Embed Size (px)
Citation preview
Media Relations Investor Relations
T +39 06 8305 5699 T +39 06 8305 7975 [email protected] [email protected]
enel.com enel.com
1
Enel SpA – Registered Office: 00198 Rome – Italy - Viale Regina Margherita 137 – Companies Register of Rome and Tax I.D. 00811720580 - R.E.A. 756032 – VAT Code 00934061003 – Stock Capital Euro 10,166,679,946 fully paid-in.
ENEL NET INCOME GROWS IN 2018 (+26.7%) Consolidated financial highlights
• Revenues: 75,672 million euros (74,639 million euros in 2017, +1.4%) − the increase reflects higher revenues from renewables business, on the free market in Italy,
as well as changes in the scope of consolidation, notably the acquisition of Eletropaulo (now Enel Distribuição São Paulo). These factors more than offset adverse developments in exchange rates, particularly in South America
• EBITDA: 16,351 million euros (15,653 million euros in 2017, +4.5%) − the increase reflects the improvement in margins on renewables, end-user markets in Italy
and Spain and in the distribution business (mainly due to the change in the scope of consolidation) as well as the effects of the efficiency policy pursued by the Group
• Ordinary EBITDA: 16,158 million euros (15,555 million euros in 2017; +3.9%) net of extraordinary items in the two periods under review
• EBIT: 9,900 million euros (9,792 million euros in 2017; +1.1%) − the increase reflects the improvement of EBITDA, which more than offset the increase in
depreciation and amortisation, mainly due to the adoption of IFRS 15 and value adjustments in the period
• Group net income: 4,789 million euros (3,779 million euros in 2017; +26.7%)
− the improvement reflects the increase in EBIT, a decline in net financial expense, value adjustments of interests in companies accounted for using the equity method, and a reduction in taxes
• Group net ordinary income: 4,060 million euros (3,709 million euros in 2017; +9.5%)
• Net financial debt: 41,089 million euros (37,410 million euros at the end of 2017; +9.8%) − the balance is at the lower end of the range forecasted for 2018, as set out in the 2019-2021
Strategic Plan (41-42 billion euros); − the increase reflects acquisitions in the period, in particular of the Brazilian company Enel
Distribuição São Paulo, the public tender offer for all of the shares of the subsidiary Enel Generación Chile carried out as part of the reorganisation of the Group’s shareholdings in Chile, investments for the period and adverse exchange rate developments
• Proposed dividend for 2018: 0.28 euro per share (of which 0.14 euro per share already distributed as interim dividend in January 2019)
2
2018 results and objectives of the Group strategic plan
• 2018 results in line with Group guidance − Renewables and networks again the engine of growth for the Group − Ordinary EBITDA and net ordinary income increase by 4% and 9% respectively
• The Group achieved all its strategic objectives for 2018, making the following progress for each key
pillar of the Group’s strategy:
1. Industrial growth – over 3 GW of new renewable capacity added during the year, while the number of distribution customers reached about 73 million, up from 65.5 million at the end of 2017;
2. Operational efficiency – Opex fell by 1% in nominal terms in 2018, despite the growth and the impact of the change in the scope of consolidation. Overall efficiency gains amounted to some 315 million euros.
3. Group simplification and active portfolio managemen t – the acquisition of Enel Distribuição São Paulo made Enel Américas the leading distribution company in Brazil in terms of number of customers (around 17 million), while the corporate reorganisation in Chile enabled the Group to increase its shareholding position in Enel Chile by 1.3 percentage points, to 61.9%;
4. Shareholder remuneration – the total dividend proposed for 2018 is 0.28 euros per share, with an implicit pay-out of 70%, 18% higher than the dividend paid in 2017.
5. Creating sustainable long-term value – in line with the Group’s sustainable business model, commitments made under the UN Sustainable Development Goals (SDGs) are confirmed.
• Financial targets for 2019 are confirmed. Francesco Starace, Chief Executive Officer and General Manager of Enel, said: “In 2018, the Enel Group achieved a very solid set of results, as reflected in a 9.5% growth in net ordinary income and increased shareholder remuneration, 18% higher than in 2017. Enel met all its strategic objectives for 2018, confirming its ability to deliver on the Group’s industrial strategy. With over 3 GW of new renewable capacity added in 2018, Enel Green Power set yet another record within the industry, confirming its role as the Group’s growth engine, alongside the distribution business, which, with the acquisition of Eletropaulo in Brazil, boosted the Group’s connected customers to 73 million. Sustainable business models continue to represent the core of Enel’s worldwide presence, as underscored by the Group’s progress towards its SDG targets in 2018. Moving forward, in 2019 we envisage an acceleration in renewable projects, mainly in North America, with continued investments in the digital transformation of grids in Italy and South America. The Group also expects to increase its customer focus on a global scale as well as accelerate Enel X’s activities in electric mobility and demand response. Progress towards the decarbonisation of Enel’s generation capacity represents another key driver for profitability. In 2021, 62% of the energy generated by the Group is expected to be zero emissions, compared with the over 50% posted in 2018. These robust full year results coupled with the achievements registered on the key pillars of the Group’s 2019-2021 strategy enable us to confirm our financial objectives for 2019.”
3
Rome, March 21 st, 2019 – The Board of Directors of Enel S.p.A. (“Enel” or the “Company”), chaired by Patrizia Grieco, today approved the results for 2018. 2018 consolidated financial highlights REVENUES
• Revenues in 2018 amounted to 75,672 million euros , an increase of 1,033 million euros (+1.4%) on 2017. − The increase mainly reflected higher revenues from renewables in Italy, Spain and North,
Central and South America, higher revenues from the free market in Italy and the effect of changes in the scope of consolidation, notably the acquisition of Eletropaulo (now Enel Distribuição São Paulo).
− These factors more than offset the adverse trend in exchange rates in South America.
• Revenues in 2018 included a number of extraordinary items, including the gains on the disposal of EF Solare Italia (65 million euros) and the indemnity connected with the sale of Enel Rete Gas in 2009 (128 million euros).
• Revenues in 2017 included the following extraordinary items: the gain on the disposal of
Chilean company Electrogas (143 million euros).
The following table reports revenues by region/country :
Revenues (millions of euros) 2018 2017 Change
Italy 38,398 38,781 -1.0%
Iberia 19,492 19,994 -2.5%
South America 14,742 13,154 +12.1%
Europe and Mediterranean Area 2,361 2,411 -2.1%
North and Central America 1,438 1,187 +21.1%
Africa, Asia and Oceania 101 96 +5.2%
Other, eliminations and adjustments (860) (984) +12.6%
TOTAL 75,672 74,639 +1.4%
4
More specifically: IN ITALY : revenues in 2018 amounted to 38,398 million euros, a slight decrease of 383 million euros compared with 2017 (-1.0%), mainly reflecting a decrease in revenues from generation and trading connected with the normalisation of market conditions after the unusual conditions that prevailed in 2017. The reduction in revenues from the sale of electricity, which was connected with a decrease in quantities generated and traded on European stock exchanges, was only partly offset by an increase in revenues from the sale of fuels and:
• an increase in revenues from renewable generation, mainly reflecting an increase in quantities generated as well as higher average sale prices;
• an increase in revenues on Infrastructure and Netwo rks operations, mainly reflecting the recognition of income, pursuant to Resolution no. 50/2018 of the Italian Regulatory Authority for Energy, Networks and Environment (ARERA), the recognition of the indemnity connected with the sale in 2009 of the stake held by e-distribuzione in Enel Rete Gas provided for in the agreement with F2i and 2i Rete Gas and an increase in connection fees;
• an increase in revenues on end-user markets for ele ctricity, mainly reflecting an increase in revenues on the free market from higher quantities sold.
IN IBERIA: revenues in 2018 amounted to 19,492 million euros, a decrease of 502 million euros compared with 2017 (-2.5%), reflecting:
• a decrease in revenues on end-user markets, essentially due to lower quantities sold both on the regulated and free markets;
• a decrease in revenues in Infrastructure and Networ k operations, mainly due to a decrease in grid connection fees following the adoption of IFRS 15;
These factors more than offset:
• an increase in revenues from generation and trading , mainly due to the increase in gas sales and greater reimbursements for costs incurred in electricity generation in the extra-peninsular area;
• an increase in revenues from renewable generation due to an increase in volumes sold.
IN SOUTH AMERICA: revenues in 2018 amounted to 14,742 million euros, an increase of 1,588 million euros compared with 2017 (+12.1%), mainly reflecting:
• an increase in revenues in Brazil, attributable to the change in the scope of consolidation following the acquisition of Enel Distribuição São Paulo as well as to higher revenues recognised by Enel Green Power Projectos I, holder as from September 28th, 2017 of a thirty-year concession for the Volta Grande hydropower plant;
• an increase in revenues in Colombia , mainly attributable to the increase in tariffs, which more than offset adverse developments in exchange rates;
• an increase in revenues in Peru due to the increase in quantities sold as a result of greater electricity demand, which more than offset adverse exchange rate developments.
The increase in revenues in these countries more than offset:
• a decrease in revenues in Chile , essentially reflecting lower sales to end users as a result of the shift of end customers from the regulated to the free market, the effect of the gain recognised in
5
the first quarter of 2017 on the disposal of Electrogas and the adverse developments in exchange rates;
• a decrease in revenues in Argentina , the effect of markedly adverse exchange rate developments due to the depreciation of the Argentine peso against the euro, partly offset by the revaluation for hyperinflation (following application of IAS 29) and an increase in energy distribution tariffs.
EUROPE AND MEDITERREAN AREA: revenues came to 2,361 million euros in 2018, a decrease of 50 million euros compared with the previous year (-2.1%). This performance mainly reflects:
• a decrease in revenues in Russia due to the depreciation of the rouble against the euro combined with a decrease in unit prices and quantities generated;
• an increase in revenues in Romania related to an increase in quantities of electricity transported and sold.
IN NORTH AND CENTRAL AMERICA: revenues were 1,438 million euros in 2018, an increase of 251 million euros compared with the previous year (+21.1%). This performance reflects:
• an increase in revenues in the United States and Ca nada , mainly generated by the Enel X Global Business Line;
• an increase in revenues in Mexico from the sale of electricity, reflecting an increase in output, from services for Operation & Maintenance activities on plants held by special purpose vehicles, whose ownership was partially sold on September 30th, 2018, according to the “Build, Sell and Operate” model, as well as from an increase in sales of green certificates.
• higher revenues in Panama due to an increase in hydro generation.
These factors more than offset a decrease in revenues in other countries, mainly due to the indemnities paid in 2017 and recognised to the Enel Group from ICE (Istituto Costaricense de Electricidad) in respect of the Chucas plant in Costa Rica.
IN AFRICA, ASIA AND OCEANIA: revenues in 2018 came to 101 million euros, an increase of 5 million euros compared with the previous year, mainly attributable to an increase in the generation and sale of electricity from the Pulida and Gibson Bay plants in South Africa
*****
EBITDA
• EBITDA in 2018 came to 16,351 million euros, an increase of 698 million euros compared with 2017 (+4.5%). This growth mainly reflects an increase in margins from renewables generation in Italy, Spain, North, Central and South America, as well as the effects of the acquisition of Enel Distribuição São Paulo and the capitalisation of customer acquisition costs as provided for by the new accounting standard IFRS 15. EBITDA also increased as a result of the extraordinary items noted in the comments on revenues, the effect of the gain and remeasurement at fair value on the disposal of 80% of the capital of eight special purpose vehicles in Mexico.
• These effects more than offset unfavourable developments in exchange rates.
The following table reports EBITDA by region/country :
EBITDA (millions of euros) 2018 2017 Change
Italy 7,304 6,863 +6.4%
6
Iberia 3,558 3,573 -0.4%
South America 4,370 4,204 +3.9%
Europe and Mediterranean Area 516 543 -5.0%
North and Central America 708 759 -6.7%
Africa, Asia and Asia 54 57 -5.3%
Other, eliminations and adjustments (159) (346) +54.0%
TOTAL 16,351 15,653 +4.5%
ORDINARY EBITDA Ordinary EBITDA for 2018 amounted to 16,158 million euros , an increase of 603 million euros compared with 2017 (+3.9%), and does not include the extraordinary items noted under revenues. In 2017, the items excluded from ordinary EBITDA amounted to 98 million euros and include the gain on the disposal of Electrogas and the losses recognised in South America for the abandonment of hydro projects in Chile and Colombia. The following table reports ordinary EBITDA by region/country :
Ordinary EBITDA (millions of euros) 2018 2017 Change
Italy 7,111 6,863 +3.6%
Iberia 3,558 3,573 -0.4%
South America 4,370 4,106 +6.4%
Europe and Mediterranean Area 516 543 -5.0%
North and Central America 708 759 -6.7%
Africa, Asia and Oceania 54 57 -5.3%
Other, eliminations and adjustments (159) (346) +54.0%
TOTAL 16,158 15,555 +3.9%
More specifically: IN ITALY : ordinary EBITDA in 2018 came to 7,111 million euros, an increase of 248 million euros compared with the same period in 2017 (+3.6%), mainly reflecting:
• an increase in margins in end-user markets , mainly attributable to the free market for electricity and gas as a result of the increase in volumes and customers on the electricity market, as well as the reduction in costs for agencies and telesellers, in part reflecting the application of IFRS 15. These factors more than offset the lower margin on the regulated market due to the reduction in quantities sold;
7
• an increase in the margin on renewable generation , reflecting the increase in quantities produced and sold at higher average prices than in 2017;
• an increase in the margin from Infrastructure and Networks operations due to recognition of the income, already discussed under revenues, recognised pursuant to ARERA Resolution no. 50/2018;
These factors more than offset a decrease in the margin on generation and trading, mainly reflecting the contraction in thermal generation and an increase in costs for the purchase of gas as a result of a rise in average prices. IN IBERIA: ordinary EBITDA was 3,558 million euros in 2018, a decrease of 15 million euros compared with 2017 (-0.4%), reflecting:
• a decrease in the margin on Infrastructure and Networks activities due to lower connection fees following the adoption of IFRS15;
• a decrease in the margin on Generation and Trading activities, primarily associated with an increase in fuel costs in 2018 and lower charges recognised in 2017 following a ruling granting Endesa reimbursement of amounts paid to finance the bono social in 2014, 2015 and 2016.
These factors more than offset:
• an increase in the margin on end-user markets reflecting the significant decrease in
provisioning and transportation costs for electricity, as well as a reduction in costs for negotiation commissions assumed following the application of IFRS 15;
• an increase in the margin on renewable generation , reflecting higher quantities sold, as referred to under revenues;
IN SOUTH AMERICA : ordinary EBITDA in 2018 came to 4,370 million euros, an increase of 264 million euros compared with 2017 (+6.4%), reflecting:
• an increase in the margin in Brazil , reflecting the performance of renewables, mainly attributable to the consolidation, since November 2017, of Enel Green Power Projectos I, as well as the change in the scope of consolidation with the acquisition of Enel Distribuição São Paulo and an increase in the margin of Enel Distribuição Goiás;
• an increase in the margin in Argentina following the revaluation of the margin in application of IAS 29 for hyperinflationary economies;
• an increase in the margin in Peru, mainly reflecting the increase in revenues from renewable generation due to greater solar and wind generation, which more than offset higher provisioning costs.
• an decrease in the margin in Colombia , mainly due to the increase in electricity purchase costs and adverse developments in exchange rates;
IN EUROPE AND MEDITERREAN AREA: ordinary EBITDA was 516 million euros in 2018, a decrease of 27 million euros compared with 2017 (-5.0%). The contraction was mainly attributable to a decrease in the margin in Russia due to adverse exchange rate developments and a decrease in the margin on generation. IN NORTH AND CENTRAL AMERICA: ordinary EBITDA was 708 million euros in 2018, a 51 million euro decrease compared with 2017 (-6.7%), reflecting:
• a decrease in the margin in the United States and Can ada due to an increase in operating and personnel expenses;
8
• a decrease in the margin in other countries , mainly reflecting lower revenues from the company PH Chucas (Costa Rica), as noted above.
These factors more than offset:
• an increase in the margin in Mexico , which benefitted from the increase in volumes generated, as noted under revenues;
• an increase in the margin in Panama due to an increase in quantities generated and a decrease in electricity provisioning costs.
IN AFRICA, ASIA AND OCEANIA: ordinary EBITDA was 54 million euros in 2018, a 3 million euro decrease compared with 2017. The reduction reflects higher costs in South Africa, Australia and Morocco as a result of the expansion of Group activities, especially in the first two countries.
*****
EBIT
EBIT in 2018 amounted to 9,900 million euros, an increase of 108 million euros compared with 2017 (9,792 million euros, +1.1%), despite an increase of 590 million euros in depreciation, amortisation and impairment losses. The latter mainly reflected:
• in 2018 , an increase in depreciation and amortisation of 270 million euros, mainly due to the acquisition of Enel Distribuição São Paulo (93 million euros) and the application as from 2018 of IFRS 15, which involved the capitalisation of the costs of acquiring new customers (166 million euros). During the year, impairment of property, plant and equipment increased by 163 million euros, comprising the writedown of biomass and solar assets in Italy (73 million euros), the Nuove Energie assets (24 million euros), the Augusta and Bastardo plants (23 million euros) and the Alcudia plant in Spain (82 million euros). These writedowns more than offset the reversal of impairment on the Greece CGU (117 million euros). Finally, writedowns of trade receivables and other assets also increased (186 million euros) net of reversals of a number of writedowns recognised in previous years mainly in Italy;
• in 2017, impairment of geothermal assets under development by subsidiary Erdwärme Oberland amounted to 42 million euros.
The following table reports EBIT by region/country : EBIT (millions of euros ) 2018 2017 Change
Italy 4,498 4,470 +0.6%
Iberia 1,724 1,842 -6.4%
South America 2,976 2,970 +0.2%
Europe and Mediterranean Area 420 306 +37.3%
North and Central America 454 553 -17.9%
Africa, Asia and Oceania 10 15 -33.3%
Other (182) (364) -50.0%
9
Total 9,900 9,792 +1.1%
***** GROUP NET INCOME Group net income in 2018 amounted to 4,789 million euros, compared with 3,779 million euros in 2017 (+26.7%), reflecting the increase in EBIT and further boosted by:
• a decrease in net financial expense and the writeback of companies accounted for using the equity method (Slovak Power Holding);
• a decrease in taxation, mainly due to the recognition of deferred tax assets on prior-year losses by Enel Distribuição Goiás and by Enel Green Power SpA, which meet the conditions for recovery of said losses.
These improvements more than offset the effect of lower taxes recognised in 2017 in the United States and Argentina and the gain posted on the disposal of Bayan Resources in Indonesia in 2017. GROUP NET ORDINARY INCOME was 4,060 million euros in 2018, compared with 3,709 million euros registered in 2017 (+9.5%). The following table presents the reconciliation between the Group net income and Group net ordinary income, with an indication of extraordinary items and their impact on net income, net of the associated tax effects and non-controlling interests:
2018
(millions of euros)
Group net income 4,789 Indemnity connected with the sale of e-distribution’s holding in Enel Rete Gas (128) Writeback of the assets of Slovenské elektràrne (646) Writedown of the Alcudìa plant (Spain) 43 Reversal of the impairment on the Greece CGU and impairment of a number of wind projects
(39)
Gain on the disposal of EF Solare Italia (64) Writedown of Nuove Energie CGU 20 Net writedown of biomass and solar plants in Italy 85 Group net ordinary income 4,060 FINANCIAL POSITION The financial position as of December 31st, 2018, shows net capital employed , including net assets held for sale of 281 million euros, equal to 88,941 million euros (89,571 million euros as of December 31st, 2017), funded by:
− equity, including non-controlling interests, of 47,852 million euros (52,161 million euros as of December 31st, 2017);
− net financial debt of 41,089 million euros , at the lower end of the range forecasted for 2018, as set out in the 2019-2021 Strategic Plan (41-42 billion euros). Net financial debt increased from 37,410 million euros as of December 31st, 2017, mainly reflecting the acquisition of Enel Distribuição São Paulo, the public tender offer for all of the shares of the subsidiary Enel Generación Chile S.A. held by minority shareholders, investment in the period and adverse exchange rate effects.
10
As of December 31st, 2018, the debt /equity ratio was 0.86 (0.72 as of December 31st, 2017). The percentage increase in leverage is partially attributable to the decrease in the Group’s consolidated shareholders’ equity (3,704 million euros) as a result of the retrospective application of IFRS 9 and IFRS 15 as well as, partly, to the increase in net financial debt referred to above. CAPITAL EXPENDITURE Capital expenditure amounted to 8,152 million euros in 2018 (of which 6,530 million euros in respect of property, plant and equipment), an increase of 22 million euros on 2017. Capital expenditure in the period mainly regarded renewable energy plants in Spain, South Africa and India, as well as greater work on grids operated under concession arrangements in Italy and Brazil. In the latter case, part of the increase reflects the acquisition of Enel Distribuição São Paulo in June 2018. The following table reports capital expenditure by region/country : Capital expenditure ( millions of euros ) 2018 2017 Change
Italy 2,479 1,812 +36.8%
Iberia 1,433 1,105 +29.7%
South America 2,246 3,002 -25.2%
Europe and Mediterranean Area 390 307 +27.0%
North and Central America 1,373 1,802 -23.8%
Africa, Asia and Oceania 142 30 -
Other, eliminations and adjustments 89 72 +23.6%
Total 8,152 8,130 +0.3%
*****
Parent Company’s 2018 results In its capacity as an industrial holding company, the Parent Company Enel sets strategic targets for the Group and coordinates the activities of its subsidiaries. The activities that Enel performs as part of its management and coordination function for the other Group companies comprise holding company activities (coordination of governance processes). Within the Group, Enel also directly manages central treasury operations, ensuring access to the money and capital markets, and handles insurance risk coverage.
Millions of euros 2018 2017 Change
Revenues 53 133 -60.15%
EBITDA (223) (227) 1.76%
11
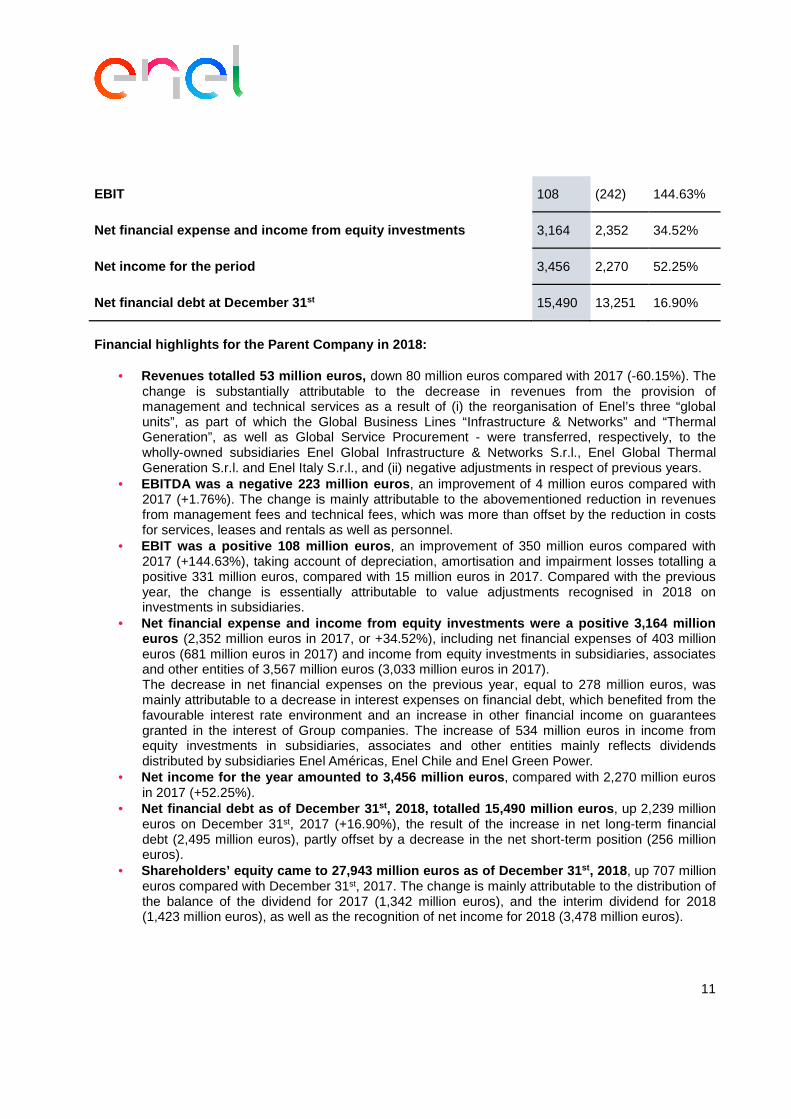
EBIT 108 (242) 144.63%
Net financial expense and income from equity invest ments 3,164 2,352 34.52%
Net income for the period 3,456 2,270 52.25%
Net financial debt at December 31 st 15,490 13,251 16.90%
Financial highlights for the Parent Company in 2018 :
• Revenues totalled 53 million euros, down 80 million euros compared with 2017 (-60.15%). The change is substantially attributable to the decrease in revenues from the provision of management and technical services as a result of (i) the reorganisation of Enel’s three “global units”, as part of which the Global Business Lines “Infrastructure & Networks” and “Thermal Generation”, as well as Global Service Procurement - were transferred, respectively, to the wholly-owned subsidiaries Enel Global Infrastructure & Networks S.r.l., Enel Global Thermal Generation S.r.l. and Enel Italy S.r.l., and (ii) negative adjustments in respect of previous years.
• EBITDA was a negative 223 million euros , an improvement of 4 million euros compared with 2017 (+1.76%). The change is mainly attributable to the abovementioned reduction in revenues from management fees and technical fees, which was more than offset by the reduction in costs for services, leases and rentals as well as personnel.
• EBIT was a positive 108 million euros , an improvement of 350 million euros compared with 2017 (+144.63%), taking account of depreciation, amortisation and impairment losses totalling a positive 331 million euros, compared with 15 million euros in 2017. Compared with the previous year, the change is essentially attributable to value adjustments recognised in 2018 on investments in subsidiaries.
• Net financial expense and income from equity invest ments were a positive 3,164 million euros (2,352 million euros in 2017, or +34.52%), including net financial expenses of 403 million euros (681 million euros in 2017) and income from equity investments in subsidiaries, associates and other entities of 3,567 million euros (3,033 million euros in 2017). The decrease in net financial expenses on the previous year, equal to 278 million euros, was mainly attributable to a decrease in interest expenses on financial debt, which benefited from the favourable interest rate environment and an increase in other financial income on guarantees granted in the interest of Group companies. The increase of 534 million euros in income from equity investments in subsidiaries, associates and other entities mainly reflects dividends distributed by subsidiaries Enel Américas, Enel Chile and Enel Green Power.
• Net income for the year amounted to 3,456 million e uros , compared with 2,270 million euros in 2017 (+52.25%).
• Net financial debt as of December 31 st, 2018, totalled 15,490 million euros , up 2,239 million euros on December 31st, 2017 (+16.90%), the result of the increase in net long-term financial debt (2,495 million euros), partly offset by a decrease in the net short-term position (256 million euros).
• Shareholders’ equity came to 27,943 million euros a s of December 31 st , 2018, up 707 million euros compared with December 31st, 2017. The change is mainly attributable to the distribution of the balance of the dividend for 2017 (1,342 million euros), and the interim dividend for 2018 (1,423 million euros), as well as the recognition of net income for 2018 (3,478 million euros).
12
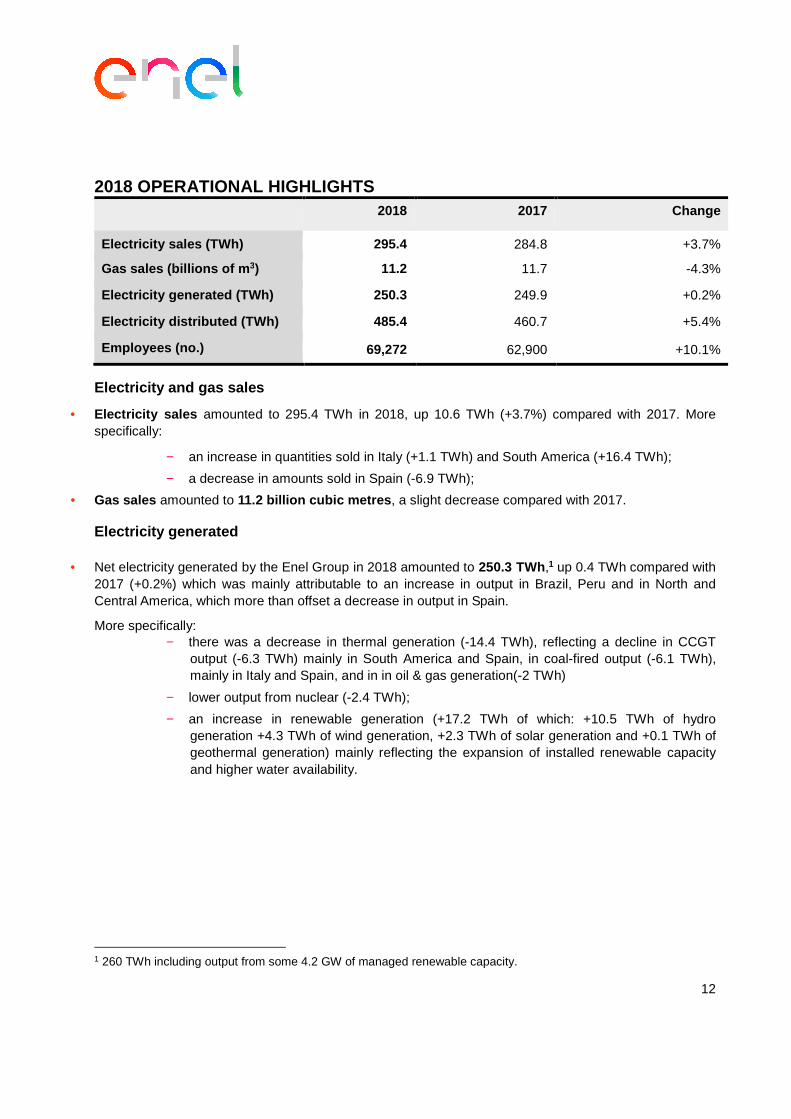
2018 OPERATIONAL HIGHLIGHTS 2018 2017 Change
Electricity sales (TWh) 295.4 284.8 +3.7%
Gas sales (billions of m 3) 11.2 11.7 -4.3%
Electricity generated (TWh) 250.3 249.9 +0.2%
Electricity distributed (TWh) 485.4 460.7 +5.4%
Employees (no.) 69,272 62,900 +10.1%
Electricity and gas sales
• Electricity sales amounted to 295.4 TWh in 2018, up 10.6 TWh (+3.7%) compared with 2017. More specifically:
− an increase in quantities sold in Italy (+1.1 TWh) and South America (+16.4 TWh);
− a decrease in amounts sold in Spain (-6.9 TWh);
• Gas sales amounted to 11.2 billion cubic metres , a slight decrease compared with 2017. Electricity generated
• Net electricity generated by the Enel Group in 2018 amounted to 250.3 TWh,1 up 0.4 TWh compared with 2017 (+0.2%) which was mainly attributable to an increase in output in Brazil, Peru and in North and Central America, which more than offset a decrease in output in Spain.
More specifically: − there was a decrease in thermal generation (-14.4 TWh), reflecting a decline in CCGT
output (-6.3 TWh) mainly in South America and Spain, in coal-fired output (-6.1 TWh), mainly in Italy and Spain, and in in oil & gas generation(-2 TWh)
− lower output from nuclear (-2.4 TWh);
− an increase in renewable generation (+17.2 TWh of which: +10.5 TWh of hydro generation +4.3 TWh of wind generation, +2.3 TWh of solar generation and +0.1 TWh of geothermal generation) mainly reflecting the expansion of installed renewable capacity and higher water availability.
1 260 TWh including output from some 4.2 GW of managed renewable capacity.
13
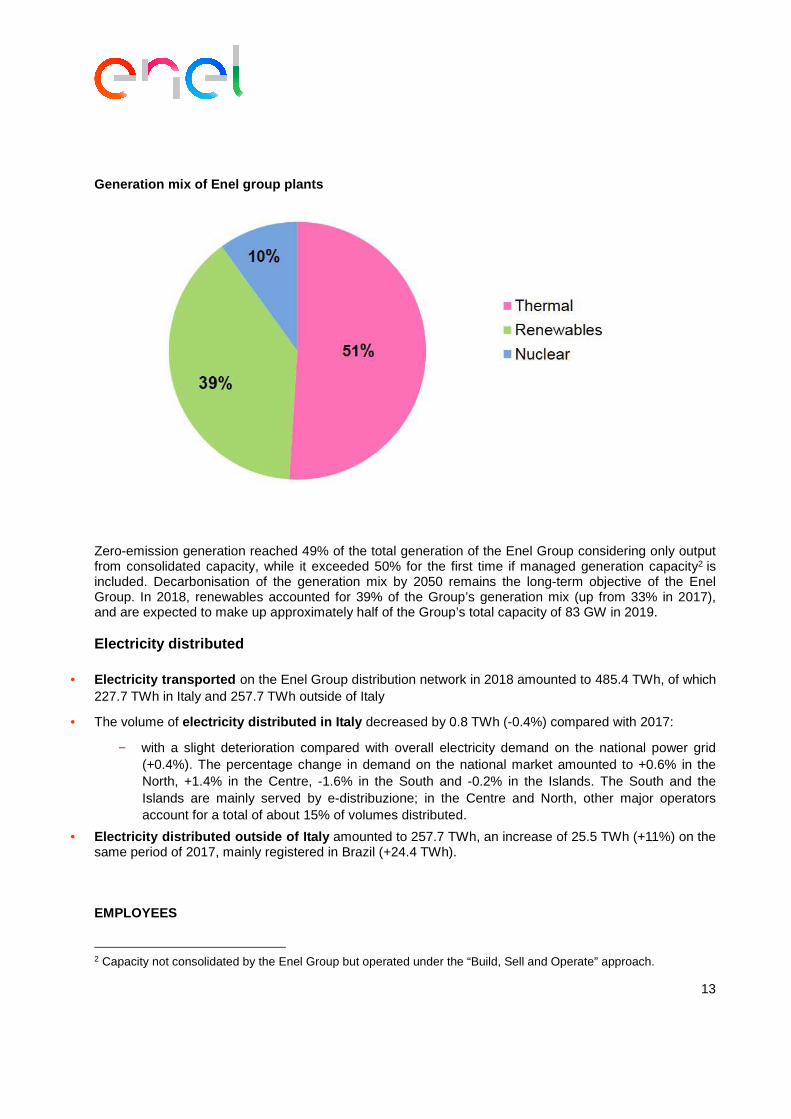
Generation mix of Enel group plants
Zero-emission generation reached 49% of the total generation of the Enel Group considering only output from consolidated capacity, while it exceeded 50% for the first time if managed generation capacity2 is included. Decarbonisation of the generation mix by 2050 remains the long-term objective of the Enel Group. In 2018, renewables accounted for 39% of the Group’s generation mix (up from 33% in 2017), and are expected to make up approximately half of the Group’s total capacity of 83 GW in 2019.
Electricity distributed
• Electricity transported on the Enel Group distribution network in 2018 amounted to 485.4 TWh, of which 227.7 TWh in Italy and 257.7 TWh outside of Italy
• The volume of electricity distributed in Italy decreased by 0.8 TWh (-0.4%) compared with 2017:
− with a slight deterioration compared with overall electricity demand on the national power grid (+0.4%). The percentage change in demand on the national market amounted to +0.6% in the North, +1.4% in the Centre, -1.6% in the South and -0.2% in the Islands. The South and the Islands are mainly served by e-distribuzione; in the Centre and North, other major operators account for a total of about 15% of volumes distributed.
• Electricity distributed outside of Italy amounted to 257.7 TWh, an increase of 25.5 TWh (+11%) on the same period of 2017, mainly registered in Brazil (+24.4 TWh). EMPLOYEES
2 Capacity not consolidated by the Enel Group but operated under the “Build, Sell and Operate” approach.
14
• As of December 31st, 2018, Enel Group employees numbered 69,272 (62,900 as of December
31st, 2017). The increase of 6,372 is mainly attributable to: − the net balance of new hires and terminations in 2018 (-1,332); − the change in the scope of consolidation (+7,704), including the acquisition of Enel
Distribuição São Paulo in Brazil, Empresa de Alumbrado Eléctrico de Ceuta and Empresa de Alumbrado Eléctrico de Ceuta Distribución in Spain, and the sale of Enel Green Power Uruguay.
***** STRATEGIC PLAN: PROGRESS ON KEY PILLARS
• Throughout 2018, the Enel Group achieved all its strategic objectives for the year, confirming its ability to deliver on its industrial strategy. With respect to progress made for each key pillar of the strategy:
1. Industrial growth – renewable generation was again the main growth driver, with over 3 GW
of new capacity added during the year, accompanied by solid growth in the distribution segment, where the number of connected customers reached about 73 million, up from 65.5 million at the end of 2017;
2. Operational efficiency – Through the ongoing commitment to optimise the cost structure, Opex fell by 1% in nominal terms in 2018, despite the industrial growth and the impact of the change in the scope of consolidation. Overall efficiency gains amounted to some 315 million euros and include a positive contribution from the application of accounting standard IFRS 15 of about 163 million euros.
3. Group simplification and active portfolio managemen t – active portfolio management allowed for the acceleration of the Group's performance in its key markets and the improvement of its overall risk/return profile. In 2018, as a result of the acquisition of Enel Distribuição São Paulo, Enel Américas became the leading distribution company in Brazil in terms of number of customers (around 17 million), strengthening its industrial strategy for positioning in “mega-cities”. Simplification of the corporate structure in South America continued with the reorganisation in Chile, which enabled Enel to increase its shareholding in Enel Chile by 1.3 percentage points, to 61.9% of the latter’s share capital;
4. Shareholder remuneration – the total dividend proposed for 2018 is 0.28 euros per share, with an implicit pay-out of 70%, 18% higher than the dividend paid in 2017 and in line with the guidance and the minimum guaranteed dividend for the year;
5. Creating sustainable long-term value – significant progress was achieved on the commitments made under the UN Sustainable Development Goals, in line with the Group's sustainable business model.
*****
OUTLOOK
The Group's 2019-2021 Strategic Plan presented in November 2018 focuses on the centrality of the integrated business model, capable of seizing the opportunities arising from the energy transition. The growth in renewable energy, the development and automation of the distribution network, the
15
opportunities for electrification and customer focus are the guidelines of the Group's strategy. More specifically, the Group's 2019 - 2021 Strategic Plan focuses on the following issues:
• Industrial growth: the Group plans to invest a total of 27.5 billion euros over the plan period, with the aim of generating a cumulative increase in ordinary EBITDA of 3.2 billion euros. The full range of investments in the three categories – asset development, customers and asset management – will contribute to achieving this goal;
• Decarbonisation opens the way to creating value, with renewables expected to generate a cumulative increase in EBITDA of 1 billion euros between 2018 and 2021. The focus of investments in markets where Enel has an integrated presence and in mature economies will enable the Group to increase profitability and achieve its decarbonisation targets. In 2021, 62% of the energy generated by the Enel Group is expected to have zero emissions, compared with an estimated 49% in 20183;
• Operational efficiency : the objective of 1.2 billion euros of cumulative benefits generated by efficiencies expected by 2021, mainly due to the effect of digitalisation, has been confirmed;
• Simplification : Enel will continue to increase its investments in its subsidiaries, continuing their integration within the Group and rationalising its portfolio through asset rotation, with further optimisation of the overall return and risk profile;
• Human capital : Enel’s commitment to achieving SDGs has been extended until 2030. A “shared value" approach towards communities and people integrated into the Group's core business processes; introduction of specific additional targets for SDG 9 (Industrial Innovation and Infrastructure) and 11 (Sustainable Cities and Communities);
• Improved return on investment to support dividend g rowth : Enel expects investments focused on higher yield assets, efficiency and portfolio optimisation will create value amounting to a total of 400 basis points on a WACC of 6.2% in 2021, increasing by more than one and a half times compared with 2018;
• Shareholder remuneration : a 70% dividend calculated on the Group's ordinary net income from 2019 onwards is confirmed, with a compound average growth rate (CAGR) in the dividend per share (DPS) of about +12%. For the first time the minimum DPS will be extended to the next three years, with a CAGR of about +9%.
In 2019 Enel expects:
• an acceleration of investments to contribute to industrial growth in renewable energy projects, particularly in North America, with global investments increasing by more than 35% compared with 2018 and the continuation of investments in grids , especially in Italy and Latin America;
• significant progress in operational efficiency , supported by digitalisation across all of Enel’s businesses;
• greater customer focus on a global scale and an acceleration of Enel X 's activities in the electric mobility and demand response businesses;
• further progress in Group simplification and active portfolio management , so as to optimise its overall risk and return profile.
Enel Group's strategy is also aimed at ensuring resilience, mitigation and adaptation to changes in the external environment and, in particular, to climate change, through a business model and leadership position in line with the Paris Agreement (COP 21). In this regard, the "Sustainability” section of the Consolidated Financial Statements for 2018 includes a review of the main risks and opportunities related to climate change, the mitigation and adaptation actions implemented and the key objectives and metrics. 3 51% if capacity managed under the “Build, Sell and Operate” model is included.
16
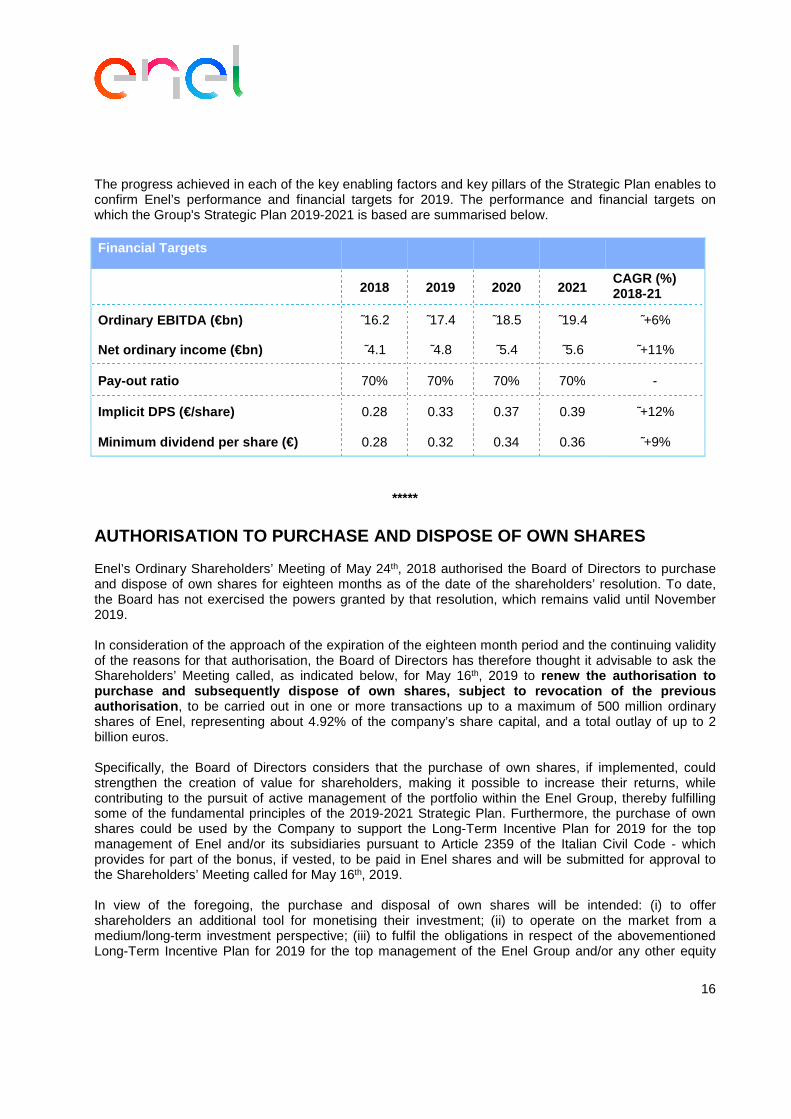
The progress achieved in each of the key enabling factors and key pillars of the Strategic Plan enables to confirm Enel’s performance and financial targets for 2019. The performance and financial targets on which the Group's Strategic Plan 2019-2021 is based are summarised below. Financial Targets
2018 2019 2020 2021 CAGR (%) 2018-21
Ordinary EBITDA (€bn) ῀16.2 ῀17.4 ῀18.5 ῀19.4 ῀+6%
Net ordinary income (€bn) ῀4.1 ῀4.8 ῀5.4 ῀5.6 ῀+11%
Pay-out ratio 70% 70% 70% 70% -
Implicit DPS (€/share) 0.28 0.33 0.37 0.39 ῀+12%
Minimum dividend per share (€) 0.28 0.32 0.34 0.36 ῀+9%
***** AUTHORISATION TO PURCHASE AND DISPOSE OF OWN SHARES Enel’s Ordinary Shareholders’ Meeting of May 24th, 2018 authorised the Board of Directors to purchase and dispose of own shares for eighteen months as of the date of the shareholders’ resolution. To date, the Board has not exercised the powers granted by that resolution, which remains valid until November 2019. In consideration of the approach of the expiration of the eighteen month period and the continuing validity of the reasons for that authorisation, the Board of Directors has therefore thought it advisable to ask the Shareholders’ Meeting called, as indicated below, for May 16th, 2019 to renew the authorisation to purchase and subsequently dispose of own shares, su bject to revocation of the previous authorisation , to be carried out in one or more transactions up to a maximum of 500 million ordinary shares of Enel, representing about 4.92% of the company’s share capital, and a total outlay of up to 2 billion euros. Specifically, the Board of Directors considers that the purchase of own shares, if implemented, could strengthen the creation of value for shareholders, making it possible to increase their returns, while contributing to the pursuit of active management of the portfolio within the Enel Group, thereby fulfilling some of the fundamental principles of the 2019-2021 Strategic Plan. Furthermore, the purchase of own shares could be used by the Company to support the Long-Term Incentive Plan for 2019 for the top management of Enel and/or its subsidiaries pursuant to Article 2359 of the Italian Civil Code - which provides for part of the bonus, if vested, to be paid in Enel shares and will be submitted for approval to the Shareholders’ Meeting called for May 16th, 2019. In view of the foregoing, the purchase and disposal of own shares will be intended: (i) to offer shareholders an additional tool for monetising their investment; (ii) to operate on the market from a medium/long-term investment perspective; (iii) to fulfil the obligations in respect of the abovementioned Long-Term Incentive Plan for 2019 for the top management of the Enel Group and/or any other equity
17
plans for the directors or employees of Enel or its subsidiaries or associates; (iv) to support the liquidity of Enel shares, to facilitate orderly trading and prevent anomalous price movements, as well as to regulate trading and prices in the presence of distortive factors connected with excessive volatility or illiquid trading conditions; and (v) to establish a “securities inventory” to be used in possible corporate finance transactions or for other uses considered to be in the financial, operational and/or strategic interests of Enel. The purchase of own shares will be permitted for eighteen months from the date of the authorisation resolution. No time limit has been set for the disposal of the own shares purchased. The purchase of own shares will be carried out at a price to be specified on a case-by-case basis, taking into account the procedure selected to carry out the transaction, any applicable legislation and market practice, provided that such price in any case does not diverge up or down by more than 10% of the reference price recorded on the Mercato Telematico Azionario, organised and operated by Borsa Italiana SpA, on the day prior to each individual transaction. The sale or other form of disposition of own shares will take place on the terms and conditions each time determined by Enel’s Board of Directors, in compliance with any limits established by applicable legislation or the applicable market practice permitted by Consob with Resolution no. 16839 of March 19th, 2009. The purchase of own shares will be carried out in accordance with one of the following operating procedures identified in Article 144-bis, paragraph 1 and 1-bis, of the Consob Issuers Regulation: (i) by means of a public tender offer or exchange offer; (ii) on regulated markets in accordance with the operating procedures established in the organisational and operational rules of such markets, which do not permit the direct matching of buy orders with predetermined sell orders; (iii) through the purchase and sale of derivative instruments traded on regulated markets or multilateral trading facilities which provide for the physical delivery of the underlying shares, provided that the organisational and operational rules of the market determines purchase procedures that comply with the characteristics set out in Article 144-bis, paragraph 1, letter c) of the Consob Issuers Regulation; (iv) with the procedures established in market practice allowed by Consob pursuant to Article 13 of with Regulation (EU) no. 596/2014; and (v) on the conditions specified in Article 5 of Regulation (EU) no. 596/2014. The sale or other form of disposition of own shares may take place in the manner considered most appropriate by the Board of Directors and in the interest of the Company and, in any event, in compliance with applicable legislation and applicable market practice. Finally, Enel does not hold own shares, either directly or through subsidiaries.
***** SHAREHOLDERS’ MEETING AND DIVIDEND The Board of Directors has convened the Ordinary Shareholders’ Meeting for May 16 th, 2019 in a single call, in order to:
1. Approve the separate financial statements and exami ne the consolidated financial statements for 2018
2. Approve the payment of a dividend of 0.28 euros per share, of which:
18
� 0.14 euros per share as a distribution of Enel net income to finance the interim dividend for 2018, in payment as from January 23rd, 2019;
� 0.14 euros per share as a distribution of Enel net income to finance payment of the balance of the dividend for 2018,
- The total dividend is therefore equal to about 2,84 6 million euros , against Group net ordinary income (i.e. generated by the core business) of 4,060 million euros and in line with the dividend policy for 2018 announced to the market, which provides for the payment of a dividend equal to the higher of 0.28 euros per share and 70% of the net ordinary income of the Enel Group. At its meeting of November 6th, 2018, the Board of Directors authorised the distribution of an interim dividend for 2018 of 0.14 euros per share, payment of which was carried out as from January 23rd, 2019, with an ex-dividend date for coupon no. 29 of January 21st, 2019 and a record date of January 22nd, 2019. As regards the balance of the dividend for 2018, equal to 0.14 euros per share, the Board of Directors has proposed a payment date as from July 24th, 2019, with an ex-dividend date for coupon no. 30 of July 22nd, 2019 and a record date of July 23rd, 2019,
3. Approve the authorisation to purchase and dispose o f own shares to subject to revocation
of authorisation granted by the Ordinary Shareholde rs’ meeting of May 24 th , 2018.
4. Approve the appointment of the Board of Auditors fo r expiry of its term of office and the determination of the remuneration of its members.
5. Approve the grant of the engagement to perform the statutory audit of the accounts for the
period 2020-2028 and concomitant determination of f ees.
6. Approve the adoption of a Long-Term Incentive Plan (“Incentive Plan”), with a three-year vesting period, which grants the beneficiaries a bonus consisting of one component in Enel shares and a cash component, subject and proportional to the achievement of the following performance objectives over the period 2019-2021: (i) Total Shareholders’ Return (“TSR”), measured with reference to the performance of the Enel share compared with that of the Euro Stoxx Utilities index - UEM; (ii) Return on Average Capital Employed (“ROACE”); and (iii) emissions of grams of CO2 per kWh equivalent produced by the Enel Group in 2021 (“CO2 Emissions”).4 In particular, the Incentive Plan - which assigns a weight of 50% to the TSR, a weight of 40% to the ROACE and a weight of 10% to CO2 Emissions - is intended for the Chief Executive Officer/General Manager and the key management personnel of Enel, as well as other managers of Enel and/or its subsidiaries pursuant to Article 2359 of the Civil Code, as identified during the assignment of the same Plan. The latter, in consideration of the characteristics of its structure, the specified performance targets and the weight attributed to each of them, is aimed at strengthening the alignment of the interests of management with the priority objective of creating sustainable value for the shareholders in the medium to long term. For a detailed description of the Incentive Plan, please see the information document, prepared pursuant to Article 114-bis of the Consolidated Law on Financial Intermediation and to Article 84-bis of the Consob Issuers Regulation, which will be made available to the public in accordance with the law.
7. Resolve a non-binding resolution on the section of the report on remuneration that discusses Enel’s policy for the remuneration of directors, the General Manager and key management personnel.
4 Emissions linked to generation by Group plants.
19
Documentation on the items on the agenda of the Shareholders’ Meeting, as required under applicable law, will be made available to the public as provided for by law.
*****
BOND ISSUES AND MATURING BONDS The main bond issues carried out in 2018 by Enel Group companies are the following:
• a green bond, in the total amount of 1,250 million euros with bullet repayment at maturity in September 2026, paying a fixed-rate coupon of 1.125%, issued in January 2018 by Enel Finance International and guaranteed by Enel;
• multi-tranche non-convertible hybrid subordinated bonds in the amount of 1,250 million euros, issued by Enel in May 2018, structured as follows: - 500 million euros, maturing in November 2078, paying a fixed-rate 2.5% until the first call date in November 2023; - 750 million euros maturing in November 2081, paying a fixed-rate 3.375% until the first call date in November 2026;
• a bond in the total amount of 1,000 million US dollars (equivalent to 873 million euros as of December 31st, 2018), maturing in June 2028, paying a fixed-rate coupon of 4.875%, issued in June 2018 by Enel Chile;
• multi-tranche bonds in the amount of 3,000 million Brazilian reais, issued in September 2018 by Enel Distribuição São Paulo, structured as follows:
- 704 million Brazilian reais (equivalent to 159 million euros as of December 31st, 2018) paying a floating rate of 108.25% of the Interbank Deposit Certificate (IDC) rate, maturing in September 2021;
- 1,396 million Brazilian reais (equivalent to 314 million euros as of December 31st, 2018) paying a floating rate of 111% of the IDC, maturing in September 2023;
- 900 million Brazilian reais (equivalent to 203 million euros as of December 31st, 2018) paying a floating rate of the IDC +1.45%, maturing in September 2025.
• multi-tranche bonds, in the amount of 4,000 million US dollars, issued in September 2018 by Enel Finance International, guaranteed by Enel and structured as follows: - 1,250 million US dollars (equivalent to 1,091 million euros as of December 31st, 2018)
paying a fixed-rate of 4.250% maturing in September 2023; - 1,500 million US dollars (equivalent to 1,309 million euros as of December 31st, 2018)
paying a fixed-rate of 4.625% maturing in September 2025; - 1,250 million US dollars (equivalent to 1,091 million euros as of December 31st, 2018)
paying a fixed-rate of 4.875% maturing in June 2029.
• During the period between January 1st, 2019 and June 30th, 2020, bond issues by Enel Group companies with a total carrying amount of 2,858 million euros are scheduled to reach maturity, of which the main issues are:
- 234,870 million Colombian pesos (equivalent to 63 million euros as of December 31st, 2018) in respect of a floating-rate bond issued by Emgesa, maturing in February 2019;
- 550 million pounds sterling (equivalent to 614 million euros as of December 31st, 2018) in respect of a fixed-rate bond issued by Enel, maturing in June 2019;
- 201,970 million Colombian pesos (equivalent to 54 million euros as of December 31st, 2018) in respect of a floating-rate bond issued by Emgesa, maturing in September 2019;
20
- 125 million euros in respect of a fixed-rate bond issued by Enel Finance International and guaranteed by Enel, maturing in November 2019;
- 748 million euros in respect of a fixed-rate non-convertible hybrid subordinated bond issued by Enel, with a first call date in January 2020;
- 100 million euros in respect of a fixed-rate bond issued by Enel Finance International and guaranteed by Enel, maturing in January 2020;
- 481 million euros in respect of a fixed-rate bond issued by Enel Finance International and guaranteed by Enel, maturing in March 2020;
- 100 million Swiss francs (equivalent to 89 million euros as of December 31st, 2018) in respect of a fixed-rate bond issued by Enel Finance International and guaranteed by Enel, maturing in June 2020.
*****
RECENT KEY EVENTS
December 11 th, 2018: Enel announced that, through its renewable subsidiary Enel Green Power Mexico, it has begun the construction of the Dolores wind farm in the municipality of China, its first project in the Mexican state of Nuevo León. The overall investment in the construction of the 244 MW wind farm is expected to amount to about 280 million US dollars. The project is supported by a contract providing for the sale to the Mexican energy authority, Cámara de Compensación, of specified volumes of generated power over a 15-year period and the related green certificates over a 20-year period. The Dolores wind farm is scheduled to enter into service in the first half of 2020. Once fully operational, the wind farm will be able to generate approximately 850 GWh per year, avoiding the annual emission of around 470,000 tonnes of CO2 into the atmosphere. December 12 th, 2018: Enel announced that, through its US renewable company Enel Green Power North America, Inc. (“EGPNA”), has begun operation of the HillTopper wind farm in Logan County in the US state of Illinois. The Enel Group’s investment in the construction of the 185 MW wind farm, which is expected to generate around 570 GWh annually, amounts to approximately 325 million US dollars. The project is supported by three long-term power purchase agreements (PPAs) with Bloomberg LP, General Motors and Constellation, an Exelon company. December 21 st, 2018: Enel announced that, through its renewable subsidiary Enel Green Power S.p.A. (“EGP”), it has sold its 50% stake in the joint venture EF Solare Italia S.p.A (“EFSI”), held through EGP’s wholly owned subsidiary Marte S.r.l., for 214 million euros to its existing partner in the venture, F2i SGR S.p.A. (“F2i”). In line with the sale agreement, EFSI has an enterprise value of approximately 1.3 billion euros, of which around 430 million euros of equity value and about 900 million euros of third party debt. The 214 million euro price, which is subject to adjustments in line with standard practice for this type of transaction, was paid in full at closing, generating a positive impact of the same amount on Group’s net financial debt.5 The sale of EGP’s stake in EFSI is part of the strategy for the active management of the Enel Group’s portfolio, which envisages the reallocation of financial resources for use in initiatives with greater potential for growth for the Group. December 27 th, 2018: Enel announced that, through its US renewable energy subsidiary EGPNA, it has begun production at its wind farms Rattlesnake Creek (320 MW) and Diamond Vista (around 300 MW), located in the US states of Nebraska and Kansas respectively. The Enel Group has invested about 430
5 EFSI was jointly controlled by EGP and F2i and so was not consolidated in the cash flow statement of the Enel Group.
21
million US dollars in the construction of Rattlesnake Creek and about 400 million US dollars in the construction of Diamond Vista. Together, the two plants will generate around 2,600 GWh a year. The output of both wind farms is supported by long-term electricity supply agreements (PPAs) with Facebook and Adobe, for Rattlesnake Creek, and with Kohler, Tri-County Electric Cooperative of Oklahoma and City Utilities of Springfield, for Diamond Vista. The two wind farms were involved in a tax equity agreement between EGPNA and Bank of America Merrill Lynch and J.P. Morgan. On the basis of this agreement, the two investment banks will purchase 100% of the “Class B” interests in both Rattlesnake Creek and Diamond Vista, against payment of about 334 million US dollars and about 317 million US dollars, respectively. Following the transaction, the Enel Group will continue to retain ownership of 100% of the “Class A” interests in the two plants, as well as their management. January 4 th, 2019: Enel announced that, through its US renewable energy subsidiary EGPNA, it has begun construction of the High Lonesome wind farm, located in the counties of Upton and Crockett, in the US state of Texas. High Lonesome, which once completed will be Enel’s largest wind farm in the global renewables portfolio, will involve a total investment of about 600 million US dollars and will have a total installed capacity of 450 MW. Enel has signed a Proxy Revenue Swap (“PRS”) agreement6 for a portion of the wind farm with a capacity of 295 MW with the Alternative Risk Transfer division of the insurance services company Allianz Global Corporate & Specialty, Inc. (“Allianz”) and Nephila Climate, a supplier of products for the management of meteorological and climate risks. Under this agreement, High Lonesome will receive fixed payments, calculated on the expected value of future energy production, with a variable portion paid based on how much the actual returns achieved by the project differ from the fixed payment. The PRS on High Lonesome, the largest of this type for a single plant worldwide in terms of capacity and a first for Enel, was implemented in collaboration with REsurety Inc., a leader in risk management and information services for renewables. The wind farm is expected to start operating by the end of 2019 and that, once fully operational, it will be able to generate approximately 1.7 TWh per year, avoiding the emission of some 1.1 million tons of CO2 into the atmosphere a year. January 14 th , 2019: Enel has announced that its subsidiary Enel Finance International NV has placed its third green bond on the European market, backed by a guarantee issued by Enel and intended for institutional investors. It will be listed on the regulated markets of Ireland and Luxembourg and on the multilateral trading system “ExtraMOT PRO”. The issue, amounting to a total of 1,000 million euros, provides for repayment in a single bullet instalment falling due on July 21st, 2025, as well as a fixed-rate coupon of 1.5%, payable annually in arrears in July, starting from July 2019. The issue price was set at 98.565%, with an effective yield at maturity of 1.736%. The transaction received subscriptions in excess of 4.2 billion euros, with significant participation by socially responsible investors, enabling the Enel Group to continue to diversify its investor base. January 16 th, 2019: Enel announced that, through its renewable energy subsidiary Enel Green Power Brasil Participações Ltda (“EGP Brazil”), it had signed an agreement with the Chinese company CGN Energy International Holdings Co. Limited for the sale of 100% of the two solar plants Nova Olinda (292 MW) and Lapa (158 MW), as well as the Cristalândia wind farm (90 MW), with a total capacity of 540 MW.
6 A PRS is a derivative financial contract that allows for the generation of stable revenue flows for a plant, regardless of the volatility of energy prices and changes in output due to meteorological factors. This sort of agreement helps hedge the risk connected with the hourly price of power and volumes generated (shape risk), as well as the risk associated with changes in volumes and energy prices.
22
The total price for the transaction, which will be paid on closing, is equal to the enterprise value of the plants and amounts to about 2.9 billion Brazilian reais, equivalent to about 700 million euros. The sale price is subject to price adjustments in line with normal market practice for this type of transaction. The sale of the three plants, all already in operation, is expected to close by the end of the first quarter of 2019, once a number of conditions have been met, including approval by the Brazilian competition authorities. The plants, which are located in the Brazilian states of Piauí and Bahia, have long-term energy purchase contracts (PPAs) with the Brazilian electricity marketing chamber (Câmara de Comercialização da Energia Elétrica or CCEE), for Lapa and Nova Olinda, and with a pool of Brazilian electricity distribution companies, for Cristalândia. The transaction, which is consistent with the Group’s 2019-2021 Strategic Plan, seeks to maximise and accelerate the creation of value by rotating assets, freeing up resources that can be invested in new projects, while Enel will continue its Operation and Maintenance (O&M) activities for the assets sold. February 6 th, 2019: Enel announced that, through its Brazilian renewable subsidiary EGP Brazil, it has begun construction of the Lagoa dos Ventos wind farm, which will have a capacity of 716 MW and will be built in the north-eastern state of Piauí in Brazil. Lagoa dos Ventos, which should start operating in 2021, is the largest wind farm currently under construction in South America and the largest Enel Green Power plant of this type in the world. Construction of Lagoa dos Ventos will involve an investment of about 3 billion Brazilian reais, equivalent to over 700 million euros, in line with the 2019-2021 Strategic Plan. Of the total capacity, 510 MW were awarded to EGP in the Brazilian A-6 public tender of December 2017 and are supported by 20-year power supply contracts with a pool of distribution companies operating in the Brazilian regulated market, while the electricity produced by the remaining 206 MW will go to the free market for sale to retail customers, leveraging Enel’s integrated presence in the country. The Lagoa dos Ventos wind farm is composed of 230 wind turbines and, when fully operational, will be able to generate over 3.3 TWh a year, avoiding the emission of over 1.6 million tons of CO2 into the atmosphere. February 28 th, 2019: Enel announced that the Board of Directors of the Chilean subsidiary Enel Américas SA, of which Enel owns 51.8% of the share capital, has called the Extraordinary Shareholders’ Meeting for April 30th, 2019 to resolve an increase in share capital of up to 3.5 billion US dollars, to be subscribed entirely in cash. This increase is expected to be carried out through the issue of new ordinary shares and new American Depositary Shares (“ADS”) to be offered in pre-emption to shareholders in proportion to the number of shares/ADSs they hold. According to the proposal made by its Board of Directors, the capital increase will enable Enel Américas to strengthen its financial position to pursue new organic and inorganic growth opportunities, both through minority buyouts and through M&A activities, optimising cash flows and improving the level of debt. The capital increase will also enable an increase in the free float and capitalisation. March 14 th, 2019: Enel announced that, through its US renewable subsidiary EGPNA, it has completed the acquisition of 100% of seven renewable energy plants for a total of 650 MW from Enel Green Power North America Renewable Energy Partners, LLC, an equally held joint venture between EGPNA and GE Capital’s Energy Financial Services, the General Electric unit for investments in the energy sector. The total price paid for the transaction was about 256 million US dollars, while the assets have an enterprise value of about 900 million US dollars. The plants involved in the operation, all operated by EGPNA, are: Cove Fort, a 25 MW geothermal plant, located in Utah; Salt Wells, a 13.4 MW geothermal plant, located in Nevada; Stillwater, a 59.5 MW geothermal solar plant located in Nevada; Cimarron Bend, a 400 MW wind farm located in Kansas; Lindahl, a 150 MW wind farm located in North Dakota; and Sheldon Springs, a 2.4 MW photovoltaic plant located in Vermont.
23
In line with the Group’s 2019-2021 Strategic Plan, this transaction seeks to increase Enel’s consolidated capacity in a key market like the United States, obtaining more value from the ownership of 100% of the plants that use strategic renewable energy technologies.
More details on these developments can be found in the associated press releases published on the Enel website at: https://www.enel.com/media/allpressreleases.
***** NOTES
At 18:00 today, March 21st, 2019, a conference call will be held to present the results for 2018 and progress in the 2019-2021 Strategic Plan to financial analysts and institutional investors. Journalists are also invited to listen in on the call. Documentation relating to the conference call will be available on Enel’s website (www.enel.com) in the Investor section from the beginning of the call. The consolidated income statement, statement of comprehensive income, balance sheet and cash flow statement for the Enel Group and the corresponding statements for the Parent Company Enel are attached below. These statements and the related notes have been submitted to the Board of Auditors and the external auditors for their evaluation. A descriptive summary of the alternative performance indicators used in this press release is also attached.
***** The officer responsible for the preparation of the corporate financial reports, Alberto De Paoli, certifies, pursuant to Article 154-bis, paragraph 2, of the Consolidated Law on Financial Intermediation, that the accounting information contained in this press release corresponds with that contained in the accounting documentation, books and records.
*****
24
ACCOUNTING POLICIES AND CHANGES IN SCOPE OF CONSOLI DATION WITH AN IMPACT ON FIGURES FOR 2018
As of January 1st, 2018 new IASB7-revised and amended accounting standards were applied for the first time: IFRS 9 and IFRS 15. First-time retrospective adoption involved the restatement of certain balances in the balance sheet at January 1st, 2018, as Enel has opted to apply the simplification permitted by those standards on first-time adoption. The net impact on Group shareholders’ equity was a negative 3,704 million euros. This decrease is mainly due to the application of IFRS 15, in particular the changes in the accounting treatment of revenues from connection fees – which are allocated on the basis of the nature of the obligation with customers rather than recognised at the time of connection – whose negative effects were only partly offset by the capitalisation of the costs of acquiring new customer contracts (“contract costs”). As from July 1st, 2018, Argentina has been declared a hyperinflationary country, as in the last three years its cumulative inflation rate has exceeded 100%. Consequently, the financial statements of Group’s subsidiaries in Argentina used in preparing the consolidated financial statements have been prepared in accordance with the provisions of IAS 29 (Financial reporting in hyperinflationary economies). The overall impact on Group equity as of January 1st, 2018 is a positive 212 million euros, while the impact on Group net income as of December 31st, 2018 amounted to 25 million euros. In addition to the effects on EBITDA and financial income discussed earlier, net income reflects an increase in taxation, the application of the end-period exchange rate rather than the average exchange rate for the period and the allocation of the share of net income pertaining to non-controlling interests. Unless otherwise specified, the balance sheet figures as of December 31st, 2018, exclude assets and liabilities held for sale of three wind farms in Brazil, on the basis of the state of progress of negotiations for their sale to third parties, fall within the scope of IFRS 5. The representation of performance by business area presented here is based on the approach used by management in monitoring Group performance for the two periods under review, taking account of the operational model adopted by the Group as described previously.
***** KEY PERFORMANCE INDICATORS
This press release uses a number of “alternative performance indicators” not envisaged in the IFRS-EU accounting standards adopted by the European Union, which management feels are useful in monitoring the performance of the Group and the Parent Company. In line with Consob Communication no. 0092543 of December 3rd, 2015 and with the Guidelines issued on October 5th, 2015 by the European Securities and Markets Authority (ESMA), pursuant to Regulation (EU) no. 1095/2010, the content and basis of calculation of these indicators are as follows.
− EBITDA : an indicator of Enel’s operating performance, calculated as “EBIT” plus “Depreciation, amortisation and impairment losses”.
7 International Accounting Standards Board.
25
− Ordinary EBITDA : an indicator calculated by eliminating from EBITDA all items connected with extraordinary transactions such as acquisitions or disposals of entities (e.g. capital gains and losses), with the exception of those in the renewables development segment, in line with the new “Build, Sell and Operate” business model launched in the fourth quarter of 2016, in which the income from the disposal of projects in that sector is the result of an ordinary activity for the Group.
− Group net ordinary income : defined as “Group net income” generated from ordinary business operations and is equal to “Group net income”, eliminating all items connected with the extraordinary items referred to under “ordinary EBITDA”, significant impairment losses or writebacks on assets (including equity investments and financial assets) recognised following impairment testing and any associated tax effects or non-controlling interests.
− Net financial debt : an indicator of Enel’s financial structure, determined by i) “Long-term borrowings” and “Short-term borrowings and the current portion of long-term borrowings”, taking account of “Short-term financial payables” included in “Other current liabilities”, (ii) net of “Cash and cash equivalents”; (iii) net of the “Current portion of long-term financial receivables”, “Factoring receivables”, “Cash collateral” and “Other financial receivables” included in “Other current financial assets”; (iv) net of “Securities held to maturity”, “Securities held for sale”, “Financial investments in funds or portfolio management products measured at fair value through profit or loss” and “Other financial receivables” included in “Other non-current financial assets”. More generally, the net financial debt of the Enel Group is calculated in conformity with paragraph 127 of Recommendation CESR/05-054b implementing Regulation (EC) no. 809/2004 and in line with the Consob instructions of July 26th, 2007 for the definition of the net financial position, net of financial receivables and long-term securities.
− Net capital employed: calculated as the sum of “Current assets”, “Non-current assets” and “Net assets held for sale”, net of “Current liabilities” and “Non-current liabilities”, excluding items previously considered in the definition of net financial debt.
− Net assets held for sale : the algebraic sum of “Assets held for sale” and “Liabilities held for sale”.
26
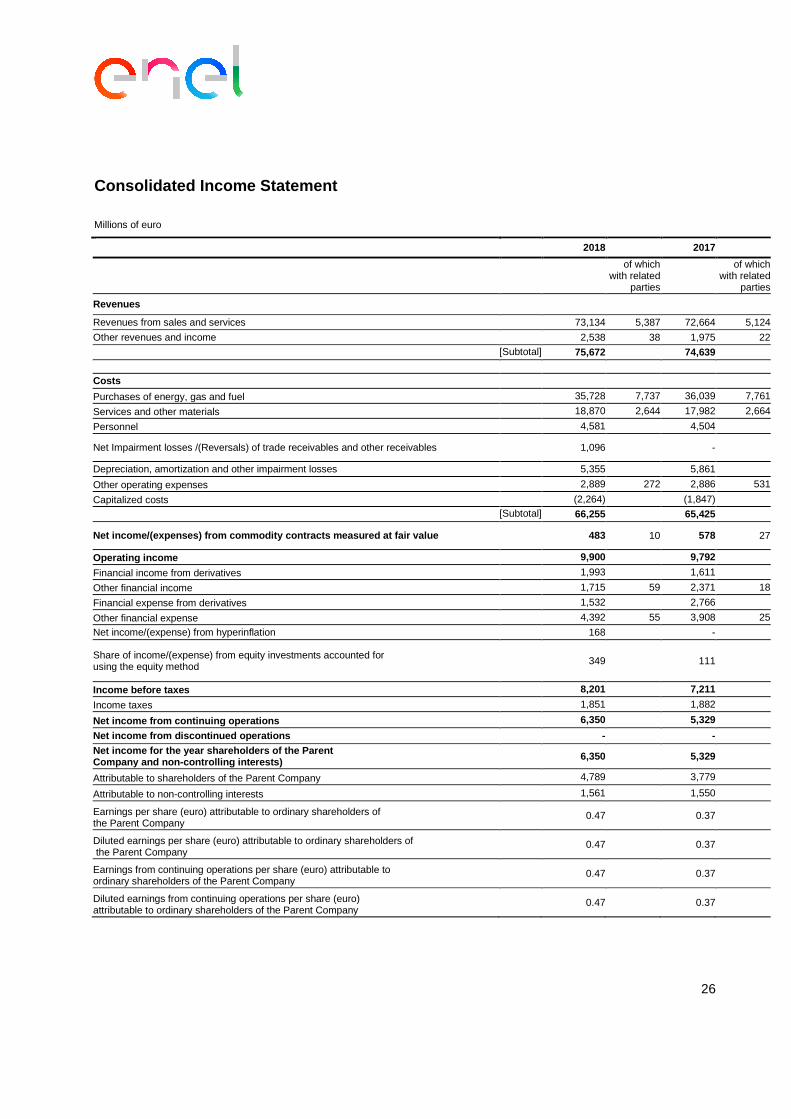
Consolidated Income Statement
Millions of euro
2018 2017
of which with related
parties
of which with related
parties
Revenues Revenues from sales and services 73,134 5,387 72,664 5,124
Other revenues and income 2,538 38 1,975 22
[Subtotal] 75,672 74,639
Costs
Purchases of energy, gas and fuel 35,728 7,737 36,039 7,761
Services and other materials 18,870 2,644 17,982 2,664
Personnel 4,581 4,504
Net Impairment losses /(Reversals) of trade receivables and other receivables
1,096 -
Depreciation, amortization and other impairment losses 5,355 5,861 Other operating expenses 2,889 272 2,886 531
Capitalized costs (2,264) (1,847) [Subtotal] 66,255
65,425
Net income/(expenses) from commodity contracts meas ured at fair value
483 10 578 27
Operating income 9,900
9,792
Financial income from derivatives 1,993 1,611 Other financial income 1,715 59 2,371 18
Financial expense from derivatives 1,532 2,766 Other financial expense 4,392 55 3,908 25
Net income/(expense) from hyperinflation 168 -
Share of income/(expense) from equity investments accounted for using the equity method
349 111
Income before taxes 8,201
7,211
Income taxes 1,851 1,882 Net income from continuing operations 6,350
5,329
Net income from discontinued operations -
-
Net income for the year shareholders of the Parent Company and non-controlling interests) 6,350
5,329
Attributable to shareholders of the Parent Company 4,789 3,779 Attributable to non-controlling interests 1,561 1,550 Earnings per share (euro) attributable to ordinary shareholders of the Parent Company
0.47 0.37
Diluted earnings per share (euro) attributable to ordinary shareholders of the Parent Company
0.47 0.37
Earnings from continuing operations per share (euro) attributable to ordinary shareholders of the Parent Company
0.47 0.37
Diluted earnings from continuing operations per share (euro) attributable to ordinary shareholders of the Parent Company
0.47 0.37
27
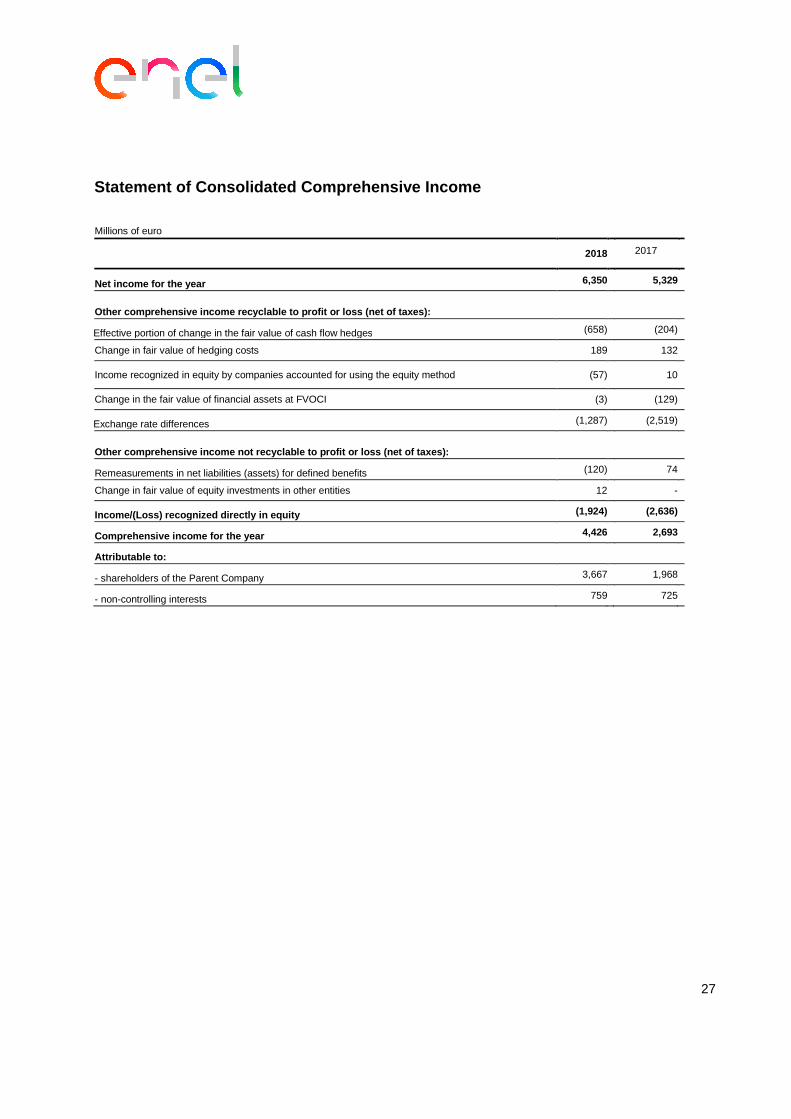
Statement of Consolidated Comprehensive Income Millions of euro
2018 2017
Net income for the year 6,350 5,329
Other comprehensive income recyclable to profit or loss (net of taxes):
Effective portion of change in the fair value of cash flow hedges (658) (204)
Change in fair value of hedging costs 189 132
Income recognized in equity by companies accounted for using the equity method (57) 10
Change in the fair value of financial assets at FVOCI (3) (129)
Exchange rate differences (1,287) (2,519)
Other comprehensive income not recyclable to profit or loss (net of taxes):
Remeasurements in net liabilities (assets) for defined benefits (120) 74
Change in fair value of equity investments in other entities 12 -
Income/(Loss) recognized directly in equity (1,924) (2,636)
Comprehensive income for the year 4,426 2,693
Attributable to:
- shareholders of the Parent Company 3,667 1,968
- non-controlling interests 759 725
28
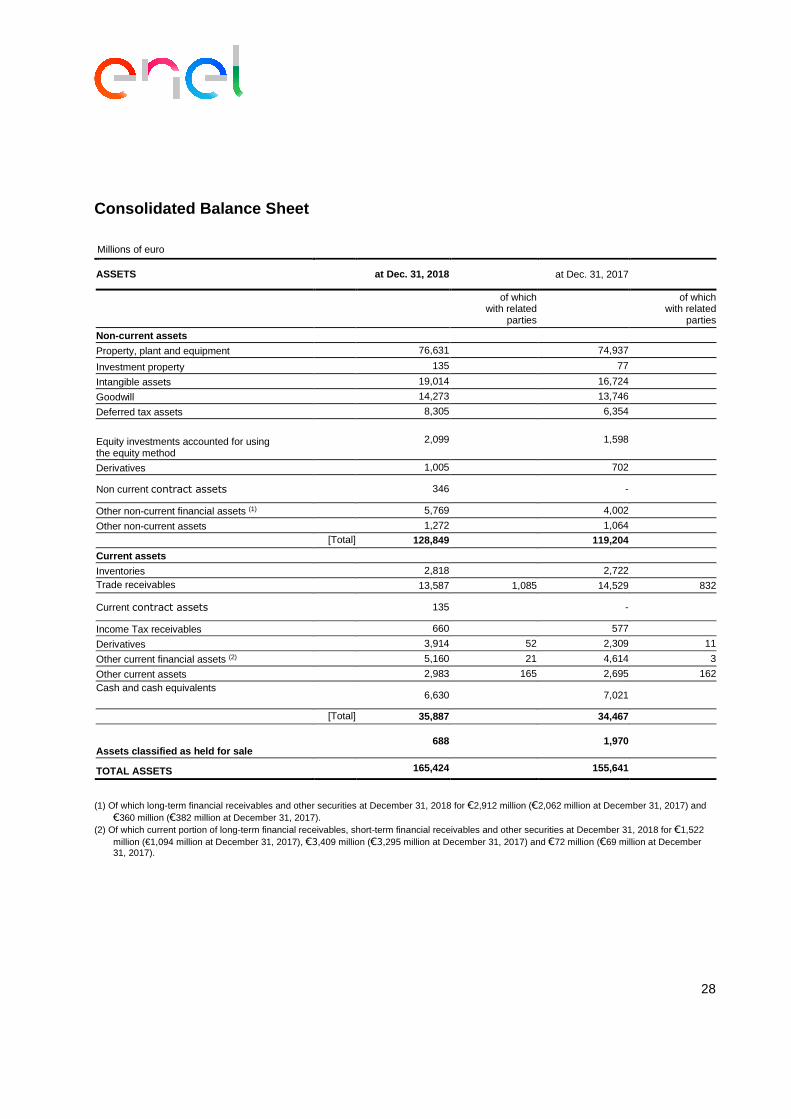
Consolidated Balance Sheet
Millions of euro
ASSETS at Dec. 31, 2018 at Dec. 31, 2017
of which with related
parties
of which with related
parties
Non-current assets Property, plant and equipment 76,631 74,937 Investment property 135 77 Intangible assets 19,014 16,724 Goodwill 14,273 13,746 Deferred tax assets 8,305 6,354
Equity investments accounted for using the equity method
2,099 1,598
Derivatives 1,005 702
Non current contract assets 346 -
Other non-current financial assets (1) 5,769 4,002 Other non-current assets 1,272 1,064
[Total] 128,849 119,204
Current assets Inventories 2,818 2,722 Trade receivables 13,587 1,085 14,529 832
Current contract assets 135 -
Income Tax receivables 660 577 Derivatives 3,914 52 2,309 11
Other current financial assets (2) 5,160 21 4,614 3
Other current assets 2,983 165 2,695 162 Cash and cash equivalents
6,630 7,021
[Total] 35,887 34,467
Assets classified as held for sale 688 1,970
TOTAL ASSETS 165,424 155,641
(1) Of which long-term financial receivables and other securities at December 31, 2018 for €2,912 million (€2,062 million at December 31, 2017) and €360 million (€382 million at December 31, 2017).
(2) Of which current portion of long-term financial receivables, short-term financial receivables and other securities at December 31, 2018 for €1,522 million (€1,094 million at December 31, 2017), €3,409 million (€3,295 million at December 31, 2017) and €72 million (€69 million at December 31, 2017).
29
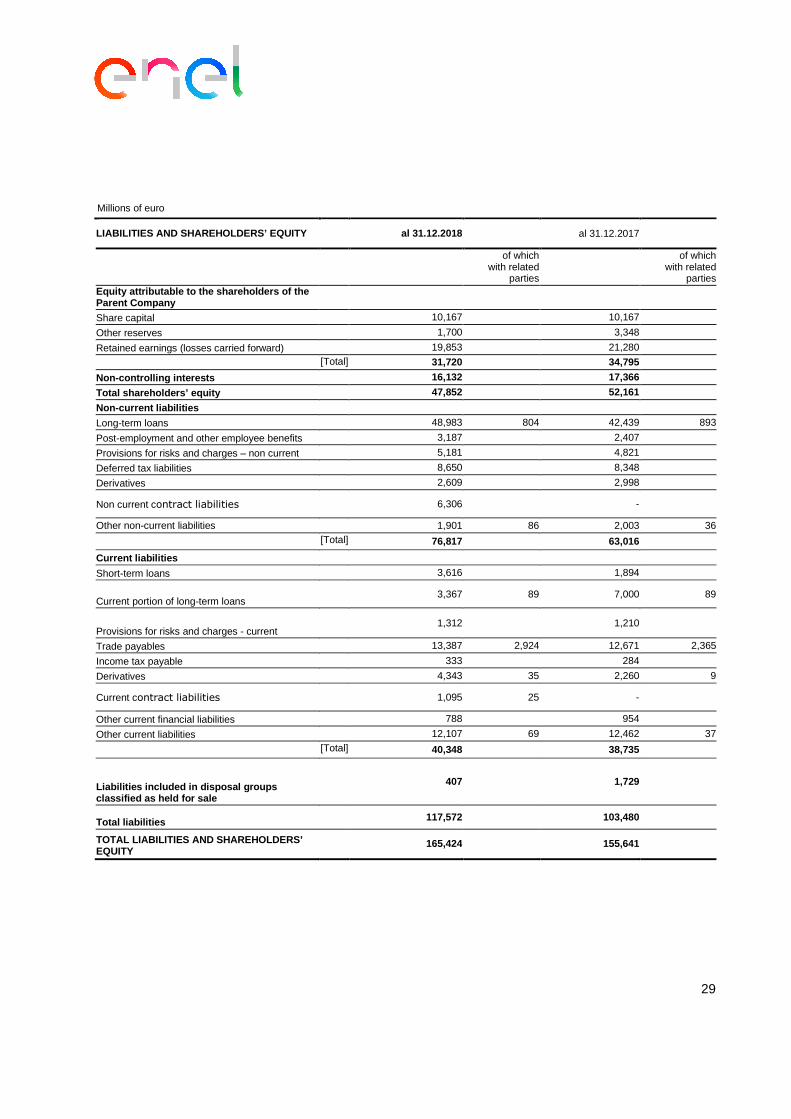
Millions of euro
LIABILITIES AND SHAREHOLDERS’ EQUITY al 31.12.2018 al 31.12.2017
of which with related
parties
of which with related
parties Equity attributable to the shareholders of the Parent Company
Share capital 10,167 10,167 Other reserves 1,700 3,348 Retained earnings (losses carried forward) 19,853 21,280
[Total] 31,720 34,795
Non-controlling interests 16,132 17,366 Total shareholders’ equity 47,852 52,161 Non-current liabilities Long-term loans 48,983 804 42,439 893
Post-employment and other employee benefits 3,187 2,407 Provisions for risks and charges – non current 5,181 4,821 Deferred tax liabilities 8,650 8,348 Derivatives 2,609 2,998
Non current contract liabilities 6,306 -
Other non-current liabilities 1,901 86 2,003 36
[Total] 76,817 63,016
Current liabilities Short-term loans 3,616 1,894
Current portion of long-term loans 3,367 89 7,000 89
Provisions for risks and charges - current 1,312 1,210
Trade payables 13,387 2,924 12,671 2,365
Income tax payable 333 284 Derivatives 4,343 35 2,260 9
Current contract liabilities 1,095 25 -
Other current financial liabilities 788 954 Other current liabilities 12,107 69 12,462 37
[Total] 40,348 38,735
Liabilities included in disposal groups classified as held for sale
407 1,729
Total liabilities 117,572 103,480
TOTAL LIABILITIES AND SHAREHOLDERS’ EQUITY
165,424 155,641
30
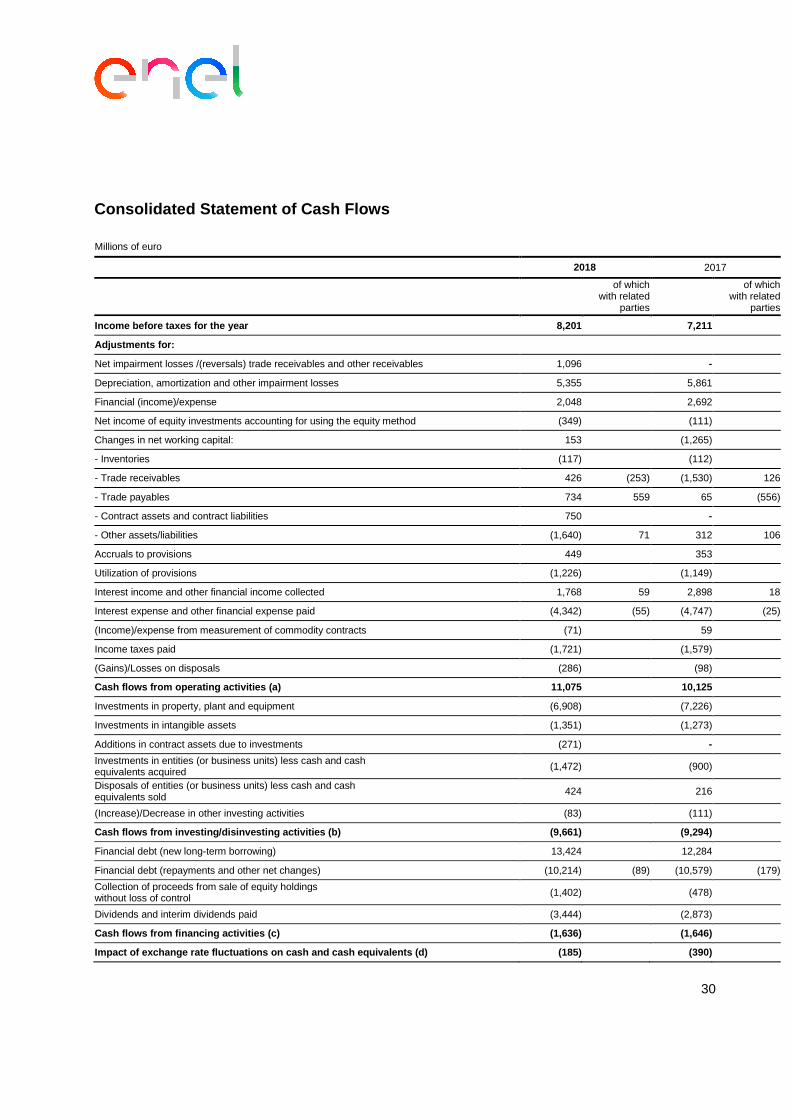
Consolidated Statement of Cash Flows
Millions of euro
2018 2017
of which with related
parties
of which with related
parties
Income before taxes for the year 8,201 7,211 Adjustments for:
Net impairment losses /(reversals) trade receivables and other receivables 1,096
-
Depreciation, amortization and other impairment losses 5,355 5,861 Financial (income)/expense 2,048 2,692 Net income of equity investments accounting for using the equity method (349) (111) Changes in net working capital: 153 (1,265) - Inventories (117) (112) - Trade receivables 426 (253) (1,530) 126
- Trade payables 734 559 65 (556)
- Contract assets and contract liabilities 750 -
- Other assets/liabilities (1,640) 71 312 106
Accruals to provisions 449 353 Utilization of provisions (1,226) (1,149) Interest income and other financial income collected 1,768 59 2,898 18
Interest expense and other financial expense paid (4,342) (55) (4,747) (25)
(Income)/expense from measurement of commodity contracts (71) 59 Income taxes paid (1,721) (1,579) (Gains)/Losses on disposals (286) (98) Cash flows from operating activities (a) 11,075 10,125 Investments in property, plant and equipment (6,908) (7,226) Investments in intangible assets (1,351) (1,273) Additions in contract assets due to investments (271)
-
Investments in entities (or business units) less cash and cash equivalents acquired (1,472) (900) Disposals of entities (or business units) less cash and cash equivalents sold 424 216
(Increase)/Decrease in other investing activities (83) (111) Cash flows from investing/disinvesting activities ( b) (9,661) (9,294) Financial debt (new long-term borrowing) 13,424 12,284 Financial debt (repayments and other net changes) (10,214) (89) (10,579) (179)
Collection of proceeds from sale of equity holdings without loss of control (1,402) (478)
Dividends and interim dividends paid (3,444) (2,873) Cash flows from financing activities (c) (1,636)
(1,646)
Impact of exchange rate fluctuations on cash and ca sh equivalents (d) (185) (390)
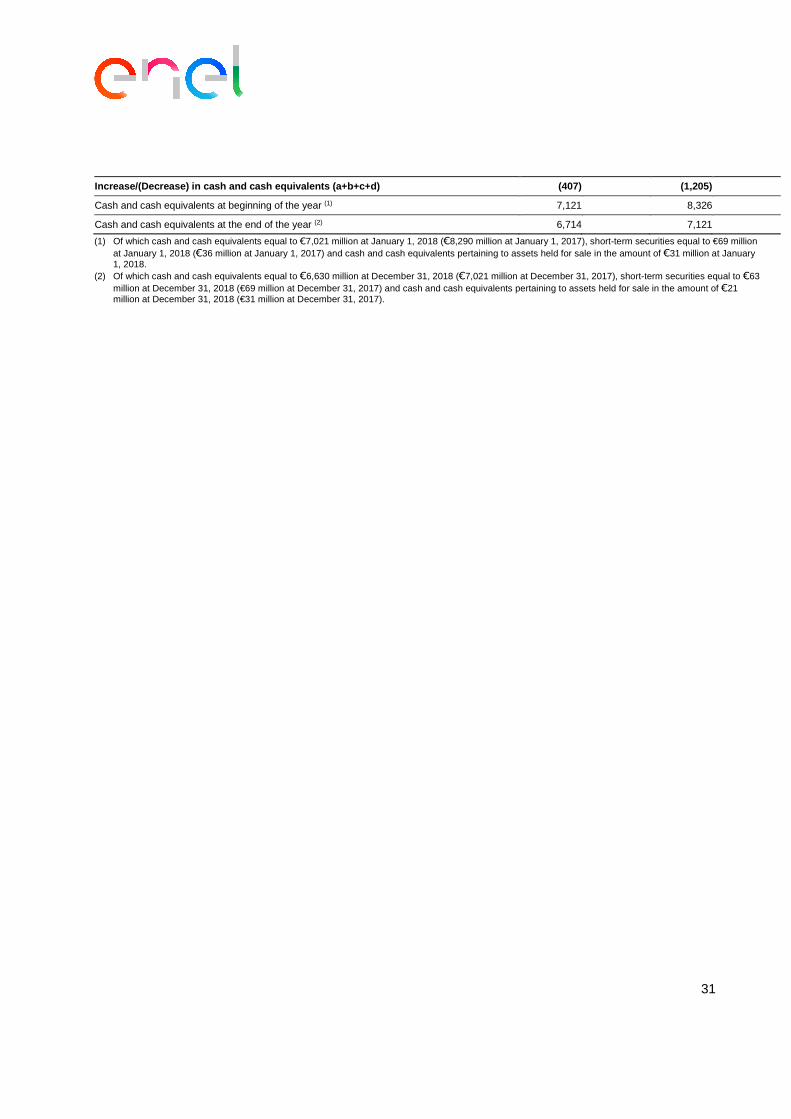
31
Increase/(Decrease) in cash and cash equivalents (a +b+c+d) (407) (1,205) Cash and cash equivalents at beginning of the year (1) 7,121 8,326 Cash and cash equivalents at the end of the year (2) 6,714 7,121 (1) Of which cash and cash equivalents equal to €7,021 million at January 1, 2018 (€8,290 million at January 1, 2017), short-term securities equal to €69 million
at January 1, 2018 (€36 million at January 1, 2017) and cash and cash equivalents pertaining to assets held for sale in the amount of €31 million at January 1, 2018.
(2) Of which cash and cash equivalents equal to €6,630 million at December 31, 2018 (€7,021 million at December 31, 2017), short-term securities equal to €63 million at December 31, 2018 (€69 million at December 31, 2017) and cash and cash equivalents pertaining to assets held for sale in the amount of €21 million at December 31, 2018 (€31 million at December 31, 2017).
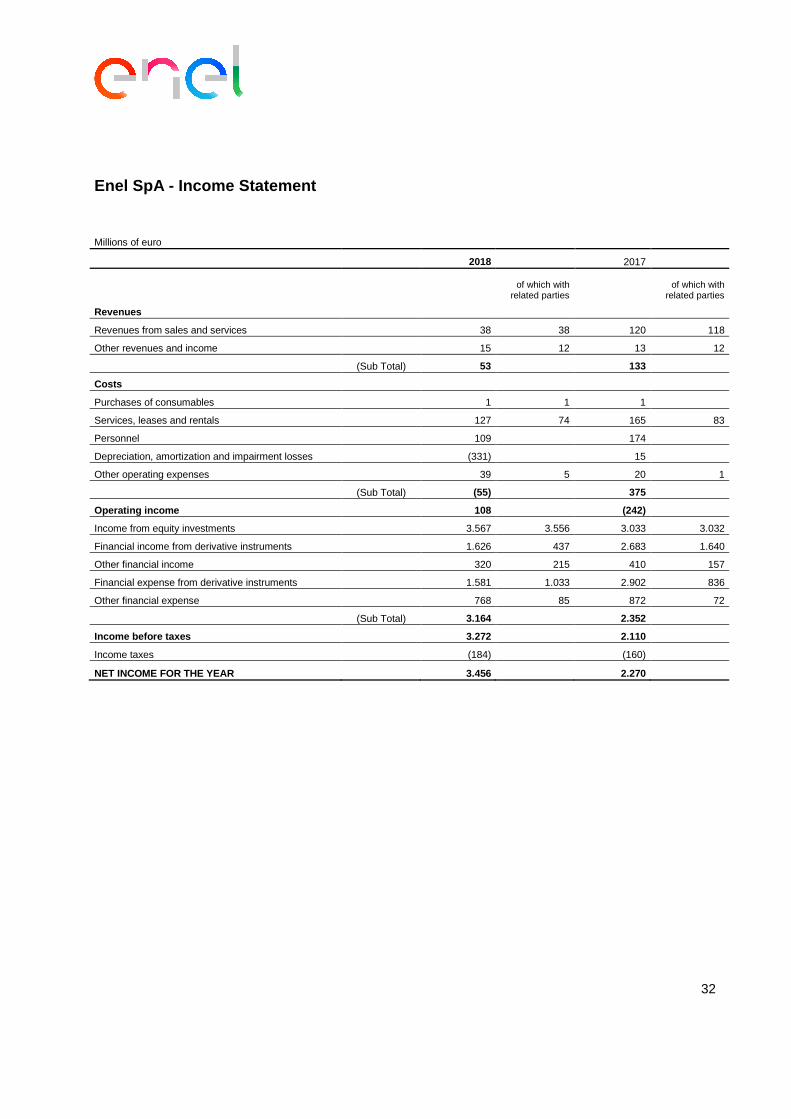
32
Enel SpA - Income Statement
Millions of euro
2018 2017
of which with
related parties of which with
related parties
Revenues
Revenues from sales and services 38 38 120 118
Other revenues and income 15 12 13 12
(Sub Total) 53 133
Costs
Purchases of consumables 1 1 1
Services, leases and rentals 127 74 165 83
Personnel 109 174
Depreciation, amortization and impairment losses (331) 15
Other operating expenses 39 5 20 1
(Sub Total) (55) 375
Operating income 108 (242)
Income from equity investments 3.567 3.556 3.033 3.032
Financial income from derivative instruments 1.626 437 2.683 1.640
Other financial income 320 215 410 157
Financial expense from derivative instruments 1.581 1.033 2.902 836
Other financial expense 768 85 872 72
(Sub Total) 3.164 2.352
Income before taxes 3.272 2.110
Income taxes (184) (160)
NET INCOME FOR THE YEAR 3.456 2.270
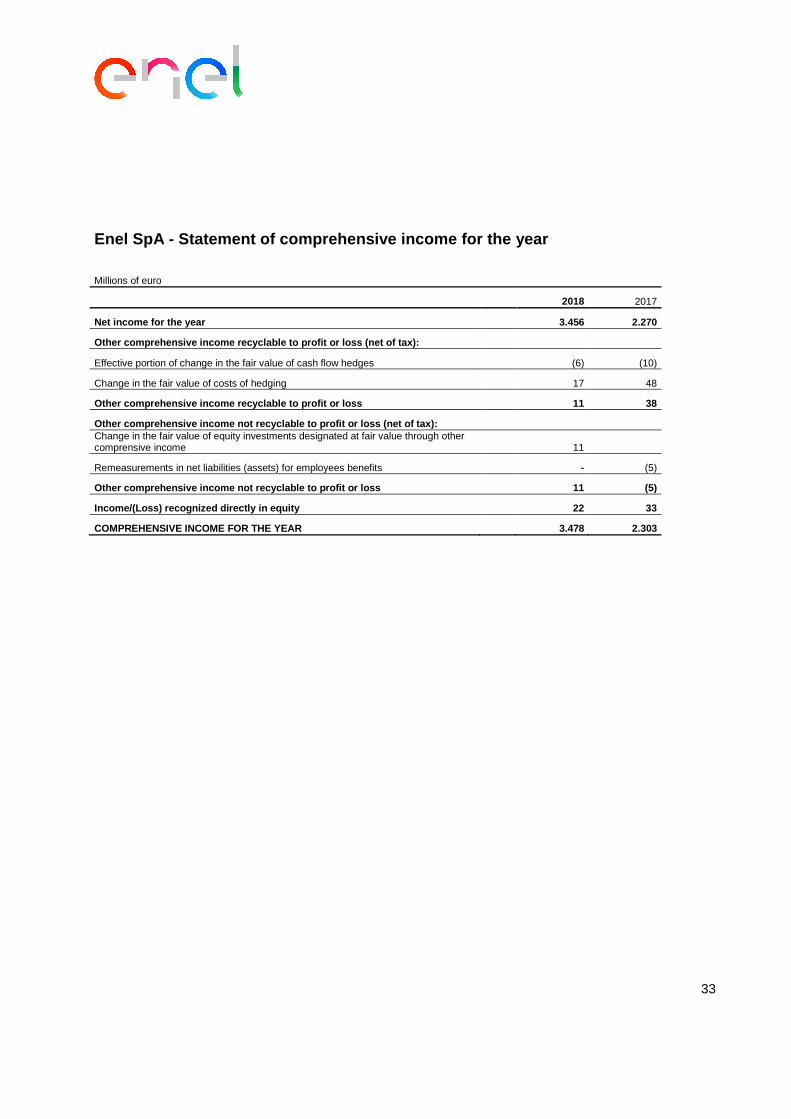
33
Enel SpA - Statement of comprehensive income for th e year
Millions of euro
2018 2017
Net income for the year 3.456 2.270
Other comprehensive income recyclable to profit or loss (net of tax):
Effective portion of change in the fair value of cash flow hedges (6) (10)
Change in the fair value of costs of hedging 17 48
Other comprehensive income recyclable to profit or loss 11 38
Other comprehensive income not recyclable to profit or loss (net of tax): Change in the fair value of equity investments designated at fair value through other comprensive income 11
Remeasurements in net liabilities (assets) for employees benefits - (5)
Other comprehensive income not recyclable to profit or loss 11 (5)
Income/(Loss) recognized directly in equity 22 33
COMPREHENSIVE INCOME FOR THE YEAR 3.478 2.303
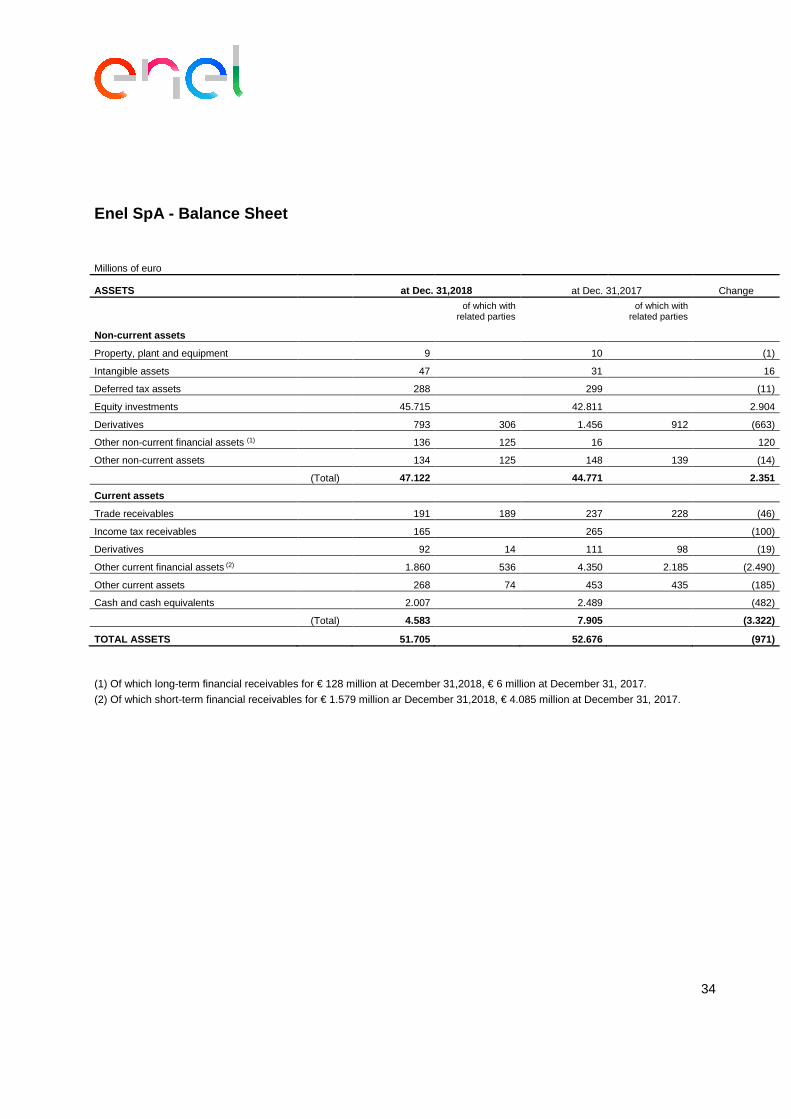
34
Enel SpA - Balance Sheet
Millions of euro
ASSETS at Dec. 31,2018 at Dec. 31,2017 Change
of which with
related parties of which with
related parties
Non-current assets
Property, plant and equipment 9 10 (1)
Intangible assets 47 31 16
Deferred tax assets 288 299 (11)
Equity investments 45.715 42.811 2.904
Derivatives 793 306 1.456 912 (663)
Other non-current financial assets (1) 136 125 16 120
Other non-current assets 134 125 148 139 (14)
(Total) 47.122 44.771 2.351
Current assets
Trade receivables 191 189 237 228 (46)
Income tax receivables 165 265 (100)
Derivatives 92 14 111 98 (19)
Other current financial assets (2) 1.860 536 4.350 2.185 (2.490)
Other current assets 268 74 453 435 (185)
Cash and cash equivalents 2.007 2.489 (482)
(Total) 4.583 7.905 (3.322)
TOTAL ASSETS 51.705 52.676 (971)
(1) Of which long-term financial receivables for € 128 million at December 31,2018, € 6 million at December 31, 2017.
(2) Of which short-term financial receivables for € 1.579 million ar December 31,2018, € 4.085 million at December 31, 2017.
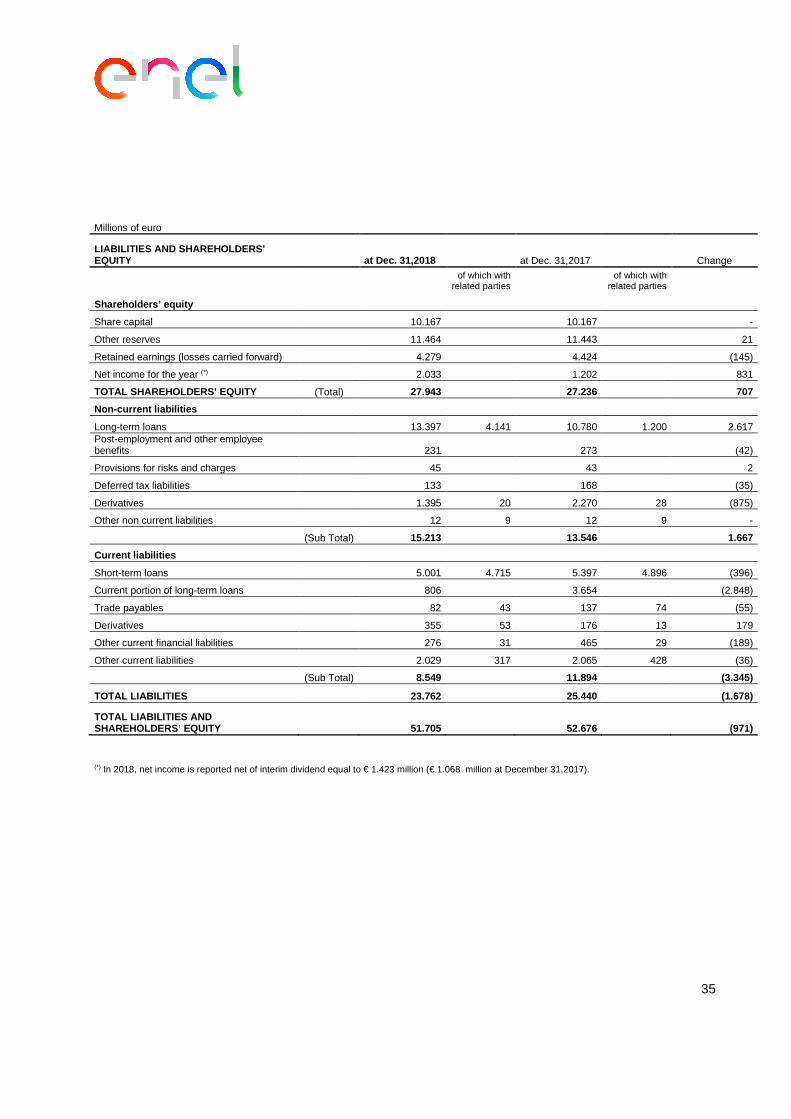
35
Millions of euro
LIABILITIES AND SHAREHOLDERS’ EQUITY at Dec. 31,2018 at Dec. 31,2017 Change
of which with
related parties of which with
related parties Shareholders’ equity
Share capital 10.167 10.167 -
Other reserves 11.464 11.443 21
Retained earnings (losses carried forward) 4.279 4.424 (145)
Net income for the year (*) 2.033 1.202 831
TOTAL SHAREHOLDERS’ EQUITY (Total) 27.943 27.236 707 Non-current liabilities
Long-term loans 13.397 4.141 10.780 1.200 2.617 Post-employment and other employee benefits 231 273 (42)
Provisions for risks and charges 45 43 2
Deferred tax liabilities 133 168 (35)
Derivatives 1.395 20 2.270 28 (875)
Other non current liabilities 12 9 12 9 -
(Sub Total) 15.213 13.546 1.667 Current liabilities
Short-term loans 5.001 4.715 5.397 4.896 (396)
Current portion of long-term loans 806 3.654 (2.848)
Trade payables 82 43 137 74 (55)
Derivatives 355 53 176 13 179
Other current financial liabilities 276 31 465 29 (189)
Other current liabilities 2.029 317 2.065 428 (36)
(Sub Total) 8.549 11.894 (3.345)
TOTAL LIABILITIES 23.762 25.440 (1.678)
TOTAL LIABILITIES AND SHAREHOLDERS’ EQUITY 51.705 52.676 (971)
(*) In 2018, net income is reported net of interim dividend equal to € 1.423 million (€ 1.068 million at December 31,2017).
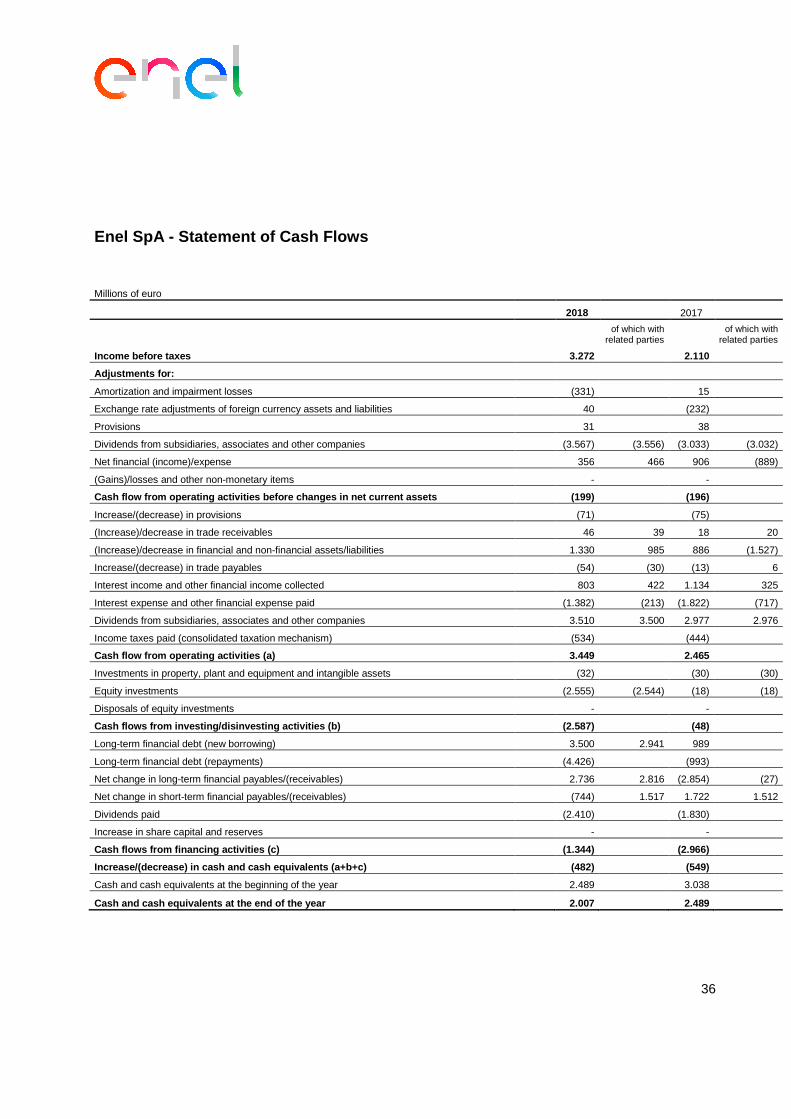
36
Enel SpA - Statement of Cash Flows
Millions of euro
2018 2017
of which with
related parties of which with
related parties
Income before taxes 3.272 2.110
Adjustments for:
Amortization and impairment losses (331) 15
Exchange rate adjustments of foreign currency assets and liabilities 40 (232)
Provisions 31 38
Dividends from subsidiaries, associates and other companies (3.567) (3.556) (3.033) (3.032)
Net financial (income)/expense 356 466 906 (889)
(Gains)/losses and other non-monetary items - -
Cash flow from operating activities before changes in net current assets (199) (196)
Increase/(decrease) in provisions (71) (75)
(Increase)/decrease in trade receivables 46 39 18 20
(Increase)/decrease in financial and non-financial assets/liabilities 1.330 985 886 (1.527)
Increase/(decrease) in trade payables (54) (30) (13) 6
Interest income and other financial income collected 803 422 1.134 325
Interest expense and other financial expense paid (1.382) (213) (1.822) (717)
Dividends from subsidiaries, associates and other companies 3.510 3.500 2.977 2.976
Income taxes paid (consolidated taxation mechanism) (534) (444)
Cash flow from operating activities (a) 3.449 2.465
Investments in property, plant and equipment and intangible assets (32) (30) (30)
Equity investments (2.555) (2.544) (18) (18)
Disposals of equity investments - -
Cash flows from investing/disinvesting activities ( b) (2.587) (48)
Long-term financial debt (new borrowing) 3.500 2.941 989
Long-term financial debt (repayments) (4.426) (993)
Net change in long-term financial payables/(receivables) 2.736 2.816 (2.854) (27)
Net change in short-term financial payables/(receivables) (744) 1.517 1.722 1.512
Dividends paid (2.410) (1.830)
Increase in share capital and reserves - -
Cash flows from financing activities (c) (1.344) (2.966)
Increase/(decrease) in cash and cash equivalents (a +b+c) (482) (549)
Cash and cash equivalents at the beginning of the year 2.489 3.038
Cash and cash equivalents at the end of the year 2.007 2.489