Embed Size (px)
Citation preview
Energies 2015, 8, 2145-2164; doi:10.3390/en8032145
energies ISSN 1996-1073
www.mdpi.com/journal/energies
Article
Load Frequency Control in Isolated Micro-Grids with Electrical Vehicles Based on Multivariable Generalized Predictive Theory
Jun Yang 1, Zhili Zeng 1,2,*, Yufei Tang 3,†, Jun Yan 3,†, Haibo He 3,† and Yunliang Wu 1,†
1 School of Electrical Engineering, Wuhan University, Wuhan 430072, China;
E-Mails: [email protected] (J.Y.); [email protected] (Y.W.) 2 Nanning Power Supply Bureau, Guangxi Power Grid Corporation, Nanning 530031, China 3 Department of Electrical, Computer and Biomedical Engineering, University of Rhode Island,
Kingston, RI 02881, USA; E-Mails: [email protected] (Y.T.); [email protected] (J.Y.);
[email protected] (H.H.)
† These authors contributed equally to this work.
* Author to whom correspondence should be addressed; E-Mail: [email protected];
Tel.: +86-152-8969-4646; Fax: +86-27-8252-2379.
Academic Editor: Josep M. Guerrero
Received: 16 October 2014 / Accepted: 4 March 2015 / Published: 18 March 2015
Abstract: In power systems, although the inertia energy in power sources can partly cover
power unbalances caused by load disturbance or renewable energy fluctuation, it is still
hard to maintain the frequency deviation within acceptable ranges. However, with the
vehicle-to-grid (V2G) technique, electric vehicles (EVs) can act as mobile energy storage
units, which could be a solution for load frequency control (LFC) in an isolated grid.
In this paper, a LFC model of an isolated micro-grid with EVs, distributed generations and
their constraints is developed. In addition, a controller based on multivariable generalized
predictive control (MGPC) theory is proposed for LFC in the isolated micro-grid, where
EVs and diesel generator (DG) are coordinated to achieve a satisfied performance on load
frequency. A benchmark isolated micro-grid with EVs, DG, and wind farm is modeled in
the Matlab/Simulink environment to demonstrate the effectiveness of the proposed method.
Simulation results demonstrate that with MGPC, the energy stored in EVs can be managed
intelligently according to LFC requirement. This improves the system frequency stability
with complex operation situations including the random renewable energy resource and the
continuous load disturbances.
OPEN ACCESS

Energies 2015, 8 2146
Keywords: electric vehicle (EV); vehicle-to-grid (V2G); isolated grid; load frequency control
(LFC); multivariable generalized predictive control (MGPC)
1. Introduction
Due to technological and regulatory innovations, the micro-grid has become an alternate choice to
compete with traditional centralized electricity plants for its small-scale and on-site distributed energy
providing capability. A typical micro-grid consists of distributed generation sources, e.g., diesel generators
or micro-turbines, loads, and renewable sources [1,2]. A micro-grid can be operated in two modes, i.e.,
isolated mode or grid-connected mode [3]. If a micro-grid is grid-connected, the loads can be supplied
by the connected electrical power system. Otherwise, the distributed generation has to cope with varying
load and fluctuating renewable energy sources in the isolated mode, which requires proper control of
micro-grid to ensure frequency and voltage stability in order to supply high-quality power to customers.
However, because of fluctuations of renewable sources and limited capacity of distributed generation
sources, it is difficult to achieve active power balance between generations and loads that is important
for critical installations.
Electric vehicles (EV) are an inevitable trend in the automotive industry’s development of
energy-saving and environmentally friendly cars [4,5]. EV technology represents a good option for
significant reductions in gasoline consumption, smog precursors and emission of greenhouse gases.
When EVs are connected to an electric distribution grid, the power flow between EVs and the power
grid can be bidirectional: a charging EV is a load for the grid [6], whereas a discharging EV is a power
source for the grid [7]. Statistical data of car usage show that private cars are sitting idle 95% of the
day, which mean most electric vehicles remain connected to the grid in charging or idle mode. With
the rapid development of EVs, the controllable energy stored in on-board batteries could be enormous.
By utilizing vehicle to grid (V2G) technique, EVs can act as distributed energy storage units. Thus,
in order to improve the support ability of load balance and the operation flexibility, EV can be a good
solution to stable operation of isolated micro-grids. As mentioned before, the critical issue in such
isolated micro-grids is large frequency fluctuation caused by intermittent renewable energy in an
isolate operating micro-gird, where the load-frequency control (LFC) capacity is not enough to
compensate the unbalance of generation and load demand. In this paper, we focus on the design of
a power system frequency oscillation damping controller using EVs. By providing active power to load
or absorbing extra active power from generations, EVs could quickly compensate the active power gap
between generation and load, thus improving the power grid frequency stability [8].
Load frequency control methods have been applied in traditional thermal power generation systems
and hydro power generation systems. Optimal control [9], fuzzy control, adaptive control [10] and
robust control have improved the load frequency control performance greatly. In [11], an optimal
output feedback method was proposed for the load frequency control in the deregulated environment.
In [12] a combined H ∞/μ approach to design a robust feedback load frequency controller for
multi-area power system was proposed. The authors of [13] proposed a coordinated control of blade
pitch angle of wind turbine generators and plug-in hybrid electric vehicles (PHEVs) for load frequency
Energies 2015, 8 2147
control of micro-grid using model predictive controls (MPCs). In order to reduce the number of
PHEVs, a smoothing technique of wind power production by pitch angle control using MPC method is
proposed and is coordinated with PHEVs control in this literature. In [14], a proportional integral (PI)
controller was applied in wind diesel hybrid power systems, and its parameters were optimized by
integral square error (ISE). In [15], an aggregated EV-based battery storage representing a V2G system
was modeled for long-term dynamic power system simulations, and the performance of a PI controller
for LFC was evaluated. However, since the PI controller with fixed gains has been designed at nominal
operating conditions, it could not provide good control performance over a wide range of operating
conditions. In [16], a typical city distribution system was modeled to demonstrate V2G capabilities for
frequency regulation and voltage sag reduction using a FUZZY logic controller. However, it can only
demonstrated good dynamics when some specific membership functions were selected, whose application
can be limited in reality.
In an isolated micro-grid with fluctuating renewable sources and EVs, the system state parameters
and operating conditions are changing rapidly. Traditional controllers are not optimized for the whole
set of possible operating conditions and configurations, so they cannot guarantee the control of system
frequency through coordinating V2G and other units for all operating conditions. Also, there are some
constraints in the LFC units including capacity constraints and generation rate constraints, which are
difficult to be considered in the controller design. So, a controller with robust performance over a wide
range of system operating conditions is greatly expected for LFC in isolated micro-grids.
To overcome the aforementioned problems, this paper proposes a new coordinated LFC controller
based on multivariable generalized predictive control (MGPC). With the control procedure of
multi-step prediction, rolling optimization and feedback correction [17], MGPC can effectively solve
multivariable optimal control problem with constraints even without an accurate system model, so that
the rapid change of system operation status can be tracked quickly. In this controller design, the LFC
signal is dispatched to diesel generator (DG) and EVs according to the response speed and the
controllable capacity; moreover, the wind turbine generator is modeled as a random fluctuating
resource in this paper.
The rest of this paper is organized as follows: Section 2 provides the description and analysis of the
models in an isolated grid, including EVs, DG and wind power. In Section 3, the coordinated LFC
controller based on MGPC is proposed. In Section 4, effectiveness and robustness of the proposed
coordinated controller is demonstrated by numerical simulations on a benchmark power system with
EVs. Conclusions are drawn in Section 5.
2. Model of an Isolated Micro-Grid
2.1. Model of the Benchmark Micro-Grid
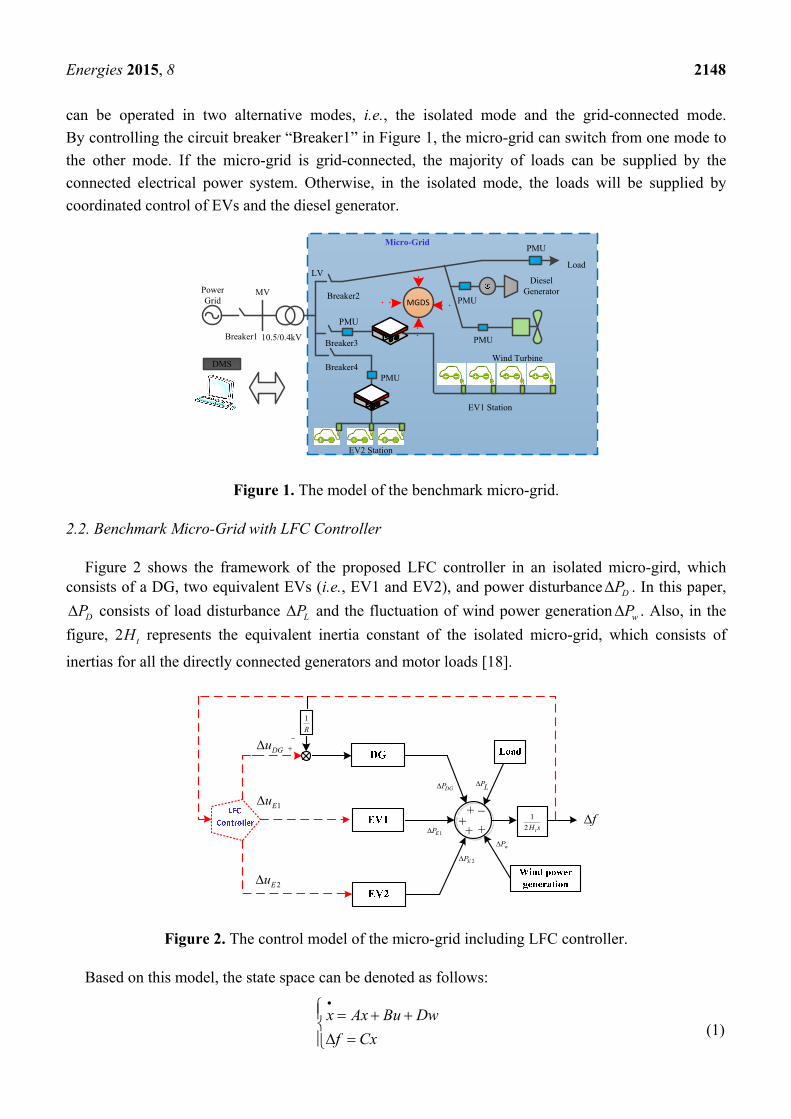
As shown in Figure 1, a micro-grid is composed of a single bus-bar, a wind turbine, a diesel
generator, EVs and loads. The power grid is managed by a distribution management system (DMS),
and the micro-grid operation is controlled by a micro-grid dispatch system (MGDS). Phasor
measurement units (PMUs) are installed in this micro-grid to measure the real-time information of
circuit breakers, distributed generation sources, EVs, and loads. With the same model, the micro-grid
Energies 2015, 8 2148
can be operated in two alternative modes, i.e., the isolated mode and the grid-connected mode.
By controlling the circuit breaker “Breaker1” in Figure 1, the micro-grid can switch from one mode to
the other mode. If the micro-grid is grid-connected, the majority of loads can be supplied by the
connected electrical power system. Otherwise, in the isolated mode, the loads will be supplied by
coordinated control of EVs and the diesel generator.
MV
LV
DMS
EV1 Station
EV2 Station
PMU
PMU
PMU
PMU
PMU
10.5/0.4kV
Load
Power Grid
Wind Turbine
Breaker1
Micro-Grid
Breaker2
Breaker3
Breaker4
MGDS
Diesel Generator
Figure 1. The model of the benchmark micro-grid.
2.2. Benchmark Micro-Grid with LFC Controller
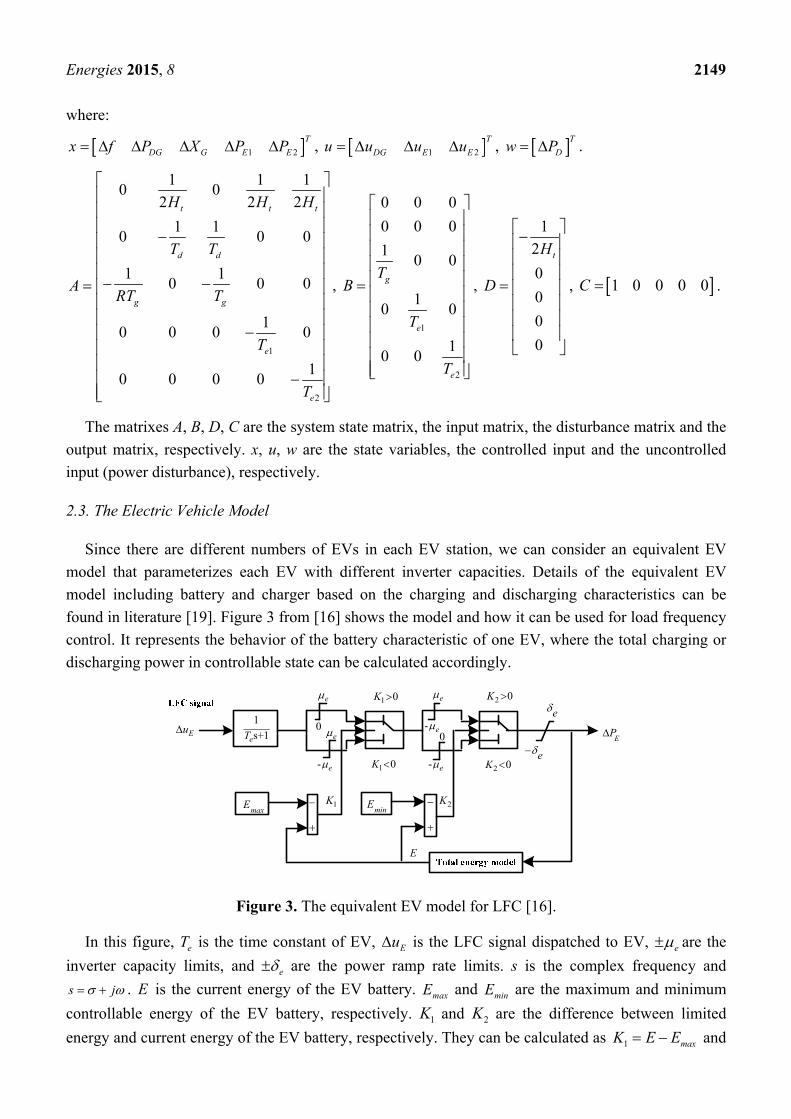
Figure 2 shows the framework of the proposed LFC controller in an isolated micro-gird, which consists of a DG, two equivalent EVs (i.e., EV1 and EV2), and power disturbance DP . In this paper,
DP consists of load disturbance LP and the fluctuation of wind power generation wP . Also, in the
figure, 2 tH represents the equivalent inertia constant of the isolated micro-grid, which consists of
inertias for all the directly connected generators and motor loads [18].
f
DGu
1
R
DGP
1EP
1
2 tH s
2EP
+
+ ++
wP
PL
1Eu
2Eu
Figure 2. The control model of the micro-grid including LFC controller.
Based on this model, the state space can be denoted as follows:
x Ax Bu Dw
f Cx
(1)
Energies 2015, 8 2149
where:
1 2
T
DG G E Ex f P X P P , 1 2
T
DG E Eu u u u , TDw P .
1
2
1 1 10 0
2 2 2
1 10 0 0
1 10 0 0
10 0 0 0
10 0 0 0
t t t
d d
g g
e
e
H H H
T T
ART T
T
T
,
1
2
0 0 0
0 0 0
10 0
10 0
10 0
g
e
e
TB
T
T
,
1
2
0
0
0
0
tH
D
, 1 0 0 0 0C .
The matrixes A, B, D, C are the system state matrix, the input matrix, the disturbance matrix and the
output matrix, respectively. x, u, w are the state variables, the controlled input and the uncontrolled
input (power disturbance), respectively.
2.3. The Electric Vehicle Model
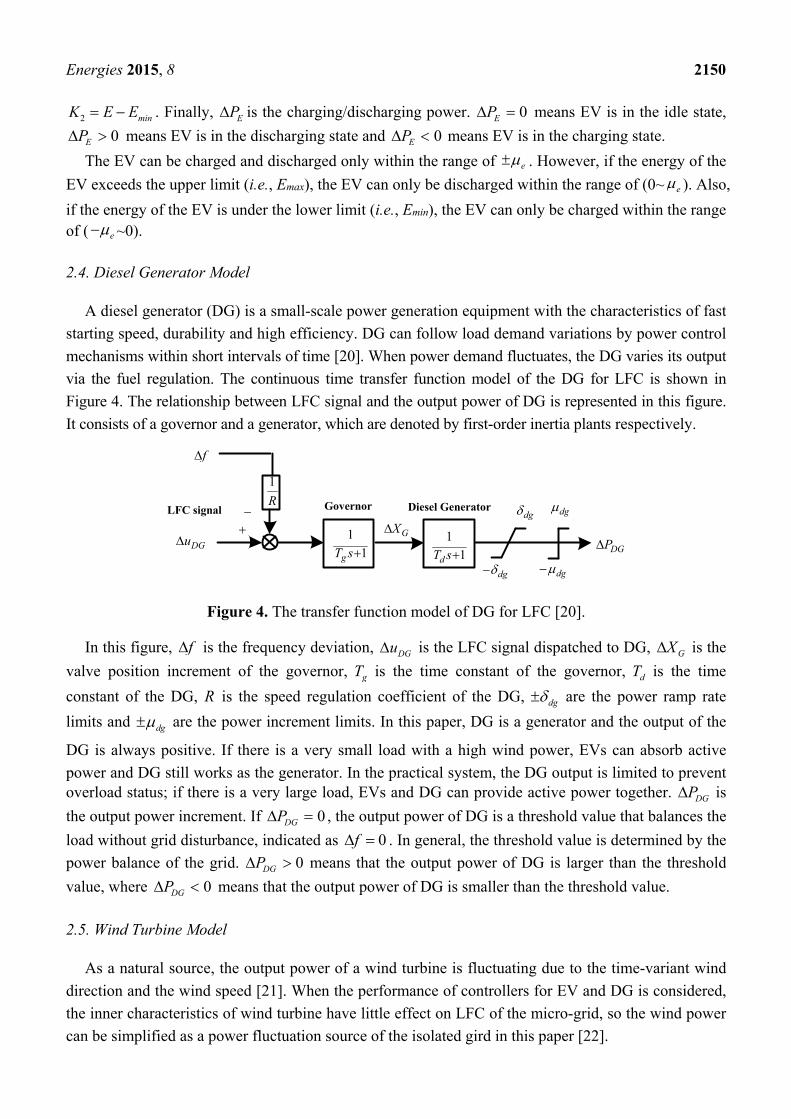
Since there are different numbers of EVs in each EV station, we can consider an equivalent EV
model that parameterizes each EV with different inverter capacities. Details of the equivalent EV
model including battery and charger based on the charging and discharging characteristics can be
found in literature [19]. Figure 3 from [16] shows the model and how it can be used for load frequency
control. It represents the behavior of the battery characteristic of one EV, where the total charging or
discharging power in controllable state can be calculated accordingly.
maxE
EuE
P1
s+1eT
1K
00
1 0K
1 0K
2 0K
2 0K
e
e
- e
e
- e
- e
e
e
minE 2K
E
Figure 3. The equivalent EV model for LFC [16].
In this figure, eT is the time constant of EV, Eu is the LFC signal dispatched to EV, e are the
inverter capacity limits, and e are the power ramp rate limits. s is the complex frequency and
s j . E is the current energy of the EV battery. maxE and minE are the maximum and minimum
controllable energy of the EV battery, respectively. 1K and 2K are the difference between limited
energy and current energy of the EV battery, respectively. They can be calculated as 1 maxK E E and
Energies 2015, 8 2150
2 minK E E . Finally, EP is the charging/discharging power. 0EP means EV is in the idle state,
0EP means EV is in the discharging state and 0EP means EV is in the charging state.
The EV can be charged and discharged only within the range of e . However, if the energy of the
EV exceeds the upper limit (i.e., Emax), the EV can only be discharged within the range of (0~ e ). Also,
if the energy of the EV is under the lower limit (i.e., Emin), the EV can only be charged within the range of ( e ~0).
2.4. Diesel Generator Model
A diesel generator (DG) is a small-scale power generation equipment with the characteristics of fast
starting speed, durability and high efficiency. DG can follow load demand variations by power control
mechanisms within short intervals of time [20]. When power demand fluctuates, the DG varies its output
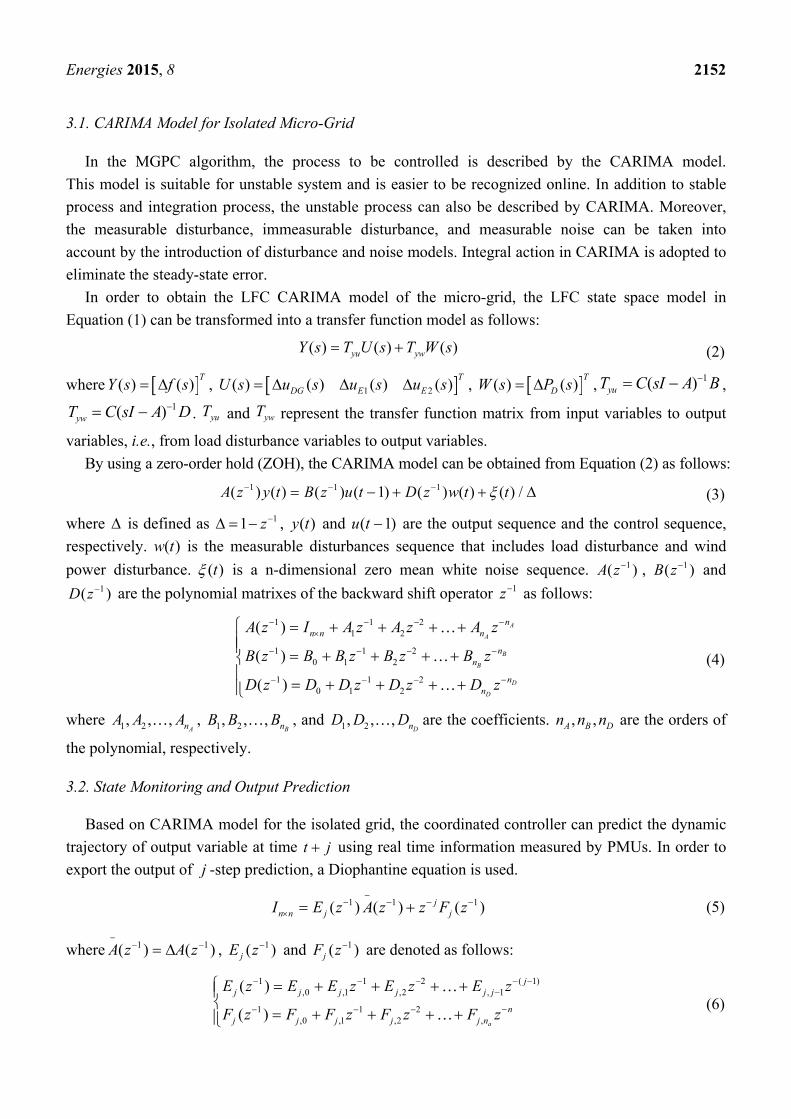
via the fuel regulation. The continuous time transfer function model of the DG for LFC is shown in
Figure 4. The relationship between LFC signal and the output power of DG is represented in this figure.
It consists of a governor and a generator, which are denoted by first-order inertia plants respectively.
DGu
1
R
f
1
1gT s1
1dT s DGP
Governor Diesel Generator
GXdg
dg dg
dgLFC signal
Figure 4. The transfer function model of DG for LFC [20].
In this figure, f is the frequency deviation, DGu is the LFC signal dispatched to DG, GX is the
valve position increment of the governor, gT is the time constant of the governor, dT is the time
constant of the DG, R is the speed regulation coefficient of the DG, dg are the power ramp rate
limits and dg are the power increment limits. In this paper, DG is a generator and the output of the
DG is always positive. If there is a very small load with a high wind power, EVs can absorb active
power and DG still works as the generator. In the practical system, the DG output is limited to prevent overload status; if there is a very large load, EVs and DG can provide active power together. DGP is
the output power increment. If 0DGP , the output power of DG is a threshold value that balances the
load without grid disturbance, indicated as 0f . In general, the threshold value is determined by the
power balance of the grid. 0DGP means that the output power of DG is larger than the threshold
value, where 0DGP means that the output power of DG is smaller than the threshold value.
2.5. Wind Turbine Model
As a natural source, the output power of a wind turbine is fluctuating due to the time-variant wind
direction and the wind speed [21]. When the performance of controllers for EV and DG is considered,
the inner characteristics of wind turbine have little effect on LFC of the micro-grid, so the wind power
can be simplified as a power fluctuation source of the isolated gird in this paper [22].

Energies 2015, 8 2151
3. The Coordinated LFC Controller Based on Multivariable Generalized Predictive Control
When the isolated grid suffers from a power disturbance, the goal of LFC is to regulate the
frequency deviation to zero as soon as possible by controlling the input signal of DG and EVs.
According to system state and disturbance characteristic, an online closed-loop control system can be
established considering the constraints of DG and EVs. Therefore, we propose a coordinated LFC
controller based on multivariable generalized predictive control (MGPC). As shown in Figure 5,
this controller is composed of two layers: a coordinated control layer and a local frequency control layer.
Based on frequency deviation and active power deviation, the coordinated control layer first provides
the real time LFC signal to the local frequency control layer; then the local frequency control layer
controls the DG and the EVs to quickly damp the system frequency oscillation.
fDGP2EP
DP
1Eu 2Eu DGu
1EP
Figure 5. The structure of the proposed coordinated LFC controller based on MGPC.
The operation flow of the proposed controller can be divided into following three steps:
Step 1 State monitoring. The real-time state information measured by PMUs, including f , 1EP , 2EP ,
DGP and DP , is collected by MGDS, and then sent to the proposed coordinated controller.
Step 2 Future prediction. Based on the real time state information from MGDS, the coordinated
controller will predict the dynamic trajectory of f using the controlled auto-regressive and
integrated moving average (CARIMA) model [23]. Then the relationship between control
variables 1Eu , 2Eu , DGu and the predicted variable f is established.
Step 3 Optimal control. Based on the result from step 2, the coordinated controller will calculate
1Eu , 2Eu and DGu according to the objective function considering the constraints of EVs
and DG.
Based on these general steps for the proposed LFC controllers, the detailed control theory and
implementation are presented in the following sections.
Energies 2015, 8 2152
3.1. CARIMA Model for Isolated Micro-Grid
In the MGPC algorithm, the process to be controlled is described by the CARIMA model.
This model is suitable for unstable system and is easier to be recognized online. In addition to stable
process and integration process, the unstable process can also be described by CARIMA. Moreover,
the measurable disturbance, immeasurable disturbance, and measurable noise can be taken into
account by the introduction of disturbance and noise models. Integral action in CARIMA is adopted to
eliminate the steady-state error.
In order to obtain the LFC CARIMA model of the micro-grid, the LFC state space model in
Equation (1) can be transformed into a transfer function model as follows:
( ) ( ) ( )yu ywY s T U s T W s (2)
where ( ) ( )T
Y s f s , 1 2( ) ( ) ( ) ( )T
DG E EU s u s u s u s , ( ) ( )T
DW s P s , 1( )yuT C sI A B , 1( )ywT C sI A D . yuT and ywT represent the transfer function matrix from input variables to output
variables, i.e., from load disturbance variables to output variables.
By using a zero-order hold (ZOH), the CARIMA model can be obtained from Equation (2) as follows: 1 1 1( ) ( ) ( ) ( 1) ( ) ( ) ( ) /A z y t B z u t D z w t t (3)
where is defined as 11 z , ( )y t and ( 1)u t are the output sequence and the control sequence,
respectively. ( )w t is the measurable disturbances sequence that includes load disturbance and wind
power disturbance. ( )t is a n-dimensional zero mean white noise sequence. 1( )A z , 1( )B z and 1( )D z are the polynomial matrixes of the backward shift operator 1z as follows:
1 1 21 2
1 1 20 1 2
1 1 20 1 2
( )
( )
( )
A
A
B
B
D
D
nn n n
nn
nn
A z I A z A z A z
B z B B z B z B z
D z D D z D z D z
(4)
where 1 2, , ,AnA A A , 1 2, , ,
BnB B B , and 1 2, , ,DnD D D are the coefficients. , ,A B Dn n n are the orders of
the polynomial, respectively.
3.2. State Monitoring and Output Prediction
Based on CARIMA model for the isolated grid, the coordinated controller can predict the dynamic
trajectory of output variable at time t j using real time information measured by PMUs. In order to
export the output of j -step prediction, a Diophantine equation is used.
1 1 1( ) ( ) ( )jn n j jI E z A z z F z
(5)
where 1 1( ) ( )A z A z
, 1( )jE z and 1( )jF z are denoted as follows:
1 1 2 ( 1),0 ,1 ,2 , 1
1 1 2,0 ,1 ,2 ,
( )
( )a
jj j j j j j
nj j j j j n
E z E E z E z E z
F z F F z F z F z
(6)
Energies 2015, 8 2153
Multiplying Equation (3) by 1( ) j
jE z z leads to:
1 1 1 1 1 1 1( ) ( ) ( ) ( ) ( ) ( 1) ( ) ( ) ( ) ( ) ( )j j j jE z A z y t j E z B z u t j E z D z w t j E z t j
(7)
Considering Equation (5) and Equation (7), then: 1 1 1 1 1 1( ) ( ) ( ) ( ) ( ) ( 1) ( ) ( ) ( ) ( ) ( )j j j jy t j F z y t E z B z u t j E z D z w t j E z t j (8)
The j -step output prediction of the process is described below:
1 1 1 1 1( | ) ( ) ( ) ( 1) ( ) ( ) ( ) ( ) ( )j j jy t j t E z B z u t j E z D z w t j F z y t
(9)
1 1( ) ( )jE z B z and 1 1( ) ( )jE z D z are considered as:
1 1 1 1
11
0
1 1 1 1
11
0
( ) ( ) ( ) ( )
( )
( ) ( ) ( ) ( )
( )
jj j j
ji
j ji
jj j j
ji
j ji
E z B z G z z Gp z
G z g z
E z D z H z z Hp z
H z h z
(10)
Then we can denote Equation (9) as:
1( | ) ( ) ( 1)j jy t j t G z u t j f
(11)
where jf is the free response which can be calculated as follows:
1 1 1 1( ) ( 1) ( ) ( ) ( ) ( ) ( ) ( )j j j j jf Gp z u t H z w t j Hp z w t F z y t (12)
As a result, Equation (11) can be represented as follows:
Y GU f (13)
where [ ( 1 | ) ( | ) ]T T TpY y t t y t N t
, [ ( ) ( 1) ]T T TuU u t u t N , 1[ ]
p
T T TNf f f , pN is
the prediction horizon, and uN is the control horizon.
3.3. Optimal Control
In order to track the set reference value ( )r t j in the predicted output, we can calculate the control
vectors using optimization techniques based on the following objective function.
2 2
1 1
|| ( | ) ( ) || || ( 1) ||p u
N N
R Qj j
J y t j t r t j u t j
(14)
where R and Q are the positive definite weighting matrixes, ( )r t j is the future reference trajectory
for the output signal. ( | )y t j t
is an optimal j -step prediction of the system output based on data up
to time t .
According to Equation (13), Equation (14) can be written as follows:
Energies 2015, 8 2154
( ) ( )T TJ Y r R Y r U Q U (15)
Assuming there is no constraint on the control signals, the minimum of J can be obtained from
0J
U
, so:
1( ) ( )T TU G RG Q G R r f (16)
The control signal in this process is the first element of vector u , which is presented as:
( ) ( )u t k r f (17)
where k is the first row of matrix 1( )T TG RG Q G R .
As mentioned previously, the constraints of inverter capacity limit of equivalent EVs, ramp rate and
power increment limit of DG, can be formulated as follows:
( )
( ) ( 1)
( ) , 1, 2
( ) ( 1) , 1, 2
dg DG dg
dg s DG DG dg s
ei Ei ei
ei s Ei Ei ei s
P t
T P t P t T
P t i
T P t P t T i
(18)
where sT is the sampling interval.
These constraints can be expressed by a compact form as:
L U V (19)
To get the optimal control signals, we need to solve a standard quadratic programming problem
with constraints as follows:
min ( ) ( )
. .
T TJ Y r R Y r U Q U
s t L U V
(20)
There are many algorithms to solve this quadratic programming problem, such as the interior-point
method, the active-set method, the ellipsoid method, etc. In this paper, we use the function “quadprog”
provided by Matlab to solve the optimization problem in Equation (20). Since the optimization
variables are only three-dimensional, the computation time will be significantly reduced.
Equation (20) sets up the quadratic object function to optimize the coordinated control between EVs
and DG with corresponding constraints listed in Equation (19). Optimization results shown in the
following sections illustrate that the results of control are consistent with practical operating situations
in real power grid.
4. Simulation Studies
In order to investigate the performance of the proposed MGPC based controller for LFC, the module
of the micro-grid in Figure 1 is established in the Matlab/Simulink environment. Also, a well-tuned
PID controller and a FUZZY controller have also been studied in the simulation. The system
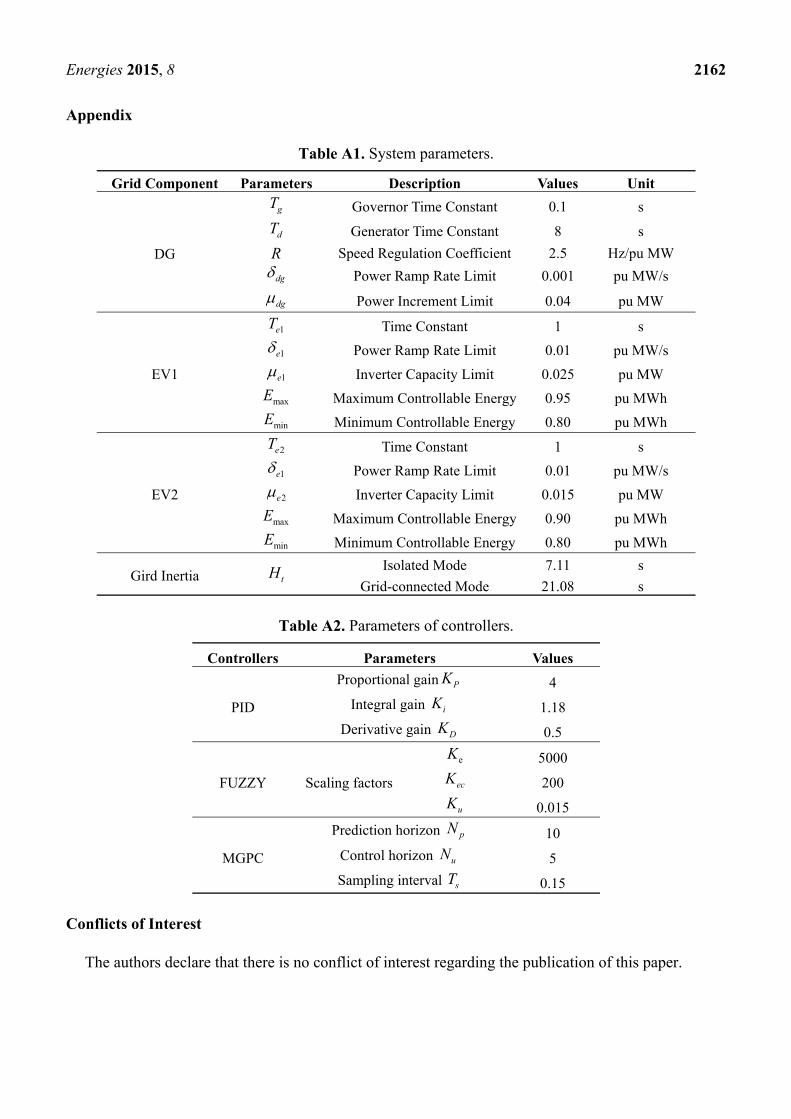
parameters are provided in Table A1 [18,19,24], and the parameters of controllers are presented in
Table A2 [25].
Energies 2015, 8 2155
In this paper, three cases have been analyzed to investigate the performance of the proposed
controller on different disturbances. In case A, we assume that the output power of wind generation is
a constant and only load disturbance is considered. In case B, the load demand is a constant with
varying wind power based on real wind power data. In case C, both load disturbance and wind power
fluctuation are considered in the simulation.
4.1. Case A: The Dynamic Response to Load Disturbance
In this case, the isolated grid is in steady state at the beginning of the simulation, and the
performance of the proposed controller on load disturbance is investigated. In this case, we assume that
the output power of wind generation is a constant with stable wind speed during a short period, which is denoted as 0wP .
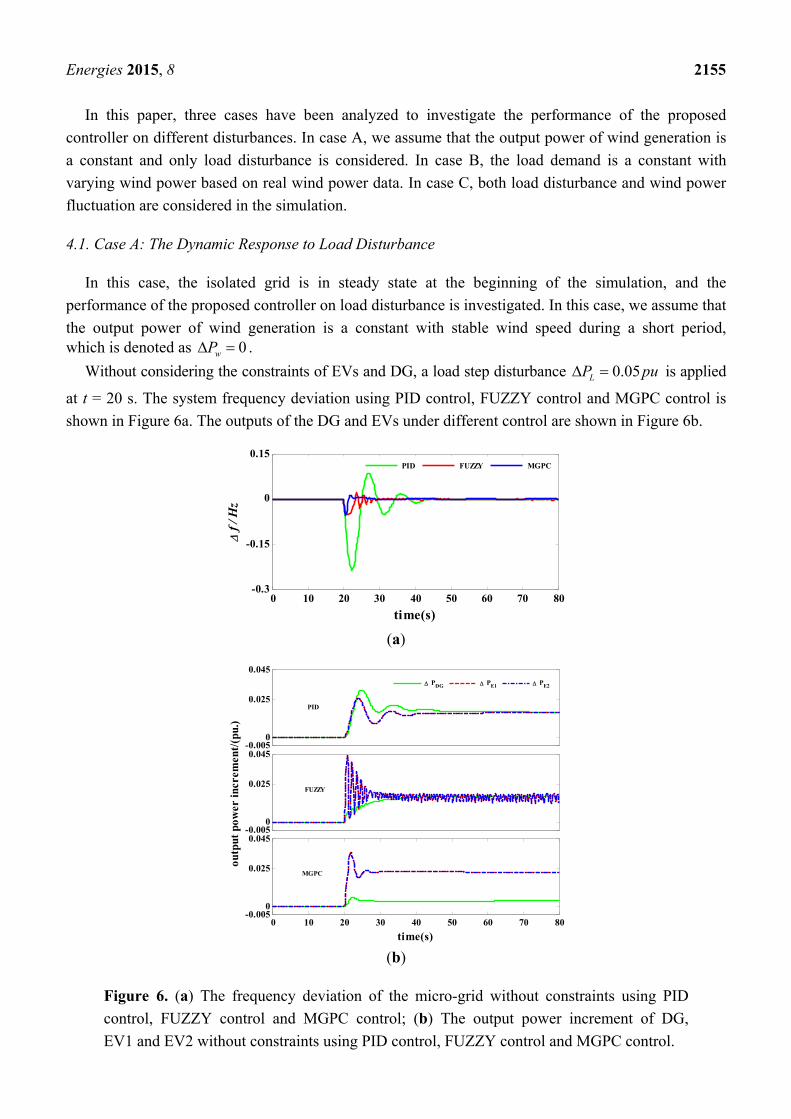
Without considering the constraints of EVs and DG, a load step disturbance 0.05LP pu is applied
at t = 20 s. The system frequency deviation using PID control, FUZZY control and MGPC control is
shown in Figure 6a. The outputs of the DG and EVs under different control are shown in Figure 6b.
0 10 20 30 40 50 60 70 80-0.3
-0.15
0
0.15
time(s)
f
/ H
z
PID FUZZY MGPC
(a)
-0.0050
0.025
0.045
PDG PE1 PE2
-0.0050
0.025
0.045
outp
ut p
ower
incr
emen
t/(p
u.)
0 10 20 30 40 50 60 70 80-0.005
0
0.025
0.045
time(s)
FUZZY
MGPC
PID
(b)
Figure 6. (a) The frequency deviation of the micro-grid without constraints using PID
control, FUZZY control and MGPC control; (b) The output power increment of DG,
EV1 and EV2 without constraints using PID control, FUZZY control and MGPC control.
Energies 2015, 8 2156
As shown in Figure 6a, compared with the PID controller and the FUZZY controller, the peak value
in the first swing has significantly decreased and the proposed MGPC controller has quickly damped
the system frequency oscillation. Figure 6b shows that MGPC obtains stable output power of EVs and
DG in shorter time and with less adjustment frequency, which is beneficial for a longer equipment life
of EV batteries and DG.
Because the EVs have been considered as an equivalent power source in this paper, different
structures of EVs have no impact on the controller. The impact of different EV capacity on the load
frequency control is determined by the constraints of inverter capacity limit of equivalent EVs.
Without considering the constraints of inverter capacity limit of EVs, EVs of different capacities
control the frequency with the same output power, which is shown in Figure 6b.
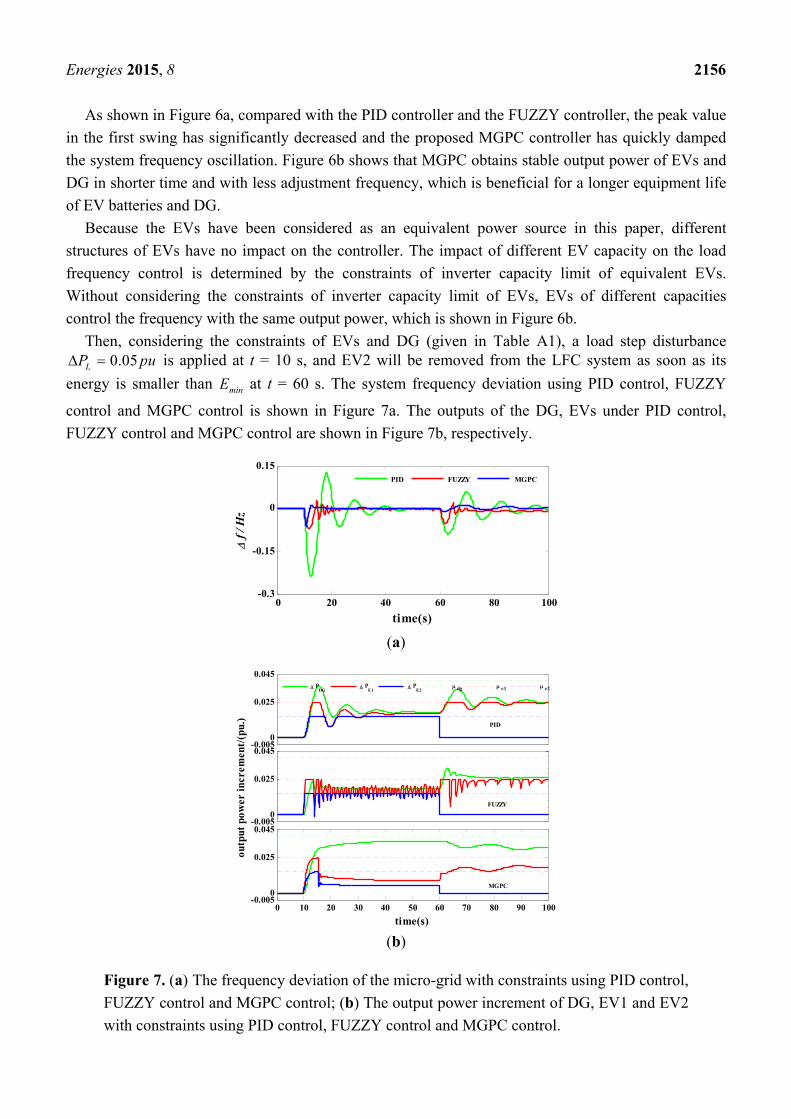
Then, considering the constraints of EVs and DG (given in Table A1), a load step disturbance 0.05LP pu is applied at t = 10 s, and EV2 will be removed from the LFC system as soon as its
energy is smaller than minE at t = 60 s. The system frequency deviation using PID control, FUZZY
control and MGPC control is shown in Figure 7a. The outputs of the DG, EVs under PID control,
FUZZY control and MGPC control are shown in Figure 7b, respectively.
0 20 40 60 80 100-0.3
-0.15
0
0.15
time(s)
f
/ H
z
PID FUZZY MGPC
(a)
-0.0050
0.025
0.045
PDG
PE1
PE2
-0.0050
0.025
0.045
outp
ut p
ower
incr
emen
t/(p
u.)
dg e1 e2
0 10 20 30 40 50 60 70 80 90 100-0.005
0
0.025
0.045
time(s)
PID
FUZZY
MGPC
(b)
Figure 7. (a) The frequency deviation of the micro-grid with constraints using PID control,
FUZZY control and MGPC control; (b) The output power increment of DG, EV1 and EV2
with constraints using PID control, FUZZY control and MGPC control.

Energies 2015, 8 2157
Due to the constraints, as shown in Figure 7a, the system can damp the frequency oscillation under
disturbance. Nevertheless, the MGPC controller still demonstrates superior damping performance over
the PID controller and the FUZZY controller. As shown in Figure 7b, the output power increments of
the two EVs are different by using different constraints. In the well-tuned PID controller and the
FUZZY controller, the output power increment of EV1 and EV2 hit their inverter capacity limits and
remains saturated for a relative long time. In addition, MGPC obtains more stable output power of EVs
than the PID controller and the FUZZY controller. It is observed that, all the EVs and DG participate
in damping frequency oscillation under different controls considering constraints. As shown in
Figure 7b, if constraints of inverter capacity limit of EVs are considered, the output power of EVs is
determined by constrains. EVs require longer time to damp the frequency oscillation under the same
disturbance because of constraints. When the total energy of EV2 hits minE at t = 60 s, the grid loses a controllable unit. As a result,
the response speed of the LFC system slows down, but the MGPC based controller still damps the
frequency oscillation well with remain controllable units (i.e., EV1 and DG).
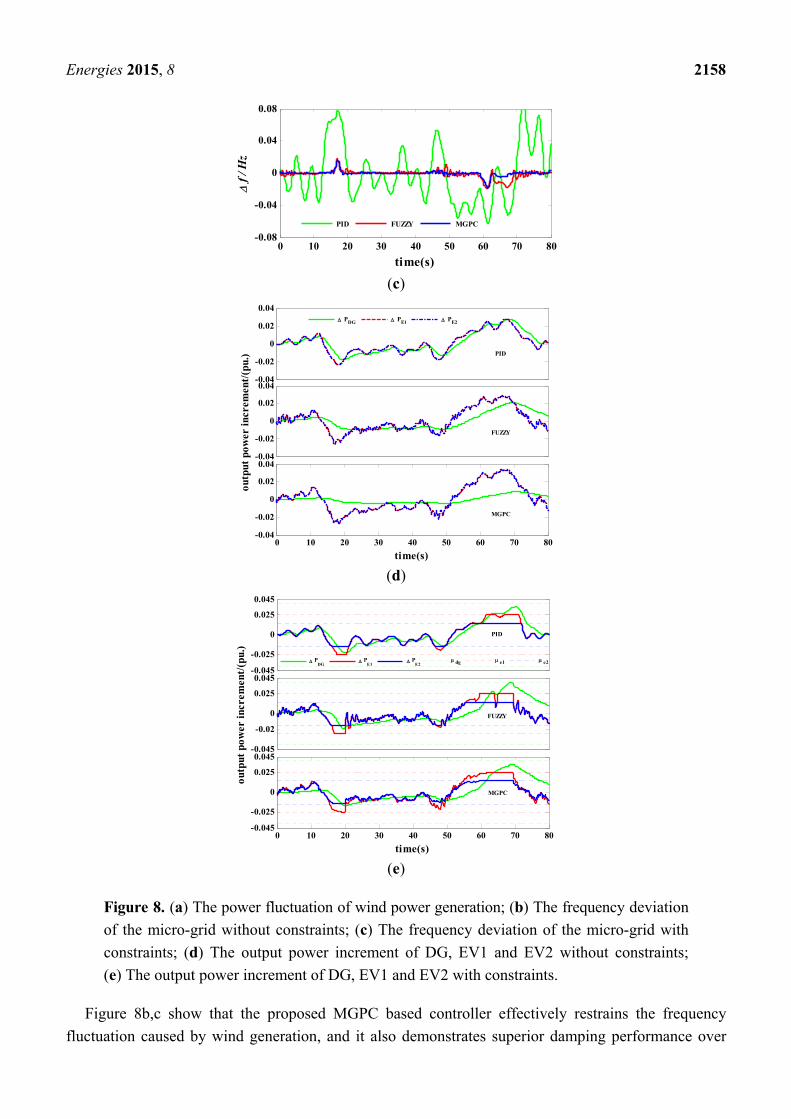
4.2. Case B: The Dynamic Response to Wind Power Fluctuation
In this case, the load demand in isolated mode is set as a constant, i.e., 0LP . Because the output
power of wind generation will fluctuate according to the change of weather condition, a power
fluctuation wP is applied to the system. As shown in Figure 8a, the data of wP is from an offshore
wind farm in Denmark [26], where 0wP means the wind power is equal to the average wind power
during the period. The simulation results are shown in Figure 8b–e, and the scenarios with and without
constraints are compared.
0 10 20 30 40 50 60 70 80-0.08
-0.04
0
0.04
0.08
time(s)
P
w (
pu.)
(a)
0 10 20 30 40 50 60 70 80-0.08
-0.04
0
0.04
0.08
time(s)
f
/ H
z
PID FUZZY MGPC
(b)
Figure 8. Cont.
Energies 2015, 8 2158
0 10 20 30 40 50 60 70 80-0.08
-0.04
0
0.04
0.08
time(s)
f
/ H
z
PID FUZZY MGPC
(c)
-0.04
-0.02
0
0.02
0.04
PDG PE1 PE2
-0.04
-0.02
0
0.02
0.04
outp
ut p
ower
incr
emen
t/(p
u.)
0 10 20 30 40 50 60 70 80-0.04
-0.02
0
0.02
0.04
time(s)
FUZZY
PID
MGPC
(d)
-0.045
-0.025
0
0.025
0.045
PDG
PE1
PE2
-0.045
-0.02
0
0.025
0.045
outp
ut p
ower
incr
emen
t/(p
u.)
dg e1 e2
0 10 20 30 40 50 60 70 80-0.045
-0.025
0
0.025
0.045
time(s)
PID
FUZZY
MGPC
(e)
Figure 8. (a) The power fluctuation of wind power generation; (b) The frequency deviation
of the micro-grid without constraints; (c) The frequency deviation of the micro-grid with
constraints; (d) The output power increment of DG, EV1 and EV2 without constraints;
(e) The output power increment of DG, EV1 and EV2 with constraints.
Figure 8b,c show that the proposed MGPC based controller effectively restrains the frequency
fluctuation caused by wind generation, and it also demonstrates superior damping performance over
Energies 2015, 8 2159
PID controller and FUZZY controller. From Figure 8d and Figure 8e, the output power curve of DG is
smoother than that of EVs, because the inertia constant of DG is much larger than that of EVs.
Also, when constraints are considered in the system, DG and EVs have less output power fluctuation
by using the MGPC control.
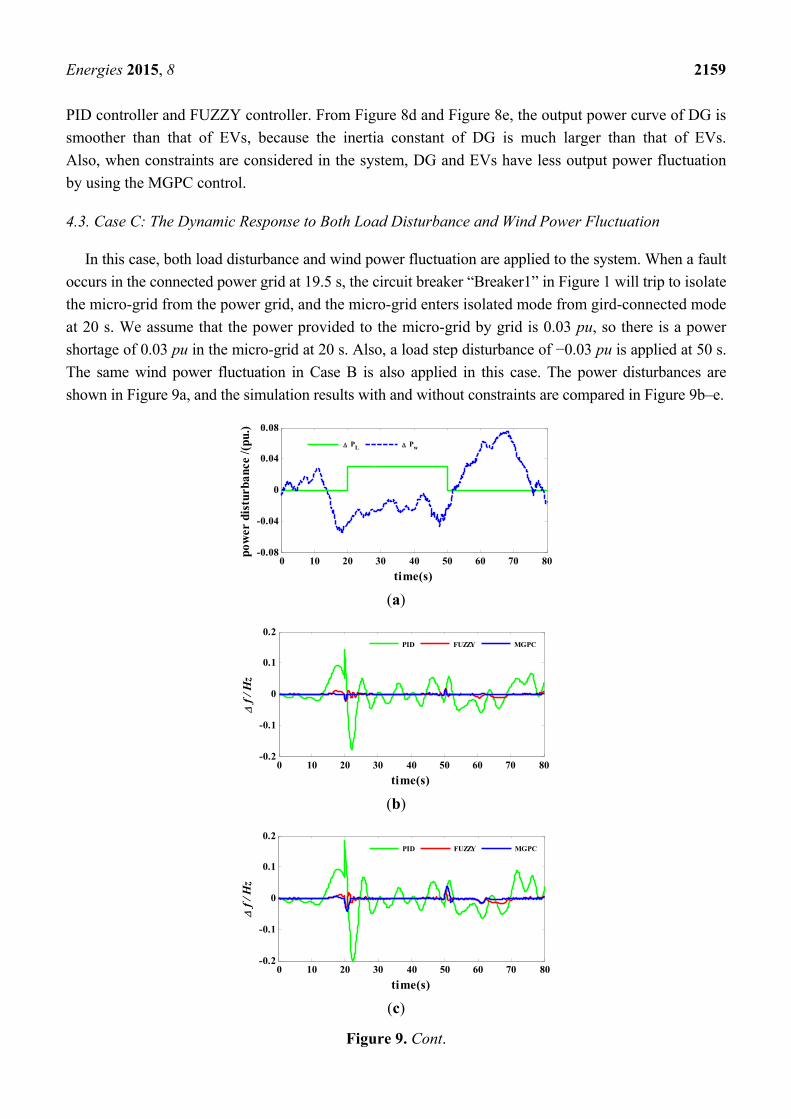
4.3. Case C: The Dynamic Response to Both Load Disturbance and Wind Power Fluctuation
In this case, both load disturbance and wind power fluctuation are applied to the system. When a fault
occurs in the connected power grid at 19.5 s, the circuit breaker “Breaker1” in Figure 1 will trip to isolate
the micro-grid from the power grid, and the micro-grid enters isolated mode from gird-connected mode
at 20 s. We assume that the power provided to the micro-grid by grid is 0.03 pu, so there is a power
shortage of 0.03 pu in the micro-grid at 20 s. Also, a load step disturbance of −0.03 pu is applied at 50 s.
The same wind power fluctuation in Case B is also applied in this case. The power disturbances are
shown in Figure 9a, and the simulation results with and without constraints are compared in Figure 9b–e.
0 10 20 30 40 50 60 70 80-0.08
-0.04
0
0.04
0.08
time(s)
pow
er d
istu
rban
ce /(
pu.)
PL Pw
(a)
0 10 20 30 40 50 60 70 80-0.2
-0.1
0
0.1
0.2
time(s)
f
/ H
z
PID FUZZY MGPC
(b)
0 10 20 30 40 50 60 70 80-0.2
-0.1
0
0.1
0.2
time(s)
f
/ H
z
PID FUZZY MGPC
(c)
Figure 9. Cont.
Energies 2015, 8 2160
-0.045
-0.025
0
0.025
0.045
PDG PE1 PE2
-0.045
-0.025
0
0.025
0.045
outp
ut p
ower
incr
emen
t/(p
u.)
0 10 20 30 40 50 60 70 80-0.045
-0.025
0
0.025
0.045
time(s)
PID
FUZZY
MGPC
(d)
-0.045
-0.025
0
0.025
0.045
PDG
PE1
PE2
-0.045
-0.025
0
0.025
0.045
outp
ut p
ower
incr
emen
t/(p
u.)
dg e1 e2
0 10 20 30 40 50 60 70 80-0.045
-0.025
0
0.025
0.045
time(s)
FUZZY
MGPC
PID
(e)
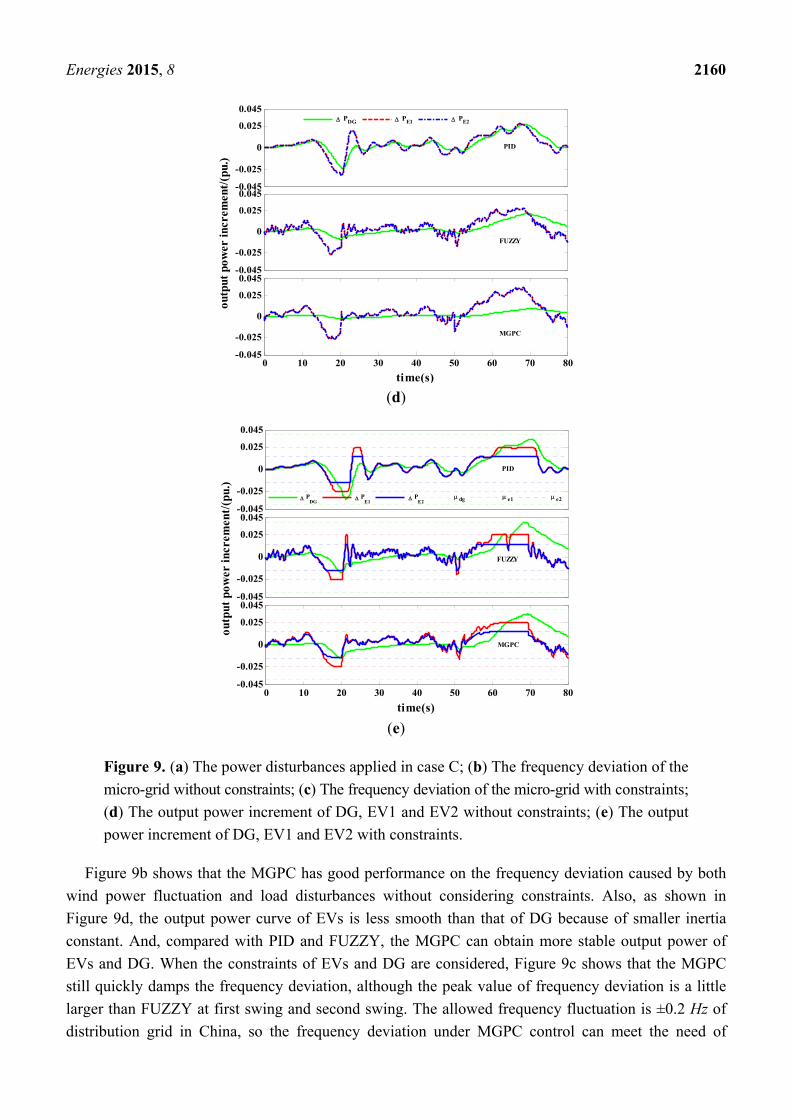
Figure 9. (a) The power disturbances applied in case C; (b) The frequency deviation of the
micro-grid without constraints; (c) The frequency deviation of the micro-grid with constraints;
(d) The output power increment of DG, EV1 and EV2 without constraints; (e) The output
power increment of DG, EV1 and EV2 with constraints.
Figure 9b shows that the MGPC has good performance on the frequency deviation caused by both
wind power fluctuation and load disturbances without considering constraints. Also, as shown in
Figure 9d, the output power curve of EVs is less smooth than that of DG because of smaller inertia
constant. And, compared with PID and FUZZY, the MGPC can obtain more stable output power of
EVs and DG. When the constraints of EVs and DG are considered, Figure 9c shows that the MGPC
still quickly damps the frequency deviation, although the peak value of frequency deviation is a little
larger than FUZZY at first swing and second swing. The allowed frequency fluctuation is ±0.2 Hz of
distribution grid in China, so the frequency deviation under MGPC control can meet the need of
Energies 2015, 8 2161
frequency limit. Figure 9e shows that when the output power of EVs and DG are constrained,
the MGPC can still obtain more stable output power of EVs and DG.
5. Conclusions
Load frequency stability is an important issue in micro-grid, especially for the power fluctuation
caused by renewable energy sources. In this paper, a coordinated controller based on MGPC theory for
LFC in an isolated micro-grid with V2G technique has been proposed under varying operation
conditions with fluctuating renewable energy generation and load disturbance. Using the online
monitoring data from PMUs, the MGPC based controller can coordinate the output of EVs and DG
through a process of multi-step prediction, rolling optimization and feedback compensation. Moreover,
the constraints of control variables can be easily implemented in the proposed controller design.
Time-domain simulations with different micro-grid operation conditions are employed to investigate
the effectiveness and robustness of the proposed controller. Comparing with PID controller and
FUZZY controller, simulation results demonstrate that the proposed controller can obtain better robust
performance on LFC with complex operation situations, namely, random renewable energy generation
and continuous load disturbances.
According to the control model of the micro-grid including LFC controller, both load disturbance
and the output power of renewable source are considered as ΔP. So the proposed controller can be
used in different configurations of micro-grid, including different loads, renewable sources and grid
topologies. With DMS, MGDS and PMUs, almost all the electrical information of the micro-grid can
be obtained online. The parameters of controllable generation sources and EVs can be determined
offline. This has shown the feasibility to implement the proposed method in real power system. On the
other hand, only active power controls of DG and EVs for the purpose of LFC are presented in the
proposed model. Bus voltage regulation by controlling the reactive power with intelligent solution will
be studied in the future work. Also, the optimal decisions of the proposed coordinated controller
depend on real-time information from MGDS. Therefore, the communication delay may have an
impact on the performance of the controller, which poses further challenges and research directions
along this topic.
Acknowledgments
The work is funded by the National Science Foundation of China (51277135, 50707021) and
Special Funds for Projects of Basic Research and Operational Costs of the Central Universities.
Author Contributions
In this paper, Jun Yang wrote abstract, section 1, section 2 and section 4. Zhili Zeng and
Yunliang Wu did simulation works and wrote section 3 and section 5. The manuscript was finalized by
Yufei Tang, Jun Yan and Haibo He.
Energies 2015, 8 2162
Appendix
Table A1. System parameters.
Grid Component Parameters Description Values Unit
DG
gT Governor Time Constant 0.1 s
dT Generator Time Constant 8 s
R Speed Regulation Coefficient 2.5 Hz/pu MW
dg Power Ramp Rate Limit 0.001 pu MW/s
dg Power Increment Limit 0.04 pu MW
EV1
1eT Time Constant 1 s
1e Power Ramp Rate Limit 0.01 pu MW/s
1e Inverter Capacity Limit 0.025 pu MW
maxE Maximum Controllable Energy 0.95 pu MWh
minE Minimum Controllable Energy 0.80 pu MWh
EV2
2eT Time Constant 1 s
1e Power Ramp Rate Limit 0.01 pu MW/s
2e Inverter Capacity Limit 0.015 pu MW
maxE Maximum Controllable Energy 0.90 pu MWh
minE Minimum Controllable Energy 0.80 pu MWh
Gird Inertia tH Isolated Mode 7.11 s
Grid-connected Mode 21.08 s
Table A2. Parameters of controllers.
Controllers Parameters Values
PID
Proportional gain PK 4
Integral gain iK 1.18
Derivative gain DK 0.5
FUZZY Scaling factors
eK 5000
ecK 200
uK 0.015
MGPC
Prediction horizon pN 10
Control horizon uN 5
Sampling interval sT 0.15
Conflicts of Interest
The authors declare that there is no conflict of interest regarding the publication of this paper.
Energies 2015, 8 2163
References
1. Tran, D.; Khambadkone, A.M. Energy management for lifetime extension of energy storage
system in micro-grid applications. IEEE Trans. Smart Grid 2013, 4, 1289–1296.
2. Kahrobaeian, A.; Mohamed, Y.-R. Interactive distributed generation interface for flexible micro-grid
operation in smart distribution systems. IEEE Trans. Sustain. Energy 2012, 3, 295–305.
3. De Souza Ribeiro, L.A.; Saavedra, O.R.; de Lima, S.L.; Gomes de Matos, J. Isolated micro-grids
with renewable hybrid generation: The case of Lençóis island. IEEE Trans. Sustain. Energy 2011,
2, 1–11.
4. Datta, M.; Senjyu, T. Fuzzy control of distributed PV inverters/energy storage systems/electric
vehicles for frequency regulation in a large power system. IEEE Trans. Smart Grid 2013, 4,
479–488.
5. Kempton, W.; Tomić, J. Vehicle-to-grid power implementation: From stabilizing the grid to
supporting large-scale renewable energy. J. Power Sources 2005, 144, 280–294.
6. ElNozahy, M.S.; Salama, M.M.A. Studying the feasibility of charging plug-in hybrid electric
vehicles using photovoltaic electricity in residential distribution systems. Electr. Power Syst. Res.
2014, 110, 133–143.
7. Bremermann, L.E.; Matos, M.; Lopes, J.A.P.; Rosa, M. Electric vehicle models for evaluating the
security of supply. Electr. Power Syst. Res. 2014, 111, 32–39.
8. Liu, H.; Hu, Z.; Song, Y.; Lin, J. Decentralized vehicle-to-grid control for primary frequency
regulation considering charging demands. IEEE Trans. Power Syst. 2013, 28, 3480–3489.
9. Mariano, S.J.P.S.; Pombo, J.A.N.; Calado, M.R.A.; Ferreira, L.A.F.M. Optimal output control:
Load frequency of a large power system. In Proceedings of the International Conference on Power
Engineering, Energy and Electrical Drives, Lisbon, Portugal, 18–20 March 2009; pp. 369–374.
10. Rashidi, M.; Rashidi, F.; Arjomand, A.S.; Sahragard, J. Design of a robust and adaptive load
frequency controller for multi-area power networks with system parametric uncertainties using
TDMLP neural network. In Proceedings of the IEEE International Conference on Systems,
Man and Cybernetics, The Hague, The Netherlands, 10–13 October 2004; pp. 3698–3703.
11. Sadeh, J.; Rakhshani, E. Multi-area load frequency control in a deregulated power system using
optimal output feedback method. In Proceedings of the 5th International Conference on Electricity
Market, Lisbon, Portugal, 28–30 May 2008; pp. 1–6.
12. Ahmed A.H.; Aldurze, F.A. Multi-area power systems H∞/μ robust load frequency control.
In Proceedings of the 6th IEEE International Conference on Intelligent Systems (IS), Sofia,
Bulgaria, 6–8 September 2012; pp. 380–387.
13. Pahasa, J.; Ngamroo, I. Coordinated control of wind turbine blade pitch angle and PHEVs using
MPCs for load frequency control of microgrid. IEEE Syst. J. 2014, 99, 1–9.
14. Bhatti, T.S.; Al-Ademi, A.A.F.; Bansal, N.K. Load frequency control of isolated wind diesel
hybrid power systems. Energy Convers. Manag. 1997, 38, 829–837.
15. Pillai, J.R.; Bak-Jensen, B. Integration of vehicle-to-grid in the western Danish power system.
IEEE Trans. Sustain. Energy 2011, 2, 12–19.
16. Singh, M.; Kumar, P.; Kar, I. Implementation of vehicle to grid infrastructure using fuzzy logic
controller. IEEE Trans. Smart Grid 2012, 3, 565–577.
Energies 2015, 8 2164
17. Camacho, E.F.; Bordons, C. Model Predictive Control; Springer: London, UK, 2004; Volume 2.
18. Bieshoy, A.; Ekanayake, J.; Jenkins, N. Intelligent load control for frequency regulation in
MicroGrids. Intell. Autom. Soft Comput. 2010, 16, 303–318.
19. Yang, J.; He, L.; Fu, S. An improved PSO-based charging strategy of electric vehicles in electrical
distribution grid. Appl. Energy 2014, 128, 82–92.
20. Lzumi, Y.; Senjyu, T.; Yona, A. Load frequency control by using demand response with H∞ in
isolated power systems. In Proceedings of the IEEE 15th International Conference on Harmonics
and Quality of Power (ICHQP), Hong Kong, China, 17–20 June 2012; pp. 656–661.
21. Global Wind Statistics 2011. Global Wind Energy Council (GWEC) Report. Available online:
http://www.gwec.net/publications/global-wind-report-2/global-wind-report-2010-2/ (accessed on
9 March 2015).
22. Masato, T.; Yu, K.; Shinichi, I. Supplementary load frequency control with storage battery
operation considering soc under large-scale wind power penetration. In Proceedings of the IEEE
Power and Energy Society General Meeting (PES), Vancouver, BC, Canada, 21–25 July 2013;
pp. 1–5.
23. Clarke, D.W.; Mohtadi, C.; Tuffs, P. Generalized predictive control part 1. The basic algorithm.
Automatica 1987, 23, 137–148.
24. Senjyu, T.; Tokudome, M.; Uehara, A.; Kaneko, T.; Yona, A.; Sekine, H.; Chul-Hwan, K. A new
control methodology of wind turbine generators for load frequency control of power system in
isolated island. In Proceedings of the IEEE International Conference on Electrical Machines and
Systems, Wuhan, China, 17–20 October 2008; pp. 2261–2266.
25. Golnaraghi, F.; Kuo, B.C. Automatic Control Systems; Wiley: Hoboken, NJ, USA, 2010.
26. Database of Wind Characteristics. Available online: http://www.winddata.com/ (accessed on
3 March 2014).
© 2015 by the authors; licensee MDPI, Basel, Switzerland. This article is an open access article
distributed under the terms and conditions of the Creative Commons Attribution license
(http://creativecommons.org/licenses/by/4.0/).