Embed Size (px)
Citation preview

What low oil prices mean for commercial real estate in
North America
EnErgy2015
CBRE REsEaRCh

2 © 2015 CBRE, Inc.

3EnErgy 2015 rEport | CBRE Research
ExEcutivE SummAryAfter a year of sliding and volatile oil prices, the commercial real estate fallout in energy markets is mixed.
Retail and hotel sectors have prospered, while office fundamentals have softened to varying degrees. An on-
slaught of sublease space has particularly weakened fundamental performance in Houston and Calgary while
Dallas/Ft. Worth, Denver and Pittsburgh rely on more diversified economic drivers to replace lost demand
from oil and gas tenants. Multifamily markets in U.S. energy economies are generally unaffected outside of
Houston and Pittsburgh to date. In some cases, the fallout has been less negative than was initially expected,
but continued price volatility and uncertainty will impede market performance.
In the five key energy markets, office space available for sublease has increased by more than 5.0 million sq.
ft. over the past year; most of the oil-related sublease space is contained to a handful of submarkets. Second
quarter occupancy was down by 100 to 380 basis points (bps) from a year earlier in Calgary, Houston and
Pittsburgh, while occupancy was up in Denver and Dallas/Ft. Worth. Calgary was the only energy headquar-
ters market with negative absorption in H1 2015, although all energy markets except Dallas/Ft. Worth record-
ed negative year-over-year absorption in Q2 2015. Weaker oil and gas tenant demand has yet to stymie rent
growth across energy markets—with the exception of Calgary’s downtown market, which in Q2 2015 reported
an 18.3% year-over-year decline in net asking rents.
Low oil prices have supported a tightening across U.S. retail markets, including most energy markets. The
availability rate for U.S. retail declined 30 bps from Q2 2014 to Q2 2015 and availability is forecast to decline
another 150 bps over the next four quarters to just below 10.0% for the first time since Q2 2008. All U.S. ener-
gy markets recorded lower retail availability rates from Q2 2014 to Q2 2015 with the exception of Pittsburgh.
Houston led U.S. energy markets and outperformed the national decline with a 100 bps year-over-year decline
in retail availability. Looking ahead four quarters, Houston is forecast to again outperform the U.S., and other
energy markets except Dallas, with a 190 bps decline in availability to 8.0%.
Dallas, Denver and Houston are three of the five most active U.S. markets for apartment completions in the
past 12 months—together accounting for 27,000 units. Apartment fundamentals in Houston have retreated
slightly, with a year-over-year vacancy increase of 10 bps and still-positive but below-average rent growth. Out-
side of Denver and Dallas/Ft. Worth, annual apartment rent growth in U.S. energy markets was below average
in Q2 2015.
Investors continue to exhibit interest in office in more diversified energy markets like Dallas and Denver but
risk concerns have slowed deal flow (12-month trailing) in Houston, Calgary and Pittsburgh. Class A stabi-
lized office cap rates are either higher or have remained flat over the past year in most energy markets, with
the exception of modest compression in the Dallas and Denver CBD markets.
Low pricing on crude oil and gasoline is largely positive for economic growth and for commercial real estate,
particularly in non-energy markets. Spending less on gasoline encourages consumers to spend more on other
items, which may solidify retail and hotel market fundamentals. Lower oil-related input costs will also reduce
certain construction, manufacturing and logistics costs in support of business investment and expansion—
thereby boosting demand for warehouse and manufacturing space.

4 © 2015 CBRE, Inc.

5EnErgy 2015 rEport | CBRE Research
For the property markets that have seen the oil and gas renaissance play a central role in
recent economic growth, the collapse in crude oil prices that began a little over a year ago
brought uncertainty, speculation and a negative outlook. With the West Texas Interme-
diate (WTI) spot price now below $50/bbl after a brief stabilization between $50-$60/bbl,
what is the pricing outlook and how might it affect commercial real estate performance
in key energy markets? To what extent—if any—have low oil prices already negatively
affected commercial real estate in energy markets? The latest market data reveal varying
levels of impact on real estate to date, but also give us some indication of how markets
will perform amid continued near-term price volatility.
iNtroductioN

6 © 2015 CBRE, Inc.
ShAlE oil Supply Shock: pricE volAtility iS hErE to StAy
The introduction of U.S. shale gas and light tight oil to
the market was a structural change for the oil and gas
industry and the recent supply shock’s ramifications will
be longstanding in the global marketplace.
U.S. crude production saw a record increase of 1.2
million b/d in 2014 for a 16.2% relative gain, the sharp-
est since 1940. According to the Energy Information
Administration’s (EIA) August projections, total U.S.
production is expected to increase by 8.0% in 2015 to 9.4
million b/d—up from 8.7 million b/d in 2014. In 2014,
the U.S. was the world’s largest petroleum producer for
the third consecutive year, followed by Saudi Arabia and
Russia.1 Canadian oil production has also been increas-
ing due to growth from unconventional resources —par-
ticularly the oil sands—albeit at a slower pace than the
U.S. With investments in oil sands production already
underway, Western Canadian crude oil production is
expected to increase by 4.5% in 2015 to 3.6 million b/d,
according to the Canadian Association of Petroleum
Producers (CAAP).
The shale oil and gas supply increase was met with
weaker-than-expected global demand and OPEC’s desire
to preserve market share by holding production volumes
steady. This resulted in an oversupply that pushed prices
down in a correction that was more dramatic than most
analysts predicted. Prices fell by more than 50%—from
FigurE 1:U.S. CrUde ProdUCtion BUilding, deSPite PriCe CollaPSe
U.s. Field Production of Crude Oil (L) Cushing, OK WTI spot Price FOB (R)
140
100
120
80
60
40
20
0
300
Million Barrels
Note: July production data and August price data are estimated based on available data. Source: Energy information Administration, September 2015.
$ Per Barrel
200
100
250
150
50
0Jan05
Jan06
Jan07
Jan08
Jan09
Jan10
Jan11
Jan12
Jan13
Jan14
Jan15
June05
June06
June07
June08
June09
June10
June11
June12
June13
June14

7EnErgy 2015 rEport | CBRE Research
the June 2014 WTI spot price peak of $107/bbl, to a
January 2015 low of $44/bbl. After finding a floor in Q1
2015, the WTI rebounded to $60/bbl in June 2015 but
has since slipped to $40/bbl and been volatile since.
As of August 2015, neither production nor inventories
have fallen far enough to encourage a substantial price
rebound, despite producers having generally re-focused
away from more marginal wells. According to Baker
Hughes, the U.S. rig count has fallen by more than half
from its year-prior level, after weeks of consecutive de-
clines in mostly land rigs. Texas leads in U.S. rig-count
declines, with Oklahoma, New Mexico, North Dakota,
Colorado, Wyoming and Ohio also seeing declines in
less significant numbers. In late June, the U.S. rig count
began to increase for the first time in 30 weeks, under-
scoring the industry’s resilience. In April, Canada’s rig
count fell below 100 for first time since May 2009, but
has since increased. Canada’s active rig count is also
down by more than 50% from mid-2014 levels.
Rig count provides an imperfect projection for supply
because production and inventories continue to grow,
despite lower rig counts. Operators are maximizing in-
place unconventional assets keeping production levels
elevated. They are also drilling, but not completing,
wells for strategic readiness, asset preservation, and to
avoid tax rate hikes in the future. U.S. production growth
will slow from the current pace in 2015 and 2016, but
not by enough to support price increases in the global
marketplace. Data from the EIA suggest that on-shore
production began to decline in May 2015; the decline is
expected to continue until Q3 2016, when production
increases will resume.2
According to the latest BP Outlook, global oil demand
will increase by 37.0% through 2035—an average annual
rate of 1.4%.3 Thus, the combination of high levels of
supply and moderate demand growth does not support
a notable price rebound for oil. The forecast consensus
expects the WTI spot price to be $50-$70/bbl over the
next 12 months. Exogenous factors, including geopo-
litical factors, make longer-term trends in oil prices
difficult to forecast.
Don’t be fooled by what seems like a forecast for gradual
increases in the price of oil. Price volatility is high and
should be factored into real estate decisions in energy
markets.
1. Petroleum production includes crude oil, natural gas liquids, condensates, refinery processing gain, and other liquids such as biofuels.2. Energy information Administration, Short term Energy outlook, August 2015. 3. Bp Energy outlook 2035, February 2015.

8 © 2015 CBRE, Inc.
iNduStry ExpEctAtioNS Amid loW pricE ENviroNmENt
Crude production and inventories have been building
over the past year in spite of the price collapse because
at moderate pricing, production remains economical
for many companies. The triple-digit prices of a year
ago enticed new firms to form and to enter the market,
enabling rapid industry growth within the energy sector.
However, most operators do not require oil to be at
$100/bbl to be profitable—particularly established firms
that purchased assets at favorable prices and are appro-
priately leveraged.
CBRE Research estimates that breakeven prices for U.S.
shale plays range widely from $30-$85/bbl, which helps
explain why exploration and production (E&P) compa-
nies have shut down only marginal rigs, continuing to
exploit rigs that are more efficient and productive. The
August EIA forecast pegs average oil prices (WTI) at $50/
bbl in 2015 and $54/bbl in 2016—figures that can be
economical for tight oil producers. In fact, with compa-
nies able to quickly adjust production levels based on
market pricing, tight oil is the new swing fuel in the U.S.
This low price environment has E&P companies focused
on optimizing the value of their assets while minimiz-
ing costs. Companies are monetizing assets, including
real estate, and shifting capital to lower-cost, more
productive shale plays or to other business lines such as
midstream and downstream segments.
The oil price slide most negatively affects the upstream
segment, which involves the exploration and production
of resources. In fact, a small slowdown in upstream pro-
duction will ease the skyrocketing cost of field services.
This is one benefit of the slowing pace of production; as
it will adjust break-even costs downward in some cases.
E&P companies have revised their 2015 capital expen-
diture budgets down to 2012 or 2013 levels; this rep-
resents a 25-30% reduction from 2014, according to
CBRE Research’s analysis of 25 major E&P companies.
The CAAP reported a 25% decline in capital investment
in Canada’s oil sands in 2015. Despite budget cuts,
well-positioned and opportunistic companies are ac-
quiring assets during this low price period—expanding
their resource holdings. Some companies are resolutely
allocating funds to research and development efforts
and to innovative strategies for staying ahead of the
competition. Highly debt-financed companies, on the
other hand, will struggle if pricing stays low and they are
unable to re-capitalize as some companies have; firm
failures could hurt lenders that are heavy in oil and gas.
Diversified oil and gas companies may reduce capital
investment and costs in their upstream activities while
ramping up allocations and investment in their mid-
stream or downstream business segments, which will
fare better in the low price environment.
The midstream or transportation-related segment
reacts to the infrastructure needs of the industry, which
remain high due to the past few years’ brisk ramp-up
in production. Investment and expansion here has
lagged the upstream segment, and there continue to be
infrastructure gaps that need addressing. The down-
stream segment, which involves refining and chemical
manufacturing, is expected to expand over the next few
years with cheaper oil that serves as feedstock for final
products. U.S. refining capacity reached a record 18.0
million b/d in January 2015 for a 2.2% increase over
2010, according to the EIA.

9EnErgy 2015 rEport | CBRE Research
Layoffs will continue to be concentrated among E&P
field workers, but further merger and acquisition (M&A)
activity that affects all types of oil and gas workers is ex-
pected. About 223,000 jobs have been added in the U.S.
oil and gas sector since 2010, when the unconventional
energy revolution was largely underway. Eighty percent
of those jobs were added in the upstream segment,
exploring and extracting underground resources. These
jobs are at greatest risk. According to the latest employ-
ment data (Q4 2014), jobs were still being added in the
upstream and midstream segments of the industry. We
expect to see upstream job growth stall and midstream
employment to increase by the end of 2015.
The oil and gas industry will record flat or slightly neg-
ative employment growth through 2016 as companies
strive to maintain profits, engage in M&A activity and
retain key employees. Moderate employment growth ex-
pected in the midstream and downstream segments will
be negated by losses in the largest segment—upstream.
Well-positioned companies will acquire struggling or
highly-leveraged firms and will continue to invest in E&P
activities to solidify future growth plans. Overall, the oil
price correction and likely price volatility will restrict
further industry expansion over the next 12-18 months;
medium- and long-term industry growth expectations
are positive, however.
FigurE 2:U.S. oil and gaS emPloyment growth By Segment
Annual Employment Change (%) Upstream Midstream Downstream Total Employment – All Industries
Source: cBrE research, u.S. Bureau of labor Statistics, QcEW, Q4 2014.
20
10
0
15
5
-5
2010 20122011 2013 2014

10 © 2015 CBRE, Inc.
FigurE 3:U.S. oil and gaS emPloyment By Segment, 2014
Source: cBrE research, u.S. Bureau of labor Statistics, QcEW, Q4 2014.
70%upstream635,99920%
midstream182,877
10%downstream
93,620

11EnErgy 2015 rEport | CBRE Research

12 © 2015 CBRE, Inc.
thE comiNg BooSt From loW FuEl pricES
The shale renaissance has been an economic driver in
the U.S. for the past five years; in 2014, the five fastest-ex-
panding economies were energy-producing states. Their
cooling contribution to future GDP growth may be offset
by a consumer spending boost as lower fuel prices are
thought to be positive for consumers and businesses.
Increases in disposable income resulting from lower
gasoline prices encourage retail spending on non-gaso-
line items and help boost tourism. Lower oil-related in-
put costs for manufacturing, construction and logistics
companies encourage re-investment or expansion. Still,
businesses and consumers need to have the confidence
to spend; otherwise, the gains from falling oil prices end
up as savings.
As the U.S. enters the second half of the current eco-
nomic cycle with interest rates anticipated to rise,
low-cost oil’s boost to consumer spending and business
activity would be welcome. The 3.7% GDP expansion in
Q2 2015 (second estimate) implies continued econom-
ic momentum on the back of solid growth during the
second half of 2014. The modest Q1 2015 increase was
widely regarded as seasonal. So far in this cycle, GDP
growth has already been supported by an improving
crude oil trade balance, as crude imports have declined
in recent years. Possible future legislation could allow
U.S. crude exports with increased parity between the
WTI and Brent indices.
The anticipated boost in consumer spending is begin-
ning to materialize. Personal consumption expendi-
tures accelerated from Q1 2015 to Q2 2015 while total
personal savings declined from over the same period.
After increasing sharply in Q1 2015, the personal sav-
ings rate, defined as personal savings as a percentage
of disposable personal income, declined from 5.2% to
4.8% over the same period. Retail sales data are hinting
at a firming consumer boost. Retail sales (advance) data
excluding gasoline stations were healthy in July with a
4.5% year-over-year increase and a 0.6% month-over-
month increase, according to the U.S. Census Bureau.
Motor vehicle and food service/drinking places sales
were up 7.1% and 9.0% year-over-year in July, respective-
ly. Still, the consumer boost may be limited thus far with
memories of the Great Recession causing consumers to
save instead of spend.
U.S. businesses generally appear to be on a solid footing
and, based on strong corporate profits and key business
investment and activity measures, they are primed for
expansion. Lower fuel prices support business expan-
sion and investment among petroleum-using manu-
facturers, builders and transportation/logistics firms
in particular, via increased profits due to reduced input
costs. As measured by the ISM® Index, activity in the
manufacturing sector expanded for the 32nd consecu-
tive month in August.

13EnErgy 2015 rEport | CBRE Research

14 © 2015 CBRE, Inc.
BiFurcAtEd rEAl EStAtE impActS
Overall, discounted oil will benefit the majority of com-
mercial real estate markets in the near term. While sev-
eral additional factors are in play, markets unconnected
to the oil and gas sector will gain the most.
• Retail and hotel property markets benefit when con-
sumer and tourism spending increase. U.S. hotels are
forecast to achieve occupancy of 71.6% in 2015, up
from 70.5% in 2014, and revenue per available room
(RevPar) is expected to increase by 7.1% in 2015. Occu-
pancy is projected to remain elevated at 71.3% in 2016,
while RevPar increases 4.9%. Retail net absorption is
forecast to surge in 2015, peaking at 58.1 million sq. ft.
in 2016; rent growth accelerates meanwhile, aided by
modest new supply. The availability rate for U.S. retail
declined 30 bps from Q2 2014 to Q2 2015 and avail-
ability is forecast to decline another 150 bps over the
next four quarters to just below 10.0% for the first time
since Q2 2008.
• The industrial sector will see elevated levels of retail/
wholesale inventory at warehouses and an uptick in
manufacturing and logistics activity. U.S. rent growth
is forecast to register 6.0% or higher in 2015 and 2016,
amid declining availability rates nationwide.
• U.S. office market fundamentals are expected to im-
prove this year. Vacancy is forecast to decline through
2018 and rent growth of 4%-5% will persist for the next
few years. Some drag on fundamentals are factored
into the forecast, largely related to Houston—the na-
tion’s fifth largest office market, with 206.6 million sq.
ft. of existing inventory and 11.8 million sq. ft. of new
supply underway.
4. pkF hospitality research (a cBrE company), Q2 2015.

15EnErgy 2015 rEport | CBRE Research
#1 Houston
31%
#1 Texas
47%
FigurE 4:toP 10 areaS for mining/oil and gaS ContriBUtionS to U.S. gdP
Source: u.S. Bureau of Economic Analysis, 2015. Note: 2014 state estimates are advance estimate.
Share of U.S. mining gdP 2014 (State)
Share of U.S. mining gdP 2013 (metro)
#4 Pittsburgh
2% #5 Lafayette
2%
#7 New Orleans
2%
#8 Bakersfield
2%
#10 North Dakota
2%
#6 Anchorage
2%#2
Denver
4% #3 Los Angeles
3%
#7 Wyoming
3%
#8 Alaska
3%#9
West Virginia
3%
#5 Colorado
4%#6
Pennslyvania
4%
#3 Louisiana
5% #4 California
5%
#2 Oklahoma
6%
#9 Shreveport
1%
#10 Longview
1%
16 © 2015 CBRE, Inc.
EnERgy MaRKET PROPERTy sECTOR ExPECTaTIOns
Over the past seven years, the tight oil renaissance has
been central to each energy market’s recovery; however,
the low-oil-price environment, subsequent production
declines and continued oil price volatility will impact
property markets to varying degrees. Real estate mar-
kets where exploration activities occur, such as in North
Dakota, are holding steady with limited availability.
This is primarily due to the predominance of build-to-
suit versus speculative construction that met oil and
gas companies’ hasty demand for office and industrial
space early in the decade. In fact, the steep supply-de-
mand imbalance that applied to all property sectors in
exploration markets is relaxing after five years of rapid
strengthening and tight or non-existent availability. The
slowdown in activity is also allowing some communities
to catch up with needed infrastructure.
Adverse impacts, particularly to the office sector, will
be restricted to just a handful of key submarkets; they
are not expected to manifest market-wide. The factors
mitigating or accentuating the impacts of low crude oil
prices and increased volatility on property markets are:
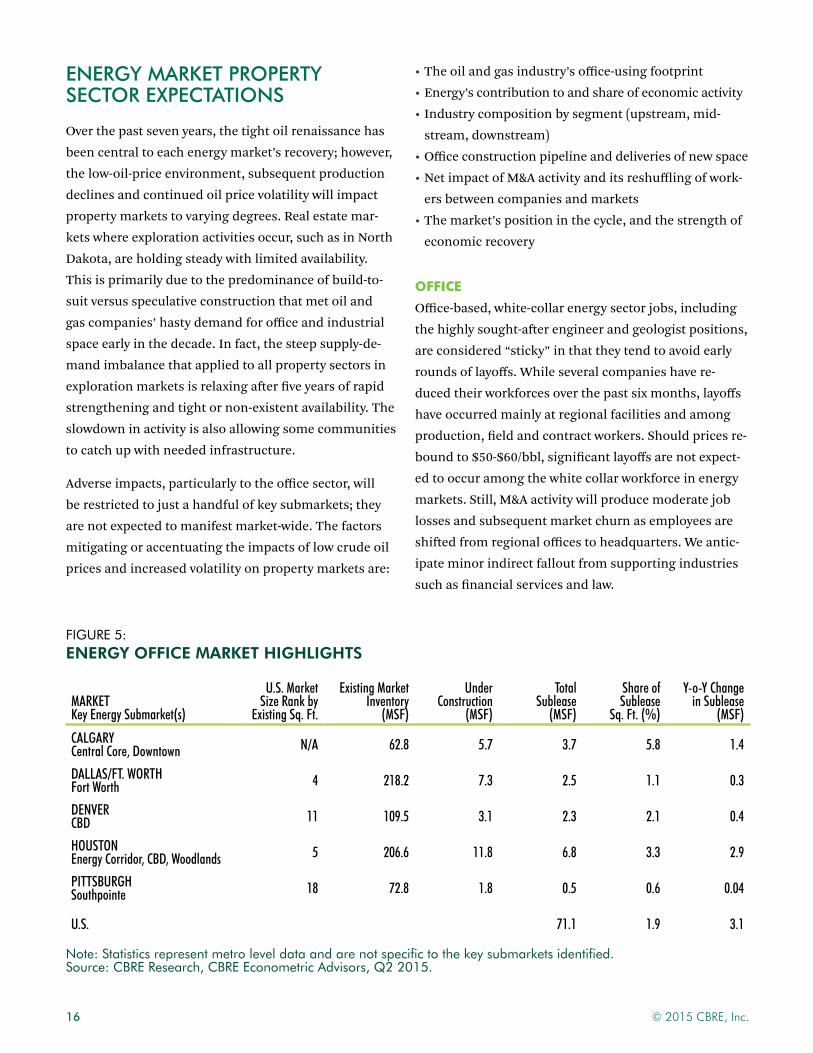
FigurE 5:energy offiCe market highlightS
Marketkey energy Submarket(s)
U.S. Market Size rank by
existing Sq. Ft.
existing Market Inventory
(MSF)
Under Construction
(MSF)
total Sublease
(MSF)
Share of Sublease
Sq. Ft. (%)
Y-o-Y Change in Sublease
(MSF)
CalgarY Central Core, Downtown N/a 62.8 5.7 3.7 5.8 1.4
DallaS/Ft. Worth Fort Worth 4 218.2 7.3 2.5 1.1 0.3
DeNver CBD 11 109.5 3.1 2.3 2.1 0.4
hoUStoN energy Corridor, CBD, Woodlands 5 206.6 11.8 6.8 3.3 2.9
PIttSBUrgh Southpointe 18 72.8 1.8 0.5 0.6 0.04
U.S. 71.1 1.9 3.1
Note: Statistics represent metro level data and are not specific to the key submarkets identified. Source: cBrE research, cBrE Econometric Advisors, Q2 2015.
• The oil and gas industry’s office-using footprint
• Energy’s contribution to and share of economic activity
• Industry composition by segment (upstream, mid-
stream, downstream)
• Office construction pipeline and deliveries of new space
• Net impact of M&A activity and its reshuffling of work-
ers between companies and markets
• The market’s position in the cycle, and the strength of
economic recovery
Office
Office-based, white-collar energy sector jobs, including
the highly sought-after engineer and geologist positions,
are considered “sticky” in that they tend to avoid early
rounds of layoffs. While several companies have re-
duced their workforces over the past six months, layoffs
have occurred mainly at regional facilities and among
production, field and contract workers. Should prices re-
bound to $50-$60/bbl, significant layoffs are not expect-
ed to occur among the white collar workforce in energy
markets. Still, M&A activity will produce moderate job
losses and subsequent market churn as employees are
shifted from regional offices to headquarters. We antic-
ipate minor indirect fallout from supporting industries
such as financial services and law.

17EnErgy 2015 rEport | CBRE Research
Office space available for sublease has increased more
than 5.0 million sq. ft. in the five key oil and gas markets
over the past year, however, oil-related sublease space is
contained to only a handful of submarkets. For exam-
ple, Houston CBD and Energy Corridor sublease space
represents nearly 46% of total Houston sublease space.
Total space available for sublease will continue to build
throughout 2015 and proposed development projects
will be put on hold, mainly in Houston. In key energy
submarkets, such as Houston’s Energy Corridor, overall
vacancy is expected to increase as positive absorption
from energy tenants stalls and supply pipelines of
varying magnitudes deliver new space. The most robust
construction pipelines as a share of existing invento-
ry by sq. ft. are in found Calgary (9.1%) and Houston
(5.7%), while more modest deliveries are set for Dallas/
Ft. Worth, Denver and Pittsburgh.
The U.S. vacancy rate declined 100 bps in the past four
quarters to 13.5%, according to CBRE Econometric Advi-
sors (CBRE EA); most U.S. energy markets also tightened
with the exception of Houston. Looking ahead to Q2
2016, CBRE EA forecasts all U.S. energy markets except
Dallas will see either flat, increased or weaker-than-aver-
age tightening in office vacancy.
Through the first half of 2015, Calgary is the only energy
headquarters market with negative absorption, although
all five energy markets with the exception of Dallas re-
corded negative year-over-year absorption in Q2 2015.
Weaker oil and gas tenant demand has yet to stymie rent
growth across most energy markets, but the strong con-
nection to the energy industry in Calgary has softened
asking rents compared to a year ago. Net asking rents
in downtown Calgary are off 18.3% year-over-year in Q2
2015.
FigurE 6:Change ahead for hoUSton offiCe market
Vacancy Rate (%)
Source: cBrE Econometric Advisors, Q2 2015.
25
21
13
9
17
5
H1 2010 H1 2011 H1 2012 H1 2013 H1 2014 H1 2015 H1 2016H2 2010 H2 2011 H2 2012 H2 2013 H2 2014 H2 2015
U.S. Sum of Markets Dallas Ft. Worth Denver Houston Pittsburgh

18 © 2015 CBRE, Inc.
MultifaMily
Due to modest office-using job losses, multifamily sector
impacts are expected to be minor in key energy markets,
although markets with large pipelines of new supply will
see a more marked influence, such as lower occupancy
and mild rent growth. Several energy markets have seen
robust new supply in recent years. Dallas, Houston and
Denver account for three of the top five U.S. markets for
rentable completions in the past year with nearly 27,000
new units added among the three energy markets.5
The Class A segment will see more pronounced mod-
eration in fundamentals as the rate of new high-paying
white-collar jobs diminishes. The Class B and C seg-
ments will remain healthy, especially as construction
and petrochemical refining see blue-collar employment
growth. Institutional capital may shy away from multi-
family investment in energy markets, but private capital
remains interested in the near- and long-term growth
potential of energy markets.
Retail
The retail sector is the most insulated and will see in-
creased consumer spending as a result of the gas pump
dividend. Underscoring the retail sector’s insulation,
Houston recorded the second highest level of retail
absorption in Q2 2015 and was the top market for retail
absorption in the U.S. over the past year. So far in this
cycle, the retail sector has remained disciplined in terms
of new supply starts in energy markets; this will uphold
current fundamentals and apply upward pressure to
both lease rates and occupancy. As lower fuel costs re-
duce delivery costs, omni-channel retailers in particular
with benefit.
All U.S. energy markets recorded lower retail availabili-
ty rates from Q2 2014 to Q2 2015 with the exception of
Pittsburgh. Houston led U.S. energy markets and outper-
formed the 30-bps national decline with a 100-bps drop
in retail availability. Looking ahead four quarters, Hous-
ton is forecast to again outperform the U.S. and other
energy markets except Dallas, with a 190-bps decline in
availability to 8.0%.
FigurE 8:low oil PriCeS SUPPort tighter retail availaBility
17
19
13
Availability Rate (%)
9
7
15
11
5
H1 20
10
H1 20
11
H1 20
12
H1 20
13
H1 20
14
H1 20
15
H1 20
16
H2 20
10
H2 20
11
H2 20
12
H2 20
13
H2 20
14
H2 20
15
U.S. Sum of Markets Dallas Ft. Worth Denver Houston Pittsburgh
Source: cBrE Econometric Advisors, Q2 2015.
FigurE 7:aPartment rent growth Below average BUt PoSitive in hoUSton
14
10
12
8
6
2
4
0
-2
-4
60
20
Year-over-Year (bps)
Source: cBrE Econometric Advisors, Q2 2015.
Year-over-Year (%)
-20
-40
-80
40
0
-60
-100
-120
Tulsa
Dallas
Denver
Fort W
orth
U.S. Sum
of Mark
etsHous
ton
Pittsbu
rgh
Vacancy (L) Same Store Rent Growth (R)
5. cBrE Econometric Advisors, Q2 2015 Apartment outlook.

19EnErgy 2015 rEport | CBRE Research
250
200
50
0
FigurE 9:hotel oCCUPanCy oUtlook mixed BUt U.S. Steady
Change in Occupancy (bps)
Note: includes upper and lower tier hotel product. Source: pkF hospitality research, a cBrE company, Q2 2015.
-150
-200
150
100
-50
-100
-250
-300
-400
-350
U.S. Sum of Markets Fort Worth DenverDallas Houston Pittsburgh
2014-2015 2015-2016
industRial
Industrial properties will see weaker demand from
upstream E&P and field services tenants but increased
demand from downstream tenants that benefit from
cheaper input costs. Heightened demand from manu-
facturing, construction and logistics tenants will result
in a net gain in (or at least sustained) occupancy levels
for the industrial sector overall. Increased consumer
activity and retail sales related to lower fuel costs will
boost demand for warehouse and logistics space as well.
HOtel
In energy markets, impacts to the hotel sector will be
mixed. As business travel slows, so will occupancy and
room rate appreciation in the luxury, full-service seg-
ment. Meanwhile, increased leisure travel and tourism
will strengthen occupancy and room rates in the limit-
ed-service segment. Hotel fundamentals in U.S. ener-
gy markets are generally healthy outside of Houston
and Pittsburgh, which will record notable declines in
occupancy levels. Dallas, Denver and Ft. Worth will see
occupancy either slip slightly or increase over the next
year while Houston and Pittsburgh will record occupan-
cy declines of 380 bps and 130 bps from 2015 to 2016,
respectively. The supply of hotel rooms in U.S. energy
markets will increase by 2.2% in 2015 compared to a
1.4% increase across the sum of markets, according to
the Q2 2015 PKF Hospitality Research forecast.

20 © 2015 CBRE, Inc.
caPital MaRKets
Opportunistic private capital will continue to seek assets
in energy markets in spite of their softer fundamentals,
given the perception of favorable pricing and long-term
opportunity that tight oil represents—although institu-
tional capital may evaluate its exposure.
Office investors have reacted to the oil price crash with
reduced sales volumes (on a 12-month trailing basis) in
Houston and Pittsburgh as of Q2 2015, according to Real
Capital Analytics. The less-energy-reliant markets of
Dallas and Denver reported modest gains over the same
period. CBRE Research recorded a sharp year-over-year
decline in Calgary’s office sales volume for Q1 2015 (the
most recent data available for the market).
According to CBRE’s North America Cap Rate Survey: H1
2015, stabilized capitalization rates for the office sec-
tor are mixed among energy markets. As of H1 2015,
suburban energy markets and CBDs in Calgary, Hous-
ton and Pittsburgh reported either stable or increased
rates compared to a year earlier. Average cap rates in the
Dallas and Denver CBDs are down slightly. The sharpest
increases were reported in Calgary’s CBD (50 bps) and
suburban markets (25 bps). Houston’s CBD and subur-
ban cap rates are among the lowest for energy markets,
despite the market’s strong connection to the oil and
gas industry.
Meanwhile, the pace of multifamily transactions (on a
12-month trailing basis) was largely elevated in energy
markets through Q2 2015, with the exception of Pitts-
burgh.
As shifting trends related to the oil and gas industry
have been most apparent in the office sector to date, the
following comments highlight office sector investment
trends in North American energy markets.
Calgary
In Calgary’s office market, investors sat on the sidelines
during Q1 2015, setting the stage for a quiet year. In fact,
office sales volume has been light for three consecu-
tive quarters. Compared to Q1 2014, office sector sales
volume was down 89.8% in Q1 2015. The measure is
volatile, however—Q1 2015 activity surpassed the levels
of Q3 2014, though oil prices were still elevated at that
time. The slowdown in Calgary office assets does paral-
lel an overall slowdown across sectors and most markets
in Canada—outside of Vancouver, Edmonton and the
Waterloo Region. Year-over-year total investment volume
was off by 18.3% as of Q1 2015. Private Canadian inves-
tors drove investment activity throughout Canada in the
first quarter of the year.
dallaS/ft. worth
So far in 2015, the Dallas and Ft. Worth CBDs have seen
sales volume decline from 2014, which was notably high-
er than previous years. In December 2014, the rolling
12-month sales volume surpassed $800 million—a level
not reached since Q2 2008. Since Q2 2014, the cores of
both North Texas cities have seen a shift from institu-
tional to private buyers.
Cap rates in the suburban areas of Dallas/Ft. Worth re-
main low, with per sq. ft. prices on the rise. The average
price per sq. ft. reached $161 in Q2 2015, the second
highest since Q4 2010. Buyer composition has been sim-
ilar to last year, with a combination of institutional and
private buyers collectively accounting for nearly 75% of
this year’s investment activity through Q2 2015.
denver
Over the past year, quarterly sales volumes have been
somewhat mixed for the Denver CBD. After dropping off
in Q3 2014, sales volume increased for two quarters and

21EnErgy 2015 rEport | CBRE Research
then receded again in Q2 2015. In the CBD, where oil
and gas companies are concentrated, Q2 2015 stabilized
cap rates were down slightly from a year earlier, but in
suburban markets they rose slightly. Denver suburbs
have seen their trailing 12-month sales volume consis-
tently gain momentum since Q1 2014; hitting an eight-
year high in mid-2015. Through the first half of this year,
Denver’s average sales price per sq. ft. across all asset
classes has generally climbed; it closed Q2 2015 at $184
per sq. ft., which is subdued for the current expansion
cycle.
hoUSton
Sales volume in Houston slowed considerably in Q3
2014 at the onset of the crude oil price decline—most
notably, downtown. However, investment activity in
the CBD has gradually trended upward over the last
two quarters; the rolling 12-month volume for Q2 2015
was 36% higher than the $540 million in trailing sales
recorded for Q4 2014. This is similar to the investment
pace of late-2010 through mid-2011, when Houston
began to emerge from the recession.
Outside of downtown Houston, investment activity has
continued to witness stable or falling cap rates and a
rising price per sq. ft. In 2015, private buyers have so far
been the predominant source of capital flow in subur-
ban Houston, but versus 2014, there has been a con-
siderable uptick in acquisitions from REITs and other
publicly listed buyers.
PittSBUrgh
Most notably among all the U.S. energy markets, sales
transaction activity in the Pittsburgh CBD has stalled
since Q3 2014; as such, urban and suburban cap rates
have trended up during the first half of 2015. For the
suburbs, the trailing 12-month sales volume hit a high
for the current cycle in Q2 2015—$235 million, a figure
not seen since Q3 2006. Reported yields for 2015 have
been lower than 2014 rates, with price per sq. ft. having
stabilized over the past few quarters.
Note: Sales volume and sales price per sq. ft. data sourced from real capital Analytics trends & trades. cap rate data sourced from cBrE North America cap rate Survey: h1 2015.
FigurE 10:offiCe CaP rateS in energy marketS
10 10
8 8
CBD, Stabilized Class A Cap Rate (%) Suburban, Stabilized Class A Cap Rate (%)
Source: cBrE research, Q2 2015.
6 6
5 5
9 9
7 7
4 4
H1 20
09
H1 20
09
H1 20
10
H1 20
10
H1 20
11
H1 20
11
H1 20
12
H1 20
12
H1 20
13
H1 20
13
H1 20
14
H1 20
14
H1 20
15
H1 20
15
H2 20
09
H2 20
09
H2 20
10
H2 20
10
H2 20
11
H2 20
11
H2 20
12
H2 20
12
H2 20
13
H2 20
13
H2 20
14
H2 20
14
Calgary Dallas Denver Houston Pittsburgh Calgary Dallas Denver Houston Pittsburgh

22 © 2015 CBRE, Inc.
AppENdix

23EnErgy 2015 rEport | CBRE Research

24 © 2015 CBRE, Inc.
cAlgAryHigh oil prices fueled an economic boom and fundamental strengthening across the office sector in Canada’s ener-gy capital between 2010 and 2014. The downturn in oil prices has consequently weakened office market conditions, particularly in the Downtown and Central Core submarkets, where oil and gas firms and ancillary and supporting industries dominate the office footprint. During the first half of 2015, office market fundamentals softened as oil and gas tenants downsized, reduced costs or put expansion plans on hold.
Upstream and midstream employment in Calgary increased by 17,300 jobs between 2010 and 2014—a 34.4% gain, versus the 14.0% across all industries. Underscoring the strong connection between the industry and Calgary’s economic activity, oil and gas jobs represented 17.6% of new jobs added over the four-year period. The Conference Board of Canada is forecasting a loss of about 7,000 jobs in Calgary this year, largely related to low oil prices.
Calgary has weathered oil price volatility in the past and will recover from the current setback once prices rebound. Given the expectation that oil prices will increase over the next 12-18 months, the 5.7 million sq. ft. of office devel-opment currently underway may be well-timed to accommodate the next round of growth in the oil gas sector. The long-term positive outlook for conventional and unconventional oil and gas production in Canada is attractive to long-term investors, and bodes well for a 2016 market rebound.
FigurE 1:offiCe market headline indiCatorS
energy Submarkets Sublease activity occupany Net absorption
key Submarkets: Downtown and Central Core
3.7 million sq. ft. 5.8% of total rBa 85.6% (1.9 million) sq. ft. YtD
Q2 absorption
oil & gas Sq. Ft. Concentration Downtown = 75-85% 65.0% Y-o-Y 380 bps Y-o-Y 1.2 million sq. ft. Y-o-Y
Source: cBrE research, Q2 2015.
FigurES 2 & 3:oil and gaS emPloyment
12%Midstream8,000
88%Upstream59,600
oil & gas jobs in Calgary represent
8.5% of total employment
Source: Statistics canada, labour Force Survey, Q4 2014.
FigurE 4:Shifting offiCe market dynamiCSSq. Ft. (000,000) Occupancy (%)
Net Absorption Sublease Occupancy
4 943 92
0 86
2 901 88
-1 84
-3 80-2 82
2010 2014 Q2 2015*201320122011
Source: cBrE research, Q2 2015.
Change in Jobs Annual Employment Change (%)
Oil & Gas (L) Oil & Gas (R) Total Employment (R)
20,000 35
25
15
5
-5
30
20
10
0
-10
10,000
15,000
5,000
-5,000
0
2010 2014201320122011

25EnERgy 2015 REPORT | CBrE research
OfficeThe pullback from oil and gas tenants that represent a large portion of Calgary’s office occupiers has most notably increased space available for sublease. Total available sublease space reached 3.7 million sq. ft. in Q2 2015, surpassing the previous annual peak of 3.4 million sq. ft. (2009). About 1.9 million sq. ft. of the 2.4 million sq. ft. of sublease space downtown is attributable to footprint reductions among 85 energy companies. Ener-gy companies account for about 79% of the total space available for sublet in the Downtown submarket.
The slowdown in overall leasing activity will likely result in negative absorption by the end of 2015, following 1.1 million sq. ft. of positive absorption in 2014. Through the first half of the year, Calgary has recorded 1.9 mil-lion sq. ft. of negative absorption. Meanwhile, develop-ers are bringing 5.7 million sq. ft. of new supply to the market. These buildings will be completed over the next three years; prices may have recovered to more economi-cal levels by the time they are ready for occupancy.
The combination of slower leasing demand and growing supply—from new deliveries and space made available for sublease—is putting downward pressure on rents and increasing overall vacancy. Average rents are down 12.5% year-over-year and vacancy has increased to 14.4% as of Q2 2015.
OutlOOKThe precipitous drop in oil prices has had a mitigating effect on Calgary’s commercial real estate market. Down-town has been hit the hardest, with a large increase in the amount of sublease space. However, we have not yet seen a substantial drop in head lease rates.
Calgary’s industrial sector seems more resilient, as its tenant base is diversified outside of the energy sector with the product distribution industry. The retail sector is dealing with national and international retail closures that are unrelated to oil prices, but it remains healthy. Large capital pools remain interested in investing in all sectors in Cal-gary, but activity is being held back by a delta between purchaser and vendor pricing expectations. Overall, Calgary will recover; most industry professionals anticipate a return to growth in 2016.
Greg Kwong, Regional Managing Director, CBRE
industRialLargely due to changes in the retail distribution sec-tor, Calgary’s industrial market reported negative net absorption of 818,000 sq. ft. in 2015 through Q2, and the vacancy rate is up 170 bps from a year earlier, to a still-low 4.8%. Industrial asking rents have declined from Q2 2014 rates but are still above the rents of 2010, when the shale renaissance took hold. More than 4.4 million sq. ft. of new supply is underway, of which almost two-thirds is speculative (62.6%).
RetailDespite lower fuel costs, retail sales have stagnated across Canada and retailers are reducing the footprints of their retail and distribution space. Canada’s retail sales growth in February and March hinted at some underlying momentum, but total sales declined in April. Calgary’s total retail vacancy is up 30 bps from Q4 2014, reflecting the shuttering of Target and other retailers.
HOtelThe hotel sector in Calgary is showing signs of a pull-back, according to the STR’s Hotel Review for July 2015. Average occupancy is down 330 bps to 65.6% in the first half of 2015 compared to the first half of 2014 across all price tiers. RevPar is also down 7.5% over the same period. In addition to generally weak economic growth across Canada, depressed oil-related business travel is contributing to the downturn in hotel sector perfor-mance.

26 © 2015 CBRE, Inc.
dAllAS/Ft. WorthThe Dallas/Ft. Worth metro area benefits from a diverse economy and consistently robust employment growth, both of which have insulated the region from adverse effects stemming from oil price volatility. Notably, no single employment sector in the metro region constitutes more than one-sixth of the metro’s overall job base. Energy-re-lated companies within Dallas/Ft. Worth are predominantly located in the Ft. Worth CBD, where approximately 10% of the office base is occupied by oil and gas tenants. Ft. Worth is the heart of Tarrant County—the most populous county entirely within the Ft. Worth Basin—which draws resources primarily from the Barnett shale play. Although the Barnett play has principally served as a source for natural gas (as opposed to oil), its rig counts had been declin-ing long before the 2014 drop in oil prices, due to growing oil and gas production in other higher-volume U.S. plays.
Notwithstanding the national oil environment, commercial real estate fundamentals in Dallas/Ft. Worth have shown pervasive strength. Year-to-date absorption is almost unprecedented in both the office and industrial sectors, retail occupancy continues to chart record highs, and sustained in-migration growth has supported strong multi-family momentum across the metro area.
FigurE 1:offiCe market headline indiCatorS
energy Submarkets Sublease activity occupany Net absorption
key Submarket: Ft. Worthoil & gas Sq. Ft. Concentration Fort Worth = 10%oil & gas Sq. Ft. Concentration overall = 2.2%
2.5 million sq. ft. 1.1% of total rBa 82.1% 2.9 million sq. ft. YtD
Q2 absorption
15.8% Y-o-Y 75 bps Y-o-Y 1.4 million sq. ft. Y-o-Y
Source: cBrE research, Q2 2015.
FigurES 2 & 3:oil and gaS emPloyment
8%Midstream2,602
2%Downstream834
90%Upstream30,112
oil & gas jobs in Dallas/Ft. Worth
represent 1.1% of total employment
Source: u.S. Bureau of labor Statistics, texas Workforce commission, QcEW 2014.
FigurE 4:Shifting offiCe market dynamiCSSq. Ft. (000,000) Occupancy (%)
Net Absorption Sublease Occupancy
3.5 833.0 82
1.5
2.5 812.0
80
1.0 79
0.0 770.5 78
2010 2014 Q2 2015*201320122011
Source: cBrE research, Q2 2015.
Change in Jobs Annual Employment Change (%)
Oil & Gas (L) Oil & Gas (R) Total Employment (R)
4,0003,500
14
10
6
2
12
8
4
0-2
2,0001,500
3,0002,500
1,000500
02010 2014201320122011

27EnERgy 2015 REPORT | CBrE research
OfficeDallas/Ft. Worth is widely known for its business-friend-ly environment and critical mass of corporate headquar-ters spanning an array of office-using industries outside of oil and gas. Growth in the professional and business services and financial activities employment sectors has propelled office leasing activity, and will continue to do so as major relocations and expansions, including Toyota, Liberty Mutual, State Farm and Real Page, bring even more attention to the region from other company prospects.
industRialGrowth in e-commerce and consumer goods has been the key driver in Dallas/Ft. Worth’s industrial landscape; these sectors have been aided by the reduced shipping costs that have resulted from lower fuel prices. While vacancy has begun to level off in Dallas/Ft. Worth, it is a result of increasing speculative construction, rather than a product of oil and gas-related instability.
MultifaMilyApartment fundamentals have seen no erosion as a result of volatility in the oil market, nor is this expected to become an issue, given the strong absorption trends and positive rent growth forecasts for the Metroplex. Aggressive expansion of the job base will continue to fuel renter demand as Dallas/Ft. Worth is projected to add 13.6% to the job base through 2019, according to Moody’s Analytics.
HOtelOverall, the fall in oil prices has had no effect on the Dallas/Ft. Worth hospitality market. Annual increases in revenue per available room are expected to reach 9.0% in Dallas and 6.5% in Ft. Worth for 2015, exceeding the long-term averages (since 1988) of 3.4% and 3.9%, respectively, according to PKF Research.
RetailLower gas prices have meant more disposable income for consumers. This is expected to have an impact on retail sales, particularly for big ticket items.
OutlOOKGiven the diverse industry base of Dallas/Ft. Worth and the energy sector’s 1.1% share of metro employment, any economic impact from low oil prices is expected to be marginal on a local level. This means commercial real estate occupancy sees minimal effects as our region looks to other industries like finance, insurance, wholesale trade and transportation for growth. Above-average population growth should continue to sustain momentum in the housing market, which will also benefit overall growth and help secure the region’s continued status as an expanding market.
Michael Caffey, Executive Managing Director, CBRE

28 © 2015 CBRE, Inc.
dENvErDenver is a regional and national headquarters market for oil and gas companies that are active in several U.S. shale plays, including the Bakken, Niobrara, Marcellus and Permian plays. The shale renaissance has been a significant driver in Denver’s early recovery and standout economic growth story throughout this expansion cycle. Due to non-energy industries—particularly finance, legal and business services—expanding in the downtown submarket over the past four quarters, the market has remained healthy in spite of the downturn in oil prices. Oil and gas of-fice tenants are heavily concentrated in the downtown submarket; it is likely the only Denver submarket that will be affected by ongoing industry growing pains.
After weaker oil and gas leasing activity throughout the first half of 2015, the office market remains strong. The slowdown in office leasing by oil and gas tenants, new sublease space on the market from energy tenants, and above-average construction activity—including 1.8 million sq. ft. of speculative space underway—will slow lease rate appreciation and increase availability in Denver’s downtown market for the remainder of the year. Negative effects beyond the downtown office market will be avoided due to other expanding industries and generally positive economic growth.
3.0
1.5
2.5
2.0
1.0
0.0
0.5
FigurE 1:offiCe market headline indiCatorS
energy Submarkets Sublease activity occupany Net absorption
key Submarket: Downtownoil & gas Sq. Ft. Concentration Downtown = 21%oil & gas Sq. Ft. Concentration overall = 5%
2.3 million sq. ft. 2.1% of total rBa 86.8% 230,779 sq. ft. YtD
Q2 absorption
23.2% Y-o-Y 80 bps Y-o-Y 598,581 sq. ft. Y-o-Y
Note: denver net absorption includes direct and not total activity.Source: cBrE research, Q2 2015.
FigurES 2 & 3:oil and gaS emPloyment
11%Midstream1,600
7%Downstream955
82%Upstream11,482
oil & gas jobs in Denver represent
1.1% of total employment
Source: u.S. Bureau of labor Statistics, cBrE research, Q2 2015.
FigurE 4:Shifting offiCe market dynamiCSSq. Ft. (000,000) Occupancy (%)
Net Absorption Sublease Occupancy
888786858483
8182
2010 2014 Q2 2015*201320122011
Source: cBrE research, Q2 2015.
Change in Jobs Annual Employment Change (%)
Oil & Gas (L) Oil & Gas (R) Total Employment (R)
1,400
1,200
14
10
6
2
12
8
4
0-2
600
400
1,000
800
200
02010 2014201320122011

29EnErgy 2015 rEport | CBRE Research
OfficeAlthough the bulk of energy leasing activity related to the shale renaissance occurred from 2009 to 2012, the industry remained among the top four categories for leasing activity through 2014 in the market. The stall in new leasing activity from oil and gas tenants became noticeable in the first half of 2015; evident in negative Q1 2015 absorption. Industries such as technology and finance are expected to backfill sublease space from the oil and gas industries, as well as the 1.8 million sq. ft. of speculative construction that is underway downtown. A total of 3.1 million sq. ft. is underway across the mar-ket, surpassing the previous peak, set in 2007. Sublease space spiked to 2.3 million sq. ft. in Q2 2015 and is currently above the historic average. About 20% of the total sublease space available in Denver is attributable to oil and gas leases. Occupancy appears to be leveling off so far this year, currently at 86.8%. Lease rates in the downtown submarket and across the metro are not yet reflecting any slowdown in demand. In Q2 2015, Class A lease rates increased by 7.3% year-over-year, to a record $28.84 full-service gross.
industRialDenver’s industrial sector will not be negatively affected by low, volatile oil prices, as the industry represents a negligible share of leasing activity and occupied sq. ft. The boost to consumption will translate into increased demand for warehousing and logistics space. In fact,
the Q2 2015 vacancy rate of 4.5% is down from 4.9% a year earlier. On the other hand, Northern Colorado’s industrial market will soften as oil production in the Denver-Julesburg basin stalls.
MultifaMilyContinued population influx, particularly into Denver’s urban neighborhoods, will shore up any apartment demand loss related to oil and gas layoffs. With 1.1% of total employment in oil and gas, negative impacts are not expected to extend to Denver’s hot multifamily market, where rents are increasing at one of the fastest rates in the U.S.
HOtelStrong performance has attracted a notable supply pipe-line that—in concert with slower oil and gas business travel—will see occupancy rates level off after five years of increases. As a popular tourist destination, Denver’s lower-tier properties will continue to see occupancy rate increases in the near term.
RetailThe retail sector is poised to see fundamentals improve. Minimal construction so far this cycle and increasing consumer activity are beginning to translate into lease rate appreciation in particular, with a 12.5% year-over-year increase to $17.37 triple net reported in Q2 2015.
OutlOOKWith a few major regional headquarters closure announcements made in the first half of 2015, downtown Den-ver received its first noteworthy setback in momentum in several years. That being said, the large majority of the resulting sublease space have significant terms remaining (5+ years), which will give the market a decent runway to absorb the additional product. Active demand in the downtown market is projecting a positive occupancy need of 1.0 million sq. ft. through Q3 2016. Denver’s diverse and robust economy has helped to neutralize the negative effects of lower oil prices on its commercial real estate asset classes.
Anthony Albanese, First Vice President, Energy Facilities Portfolio Consultant/Co-Founder, CBRE

30 © 2015 CBRE, Inc.
houStoNIt should come as no surprise that the oil glut in the upstream sector is bearing upon Houston’s economic, employ-ment and commercial real estate sectors: Houston’s Purchasing Managers Index—a short-term leading indicator for regional production—registered 49.1 in July, indicating a slight contraction; the competitive office leasing market has seen negative growth of more than 0.5 million sq. ft.; and the unemployment rate ticked up 30 bps to 4.5% in June, according to the Texas Workforce Commission. Still, Houston’s rolling 90-day job growth eclipsed 18,800 new payrolls, even with contractions in mining and logging, construction, and manufacturing. Area economists antic-ipate that the region will expand its metro employment by 20,000-30,000 new weekly paychecks in 2015; and with local business confidence holding firm, the slowdown in job growth is a lull, rather than a new normal.
Clearly though, energy companies are adjusting to the pricing realities of a global oversupply of crude oil; Houston has seen its office sublease space spike this year as a result. For office occupancy in the area, it has been a one-two punch: several energy companies recently moved into newly developed, owned buildings, contributing to the surge in sublease space. Meanwhile, companies have right-sized in the dead wake of slumping crude prices. Unsurprising-ly, the majority of sublease space on the market is from the energy industry—specifically the upstream oil and gas companies, like ConocoPhillips and Statoil.
FigurE 1:offiCe market headline indiCatorS
energy Submarkets Sublease activity occupany Net absorption
key Submarkets: energy Corridor & CBDoil & gas Sq. Ft. Concentration energy Corridor = 58%oil & gas Sq. Ft. Concentration CBD = 53%
6.8 million sq. ft. 3.3% of total rBa 86.6% 2.0 million sq. ft. YtD
Q2 absorption
76.7% Y-o-Y 140 bps Y-o-Y 803,019 sq. ft. Y-o-Y
Source: cBrE research, Q2 2015.
FigurES 2 & 3:oil and gaS emPloyment
19%Midstream29,736
14%Downstream21,060
67%Upstream105,284
oil & gas jobs in houston represent
5.5% of total employment
Source: u.S. Bureau of labor Statistics, texas Workforce commission, QcEW 2014.
8
4
6
2
-2
0
FigurE 4:Shifting offiCe market dynamiCSSq. Ft. (000,000) Occupancy (%)
Net Absorption Sublease Occupancy
89888786858483
8182
2010 2014 Q2 2015*201320122011
Source: cBrE research, Q2 2015.
Change in Jobs Annual Employment Change (%)
Oil & Gas (L) Oil & Gas (R) Total Employment (R)
14,00012,000
12
10
6
2
8
4
0
-2
6,0004,000
10,0008,000
2,000
-2,0000
-4,0002010 2014201320122011

31EnErgy 2015 rEport | CBRE Research
OfficeHouston is pulling back on the construction throttle for the first time since Q4 2013, with 11.8 million sq. ft. of office space under construction in Q2 2015. Ten new buildings were delivered in Q2 2015, all in West Houston, totaling 2.3 million sq. ft. Eighty-three percent were pre-leased; six of the buildings arrived completely pre-leased or owner occupied. Class A availability will increase sharply and quickly over the next 18 months, mainly in the Energy Corridor, CBD, Westchase and The Woodlands. New deliveries nearing 6.2 million sq. ft. will occur in these four submarkets alone coupled with an overhang of 6.8 million sq. ft. of sublease space marketwide.
industRial Job growth is a leading indicator for industrial space demand and its ties to consumer and capital expendi-ture are linked. The oil price downturn is costing the Houston area jobs on offshore drilling rigs and in the office towers of the Energy Corridor, but the region’s construction of new petrochemical plants in the Ship Channel should offset many of these losses and give oil crude prices more time to rebound.
MultifaMilyAfter a measured start to the year alongside the decline in oil prices, investment sales activity remains healthy. Investors spent $2.06 billion on Houston multifamily
during the first half of the year—down from the $2.24 billion spent during the same period last year, according to Real Capital Analytics. In Q2 2015, overall vacancy remained low and ticked up only 10 bps to 5.2% from a year ago. The drop in oil is preventing the local market from becoming overbuilt. Some 25,000 units are under construction, but few new projects are being started. Projects can take two to three years to complete.
HOtelRates and occupancy are down in the areas of Houston where energy companies are clustered, such as the Ener-gy Corridor on the west side and in The Woodlands on the city’s far north side. Downtown is vibrant, however—the city’s convention center is diversifying its business development efforts and seven hotels with a total of 2,081 rooms are under construction. The largest is the 1,000-room Marriott Marquis, its completion is estimated for September 2016.
RetailBolstered by pent-up demand from recent population growth, Houston’s retail market is poised for a strong growth cycle in spite of the slump in oil prices and some resulting job losses. In Q2 2015, more than 1.6 million sq. ft. of proposed retail projects were announced, of which 560,000 sq. ft. is speculative. Due to the popula-tion gains, grocery-anchored centers continue to be the focus of developers.
OutlOOKDespite the headlines, Houston’s regional economy is buoyant. In June 2015, local realtors set a residential sales record and area auto dealers experienced their personal best sales figures. Commercial real estate landlords and occupiers alike saw silver linings to the pricing clouds hovering over the upstream energy sector with the rise in office sublease giving some tenants an opportunity to upgrade at a discount, and petrochemical refining triggering industrial demand in the southeast Ship Channel.
As expected, the majority of the office sublease space is from the energy industry and the Class A sector is bearing the brunt of it. Make no mistake, however, as landlords are well-positioned for a trough in leasing demand that is expected to run through the remainder of the year. Houston ranks among the five fastest growing manufacturing job markets. Daikin Industries— a manufacturer of heating, cooling and refrigerant products—recently announced expansion plans with a new $417 million campus and 2,800 jobs to be added to its local workforce.
Houston’s job scene—and its commercial real estate sectors—remain good, solid, long-term bets.
Robert C. Kramp, Director, Research & Analysis, CBRE

32 © 2015 CBRE, Inc.
pittSBurghPittsburgh has become a regional hub for oil and gas companies involved in the Marcellus and Utica shale plays. As oil and gas companies have entered the market, so have ancillary and support companies such as law, finance, engineering and environmental firms. The shale gas industry has grown into a significant contributor to regional economic output, including job creation.
Most of the shale-related energy production in the region is centered on the production of natural gas—specifically highly profitable wet gas, which contains valuable natural gas liquids (NGLs) such as ethane, methane, propane and butane. The region offers a cost advantage; with 45% of the U.S. population within a 500-mile radius, production and transportation costs are lower than those at shale plays in areas that are less populous.
Much of the area’s energy-related commercial real estate activity is clustered in the I-70 and I-79 corridor between the Marcellus and Utica shale formations. While the energy industry has brought new tenants to the office market, the industrial sector has been the predominant benefactor of the shale renaissance, with oil and gas tenants having been a major leasing driver over the past seven years.
Oil prices affect commercial real estate fundamentals in Pittsburgh less than in other energy markets because of the region’s concentration in natural gas production. Natural gas prices are down slightly from a year ago, but over the past six months they have stabilized.
2.0
0.81.0
1.61.8
1.21.4
1.00.6
0.00.5
FigurE 1:offiCe market headline indiCatorS
energy Submarkets Sublease activity occupany Net absorption
key Submarket: Southpointeoil & gas Sq. Ft. Concentration Southpointe = 38%oil & gas Sq. Ft. Concentration overall = 3%
457,544 sq. ft. 0.6% of total rBa 89.5% 150,293 sq. ft. YtD
Q2 absorption
8.7% Y-o-Y 100 bps Y-o-Y 146,249 sq. ft. Y-o-Y
Source: cBrE research, Q2 2015.
FigurE 4:Shifting offiCe market dynamiCSSq. Ft. (000,000) Occupancy (%)
Net Absorption Sublease Occupancy
90.590.0
89.089.5
88.588.087.5
86.587.0
2010 2014 Q2 2015*201320122011
Source: cBrE research, Q2 2015.
FigurES 2 & 3:oil and gaS emPloyment
17%Midstream1,702
83%Upstream8,014
oil & gas jobs in Pittsburgh
represent 0.7% of total employment
Note: downstream employment data was unavailable for pittsburgh and is therefore not represented. Source: u.S. Bureau of labor Statistics, cBrE research, Q2 2015.
Change in Jobs Annual Employment Change (%)
Oil & Gas (L) Oil & Gas (R) Total Employment (R)
3,000
2,500
60
40
20
0
50
30
10
-10
1,000
500
2,000
1,500
02010 2014201320122011
33EnErgy 2015 rEport | CBRE Research
OfficeDemand for office space from energy companies has been concentrated in the Southpointe submarket, Pitts-burgh’s energy headquarters hub and the location of NOBLE Energy’s newly completed and occupied region-al facility. While the energy industry’s leasing activity has been strong, it ranks behind finance, healthcare, legal and professional services. Oil and gas companies have not yet announced plans to downsize, but expan-sion plans are on hold.
Net absorption has trended downward since 2013 but remains positive—at more than 150,000 sq. ft. for the first half of 2015. Total sublease space is up 8.7% from a year ago but represents only 0.6% of market invento-ry. Occupancy is steady—ranging between 89.1% and 90.1% over the past five years. Energy-related sublease space accounts for 26.2% of the total space on the mar-ket. Average asking lease rates increased 8.2% year-over-year in Southpointe, compared to 4.2% marketwide. About 1.8 million sq. ft. is underway, representing 2.7% of existing inventory, and no construction projects have been halted due to the downturn in oil prices.
industRialThe industrial sector has recorded strong demand from oil and gas tenants over the past five years, with energy ranking behind only manufacturing for leasing activity.
Sustained low fuel prices may weaken demand for in-dustrial product, although the market has not softened yet. In fact, the Q2 2015 overall vacancy rate of 6.8% represented a 10-bps decline from a year earlier. Devel-opers have been cautious during this building cycle, with only 1.1 million sq. ft. of new supply underway to relieve market pressure and increase tenants’ leasing options.
MultifaMilyIn response to increased demand for apartments—which prompted a low 2.7% vacancy rate in 2012—more than 2,700 units were delivered between 2012-2014. Overall vacancy has increased since then but remains healthy. Lease rates have also increased, although appre-ciation is expected by slow from 2014’s 5.7% to 2.4% in 2015, according to CBRE EA.
HOtelThe hotel sector responded to increased demand with new hotel rooms in recent years. With supply growth outpacing demand growth, occupancy will decline from 2014’s 67.9% to 66.6% in 2015, according to CBRE EA.
RetailModest fundamental strengthening, related to increased consumer discretionary income and spending, is expected.
OutlOOKThe decline in oil prices has prompted energy companies to reevaluate growth plans, with a focus on cutting back expenses. Many smaller, privately held firms are seeing their major accounts request pricing cuts of up to 15%. This downward pricing pressure will cause expansion to pause and may accelerate strategic M&A activity.
Industrial vacancy rates within the Marcellus and Utica shale plays are at historic lows, and anticipated M&As should free up some inventory in the second half of 2015. The long-term outlook remains positive for Pittsburgh’s office and industrial markets.
R.T. Walker, Vice President, Energy Facilities Portfolio Consultant/Co-Founder, CBRE

coNtActS
To learn more about CBRE Research, or to access additional research reports, please visit the Global Research Gateway at www.cbre.com/researchgateway.
Additional U.S. publications produced by CBRE Research can be found at www.cbre.us/research.
Disclaimer: Information contained herein, including projections, has been obtained from sources believed to be reliable. While we do not doubt its accu-racy, we have not verified it and make no guarantee, warranty or representation about it. It is your responsibility to confirm independently its accuracy and completeness. This information is presented exclusively for use by CBRE clients and professionals and all rights to the material are reserved and cannot be reproduced without prior written permission of CBRE.
sPEnCER g. LEvy
Americas Head of Research
+1 410 951 8443
@SpencerGLevy
JEssICa OsTERMICK
Director, Research and Analysis
+1 720 528 6338
@jessostermick
ROBERT KRaMP
Director, Research and Analysis
+1 713 577 1715
@RobertKramp
LaUREn PaRIs
Senior Research Analyst
+1 214 979 6587
anThOny aLBanEsE
First Vice President, Energy Facilities
Portfolio Consultant/Co-Founder
+1 303 628 1758
@Albanese_Energy
R.T. WaLKER
Vice President, Energy Facilities
Portfolio Consultant/Co-Founder
+1 412 394 9850
@RTWalker
fOR MORe infORMatiOn abOut
tHis RePORt OR cbRe ReseaRcH:
fOR MORe infORMatiOn abOut
cbRe’s eneRgy facilities gROuP: