Embed Size (px)
Citation preview
Energy & Environmental Economics A.Y.2015-2016
Energy Industries: Oil
Petroleum
By petroleum we mean a natural mix of hydrocarbons and other substances
- Oil, crude oil (when liquid)
- Natural gas
- Tar (solid)
The measurement unit for crude oil is the barrel corresponding to about 159 litres.
Petroleum is the final result of a process of thermal alteration of organic material dispersed in sedimentary rocks.
90% of oil reserves is contained in less than 1500 big oil fields (which is but a small part of the 40.000 existing oil fields )
Reservoirs differ in oil quality, as measured by
API degrees) (The API degree is inversely related to the content of sulphur and to density)
PRODUCTION
TOTA
L P
ETR
OLE
UM
INIT
IALL
Y IN
PLA
CE
(PII
P)
UN
DIS
CO
VER
ED P
IIP
DIS
CO
VER
ED P
IIP
CO
MM
ERC
IAL
SUB
-CO
MM
ERC
IAL
RESERVES
CONTINGENT RESOURCES
UNRECOVERABLE
PROSPECTIVE RESOURCES
UNRECOVERABLE
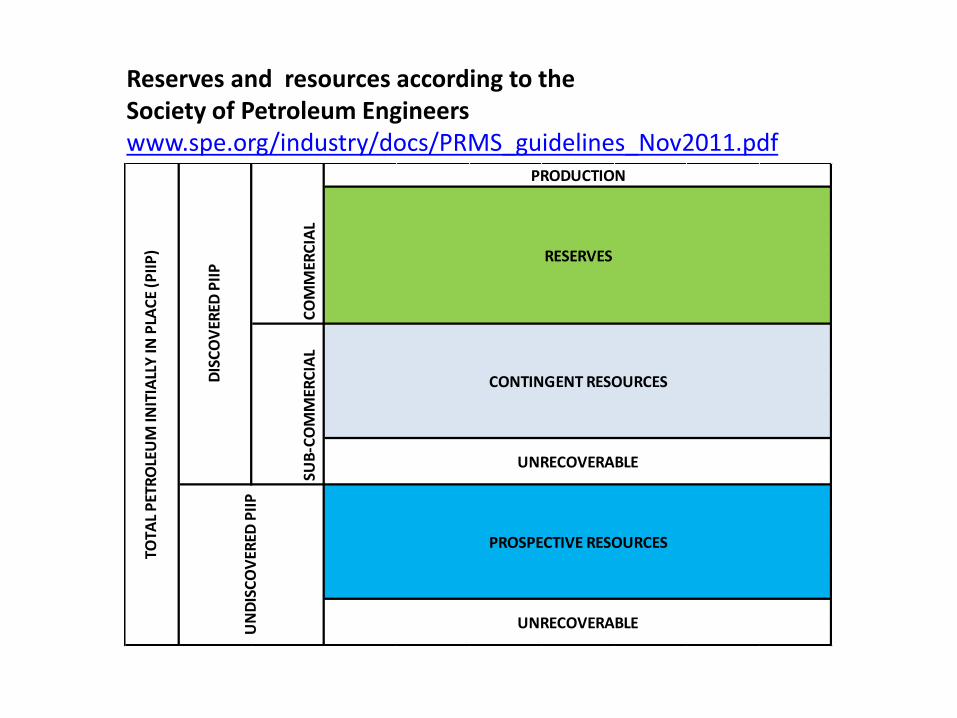
Reserves and resources according to the Society of Petroleum Engineers www.spe.org/industry/docs/PRMS_guidelines_Nov2011.pdf
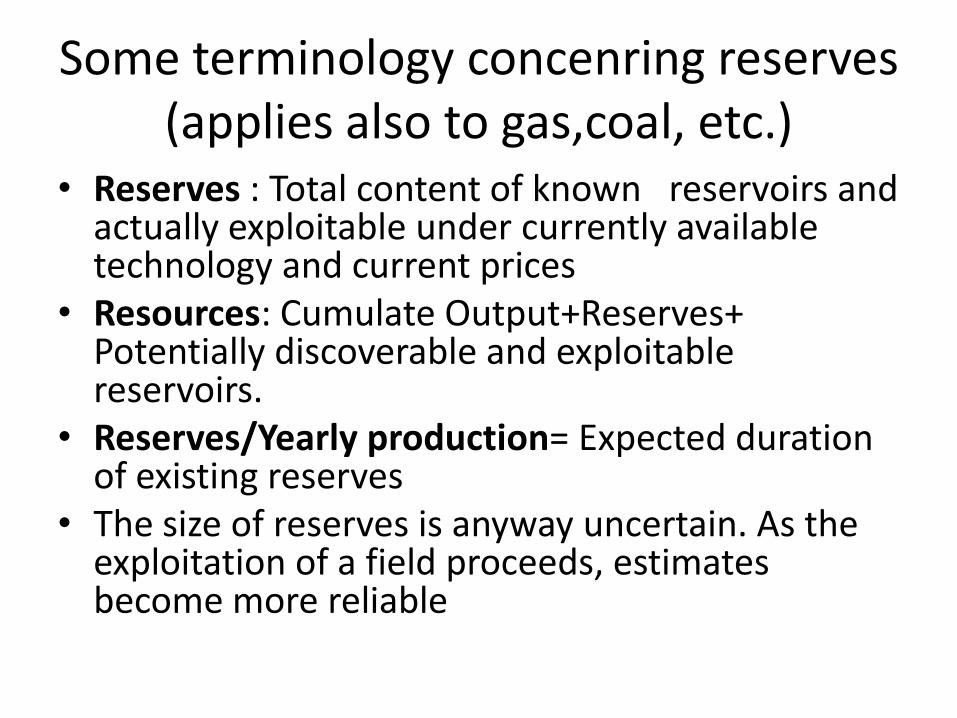
Some terminology concenring reserves (applies also to gas,coal, etc.)
• Reserves : Total content of known reservoirs and actually exploitable under currently available technology and current prices
• Resources: Cumulate Output+Reserves+ Potentially discoverable and exploitable reservoirs.
• Reserves/Yearly production= Expected duration of existing reserves
• The size of reserves is anyway uncertain. As the exploitation of a field proceeds, estimates become more reliable
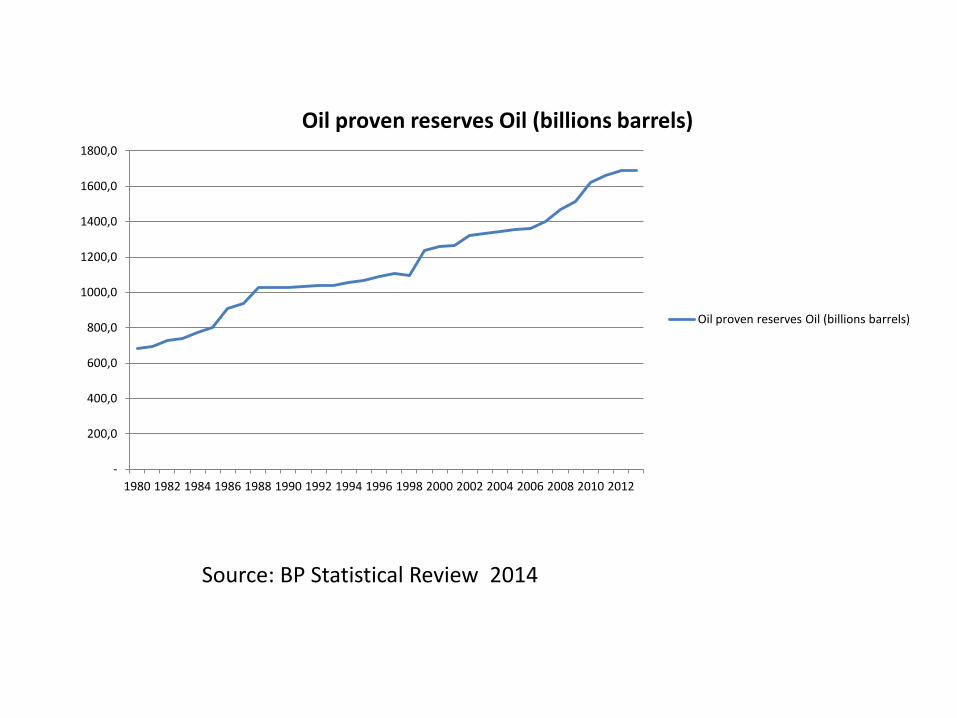
Source: BP Statistical Review 2014
-
200,0
400,0
600,0
800,0
1000,0
1200,0
1400,0
1600,0
1800,0
1980 1982 1984 1986 1988 1990 1992 1994 1996 1998 2000 2002 2004 2006 2008 2010 2012
Oil proven reserves Oil (billions barrels)
Oil proven reserves Oil (billions barrels)
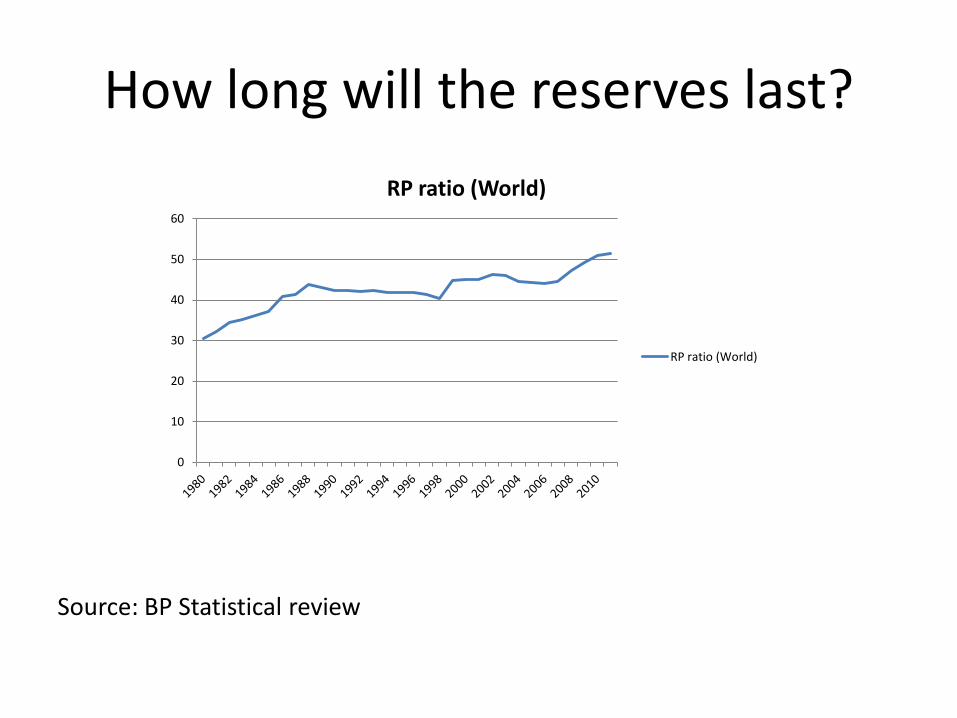
How long will the reserves last?
Source: BP Statistical review
0
10
20
30
40
50
60
RP ratio (World)
RP ratio (World)
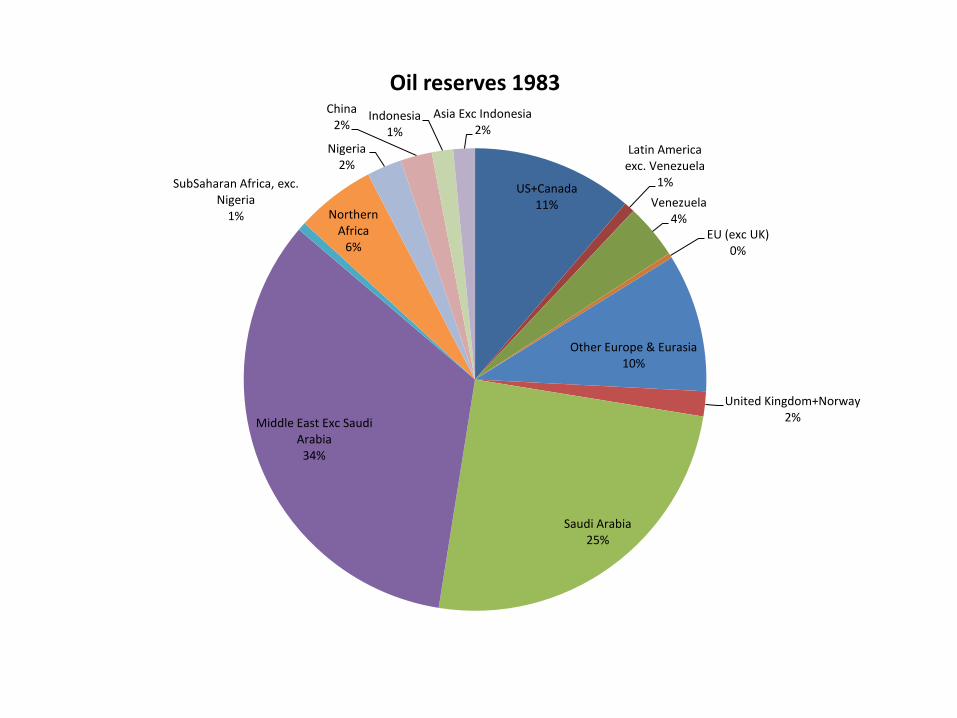
US+Canada 11%
Latin America exc. Venezuela
1%
Venezuela 4%
EU (exc UK) 0%
Other Europe & Eurasia 10%
United Kingdom+Norway 2%
Saudi Arabia 25%
Middle East Exc Saudi Arabia
34%
SubSaharan Africa, exc. Nigeria
1% Northern Africa
6%
Nigeria 2%
China 2%
Indonesia 1%
Asia Exc Indonesia 2%
Oil reserves 1983
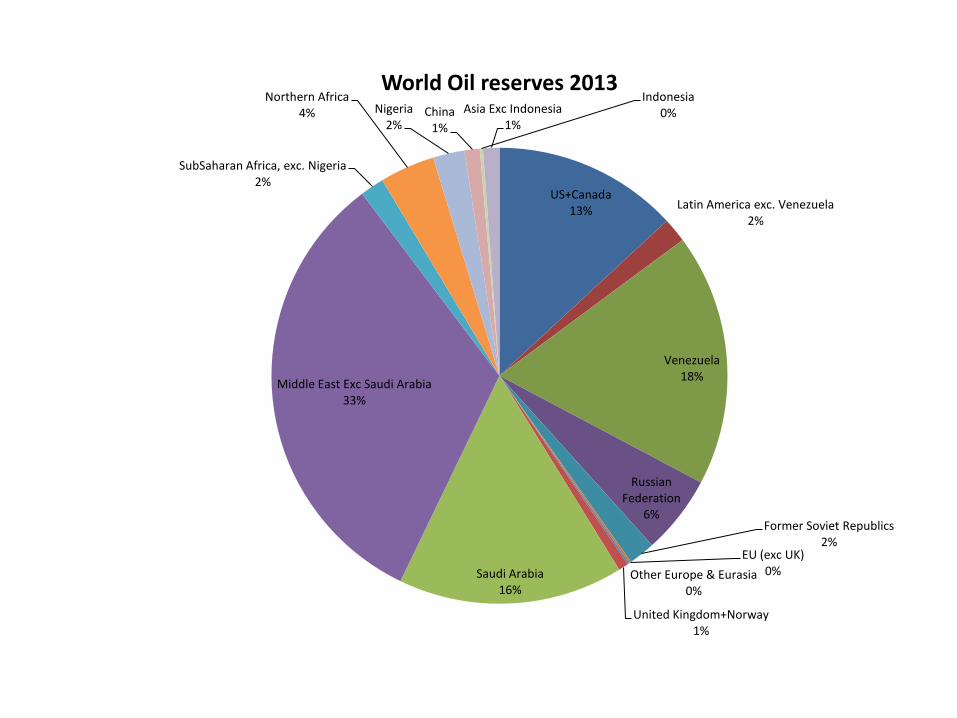
US+Canada 13% Latin America exc. Venezuela
2%
Venezuela 18%
Russian Federation
6% Former Soviet Republics
2% EU (exc UK)
0% Other Europe & Eurasia 0%
United Kingdom+Norway 1%
Saudi Arabia 16%
Middle East Exc Saudi Arabia 33%
SubSaharan Africa, exc. Nigeria 2%
Northern Africa 4% Nigeria
2% China
1%
Indonesia 0% Asia Exc Indonesia
1%
World Oil reserves 2013
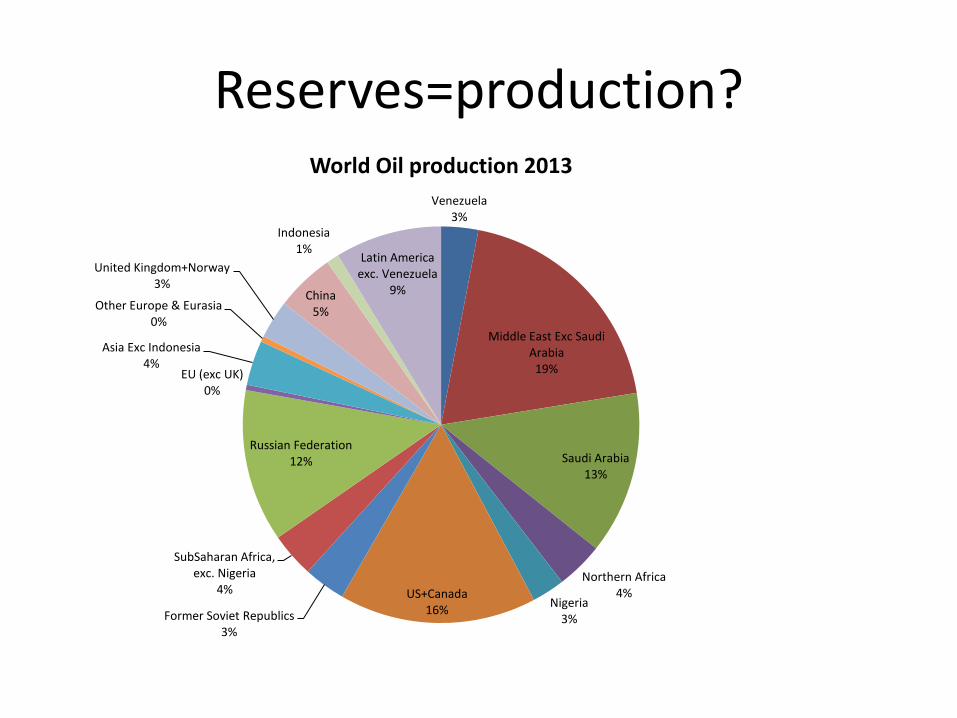
Reserves=production?
Venezuela 3%
Middle East Exc Saudi Arabia
19%
Saudi Arabia 13%
Northern Africa 4%
Nigeria 3%
US+Canada 16% Former Soviet Republics
3%
SubSaharan Africa, exc. Nigeria
4%
Russian Federation 12%
EU (exc UK) 0%
Asia Exc Indonesia 4%
Other Europe & Eurasia 0%
United Kingdom+Norway 3%
China 5%
Indonesia 1%
Latin America exc. Venezuela
9%
World Oil production 2013
0
1
2
3
4
5
6
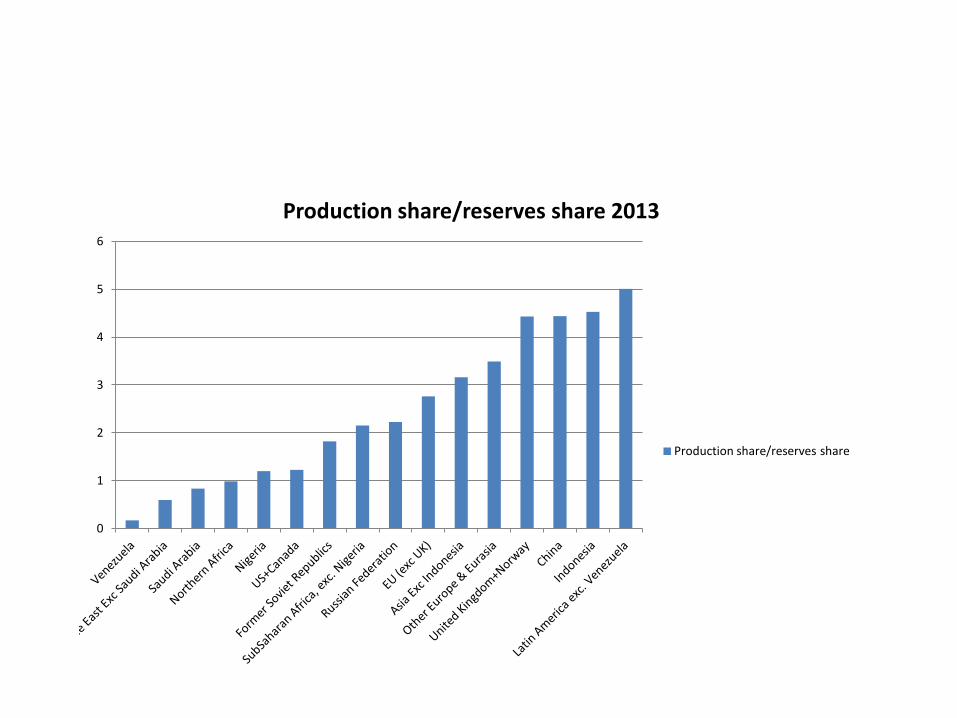
Production share/reserves share 2013
Production share/reserves share
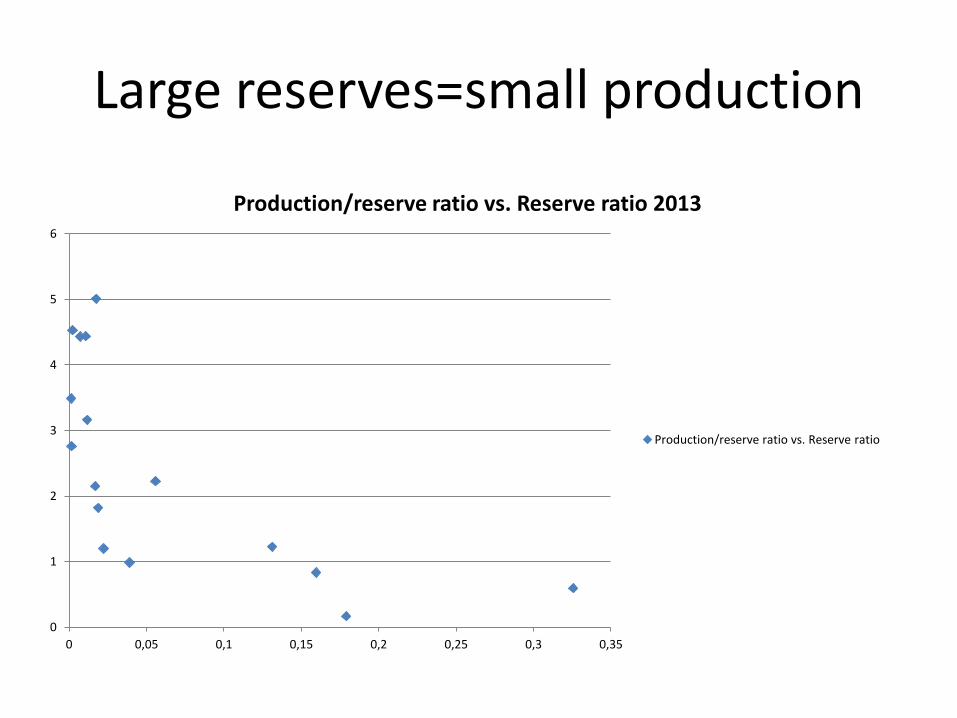
Large reserves=small production
0
1
2
3
4
5
6
0 0,05 0,1 0,15 0,2 0,25 0,3 0,35
Production/reserve ratio vs. Reserve ratio 2013
Production/reserve ratio vs. Reserve ratio
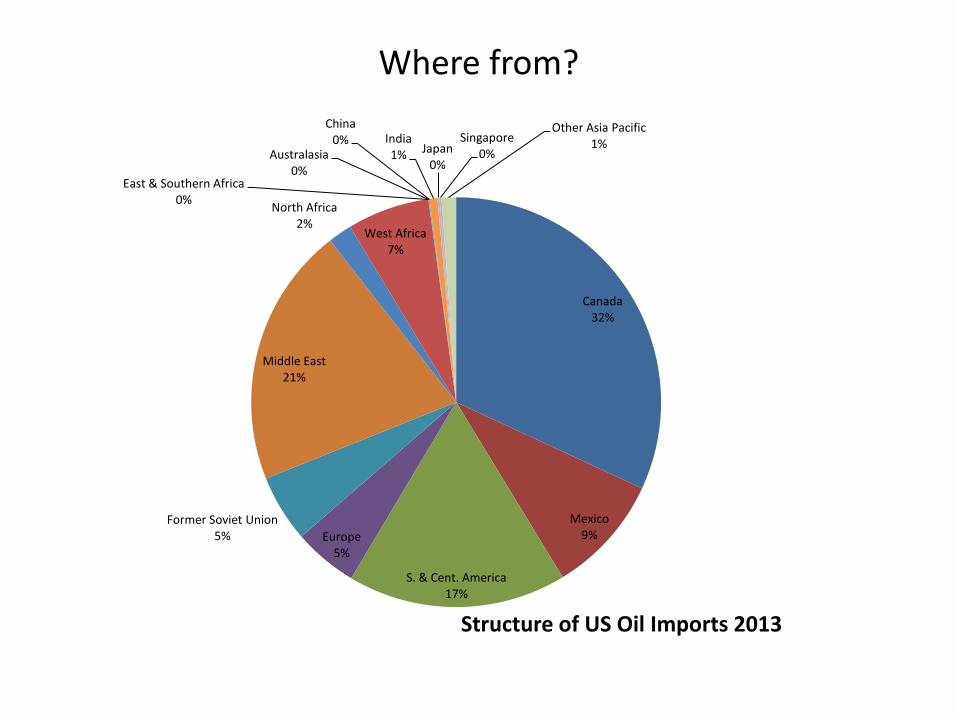
Where from?
Canada 32%
Mexico 9%
S. & Cent. America 17%
Europe 5%
Former Soviet Union 5%
Middle East 21%
North Africa 2%
West Africa 7%
East & Southern Africa 0%
Australasia 0%
China 0% India
1% Japan 0%
Singapore 0%
Other Asia Pacific 1%
Structure of US Oil Imports 2013
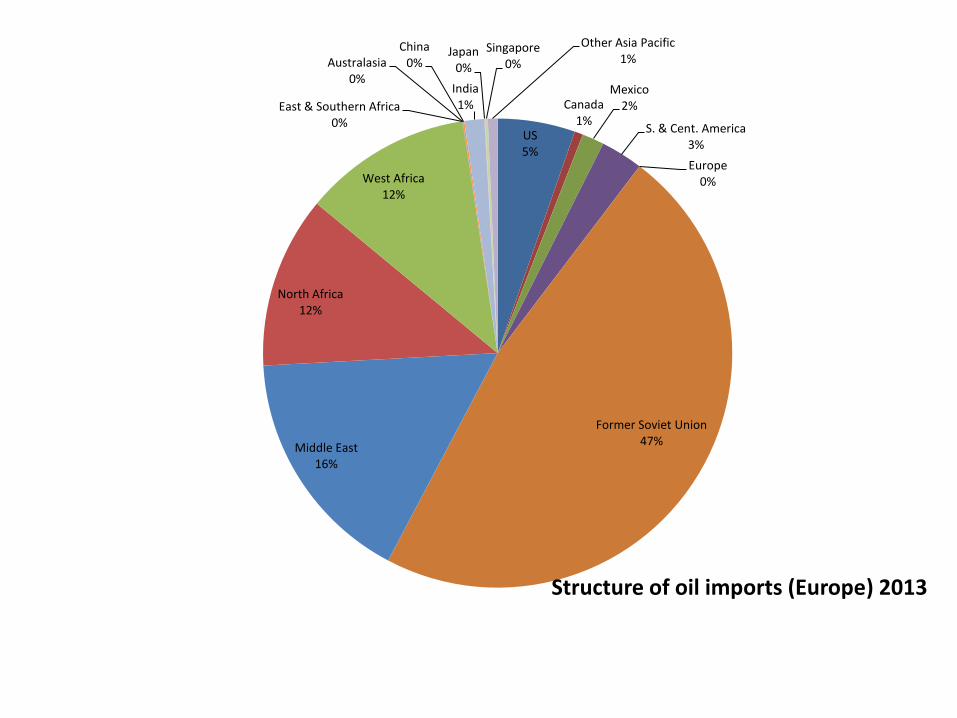
US 5%
Canada 1%
Mexico 2%
S. & Cent. America 3%
Europe 0%
Former Soviet Union 47%
Middle East 16%
North Africa 12%
West Africa 12%
East & Southern Africa 0%
Australasia 0%
China 0%
India 1%
Japan 0%
Singapore 0%
Other Asia Pacific 1%
Structure of oil imports (Europe) 2013
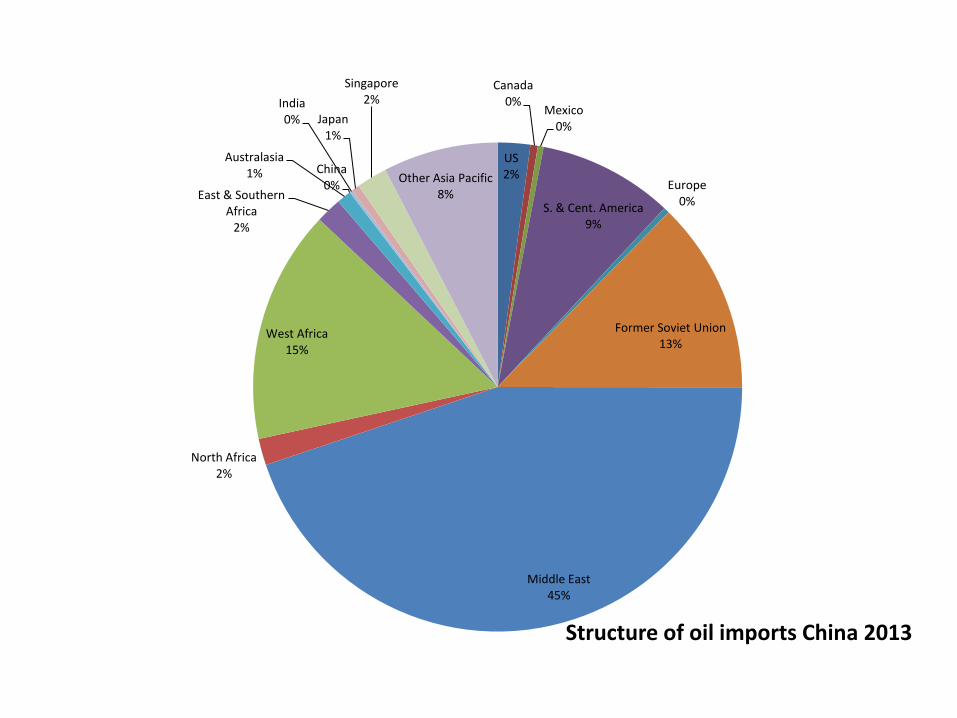
US 2%
Canada 0%
Mexico 0%
S. & Cent. America 9%
Europe 0%
Former Soviet Union 13%
Middle East 45%
North Africa 2%
West Africa 15%
East & Southern Africa
2%
Australasia 1% China
0%
India 0% Japan
1%
Singapore 2%
Other Asia Pacific 8%
Structure of oil imports China 2013
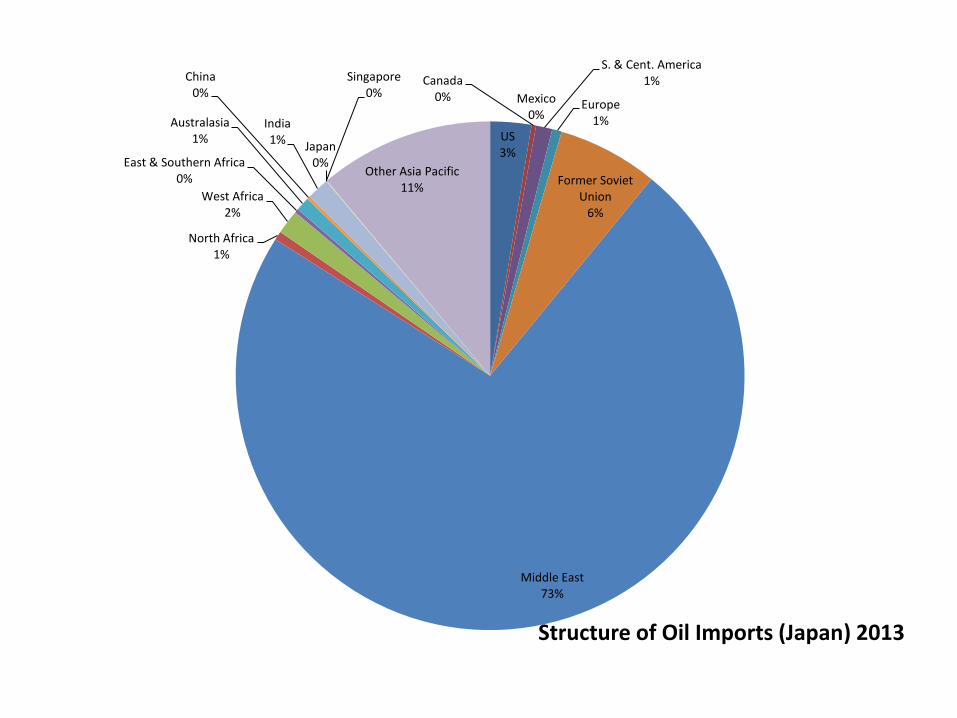
US 3%
Canada 0% Mexico
0%
S. & Cent. America 1%
Europe 1%
Former Soviet Union
6%
Middle East 73%
North Africa 1%
West Africa 2%
East & Southern Africa 0%
Australasia 1%
China 0%
India 1%
Japan 0%
Singapore 0%
Other Asia Pacific 11%
Structure of Oil Imports (Japan) 2013
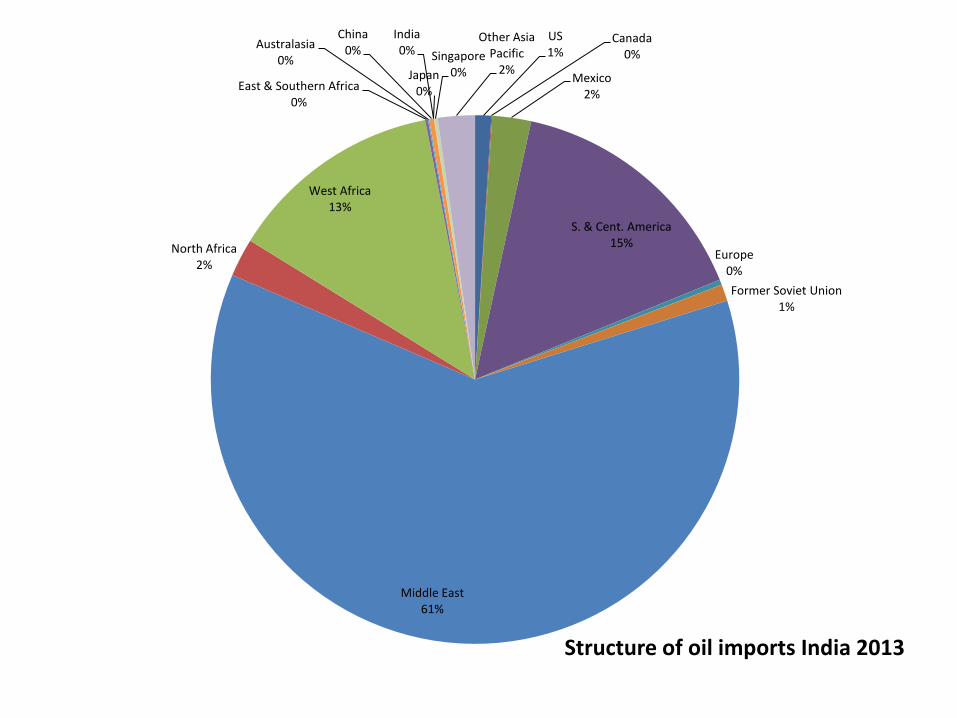
US 1%
Canada 0%
Mexico 2%
S. & Cent. America 15%
Europe 0%
Former Soviet Union 1%
Middle East 61%
North Africa 2%
West Africa 13%
East & Southern Africa 0%
Australasia 0%
China 0%
India 0%
Japan 0%
Singapore 0%
Other Asia Pacific
2%
Structure of oil imports India 2013
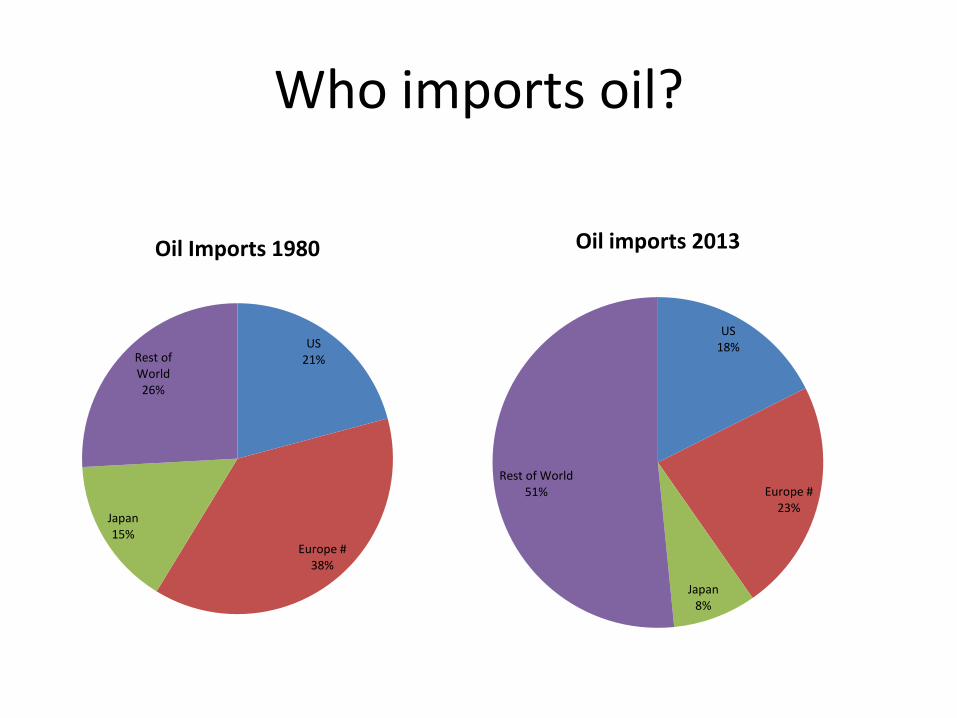
Who imports oil?
US 21%
Europe # 38%
Japan 15%
Rest of World 26%
Oil Imports 1980
US 18%
Europe # 23%
Japan 8%
Rest of World 51%
Oil imports 2013
The Oil Industry
Exploration & Discovery
• High fixed costs
• High uncertainty in outcomes, time-consuming processes
These features support highly concentrated structures, capable of self financing and diversification
Concentration by firm
Geographic concentration goes hand in hand with concentration by firm. 50% of oil world reserves is controlled by 3 firms (Saudi Arabian Oil Company, Petroleos de Venezuela.S.A, National Iranian Oil Company ),90% by 13 firms from 12 countries. ENI is 26th controlling 3% of world reserves.
(Source: www.petrostrategies.org/)
OPEC
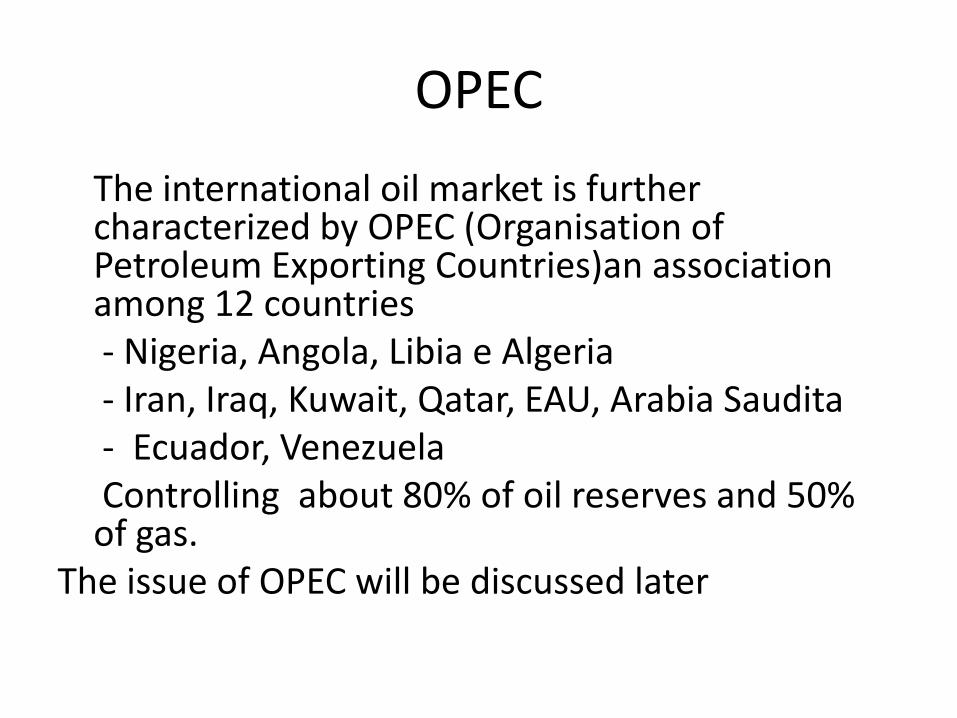
The international oil market is further characterized by OPEC (Organisation of Petroleum Exporting Countries)an association among 12 countries
- Nigeria, Angola, Libia e Algeria - Iran, Iraq, Kuwait, Qatar, EAU, Arabia Saudita - Ecuador, Venezuela Controlling about 80% of oil reserves and 50%
of gas. The issue of OPEC will be discussed later
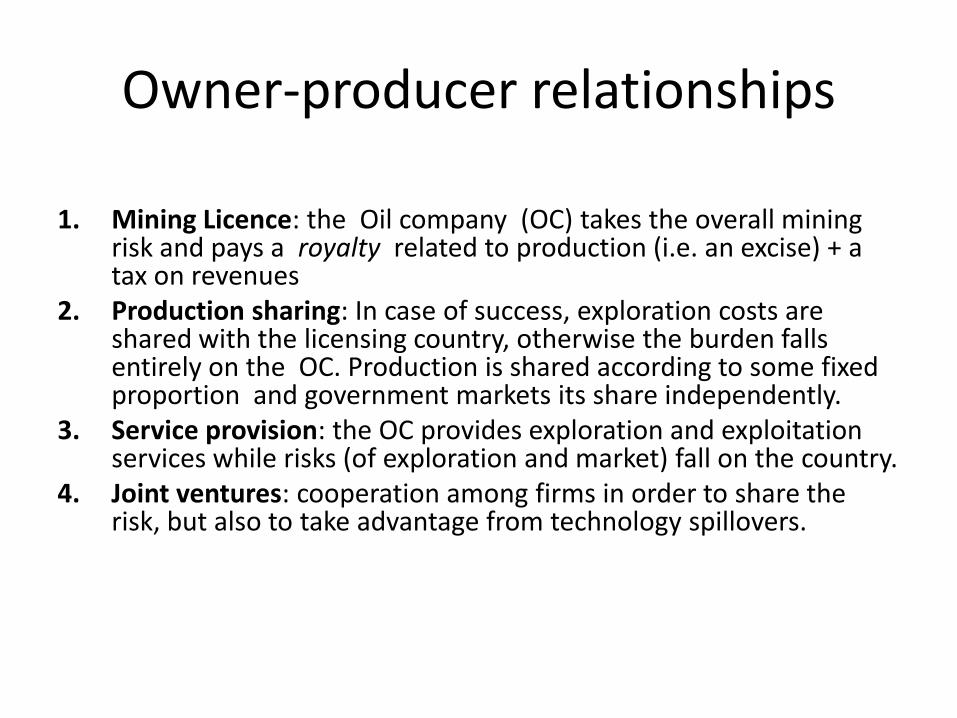
Owner-producer relationships
1. Mining Licence: the Oil company (OC) takes the overall mining
risk and pays a royalty related to production (i.e. an excise) + a tax on revenues
2. Production sharing: In case of success, exploration costs are shared with the licensing country, otherwise the burden falls entirely on the OC. Production is shared according to some fixed proportion and government markets its share independently.
3. Service provision: the OC provides exploration and exploitation services while risks (of exploration and market) fall on the country.
4. Joint ventures: cooperation among firms in order to share the risk, but also to take advantage from technology spillovers.
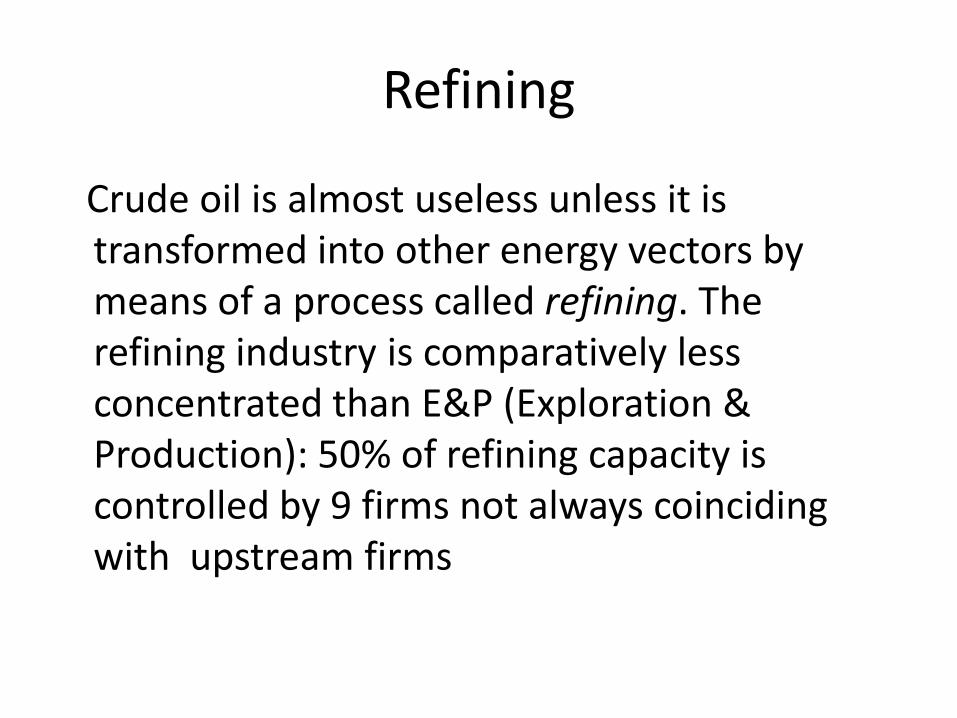
Refining
Crude oil is almost useless unless it is transformed into other energy vectors by means of a process called refining. The refining industry is comparatively less concentrated than E&P (Exploration & Production): 50% of refining capacity is controlled by 9 firms not always coinciding with upstream firms
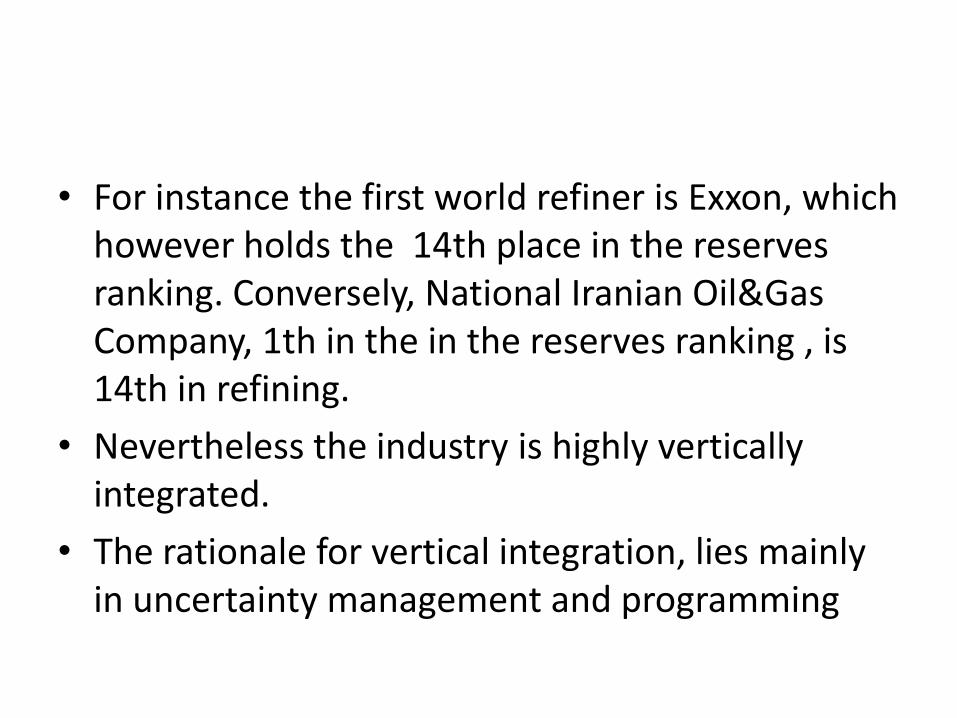
• For instance the first world refiner is Exxon, which however holds the 14th place in the reserves ranking. Conversely, National Iranian Oil&Gas Company, 1th in the in the reserves ranking , is 14th in refining.
• Nevertheless the industry is highly vertically integrated.
• The rationale for vertical integration, lies mainly in uncertainty management and programming
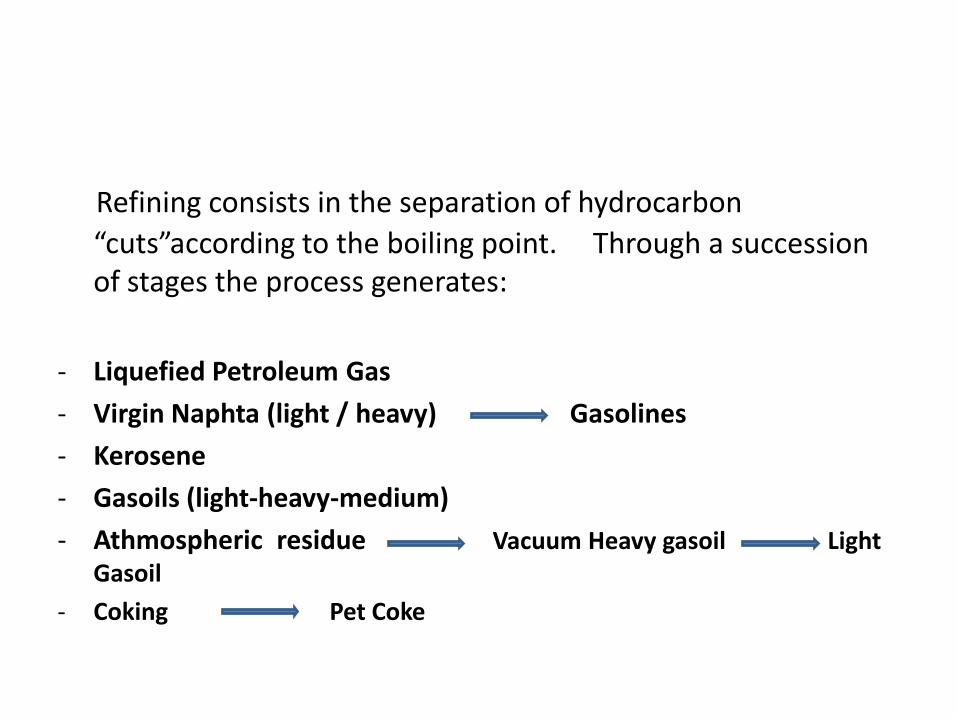
Refining consists in the separation of hydrocarbon
“cuts”according to the boiling point. Through a succession of stages the process generates:
- Liquefied Petroleum Gas
- Virgin Naphta (light / heavy) Gasolines
- Kerosene
- Gasoils (light-heavy-medium)
- Athmospheric residue Vacuum Heavy gasoil Light Gasoil
- Coking Pet Coke
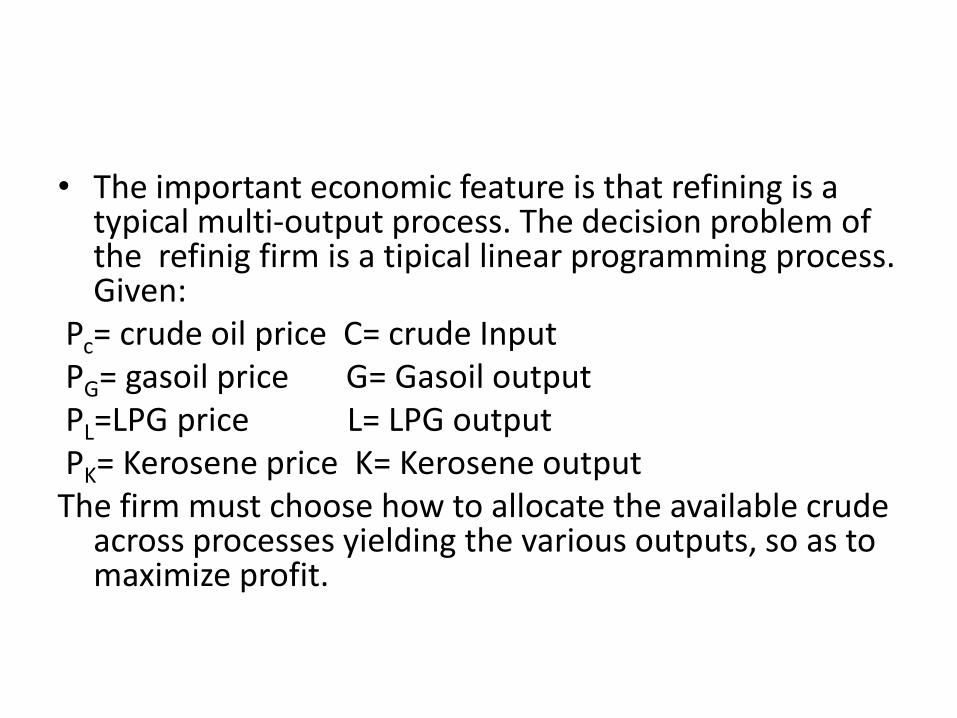
• The important economic feature is that refining is a typical multi-output process. The decision problem of the refinig firm is a tipical linear programming process. Given:
Pc= crude oil price C= crude Input PG= gasoil price G= Gasoil output PL=LPG price L= LPG output PK= Kerosene price K= Kerosene output The firm must choose how to allocate the available crude
across processes yielding the various outputs, so as to maximize profit.
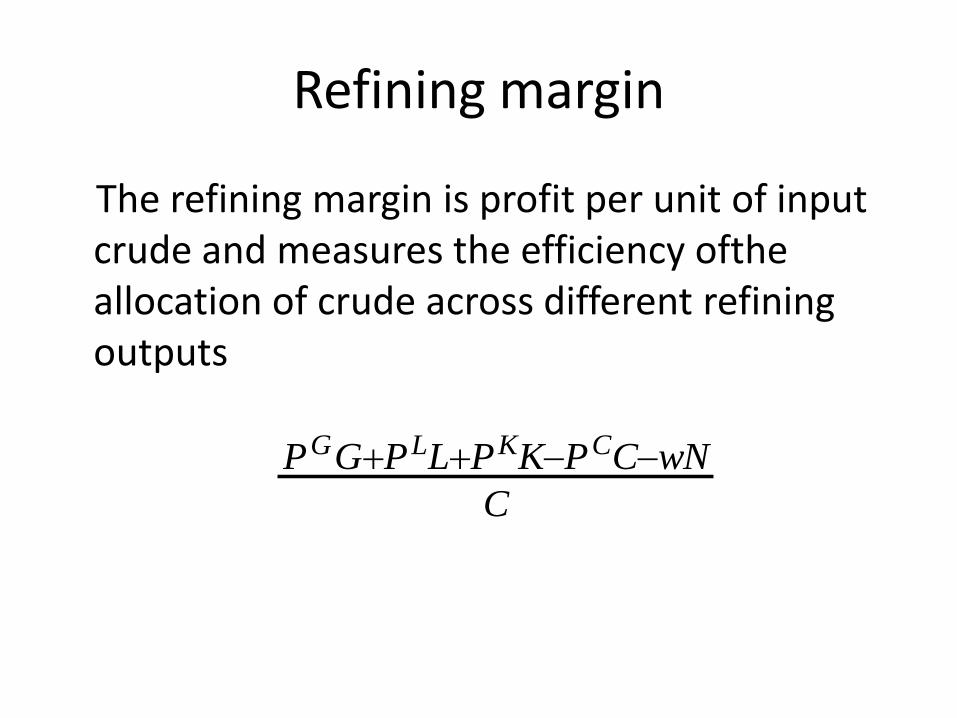
Refining margin
The refining margin is profit per unit of input crude and measures the efficiency ofthe allocation of crude across different refining outputs
PGGPLLPKKPCCwN
C
-5,00
0,00
5,00
10,00
15,00
20,00
25,00
30,00
1Q
92
4Q
92
3Q
93
2Q
94
1Q
95
4Q
95
3Q
96
2Q
97
1Q
98
4Q
98
3Q
99
2Q
00
1Q
01
4Q
01
3Q
02
2Q
03
1Q
04
4Q
04
3Q
05
2Q
06
1Q
07
4Q
07
3Q
08
2Q
09
1Q
10
4Q
10
3Q
11
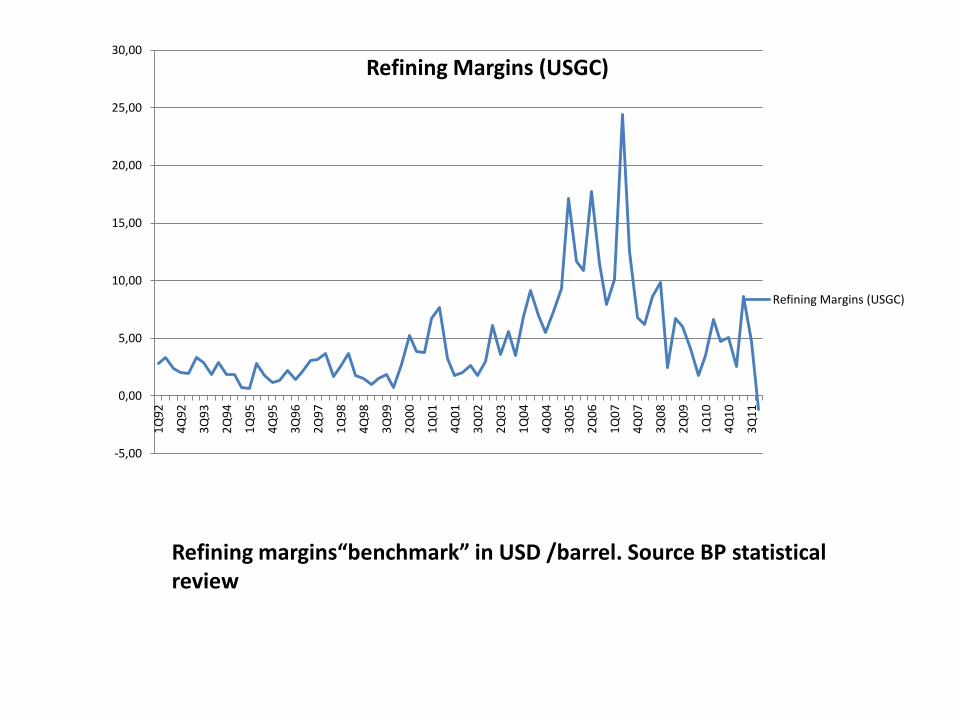
Refining Margins (USGC)
Refining Margins (USGC)
Refining margins“benchmark” in USD /barrel. Source BP statistical review
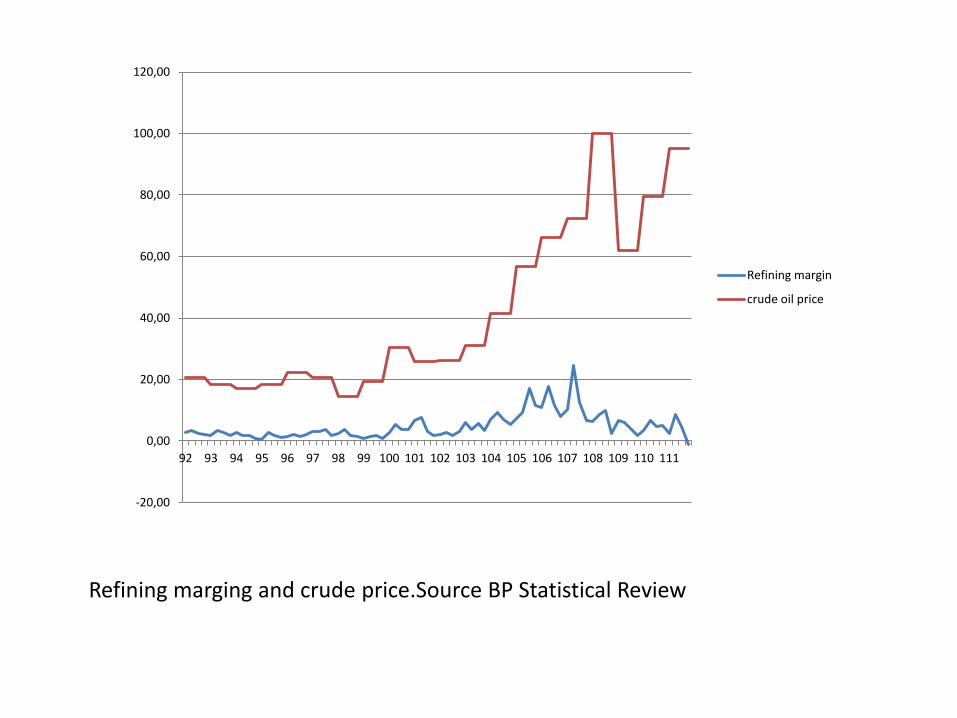
-20,00
0,00
20,00
40,00
60,00
80,00
100,00
120,00
92 93 94 95 96 97 98 99 100 101 102 103 104 105 106 107 108 109 110 111
Refining margin
crude oil price
Refining marging and crude price.Source BP Statistical Review
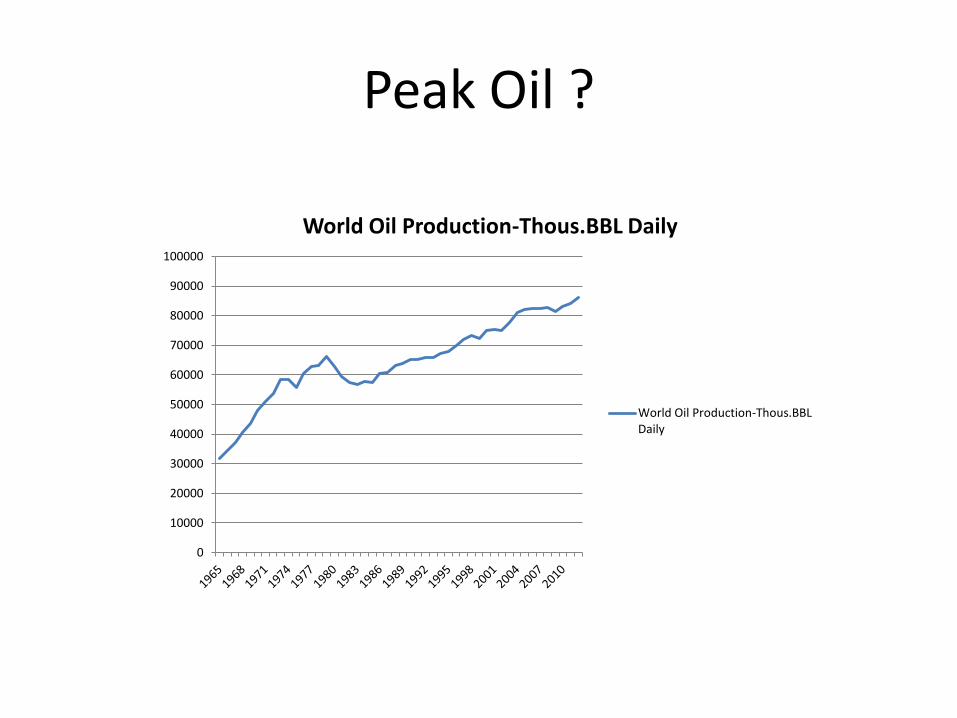
Peak Oil ?
0
10000
20000
30000
40000
50000
60000
70000
80000
90000
100000
World Oil Production-Thous.BBL Daily
World Oil Production-Thous.BBL Daily
0
5000
10000
15000
20000
25000
30000
35000
40000
19
65
19
68
19
71
19
74
19
77
19
80
19
83
19
86
19
89
19
92
19
95
19
98
20
01
20
04
20
07
20
10
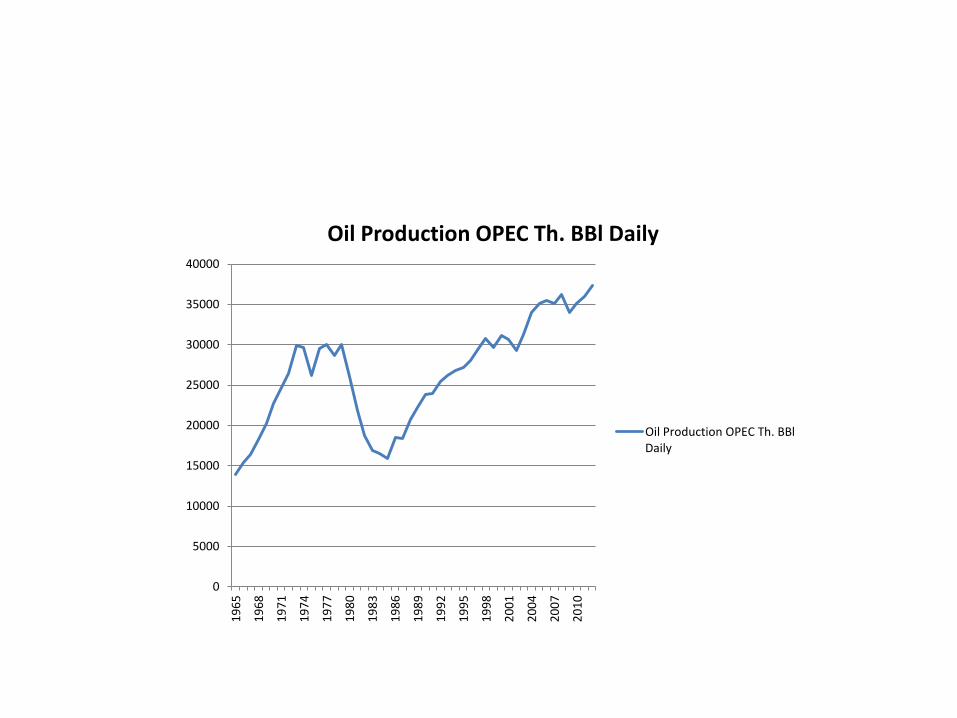
Oil Production OPEC Th. BBl Daily
Oil Production OPEC Th. BBl Daily
0
5000
10000
15000
20000
25000
30000
35000
40000
19
65
19
67
19
69
19
71
19
73
19
75
19
77
19
79
19
81
19
83
19
85
19
87
19
89
19
91
19
93
19
95
19
97
19
99
20
01
20
03
20
05
20
07
20
09
20
11
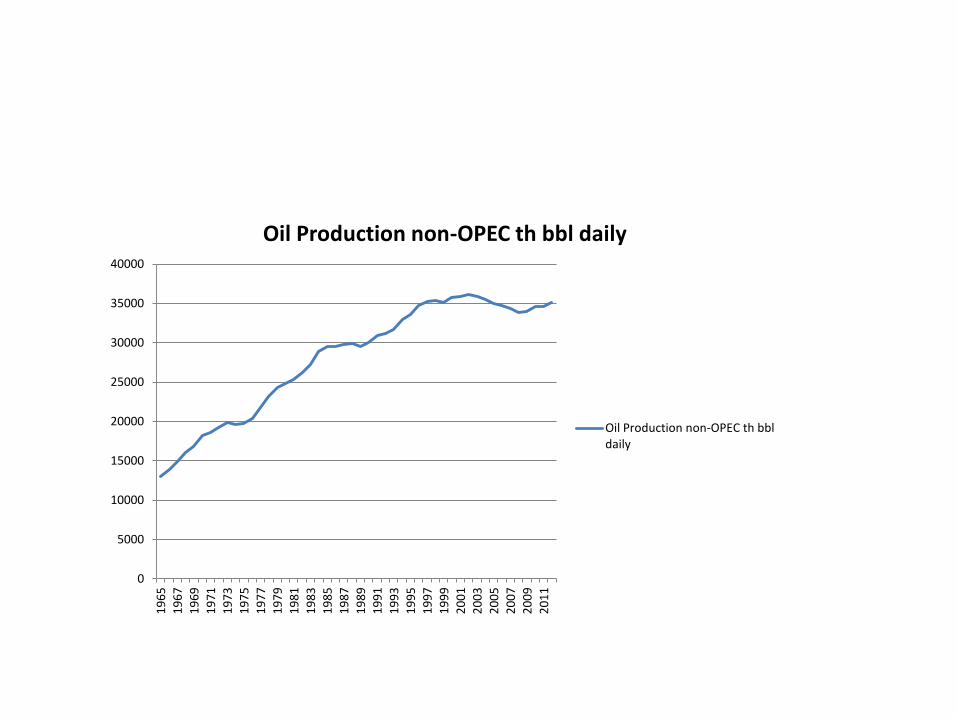
Oil Production non-OPEC th bbl daily
Oil Production non-OPEC th bbl daily
0
5000
10000
15000
20000
25000
19
65
1
96
7
19
69
1
97
1
19
73
1
97
5
19
77
1
97
9
19
81
1
98
3
19
85
1
98
7
19
89
1
99
1
19
93
1
99
5
19
97
1
99
9
20
01
2
00
3
20
05
2
00
7
20
09
2
01
1
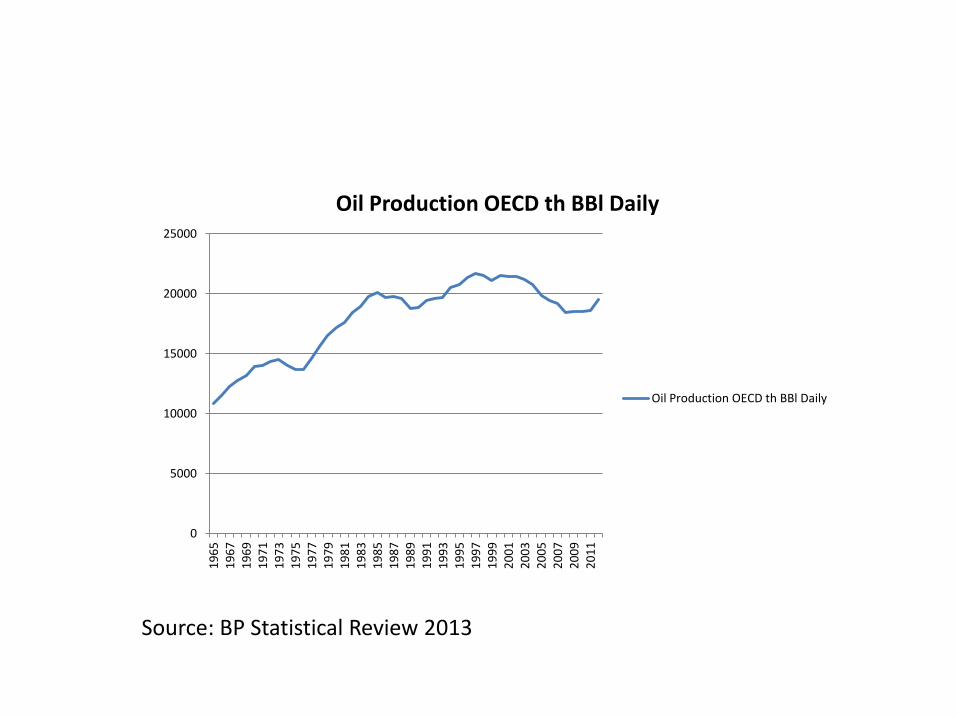
Oil Production OECD th BBl Daily
Oil Production OECD th BBl Daily
Source: BP Statistical Review 2013
0
500
1000
1500
2000
2500
3000
3500
4000
19
65
19
67
19
69
19
71
19
73
19
75
19
77
19
79
19
81
19
83
19
85
19
87
19
89
19
91
19
93
19
95
19
97
19
99
20
01
20
03
20
05
20
07
20
09
20
11
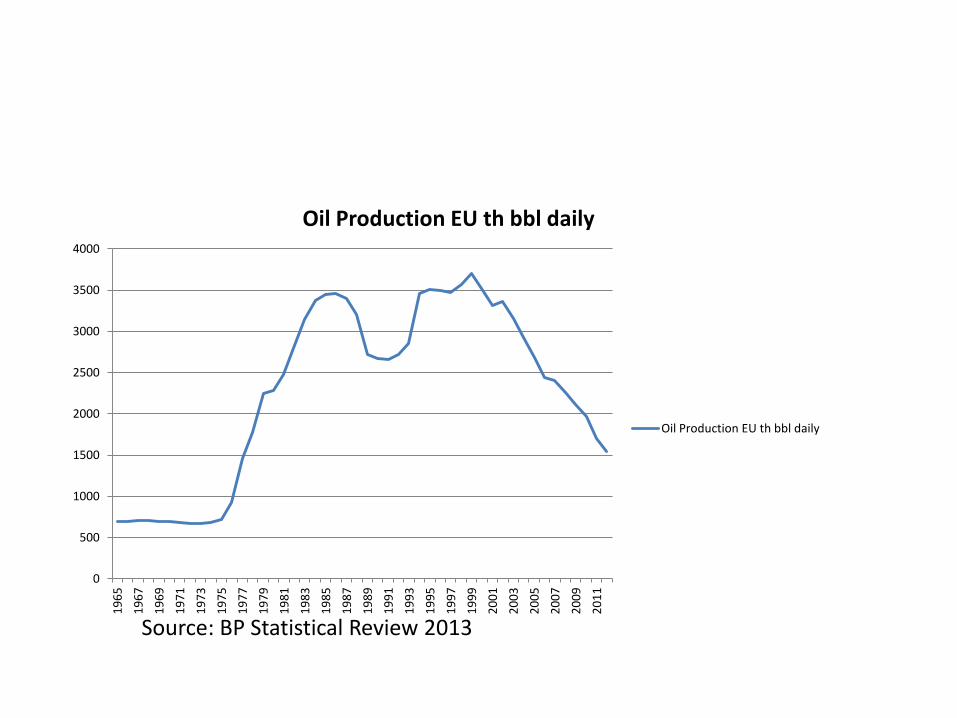
Oil Production EU th bbl daily
Oil Production EU th bbl daily
Source: BP Statistical Review 2013
0
2000
4000
6000
8000
10000
12000
14000
16000
19
65
19
67
19
69
19
71
19
73
19
75
19
77
19
79
19
81
19
83
19
85
19
87
19
89
19
91
19
93
19
95
19
97
19
99
20
01
20
03
20
05
20
07
20
09
20
11
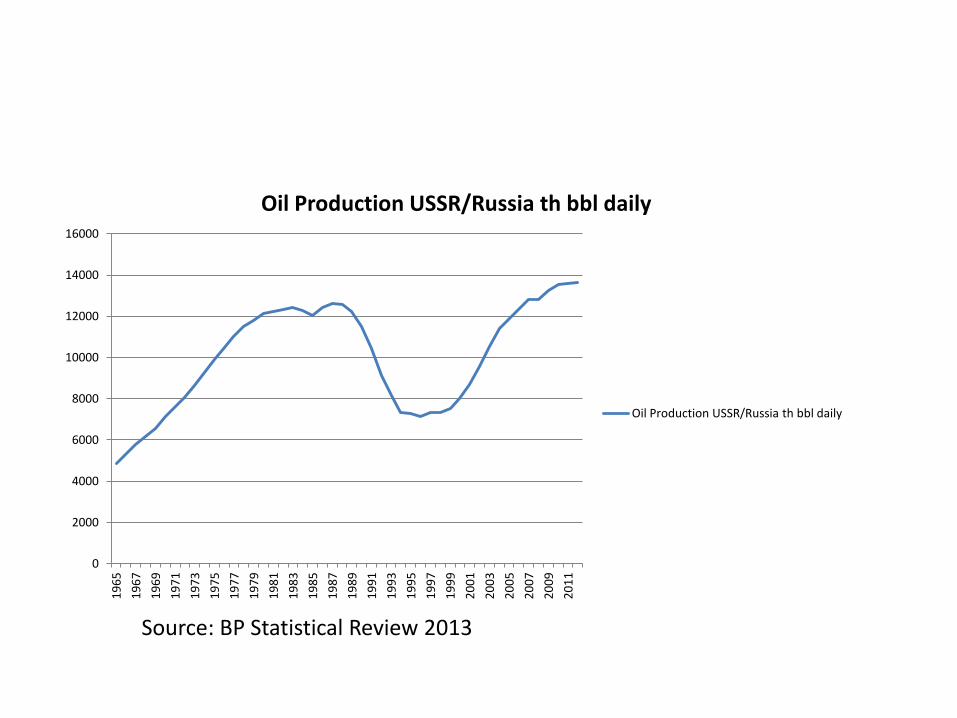
Oil Production USSR/Russia th bbl daily
Oil Production USSR/Russia th bbl daily
Source: BP Statistical Review 2013