Embed Size (px)
Citation preview

Copyright © 2014 The Brattle Group, Inc.
P r e s ented to
P r e pared b y
Energy and Capacity Markets: Tradeoffs in Reliability, Costs, and Risks
Harvard Electricity Policy Group Seventy-Fourth Plenary Session
Johannes P. Pfeifenberger Samuel A. Newell Kathleen Spees
F e b ruary 27 , 2014

| brattle.com 1
Content I. When might we need a capacity market? (Or do we really?)
II. Implications of ERCOT Report: Reliability, cost, and risk tradeoffs between energy-only and capacity markets
III. Highlights from FERC Report: Impacts of interties, price caps, DR
IV. Things to think about before implementing a capacity market
V. Policy implications
Appendix A: Additional FERC Study Results Appendix B: Characteristics of Successful Capacity Markets (Additional Detail) Appendix C: Additional Reading, Author Contacts, About Brattle
This presentation is based on the following two reports: ▀ Newell, Spees, Pfeifenberger, Karkatsouli, Wintermantel, and Carden, Estimating the
Economically Optimal Reserve Margin in ERCOT, Report prepared for The Public Utility Commission of Texas, The Brattle Group, January 31, 2014.
▀ Pfeifenberger, Spees, Carden, and Wintermantel, Resource Adequacy Requirements: Reliability and Economic Implications, Prepared for the Federal Energy Regulatory Commission (FERC), The Brattle Group, September 2013.

| brattle.com 2
I. When Might We Need Capacity Markets? Reserve-margin mandates (and the capacity market created by them) are generally
called for when energy-only markets do not attract “adequate” investments: ▀ Energy market designs that lead to price suppression? − Low price caps and inadequate scarcity pricing? − Poor integration of demand-response resources? − Substantial locational differences not reflected in market prices? − Operational actions (e.g., dispatch of emergency resources) that depress clearing
prices? ▀ Challenging investment risks (e.g., in hydro-dominated markets)? ▀ Distortions created by out-of-market payments for some resources that lead to
over-supply or high costs? ▀ Incomplete or poorly-designed ancillary service markets? − Missing ramping products? − Not co-optimized with energy market? − Operational actions that depress clearing prices?
▀ Most Likely: Resource adequacy preferences (e.g., 1-in-10) higher than what even fully-efficient energy and A/S markets would provide

| brattle.com 3
II. Summary of Recent ERCOT Report ▀ The PUCT asked us to estimate the economically-optimal reserve margin in
ERCOT to inform their ongoing review of market design for resource adequacy.
▀ Under base case assumptions, we estimate reserve margins of: − 10.2% economic optimum − 11.5% in equilibrium of current energy market design (minimizes customer
cost) − 14.1% required to meet 1-in-10 reliability standard
▀ Enforcing a 1-in-10 reserve margin requirement at 14.1% (with or without a centralized capacity market) would increase long-run average customer costs by approximately 1% of retail rates relative to the 11.5% energy-only market in equilibrium : − Considered only energy and capacity price impacts − Potential additional benefits: risk mitigation, DR integration − Potential additional costs: implementation, added complexity, disputes

| brattle.com 4
85%
90%
95%
100%
105%
110%
0 50 100 150 200 250
Peak
Loa
d (%
of 5
0/50
Pea
k)
Hour of Year
2011 Weather
Weather-Normal Year
Weather-Normal Peak Load
II. Modeling Approach
▀ Implemented study with SERVM, a probabilistic multi-area reliability and economic modeling tool, representing: − Demand in ERCOT and external regions − Generation with randomized outages − Demand response of several types with differing
availability and emergency or economic triggers − Emergency procedures that ERCOT triggers in
shortage conditions
▀ Monte Carlo simulation of 7,500 full annual (hourly-sequential) simulations at each reserve margin
▀ Primary outputs reported at each reserve margin include: − Reliability metrics (LOLE, LOLH, EUE) − Economic costs (production costs, DR curtailment
costs, emergency intervention costs) − Market results (prices, energy margins)
Load Duration Curves Modeled (Peak Hours, Before DR Gross-Up or Forecast Error)

| brattle.com 5
II. Reliability-Based Reserve Margin Targets ▀ We estimated that a 14.1% reserve margin would be required to meet the traditional 1-
in-10 loss of load event (LOLE) standard; − At 11.5%, average LOLE is three times higher (with average MWh shed 25% higher)
▀ Results sensitive to: − Forward period at which supply decisions are locked in, and consequential load forecast error
(LFE) that needs to be considered in analysis (removing LFE drops the reserve margin to 12.6%) − Likelihood of extreme 2011 weather recurring treated at 1% chance in base case (raising it to
1/15 or equal chance would increase the reserve margin to 16.1%)

| brattle.com 6
II. Economically Optimal Reserve Margin
$34,800
$35,000
$35,200
$35,400
$35,600
$35,800
$36,0006.
0%
7.0%
7.9%
8.9%
9.8%
10.8
%
11.8
%
12.7
%
13.7
%
14.6
%
15.6
%
16.5
%
17.5
%
Tota
l Sys
tem
Cos
ts ($
Mill
ion/
Year
)
ERCOT Reserve Margin (% ICAP)
Firm Load SheddingRegulation ShortagesNon-Spinning Reserve ShortagesSpinning Reserve ShortagesPrice-Responsive DemandTDSP Load ManagementNon-Controllable LRs30-Minute ERS10-Minute ERSEmergency GenerationExternal System Costs (Above Baseline)Production Costs (Above $10B/Yr Baseline)Marginal CC Capital Costs
Economically Optimal Reserve Margin at 10.2%
Total System Costs across Planning Reserve Margins (risk neutral)
Notes: Total system costs include a large baseline of total system costs that do not change across reserve margins, including $15.2 B/year in transmission and distribution, $9.6 B/year in fixed costs for
generators other than the marginal unit, and $10B/year in production costs.

| brattle.com 7
II. Energy-Only Market Equilibrium ▀ Risk neutral, equilibrium
reserve margin determined by market forces, where supplier energy margins equal the gross Cost of New Entry (CONE)
▀ Current ERCOT market design results in 11.5% equilibrium reserve margin for base case (9-13% for sensitivity cases) − Equilibrium exceeds
economic optimum because administrative scarcity prices exceed marginal costs in some cases
▀ Significantly greater uncertainty of actual outcomes
$0
$50
$100
$150
$200
$250
$300
$350
7% 9% 11% 13% 15% 17%
CC E
nerg
y M
argi
ns ($
/kW
-yr)
CC CONE
Base Case
Base CaseOptimal RM
Base Case0.1 LOLE
Energy-only equilibrium RM is higher than optimumbecause prices sometimes exceed marginal cost
CC Energy Margins

| brattle.com 8
$0
$20
$40
$60
$80
$100
$120
$140
7% 9% 11% 13% 15% 17%
Equi
libri
um C
apac
ity
Pric
e ($
/kW
-y)
Reserve Margin (% ICAP)
CC CONE
0.1LOLE
Base Case Optimal RM
CC EnergyMargins
Equilibrium Capacity Price Net CONE = CONE - Energy Margins
II. Equilibrium Capacity Market Prices ▀ Capacity is valuable for
reserve margin requirements above the 11.5% energy-only equilibrium − Equilibrium capacity price set
by the market at Net CONE (gross CONE minus energy margins)
− 1-in-10 reliability at 14.1% requires average capacity price of $40/kW-yr ($30-$60/kW-y in sensitivity cases)
▀ Even at lower levels, a reserve margin mandate will prevent very low reserve margin outcomes, mitigate some boom-bust cycles, and make capacity more valuable than in equilibrium
Equilibrium Capacity Prices at different Reserve Margin Requirements

| brattle.com 9
II. Volatility in Spot Prices and Energy Margins
$0
$20
$40
$60
$80
$100
$120
$140
$160
$180
$200
7% 8% 9% 11% 12% 13% 14% 15% 17%
Ener
gy P
rice
($/M
Wh)
Reserve Margin (% ICAP)
Average
Median
95th Percentile
75th Percentile90th Percentile
5th Percentile
Energy-Only Equilibrium
$0
$50
$100
$150
$200
$250
$300
$350
$400
$450
$500
7% 8% 9% 11% 12% 13% 14% 15% 17%
CC E
nerg
y M
argi
n ($
/kW
-yr)
Reserve Margin (% ICAP)
CC CONEAverage
Median
95th Percentile
75th Percentile
90th Percentile
5th Percentile
Energy-Only Equilibrium
Load-Weighted Spot Energy Price Unhedged CC Energy Margins
▀ At 11.5% the average annual energy price is 20% higher than at 14%; average of top 10% of annual prices (unhedged) is 50% higher. Median prices significantly below average.

| brattle.com 10
II. Supplier Net Revenues
$0
$100
$200
$300
$400
$500
$600
$700
$800
7.9% 8.9% 9.8% 10.8% 11.8% 12.7% 13.7% 14.6% 15.6% 17.5%
Supp
lier N
et R
even
ues (
$/kW
-y)
Reserve Margin (ICAP %)
Capacity PaymentsLong-Run CapacityPrice Needed to Sustain Reserve MarginEnergy Margins
CC CONE
Top 10% of Years Unhedged
Top 10% of Years 80% Hedged
Infeasible EquilibriaSupplier Net Revenues
Exceed Investment Costs
Increasing Capacity PaymentsAssociated with Progressively Higher Administratively -Set Reserve Margins
Energy-Only Equilibrium 11.5% RM
Supplier Net Revenues On Average and in the Top 10% of Years
▀ Total supplier net revenues must reach CONE (on a long-run average basis) to attract new entry
▀ At higher reserve margin mandates, the source of revenues shifts from energy to capacity market (capacity makes up 32% of net revenues at 1-in-10)
▀ Volatility in supplier net revenues is reduced at higher reserve margins (but much of it can also be achieved through hedging)

| brattle.com 11
II. Total Customer Costs Total Customer Costs
On Average and in the Top 10% of Years
0¢
5¢
10¢
15¢
20¢
25¢
7.9% 8.9% 9.8% 10.8% 11.8% 12.7% 13.7% 14.6% 15.6% 17.5%
Cust
omer
Cos
ts (¢
/kW
h)
Reserve Margin (ICAP %)
Transmission and Distribution
Capacity
Energy
Top 10% of YearsUnhedged
Top 10% of Years80% Hedged
Energy-Only Equilibrium 11.5% RM
Increasing Capacity PaymentsAssociated with Progressively Higher Administratively-Set Reserve Margins
Infeasible EquilibriaSupplier Net Revenues
Exceed Investment Costs
▀ ERCOT customer costs are minimized at the energy-only equilibrium and increase if higher reserve margin mandates are imposed
▀ A 14.1% reserve margin mandate (at 1-in-10) would increase customer costs by approximately $400 mil/year or 1% in long-run equilibrium
▀ The near-term difference between energy-only and capacity markets is more substantial because energy prices are currently below equilibrium levels (excess capacity relative to energy-only equilibrium)

| brattle.com 12
II. Summary of Results from ERCOT Report Energy-Only Market Capacity Market at 1-in-10
Base Case Sensitivity Cases Base Case Sensitivity Cases
Equilibrium Reserve Margin (%) 11.5% 9.3%-12.9% 14.1% 12.6% - 16.1%
Realized ReliabilityLoss of Load Events (events/yr) 0.33 0.27 - 0.85 0.10 0.10 - 0.10Loss of Load Hours (hours/yr) 0.86 0.68 - 2.37 0.23 0.22 - 0.23Normalized EUE (% of MWh) 0.0004% 0.0003% - 0.0013% 0.0001% 0.00008% - 0.0001%
Economics in Average YearEnergy Price ($/MWh) $58 $58 - $60 $48 $46 - $53Capacity Price ($/kW-yr) $0 $0 - $0 $39 $30 - $60Supplier Net Revenue ($/kW-yr) $122 $97 - $122 $122 $97 - $122Average Customer Cost (¢/kWh) 10.1¢ 10.1¢ - 10.7¢ 10.2¢ 10.2¢ - 10.8¢Total Customer Costs ($B/Yr) $35.7 $35.7 - $37.8 $36.1 $36.0 - $38.3
Economics in Top 10% of YearsEnergy Price ($/MWh) $99 $95 - $102 $65 $58 - $77Capacity Price ($/kW-yr) $0 $0 - $0 $76 $30 - $116Supplier Net Revenue (Unhedged) ($/kW-yr) $362 $173 - $444 $249 $152 - $302Supplier Net Revenue (80% Hedged) ($/kW-yr) $244 $119 - $259 $193 $128 - $289Average Customer Cost (Unhedged) (¢/kWh) 15.1¢ 13.4¢ - 23.0¢ 12.9¢ 12.4¢ - 17.9¢Average Customer Cost (80% Hedged) (¢/kWh) 12.6¢ 9.8¢ - 21.8¢ 11.7¢ 10.2¢ - 17.7¢Total Customer Costs (Unhedged) ($B/Yr) $53.6 $37.4 - $81.5 $45.7 $43.9 - $63.3Total Customer Costs (80% Hedged) ($B/Yr) $44.7 $34.6 - $77.2 $41.5 $36.2 - $62.9

| brattle.com 13
III. FERC Study of Resource Adequacy ▀ Scope of September 2013 Study (released by FERC in Feb 2014):
− Assessed economic/reliability implications of different resource adequacy standards. − Examine the widely-used one-day-in-ten-years (1-in-10) loss of load standard and
compare it to alternative approaches to defining resource adequacy − Evaluate the implications of different resource adequacy standards from a customer
cost, societal cost, risk mitigation, market structure, and market design perspective. ▀ Documented wide differences in application of 1-in-10 standard
− 0.1 loss of load events (LOLE) per year interpretation is most widely used − 2.4 loss of load hours (LOLH) per year, economic reserve margins, and normalized
expected unserved energy (EUE) also applied ▀ Even different applications of 0.1 LOLE standard and calculation of reserve
margin have up to 5 percentage point impact on planning reserve margin − Different definition of “event” (e.g., load shed vs. operating reserve depletion) − Reserve margin based on name plate or de-rated capacity (e.g. for renewables) − Different treatment of intertie benefits, load growth uncertainty, etc.
▀ More explicit recognition of these wide difference would provide much-needed flexibility in market design for resource adequacy and flexibility needs

| brattle.com 14
III. ERCOT vs. FERC Study Design ▀ The study design for FERC was based on a hypothetical but realistic, medium-sized
“Study RTO” ▀ Unlike ERCOT, the Study RTO has significant transmission interconnections to three
similarly-sized neighboring regions − Realistic resource mix based on scaled NYISO, MISO, PJM, and Southern Company data − Weather (hourly load and renewable generation) based on actual TVA, MISO, PJM, and SoCo data
Study RTO 50,000 MW
Neighbor 3 30,000 MW
Neighbor 1 60,000 MW
Neighbor 2 40,000 MW
4,000 MW 4,000 MW
3,000 MW
3,000 MW
810 MW
280 MW
Mexico 10,000 MW
(Coahuila, Nuevo Leon, & Tamaulipas)
ERCOT 71,000 MW
5,180 MW
Entergy 27,000 MW
SPP 56,000 MW

| brattle.com 15
III. Sensitivity to Intertie Capacity Total System Costs vs. Reserve Margin
with Varying Intertie Assumptions ▀ Overall, the results in
FERC Study are very similar to ERCOT Report; however, difference in study scope provides additional insights on a number of topics
▀ Size of interconnection to neighboring system has large impact on both 1-in-10 (blue dots) and economically-optimal reserve margins (red dots)
▀ Strongly dependent reserve margins in neighboring systems

| brattle.com 16
III. Capacity Value of Demand Response ▀ Simulations of different levels of economic and (call-hour-limited) emergency DR
show significant benefits of DR with economically optimal levels in 8%-14% range − Lower total costs, improved scarcity pricing, lower capacity prices
▀ Capacity value decreases with higher penetration for: (a) emergency DR with call-hour limits and (b) economic DR with bid caps
Emergency DR’s Effective Load Carrying Capability (Varying DR Penetration and Call Hours)
Approximate Emergency DR Dispatch Hours at Varying DR Penetration Levels

| brattle.com 17
III. Impact of Price Caps
Energy Margins and Capacity Prices (“Missing Money”) at Different Price Caps
▀ Simulations show that price caps substantially reduce the equilibrium reserve margins that can be achieved by energy-only market
▀ Energy market prices capped at levels below $3,000/MWh significantly increase the “missing money” at any particular reserve margin
▀ Price caps shift necessary generator revenues from energy market to capacity market; reducing dispatch efficiencies and demand response during scarcity pricing periods

| brattle.com 18
III. Economic RM vs. Cost of New Entry Cost-Minimizing Reserve Margin with Varying CT CONE
(Risk-Neutral, Cost of Service Perspective) ▀ Economically-
optimal reserve margins decrease as the marginal cost of adding new resources increases
▀ Allows estimation of a capacity market “demand curve” that is not dependent on estimates for Net CONE

| brattle.com 19
III. Demand-Curves for Capacity Markets Cost-Minimizing Capacity Demand Curve from FERC Study
vs. Current RTO Demand Curves ▀ Economically-
determined demand curves for capacity are in the general range of RTOs’ actual demand curve
▀ Very sensitive to market structure (such as interties with neighboring systems) and market design features (such as price caps)

| brattle.com 20
IV. Characteristics of Successful Capacity Markets Experience from the last decade strongly suggests that successful capacity markets require:
1. Well-defined resource adequacy objectives and drivers 2. Clear understanding why market design is deficient without capacity
market (inefficient or not able to achieve resource adequacy targets) 3. Clearly-defined capacity products, consistent with needs 4. Well-defined obligations, auctions, verifications, and monitoring 5. Efficient spot markets for energy and ancillary services 6. Addressing locational reliability challenges 7. Participation from all resource types 8. Carefully-designed forward obligations 9. Staying power to reduce regulatory risk while improving designs and
addressing deficiencies 10. Capitalizing and building on experience from other markets
| brattle.com 21
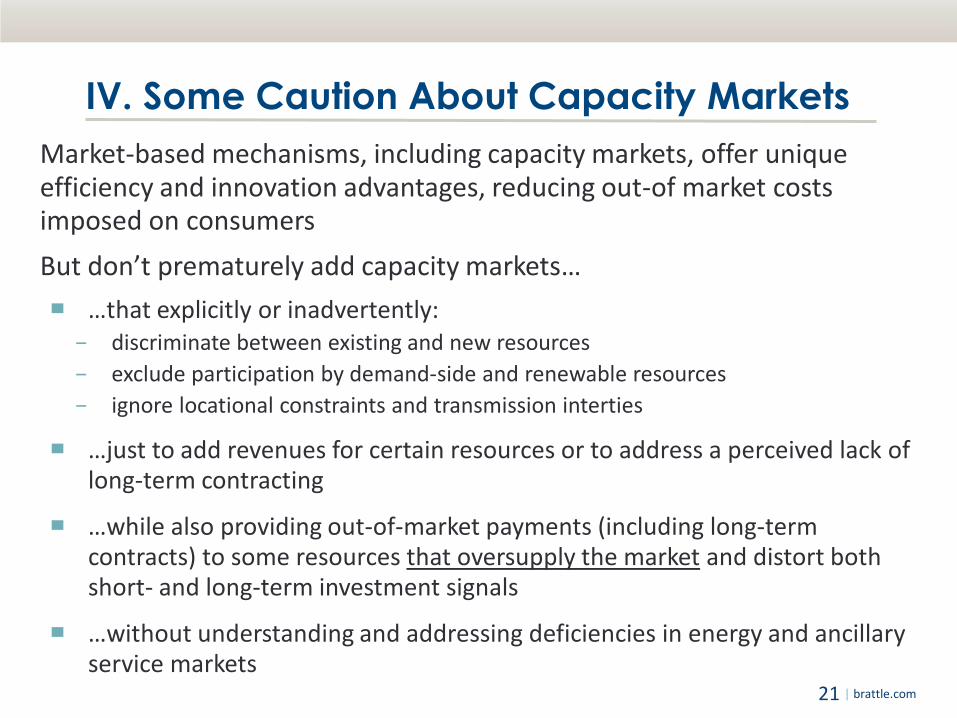
IV. Some Caution About Capacity Markets Market-based mechanisms, including capacity markets, offer unique efficiency and innovation advantages, reducing out-of market costs imposed on consumers But don’t prematurely add capacity markets… ▀ …that explicitly or inadvertently:
− discriminate between existing and new resources − exclude participation by demand-side and renewable resources − ignore locational constraints and transmission interties
▀ …just to add revenues for certain resources or to address a perceived lack of long-term contracting
▀ …while also providing out-of-market payments (including long-term contracts) to some resources that oversupply the market and distort both short- and long-term investment signals
▀ …without understanding and addressing deficiencies in energy and ancillary service markets

| brattle.com 22
V. Policy Implications ▀ The most appropriate market design (and reserve margin) depends on a
regions’ policy objectives and risk tolerance: − Energy-Only Market: likely the most appropriate design if economic efficiency
is the primary policy objective, and the anticipated reserve margin, outage levels, and potential for periodic scarcity events is sustainable from a public policy perspective
− Mandated Reserve Margins (e.g., implemented with Capacity Market): likely the most appropriate design if maintaining physical resource adequacy standards is the primary policy concern or policy makers wish to prevent potential low-reliability, high-cost events (thereby creating potential long-run benefits through risk-mitigation)
▀ Addressing this market design question appears to be less pressing while reserve margins are high, but doing so before reserve margins fall will:
− Enable market participants to plan investment and contracting decisions under less regulatory uncertainty, and
− If opting for a reserve margin mandate, provide sufficient time to carefully develop and implement the market design to avoid design flaws introduced through hasty implementation

Appendix A: Additional FERC Study Results

| brattle.com 24
Uncertainties Considered in FERC Study
Economic Load Forecast Error vs. Forward Planning Period
▀ Key uncertainties considered in FERC Study: − Forced/planned generation outages and intertie-transmission derates − Weather-related impacts on load and renewable generation (32 weather years) − Economic load-growth uncertainty over range of forward periods (1 to 10 years, 4-yr base)
▀ Administrative scarcity pricing, reserve depletion, DR- and emergency-generation
Study RTO Summer Peak Load under Different Weather Profiles

| brattle.com 25
FERC Study Results Planning Reserve Margins Required to
Meet Different Physical Reliability Standards

| brattle.com 26
FERC Study Results Distribution of Loss of Load Hours at 12% Planning Reserve Margin
Across Months (Left) and Across Simulation Years (Right)

| brattle.com 27
FERC Study Results: Spot Energy Prices Price Duration Curve at the Equilibrium Reserve Margin

| brattle.com 28
Sensitivities: Physical and Economic RM Reliability-Based and Economically-Based Reserve Margin Targets
(Across Base and Sensitivity Case Simulations)
Simulation Reliability-Based Risk-Neutral, Cost-Minimizing 0.1 LOLE 2.4 LOLH 0.001%
Normalized EUECost-of-Service
PerspectiveSocietal
Perspective
Base Case 15.2% 8.2% 9.6% 10.3% 7.9%
Lower Price Caps$1,000 Price Cap Case 15.2% 8.2% 9.6% 8.7% 7.9%$3,000 Price Cap Case 15.2% 8.2% 9.6% 9.5% 7.9%
Smaller System Size40% Size Case 14.8% <6% 7.5% <6% <6%40% Size and Transmission 15.1% 6.9% 8.1% <6% <6%
Neighbor AssistanceLong Neighbors Case 13.0% <6% 7.0% 8.0% <6%50% Transmission Case 15.8% 9.8% 10.0% 12.3% 10.5%Island Case 18.5% 16.5% 15.8% 16.5% 16.5%
Marginal CC Case 15.3% 8.3% 9.8% 10.1% 7.7%

| brattle.com 29
Additional Sensitivities: Economic RM Sensitivity of Economically Optimal Reserve Margin to Economic Study Assumptions
(Risk Neutral, Cost-of-Service Perspective)
Reserve Margin Range Base Case Low/High Sensitivity(% ICAP)
Base Case 10.30% n/a n/a
Emergency Event CostsEmergency Generation 10.2% - 10.5% $500/MWh $250 - $1000/MWhEmergency DR 9.9% - 10.9% $2000/MWh $1000 - $3000/MWhEmergency Hydro 10.2% - 10.5% $3,000/MWh $1,500 - $6,000/MWhVoltage Reduction 10.2% - 10.4% $7,000/MWh $3,500 - $14,000/MWhVOLL 10.0% - 11.6% $7,500/MWh $3,750 - $15,000/MWhAll Emergency Event Costs 9.2% - 12.1% Base 50% or 200% Base
Other AssumptionsLoad Forecast Error 9.4% - 11.0% 4 Years Forward 2 Years - 6 YearsCONE 9.5% - 11.3% $120/kW-y $100 - $140/kW-yTransmission Ownership 8.3% - 12.3% 50/50 Ownership Importer/Exporter Owns

Appendix B: Characteristics of Successful Capacity Markets
(additional detail)

| brattle.com 31
Characteristics of Successful Capacity Markets 1. Well-defined resource adequacy objectives and drivers
▀ Meet seasonal/annual peak loads or ramping/flexibility constraints?
▀ Drivers of the identified needs?
▀ System-wide or location-specific due to transmission constraints?
▀ Near-term vs. multi-year forward deficiencies? Uncertainty of projected multi-year forward needs?
▀ Ability of all demand- and supply-side resources , including interties, to meet the identified need?

| brattle.com 32
Characteristics of Successful Capacity Markets 2. Clear understanding why the market design is inefficient or will
not achieve resource adequacy targets without a capacity market ▀ Energy market designs that lead to price suppression? − Low price caps and inadequate scarcity pricing? − Poor integration of demand-response resources? − Substantial locational differences not reflected in market prices? − Operational actions that depress clearing prices?
▀ Challenging investment risks (e.g., in hydro-dominated markets)? ▀ Distortions created by out-of-market payments for some resources
that lead to over-supply or high costs? ▀ Incomplete or poorly-designed ancillary service markets? − Missing ramping products? − Not co-optimized with energy market? − Operational actions that depress clearing prices?
▀ Most Likely: Resource adequacy preferences higher than what even fully-efficient energy and ancillary service markets would provide

| brattle.com 33
Characteristics of Successful Capacity Markets 3. Clearly-defined capacity products, consistent with needs
▀ Annual and seasonal capability ▀ Near-term or multi-year forward obligations ▀ Peak load carrying vs. ramping capability ▀ Effective load carrying capability and outage rates of different
resource types (including renewables, demand-response, and interties)
▀ Integration with energy and ancillary service markets
4. Well-defined obligations, auctions, verifications, monitoring, and penalties ▀ Ensure quality of resources and compliance without creating
inadvertent bias against certain resources (e.g., demand-response, intermittent resources, imports)

| brattle.com 34
Characteristics of Successful Capacity Markets 5. Efficient spot markets for energy and ancillary services
▀ Capacity markets can “patch-up” deficiencies in energy and ancillary service markets from a resource adequacy perspective
▀ Less efficient investment signals (e.g., resource types, supply- vs. demand-side resources, locations) if deficiencies in energy and ancillary service are not addressed
6. Addressing locational reliability challenges ▀ Resource adequacy won’t be addressed efficiently if reliability
concerns are locational but capacity markets aren’t
▀ Requires locational resource adequacy targets and market design
▀ Requires understanding of how transmission (including interties between power markets) affect resource adequacy

| brattle.com 35
Characteristics of Successful Capacity Markets 7. Participation from all resource types
▀ Existing and new generating plants ▀ Conventional, renewable/intermittent, and distributed generation ▀ Load (demand response) ▀ Interties (actively committed imports vs. resource adequacy value of
uncommitted interties)
8. Carefully-designed forward obligations ▀ Efficiency of near-term obligations (avoid forecasting uncertainty,
adjust to changes in market conditions, reduced commitment risk) ▀ Benefits of multi-year forward obligations (competition between
new and existing resources; forward visibility; financial certainty) ▀ Questionable need for forward commitments greater than 3-4 years ▀ Avoid capacity markets as substitute for long-term contracts

| brattle.com 36
Characteristics of Successful Capacity Markets 9. Staying power to reduce regulatory risk while improving
designs ▀ Staying power of market design reduces regulatory risk and
improves investment climate ▀ Requires careful balancing of staying power and the need to
improve design elements and address deficiencies ▀ Challenge due to strong financial interests of different stakeholders
10. Capitalizing and building on experience from other markets ▀ Regional difference are important but often overstated ▀ Avoid the “not invented here” syndrome ▀ Avoid “urban myths” (e.g., no new generation built in regions with
capacity markets; insufficient to support merchant investments unless 5-10 year payments can be locked in)

Appendix C: Additional Reading,
About the Authors and Brattle
| brattle.com 38
Additional Reading Newell, Spees, Pfeifenberger, Karkatsouli, Wintermantel, Carden. Estimating the Economically Optimal
Reserve Margin in ERCOT, Report prepared for the PUCT, January 31, 2014. Pfeifenberger. Market-based Approaches to Resource Adequacy, IESO Stakeholder Summit, Feb. 11, 2014. Pfeifenberger, Spees. Characteristics of Successful Capacity Markets, APEx Conference, October 31, 2013. Pfeifenberger, Spees, Carden and Wintermantel, Resource Adequacy Requirements: Reliability and
Economic Implications, Report prepared for FERC, September 2013. Spees, Newell, Pfeifenberger. “Capacity Markets: Lessons Learned from the First Decade,” Economics of
Energy & Environmental Policy. Vol. 2, No. 2, September 2013. Spees, Pfeifenberger. “PJM’s Energy and Capacity Markets: Outlook on Fundamentals,” 12th Annual Power
&Utility Conference, Goldman Sachs, August 8, 2013. Pfeifenberger, Spees. “Evaluation of Market Fundamentals and Challenges to Long-Term System Adequacy
in Alberta’s Electricity Market,” March 2013 (Update) and April 2011 (Original Study). Pfeifenberger. “Structural Challenges with California’s Current Forward Procurement Construct.” CPUC
and CAISO Long-Term Resource Adequacy Summit. San Francisco, February 26, 2013 Newell, Spees. “Get Ready for Much Spikier Energy Prices: The Under-Appreciated Market Impacts of
Displacing Generation with Demand Response.” February 2013. Pfeifenberger, Spees, Newell. “Resource Adequacy in California: Options for Improving Efficiency and
Effectiveness,” October 2012. Newell, Spees, Pfeifenberger, Mudge, DeLucia, Carlton, “ERCOT Investment Incentives and Resource
Adequacy,” June 2012.
| brattle.com 39
Additional Reading (cont’d) Pfeifenberger, Newell. “Trusting Capacity Markets: Does the Lack of Long-Term Pricing Undermine the
Financing of New Power Plants?” Public Utilities Fortnightly. December 2011. Pfeifenberger, Newell, Spees, Hajos, Madjarov. “Second Performance Assessment of PJM’s Reliability
Pricing Model: Market Results 2007/08 through 2014/15.” August 26, 2011. Spees, Newell, Carlton, Zhou, Pfeifenberger. “Cost of New Entry Estimates for Combustion Turbine and
Combined-Cycle Plants in PJM.” August 24, 2011. Carden, Pfeifenberger and Wintermantel. “The Economics of Resource Adequacy Planning: Why Reserve
Margins Are Not Just About Keeping the Lights On.” NRRI Report 11-09. April 2011. Newell, Spees, Hajos. “The Midwest ISO’s Resource Adequacy Construct: An Evaluation of Market Design
Elements.” The Brattle Group, January 19, 2010. Newell, Bhattacharyya, Madjarov. “Cost-Benefit Analysis of Replacing the NYISO’s Existing ICAP Market
with a Forward Capacity Market." June 15, 2009. LaPlante, Chao, Newell, Celebi, Hajos. “Internal Market Monitoring Unit Review of the Forward Capacity
Market Auction Results and Design Elements.” ISO New England and The Brattle Group. June 5, 2009. Pfeifenberger, Spees. “Best Practices in Resource Adequacy.” PJM Long Term Capacity Issues Symposium.
January 27, 2010. Pfeifenberger, Spees, Schumacher. “A Comparison of PJM's RPM with Alternative Energy and Capacity
Market Designs.” September 2009. Pfeifenberger, Newell, Earle, Hajos, Geronimo. “Review of PJM's Reliability Pricing Model (RPM).” June 30,
2008. Reitzes, Pfeifenberger, Fox-Penner, Basheda, Garcia, Newell, Schumacher. “Review of PJM’s Market Power
Mitigation Practices in Comparison to Other Organized Electricity Markets,” September 2007.

| brattle.com 40
Author Contact Information JOHANNES P. PFEIFENBERGER Principal │ Cambridge, MA [email protected] +1.617.234.5624
SAMUEL A. NEWELL Principal │ Cambridge, MA [email protected] +1.617.234.5725 KATHLEEN SPEES Senior Associate │ Cambridge, MA [email protected] +1.617.234.5783

| brattle.com 41
About the Brattle Group The Brattle Group provides consulting and expert testimony in economics, finance, and regulation to corporations, law firms, and governmental agencies worldwide.
We combine in-depth industry experience and rigorous analyses to help clients answer complex economic and financial questions in litigation and regulation, develop strategies for changing markets, and make critical business decisions.
Our services to the electric power industry include:
▀ Climate Change Policy and Planning ▀ Cost of Capital ▀ Demand Forecasting Methodology ▀ Demand Response and Energy Efficiency ▀ Electricity Market Modeling ▀ Energy Asset Valuation ▀ Energy Contract Litigation ▀ Environmental Compliance ▀ Fuel and Power Procurement ▀ Incentive Regulation
▀ Rate Design and Cost Allocation ▀ Regulatory Strategy and Litigation Support ▀ Renewables ▀ Resource Planning ▀ Retail Access and Restructuring ▀ Risk Management ▀ Market-Based Rates ▀ Market Design and Competitive Analysis ▀ Mergers and Acquisitions ▀ Transmission

| brattle.com 42
Offices
Cambridge New York San Francisco Washington, DC
London Rome Madrid
NORTH AMERICA
EUROPE