Embed Size (px)
Citation preview
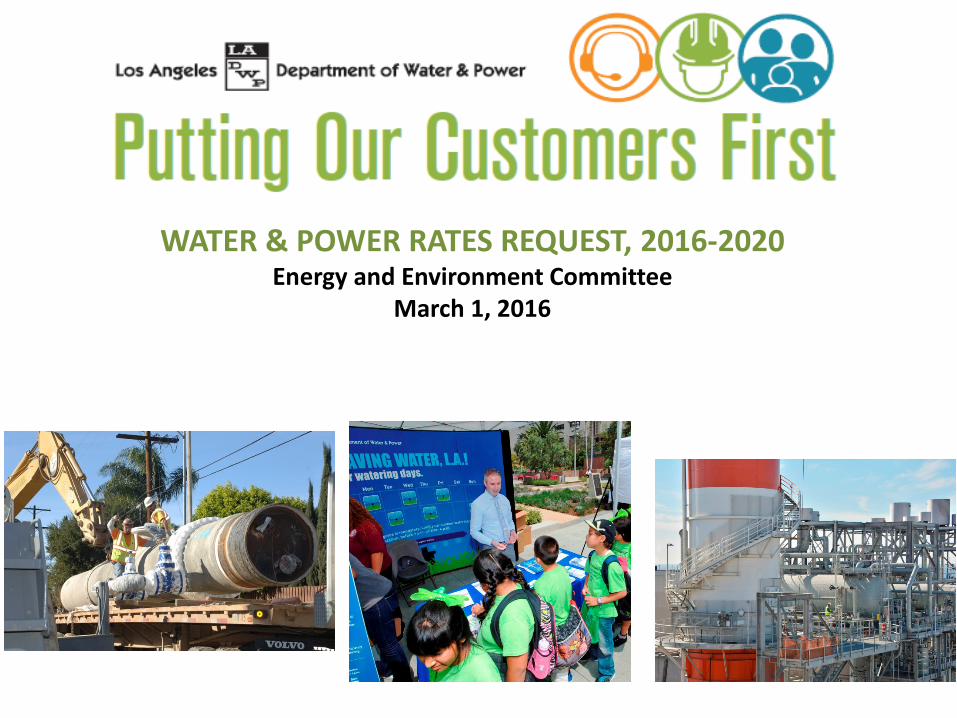
WATER & POWER RATES REQUEST, 2016-2020 Energy and Environment Committee
March 1, 2016
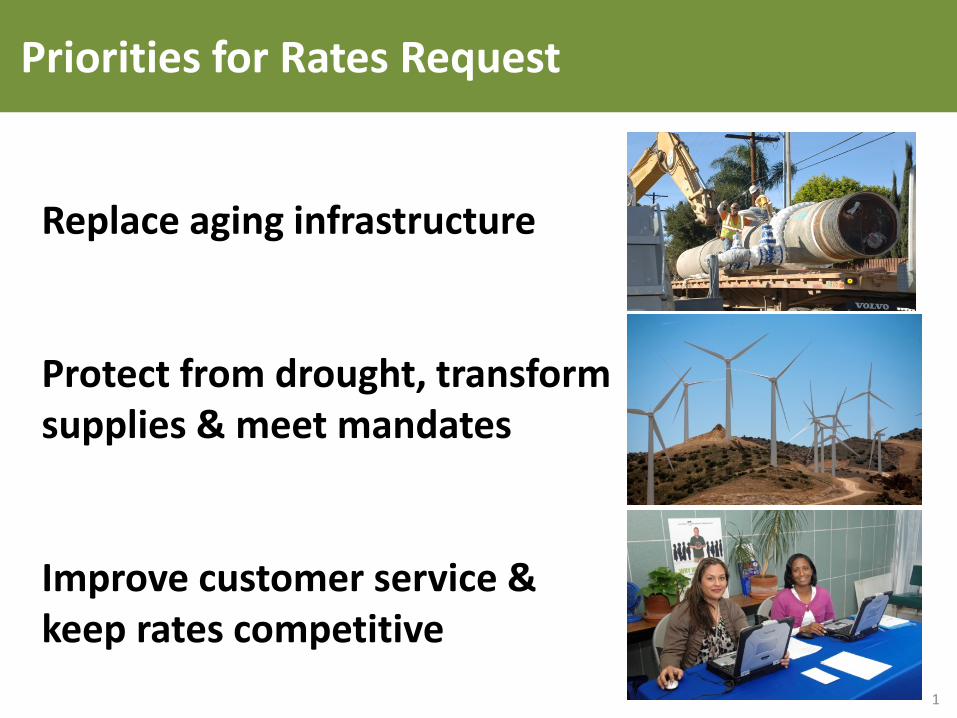
Priorities for Rates Request
1
Replace aging infrastructure Protect from drought, transform supplies & meet mandates Improve customer service & keep rates competitive
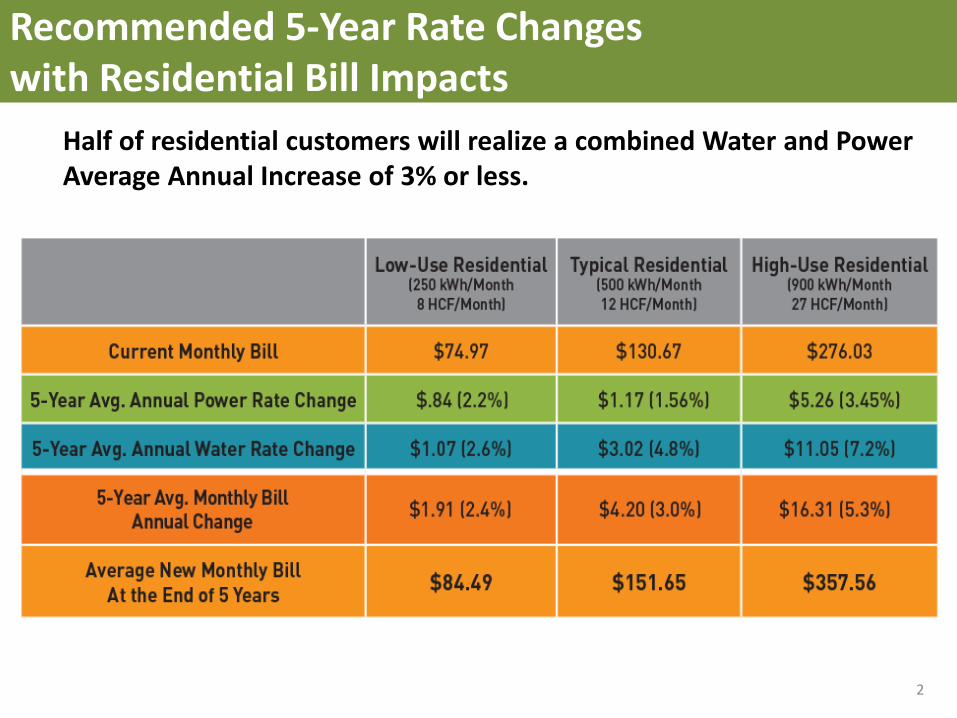
Recommended 5-Year Rate Changes with Residential Bill Impacts
2
Half of residential customers will realize a combined Water and Power Average Annual Increase of 3% or less.
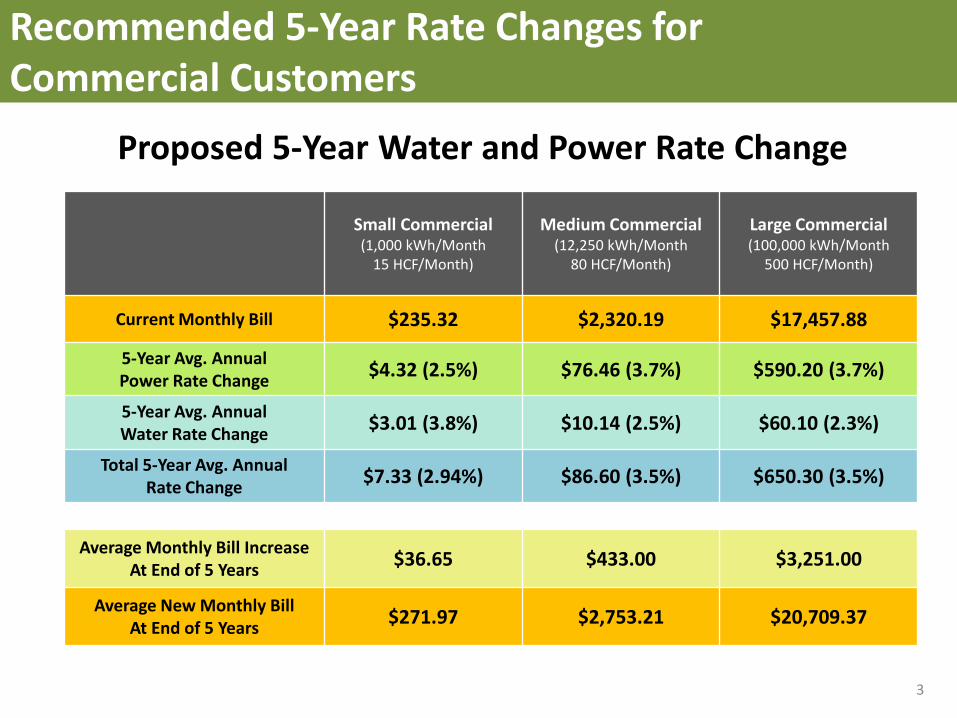
Recommended 5-Year Rate Changes for Commercial Customers
3
Proposed 5-Year Water and Power Rate Change
Small Commercial (1,000 kWh/Month
15 HCF/Month)
Medium Commercial (12,250 kWh/Month
80 HCF/Month)
Large Commercial (100,000 kWh/Month
500 HCF/Month)
Current Monthly Bill $235.32 $2,320.19 $17,457.88
5-Year Avg. Annual Power Rate Change $4.32 (2.5%) $76.46 (3.7%) $590.20 (3.7%)
5-Year Avg. Annual Water Rate Change $3.01 (3.8%) $10.14 (2.5%) $60.10 (2.3%)
Total 5-Year Avg. Annual Rate Change $7.33 (2.94%) $86.60 (3.5%) $650.30 (3.5%)
Average Monthly Bill Increase
At End of 5 Years $36.65 $433.00 $3,251.00
Average New Monthly Bill At End of 5 Years $271.97 $2,753.21 $20,709.37
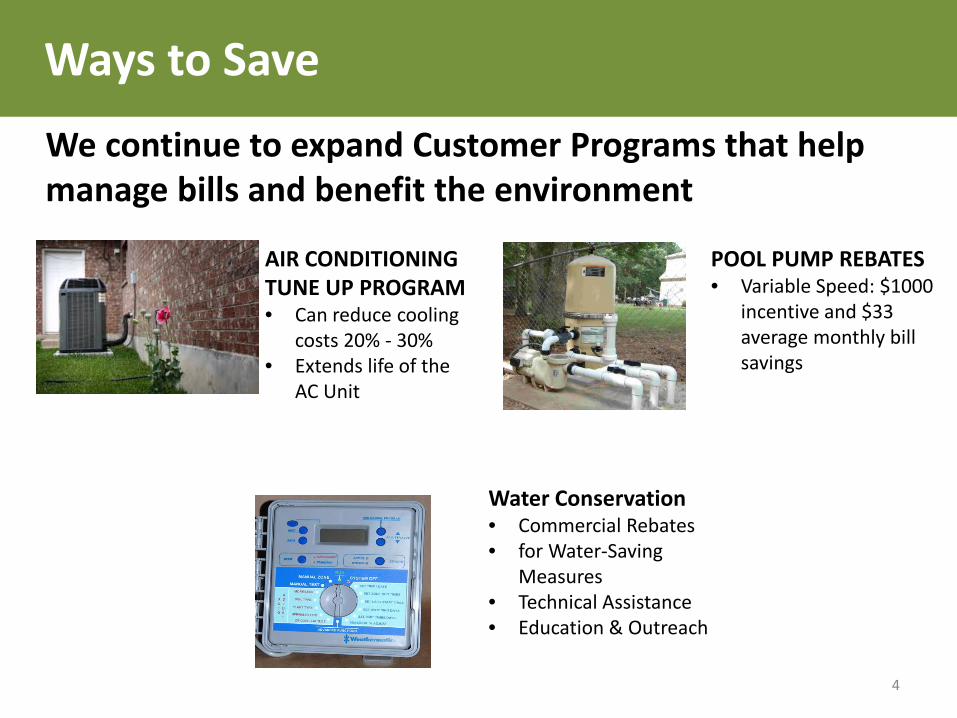
Ways to Save
We continue to expand Customer Programs that help manage bills and benefit the environment
POOL PUMP REBATES • Variable Speed: $1000
incentive and $33 average monthly bill savings
AIR CONDITIONING TUNE UP PROGRAM • Can reduce cooling
costs 20% - 30% • Extends life of the
AC Unit
Water Conservation • Commercial Rebates • for Water-Saving
Measures • Technical Assistance • Education & Outreach
4
POWER RATE ACTION
5
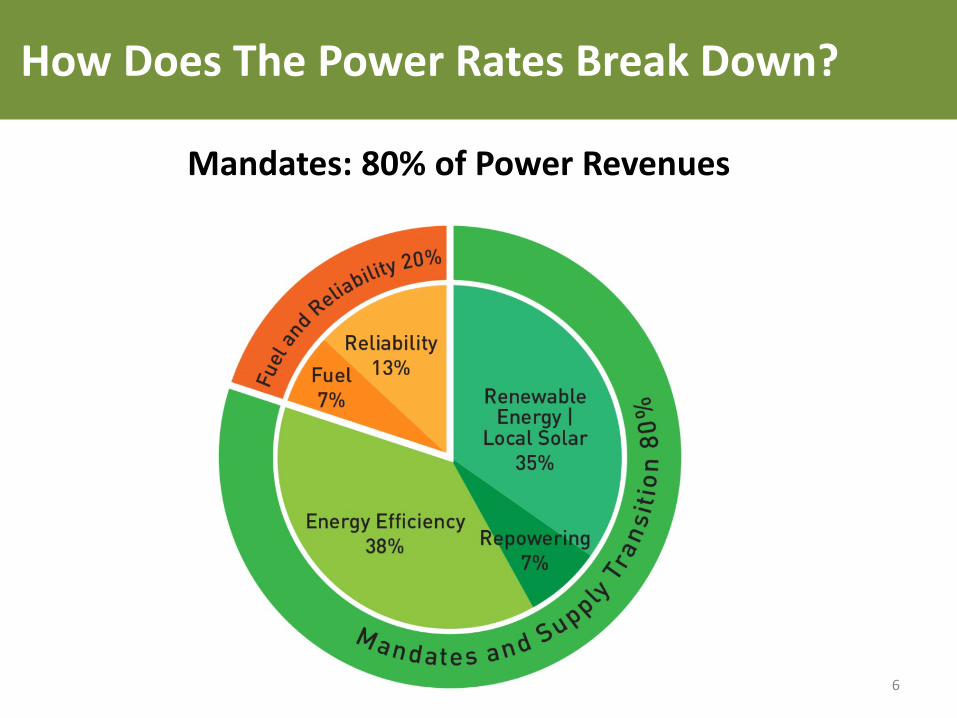
How Does The Power Rates Break Down?
Mandates: 80% of Power Revenues
6
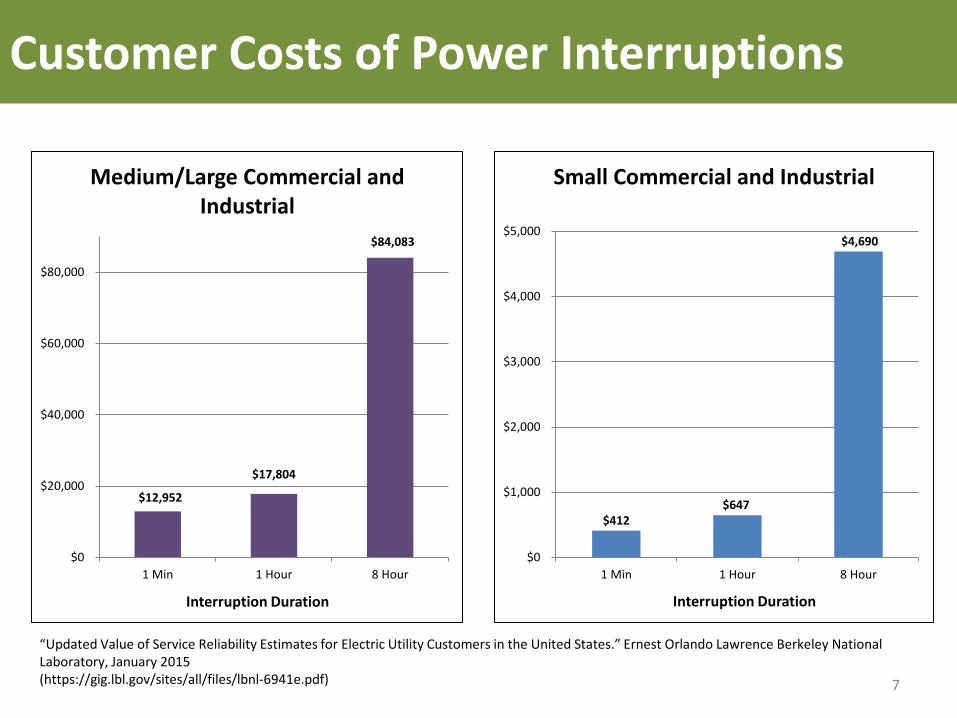
Customer Costs of Power Interruptions
$12,952
$17,804
$84,083
$0
$20,000
$40,000
$60,000
$80,000
1 Min 1 Hour 8 Hour
Interruption Duration
Medium/Large Commercial and Industrial
$412 $647
$4,690
$0
$1,000
$2,000
$3,000
$4,000
$5,000
1 Min 1 Hour 8 Hour
Interruption Duration
Small Commercial and Industrial
“Updated Value of Service Reliability Estimates for Electric Utility Customers in the United States.” Ernest Orlando Lawrence Berkeley National Laboratory, January 2015 (https://gig.lbl.gov/sites/all/files/lbnl-6941e.pdf) 7
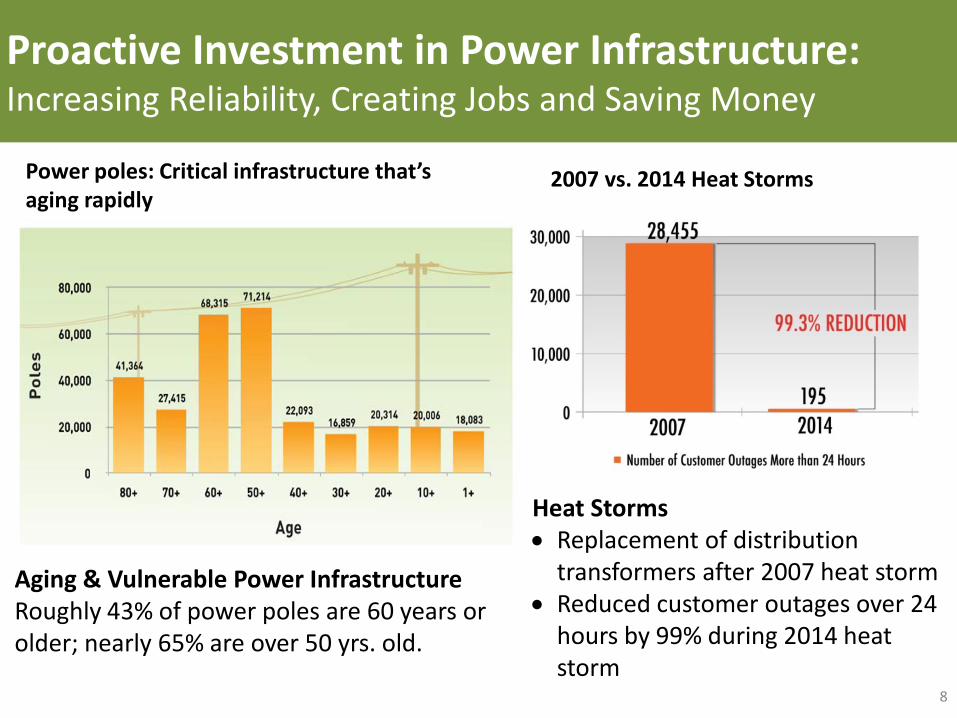
Proactive Investment in Power Infrastructure: Increasing Reliability, Creating Jobs and Saving Money
8
Aging & Vulnerable Power Infrastructure Roughly 43% of power poles are 60 years or older; nearly 65% are over 50 yrs. old.
Power poles: Critical infrastructure that’s aging rapidly
2007 vs. 2014 Heat Storms
Heat Storms • Replacement of distribution
transformers after 2007 heat storm • Reduced customer outages over 24
hours by 99% during 2014 heat storm
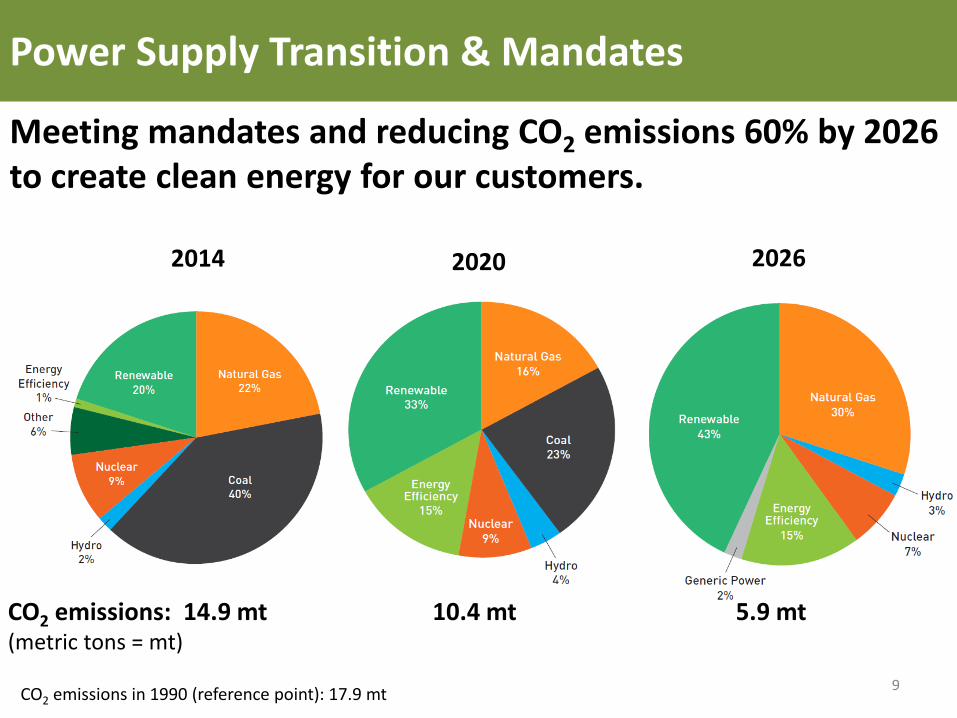
Power Supply Transition & Mandates
Meeting mandates and reducing CO2 emissions 60% by 2026 to create clean energy for our customers.
2014 2020
9
2026
CO2 emissions: (metric tons = mt)
14.9 mt 10.4 mt 5.9 mt
CO2 emissions in 1990 (reference point): 17.9 mt
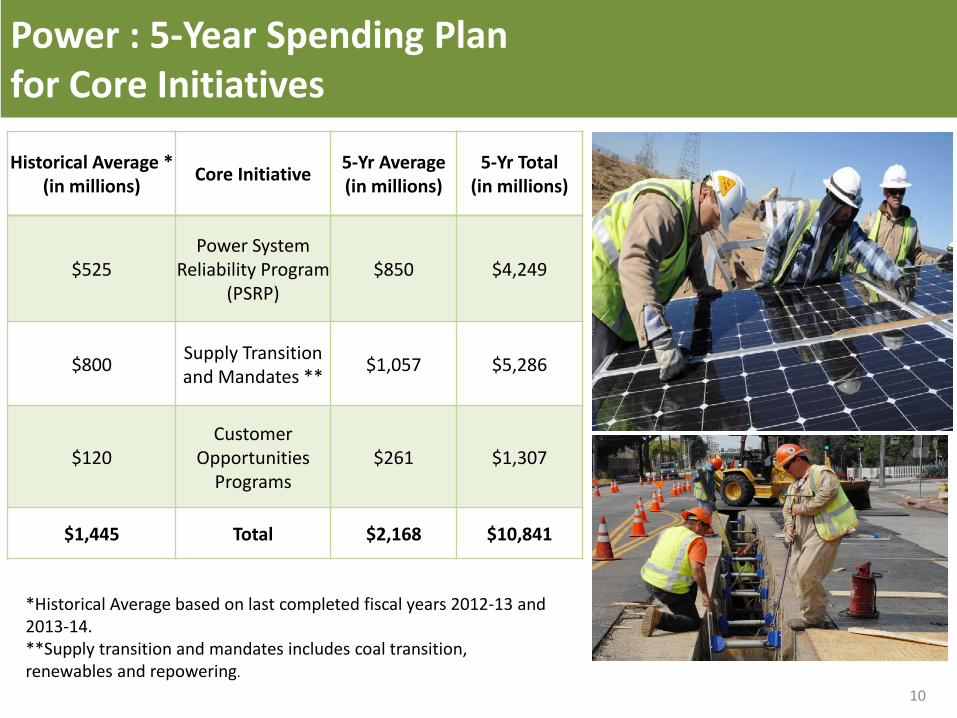
Power : 5-Year Spending Plan for Core Initiatives
10
*Historical Average based on last completed fiscal years 2012-13 and 2013-14. **Supply transition and mandates includes coal transition, renewables and repowering.
Historical Average * (in millions) Core Initiative 5-Yr Average
(in millions) 5-Yr Total
(in millions)
$525 Power System
Reliability Program (PSRP)
$850 $4,249
$800 Supply Transition and Mandates ** $1,057 $5,286
$120 Customer
Opportunities Programs
$261 $1,307
$1,445 Total $2,168 $10,841
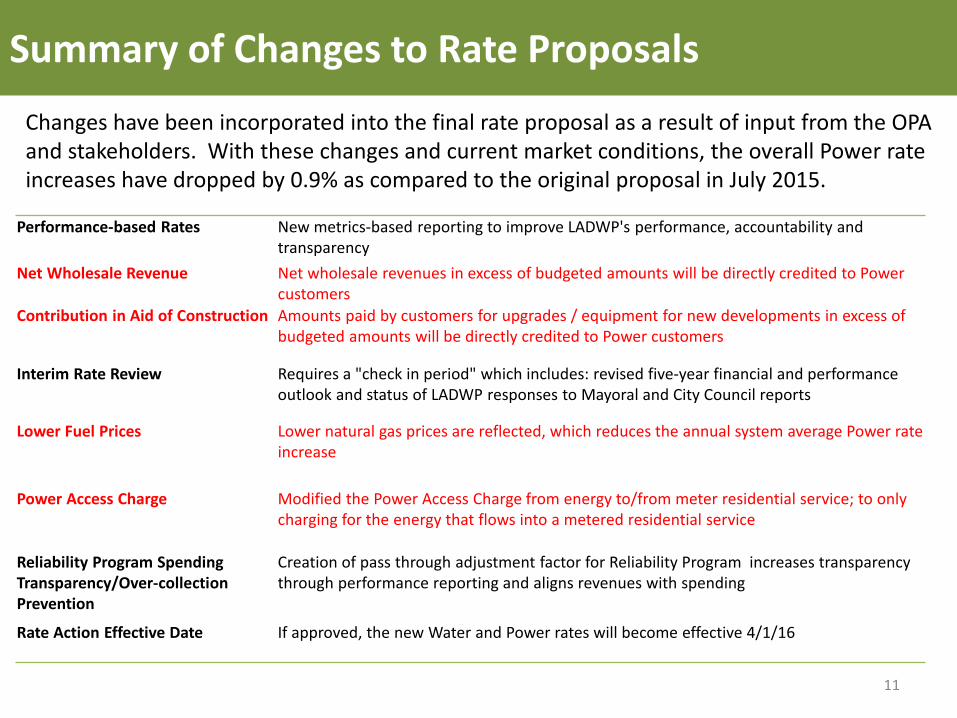
Summary of Changes to Rate Proposals
11
Performance-based Rates New metrics-based reporting to improve LADWP's performance, accountability and transparency
Net Wholesale Revenue Net wholesale revenues in excess of budgeted amounts will be directly credited to Power customers
Contribution in Aid of Construction Amounts paid by customers for upgrades / equipment for new developments in excess of budgeted amounts will be directly credited to Power customers
Interim Rate Review Requires a "check in period" which includes: revised five-year financial and performance outlook and status of LADWP responses to Mayoral and City Council reports
Lower Fuel Prices Lower natural gas prices are reflected, which reduces the annual system average Power rate increase
Power Access Charge Modified the Power Access Charge from energy to/from meter residential service; to only charging for the energy that flows into a metered residential service
Reliability Program Spending Transparency/Over-collection Prevention
Creation of pass through adjustment factor for Reliability Program increases transparency through performance reporting and aligns revenues with spending
Rate Action Effective Date If approved, the new Water and Power rates will become effective 4/1/16
Changes have been incorporated into the final rate proposal as a result of input from the OPA and stakeholders. With these changes and current market conditions, the overall Power rate increases have dropped by 0.9% as compared to the original proposal in July 2015.
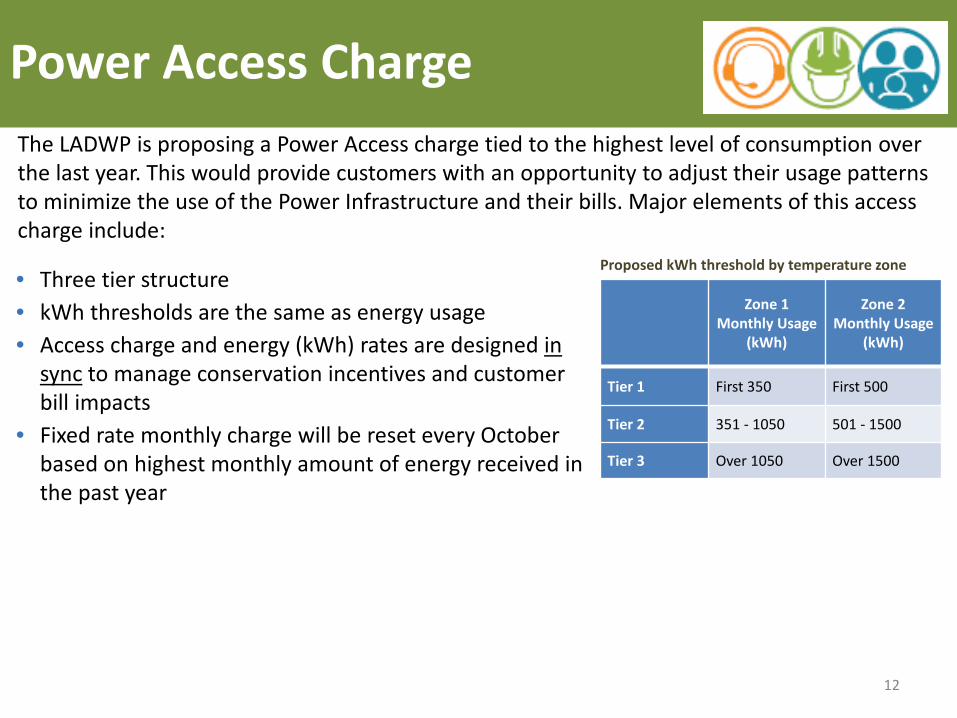
Power Access Charge
12
• Three tier structure • kWh thresholds are the same as energy usage • Access charge and energy (kWh) rates are designed in
sync to manage conservation incentives and customer bill impacts
• Fixed rate monthly charge will be reset every October based on highest monthly amount of energy received in the past year
Zone 1 Monthly Usage
(kWh)
Zone 2 Monthly Usage
(kWh)
Tier 1 First 350 First 500
Tier 2 351 - 1050 501 - 1500
Tier 3 Over 1050 Over 1500
The LADWP is proposing a Power Access charge tied to the highest level of consumption over the last year. This would provide customers with an opportunity to adjust their usage patterns to minimize the use of the Power Infrastructure and their bills. Major elements of this access charge include:
Proposed kWh threshold by temperature zone
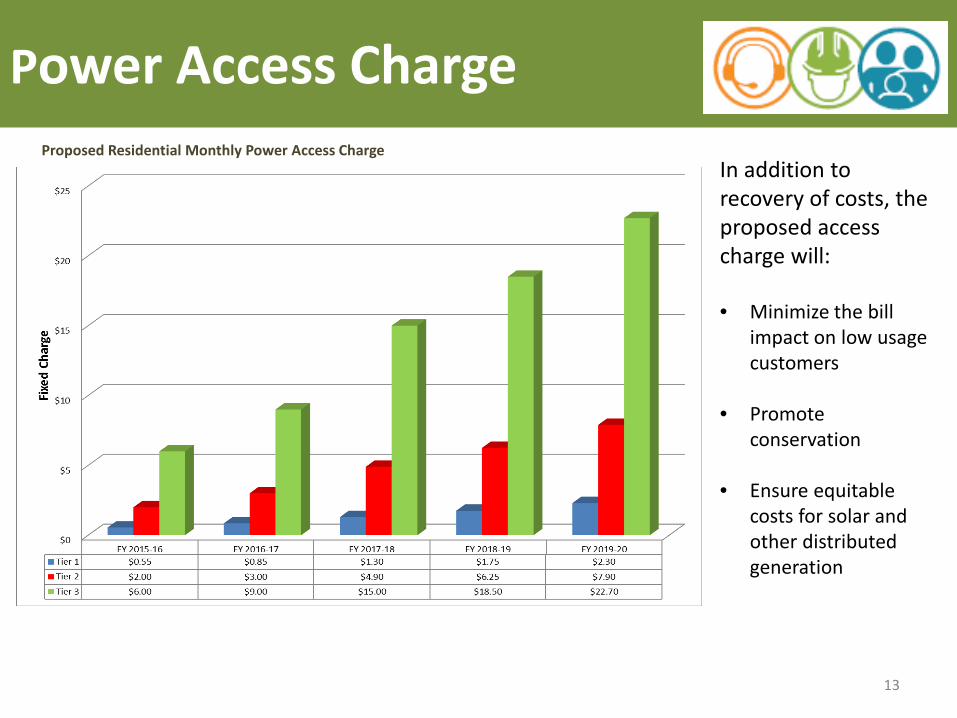
Power Access Charge
13
Proposed Residential Monthly Power Access Charge In addition to recovery of costs, the proposed access charge will: • Minimize the bill
impact on low usage customers
• Promote conservation
• Ensure equitable costs for solar and other distributed generation

Appendix
14
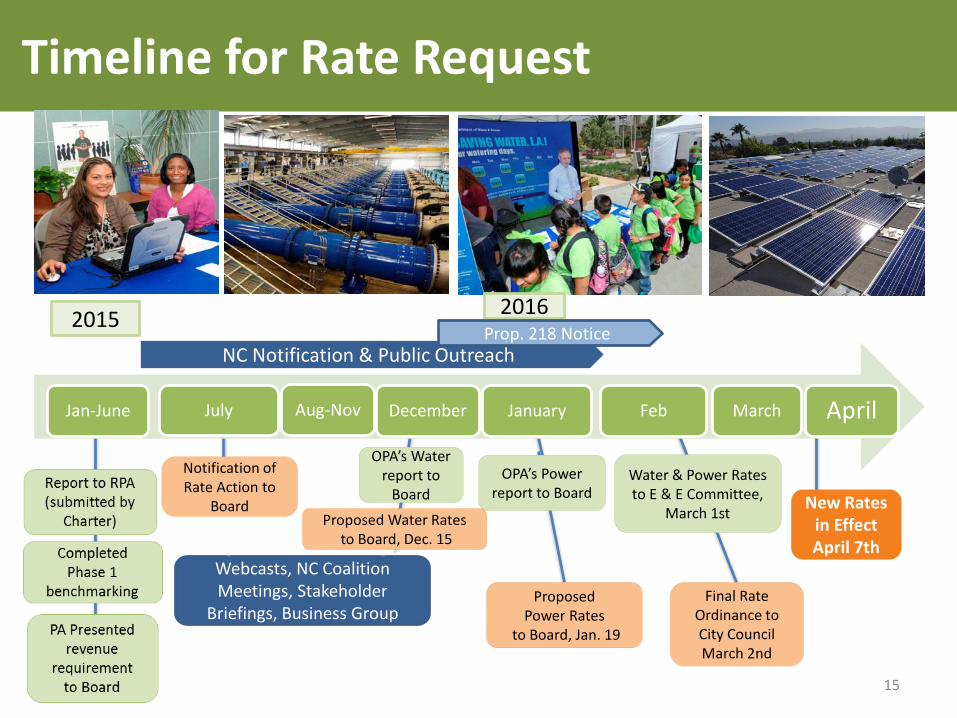
Timeline for Rate Request
15
Jan-June July Aug-Nov December January Feb March April
2015 2016
Notification of Rate Action to
Board
Regional Public Meetings, Webcasts, NC Coalition Meetings, Stakeholder
Briefings, Business Group Presentations
OPA’s Water report to
Board
Proposed Water Rates to Board, Dec. 15
Water & Power Rates to E & E Committee,
March 1st
Final Rate Ordinance to City Council March 2nd
NC Notification & Public Outreach Prop. 218 Notice
Proposed Power Rates
to Board, Jan. 19
OPA’s Power report to Board
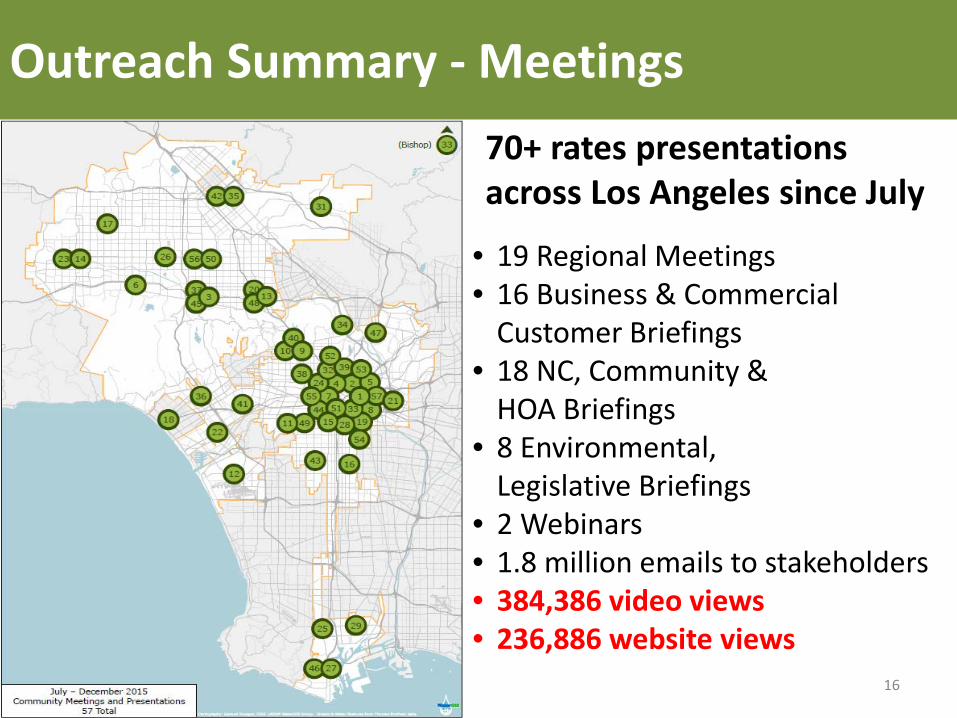
Outreach Summary - Meetings
16
70+ rates presentations across Los Angeles since July
• 19 Regional Meetings • 16 Business & Commercial
Customer Briefings • 18 NC, Community &
HOA Briefings • 8 Environmental,
Legislative Briefings • 2 Webinars • 1.8 million emails to stakeholders • 384,386 video views • 236,886 website views
17 17
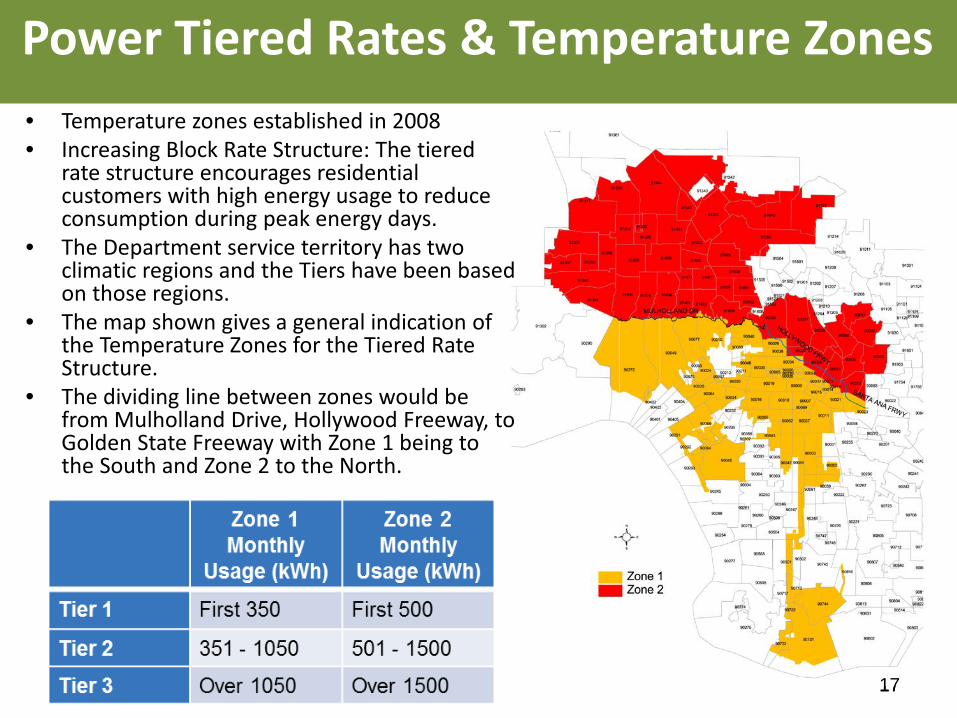
• Temperature zones established in 2008 • Increasing Block Rate Structure: The tiered
rate structure encourages residential customers with high energy usage to reduce consumption during peak energy days.
• The Department service territory has two climatic regions and the Tiers have been based on those regions.
• The map shown gives a general indication of the Temperature Zones for the Tiered Rate Structure.
• The dividing line between zones would be from Mulholland Drive, Hollywood Freeway, to Golden State Freeway with Zone 1 being to the South and Zone 2 to the North.
Power Tiered Rates & Temperature Zones
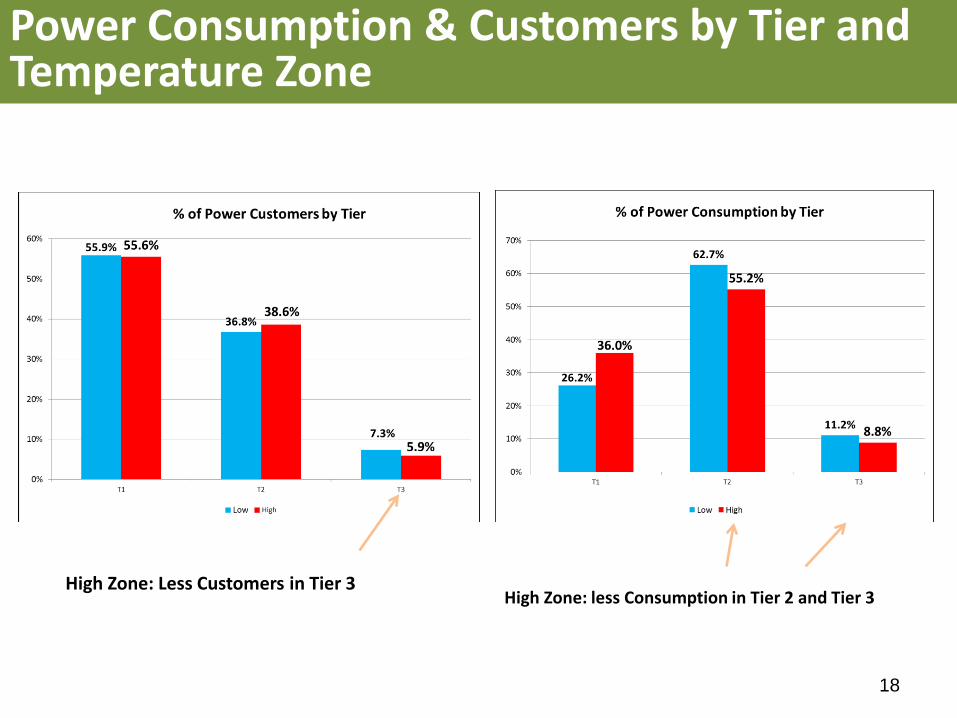
High Zone: Less Customers in Tier 3
High Zone: less Consumption in Tier 2 and Tier 3
18
Power Consumption & Customers by Tier and Temperature Zone
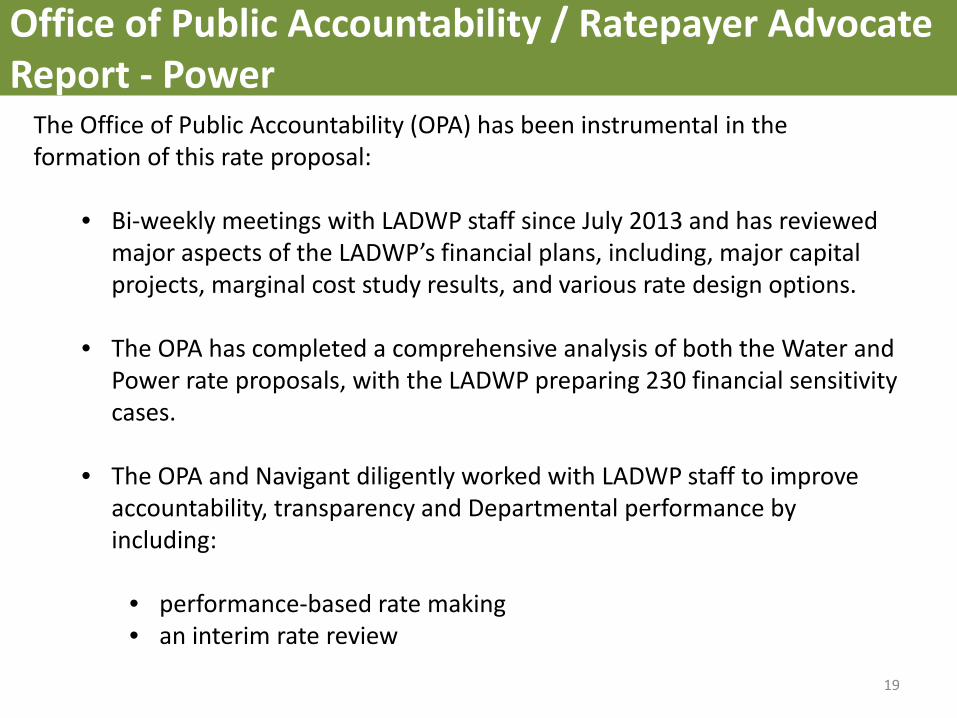
Office of Public Accountability / Ratepayer Advocate Report - Power
19
The Office of Public Accountability (OPA) has been instrumental in the formation of this rate proposal:
• Bi-weekly meetings with LADWP staff since July 2013 and has reviewed major aspects of the LADWP’s financial plans, including, major capital projects, marginal cost study results, and various rate design options.
• The OPA has completed a comprehensive analysis of both the Water and Power rate proposals, with the LADWP preparing 230 financial sensitivity cases.
• The OPA and Navigant diligently worked with LADWP staff to improve accountability, transparency and Departmental performance by including:
• performance-based rate making • an interim rate review
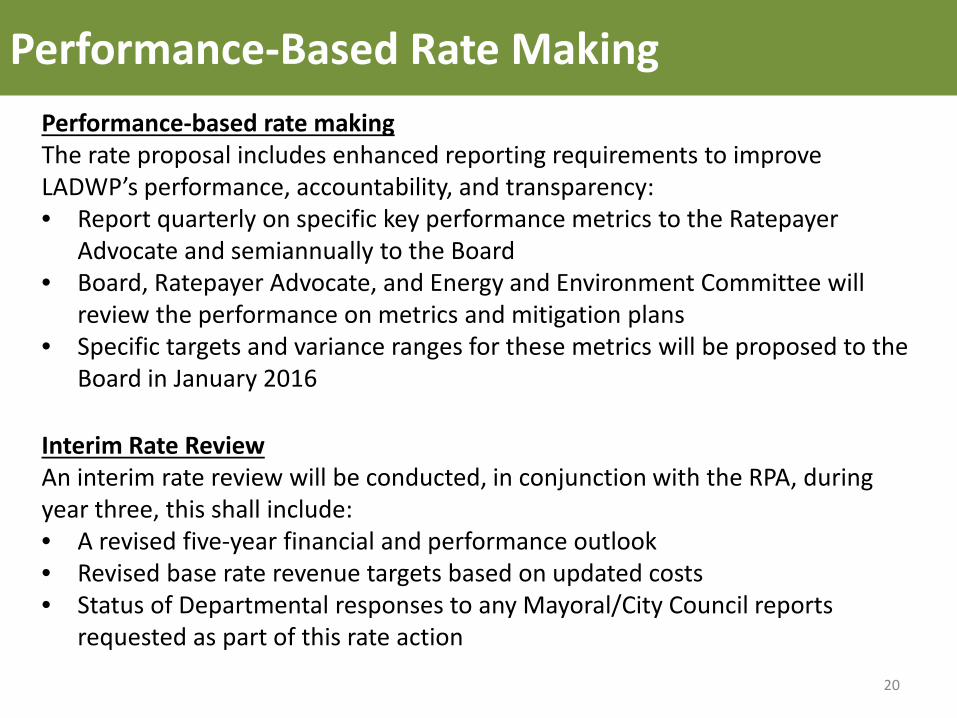
Performance-Based Rate Making
20
Performance-based rate making The rate proposal includes enhanced reporting requirements to improve LADWP’s performance, accountability, and transparency: • Report quarterly on specific key performance metrics to the Ratepayer
Advocate and semiannually to the Board • Board, Ratepayer Advocate, and Energy and Environment Committee will
review the performance on metrics and mitigation plans • Specific targets and variance ranges for these metrics will be proposed to the
Board in January 2016 Interim Rate Review An interim rate review will be conducted, in conjunction with the RPA, during year three, this shall include: • A revised five-year financial and performance outlook • Revised base rate revenue targets based on updated costs • Status of Departmental responses to any Mayoral/City Council reports
requested as part of this rate action

Common Questions & Concerns
21
Biggest topics: • Replacing and fixing aging
infrastructure
• Financial relationship with the City
• Protecting LA against the drought
• Protecting our most vulnerable populations from higher rates
• Creating jobs and boosting the economy
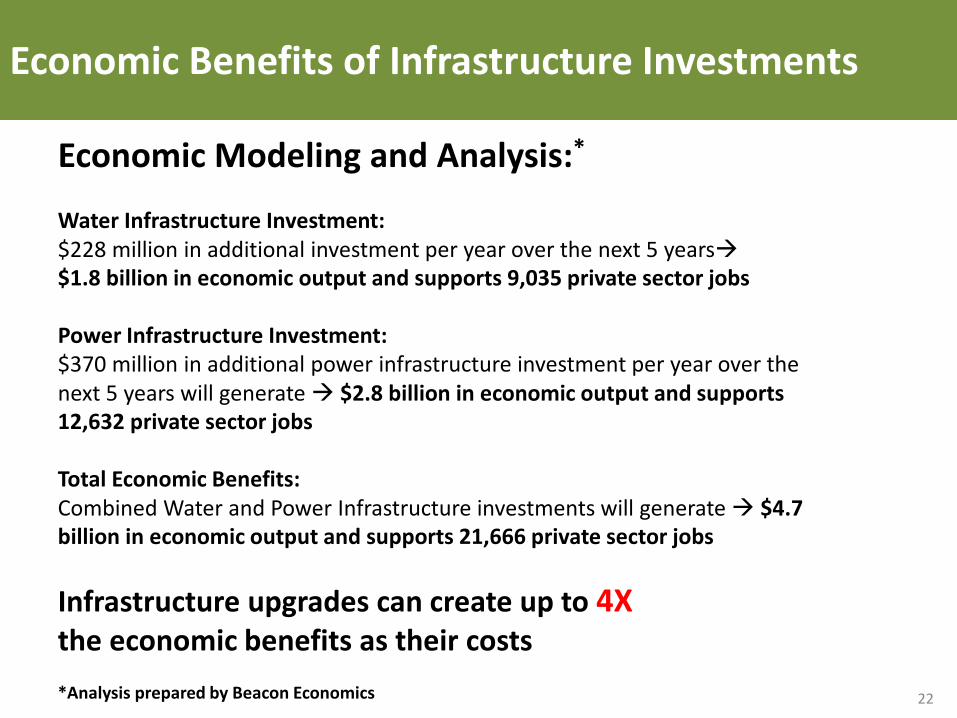
Economic Benefits of Infrastructure Investments
22
Economic Modeling and Analysis:*
Water Infrastructure Investment: $228 million in additional investment per year over the next 5 years $1.8 billion in economic output and supports 9,035 private sector jobs Power Infrastructure Investment: $370 million in additional power infrastructure investment per year over the next 5 years will generate $2.8 billion in economic output and supports 12,632 private sector jobs Total Economic Benefits: Combined Water and Power Infrastructure investments will generate $4.7 billion in economic output and supports 21,666 private sector jobs
Infrastructure upgrades can create up to 4X the economic benefits as their costs *Analysis prepared by Beacon Economics
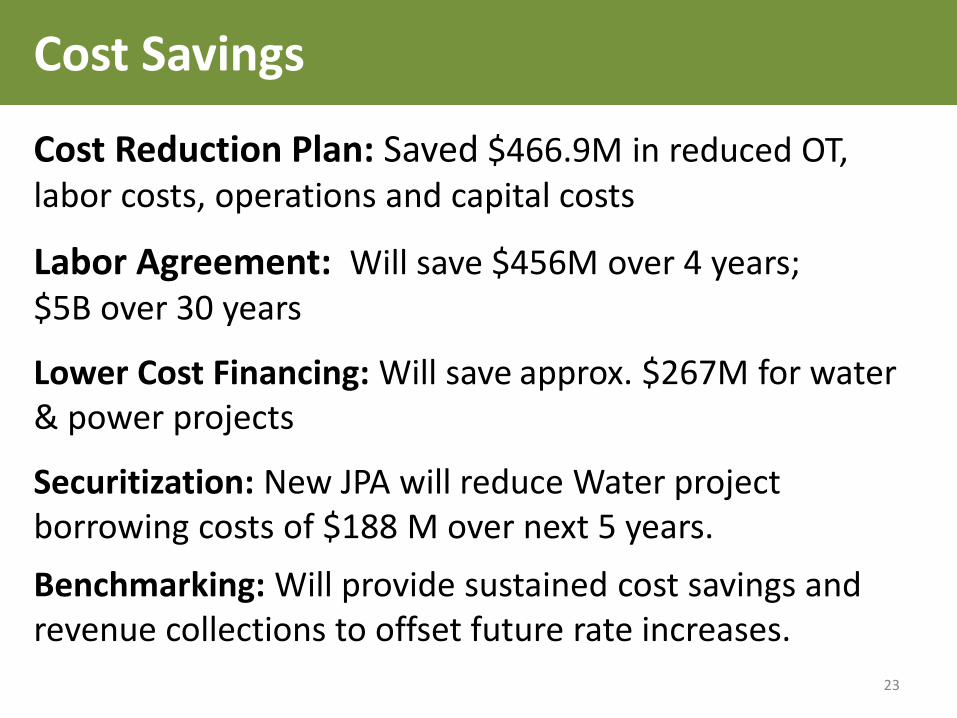
Cost Savings
Cost Reduction Plan: Saved $466.9M in reduced OT, labor costs, operations and capital costs Labor Agreement: Will save $456M over 4 years; $5B over 30 years Lower Cost Financing: Will save approx. $267M for water & power projects Securitization: New JPA will reduce Water project borrowing costs of $188 M over next 5 years. Benchmarking: Will provide sustained cost savings and revenue collections to offset future rate increases. 23
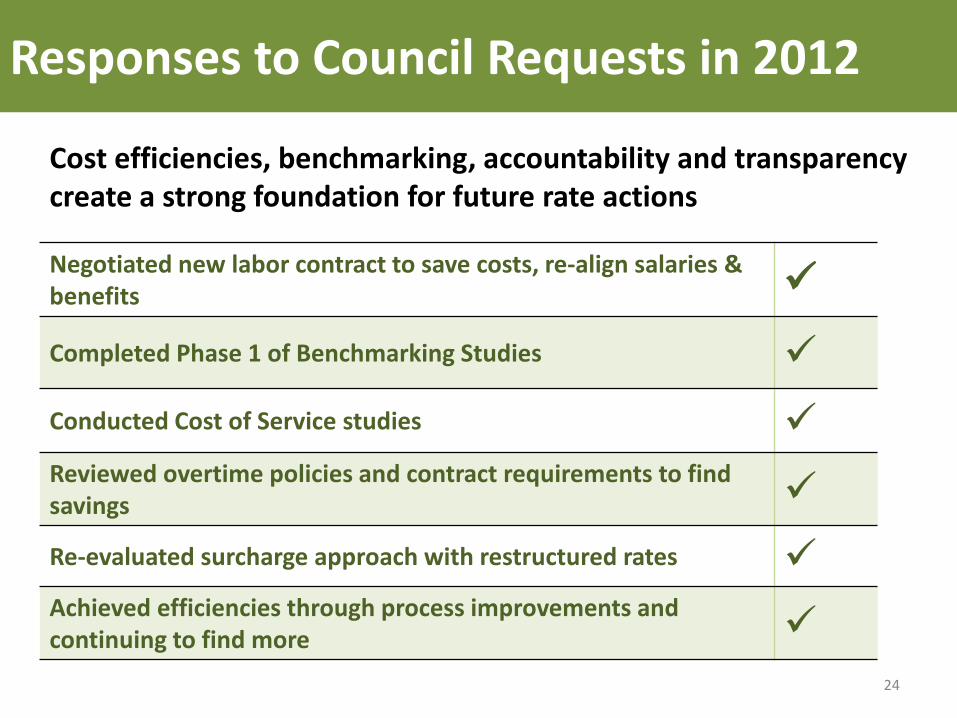
Responses to Council Requests in 2012
24
Cost efficiencies, benchmarking, accountability and transparency create a strong foundation for future rate actions
Negotiated new labor contract to save costs, re-align salaries & benefits Completed Phase 1 of Benchmarking Studies Conducted Cost of Service studies Reviewed overtime policies and contract requirements to find savings Re-evaluated surcharge approach with restructured rates Achieved efficiencies through process improvements and continuing to find more
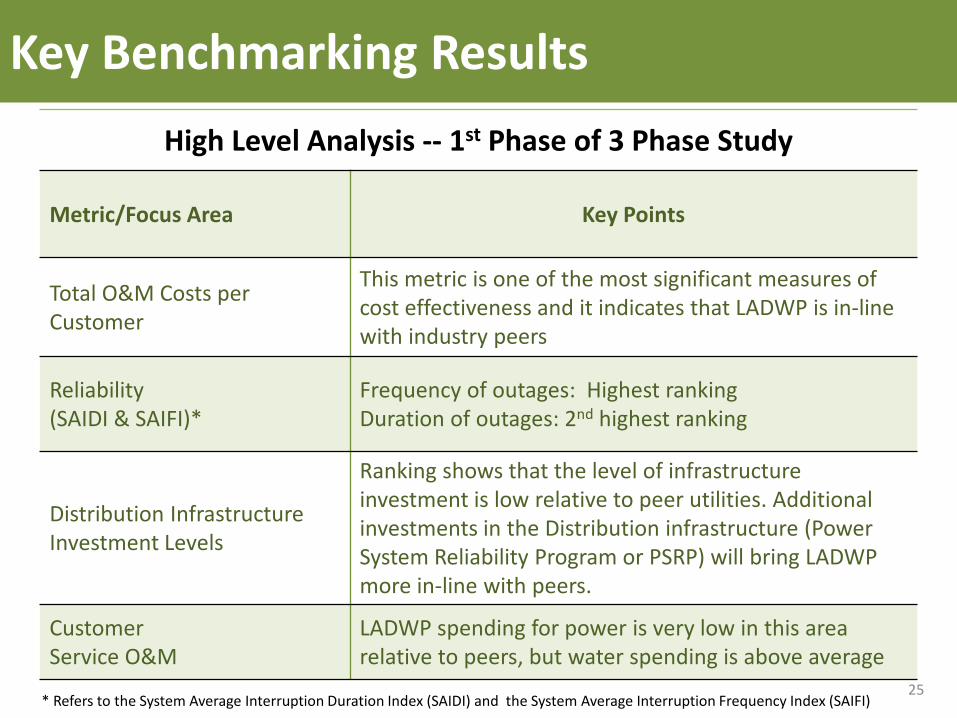
Key Benchmarking Results
25
High Level Analysis -- 1st Phase of 3 Phase Study
Metric/Focus Area Key Points
Total O&M Costs per Customer
This metric is one of the most significant measures of cost effectiveness and it indicates that LADWP is in-line with industry peers
Reliability (SAIDI & SAIFI)*
Frequency of outages: Highest ranking Duration of outages: 2nd highest ranking
Distribution Infrastructure Investment Levels
Ranking shows that the level of infrastructure investment is low relative to peer utilities. Additional investments in the Distribution infrastructure (Power System Reliability Program or PSRP) will bring LADWP more in-line with peers.
Customer Service O&M
LADWP spending for power is very low in this area relative to peers, but water spending is above average
* Refers to the System Average Interruption Duration Index (SAIDI) and the System Average Interruption Frequency Index (SAIFI)
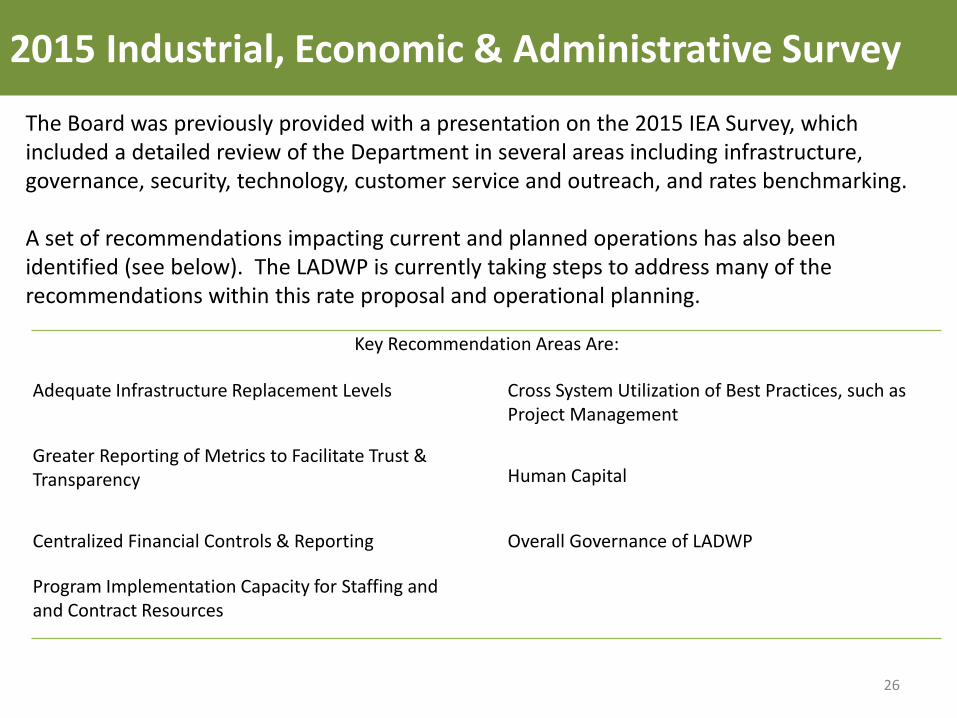
2015 Industrial, Economic & Administrative Survey
26
The Board was previously provided with a presentation on the 2015 IEA Survey, which included a detailed review of the Department in several areas including infrastructure, governance, security, technology, customer service and outreach, and rates benchmarking. A set of recommendations impacting current and planned operations has also been identified (see below). The LADWP is currently taking steps to address many of the recommendations within this rate proposal and operational planning.
Key Recommendation Areas Are:
Adequate Infrastructure Replacement Levels Cross System Utilization of Best Practices, such as Project Management
Greater Reporting of Metrics to Facilitate Trust & Transparency Human Capital
Centralized Financial Controls & Reporting Overall Governance of LADWP
Program Implementation Capacity for Staffing and and Contract Resources
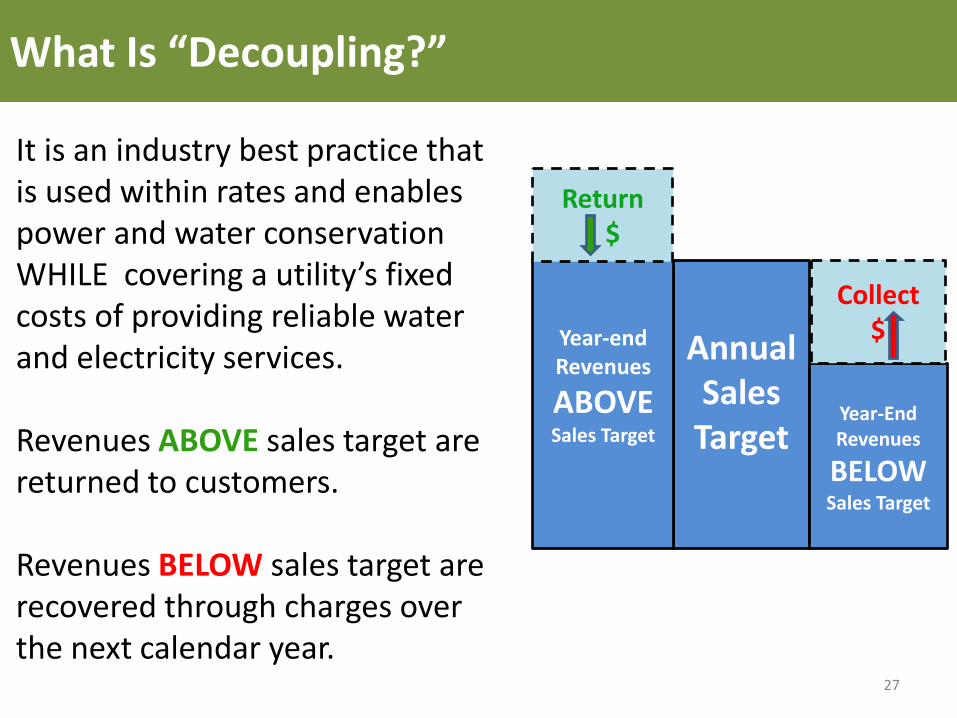
“DECOUPLING“ REVENUES FROM CONSUMPTION
It is an industry best practice that is used within rates and enables power and water conservation WHILE covering a utility’s fixed costs of providing reliable water and electricity services. Revenues ABOVE sales target are returned to customers. Revenues BELOW sales target are recovered through charges over the next calendar year.
What Is “Decoupling?”
AnnualSales Target
Year-end Revenues
ABOVE Sales Target
Year-End Revenues
BELOW Sales Target
Collect $
Return $
27
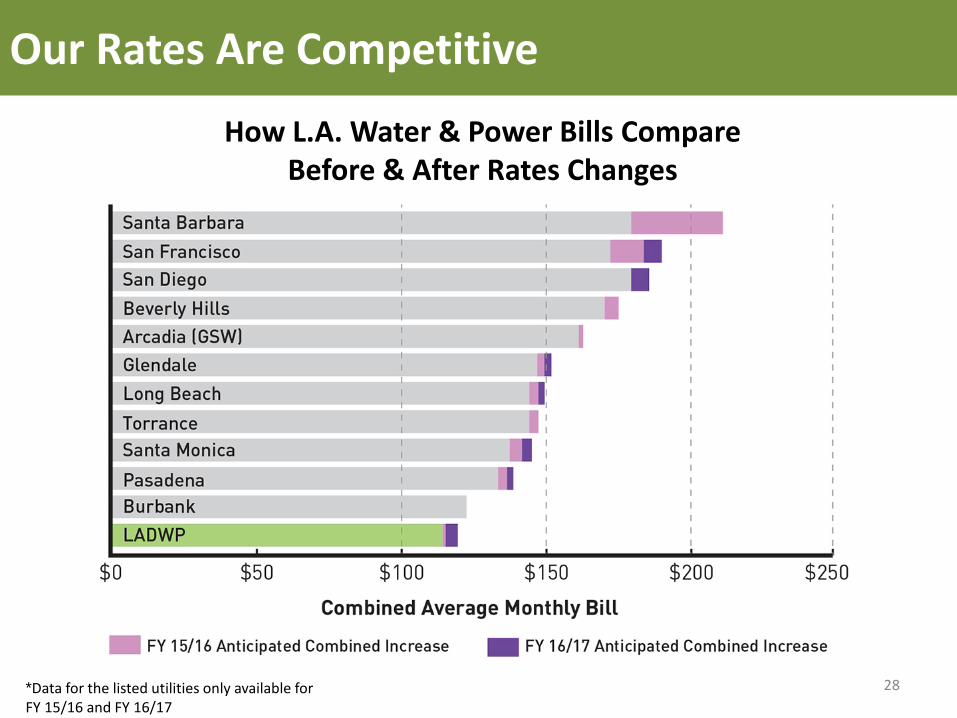
Our Rates Are Competitive
28 *Data for the listed utilities only available for FY 15/16 and FY 16/17
How L.A. Water & Power Bills Compare Before & After Rates Changes
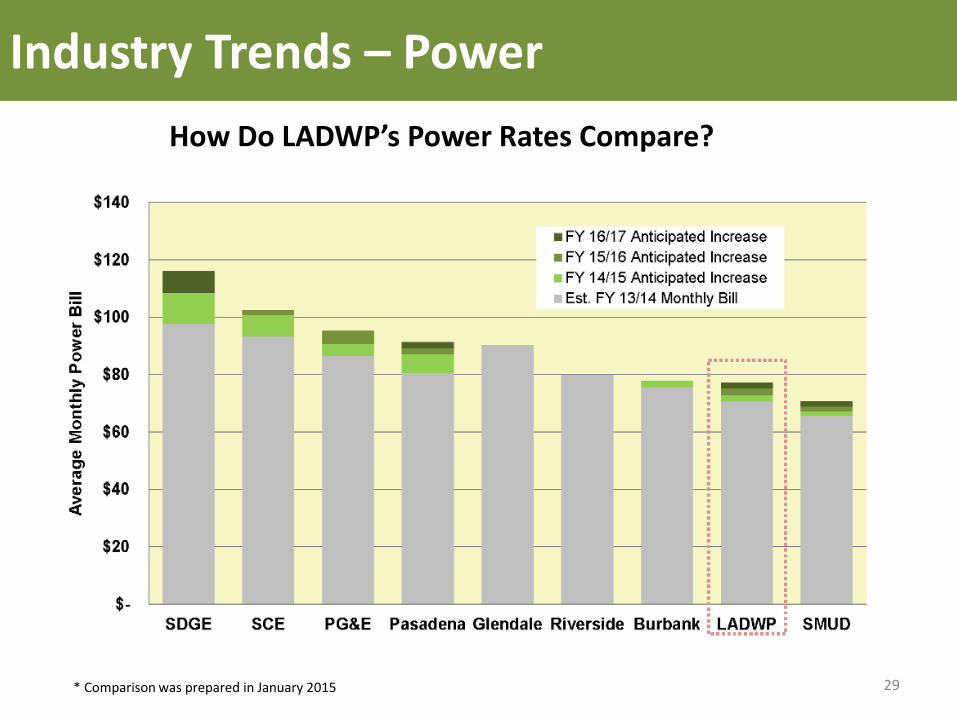
Industry Trends – Power
29
How Do LADWP’s Power Rates Compare?
* Comparison was prepared in January 2015
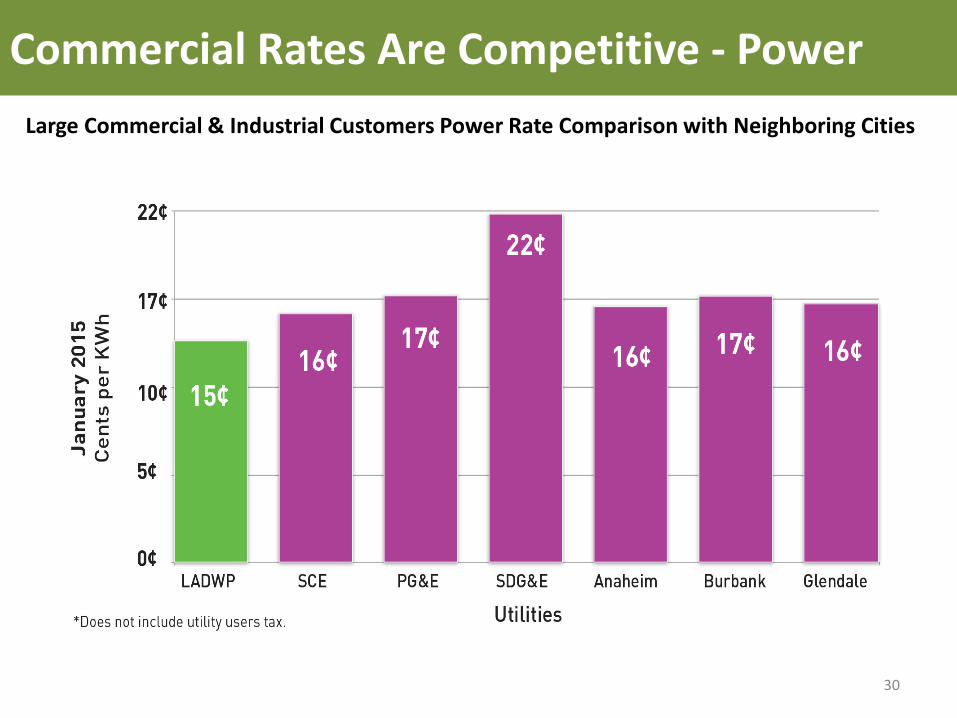
Commercial Rates Are Competitive - Power
30
Large Commercial & Industrial Customers Power Rate Comparison with Neighboring Cities
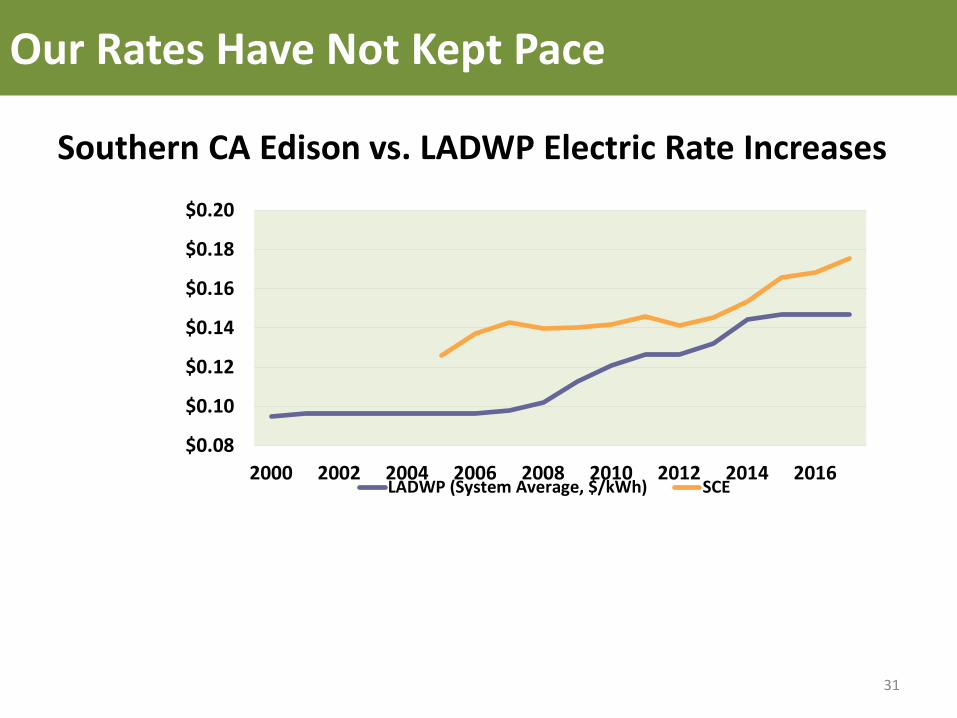
Our Rates Have Not Kept Pace
31
Southern CA Edison vs. LADWP Electric Rate Increases
$0.08
$0.10
$0.12
$0.14
$0.16
$0.18
$0.20
2000 2002 2004 2006 2008 2010 2012 2014 2016LADWP (System Average, $/kWh) SCE
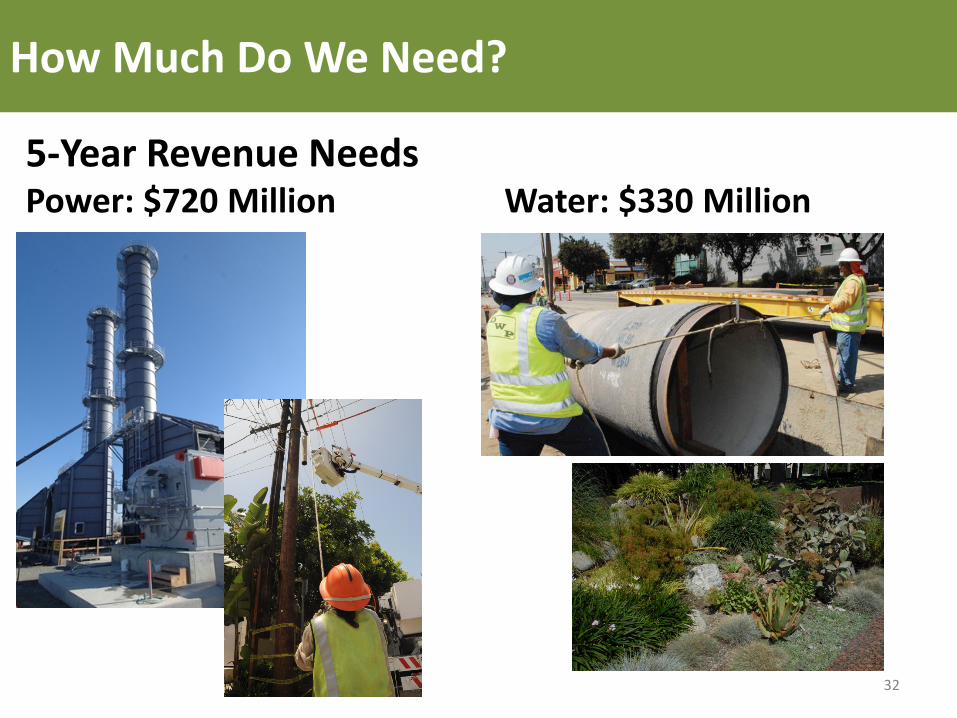
How Much Do We Need?
32
5-Year Revenue Needs Power: $720 Million Water: $330 Million
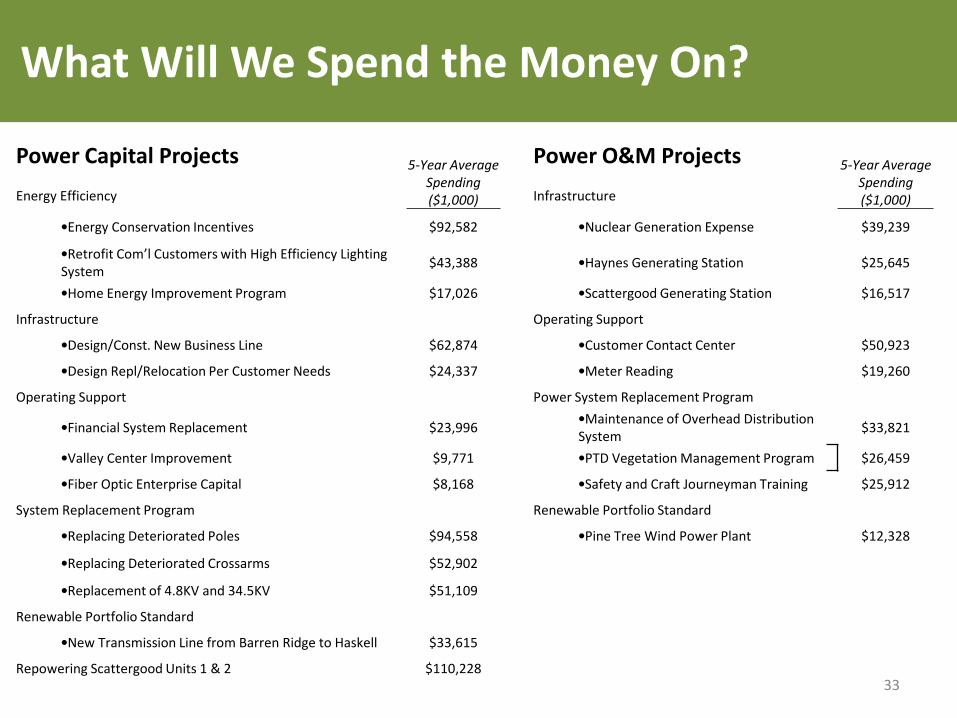
What Will We Spend the Money On?
Power Capital Projects 5-Year Average Spending ($1,000)
Power O&M Projects 5-Year Average Spending ($1,000) Energy Efficiency Infrastructure
•Energy Conservation Incentives $92,582 •Nuclear Generation Expense $39,239
•Retrofit Com’l Customers with High Efficiency Lighting System $43,388 •Haynes Generating Station $25,645
•Home Energy Improvement Program $17,026 •Scattergood Generating Station $16,517
Infrastructure Operating Support
•Design/Const. New Business Line $62,874 •Customer Contact Center $50,923
•Design Repl/Relocation Per Customer Needs $24,337 •Meter Reading $19,260
Operating Support Power System Replacement Program
•Financial System Replacement $23,996 •Maintenance of Overhead Distribution System $33,821
•Valley Center Improvement $9,771 •PTD Vegetation Management Program $26,459
•Fiber Optic Enterprise Capital $8,168 •Safety and Craft Journeyman Training $25,912
System Replacement Program Renewable Portfolio Standard
•Replacing Deteriorated Poles $94,558 •Pine Tree Wind Power Plant $12,328
•Replacing Deteriorated Crossarms $52,902
•Replacement of 4.8KV and 34.5KV $51,109
Renewable Portfolio Standard
•New Transmission Line from Barren Ridge to Haskell $33,615
Repowering Scattergood Units 1 & 2 $110,228 33
Benefits of This Partnership
34
• Savings from the largest energy user and one of the largest water consumers
• Helps LADWP avoid the cost of building new power plants ($54 Million in avoided Generation)
• Brings projects funded by Prop 39, LAUSD and other sources into our savings portfolios
• Addresses schools most in need
• Students will experience efficiency in action; learning opportunities at school and home
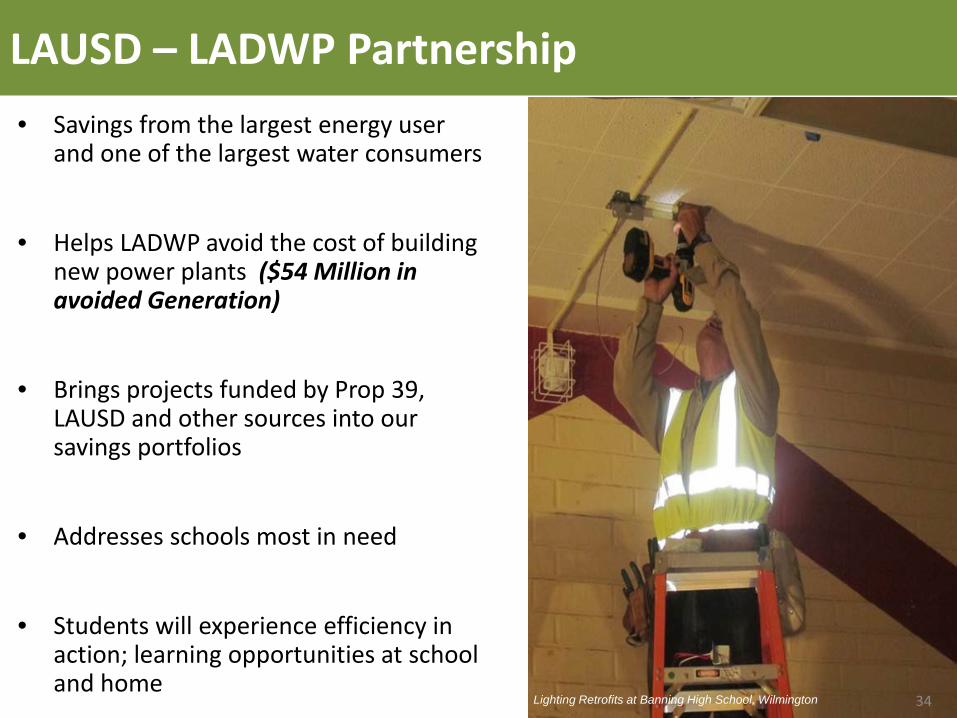
Lighting Retrofits at Banning High School, Wilmington
LAUSD – LADWP Partnership
34
MOU Overview
35
MOU Partnership: • The LADWP will invest $43 million towards additional energy efficiency and
water conservation projects over a three-year period, including: o Energy efficiency upgrades (lighting fixtures, air conditioning units, etc.) o Water efficiency upgrades (high-efficiency urinals, toilets, irrigation) o Educational outreach o New technologies (stormwater capture/reuse, heat island mitigation) o Project management services including assisting LAUSD with Prop 39 o MOU and funding supports projects that LAUSD is not able to fund
through its own bond funding programs LAUSD Bill Impact: • Combined LAUSD annual water and power bill now is approx. $92 million • Through the savings achieved with the MOU and using the proposed rate
increases, LAUSD’s costs at the end of five years will be approximately $90.8 million annually or approx. $1-$2 million lower than they are now
LAUSD – LADWP Partnership
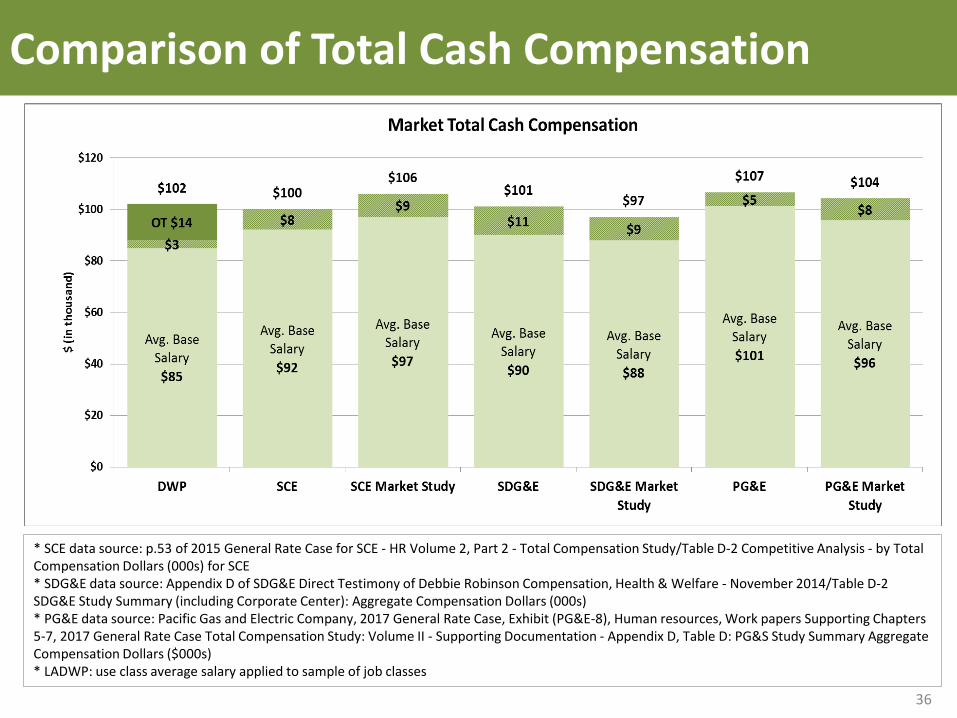
Comparison of Total Cash Compensation
* SCE data source: p.53 of 2015 General Rate Case for SCE - HR Volume 2, Part 2 - Total Compensation Study/Table D-2 Competitive Analysis - by Total Compensation Dollars (000s) for SCE * SDG&E data source: Appendix D of SDG&E Direct Testimony of Debbie Robinson Compensation, Health & Welfare - November 2014/Table D-2 SDG&E Study Summary (including Corporate Center): Aggregate Compensation Dollars (000s) * PG&E data source: Pacific Gas and Electric Company, 2017 General Rate Case, Exhibit (PG&E-8), Human resources, Work papers Supporting Chapters 5-7, 2017 General Rate Case Total Compensation Study: Volume II - Supporting Documentation - Appendix D, Table D: PG&S Study Summary Aggregate Compensation Dollars ($000s) * LADWP: use class average salary applied to sample of job classes
36
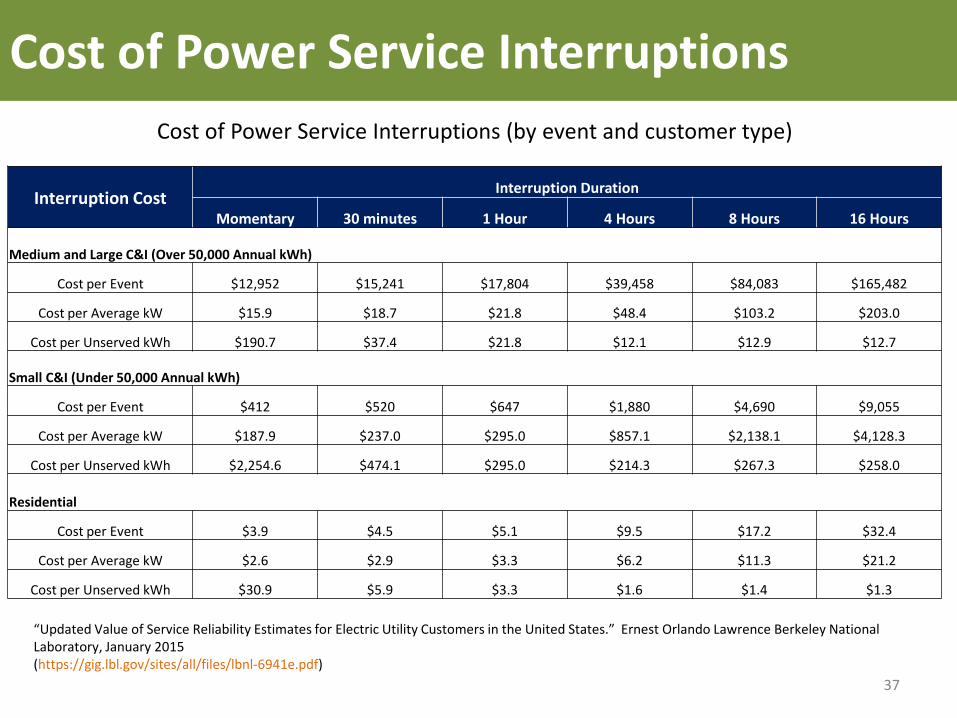
Cost of Power Service Interruptions
37
Interruption Cost Interruption Duration
Momentary 30 minutes 1 Hour 4 Hours 8 Hours 16 Hours
Medium and Large C&I (Over 50,000 Annual kWh)
Cost per Event $12,952 $15,241 $17,804 $39,458 $84,083 $165,482
Cost per Average kW $15.9 $18.7 $21.8 $48.4 $103.2 $203.0
Cost per Unserved kWh $190.7 $37.4 $21.8 $12.1 $12.9 $12.7
Small C&I (Under 50,000 Annual kWh)
Cost per Event $412 $520 $647 $1,880 $4,690 $9,055
Cost per Average kW $187.9 $237.0 $295.0 $857.1 $2,138.1 $4,128.3
Cost per Unserved kWh $2,254.6 $474.1 $295.0 $214.3 $267.3 $258.0
Residential
Cost per Event $3.9 $4.5 $5.1 $9.5 $17.2 $32.4
Cost per Average kW $2.6 $2.9 $3.3 $6.2 $11.3 $21.2
Cost per Unserved kWh $30.9 $5.9 $3.3 $1.6 $1.4 $1.3
“Updated Value of Service Reliability Estimates for Electric Utility Customers in the United States.” Ernest Orlando Lawrence Berkeley National Laboratory, January 2015 (https://gig.lbl.gov/sites/all/files/lbnl-6941e.pdf)
Cost of Power Service Interruptions (by event and customer type)
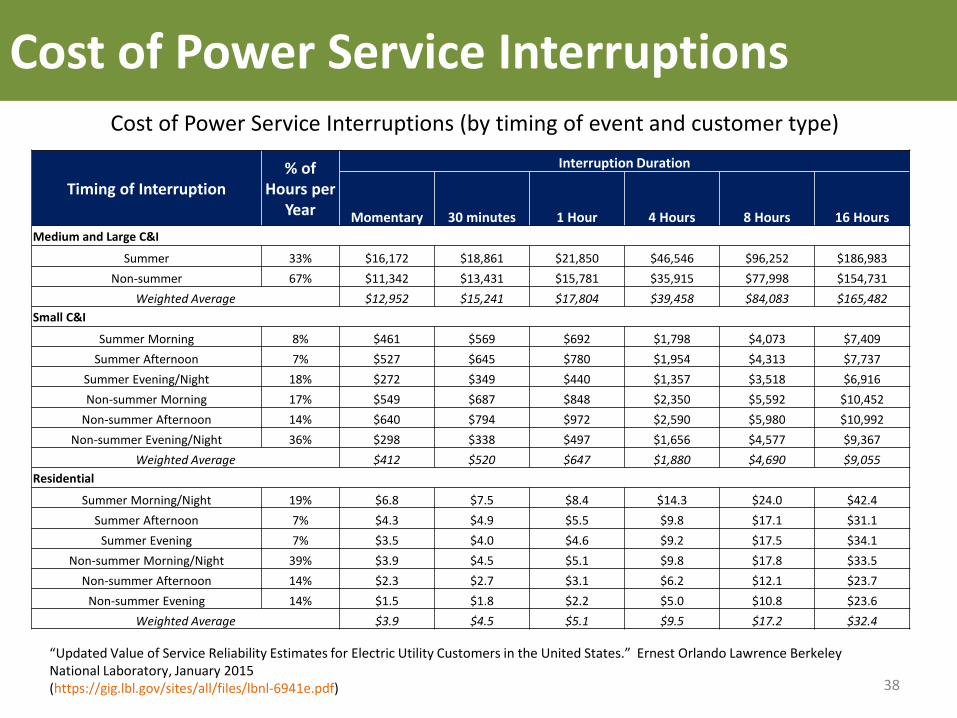
Cost of Power Service Interruptions
38
“Updated Value of Service Reliability Estimates for Electric Utility Customers in the United States.” Ernest Orlando Lawrence Berkeley National Laboratory, January 2015 (https://gig.lbl.gov/sites/all/files/lbnl-6941e.pdf)
Cost of Power Service Interruptions (by timing of event and customer type)
Timing of Interruption % of
Hours per Year
Interruption Duration
Momentary 30 minutes 1 Hour 4 Hours 8 Hours 16 Hours Medium and Large C&I
Summer 33% $16,172 $18,861 $21,850 $46,546 $96,252 $186,983 Non-summer 67% $11,342 $13,431 $15,781 $35,915 $77,998 $154,731
Weighted Average $12,952 $15,241 $17,804 $39,458 $84,083 $165,482 Small C&I
Summer Morning 8% $461 $569 $692 $1,798 $4,073 $7,409 Summer Afternoon 7% $527 $645 $780 $1,954 $4,313 $7,737
Summer Evening/Night 18% $272 $349 $440 $1,357 $3,518 $6,916 Non-summer Morning 17% $549 $687 $848 $2,350 $5,592 $10,452
Non-summer Afternoon 14% $640 $794 $972 $2,590 $5,980 $10,992 Non-summer Evening/Night 36% $298 $338 $497 $1,656 $4,577 $9,367
Weighted Average $412 $520 $647 $1,880 $4,690 $9,055 Residential
Summer Morning/Night 19% $6.8 $7.5 $8.4 $14.3 $24.0 $42.4 Summer Afternoon 7% $4.3 $4.9 $5.5 $9.8 $17.1 $31.1
Summer Evening 7% $3.5 $4.0 $4.6 $9.2 $17.5 $34.1 Non-summer Morning/Night 39% $3.9 $4.5 $5.1 $9.8 $17.8 $33.5
Non-summer Afternoon 14% $2.3 $2.7 $3.1 $6.2 $12.1 $23.7 Non-summer Evening 14% $1.5 $1.8 $2.2 $5.0 $10.8 $23.6
Weighted Average $3.9 $4.5 $5.1 $9.5 $17.2 $32.4