Embed Size (px)
Citation preview

Energy and Environment
Tânia SousaTiago Domingos
MARETEC – Marine, Environment and Technology CentreEnvironment and Energy Scientific AreaDepartment of Mechanical Engineering
Integrated Master in Environmental Engineering

Sustainable Development

“Empty World”
Costanza, R., J. Cumberland, H. Daly, R. Goodland, R. Norgaard (1997). An
Introduction to Ecological Economics. St. Lucie Press, Boca Raton, FL, USA.

“Full World”
Costanza, R., J. Cumberland, H. Daly, R. Goodland, R. Norgaard (1997). An
Introduction to Ecological Economics. St. Lucie Press, Boca Raton, FL, USA.

A brief history of Humankind …
Environment
Economy
De-growth
Smart growth
BAU

Have we crossed the limits?
Environment
Economy
Sustainability Threshold

… or not?
Environment
Economy
Sustainability Threshold

Climate and Greenhouse Gases

Balanço de Energia da Terra
TERRARADIAÇÃO
SOLARRADIAÇÃO TÉRMICA
Quando a radiação solar é superior à radiação térmica, a Terra aquece e estabelece-se um novo equilíbrio.
proporcional à temperatura da Terra

Efeito de Estufa
A atmosfera retorna parte da radiação térmica à Terra, aumentando a temperatura da Terra. – EFEITO DE ESTUFA
Os componentes principais da atmosfera que causam este efeito são:
Vapor de água, H2ODióxido de carbono, CO2
Metano, CH4
Óxido de Azoto, N2O
TERRARADIAÇÃO
SOLARRADIAÇÃO TÉRMICA
proporcional à temperatura da Terra
ATMOSFERA

Temperatura Global
IPC
C, 2
007:
Sum
mar
y fo
r P
olic
ymak
ers.
In:
Cli
mate
Chang
e 2007:
The
Phys
ical
Sci
ence
Basi
s.
Contr
ibuti
on o
f W
ork
ing
Gro
up
I t
o t
he
Fourt
h A
sses
smen
t R
eport
of
the
Inte
rgove
rnm
enta
l P
anel
on
Cli
mate
Chang
e [S
olom
on, S
., D
. Qin
, M. M
anni
ng, Z
. Che
n, M
. Mar
quis
, K.B
. Ave
ryt,
M.T
igno
r an
d H
.L. M
ille
r (e
ds.)
]. C
ambr
idge
Uni
vers
ity
Pre
ss, C
ambr
idge
, Uni
ted
Kin
gdom
and
New
Yor
k, N
Y, U
SA
.

Forçamento Radiativo

Dinâmica dos Gases de Efeito de EstufaDióxido de Carbono
IPCC, 2007: Summary for Policymakers. In: Climate Change 2007: The Physical Science Basis.
Contribution of Working Group I to the Fourth Assessment Report of the Intergovernmental Panel on
Climate Change [Solomon, S., D. Qin, M. Manning, Z. Chen, M. Marquis, K.B. Averyt, M.Tignor and H.L. Miller (eds.)]. Cambridge University Press, Cambridge, United Kingdom and New York, NY, USA.

Dinâmica dos Gases de Efeito de EstufaMetano
IPCC, 2007: Summary for Policymakers. In: Climate Change 2007: The Physical Science Basis.
Contribution of Working Group I to the Fourth Assessment Report of the Intergovernmental Panel on
Climate Change [Solomon, S., D. Qin, M. Manning, Z. Chen, M. Marquis, K.B. Averyt, M.Tignor and H.L. Miller (eds.)]. Cambridge University Press, Cambridge, United Kingdom and New York, NY, USA.

Dinâmica dos Gases de Efeito de EstufaÓxido de Azoto
IPCC, 2007: Summary for Policymakers. In: Climate Change 2007: The Physical Science Basis.
Contribution of Working Group I to the Fourth Assessment Report of the Intergovernmental Panel on
Climate Change [Solomon, S., D. Qin, M. Manning, Z. Chen, M. Marquis, K.B. Averyt, M.Tignor and H.L. Miller (eds.)]. Cambridge University Press, Cambridge, United Kingdom and New York, NY, USA.
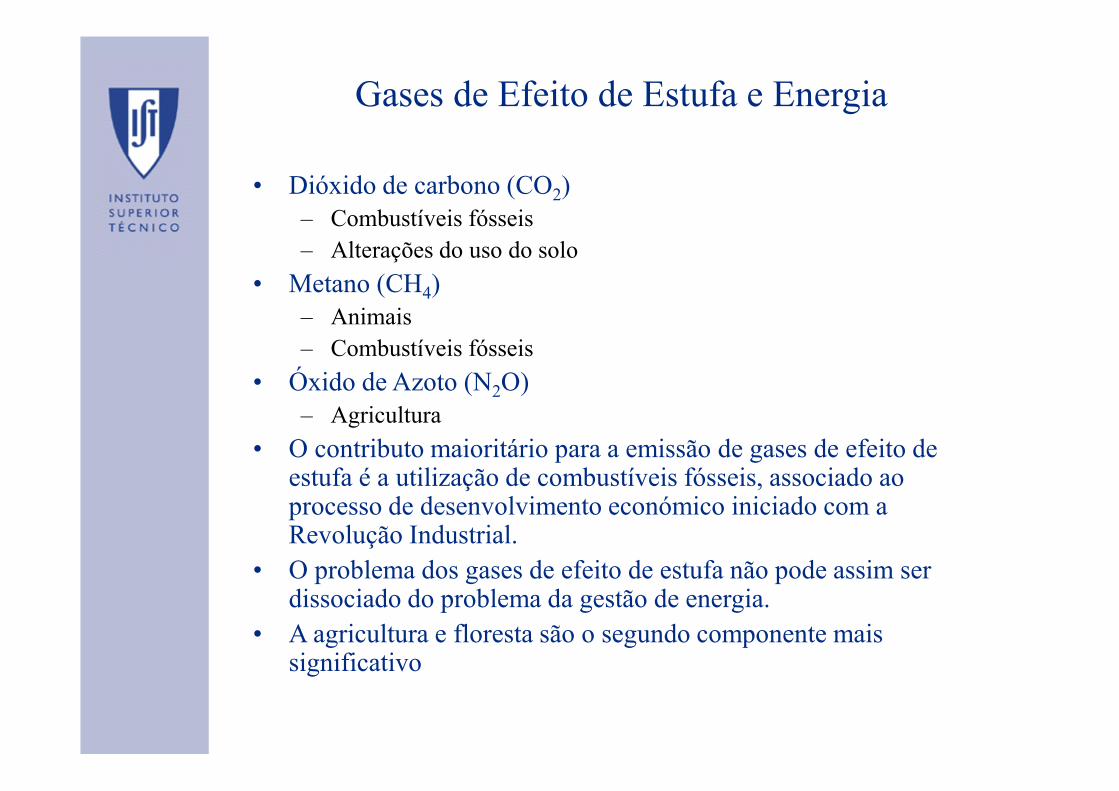
Gases de Efeito de Estufa e Energia
• Dióxido de carbono (CO2)– Combustíveis fósseis– Alterações do uso do solo
• Metano (CH4)– Animais– Combustíveis fósseis
• Óxido de Azoto (N2O)– Agricultura
• O contributo maioritário para a emissão de gases de efeito de estufa é a utilização de combustíveis fósseis, associado ao processo de desenvolvimento económico iniciado com a Revolução Industrial.
• O problema dos gases de efeito de estufa não pode assim ser dissociado do problema da gestão de energia.
• A agricultura e floresta são o segundo componente mais significativo

Comida
Restaurantes
Recreio
Roupa
Habitação
Comunicação
Saúde
Transportes
Educação
Diversos
Emissões de Gases de Efeito de Estufa por Produto na Europa
Huppes, G., A. de Koning, S. Suh, R. Heijungs, L. van Oers, P. Nielsen, and J. B. Guinée (2006). Environmental Impacts of Consumption in the European Union: High-Resolution Input-Output Tables with Detailed Environmental Extensions. Journal of Industrial Ecology 10(3): 129–146.
CarneLacticínios
AquecimentoCozinha
Água quente, Electrodomésticos,
Construção
Automóvel privado, Transporte aéreo

Decarbonisation of Energy Systems

Decarbonisation of Energy Systems
Decreasing trend in CO2
emitted per GJ from 1850 to 2000
2010: 108 GJ/capita/year
7600 kg CO2/capita/year

Decarbonisation of Energy Systems
Historically energy related biomass burning has not been carbon-neutral (maximum estimated value of 38%)

Decarbonisation of Energy Systems
Why a slight increasing trend in the last 10 years?
TS1

Slide 21
TS1 The average hydrogen/carbon ratios show that the degree of unsaturation increases from natural gas through petroleum to coal. The amount of
carbon dioxide released per mole also increases as the amount of unsaturation increases. Since carbon dioxide is a greenhouse gas, from this
data, it would appear that burning coal would have a larger greenhouse effect than burning natural gas.Tânia Sousa, 03/03/2016

Ecological Footprint

Impacto da pegada ecológica
Relatório anual Global Footprint Network, 2010
WWF Living Report, 2010 Circular enviada pela Global Footprint Network
GFN_OvershootExplained_2009.mp4

0
1
1
2
1961 1966 1971 1976 1981 1986 1991 1996 2001 2006
year
Carbon
Agriculture
PasturesFisheries
Forest
Infrastructure
The global ecological footprint ... as usually presented

0
1
1
2
1961 1966 1971 1976 1981 1986 1991 1996 2001 2006
year
Carbon
Agriculture
PasturesFisheries
ForestInfrastructure
The global ecological footprint … as it should be presented

Why forest?It could be:1. Considering all areas (not only forest)2. Bioenergy (Wackernagel and Rees, 1996)4. the number of global hectares originally needed to producethe living matter embodied in a given quantity of fossil fuel.
Shadow projects that can be considered either to compensate or avoid carbon emission…and
The most efficient should be chosen
"The IPCC report’s findings make clear that with
each passing year of continued high emissions, the
prospect of keeping temperatures from rising less
than 2°°°°C through emissions reductions alone will
become ever more vanishingly small." –Peter
Frumhoff, Union of Concerned Scientists
MacKay, D.J.C (2009). Sustainable Energy – without the hot air. Cambridge, England.

Central Solar PS10 em Sevilha

Some data about CSP
http://www.desertec.org/organization/
Zickfeld, F., Wieland, A (2012). 2050 Desert Power. Munich, Germany.

Some data about CSP
Zickfeld, F., Wieland, A (2012). 2050 Desert Power. Munich, Germany.
48
38
114
60
100
143149
124
61
183
0
20
40
60
80
100
120
140
160
180
200
Wind on-shore
3000FLH
Coal6000FLH
UtilityPV2000FLH
Windonshore
2400FLH
Wind off-shore
4000FLH
UtilityPV1600FLH
CSP4000FLH
Wind off-shore
3200FLH
CCGT4000FLH
CSP3200FLH
€/MWh

Some data about CSP
Zickfeld, F., Wieland, A (2012). 2050 Desert Power. Munich, Germany.
0
1000
2000
3000
4000
5000
6000
Wind on-shore
3000FLH
Coal6000FLH
UtilityPV2000FLH
Windonshore
2400FLH
Wind off-shore
4000FLH
UtilityPV1600FLH
CSP4000FLH
Wind off-shore
3200FLH
CCGT4000FLH
CSP3200FLH
Investment (€/kW)

Central Solar PS10 em Sevilha
Space needed for solar power plants to generate sufficient electric power in order to meet the electricity demand of the World, Europe (EU-25) and Germany (De) respectively. (Data by the German Center of Aerospace (DLR), 2005)

0
1
1
2
1961 1966 1971 1976 1981 1986 1991 1996 2001 2006
The global ecological footprint … with carbon compensated by solar energy
Carbon
Agriculture
PasturesFisheries
ForestInfrastructure

Thermodynamics: Scales and Units

Energy Units and Scales
IIASA – Global Energy Assessment 2012

Thermodynamics: 1st Law

Heat and Work - Joule’s Experiment
• Equivalence between Heat (Q) and Work (W)

First Law energy efficiencies
• Power Cycle • 1st Law efficiency
cycle
in
W
Qη =

Typical values of 1st law efficiencies
• 1st Law efficiencies from primary to final energy
Refinery, Sines
Coal Power Plant, Sines
CCTG Power Plant, Tapada Outeiro
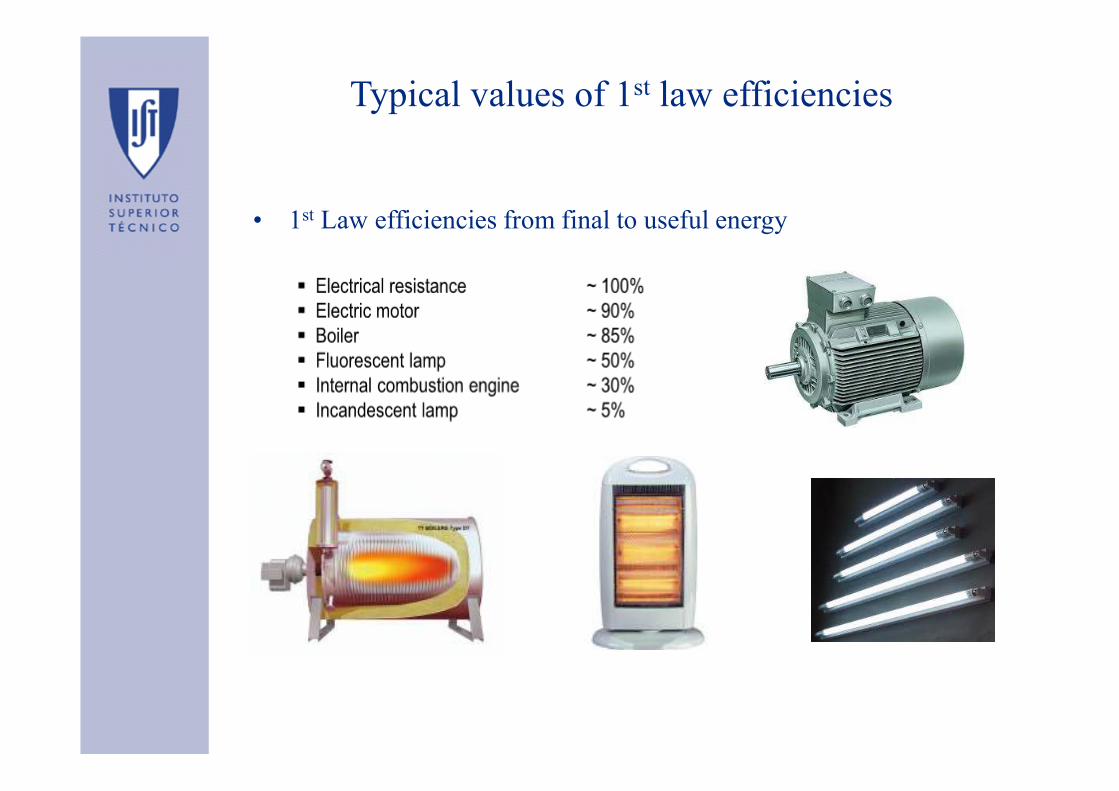
Typical values of 1st law efficiencies
• 1st Law efficiencies from final to useful energy

Are there 1st law efficiencies > 1?
• Refrigerator & Heat Pump Cycles
• 1st Law efficiencies
– Heat Pump
– Refrigerator
out
cycle
Q
Wγ =
in
cycle
Q
Wβ =

• What is the 1st Law efficiency in a heat pump?
Typical values of η between 3 – 5
• What is the Sankey diagram like?
Are there 1st law efficiencies > 1?
11
1
out out
inout in
out
Q Q
QW Q Q
Q
γ = = = >− −

Are 1st law efficiencies enough?
Heating of a house can be done by one of the following methods:1. Electrical heating using the Joule effect2. Central heating 3. Heating using a heat pump

Are first law efficiencies enough?
• Providing 1 kWh of heat at 30ºC to a building with an outsidetemperature of 4ºC
• First law efficiencies do not provide information on how muchyou can improve your efficiency
Electrical
Resistance
Central
Heating
Heat
Pump
Ideal Heat
Pump
Final (kWh) 1 1/0.90 1/3 1/12
Useful(kWh)
1 1 1 1
First Law 100% 90% 300% 1200%

Is the first law enough?
• What has the first law has to say about what happens in the following case?

Thermodynamics: Second Law


Spontaneous Processes
• Hot coffee in a cold room gets colder and not hotter
• Radiating energy is received by the Earthfrom the sun and by outer space from the earth and not the other way around.
• If the valve of a tyre is opened, air gets out and not in


The state variable: Entropy
• Entropy is the state variable that gives unidirectionality to time in physical processes ocurring in isolated & adiabatic systems.

Entropy Balance in Adiabatic Systems
Entropy change = Entropy production
• 2nd Law: In an adiabatic system the entropy must not decrease
S σ∆ =

Entropy Balance in Closed Systems
Entropy change = Entropy transfer in the form of heat + entropy production
Entropy flows with heat but not with work
QS
Tσ∆ = +

Second law efficiencies
• Ratio between 1st law real and best efficiencies
• Providing 1 kWh of heat at 30ºC to a building with an outside temperature of 4ºC
• Second law efficiencies provide information on how much you can improve your efficiency
Electrical
Resistance
Central
Heating
Heat
Pump
Ideal Heat
Pump
Final (kWh) 1 1/0.90 1/3 1/12
Useful (kWh) 1 1 1 1
First Law ε 100% 90% 300% 1200%
Second Law ε 8.3% 7.5% 25% 100%

Typical values of 2nd law efficiencies
• Overall 2nd law efficiency in convertingprimary to final is 76% and primary to usefulenergy is 10%
IAASA - Global Energy Assessment 2012

Second law efficiencies
• Second law efficiencies by providing information on how much you can improve your efficiency show where efforts should be made
Rosen and Dincer, 1997

Energy Stages

Stages of Energy - Primary Energy

Stages of Energy - Final Energy

Stages of Energy – Useful Energy
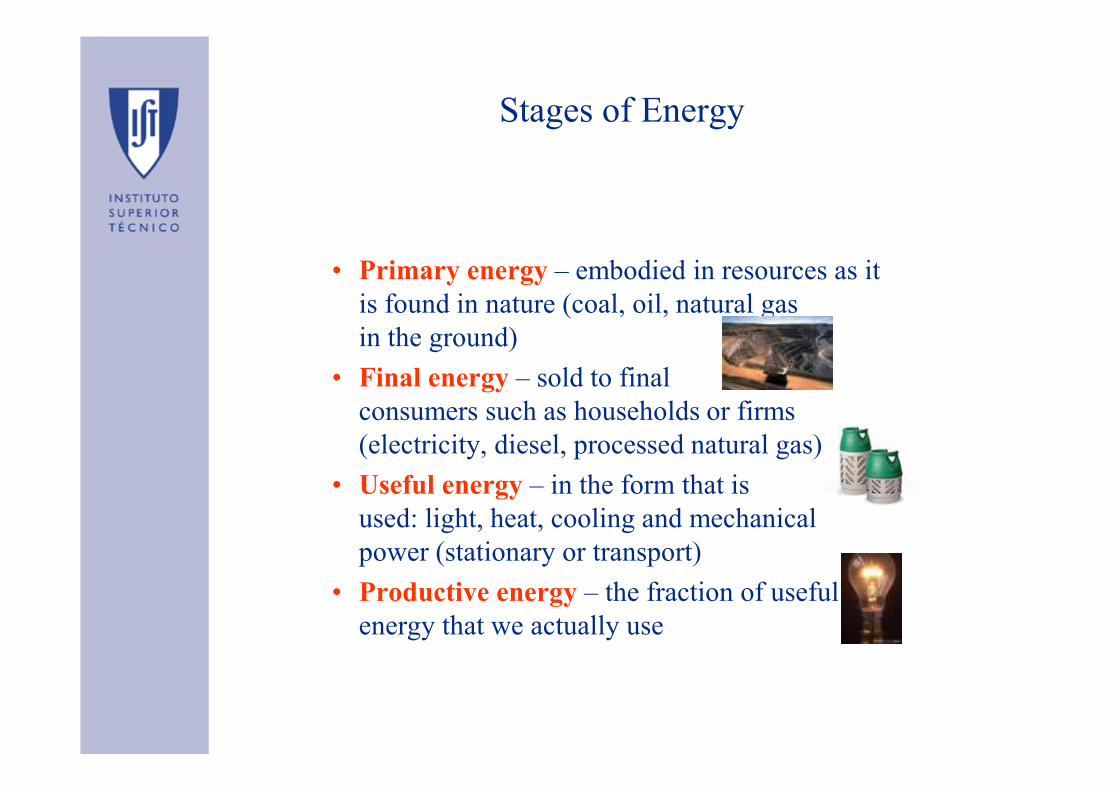
Stages of Energy
• Primary energy – embodied in resources as it is found in nature (coal, oil, natural gas in the ground)
• Final energy – sold to final consumers such as households or firms (electricity, diesel, processed natural gas)
• Useful energy – in the form that isused: light, heat, cooling and mechanical power (stationary or transport)
• Productive energy – the fraction of useful energy that we actually use

From Primary Energy to Energy Services
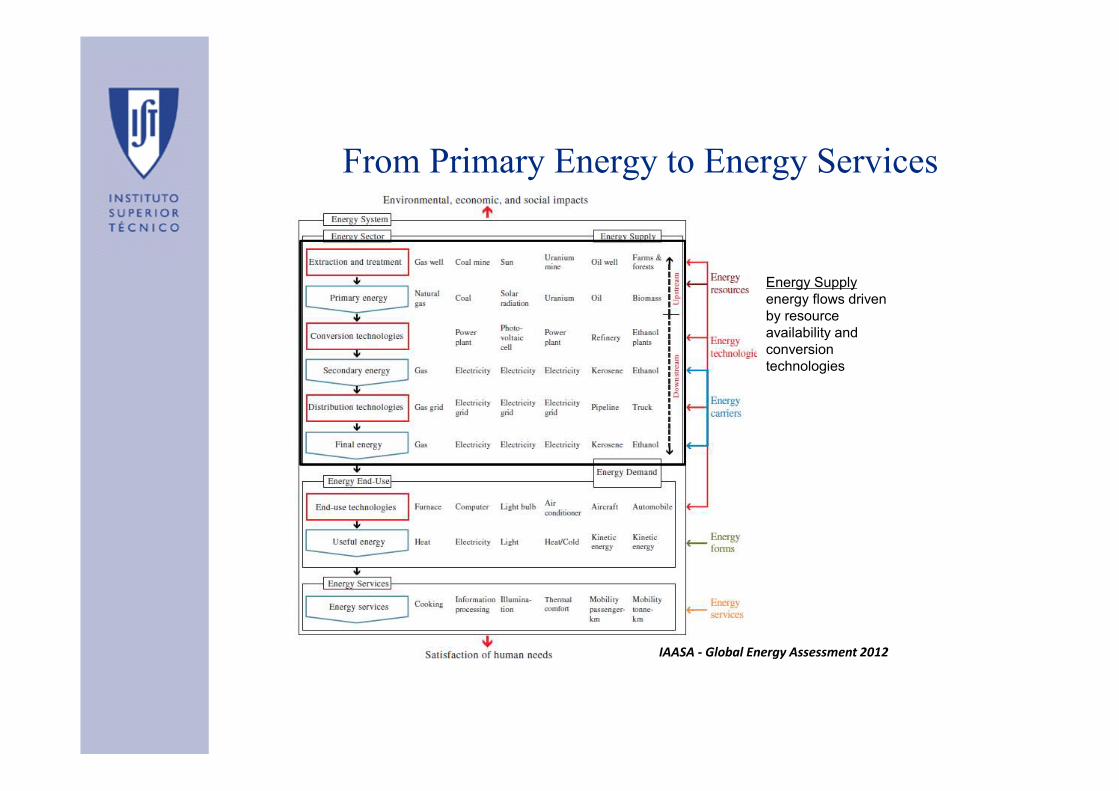
From Primary Energy to Energy Services
IAASA - Global Energy Assessment 2012
Energy Supplyenergy flows driven by resource availability and conversion technologies

IAASA - Global Energy Assessment 2012
The energy supply sector dealing with primary energy is referred as “upstream” activities
From Primary Energy to Energy Services

IAASA - Global Energy Assessment 2012
The energy supply sector dealing with secondary energy is referred as “downstream” activities
From Primary Energy to Energy Services

IAASA - Global Energy Assessment 2012
Energy DemandEnergy system is service driven
From Primary Energy to Energy Services

IAASA - Global Energy Assessment 2012
Quality and cost of energy services
From Primary Energy to Energy Services

Useful Energy
• How do you go from final to useful energy for household electricity consumption?
• Electrical resistance 100%• Electrical motor 90%• Fluorescent lamp 50%• Refrigerator 200%• Heat pump 250%

Useful Energy
• How do you go from final to useful energy for household electricity consumption?
• Electrical resistance 100%• Electrical motor 90%• Fluorescent lamp 50%• Refrigerator 200%• Heat pump 250%
,useful final i i
i
E E η=∑
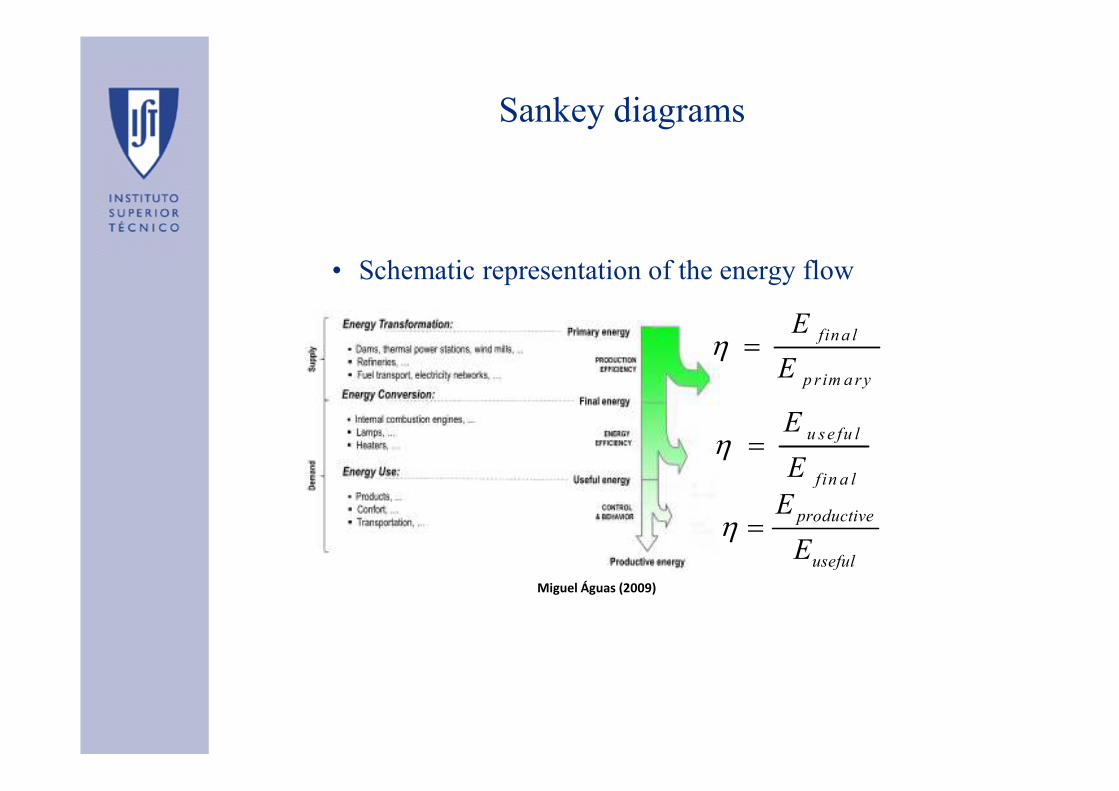
Sankey diagrams
• Schematic representation of the energy flow
f in a l
p r im a ry
E
Eη =
u s e fu l
f in a l
E
Eη =
productive
useful
E
Eη =
Miguel Águas (2009)

Sankey diagram for Portugal 2010

World Sankey Diagram in 2005
IAASA – Global Energy Assessment 2012

History of Energy Use

Energy Management
Class # 9 : Energy Economics

Population (lines) Primary energy use (bars)
industrialized countries
(white squares and bars)
developing countries
(gray triangles and bars)
Energy use data includes estimates of noncommercial energy use
Primary Energy Use 1800-2000
Grubler, A. “Energy Transitions”

Population (lines) Primary energy use (bars)
industrialized countries
(white squares and bars)
developing countries
(gray triangles and bars)
Energy use data includes estimates of noncommercial energy use
• Primary energy use increased more than 20-fold in 200 years
• Heterogeneity in per capita primary energy use:• In industrialized countries population increased linearly while primary
energy use increased exponentially until recently
• In developing countries energy use increased proportionally to population until recently
• Primary Energy Mix ?
Primary Energy Use 1800-2000
Grubler, A. “Energy Transitions”

Grubler, A. “Energy Transitions”
Primary Energy Mix 1850-2010
IAASA – Global Energy Assessment 2012

Grubler, A. “Energy Transitions”
Primary Energy Mix 1850-2010
• Mostly biomass in 1850
• Increasing diversification of energy vectors
IAASA – Global Energy Assessment 2012

Grubler, A. “Energy Transitions”
Primary Energy Mix 1850-2010

Primary Energy Mix 1800-2040
• Energy Transition: The switch from an economic system dependent on one or a series of energy sources and technologies to another (Fouquet & Pearson, 2012)

Primary Energy Mix 1800-2040
• Energy Transition: The switch from an economic system dependent on one or a series of energy sources and technologies to another (Fouquet & Pearson, 2012)
Energy Transition biomass to coal

Primary Energy Mix 1800-2040
• Energy Transition: The switch from an economic system dependent on one or a series of energy sources and technologies to another (Fouquet & Pearson, 2012)
Energy Transition biomass to coal Energy Transition coal to oil

Primary Energy Mix 1800-2040
• Energy Transition: The switch from an economic system dependent on one or a series of energy sources and technologies to another (Fouquet & Pearson, 2012)
Energy Transition biomass to coal Energy Transition coal to oil
Stabilization

Energy Eras and Transitions
• Energy Transformations before industrial civilization:

Energy Eras and Transitions
• Energy Transformations before industrial civilization: – Solar radiation – food & feed, light and heat
– Animate labor from humans and work animals (levers, inclined planes, pulleys) – mechanical work & transport
– Kinetic energies of water & wind – mechanical work & transport
– Biomass fuels (wood, charcoal, crop residues, dung) –residential & industrial heat and light

Energy Eras and Transitions
• Energy Transformations before industrial civilization: – Dominant in the western world until the 2nd half of the 19th century
– Dominant for most of humankind until middlle of the 20th century
– Annual per capita primary energy consumption < 20 GJ

Energy Units and Scales
IAASA – Global Energy Assessment 2012

Energy Eras and Transitions
• Energy Transformations that came with industrial civilization: – Fossil fuels – heat & mechanical work & transport (steam
engines, internal combustion engines and steam turbines)

Energy Transitions
• An aggregated transition to other energy source(s) includes numerous services and sectors
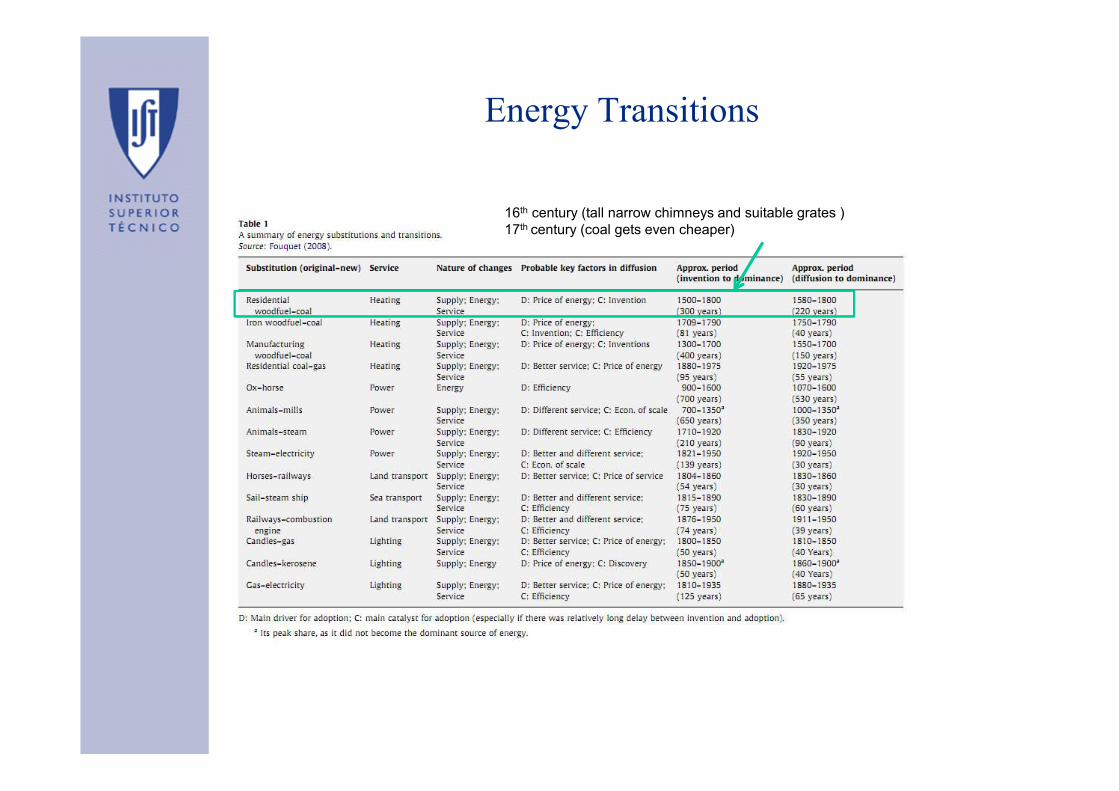
Energy Transitions
• The switch from an economic system dependent on one or a series of energy sources and technologies to another (Fouquet & Pearson, 2012)
16th century (tall narrow chimneys and suitable grates )17th century (coal gets even cheaper)

Energy Transitions
• The switch from an economic system dependent on one or a series of energy sources and technologies to another (Fouquet & Pearson, 2012)
1709 (coke)18th century (efficiency improvments)
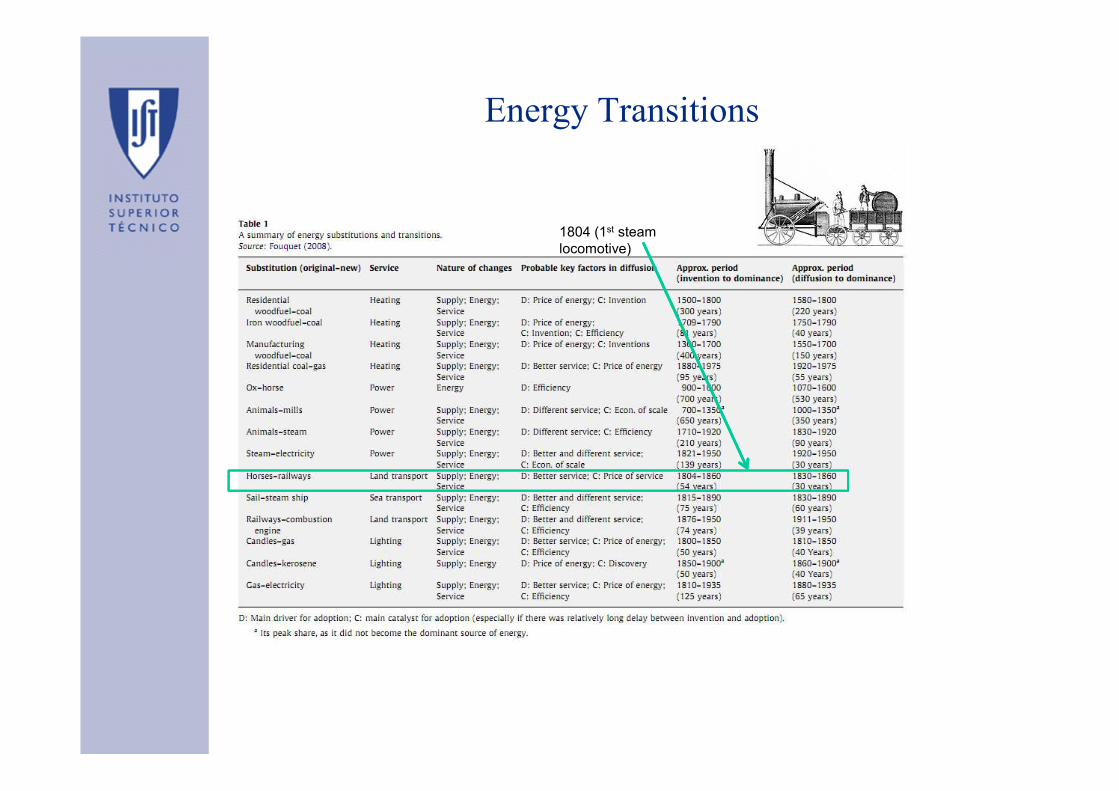
Energy Transitions
• The switch from an economic system dependent on one or a series of energy sources and technologies to another (Fouquet & Pearson, 2012)
1804 (1st steam locomotive)
Why do energy transitions occur?
• Main Drivers/Catalyst for adoption of a new energy carrier:– Price of energy
– Better/Different Service
– Technological change and innovation
– Efficiency improvments

Why do energy transitions occur?
• Main Drivers/Catalyst for adoption of a new energy carrier:– Price of energy
– Better/Different Service
– Technological change and innovation
– Efficiency improvments
– Environmental Impacts?

Power generation 1990-2010
• Despite an increasing contribution across two decades, the
share of non-fossil generation has failed to keep pace with the
growth in generation from fossil fuels.
© OECD/IEA
2012
Ele
ctri
city
ge
ne
ratio
n (
TW
h)
Sh
are
of e
lect
rici
ty (
%)
Nuclear
HydroNon-hydro renewables
IEA - Energy Technology Perspectives 2012

Final Energy from 1900-2000
World final energy use by consumers.Solids (such as coal and biomass,brown), Liquids (such as oil, red) and fuels delivered via dedicated Grids (such as natural gas and electricity, green).
Grubler, A. “Energy Transitions”

Final Energy from 1900-2000
World final energy use by consumers.Solids (such as coal and biomass,brown), Liquids (such as oil, red) and fuels delivered via dedicated Grids (such as natural gas and electricity, green).
“With rising incomes, consumers payincreasing attention to convenience and cleanliness, favoring liquids and grid-delivered energy forms”
Grubler, A. “Energy Transitions”

Final Energy from 1900-2000
World final energy use by consumers.Solids (such as coal and biomass,brown), Liquids (such as oil, red) and fuels delivered via dedicated Grids (such as natural gas and electricity, green).
Developing countries
OECD (squares)
Grubler, A. “Energy Transitions”

Final Energy from 1900-2000
World final energy use by consumers.Solids (such as coal and biomass,brown), Liquids (such as oil, red) and fuels delivered via dedicated Grids (such as natural gas and electricity, green).
Heterogeneity in final energy quality
Grubler, A. “Energy Transitions”

Final Energy per capita in 2010
• Heterogeneity in Final Energy Use per capita:
IAASA – Global Energy Assessment 2012

What is Final Energy used for?
• UK 1800-2000
IAASA – Global Energy Assessment 2012

What is Final Energy used for?
• Regular expansion ofenergy services in 19th
– dominated by heat and transport
• High volatility due topolitical and economic events
• Moderated growth after 1950– Decline in industrial energy services compensated by strong
growth in transport
• Saturated at a level of 6 EJ or 100 GJ/capita
• What about energy services?
IAASA – Global Energy Assessment 2012

From Final Energy to Energy Services
• UK 1800-2000
IAASA – Global Energy Assessment 2012

• UK 1800-2000
• Increasing efficiencies in converting final energy to energy services– Ranges between a factor
of 5 for transportation and 600 for lighting
From Final Energy to Energy Services
IAASA – Global Energy Assessment 2012

• UK 1800-2000
• Lower prices of energyservices– Ranges between a factor
of 10 for heating and 70 for lighting
From Final Energy to Energy Services
IAASA – Global Energy Assessment 2012

Energy Services 2005
• Energy services cannot be expressed in common units
• Transport– 13 km/day/per capita
– 1 ton 20 km/day/per capita
• Industry– 9 ton/year/per capita (steel +
fertilizers + constructionmaterials + plastics …
• Buldings– Heating/cooling to 20m2/per capita
• Useful energy – minimizes distortions among
different energy service categories, as it most closely measures the actual energy service provided.

Energy and Economics

Energy Management
Class # 9 : Energy Economics
Per capita energy use
kW/capita GJ/capita
Region 1990 2008 1990 2008
USA 10.2 10.0 320.5 314.0
EU-27 4.6 4.7 144.9 147.0
Middle East 2.2 4.0 69.9 125.2
China 1.0 2.1 31.8 67.0
Latin America
1.3 1.6 40.6 51.9
Africa 0.8 0.9 25.5 28.1
India 0.5 0.7 15.9 22.6
Others* 2.9 2.7 90.8 85.9
The World 2.2 2.4 69.9 76.6
Energy Management
Class # 9 : Energy Economics
What are the links between Energy and Economics? (Smil)
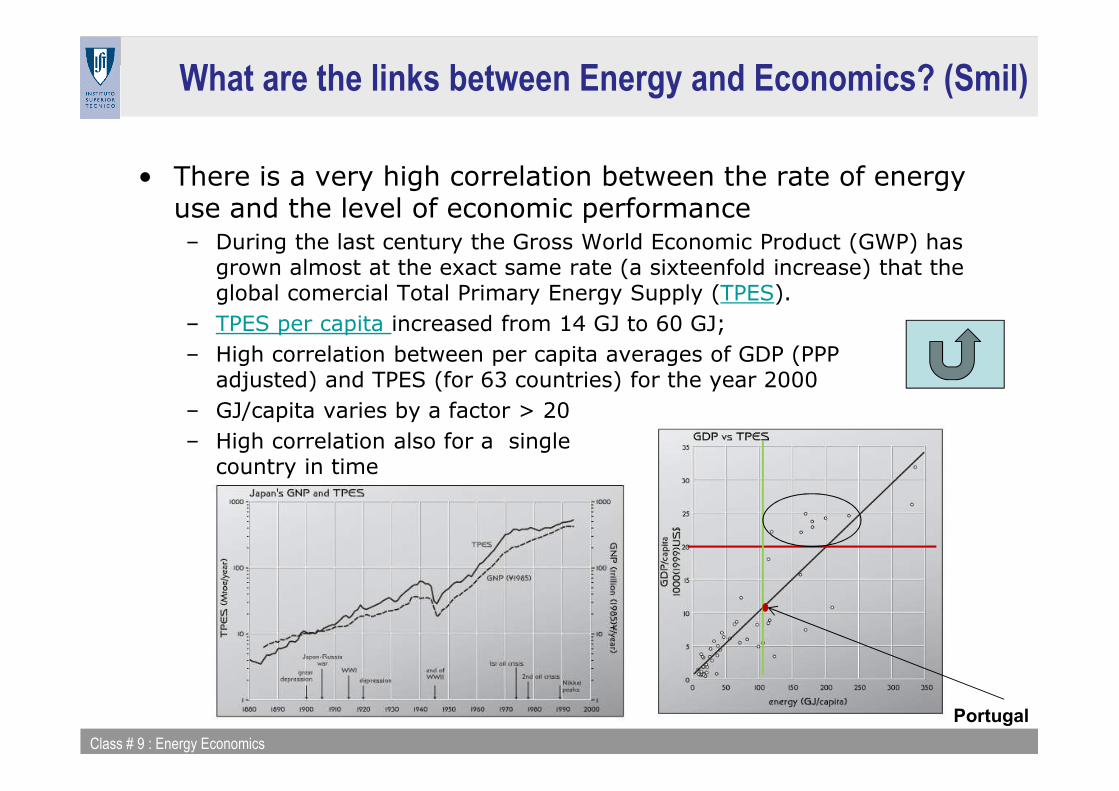
• There is a very high correlation between the rate of energyuse and the level of economic performance – During the last century the Gross World Economic Product (GWP) has
grown almost at the exact same rate (a sixteenfold increase) that the global comercial Total Primary Energy Supply (TPES).
– TPES per capita increased from 14 GJ to 60 GJ;
– High correlation between per capita averages of GDP (PPP adjusted) and TPES (for 63 countries) for the year 2000
– GJ/capita varies by a factor > 20
– High correlation also for a single country in time
Portugal
Energy Management
Class # 9 : Energy Economics
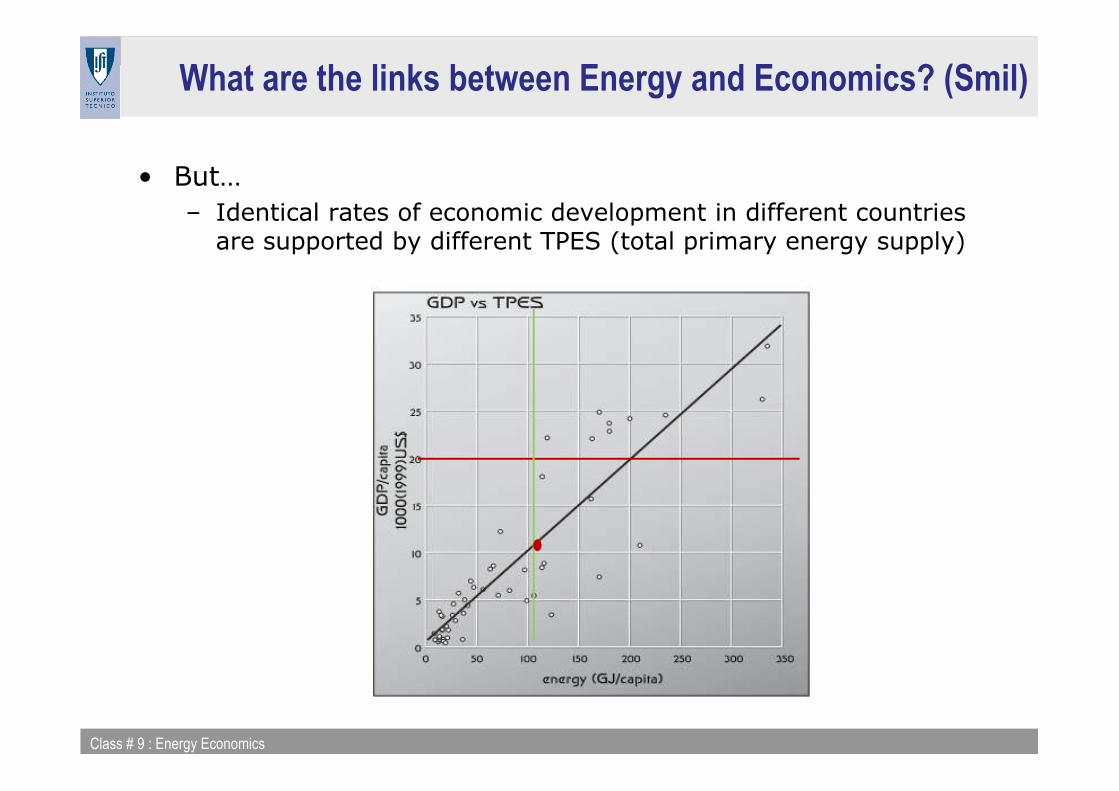
What are the links between Energy and Economics? (Smil)
• But…
– Identical rates of economic development in different countries are supported by different TPES (total primary energy supply)

Energy Management
Class # 9 : Energy Economics
What are the links between Energy and Economics? (Smil)
• Energy intensity (energy use per unit of GDP):
– A measure of the efficiency of a country in using energy
– Which (low or high) values correspond to environmental andeconomic advantages?
– EI for the World decreased from 3.3 kWh/US$2012 in 1900 to 1.8 kWh kWh/US$2012 in 2010
Brito & Sousa (2016)
KW
h/U
S$2
01
2

Energy Management
Class # 9 : Energy Economics
What are the links between Energy and Economics? (Smil)
• Energy intensity in time for countries:
– EI changes with development stage
– EI rises during early stages of industrialization, its peak issharp and short, and then declines as mature economies use inputs more efficiently

Energy Management
Class # 9 : Energy Economics
What are the links between Energy and Economics? (Smil)
• Energy intensity for different countries in 1999:
– Most countries have EI between 5 and 13 MJ/$ PPP
– EI does not depend on the GDP/capita (e.g., India andAustralia have similar EI)

Energy Management
Class # 9 : Energy Economics
What are the links between Energy and Economics? (Smil)
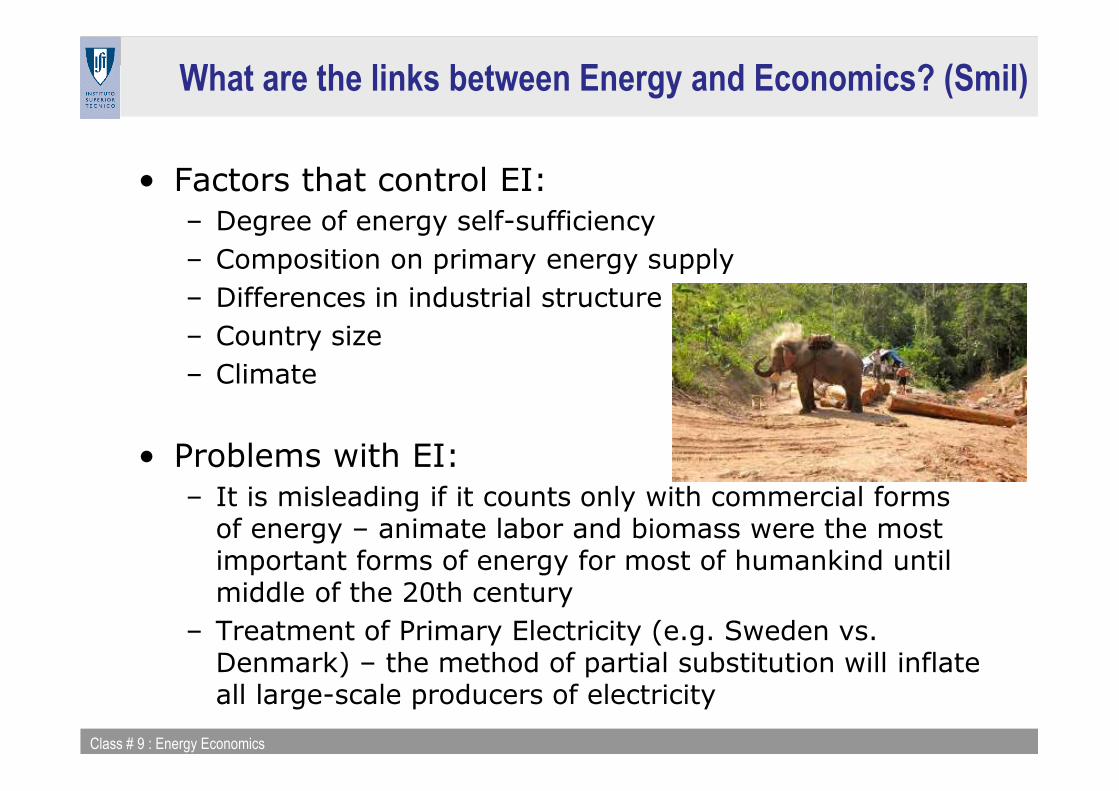
• Factors that control EI:
– Degree of energy self-sufficiency
– Composition on primary energy supply
– Differences in industrial structure
– Country size
– Climate
Energy Management
Class # 9 : Energy Economics
What are the links between Energy and Economics? (Smil)
• Factors that control EI:
– Degree of energy self-sufficiency
– Composition on primary energy supply
– Differences in industrial structure
– Country size
– Climate
• Problems with EI:
– It is misleading if it counts only with commercial formsof energy – animate labor and biomass were the mostimportant forms of energy for most of humankind untilmiddle of the 20th century
– Treatment of Primary Electricity (e.g. Sweden vs. Denmark) – the method of partial substitution will inflateall large-scale producers of electricity
Energy Management
Class # 9 : Energy Economics
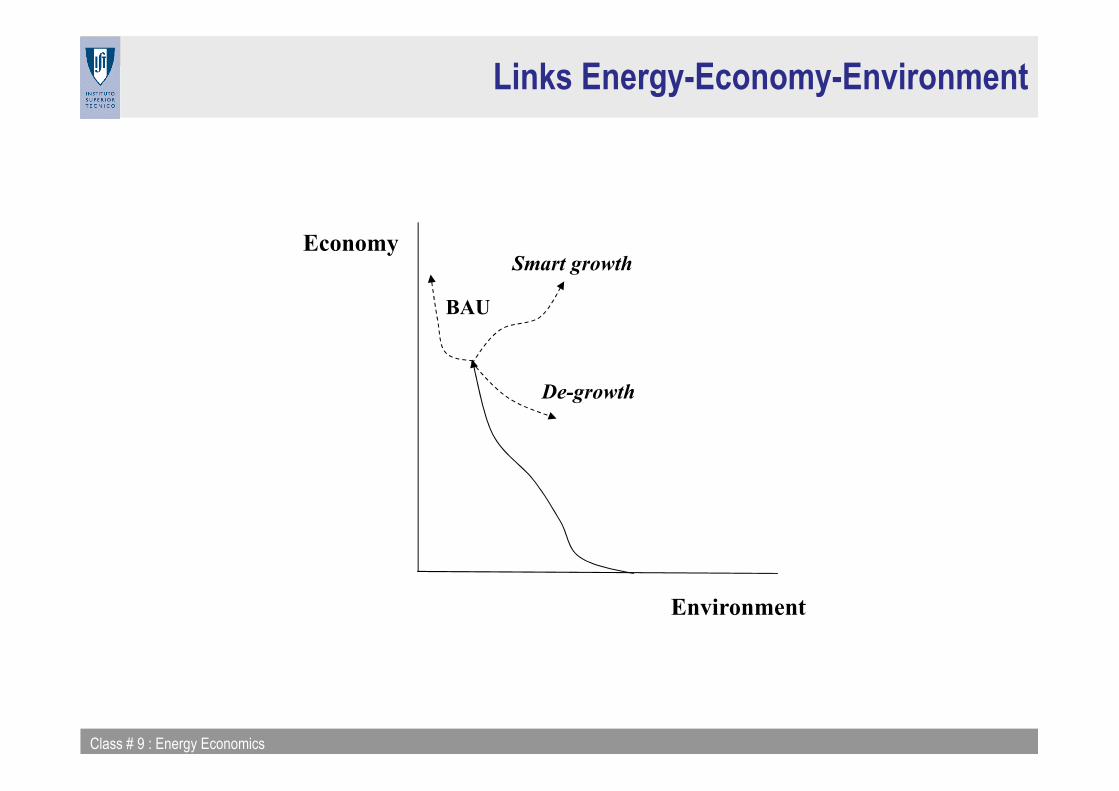
Links Energy-Economy-Environment
Environment
Economy
De-growth
Smart growth
BAU

Energy Management
Class # 9 : Energy Economics
Links Energy-Economy-Environment
• What will the economy in the future look like?
More self-reliant local economiesand ways of life
Global Economydependent onrenewable energies
Similar to the present but bigger
Models will help us understand theimpact of energy supply & technological innovations & policymeasures on the environment andthe economy?
Environment
Economy
Smart growth
BAU
De-growth

Energy Management
Class # 9 : Energy Economics
Issues in modeling energy-economy interactions
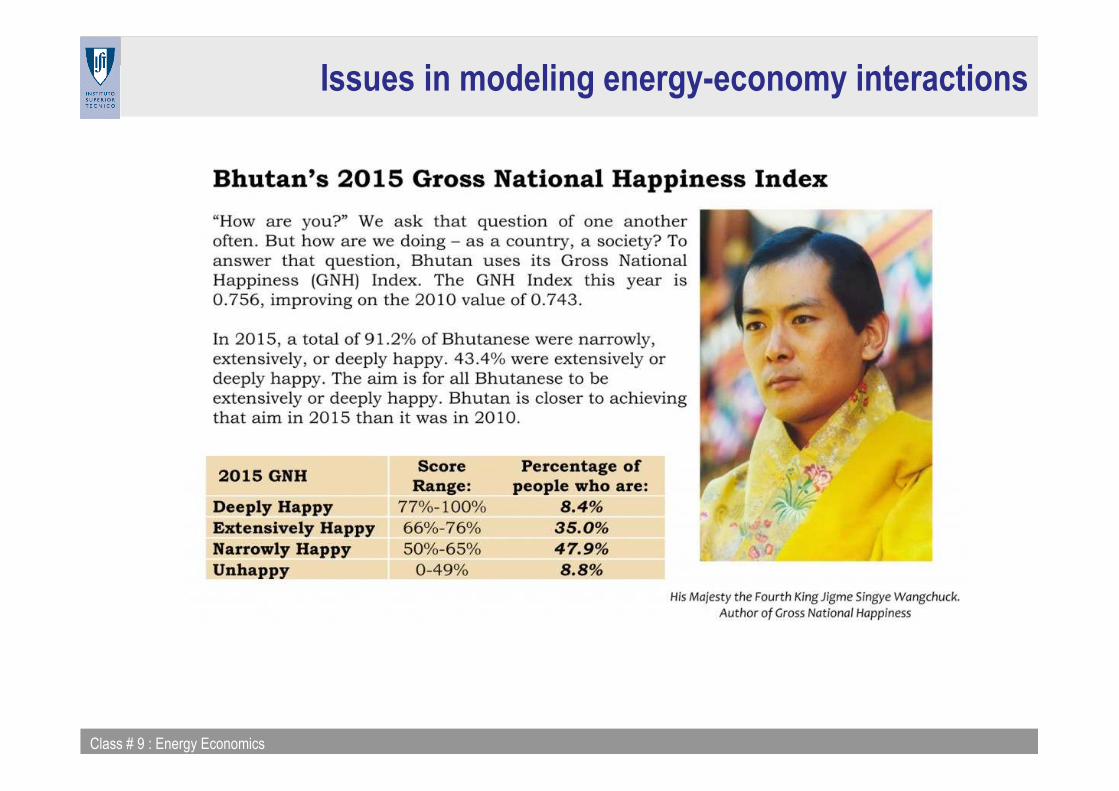
1. Trade-offs for people between environmentalquality ( with the use of energy) and income( with the use of energy)
– Is GDP enough?

Energy Management
Class # 9 : Energy Economics
Issues in modeling energy-economy interactions
1. Trade-offs for people between environmentalquality ( with the use of energy) and income( with the use of energy)
– GDP: There are important factors for the quality of lifesuch as inequality in the society, environmental qualityand unemployment rate that are related with GDP butthat are not controlled only by GDP (http://www.beyond-gdp.eu/)

Energy Management
Class # 9 : Energy Economics
Issues in modeling energy-economy interactions
1. Trade-offs for people between environmentalquality ( with the use of energy) and income( with the use of energy)
1 Norway 0.9442 Australia 0.9353 Switzerland 0.9304 Denmark 0.9235 Netherlands 0.9226 Germany 0.9166 Ireland 0.9168 United States 0.9159 Canada 0.9139 New Zealand 0.913
178 Guinea-Bissau 0.420179 Mali 0.419180 Mozambique 0.416181 Sierra Leone 0.413182 Guinea 0.411183 Burkina Faso 0.402184 Burundi 0.400185 Chad 0.392186 Eritrea 0.391187 Central African Republic 0.350188 Niger 0.348
Energy Management
Class # 9 : Energy Economics
Issues in modeling energy-economy interactions

Energy Management
Class # 9 : Energy Economics
Utility functions: a review
• Utility functions specify the hapiness U of a person or a population as a function of consumedgoods X1, X2, …:
• Examples:
• Issues:
• Indiference curves (substitutability betweengoods)
1 2 ....b cU aX X=
1 2 ....U a bX cX= + + +
( )1 2min , ,....U aX bX=
Cobb-Douglas Utility Function
Linear Utility Function
Leontief Utility Function
1max ( ,..., ) . .n i i
i
U U X X s t X P m= ≤∑
x1
x2
U(x1,x2) = x1x2;
Energy Management
Class # 9 : Energy Economics
Issues in modeling energy-economy interactions
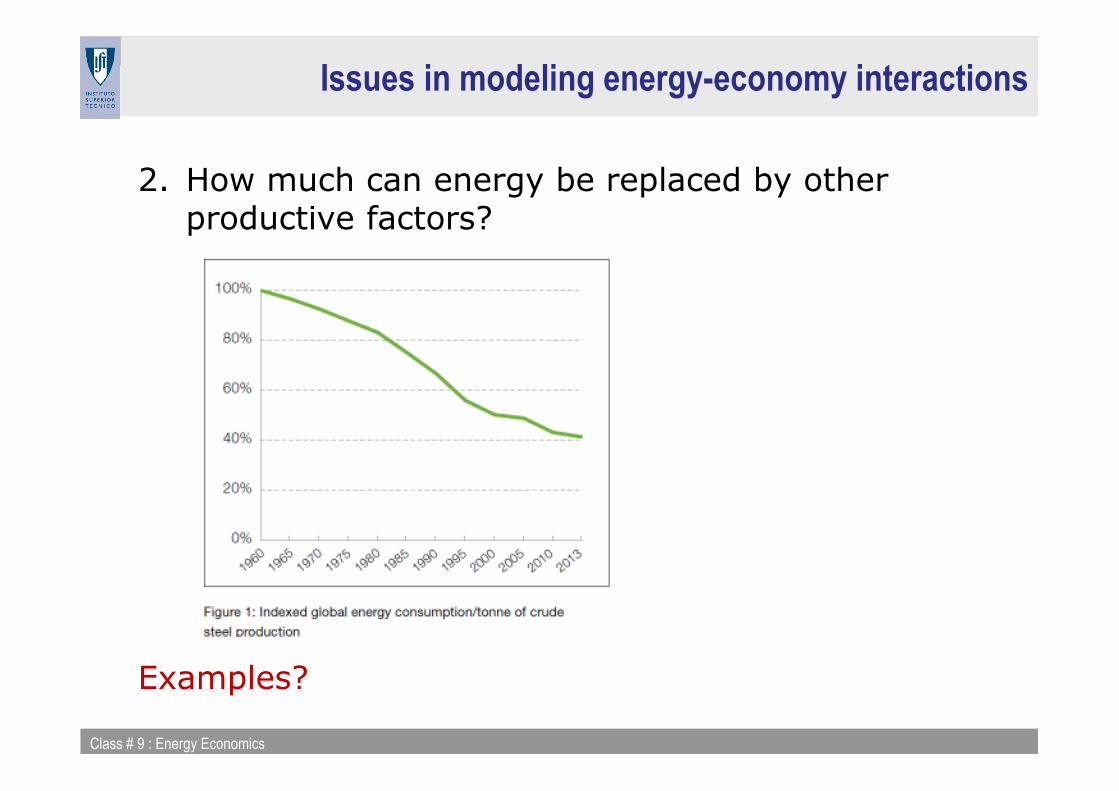
2. How much can energy be replaced by other productive factors?
Examples?

Energy Management
Class # 9 : Energy Economics

Energy Management
Class # 9 : Energy Economics
Production Functions: a review
• Production functions specify the output Q of aneconomy as a function of inputs X1, X2, …:
• Examples:
• Issues:
• What are the relevant production factors (K, L, E, M, T, ….)
• How much are they substitutable?
1 2( , ,...)Q f X X=
1 2 ....b cQ aX X=
1 2 ....Q a bX cX= + + +
( )1 2min , ,....Q aX bX=
Cobb-Douglas Production Function
Linear Production Function
Leontief Production Function

Energy Management
Class # 9 : Energy Economics
Issues in modeling energy-economy interactions
2. How much can energy be replaced by otherproductive factors?
– Production functions that have energy as a productionfactor, e.g., LINEX (Ayres):
+ = − + −
exp ( ) 2 ( ) ( ) 1L U L
Q AU a t a t b tK U

Energy Management
Class # 9 : Energy Economics
Issues in modeling energy-economy interactions
3. How much are different forms of energyreplaceable by each other?
– Transport is the most problematic use
– Possibility of replacing oil liquids in internal combustionengines by more efficiency, other fossil (coal-to-liquids, tar sands, oil shale) or renewables (ethanol, biodiesel)
Electric cars (driving range; Recharge time, 4 to 8 hours, battery cost, bulk & weight)
Hydrogen cars (hydrogeninfrastructure and cost)

Energy Management
Class # 9 : Energy Economics
4. What is the energy that really matters (primary, final, useful, productive or useful work)?
– During the twentieth century the quantity of final energy taken from one unit of primary energy has doubled or even tripled
– The energy that is more intimated related with productivity is the productive energy but this is also the most difficult one to quantify
– What about the energy used for non-productive activities?
Issues in modeling energy-economy interactions
Energy Management
Class # 9 : Energy Economics
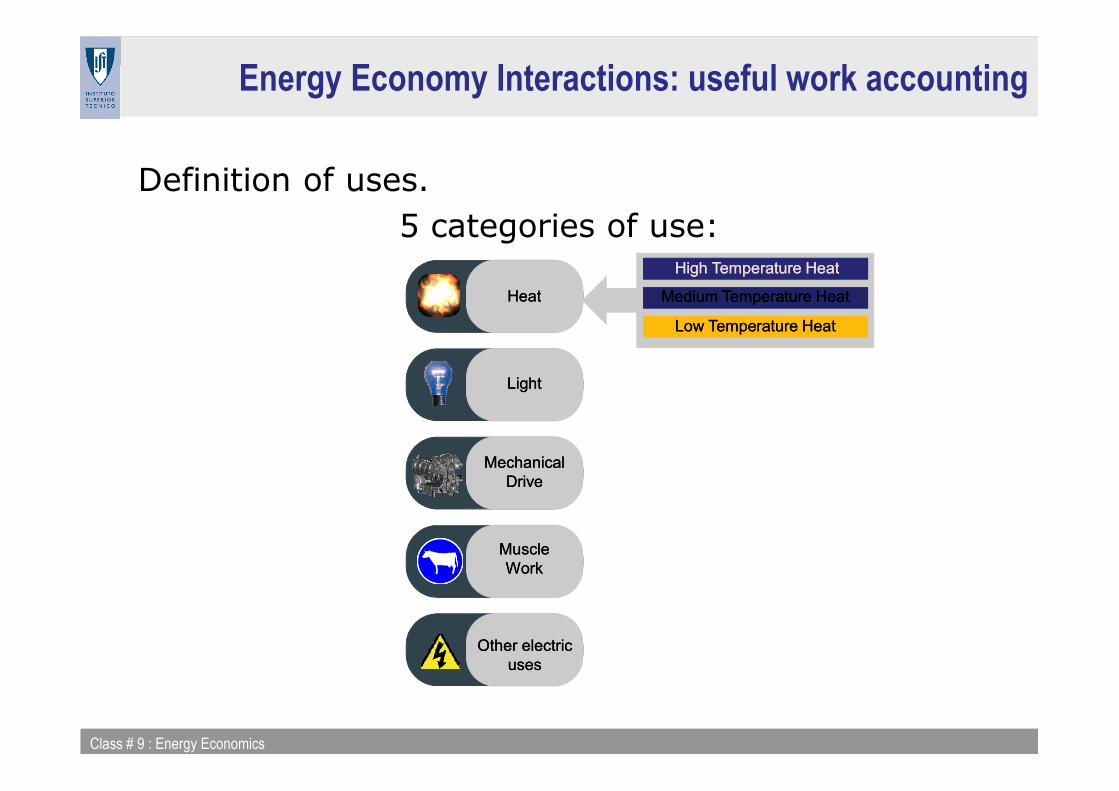
Energy Economy Interactions: useful work accounting
Definition of uses.
5 categories of use:High Temperature HeatHigh Temperature Heat
Medium Temperature HeatMedium Temperature Heat
Low Temperature HeatLow Temperature Heat
HeatHeat
LightLight
Mechanical Drive
Mechanical Drive
Muscle Work
Muscle Work
Other electric uses
Other electric uses

Energy Management
Class # 9 : Energy Economics
Issues in modeling energy-economy interactions
5. Investment in renewable energies and energyefficiency technologies
– Depends on the price of fossil fuels;
the power of the sun to enrich our lives as we move away from our
crippling dependence on foreign oil.” Jimmy Carter, 1979

Energy Management
Class # 9 : Energy Economics
Issues in modeling energy-economy interactions
5. Investment in renewable energies and energyefficiency technologies
– Controls conversion efficiencies between primary, final and useful energy;
– Controls price of renewable energies;
Energy Management
Class # 9 : Energy Economics
Issues in modeling energy-economy interactions
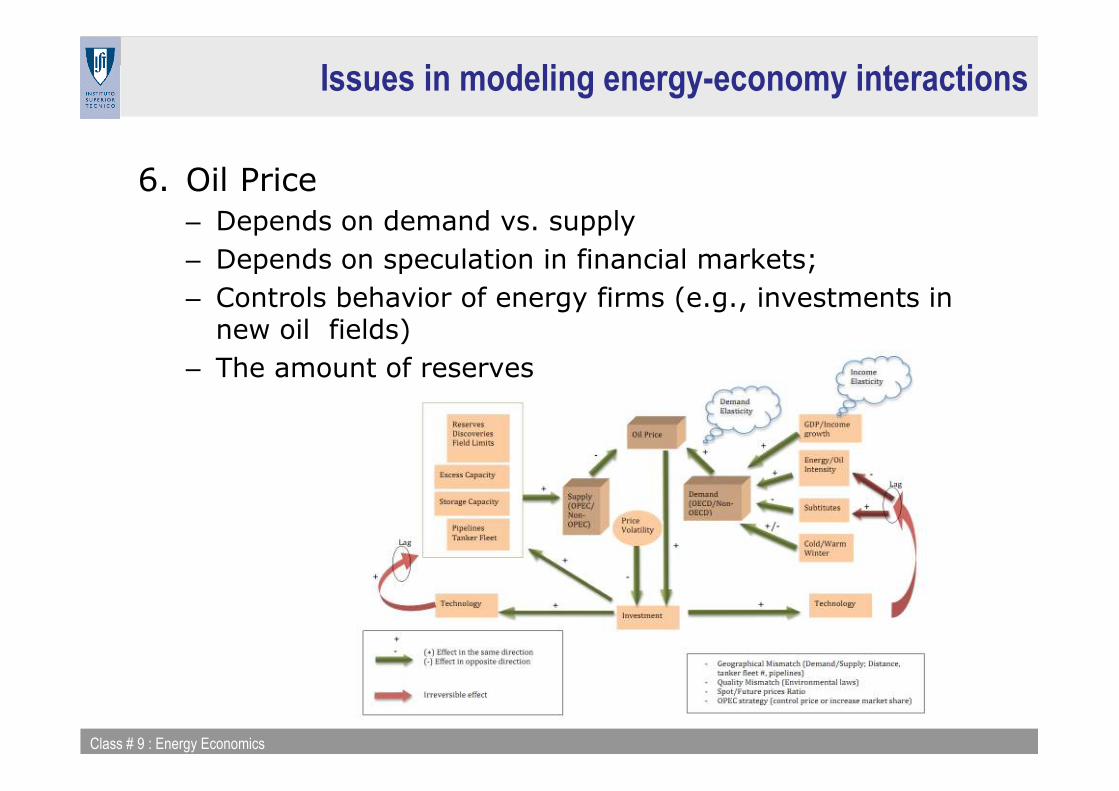
6. Oil Price
– Depends on demand vs. supply
– Depends on speculation in financial markets;
– Controls behavior of energy firms (e.g., investments in new oil fields)
– The amount of reserves

Energy Management
Class # 9 : Energy Economics
Issues in modeling energy-economy interactions
7. Energy game changers such as accidents (Japan, 2010)
OVER 70% OF JAPANESE AGAINST
NUCLEAR POWER PLANTS AFTER
FUKUSHIMA TRAGEDY

Energy Management
Class # 9 : Energy Economics
City ON – an energy-economy model
• Energy (electricity) is the onlyproduction factor
• Electricity has both a productive(industry and servicesconsumption) and non-productive (residential andmunicipal consumption) role
• Services and industry produceadded-value to the economy as a whole

Energy Management
Class # 9 : Energy Economics
City ON – an energy-economy model
• The central planner splitsincome between building powerplants, technologydevelopment, resources(constant prices) andconsumption
• Households have an utility function that depends on pollution generated by the electricity production sector and useful consumption
• Transformation between final and useful consumption depends on efficiency
• A central planner has to keeppeople happy (high usefulconsumption + low pollution)

Energy Management
Class # 9 : Energy Economics
City ON – an energy-economy model
• Power plants can be renewable and non-renewable.
• Non-renewable power plants pollute & Renewable plantsdepend on wind, sun and wateravailability
• Characterizationof power plantsand technology development (& investment) were realistic

Energy Management
Class # 9 : Energy Economics
City ON – an energy-economy model
• This model was used byBiodroid to develop a serious game to EDP
• It was applied to Portugal with some adjustments to forecast optimal electricityproduction & GDP evolution– Supply should have a more
relevant role for renewablesdue to environmentalimpacts.

Energy Management
Class # 9 : Energy Economics
City ON – an energy-economy model
• Improvements??

Energy Management
Class # 9 : Energy Economics
Energy Wars – an energy-economy model
• Introduce more production factors (labor, capital andtechnology)
• Introduce energy scarcity to simulate dependence ofeconomic growth on energy
• Introduce more types of energy (at least oil & renewableelectricity) to simulate whether the economy can make a smooth transition between fossils and renewables
• Introduce mechanisms that are relevant for the oil priceformation (speculation, decisions on investments by energyfirms, decisions of oil consumption by non-energy firms andhouseholds)
• There is no central planner to make decisions, i.e., households, the energy sector and the non-energy sector have internal dynamics
• A set of 3 models: a macroeconomic model, and 2 agent-based models for energy firms and for financial markets