Embed Size (px)
Citation preview
UHERO.HAWAII.EDU ©2010
Hawai‘i’s Energy Policy and
role of Biofuels Kanae Tokunaga
ENERGY AND GREENHOUSE GAS SOLUTIONS PROGRAM
NORTHEAST ASIA ECONOMIC FORUM YOUNG LEADERS PROGRAM
UHERO.HAWAII.EDU ©2010
Hawai‘i is No. 1!
UHERO.HAWAII.EDU ©2010
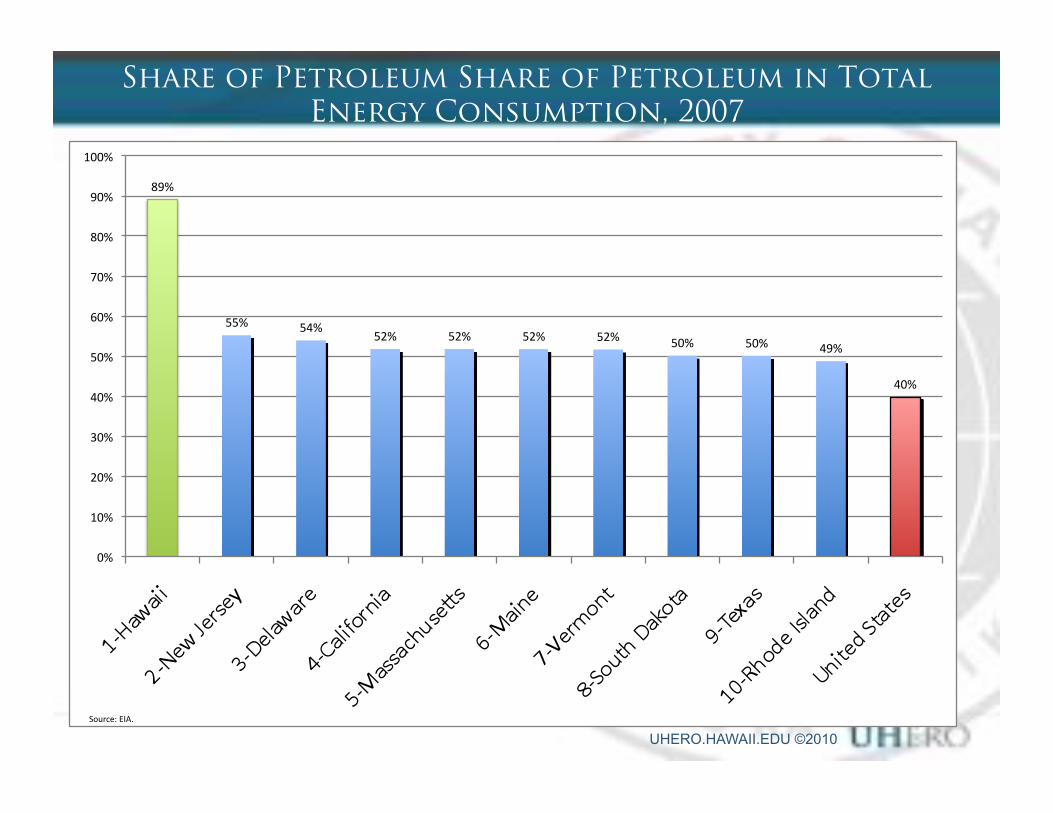
Share of Petroleum Share of Petroleum in Total Energy Consumption, 2007
89%$
55%$ 54%$52%$ 52%$ 52%$ 52%$ 50%$ 50%$ 49%$
40%$
0%$
10%$
20%$
30%$
40%$
50%$
60%$
70%$
80%$
90%$
100%$
Source:$EIA.$
UHERO.HAWAII.EDU ©2010
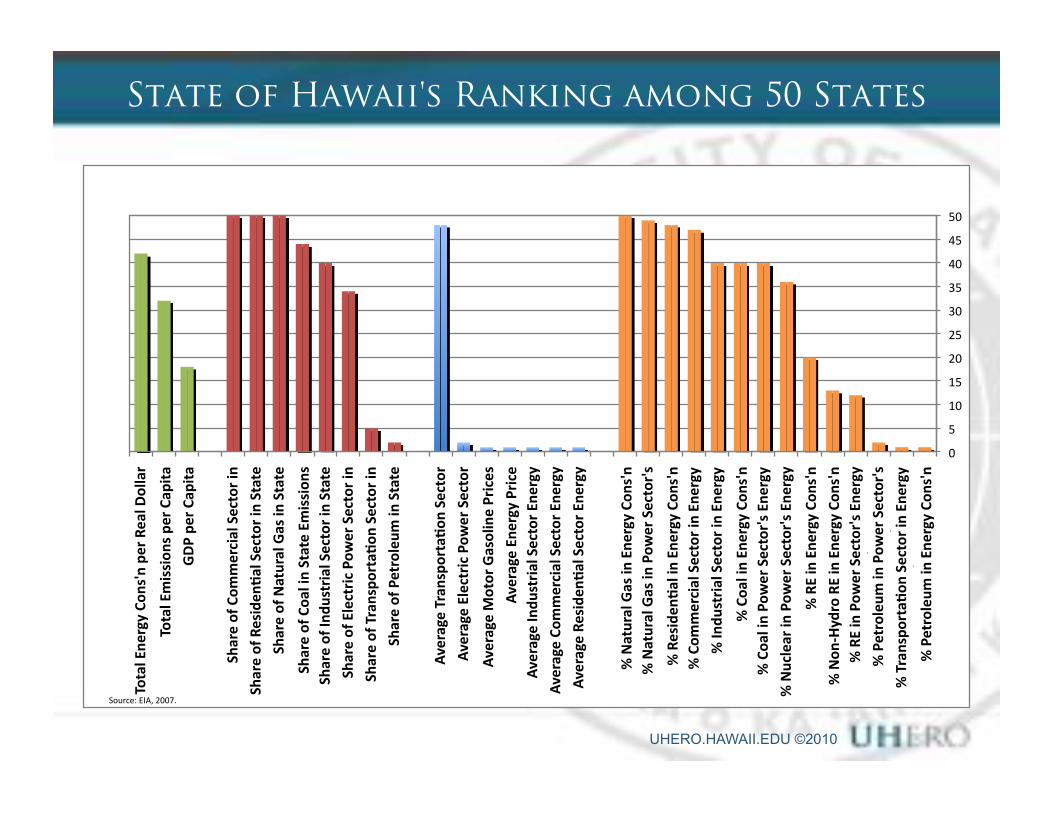
State of Hawaii's Ranking among 50 States
0$
5$
10$
15$
20$
25$
30$
35$
40$
45$
50$
%"Petroleum
"in"Ene
rgy"Co
ns'n"
%"Transpo
rta6
on"Sector"in"Ene
rgy"
Cons'n"
%"Petroleum
"in"Pow
er"Sector's"
Energy"Con
s'n"
%"RE"in"Pow
er"Sector's"En
ergy"
Cons'n"
%"Non
<Hydro"RE"in"Ene
rgy"Co
ns'n"
%"RE"in"Ene
rgy"Co
ns'n"
%"Nuclear"in"Pow
er"Sector's"En
ergy"
Cons'n"
%"Coa
l"in"Po
wer"Sector's"En
ergy"
Cons'n"
%"Coa
l"in"En
ergy"Con
s'n"
%"In
dustrial"Sector"in"Ene
rgy"
Cons'n"
%"Com
mercial"Sector"in"Ene
rgy"
Cons'n"
%"Residen
6al"in"Ene
rgy"Co
ns'n"
%"Natural"Gas"in"Pow
er"Sector's"
Energy"Con
s'n"
%"Natural"Gas"in"Ene
rgy"Co
ns'n"
Average"Residen
6al"Sector"En
ergy"
Price"
Average"Com
mercial"Sector"En
ergy"
Price"
Average"In
dustrial"Sector"En
ergy"
Price"
Average"Ene
rgy"Price"
Average"M
otor"Gasoline"Prices"
Average"Electric"Po
wer"Sector"
Energy"Price"
Average"Transpo
rta6
on"Sector"
Energy"Price"
Share"of"Petroleum
"in"State"
Emission
s"
Share"of"Transpo
rta6
on"Sector"in"
State"Em
ission
s"
Share"of"Electric"Po
wer"Sector"in"
State"Em
ission
s"
Share"of"In
dustrial"Sector"in"State"
Emission
s"
Share"of"Coa
l"in"State"Em
ission
s"
Share"of"Natural"Gas"in"State"
Emission
s"
Share"of"Residen
6al"Sector"in"State"
Emission
s"
Share"of"Com
mercial"Sector"in"
State"Em
ission
s"
GDP"pe
r"Ca
pita"
Total"Emission
s"pe
r"Ca
pita"
Total"Ene
rgy"Co
ns'n"per"Real"D
ollar"
of"GDP"
Source:$EIA,$2007.$
UHERO.HAWAII.EDU ©2010
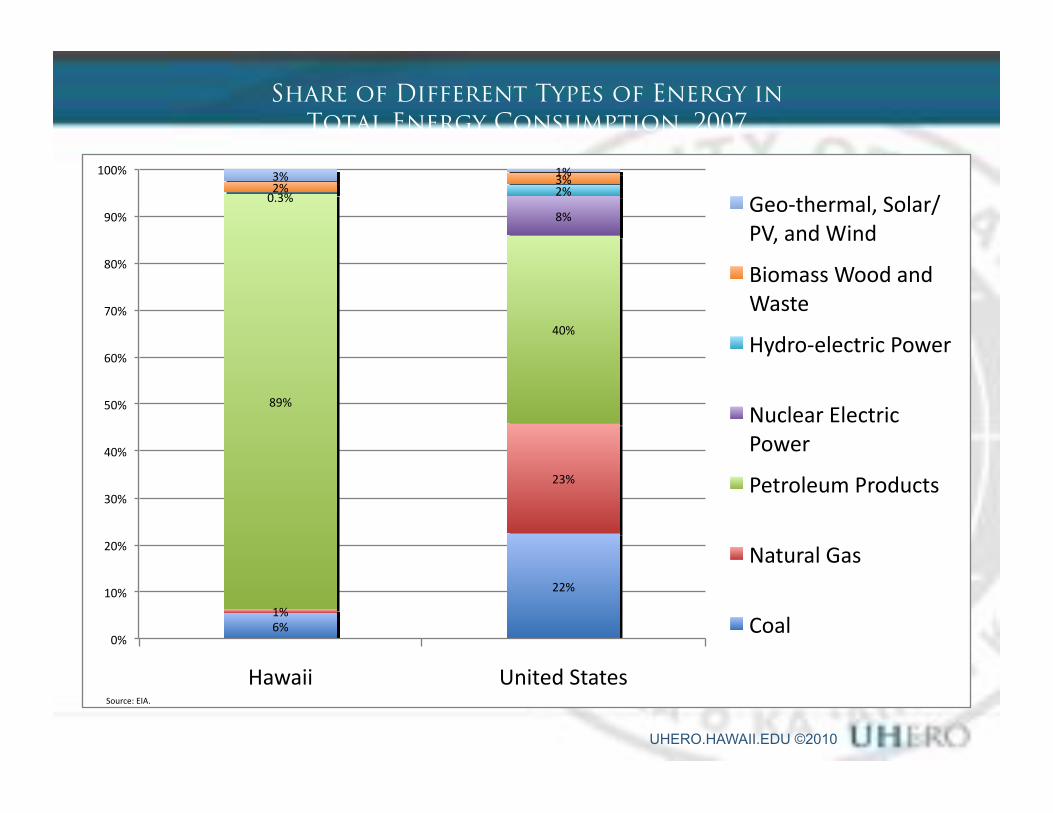
Share of Different Types of Energy in Total Energy Consumption, 2007
6%$
22%$
1%$
23%$
89%$
40%$
8%$
0.3%$ 2%$2%$3%$3%$ 1%$
0%$
10%$
20%$
30%$
40%$
50%$
60%$
70%$
80%$
90%$
100%$
Hawaii$ United$States$
GeoCthermal,$Solar/PV,$and$Wind$
Biomass$Wood$and$Waste$
HydroCelectric$Power$
Nuclear$Electric$Power$
Petroleum$Products$
Natural$Gas$
Coal$
Source:$EIA.$
UHERO.HAWAII.EDU ©2010
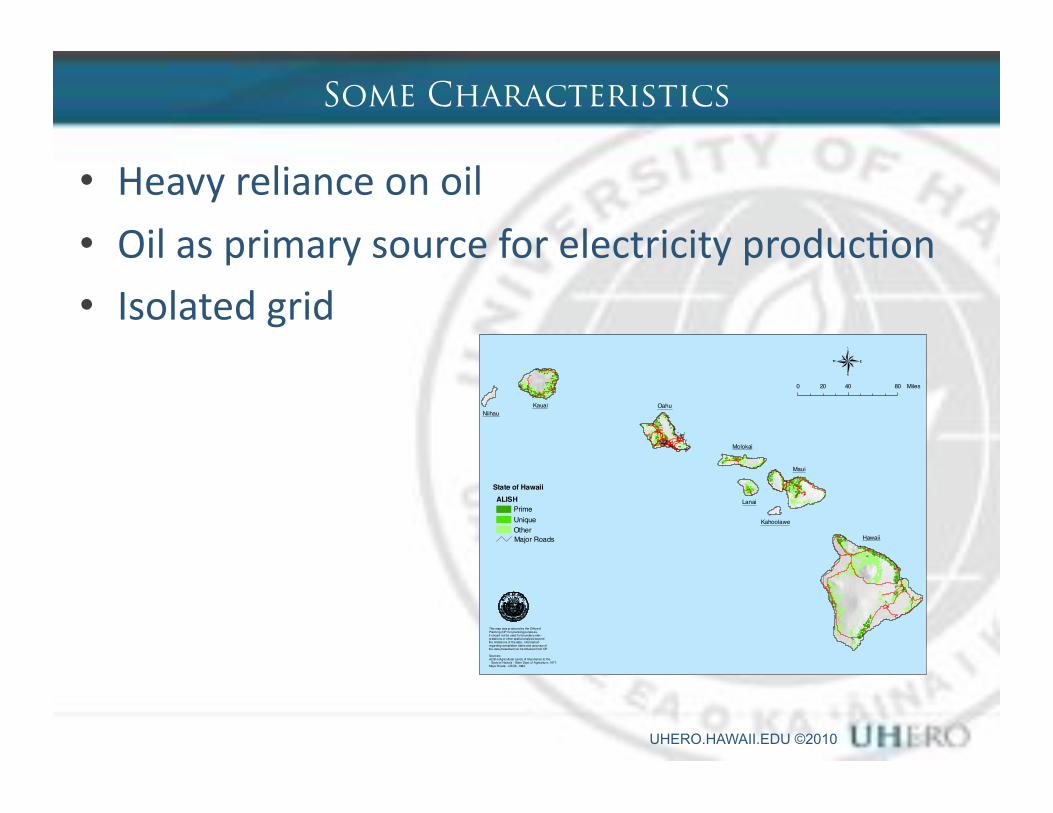
Some Characteristics
•� Heavy$reliance$on$oil$$•� Oil$as$primary$source$for$electricity$producSon$
•� Isolated$grid$
Hawaii
Niihau
Kauai Oahu
Molokai
Lanai
Kahoolawe
Maui
This map was produced by the Office ofPlanning (OP) for planning purposes.It should not be used for boundary inter-pretations or other spatial analysis beyond the limitations of the data. Informationregarding compilation dates and accuracy ofthe data presented can be obtained from OP.
Sources:ALISH (Agricultural Lands of Importance to the State of Hawaii) - State Dept. of Agriculture, 1977.Major Roads - USGS, 1983.
State of Hawaii
ALISH
Prime
Unique
Other
Major Roads
0 40 8020 Miles
UHERO.HAWAII.EDU ©2010
Historical Context
UHERO.HAWAII.EDU ©2010
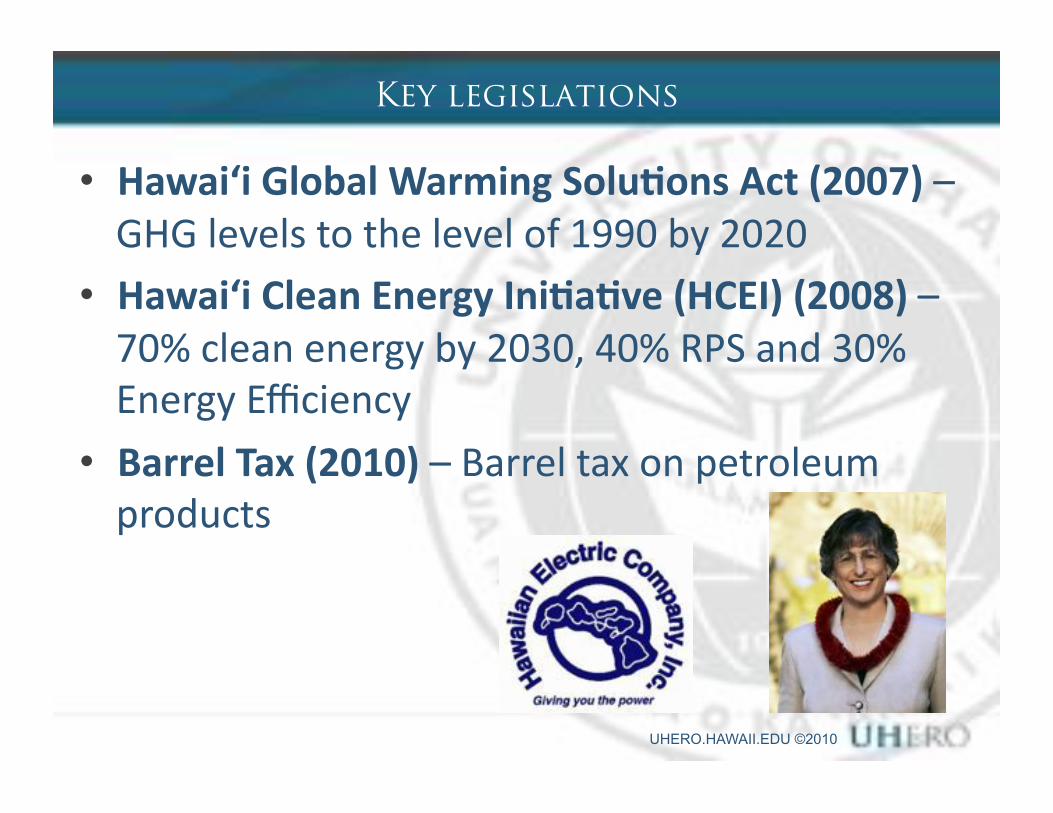
Key legislations
•� Hawai‘i"Global"Warming"Solu6ons"Act"(2007)"–$GHG$levels$to$the$level$of$1990$by$2020$
•� Hawai‘i"Clean"Energy"Ini6a6ve"(HCEI)"(2008)"–$70%$clean$energy$by$2030,$40%$RPS$and$30%$Energy$Efficiency$
•� Barrel"Tax"(2010)"–$Barrel$tax$on$petroleum$products$
UHERO.HAWAII.EDU ©2010
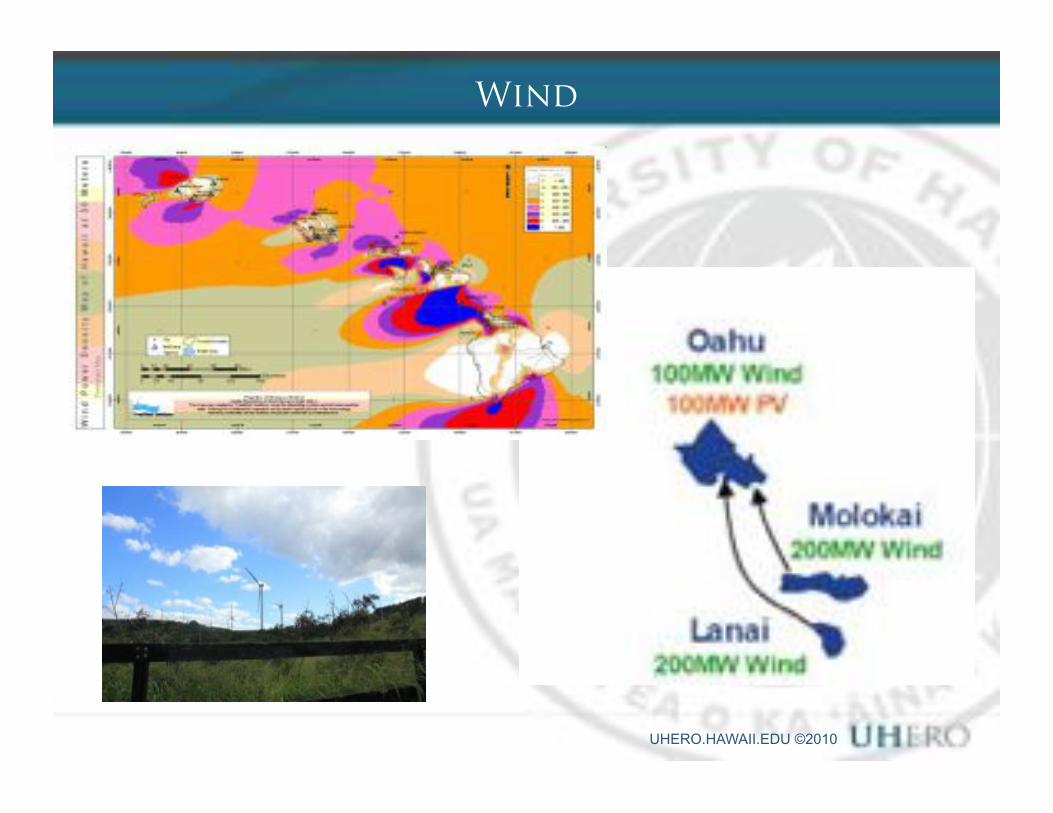
Wind
UHERO.HAWAII.EDU ©2010
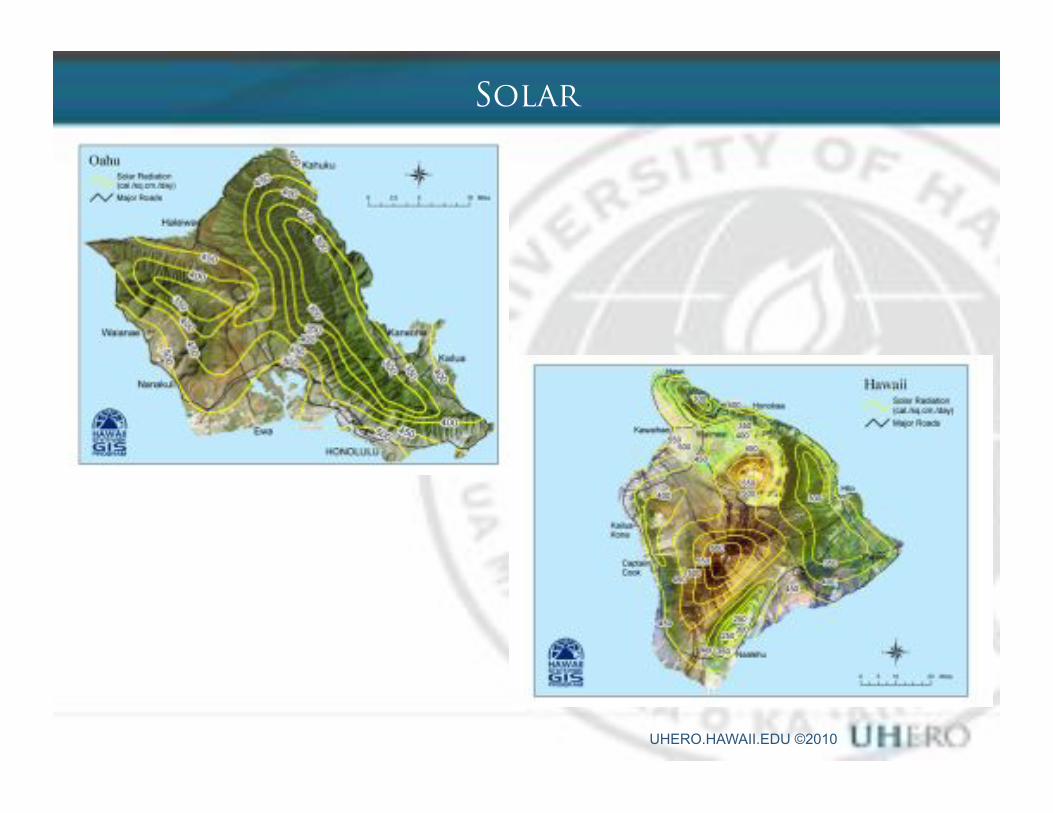
Solar
UHERO.HAWAII.EDU ©2010
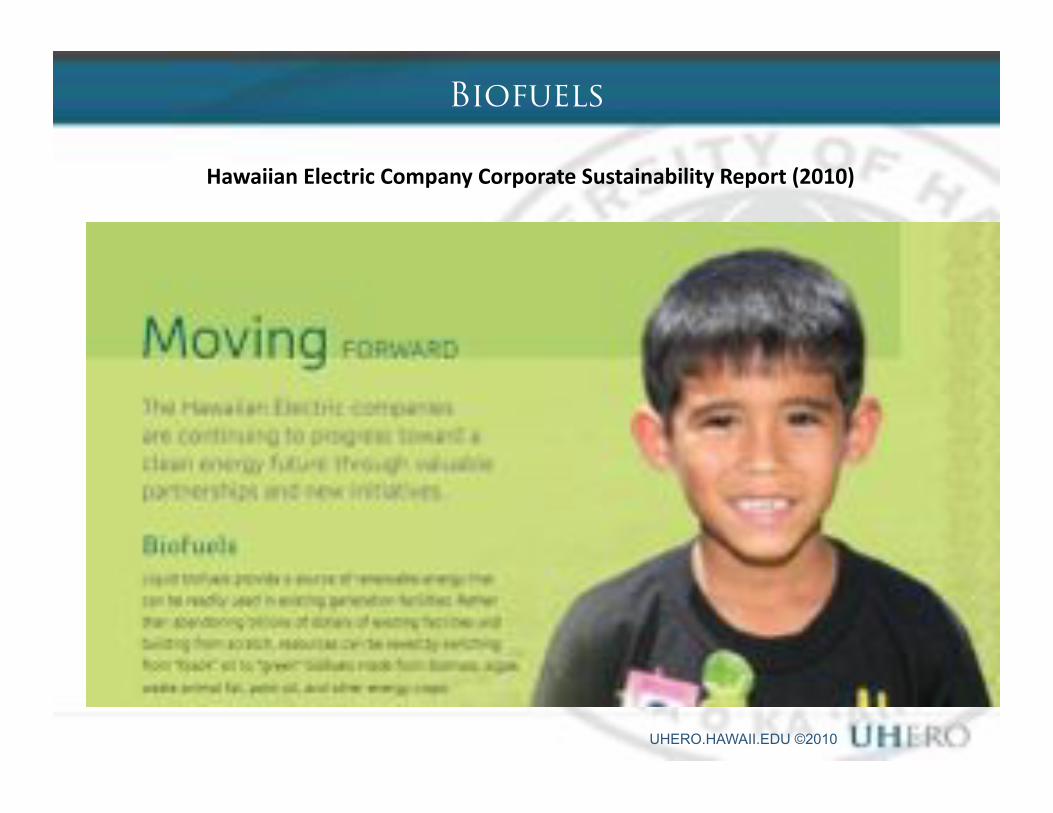
Biofuels
Hawaiian"Electric"Company"Corporate"Sustainability"Report"(2010)"
UHERO.HAWAII.EDU ©2010
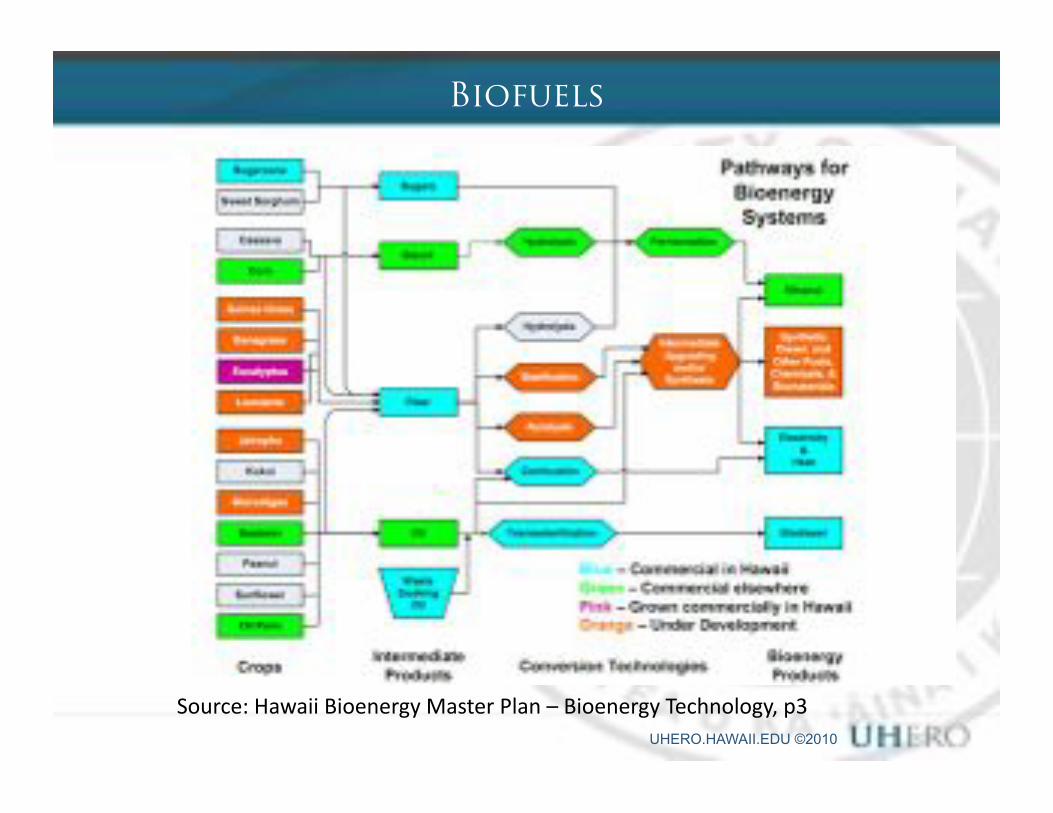
Biofuels
Source:$Hawaii$Bioenergy$Master$Plan$–$Bioenergy$Technology,$p3$
UHERO.HAWAII.EDU ©2010
HAWAII BIOENERGY MASTER PLAN
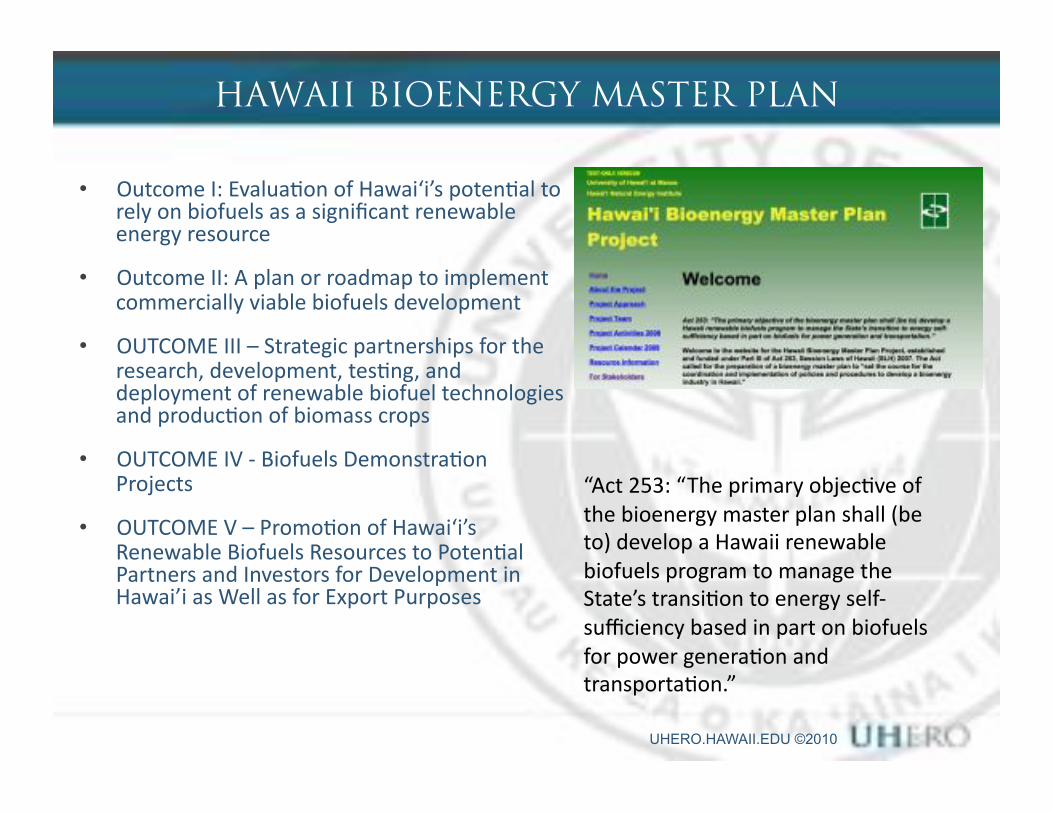
•� Outcome$I:$EvaluaSon$of$Hawai‘i’s$potenSal$to$rely$on$biofuels$as$a$significant$renewable$energy$resource$
•� Outcome$II:$A$plan$or$roadmap$to$implement$commercially$viable$biofuels$development$
•� OUTCOME$III$–$Strategic$partnerships$for$the$research,$development,$tesSng,$and$deployment$of$renewable$biofuel$technologies$and$producSon$of$biomass$crops$
•� OUTCOME$IV$C$Biofuels$DemonstraSon$Projects$
•� OUTCOME$V$–$PromoSon$of$Hawai‘i’s$Renewable$Biofuels$Resources$to$PotenSal$Partners$and$Investors$for$Development$in$Hawai’i$as$Well$as$for$Export$Purposes$
“Act$253:$“The$primary$objecSve$of$the$bioenergy$master$plan$shall$(be$to)$develop$a$Hawaii$renewable$biofuels$program$to$manage$the$State’s$transiSon$to$energy$selfCsufficiency$based$in$part$on$biofuels$for$power$generaSon$and$transportaSon.”$
UHERO.HAWAII.EDU ©2010
Life"Cycle"Analysis"of"Biofuels:"Implementa6on"in"the"State"of"Hawai‘i"
UHERO.HAWAII.EDU ©2010
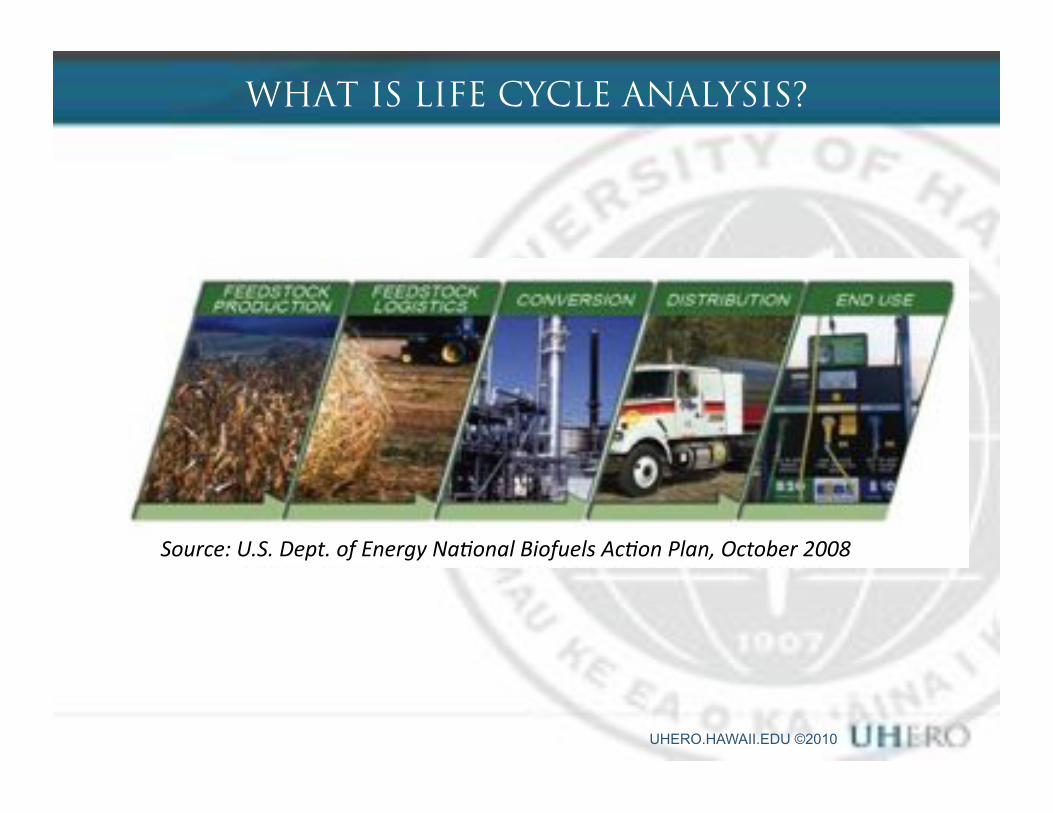
WHAT IS LIFE CYCLE ANALYSIS?
Source:(U.S.(Dept.(of(Energy(Na5onal(Biofuels(Ac5on(Plan,(October(2008$
UHERO.HAWAII.EDU ©2010
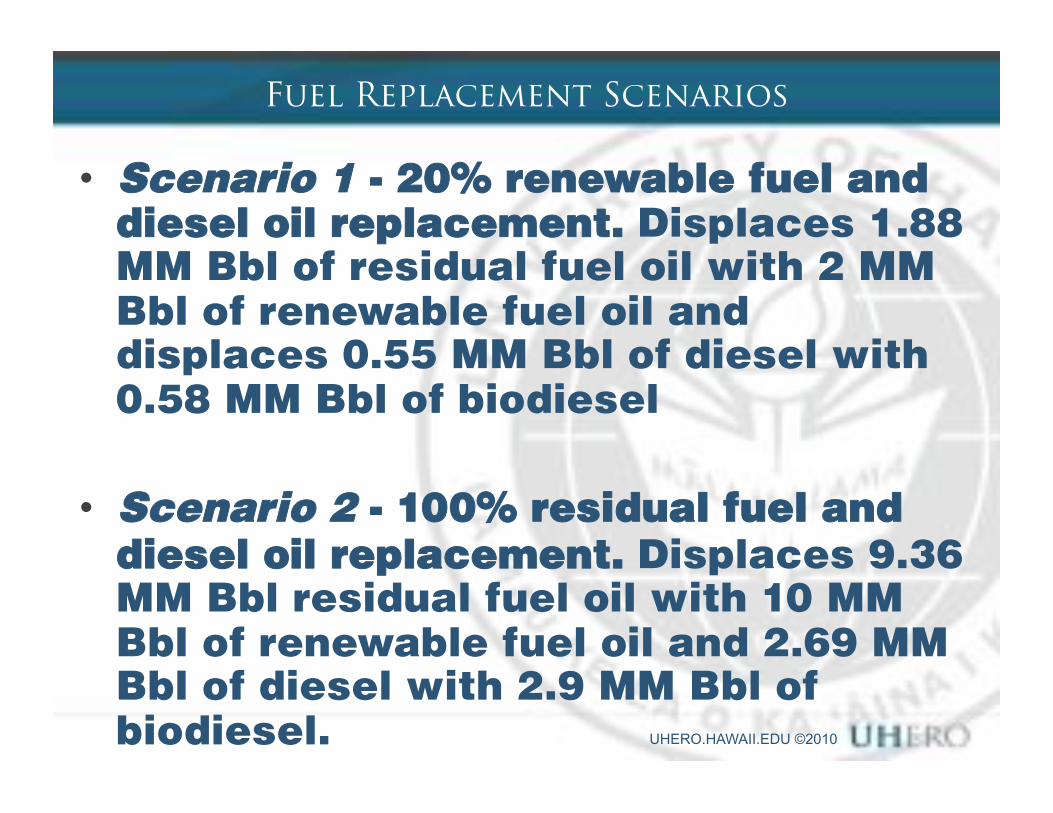
Fuel Replacement Scenarios
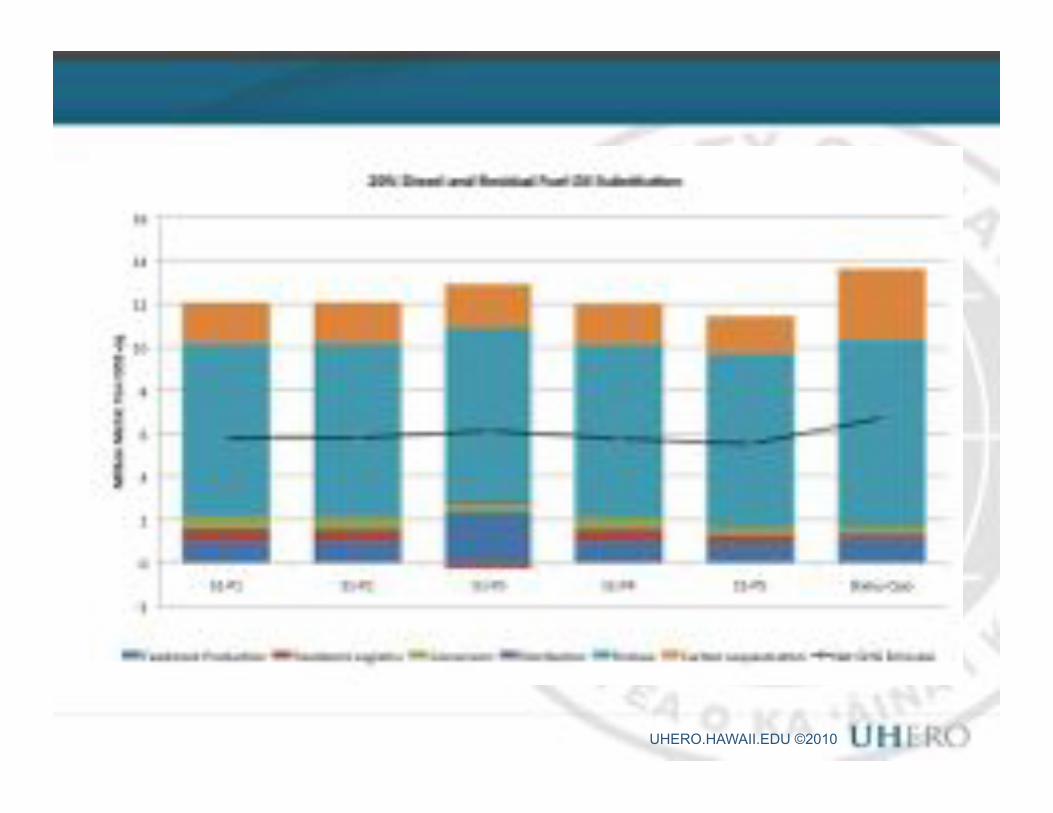
•� Scenario 1 - 20% renewable fuel and diesel oil replacement. Displaces 1.88 MM Bbl of residual fuel oil with 2 MM Bbl of renewable fuel oil and displaces 0.55 MM Bbl of diesel with 0.58 MM Bbl of biodiesel
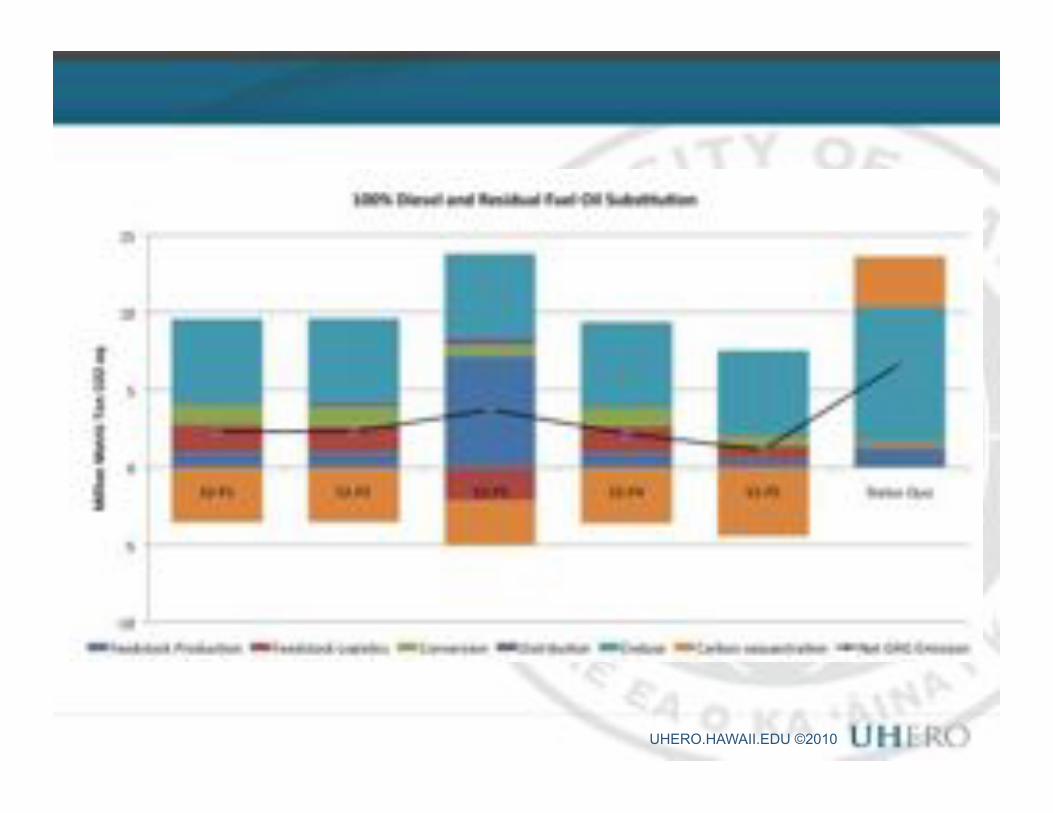
•� Scenario 2 - 100% residual fuel and diesel oil replacement. Displaces 9.36 MM Bbl residual fuel oil with 10 MM Bbl of renewable fuel oil and 2.69 MM Bbl of diesel with 2.9 MM Bbl of biodiesel.
UHERO.HAWAII.EDU ©2010
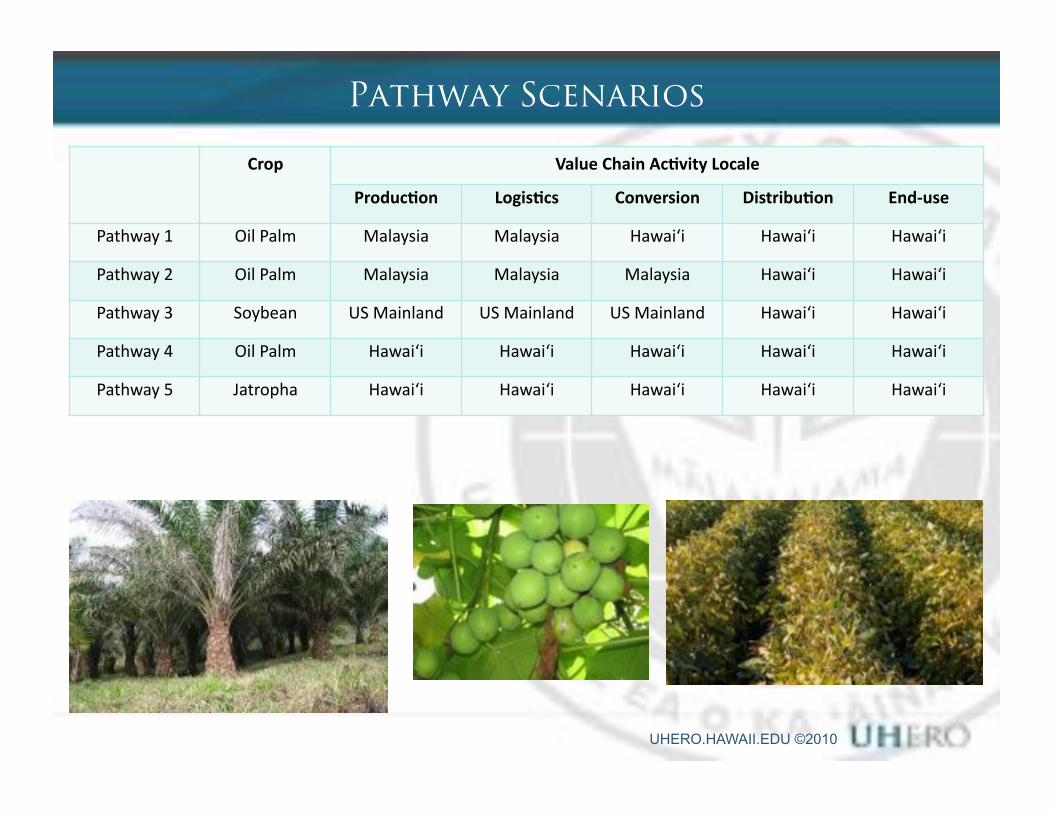
Pathway Scenarios
Crop" Value"Chain"Ac6vity"Locale""
Produc6on" Logis6cs" Conversion" Distribu6on" End<use"
Pathway$1$ Oil$Palm$ Malaysia$ Malaysia$ Hawai‘i$ Hawai‘i$ Hawai‘i$
Pathway$2$ Oil$Palm$ Malaysia$ Malaysia$ Malaysia$ Hawai‘i$ Hawai‘i$
Pathway$3$ Soybean$ US$Mainland$ US$Mainland$ US$Mainland$ Hawai‘i$ Hawai‘i$
Pathway$4$ Oil$Palm$ Hawai‘i$ Hawai‘i$ Hawai‘i$ Hawai‘i$ Hawai‘i$
Pathway$5$ Jatropha$ Hawai‘i$ Hawai‘i$ Hawai‘i$ Hawai‘i$ Hawai‘i$
UHERO.HAWAII.EDU ©2010
UHERO.HAWAII.EDU ©2010
UHERO.HAWAII.EDU ©2010
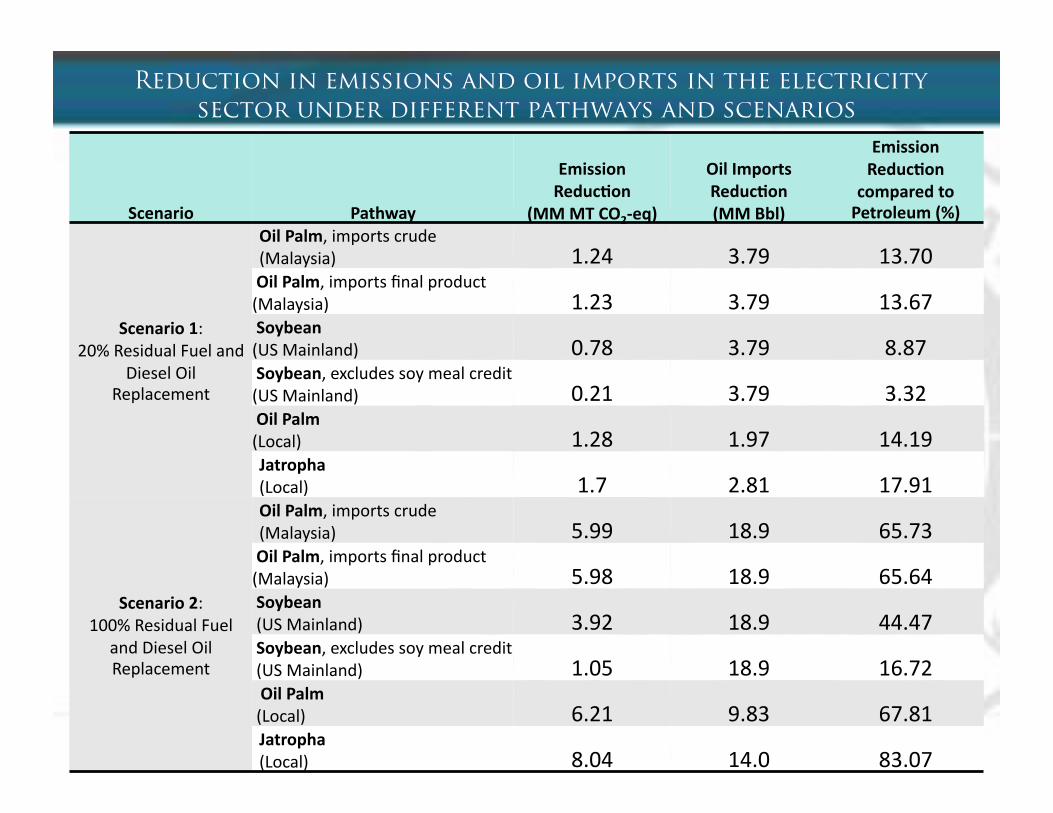
Reduction in emissions and oil imports in the electricity sector under different pathways and scenarios
Scenario" Pathway"
Emission"Reduc6on"
(MM"MT"CO2<eq)"
Oil"Imports"Reduc6on"(MM"Bbl)"
Emission"Reduc6on"
compared"to"Petroleum"(%)"
Scenario"1:$20%$Residual$Fuel$and$
Diesel$Oil$Replacement$
Oil"Palm,$imports$crude$$(Malaysia)$ 1.24$ 3.79$ 13.70$"Oil"Palm,$imports$final$product$$(Malaysia)$ 1.23$ 3.79$ 13.67$"Soybean"$(US$Mainland)$ 0.78$ 3.79$ 8.87$"Soybean,$excludes$soy$meal$credit$(US$Mainland)$ 0.21$ 3.79$ 3.32$"Oil"Palm$(Local)$ 1.28$ 1.97$ 14.19$Jatropha$(Local)$ 1.7$ 2.81$ 17.91$
Scenario"2:$100%$Residual$Fuel$
and$Diesel$Oil$Replacement$
Oil"Palm,$imports$crude$$(Malaysia)$ 5.99$ 18.9$ 65.73$"Oil"Palm,$imports$final$product$$(Malaysia)$ 5.98$ 18.9$ 65.64$"Soybean"$$(US$Mainland)$ 3.92$ 18.9$ 44.47$"Soybean,$excludes$soy$meal$credit$$(US$Mainland)$ 1.05$ 18.9$ 16.72$""Oil"Palm$$(Local)$ 6.21$ 9.83$ 67.81$Jatropha$(Local)$ 8.04$ 14.0$ 83.07$
UHERO.HAWAII.EDU ©2010
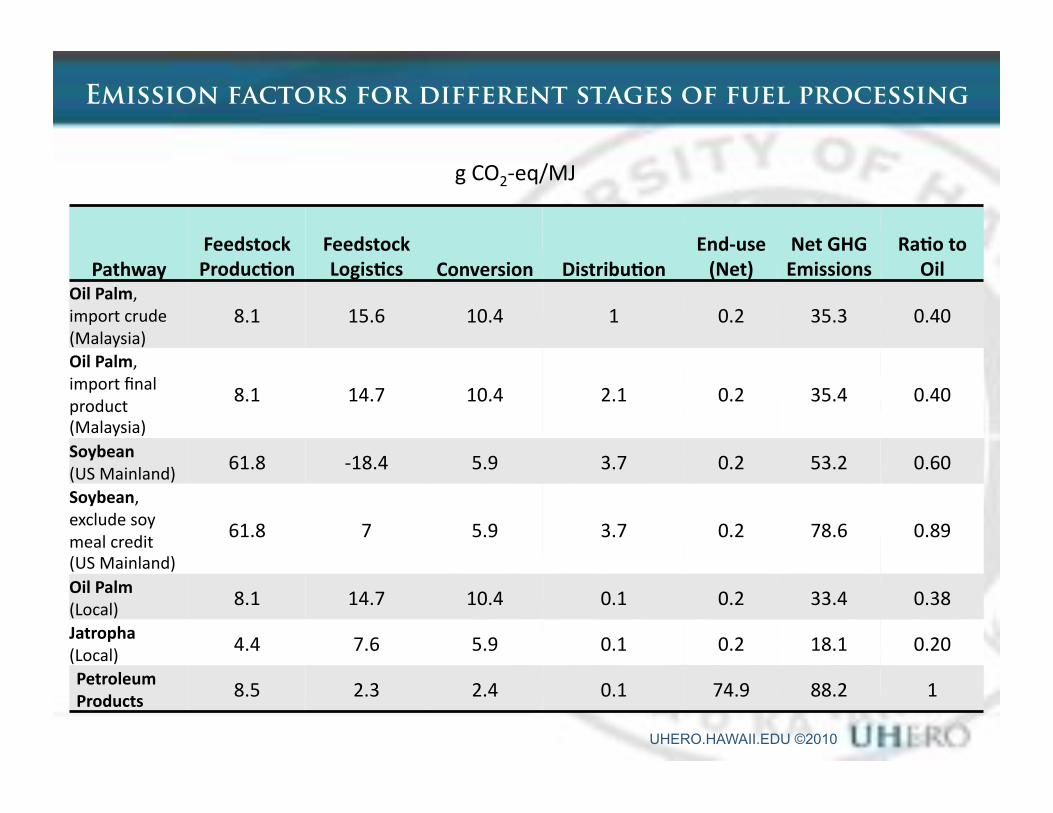
Emission factors for different stages of fuel processing
Pathway"Feedstock"Produc6on"
Feedstock"Logis6cs" Conversion" Distribu6on"
End<use"(Net)"
Net"GHG"Emissions"
Ra6o"to"Oil"
Oil"Palm,$import$crude$$(Malaysia)$
8.1$ 15.6$ 10.4$ 1$ 0.2$ 35.3$ 0.40$
Oil"Palm,$import$final$product$$(Malaysia)$
8.1$ 14.7$ 10.4$ 2.1$ 0.2$ 35.4$ 0.40$
Soybean"$(US$Mainland)$
61.8$ C18.4$ 5.9$ 3.7$ 0.2$ 53.2$ 0.60$
Soybean,$exclude$soy$meal$credit$(US$Mainland)$
61.8$ 7$ 5.9$ 3.7$ 0.2$ 78.6$ 0.89$
Oil"Palm$(Local)$
8.1$ 14.7$ 10.4$ 0.1$ 0.2$ 33.4$ 0.38$
Jatropha$(Local)$
4.4$ 7.6$ 5.9$ 0.1$ 0.2$ 18.1$ 0.20$
Petroleum"Products$ 8.5$ 2.3$ 2.4$ 0.1$ 74.9$ 88.2$ 1$
g$CO2Ceq/MJ$$
UHERO.HAWAII.EDU ©2010
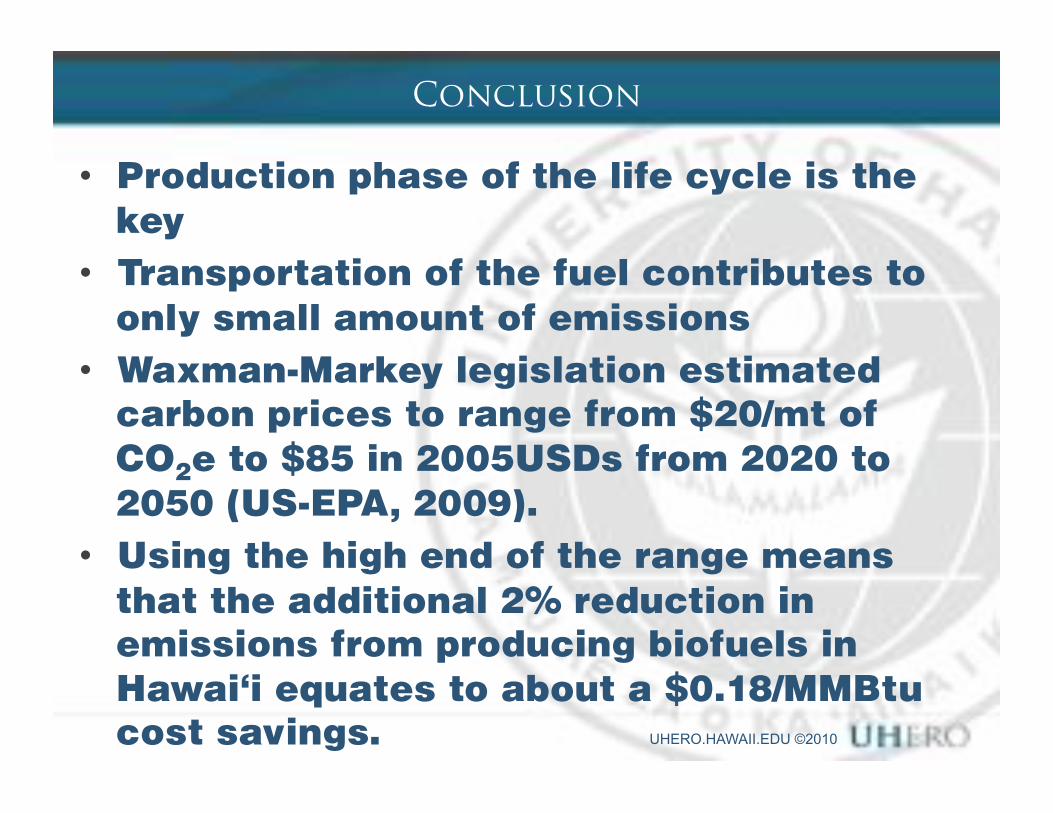
Conclusion
•� Production phase of the life cycle is the key
•� Transportation of the fuel contributes to only small amount of emissions
•� Waxman-Markey legislation estimated carbon prices to range from $20/mt of CO2e to $85 in 2005USDs from 2020 to 2050 (US-EPA, 2009).
•� Using the high end of the range means that the additional 2% reduction in emissions from producing biofuels in Hawai‘i equates to about a $0.18/MMBtu cost savings.
UHERO.HAWAII.EDU ©2010
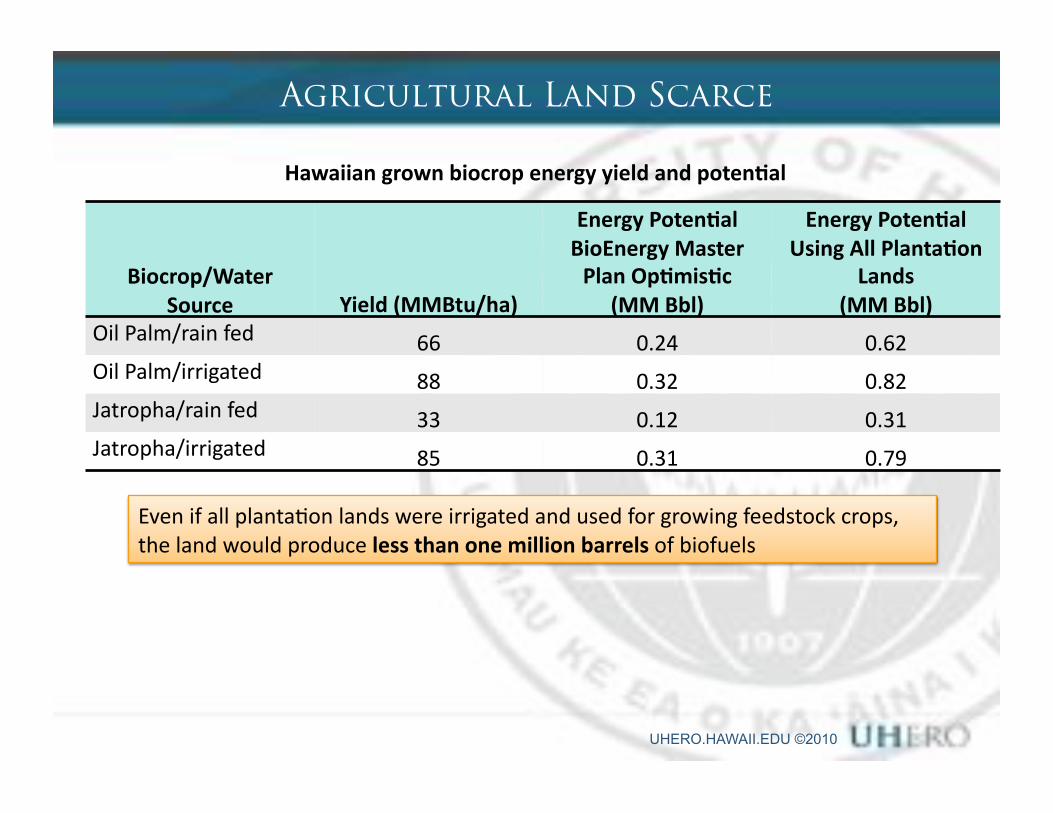
Agricultural Land Scarce
Biocrop/Water"Source" Yield"(MMBtu/ha)"
Energy"Poten6al"BioEnergy"Master"Plan"Op6mis6c""
(MM"Bbl)"
Energy"Poten6al"Using"All"Planta6on"
Lands""(MM"Bbl)"
Oil$Palm/rain$fed$ 66$ 0.24$ 0.62$Oil$Palm/irrigated$ 88$ 0.32$ 0.82$Jatropha/rain$fed$ 33$ 0.12$ 0.31$Jatropha/irrigated$ 85$ 0.31$ 0.79$
Hawaiian"grown"biocrop"energy"yield"and"poten6al""
Even$if$all$plantaSon$lands$were$irrigated$and$used$for$growing$feedstock$crops,$the$land$would$produce$less"than"one"million"barrels"of$biofuels$$
UHERO.HAWAII.EDU ©2010
Next Step
•� A cost-benefit analysis •� An impact assessment of monetizing GHG
emission reductions from substituting biofuels - i.e. attaching a price on carbon.
•� An evaluation of land-use change elements that would not only include resulting GHG emissions, but also added value from preserving or increasing open lands.
UHERO.HAWAII.EDU ©2010
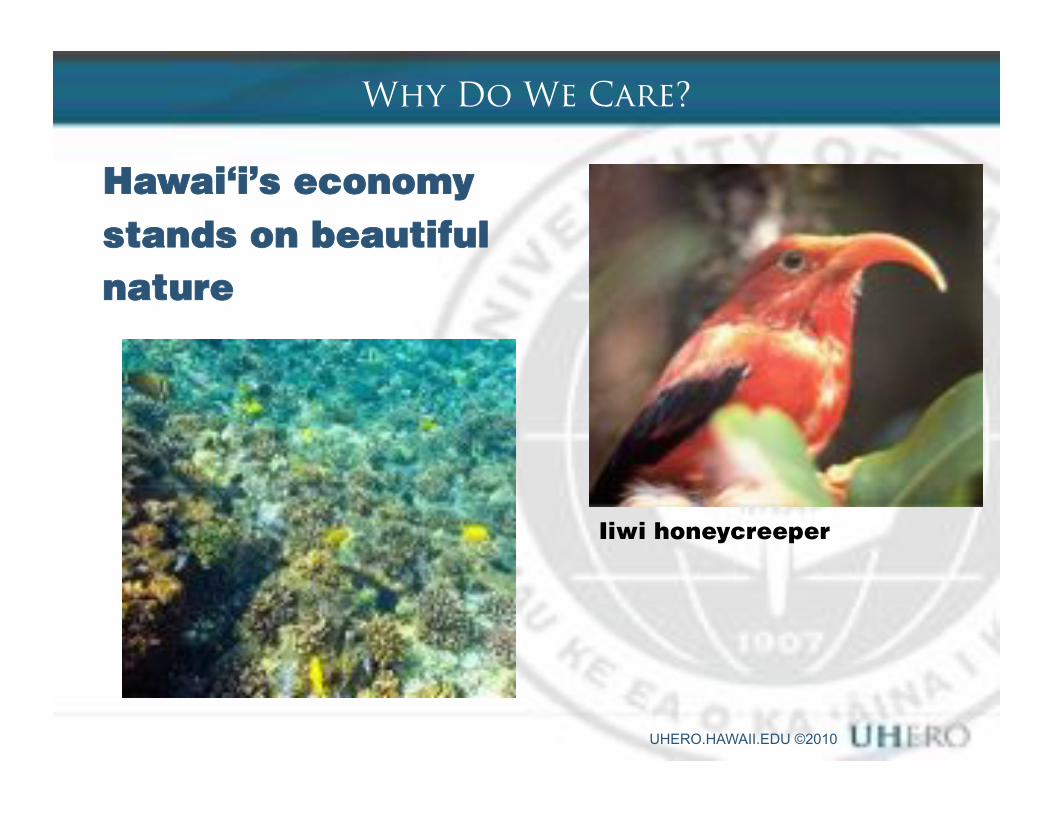
Why Do We Care?
Hawai‘i’s economy stands on beautiful nature
Iiwi honeycreeper

UHERO.HAWAII.EDU ©2010
Mahalo!