Embed Size (px)
Citation preview
D7.1: Energy and resource saving based Networked Business Model framework
1
D 7.1
Energy and resource saving based
Networked Business Model
framework
DUE DATE OF DELIVERABLE: April 2016
SUBMISSION DATE:
H2020-FoF-2014-2015; Grant Agreement No 636926
Work Package: WP7
Type of document: Deliverable
Title: Energy and resource saving based Networked Business Model
framework
Date: 24/05/16
Version: v2.0
Partners: IKERLAN (MCC), EIFFO, VMT, CETIM, TECHNOFI
Responsible: IKERLAN (MCC)
Circulation
Public
Confidential
Restricted
D7.1: Energy and resource saving based Networked Business Model framework
3
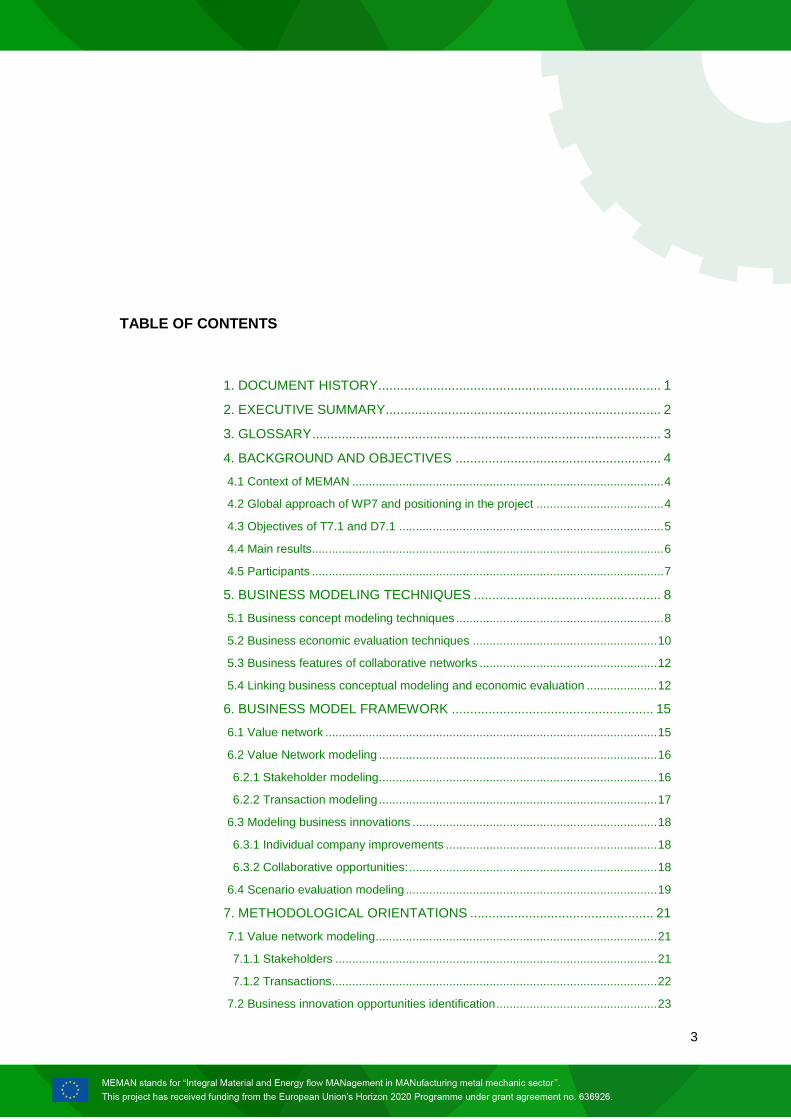
TABLE OF CONTENTS
1. DOCUMENT HISTORY ............................................................................. 1
2. EXECUTIVE SUMMARY ........................................................................... 2
3. GLOSSARY ............................................................................................... 3
4. BACKGROUND AND OBJECTIVES ........................................................ 4
4.1 Context of MEMAN ............................................................................................. 4
4.2 Global approach of WP7 and positioning in the project ...................................... 4
4.3 Objectives of T7.1 and D7.1 ............................................................................... 5
4.4 Main results......................................................................................................... 6
4.5 Participants ......................................................................................................... 7
5. BUSINESS MODELING TECHNIQUES ................................................... 8
5.1 Business concept modeling techniques .............................................................. 8
5.2 Business economic evaluation techniques ....................................................... 10
5.3 Business features of collaborative networks ..................................................... 12
5.4 Linking business conceptual modeling and economic evaluation ..................... 12
6. BUSINESS MODEL FRAMEWORK ....................................................... 15
6.1 Value network ................................................................................................... 15
6.2 Value Network modeling ................................................................................... 16
6.2.1 Stakeholder modeling ................................................................................... 16
6.2.2 Transaction modeling ................................................................................... 17
6.3 Modeling business innovations ......................................................................... 18
6.3.1 Individual company improvements ............................................................... 18
6.3.2 Collaborative opportunities: .......................................................................... 18
6.4 Scenario evaluation modeling ........................................................................... 19
7. METHODOLOGICAL ORIENTATIONS .................................................. 21
7.1 Value network modeling .................................................................................... 21
7.1.1 Stakeholders ................................................................................................ 21
7.1.2 Transactions ................................................................................................. 22
7.2 Business innovation opportunities identification ................................................ 23
D7.1: Energy and resource saving based Networked Business Model framework
4
7.2.1 Individual company’s opportunities............................................................... 23
7.2.2 Business Models and Value Networks ......................................................... 23
7.3 Business innovation scenario modeling ............................................................ 27
7.3.1 Stakeholder events....................................................................................... 28
7.3.2 Transaction events ....................................................................................... 28
7.3.3 General events ............................................................................................. 28
7.4 Economic evaluation ......................................................................................... 28
8. CONCLUSIONS ...................................................................................... 29
9. REFERENCES ........................................................................................ 30
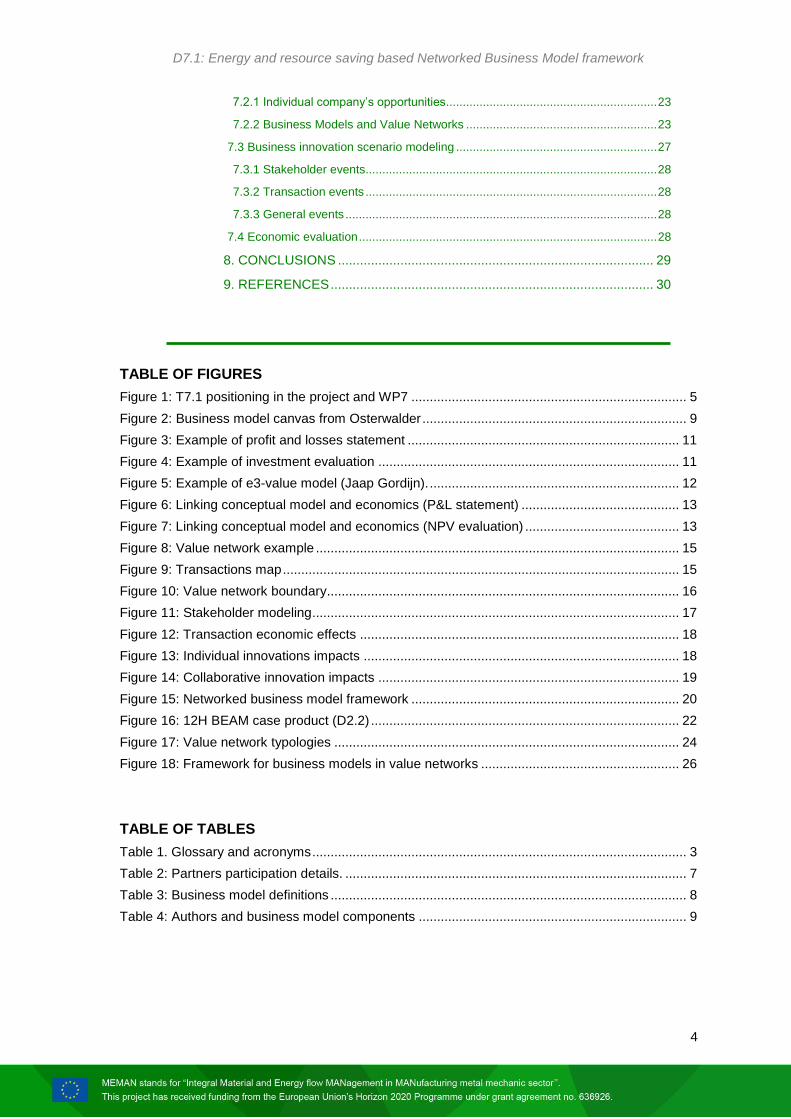
TABLE OF FIGURES
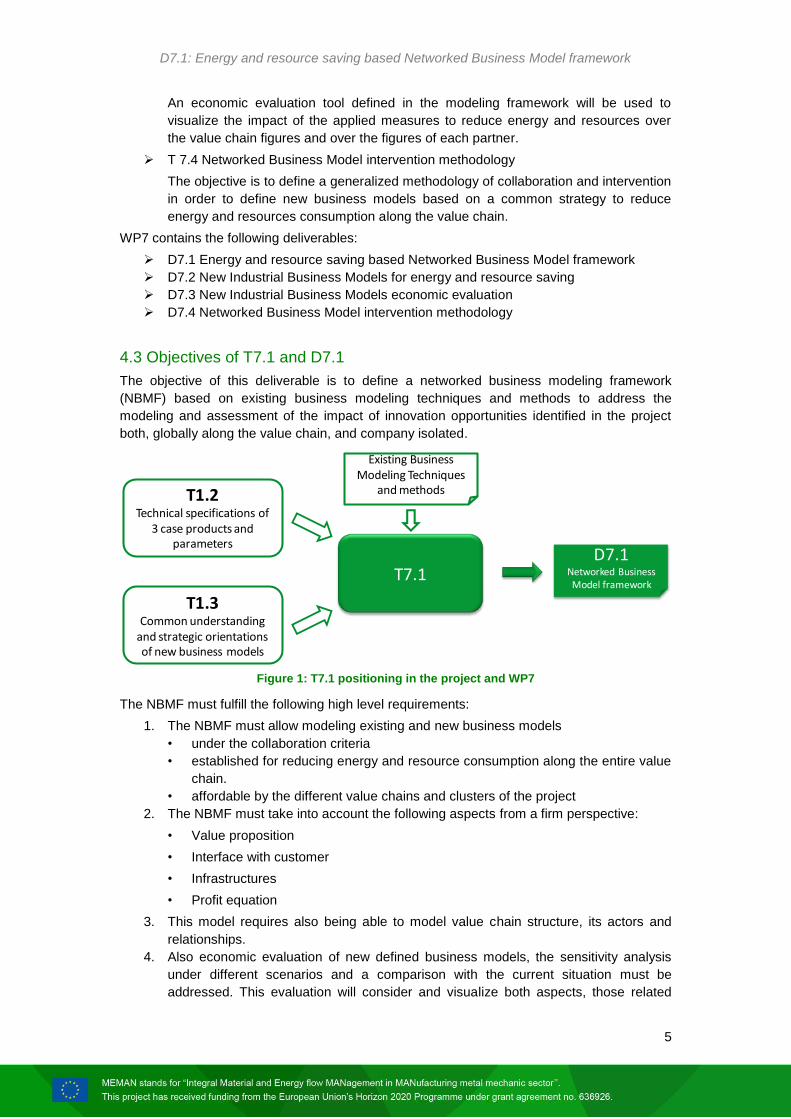
Figure 1: T7.1 positioning in the project and WP7 ........................................................................... 5
Figure 2: Business model canvas from Osterwalder ........................................................................ 9
Figure 3: Example of profit and losses statement .......................................................................... 11
Figure 4: Example of investment evaluation .................................................................................. 11
Figure 5: Example of e3-value model (Jaap Gordijn). .................................................................... 12
Figure 6: Linking conceptual model and economics (P&L statement) ........................................... 13
Figure 7: Linking conceptual model and economics (NPV evaluation) .......................................... 13
Figure 8: Value network example ................................................................................................... 15
Figure 9: Transactions map ............................................................................................................ 15
Figure 10: Value network boundary................................................................................................ 16
Figure 11: Stakeholder modeling .................................................................................................... 17
Figure 12: Transaction economic effects ....................................................................................... 18
Figure 13: Individual innovations impacts ...................................................................................... 18
Figure 14: Collaborative innovation impacts .................................................................................. 19
Figure 15: Networked business model framework ......................................................................... 20
Figure 16: 12H BEAM case product (D2.2) .................................................................................... 22
Figure 17: Value network typologies .............................................................................................. 24
Figure 18: Framework for business models in value networks ...................................................... 26
TABLE OF TABLES
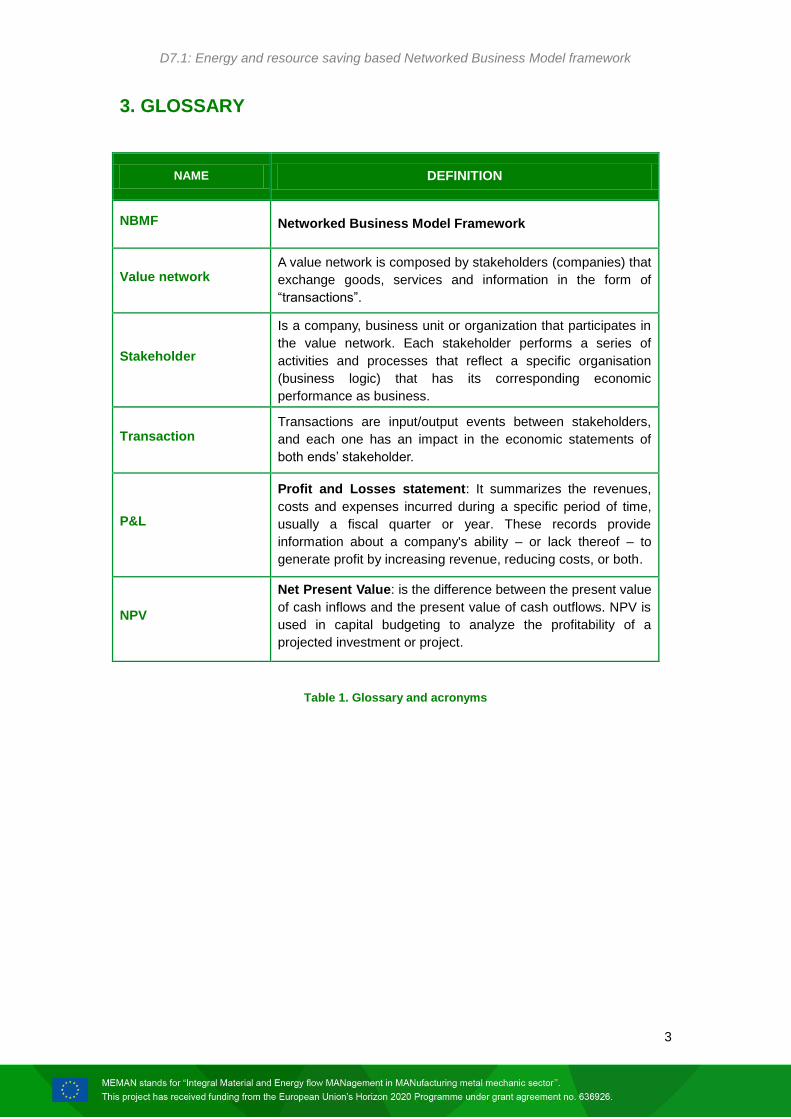
Table 1. Glossary and acronyms ...................................................................................................... 3
Table 2: Partners participation details. ............................................................................................. 7
Table 3: Business model definitions ................................................................................................. 8
Table 4: Authors and business model components ......................................................................... 9

D7.1: Energy and resource saving based Networked Business Model framework
2
2. EXECUTIVE SUMMARY
The overarching goal of MEMAN is to implement an approach that optimises resource
efficiency across three selected value chains (i.e. casting, machining and surface finishing) by
developing and validating innovative tools and business models. To achieve this task,
MEMAN aims at analysing resource saving potentials not only at company level but also by
focusing on interfaces between companies of the value chain.
In this context, the goal of WP7 is the design of the new business models affordable by the
different value chains and clusters of the project under the collaboration criteria established
for reducing energy and resource consumption along the entire value chain.
The goal of the present working document is to define a networked business modeling
framework (NBMF) based on existing business modeling techniques and methods to address
the modeling and assessment of the impact of innovation opportunities identified in the
project both, globally along the value chain, and company isolated
To achieve this, in a first step a review of existing technique has been carried out. This has
covered the following aspects: business concept modeling techniques, business economic
evaluation techniques, business features of collaborative networks, and linking business
conceptual modeling and economic evaluation.
Then, based on these techniques, a modeling framework has been defined consisting of:
A value network modeling framework: this is a modeling proposal that permits the
representation of a value network in a two level modeling approach.
Economic evaluation: The quantitative part of the model will be based in a different
approach depending on the type of improvement alternative to be evaluated and the
confidentiality issues of the required information and also results. The quantitative
model will reflect the impact of each business model component (activities,
resources, supplies, channels, customer segment, transactions…) in the economic
statements.
Modeling orientations: modeling guidelines and clues are given as orientations to
apply the NBMF in tasks 7.2 and 7.3. The set of orientations refer to:
o Value network modeling
o Business innovation opportunities identification
o Business innovation scenario modeling
D7.1: Energy and resource saving based Networked Business Model framework
3
3. GLOSSARY
NAME DEFINITION
NBMF Networked Business Model Framework
Value network A value network is composed by stakeholders (companies) that
exchange goods, services and information in the form of
“transactions”.
Stakeholder
Is a company, business unit or organization that participates in
the value network. Each stakeholder performs a series of
activities and processes that reflect a specific organisation
(business logic) that has its corresponding economic
performance as business.
Transaction Transactions are input/output events between stakeholders,
and each one has an impact in the economic statements of
both ends’ stakeholder.
P&L
Profit and Losses statement: It summarizes the revenues,
costs and expenses incurred during a specific period of time,
usually a fiscal quarter or year. These records provide
information about a company's ability – or lack thereof – to
generate profit by increasing revenue, reducing costs, or both.
NPV
Net Present Value: is the difference between the present value
of cash inflows and the present value of cash outflows. NPV is
used in capital budgeting to analyze the profitability of a
projected investment or project.
Read more: Net Present Value (NPV) Definition | Investopedia
http://www.investopedia.com/terms/n/npv.asp#ixzz49Z0W4Dne
Follow us: Investopedia on Facebook
Table 1. Glossary and acronyms
D7.1: Energy and resource saving based Networked Business Model framework
4
4. BACKGROUND AND OBJECTIVES
4.1 Context of MEMAN
MEMAN aims at improving the competitiveness of the European companies of the metal
mechanic sector by developing and validating innovative tools and business models across
the entire value chain (i.e. including casting, machining, surface finishing and recycling
aspects) in order to reduce global impacts in terms of resources use (i.e. material and
energy).
In this context, the overarching goal of the MEMAN project is to implement an approach that
optimizes resource efficiency across three selected value chains (i.e. casting, machining and
surface finishing). To achieve this task, MEMAN aims at analyzing resource saving potentials
not only at company level but also on focusing on interfaces between the companies of the
value chain.
The overall approach of MEMAN is divided into three main phases:
The first phase aims at “setting the scene”. This means to define in detail the
companies involved in each cluster (WP 1). Once the scope has then been defined,
the three clusters will be analysed in order to define and characterize every
constitutive unit process (WP 2).
The second phase consists in developing a decision-making toolbox, specifically
designed for value chain analysis (WP 3). This toolbox will be used to carry out the
modelling and the simulation of the three selected value chains (WP 4) in order to
determine alternative improvement options.
The third phase builds on the outputs of the previous phases to define new business
models aiming at reaching a global optimum in terms of resource efficiency at value
chain level (WP 7) and aims at implementing selected alternatives options in field
(WP 8).
4.2 Global approach of WP7 and positioning in the project
The objective of WP7 is the design of the new business models affordable by the different
value chains and clusters of the project under the collaboration criteria established for
reducing energy and resource consumption along the entire value chain. The design of the
new business models will take into account aspects of value proposition, interface with
customer, infrastructures, and profit equation, taken into account the point of view derived
from the energy characterization along the entire value chain, both globally and company
isolated.
WP7 will also address the economic evaluation of new defined business models, the
sensitivity analysis under different scenarios and a comparison with the current situation. This
economic evaluation will consider and visualize both aspects, those related with the entire
value chain, such as those corresponding to each of the companies involved.
WP7 is organized in four tasks:
T 7.1 Networked Business Model framework definition
To define a modeling environment based on Existing Business Modeling Techniques
and methods.
T 7.2 New Industrial Business Models for energy and resource saving
Use the Networked Business Model Framework to represent the old and new
business model and compare the different alternatives from a qualitative point of
view.
T 7.3 New Industrial Business Models economic evaluation
D7.1: Energy and resource saving based Networked Business Model framework
5
An economic evaluation tool defined in the modeling framework will be used to
visualize the impact of the applied measures to reduce energy and resources over
the value chain figures and over the figures of each partner.
T 7.4 Networked Business Model intervention methodology
The objective is to define a generalized methodology of collaboration and intervention
in order to define new business models based on a common strategy to reduce
energy and resources consumption along the value chain.
WP7 contains the following deliverables:
D7.1 Energy and resource saving based Networked Business Model framework
D7.2 New Industrial Business Models for energy and resource saving
D7.3 New Industrial Business Models economic evaluation
D7.4 Networked Business Model intervention methodology
4.3 Objectives of T7.1 and D7.1
The objective of this deliverable is to define a networked business modeling framework
(NBMF) based on existing business modeling techniques and methods to address the
modeling and assessment of the impact of innovation opportunities identified in the project
both, globally along the value chain, and company isolated.
Figure 1: T7.1 positioning in the project and WP7
The NBMF must fulfill the following high level requirements:
1. The NBMF must allow modeling existing and new business models
• under the collaboration criteria
• established for reducing energy and resource consumption along the entire value
chain.
• affordable by the different value chains and clusters of the project
2. The NBMF must take into account the following aspects from a firm perspective:
• Value proposition
• Interface with customer
• Infrastructures
• Profit equation
3. This model requires also being able to model value chain structure, its actors and
relationships.
4. Also economic evaluation of new defined business models, the sensitivity analysis
under different scenarios and a comparison with the current situation must be
addressed. This evaluation will consider and visualize both aspects, those related
T7.1
T1.2Technical specifications of
3 case products and parameters
T1.3Common understanding
and strategic orientations of new business models
D7.1Networked Business Model framework
Existing Business Modeling Techniques
and methods
D7.1: Energy and resource saving based Networked Business Model framework
6
with the entire value chain, and those corresponding to each of the companies
involved.
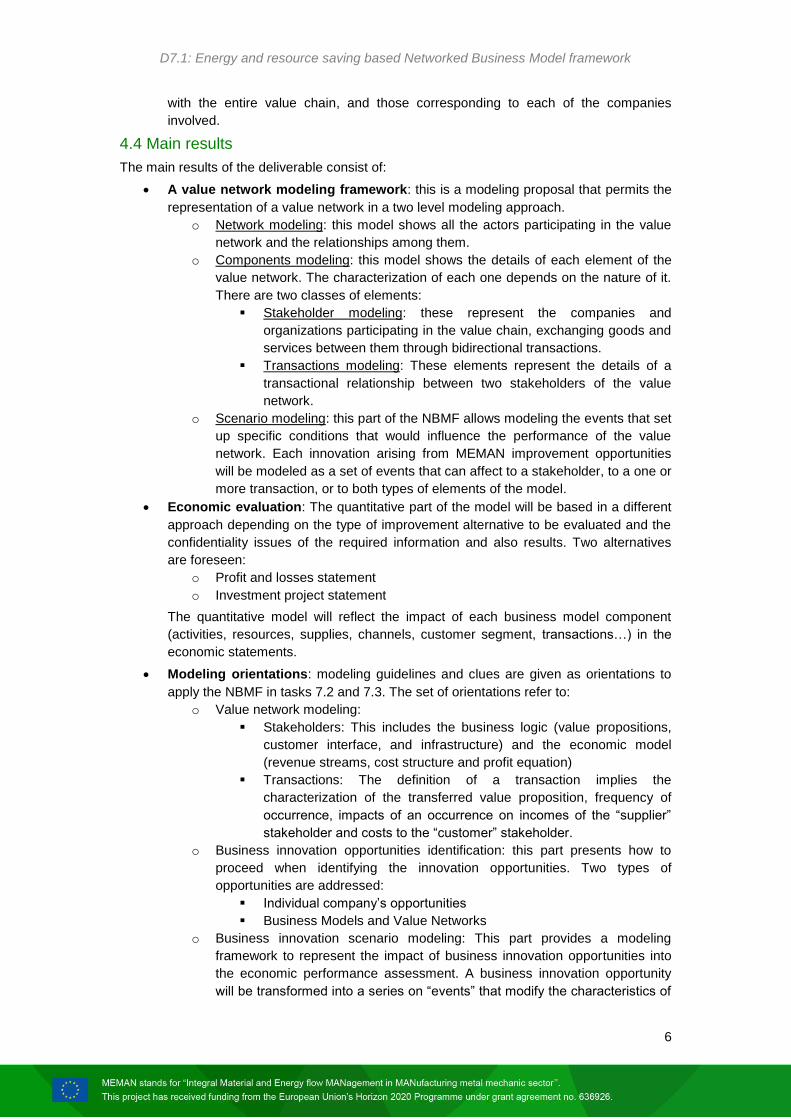
4.4 Main results
The main results of the deliverable consist of:
A value network modeling framework: this is a modeling proposal that permits the
representation of a value network in a two level modeling approach.
o Network modeling: this model shows all the actors participating in the value
network and the relationships among them.
o Components modeling: this model shows the details of each element of the
value network. The characterization of each one depends on the nature of it.
There are two classes of elements:
Stakeholder modeling: these represent the companies and
organizations participating in the value chain, exchanging goods and
services between them through bidirectional transactions.
Transactions modeling: These elements represent the details of a
transactional relationship between two stakeholders of the value
network.
o Scenario modeling: this part of the NBMF allows modeling the events that set
up specific conditions that would influence the performance of the value
network. Each innovation arising from MEMAN improvement opportunities
will be modeled as a set of events that can affect to a stakeholder, to a one or
more transaction, or to both types of elements of the model.
Economic evaluation: The quantitative part of the model will be based in a different
approach depending on the type of improvement alternative to be evaluated and the
confidentiality issues of the required information and also results. Two alternatives
are foreseen:
o Profit and losses statement
o Investment project statement
The quantitative model will reflect the impact of each business model component
(activities, resources, supplies, channels, customer segment, transactions…) in the
economic statements.
Modeling orientations: modeling guidelines and clues are given as orientations to
apply the NBMF in tasks 7.2 and 7.3. The set of orientations refer to:
o Value network modeling:
Stakeholders: This includes the business logic (value propositions,
customer interface, and infrastructure) and the economic model
(revenue streams, cost structure and profit equation)
Transactions: The definition of a transaction implies the
characterization of the transferred value proposition, frequency of
occurrence, impacts of an occurrence on incomes of the “supplier”
stakeholder and costs to the “customer” stakeholder.
o Business innovation opportunities identification: this part presents how to
proceed when identifying the innovation opportunities. Two types of
opportunities are addressed:
Individual company’s opportunities
Business Models and Value Networks
o Business innovation scenario modeling: This part provides a modeling
framework to represent the impact of business innovation opportunities into
the economic performance assessment. A business innovation opportunity
will be transformed into a series on “events” that modify the characteristics of
D7.1: Energy and resource saving based Networked Business Model framework
7
the value network model elements’ (stakeholders and transactions)
characteristics. The following types of event are foreseen:
Stakeholder events: Stakeholder related events will impact the cost
structure through activities and resources innovations. An event must
show the increase or decrease on the consumption of activities
and/or resources.
Transaction events: These events modify the characteristics of
existing transactions. These events may modify any characteristic of
the transaction, but specially those corresponding to economic
evaluation:
General events: these events will show how variables external to the
value network influence the scenario and the performance of the
value networks. These events will be used to represent specific risks
such energy/raw material price variations, regulation and taxes, etc…
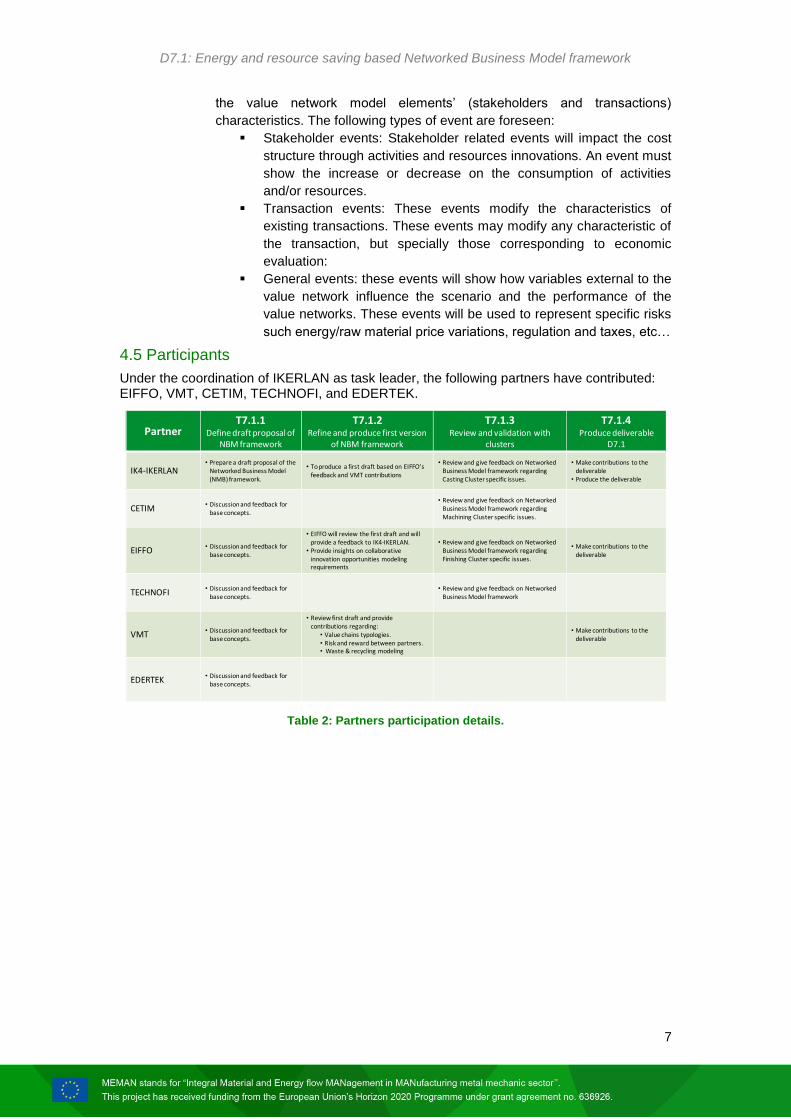
4.5 Participants
Under the coordination of IKERLAN as task leader, the following partners have contributed: EIFFO, VMT, CETIM, TECHNOFI, and EDERTEK.
Table 2: Partners participation details.
PartnerT7.1.1
Define draft proposal of NBM framework
T7.1.2Refine and produce first version
of NBM framework
T7.1.3Review and validation with
clusters
T7.1.4Produce deliverable
D7.1
IK4-IKERLAN• Prepare a draft proposal of the
Networked Business Model (NMB) framework.
• To produce a first draft based on EIFFO’s feedback and VMT contributions
• Review and give feedback on Networked Business Model framework regarding Casting Cluster specific issues.
• Make contributions to the deliverable
• Produce the deliverable
CETIM• Discussion and feedback for
base concepts.
• Review and give feedback on Networked Business Model framework regarding Machining Cluster specific issues.
EIFFO• Discussion and feedback for
base concepts.
• EIFFO will review the first draft and will provide a feedback to IK4-IKERLAN.
• Provide insights on collaborative innovation opportunities modeling requirements
• Review and give feedback on Networked Business Model framework regarding Finishing Cluster specific issues.
• Make contributions to the deliverable
TECHNOFI• Discussion and feedback for
base concepts.• Review and give feedback on Networked
Business Model framework
VMT• Discussion and feedback for
base concepts.
• Review first draft and provide contributions regarding:
• Value chains typologies.• Risk and reward between partners.• Waste & recycling modeling
• Make contributions to the deliverable
EDERTEK• Discussion and feedback for
base concepts.
D7.1: Energy and resource saving based Networked Business Model framework
8
5. BUSINESS MODELING TECHNIQUES
5.1 Business concept modeling techniques
As David Teece1 points out, the concept of a business model lacks theoretical grounding in
economics or in business studies, mainly due to the ubiquity of theoretical constructs that
have markets solving the problems that, in the real world, business models are created to
solve. But the rise of information industries and the internet itself as an enabler, new and
unexpected ways of creating, delivering and capturing value have emerged. This has pushed
an increased interest on business model research, and scholars have made several
proposals on business modeling.
There are several definitions of the concept of business model. Some of the more relevant
are:
Author Definition
Chesbrough & Rosenbloom2 The heuristic logic that connects technical potential
with the realization of economic value. Johnson et al.
3 Consist of four interlocking elements that, taken
together, create and deliver values. These are: customer value proposition, profit formula, key resources, and key processes.
David J. Teece1 A business model articulates the logic and provides
data and other evidence that demonstrates how a business creates and delivers value to customers. It also outlines the architecture of revenues, costs, and profits associated with the business enterprise delivering that value
Alexander Osterwalder4 A business model describes the rationale of how an
organization creates, delivers and captures value.
Table 3: Business model definitions
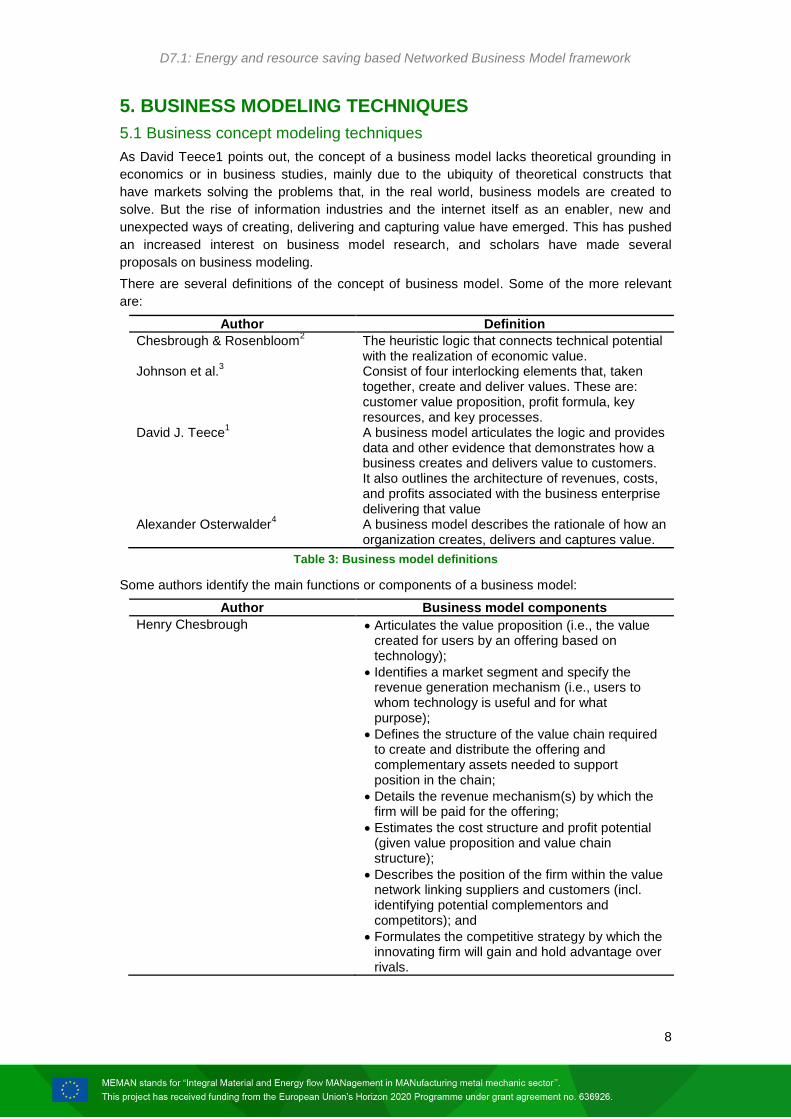
Some authors identify the main functions or components of a business model:
Author Business model components
Henry Chesbrough Articulates the value proposition (i.e., the value created for users by an offering based on technology);
Identifies a market segment and specify the revenue generation mechanism (i.e., users to whom technology is useful and for what purpose);
Defines the structure of the value chain required to create and distribute the offering and complementary assets needed to support position in the chain;
Details the revenue mechanism(s) by which the firm will be paid for the offering;
Estimates the cost structure and profit potential (given value proposition and value chain structure);
Describes the position of the firm within the value network linking suppliers and customers (incl. identifying potential complementors and competitors); and
Formulates the competitive strategy by which the innovating firm will gain and hold advantage over rivals.
D7.1: Energy and resource saving based Networked Business Model framework
9
Alexander Osterwalder Value proposition
Customer segments
Relationships
Channels
Key activities
Key resources
Partners network
Revenue streams
Cost structure Ash Maurya Unique value proposition
Customer segments
Unfair advantage
Channels
Solution
Key metrics
Problem
Revenue streams
Cost structure
Table 4: Authors and business model components
As we can see, there is a coincidence between most of the components pointed out by each
author. The main difference lay on that Chesbrough considers firm positioning, value chain
and competitive strategy as key components of the business model, while Osterwalder
doesn’t include them in his proposal but proposes a process to focus on business strategy
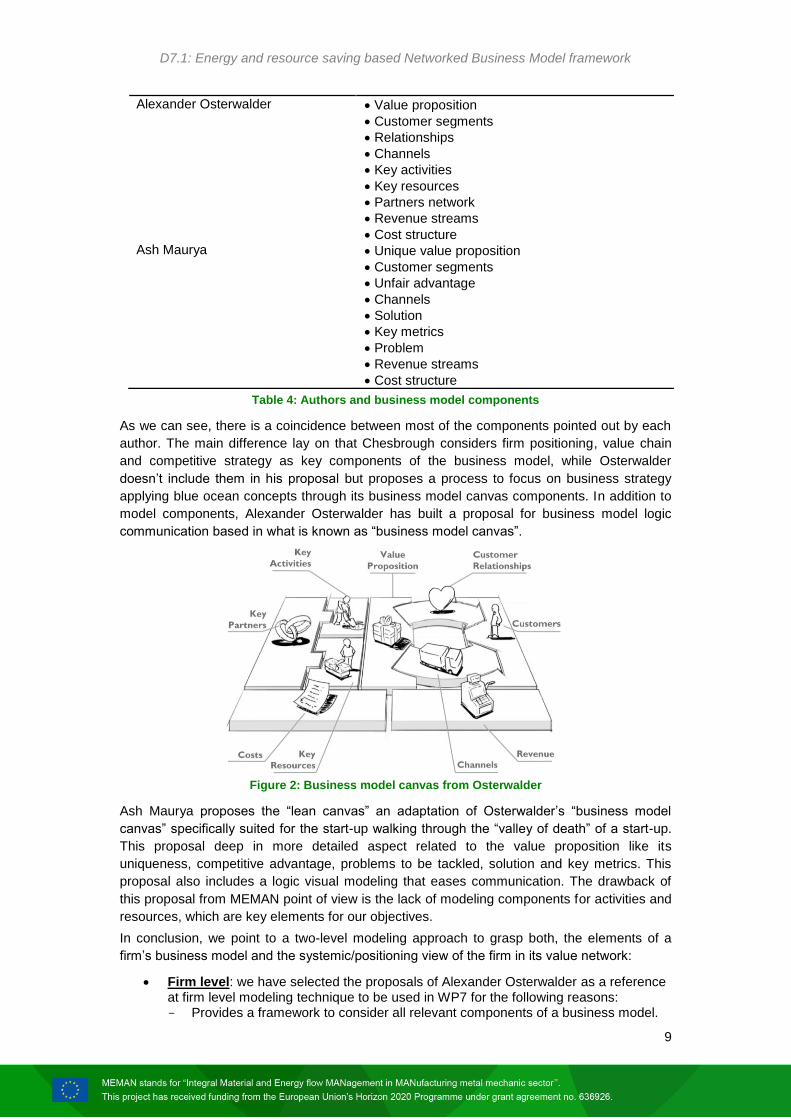
applying blue ocean concepts through its business model canvas components. In addition to
model components, Alexander Osterwalder has built a proposal for business model logic
communication based in what is known as “business model canvas”.
Figure 2: Business model canvas from Osterwalder
Ash Maurya proposes the “lean canvas” an adaptation of Osterwalder’s “business model
canvas” specifically suited for the start-up walking through the “valley of death” of a start-up.
This proposal deep in more detailed aspect related to the value proposition like its
uniqueness, competitive advantage, problems to be tackled, solution and key metrics. This
proposal also includes a logic visual modeling that eases communication. The drawback of
this proposal from MEMAN point of view is the lack of modeling components for activities and
resources, which are key elements for our objectives.
In conclusion, we point to a two-level modeling approach to grasp both, the elements of a
firm’s business model and the systemic/positioning view of the firm in its value network:
Firm level: we have selected the proposals of Alexander Osterwalder as a reference at firm level modeling technique to be used in WP7 for the following reasons: - Provides a framework to consider all relevant components of a business model.
D7.1: Energy and resource saving based Networked Business Model framework
10
- Gives a tool to represent the model. - Model components critical to MEMAN objectives such as activities and resources
can be mapped to economic elements. - His proposals include strategic business model innovation thinking approaches.
Value network level: Chesbrough proposals to consider value chain positioning are critical for MEMAN due to our objectives of discovering collaborative innovation opportunities. For these purposes, value network modeling including network partners and their relationships, requires to be considered adequately.
5.2 Business economic evaluation techniques
One of the objectives of WP7 is the economic evaluation of new defined business models, the
sensitivity analysis under different scenarios and a comparison with the current situation must
be addressed.
The economic performance of a business is shown with two main types instruments:
Profit and Losses statement: It summarizes the revenues, costs and expenses
incurred during a specific period of time, usually a fiscal quarter or year. These
records provide information about a company's ability – or lack thereof – to generate
profit by increasing revenue, reducing costs, or both.
Balance Sheet: It presents a company's financial position at the end of a specified
date. It allows someone to see what a company owns as well as what it owes to other
parties as of the date indicated in the heading.
Considering that MEMAN aims to design new business models under the collaboration
criteria and established for reducing energy and resource consumption along the entire value
chain, the following reflections arise:
“Reducing energy and resource consumption”: These innovations will have an
impact on costs of goods sold and/or on fixed overheads through the investment that
could be required to get these improvements.
“Along the entire value chain”: This implies innovations in the transactions between
partners of a value chain. This would impact on the incomes of the partner in the
“supplier” side of the transaction, and on the costs (direct or indirect) in the
“customer” side of the transaction.
So that, we conclude that the profit and losses statement is the first option to perform the
required economic evaluation.
D7.1: Energy and resource saving based Networked Business Model framework
11
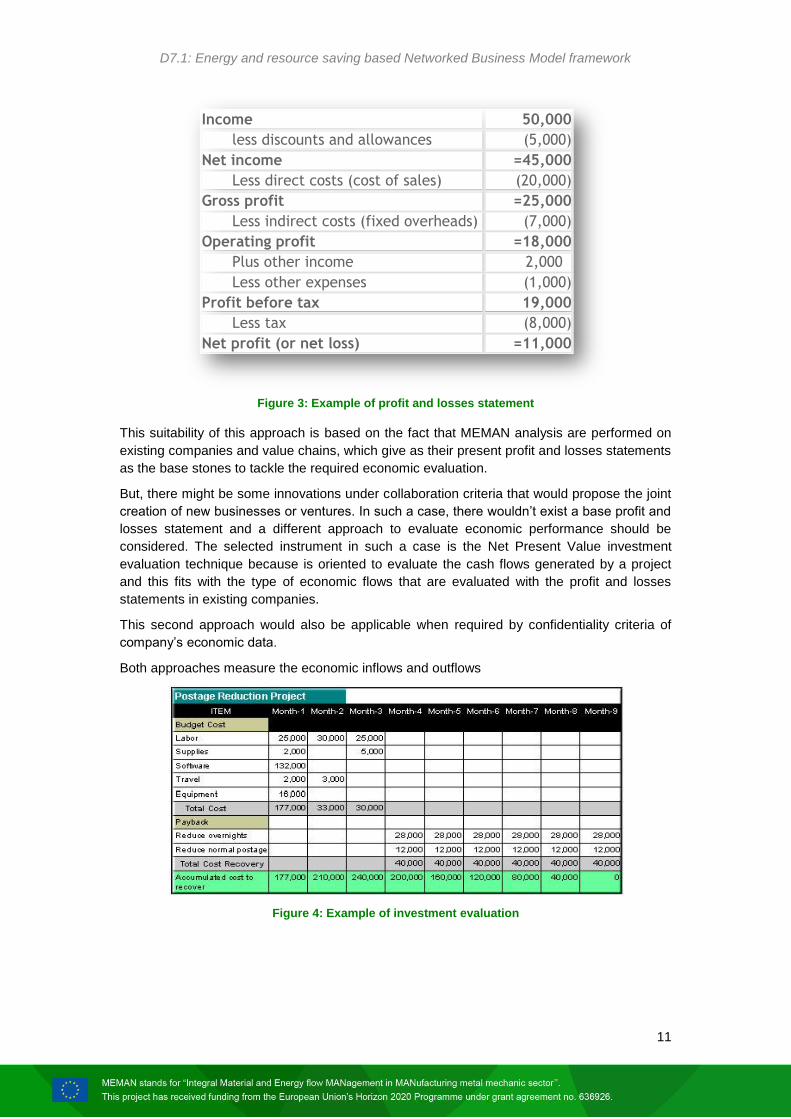
Figure 3: Example of profit and losses statement
This suitability of this approach is based on the fact that MEMAN analysis are performed on
existing companies and value chains, which give as their present profit and losses statements
as the base stones to tackle the required economic evaluation.
But, there might be some innovations under collaboration criteria that would propose the joint
creation of new businesses or ventures. In such a case, there wouldn’t exist a base profit and
losses statement and a different approach to evaluate economic performance should be
considered. The selected instrument in such a case is the Net Present Value investment
evaluation technique because is oriented to evaluate the cash flows generated by a project
and this fits with the type of economic flows that are evaluated with the profit and losses
statements in existing companies.
This second approach would also be applicable when required by confidentiality criteria of
company’s economic data.
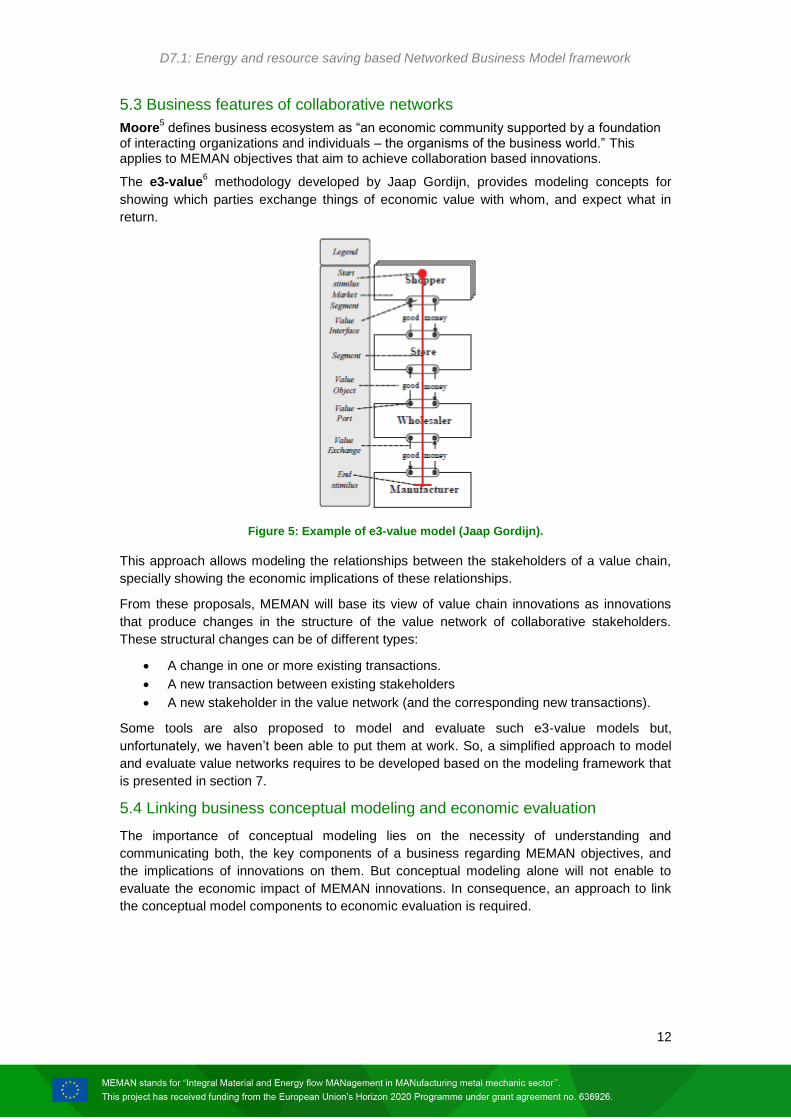
Both approaches measure the economic inflows and outflows
Figure 4: Example of investment evaluation
Income 50,000
less discounts and allowances (5,000)
Net income =45,000
Less direct costs (cost of sales) (20,000)
Gross profit =25,000
Less indirect costs (fixed overheads) (7,000)
Operating profit =18,000
Plus other income 2,000
Less other expenses (1,000)
Profit before tax 19,000
Less tax (8,000)
Net profit (or net loss) =11,000
D7.1: Energy and resource saving based Networked Business Model framework
12
5.3 Business features of collaborative networks
Moore5 defines business ecosystem as “an economic community supported by a foundation
of interacting organizations and individuals – the organisms of the business world.” This applies to MEMAN objectives that aim to achieve collaboration based innovations.
The e3-value6 methodology developed by Jaap Gordijn, provides modeling concepts for
showing which parties exchange things of economic value with whom, and expect what in
return.
Figure 5: Example of e3-value model (Jaap Gordijn).
This approach allows modeling the relationships between the stakeholders of a value chain,
specially showing the economic implications of these relationships.
From these proposals, MEMAN will base its view of value chain innovations as innovations
that produce changes in the structure of the value network of collaborative stakeholders.
These structural changes can be of different types:
A change in one or more existing transactions.
A new transaction between existing stakeholders
A new stakeholder in the value network (and the corresponding new transactions).
Some tools are also proposed to model and evaluate such e3-value models but,
unfortunately, we haven’t been able to put them at work. So, a simplified approach to model
and evaluate value networks requires to be developed based on the modeling framework that
is presented in section 7.
5.4 Linking business conceptual modeling and economic evaluation
The importance of conceptual modeling lies on the necessity of understanding and
communicating both, the key components of a business regarding MEMAN objectives, and
the implications of innovations on them. But conceptual modeling alone will not enable to
evaluate the economic impact of MEMAN innovations. In consequence, an approach to link
the conceptual model components to economic evaluation is required.
D7.1: Energy and resource saving based Networked Business Model framework
13
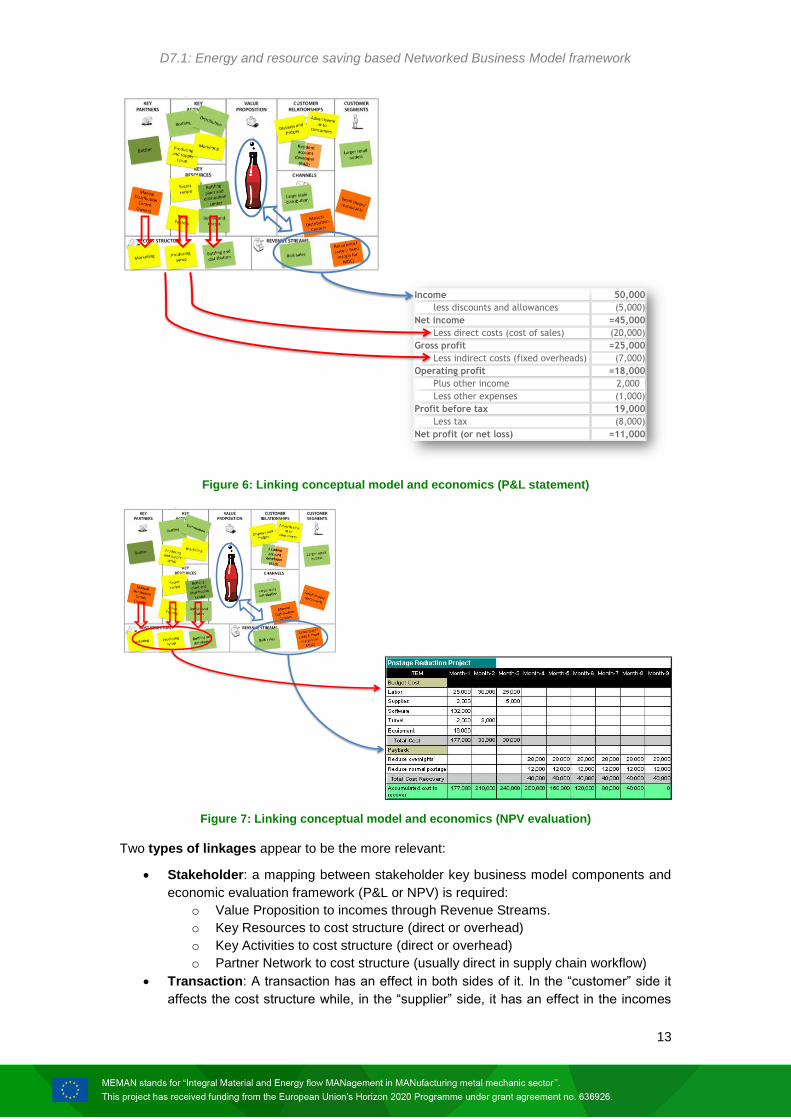
Figure 6: Linking conceptual model and economics (P&L statement)
Figure 7: Linking conceptual model and economics (NPV evaluation)
Two types of linkages appear to be the more relevant:
Stakeholder: a mapping between stakeholder key business model components and
economic evaluation framework (P&L or NPV) is required:
o Value Proposition to incomes through Revenue Streams.
o Key Resources to cost structure (direct or overhead)
o Key Activities to cost structure (direct or overhead)
o Partner Network to cost structure (usually direct in supply chain workflow)
Transaction: A transaction has an effect in both sides of it. In the “customer” side it
affects the cost structure while, in the “supplier” side, it has an effect in the incomes
Income 50,000
less discounts and allowances (5,000)
Net income =45,000
Less direct costs (cost of sales) (20,000)
Gross profit =25,000
Less indirect costs (fixed overheads) (7,000)
Operating profit =18,000
Plus other income 2,000
Less other expenses (1,000)
Profit before tax 19,000
Less tax (8,000)
Net profit (or net loss) =11,000

D7.1: Energy and resource saving based Networked Business Model framework
14
and indirectly in the cost incurred to produce the goods or services exchanged in the
transaction.
D7.1: Energy and resource saving based Networked Business Model framework
15
6. BUSINESS MODEL FRAMEWORK
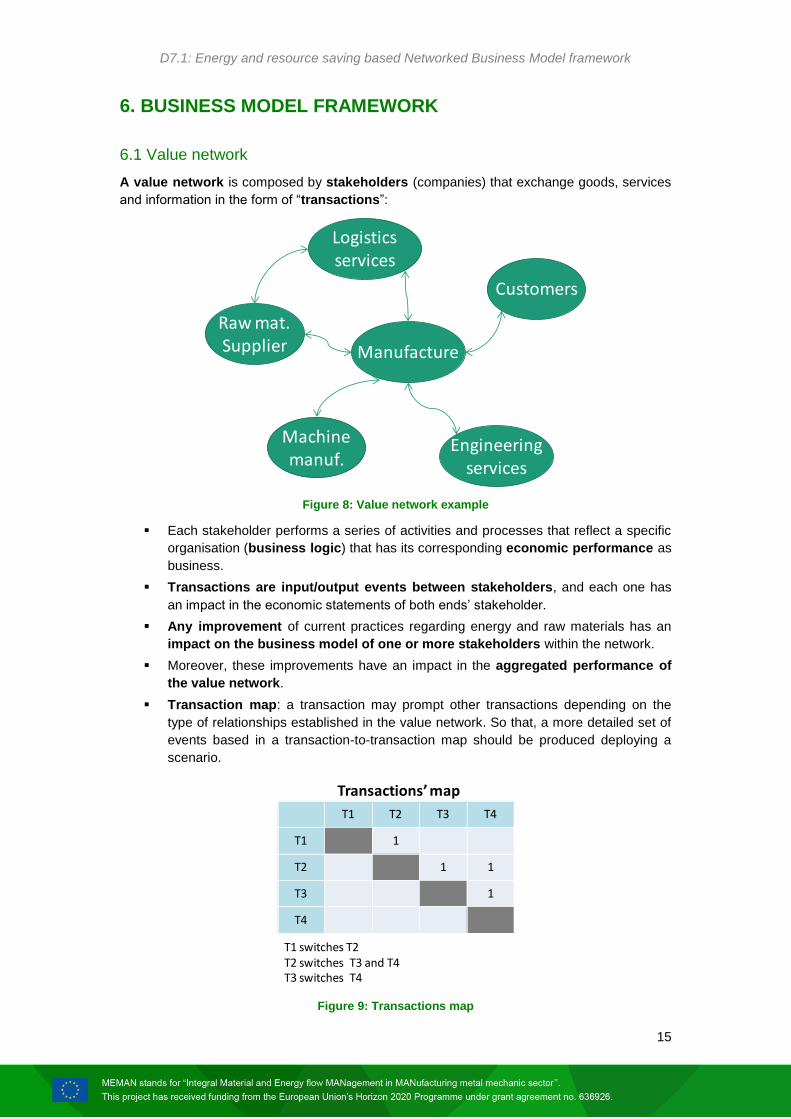
6.1 Value network
A value network is composed by stakeholders (companies) that exchange goods, services
and information in the form of “transactions”:
Figure 8: Value network example
Each stakeholder performs a series of activities and processes that reflect a specific
organisation (business logic) that has its corresponding economic performance as
business.
Transactions are input/output events between stakeholders, and each one has
an impact in the economic statements of both ends’ stakeholder.
Any improvement of current practices regarding energy and raw materials has an
impact on the business model of one or more stakeholders within the network.
Moreover, these improvements have an impact in the aggregated performance of
the value network.
Transaction map: a transaction may prompt other transactions depending on the
type of relationships established in the value network. So that, a more detailed set of
events based in a transaction-to-transaction map should be produced deploying a
scenario.
Figure 9: Transactions map
Manufacture
Customers
Raw mat.Supplier
Engineeringservices
Logisticsservices
Machinemanuf.
T1 T2 T3 T4
T1 1
T2 1 1
T3 1
T4
T1 switches T2T2 switches T3 and T4T3 switches T4
Transactions’ map
D7.1: Energy and resource saving based Networked Business Model framework
16
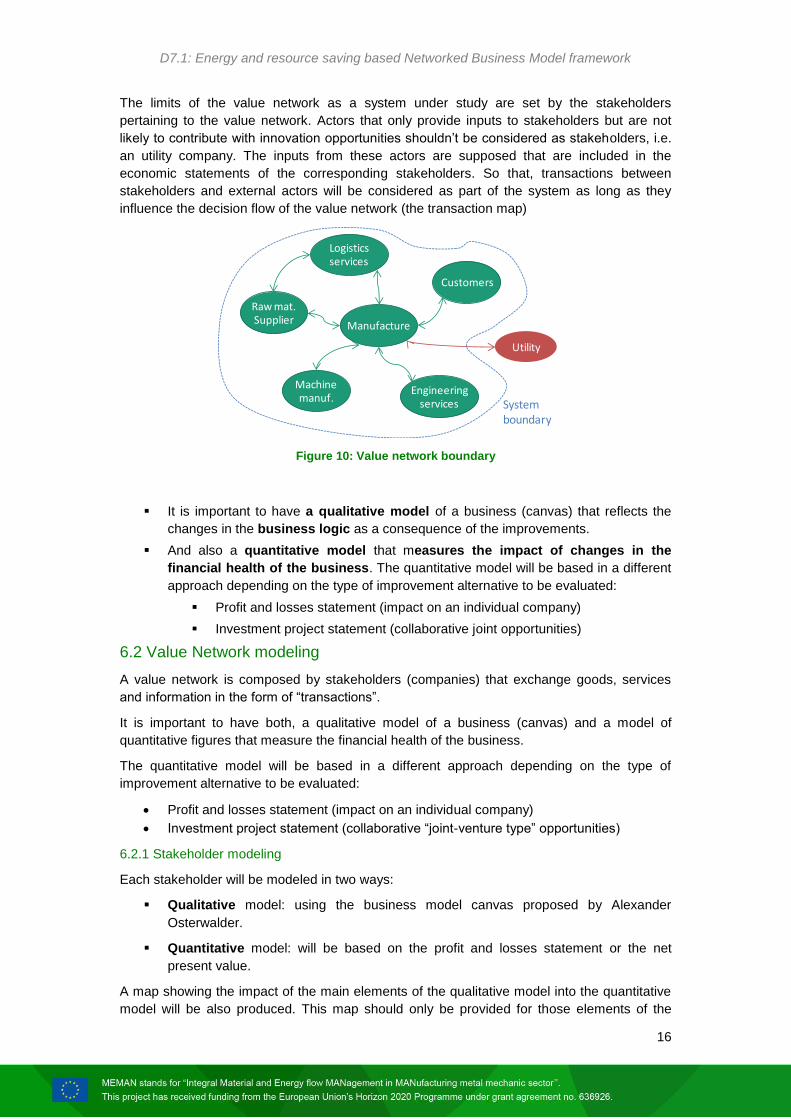
The limits of the value network as a system under study are set by the stakeholders
pertaining to the value network. Actors that only provide inputs to stakeholders but are not
likely to contribute with innovation opportunities shouldn’t be considered as stakeholders, i.e.
an utility company. The inputs from these actors are supposed that are included in the
economic statements of the corresponding stakeholders. So that, transactions between
stakeholders and external actors will be considered as part of the system as long as they
influence the decision flow of the value network (the transaction map)
Figure 10: Value network boundary
It is important to have a qualitative model of a business (canvas) that reflects the
changes in the business logic as a consequence of the improvements.
And also a quantitative model that measures the impact of changes in the
financial health of the business. The quantitative model will be based in a different
approach depending on the type of improvement alternative to be evaluated:
Profit and losses statement (impact on an individual company)
Investment project statement (collaborative joint opportunities)
6.2 Value Network modeling
A value network is composed by stakeholders (companies) that exchange goods, services
and information in the form of “transactions”.
It is important to have both, a qualitative model of a business (canvas) and a model of
quantitative figures that measure the financial health of the business.
The quantitative model will be based in a different approach depending on the type of
improvement alternative to be evaluated:
Profit and losses statement (impact on an individual company)
Investment project statement (collaborative “joint-venture type” opportunities)
6.2.1 Stakeholder modeling
Each stakeholder will be modeled in two ways:
Qualitative model: using the business model canvas proposed by Alexander
Osterwalder.
Quantitative model: will be based on the profit and losses statement or the net
present value.
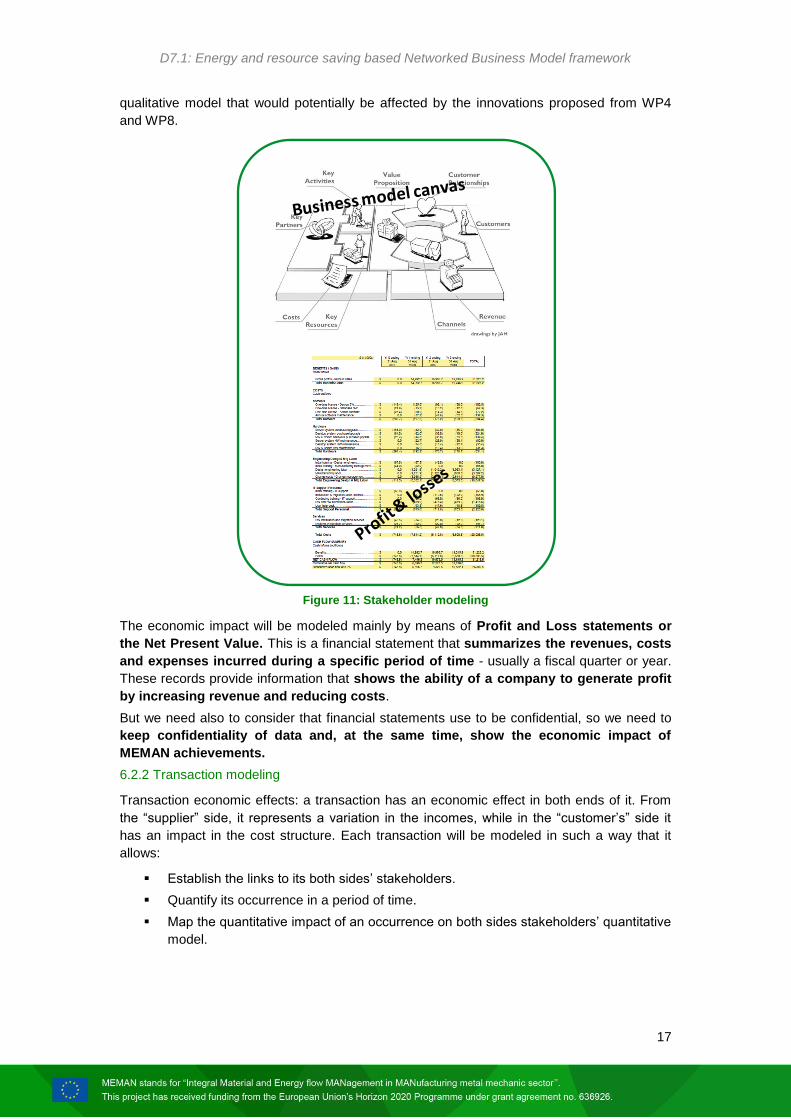
A map showing the impact of the main elements of the qualitative model into the quantitative
model will be also produced. This map should only be provided for those elements of the
Manufacture
Customers
Raw mat.Supplier
Engineeringservices
Logisticsservices
Machinemanuf.
Utility
Systemboundary
D7.1: Energy and resource saving based Networked Business Model framework
17
qualitative model that would potentially be affected by the innovations proposed from WP4
and WP8.
Figure 11: Stakeholder modeling
The economic impact will be modeled mainly by means of Profit and Loss statements or
the Net Present Value. This is a financial statement that summarizes the revenues, costs
and expenses incurred during a specific period of time - usually a fiscal quarter or year.
These records provide information that shows the ability of a company to generate profit
by increasing revenue and reducing costs.
But we need also to consider that financial statements use to be confidential, so we need to
keep confidentiality of data and, at the same time, show the economic impact of
MEMAN achievements.
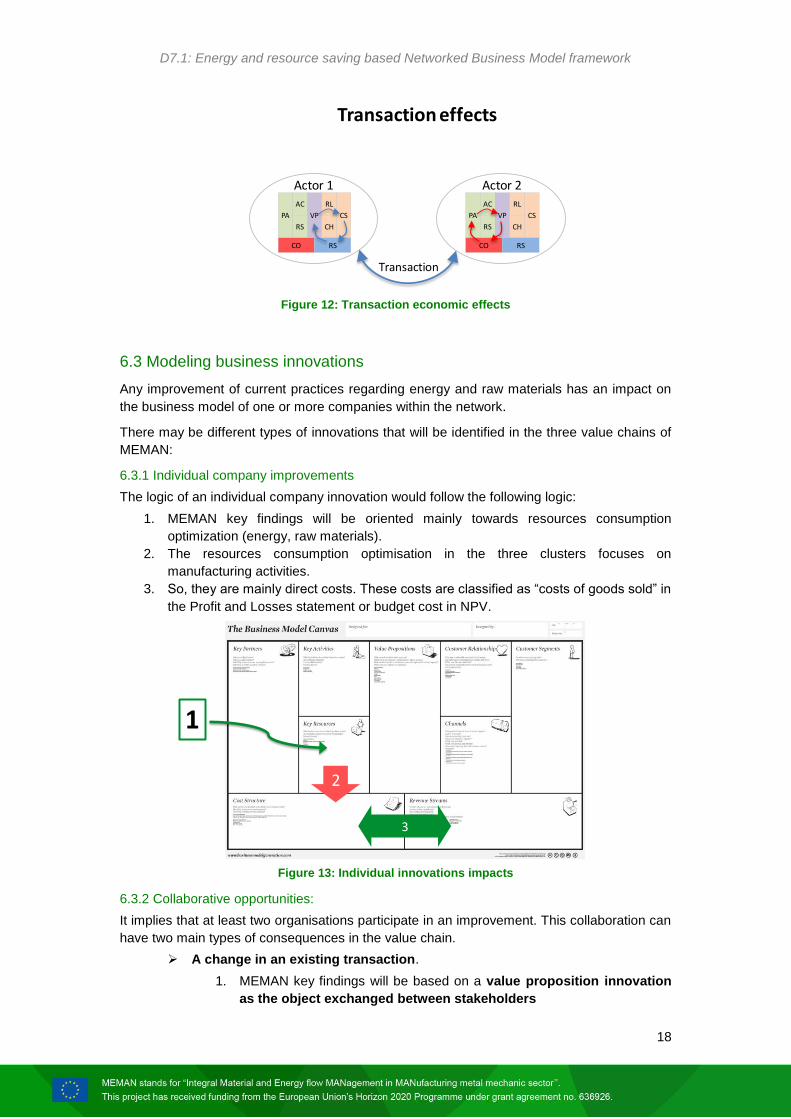
6.2.2 Transaction modeling
Transaction economic effects: a transaction has an economic effect in both ends of it. From
the “supplier” side, it represents a variation in the incomes, while in the “customer’s” side it
has an impact in the cost structure. Each transaction will be modeled in such a way that it
allows:
Establish the links to its both sides’ stakeholders.
Quantify its occurrence in a period of time.
Map the quantitative impact of an occurrence on both sides stakeholders’ quantitative
model.
D7.1: Energy and resource saving based Networked Business Model framework
18
Figure 12: Transaction economic effects
6.3 Modeling business innovations
Any improvement of current practices regarding energy and raw materials has an impact on
the business model of one or more companies within the network.
There may be different types of innovations that will be identified in the three value chains of
MEMAN:
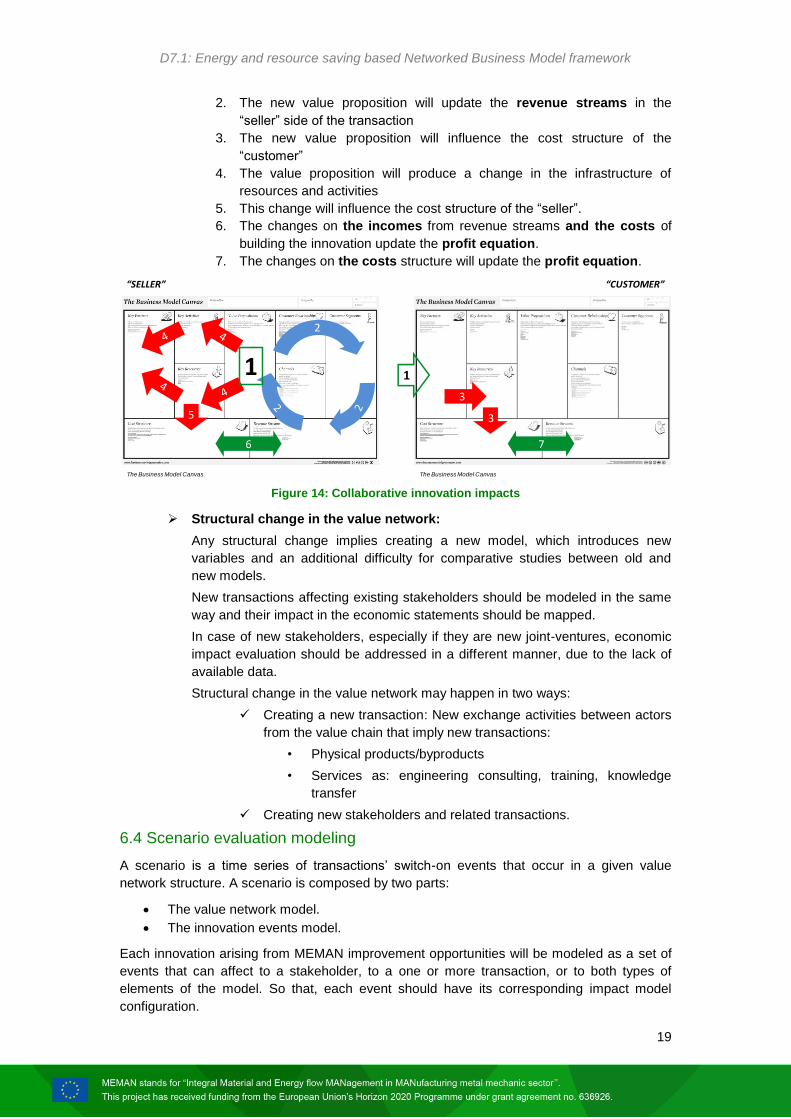
6.3.1 Individual company improvements
The logic of an individual company innovation would follow the following logic:
1. MEMAN key findings will be oriented mainly towards resources consumption
optimization (energy, raw materials).
2. The resources consumption optimisation in the three clusters focuses on
manufacturing activities.
3. So, they are mainly direct costs. These costs are classified as “costs of goods sold” in
the Profit and Losses statement or budget cost in NPV.
Figure 13: Individual innovations impacts
6.3.2 Collaborative opportunities:
It implies that at least two organisations participate in an improvement. This collaboration can
have two main types of consequences in the value chain.
A change in an existing transaction.
1. MEMAN key findings will be based on a value proposition innovation
as the object exchanged between stakeholders
Transaction effects
PA
AC
VP CS
RL
RS CH
CO RS
Actor 1
PA
AC
VP CS
RL
RS CH
CO RS
Actor 2
Transaction
2
3
1
D7.1: Energy and resource saving based Networked Business Model framework
19
2. The new value proposition will update the revenue streams in the
“seller” side of the transaction
3. The new value proposition will influence the cost structure of the
“customer”
4. The value proposition will produce a change in the infrastructure of
resources and activities
5. This change will influence the cost structure of the “seller”.
6. The changes on the incomes from revenue streams and the costs of
building the innovation update the profit equation.
7. The changes on the costs structure will update the profit equation.
Figure 14: Collaborative innovation impacts
Structural change in the value network:
Any structural change implies creating a new model, which introduces new
variables and an additional difficulty for comparative studies between old and
new models.
New transactions affecting existing stakeholders should be modeled in the same
way and their impact in the economic statements should be mapped.
In case of new stakeholders, especially if they are new joint-ventures, economic
impact evaluation should be addressed in a different manner, due to the lack of
available data.
Structural change in the value network may happen in two ways:
Creating a new transaction: New exchange activities between actors
from the value chain that imply new transactions:
• Physical products/byproducts
• Services as: engineering consulting, training, knowledge
transfer
Creating new stakeholders and related transactions.
6.4 Scenario evaluation modeling
A scenario is a time series of transactions’ switch-on events that occur in a given value
network structure. A scenario is composed by two parts:
The value network model.
The innovation events model.
Each innovation arising from MEMAN improvement opportunities will be modeled as a set of
events that can affect to a stakeholder, to a one or more transaction, or to both types of
elements of the model. So that, each event should have its corresponding impact model
configuration.
The Business Model Canvas
6
2
5
1
The Business Model Canvas
7
3
1
3
“SELLER” “CUSTOMER”
D7.1: Energy and resource saving based Networked Business Model framework
20
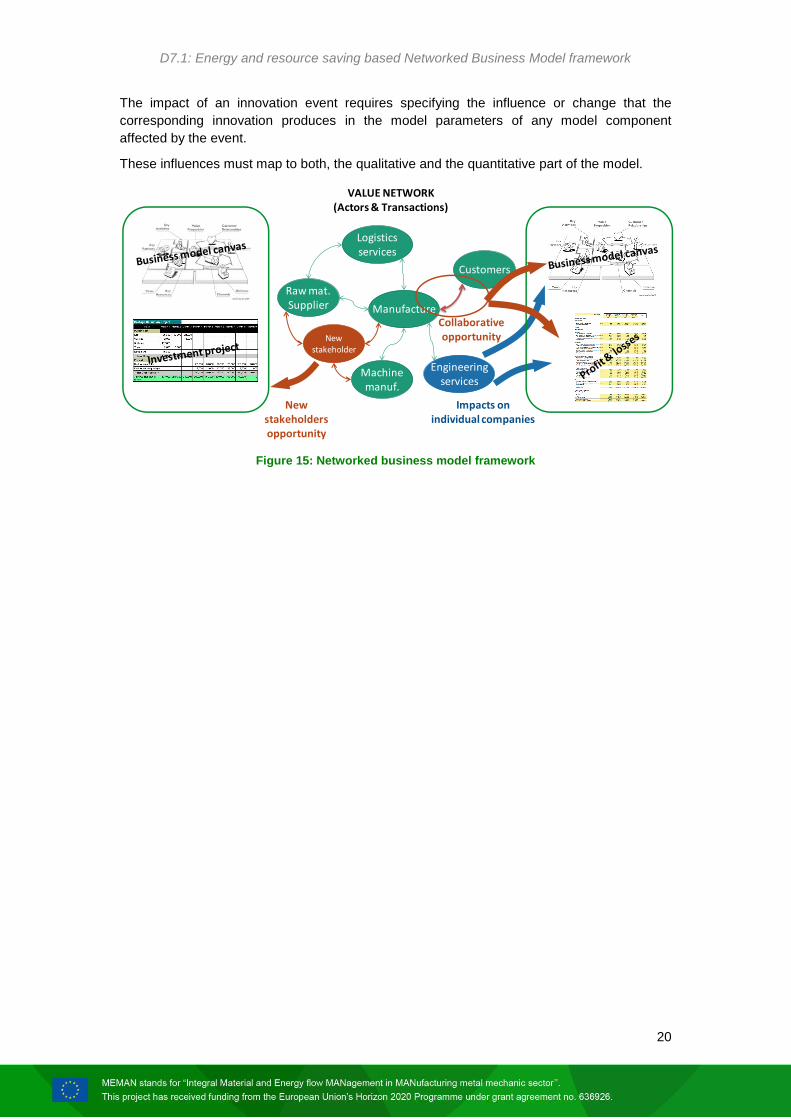
The impact of an innovation event requires specifying the influence or change that the
corresponding innovation produces in the model parameters of any model component
affected by the event.
These influences must map to both, the qualitative and the quantitative part of the model.
Figure 15: Networked business model framework
Manufacture
Customers
Raw mat.Supplier
Engineeringservices
Logisticsservices
Machinemanuf.
Newstakeholder
VALUE NETWORK(Actors & Transactions)
Impacts on individual companies
Collaborative opportunity
New stakeholders opportunity
D7.1: Energy and resource saving based Networked Business Model framework
21
7. METHODOLOGICAL ORIENTATIONS
7.1 Value network modeling
Office type common visual tools (powerpoint or others) and specific templates will be used for
value network modeling and its components specification. These templates must cover all the
modeling concepts described in the Networked Business Modeling Framework.
The templates will be defined in detail in task 7.2 of the project. A first version will be
developed for qualitative modeling purposes and feedback from this modeling will allow the
required refinement to gather data for economic evaluation purposes.
Methodologically, value network modeling will consider two types of components:
stakeholders and transactions.
7.1.1 Stakeholders
7.1.1.1 Stakeholders identification
Each stakeholder that participates in the flow of goods and services in the value network must
be identified and characterized as model component. This characterization includes only
stakeholder identification because the specific modeling of its components from a business
model perspective will be done in the “Stakeholder modeling” phase.
These identification characteristics will be based on the information available in D2.1 and
D2.2. Each company is a stakeholder, unless it has several business units that perform with
their respective business logic. In this later case, the business unit should be identified as a
stakeholder.
7.1.1.2 Stakeholder modeling
Business logic modeling
There are three relevant types of elements that require to be modeled from a business
logic perspective:
o Value propositions: these are the goods or services exchanged between value
network stakeholders. The characteristics of the product behind the value
proposition require also to consider some specific issues in the modeling:
- The requirements of the customers have to be implemented in the
decision process. Typically, the customer defines the required
characteristics of the products and if they are fulfilled. From this view it
has to be answered what should be achieved by the company and his
customer. One can also think about the location of production. In certain
cases the product could be needed directly at the customer's site. Then,
the company has to decide what kind of production process is needed,
e.g. 3D Printing vs. conventional manufacturing.
- These requirements will be modeled through the involved activities and
resources sections of the business logic, and the corresponding impact
on the cost structure.
o Customer interface:
- Customers segments: types of different customers that participate in
transactions with the stakeholder being modeled.
o Infrastructure:
- Main activities performed by the stakeholder regarding the process being
modeled, including management activities.
- Main resources that participate in the process: the reference information
required to identify this resources comes from functional units modeled in
WP2.
D7.1: Energy and resource saving based Networked Business Model framework
22
- Partnership: types of different suppliers or collaborations that participate
in transactions with the stakeholder being modeled.
Economic modeling
o Revenue streams: income flows produced as a consequence of transactions.
These flows will consider specially the incomes resulting from those transactions
between partners of the value network that are modified by the innovation
opportunities identified in the project.
o Cost structure: Costs structure derived from the infrastructure elements gathered
before, and the incoming transactions from value network partners that are
modified by the innovation opportunities identified in the project.
o Profit equation: Relation between incomes and costs that allows economic
evaluation of each stakeholder performance. In each case, the approach (Profit
statement or Investment evaluation) for the profit equation will be selected by
each partner of the value network. Profit equation modeling must preserve the
confidentiality of this sensitive information. Also costs/profits increase or
reduction percentages evaluation approaches will be analysed and implemented
if necessary and feasible.
7.1.2 Transactions
7.1.2.1 Transactions identification
The interfaces between stakeholders are the reference points to identify transactions between
stakeholders.
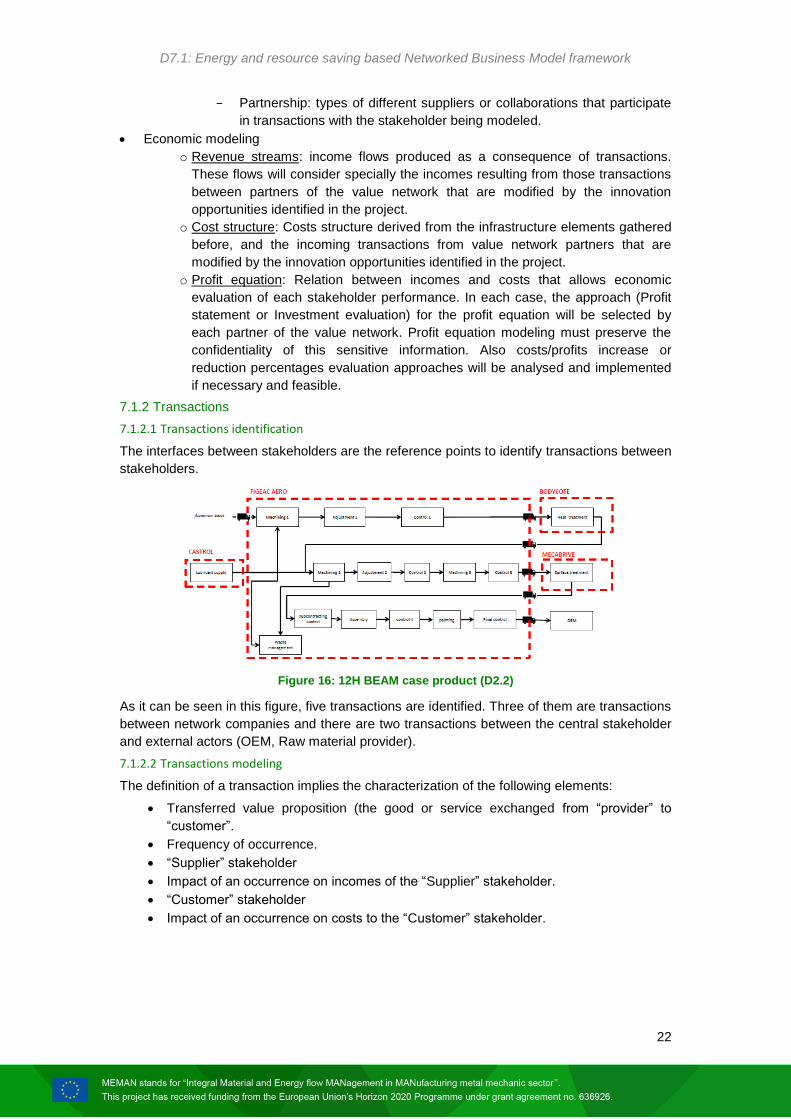
Figure 16: 12H BEAM case product (D2.2)
As it can be seen in this figure, five transactions are identified. Three of them are transactions
between network companies and there are two transactions between the central stakeholder
and external actors (OEM, Raw material provider).
7.1.2.2 Transactions modeling
The definition of a transaction implies the characterization of the following elements:
Transferred value proposition (the good or service exchanged from “provider” to
“customer”.
Frequency of occurrence.
“Supplier” stakeholder
Impact of an occurrence on incomes of the “Supplier” stakeholder.
“Customer” stakeholder
Impact of an occurrence on costs to the “Customer” stakeholder.
D7.1: Energy and resource saving based Networked Business Model framework
23
7.2 Business innovation opportunities identification
7.2.1 Individual company’s opportunities
The nature of MEMAN project has a high potential for business innovation opportunities from
an internal perspective of a company. Two main aspects need to be adequately modeled
from business model perspective:
Manufacturing processes
These include the activities and related equipment that is monitored and analised in
each cluster use case. Specific elements representing these items must be
implemented in the business model in the activities and resources of the modeling
framework.
Economic model
These economic aspects will reflect first the impact of each manufacturing process
components in the cost structure. Secondly, cost and income elements will be
mapped to the type of profit equation selected by the company.
Once this modeling is ready, a specific modeling of innovation opportunities will be
addressed. Each innovation opportunity will be modeled as an event. The modeling of an
event must include at least the following items:
Innovation event identification
Frequency of occurrence: how many times does the innovation represented by the
event impact in the profit equation?
Business model elements involved in the innovation
Impact of an occurrence on incomes
Impact of an occurrence on costs
7.2.2 Business Models and Value Networks
According to Chesbrough as mentioned in chapter 6, one of the components of a business
model is the definition of the structure of the value network, required to create and distribute
the offered products to the customers. Which partners and their resources are needed to
manufacture and deliver the intended product or service. The time that many OEMs
developed, manufactured and sold all products by themselves is already for a long period left
behind us. Due to increased outsourcing, specialization and increased technological
complexity, especially in the high tech sector, it is closer to reality to speak about value
networks competing with each other than competition among individual OEMs. Partners in the
value network increasingly possess specific knowledge that contributes to the competitive
advantages of a certain product. These specialisms contribute to superior product
capabilities, shortening of the time to market and/or lowering the production cost. The
specialist competences give the different partners in the value network a more independent
and powerful position. The OEM and the value network partners have become mutually
dependent. This will find its reflection in the business model and the division of the generated
revenues.
The above mentioned developments have led to a variety of value networks. All value
networks may have a lead firm but the distribution of power between the partners and the
degree of explicit coordination will be different in each value network.
The following typology of value networks helps to come to grips with these differences and
the consequences of them for the strategic position of the individual value network partners
and the division of costs and revenues in the value network.
D7.1: Energy and resource saving based Networked Business Model framework
24
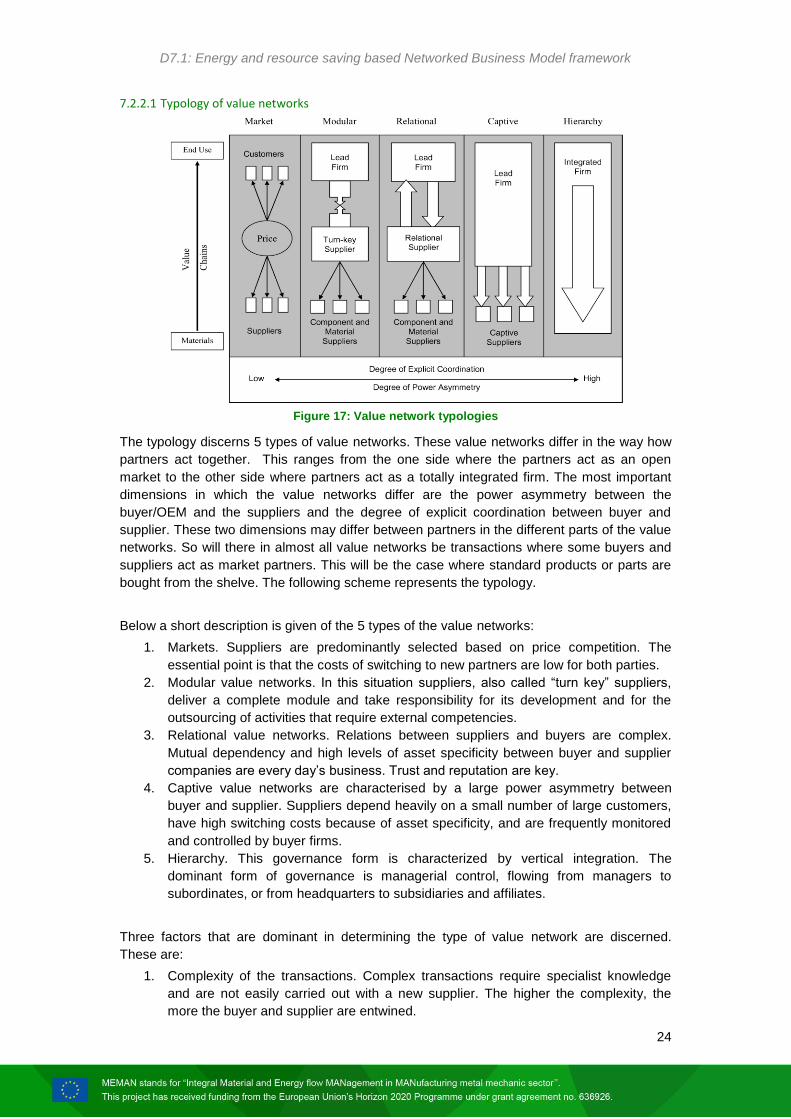
7.2.2.1 Typology of value networks
Figure 17: Value network typologies
The typology discerns 5 types of value networks. These value networks differ in the way how
partners act together. This ranges from the one side where the partners act as an open
market to the other side where partners act as a totally integrated firm. The most important
dimensions in which the value networks differ are the power asymmetry between the
buyer/OEM and the suppliers and the degree of explicit coordination between buyer and
supplier. These two dimensions may differ between partners in the different parts of the value
networks. So will there in almost all value networks be transactions where some buyers and
suppliers act as market partners. This will be the case where standard products or parts are
bought from the shelve. The following scheme represents the typology.
Below a short description is given of the 5 types of the value networks:
1. Markets. Suppliers are predominantly selected based on price competition. The
essential point is that the costs of switching to new partners are low for both parties.
2. Modular value networks. In this situation suppliers, also called “turn key” suppliers,
deliver a complete module and take responsibility for its development and for the
outsourcing of activities that require external competencies.
3. Relational value networks. Relations between suppliers and buyers are complex.
Mutual dependency and high levels of asset specificity between buyer and supplier
companies are every day’s business. Trust and reputation are key.
4. Captive value networks are characterised by a large power asymmetry between
buyer and supplier. Suppliers depend heavily on a small number of large customers,
have high switching costs because of asset specificity, and are frequently monitored
and controlled by buyer firms.
5. Hierarchy. This governance form is characterized by vertical integration. The
dominant form of governance is managerial control, flowing from managers to
subordinates, or from headquarters to subsidiaries and affiliates.
Three factors that are dominant in determining the type of value network are discerned.
These are:
1. Complexity of the transactions. Complex transactions require specialist knowledge
and are not easily carried out with a new supplier. The higher the complexity, the
more the buyer and supplier are entwined.
D7.1: Energy and resource saving based Networked Business Model framework
25
2. Codifiability of the transactions. When transactions can be well codified into concrete
specifications or instructions, the outsourcing of them can be done in a controlled
way. In case of low codifiable transactions the relationship between buyer and
supplier must be closer. The specific know how of the partners is complementary.
Often tacit or sticky knowledge of one or both partners is involved. Therefore, the
lower the codifiability of transactions, the more the buyer and supplier are entwined.
3. Capabilities of the suppliers. The capability of suppliers to internalise knowledge,
develop products and access markets, strengthens their position in the value
network.
7.2.2.2 Business model types in value networks
There are broadly three main types of business models in value networks. These are 1) Cost
based business models, 2) Performance based business models and 3) Revenue based
models. Important aspects of value network business models are the sharing of risks and
rewards.
1. Cost based business models
Cost based models are based on the actual costs that the value network needs to
make in order to realise the product. If suppliers and buyers in a value network
work together, suppliers are compensated for their energy, (auxiliary) material,
and labour costs. Usually, the risk is carried by the buyer firm. There are also
models possible in which the supplier and buyer share the risk, for example,
when payment is carried out afterwards.
2. Performance based business models
In performance based business models the supplier will realise the components
for the buyer and get paid a predetermined amount of money. The supplier will
have an incentive to realise it as cost effective as possible, since all savings will
be directly for the supplier. A possibility is to take into account the learning effect
of the supplier, by decreasing the amount over time, anticipating on declining
costs for the supplier.
3. Revenue based business models
In revenue based business models the reward of the supplier is related to the
commercial success of the resulting product. For example the number of
products sold. This is a far-reaching form of cost- and risk sharing between the
buyer and the supplier. Several variations can be developed on this basic
principle.
D7.1: Energy and resource saving based Networked Business Model framework
26
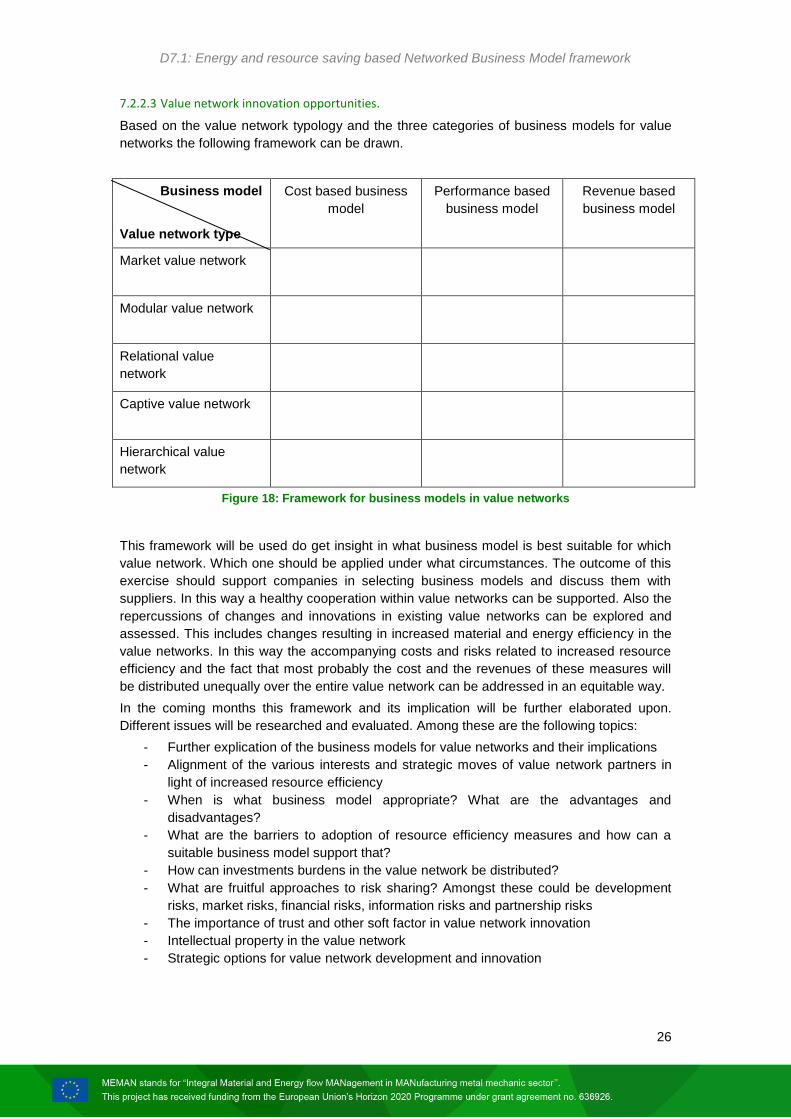
7.2.2.3 Value network innovation opportunities.
Based on the value network typology and the three categories of business models for value
networks the following framework can be drawn.
Business model
Value network type
Cost based business
model
Performance based
business model
Revenue based
business model
Market value network
Modular value network
Relational value
network
Captive value network
Hierarchical value
network
Figure 18: Framework for business models in value networks
This framework will be used do get insight in what business model is best suitable for which
value network. Which one should be applied under what circumstances. The outcome of this
exercise should support companies in selecting business models and discuss them with
suppliers. In this way a healthy cooperation within value networks can be supported. Also the
repercussions of changes and innovations in existing value networks can be explored and
assessed. This includes changes resulting in increased material and energy efficiency in the
value networks. In this way the accompanying costs and risks related to increased resource
efficiency and the fact that most probably the cost and the revenues of these measures will
be distributed unequally over the entire value network can be addressed in an equitable way.
In the coming months this framework and its implication will be further elaborated upon.
Different issues will be researched and evaluated. Among these are the following topics:
- Further explication of the business models for value networks and their implications
- Alignment of the various interests and strategic moves of value network partners in
light of increased resource efficiency
- When is what business model appropriate? What are the advantages and
disadvantages?
- What are the barriers to adoption of resource efficiency measures and how can a
suitable business model support that?
- How can investments burdens in the value network be distributed?
- What are fruitful approaches to risk sharing? Amongst these could be development
risks, market risks, financial risks, information risks and partnership risks
- The importance of trust and other soft factor in value network innovation
- Intellectual property in the value network
- Strategic options for value network development and innovation
D7.1: Energy and resource saving based Networked Business Model framework
27
7.2.2.4 Value network innovation opportunities modeling.
The opportunities identified from a value network perspective affect to the network structure in
the sense that it involves at least on transaction and two stakeholders.
These opportunities modelling will have as reference the actual value network model and will
show how the opportunity transforms stakeholders’ business models and the transactions
between them.
Stakeholders’ transformations:
These transformations must reflect the changes in the business model components,
and its consequences in the cost structure and revenues’ streams.
Transactions’ transformations:
These transformations must reflect the changes in the characteristics of existing
transactions (see section 8.1).
In case the opportunity induces a change in the structure itself by adding or eliminating
stakeholders or transactions. We need to proceed to model the new value network using the
BMF.
The procedure to follow when identifying and modelling value network innovation
opportunities will be the following:
1. Model the existing value network using the BMF.
2. Identify value network innovation opportunities based on the approach presented in
8.2.2.
3. Model the new value network:
Structure
Stakeholders
Transactions
7.2.2.5 Communication and cooperation between supplier and customer
Due to the increasing number of different requirements, it is necessary to enhance the tools
to exchange information about the product characteristics. This could be related to the
selection of the raw material used, the way of processing the material or the combination of
materials.
Furthermore, the possibilities of recycling depend on the material and the manufacturing. The
chance to save resources increases by matching the materials and the required
characteristics of the end-product.
The innovation opportunities regarding communication and cooperation will also be
considered and modeled to assess their influence in the value chain performance. This
implies to identify and model the impact of the new communication and cooperation strategies
and tools in the elements of the value chain: stakeholders and transactions.
7.3 Business innovation scenario modeling
The aim of scenario modeling is to provide a modeling framework to represent the impact of
business innovation opportunities into the economic performance assessment. This is an
intermediate step between qualitative business opportunities appraisal and modeling and
their economic evaluation.
A business innovation opportunity will be transformed into a series on “events” that modify the
characteristics of the value network model elements’ (stakeholders and transactions)
characteristics.
In case an innovation opportunity implies changing the value network structure, the new value
network must be modeled in advance. Afterwards, the events corresponding to the innovation
opportunity will be defined.
D7.1: Energy and resource saving based Networked Business Model framework
28
7.3.1 Stakeholder events
Stakeholder related events will impact the cost structure through activities and resources
innovations. An event must show the increase or decrease on the consumption of activities
and/or resources. Depending on the nature of the qualitative innovation and the economic
evaluation statement chosen (P&L or NPV), the impact can be spread in one or more periods
of time.
In task T7.2 a list of preliminary event types and associated modeling guideline and attached
forms will be produced, considering all type of innovations arising from each cluster case.
7.3.2 Transaction events
Transaction related events modify the characteristics of existing transactions. These events
may modify any characteristic of the transaction, but specially those corresponding to
economic evaluation:
Frequency of occurrence.
Impact of an occurrence on incomes of the “Supplier” stakeholder.
Impact of an occurrence on costs to the “Customer” stakeholder.
7.3.3 General events
Events will be modeled to show how variables external to the value network influence the
scenario and the performance of the value networks. These events will be used to represent
specific risks such energy/raw material price variations, regulation and taxes, etc…
7.4 Economic evaluation
Economic impact evaluation is a key aspect for the framework and must consider the
confidentiality issues of the required information and also results.
Independently of the chosen economic statement (P&L or NPV), the
figures will be treated and presented in a way that preserves company’s
confidentiality.
The approach to keep confidentiality of figures will be developed and agreed between cluster
leaders as a first step y task T7.3.
In addition to that, each cluster network will choose the type of statement more suitable for
economic evaluation purposes in their use case.
Example: Imagine an innovation opportunity that involves retrofitting an
existing equipment to obtain a 20% reduction on energy consumption of this
equipment (the equipment consumes the 50% of the total energy). The
retrofitting costs have been accounted as an investment of € 20.000, to be
amortised over 5 years. This innovation would trigger two events:
Event 1: (20% * 50%) reduction on the energy costs in the cost of
goods sold line of the P&L statement.
Event 2: An increase of €4.000 in the fixed overhead costs in the P&L
statement.
D7.1: Energy and resource saving based Networked Business Model framework
29
8. CONCLUSIONS
Deliverable 7.1 define a modeling framework based on existing business modeling
techniques and methods devoted to model and assess the consequences innovation
oportunities identified in the project.
The deliverable is a modeling proposal that will be used as a main input to subsequent tasks
of WP7. The critical issue has been to build a modeling proposal integrating different existing
techniques due to the absence of proposals that provide adequate tools to tackle all the
aspects we need to address.
The negative consequence of this “blended” approach is the inexistence of available tools
that reflect all the modeling issues required in MEMAN regarding networked business
modeling. This implies that an especial effort requires to be made in subsequent task to
provide procedures, forms and tools to get the objectives.
On the positive there is a match between the three main element of the NBMF and the
following tasks of WP7:
The value network modeling framework will be used then in task T7.2 to model
each cluster’s value network in a qualitative way. Actual value network and the new
network as a result of innovations opportunities will be modeled.
The economic evaluation represents the quantitative part of the model. Specific
tools based on the value network modeling and economic evaluation proposals will
be developed in task T7.3 to assess the economic consequences of innovation
opportunities.
Finally, the modeling orientations will guide the execution of tasks T7.2 and T7.3,
and will also provide specific inputs for task T7.4.
In conclusion, the results of task T7.1 presented in this deliverable provide the modeling
framework to be used in subsequent tasks in order to fulfill the objectives of WP7: the design
and assessment of new business models under the collaboration criteria established for
reducing energy and resource consumption along the entire value chain.
D7.1: Energy and resource saving based Networked Business Model framework
30
9. REFERENCES
[1] David J. Teece, Business Models, Business Strategy and Innovation, Long Range
Planning (2009)
[2] Chesbrough, Henry and Rosenbloom, Richard S., The Role of the Business Model in
Capturing Value from Innovation: Evidence from Xerox Corporation's Technology Spin-Off
Companies. Industrial and Corporate Change, 2002.
[3] Johnson, Mark W., Christensen, Clayton M. and Kagermann, Henning; Reinventing Your
Business Model; Harvard Business Review, Dec. 2008, pp. 50-59.
[4] Osterwalder, Alexander. "The business model ontology: A proposition in a design science
approach." (2004).
[5] Moore, J.F. 1993. Predators and Prey: The New Ecology of Competition. Harward
Business Review. Vol. 71(3), pp. 75-83.
[6] Jaap Gordijn. Value-based Requirements Engineering - Exploring Innovative e-Commerce
Ideas. PhD thesis, Vrije Universiteit, Amsterdam, NL, 2002
[7] Justine Bisiaux. La transition vers l’innovation soutenable pour les entreprises
industrielles: une approche par les business models : application au domaine du génie
industriel. PhD thesis, Université de Technologie de Compiègne, Compiègne, FR, 2015

D7.1: Energy and resource saving based Networked Business Model framework
31
Copyright
“Copyright and Reprint Permissions. You may freely reproduce all or part of this paper for non-
commercial purposes, provided that the following conditions are fulfilled: (i) to cite the authors, as
the copyright owners (ii) to cite the MEMAN Project and mention that the European Commission
co-finances it, by means of including this statement “MEMAN. FoF - 2014 - 2015 No 636926.
Funded by EC” and (iii) not to alter the information.”