Embed Size (px)
Citation preview
2014
Released Date: Novermber 2015
Energy and Water Statistics
2
Ener
gy a
nd W
ater
sta
tist
ic 201
4
Table of content Introduction ......................................................................................................................... 3
Water and electricity statistics .......................................................................................... 4
Electricity generation ......................................................................................................... 4
Fuel consumption of the water and electricity activity ........................................................ 5
Electricity generated by solar energy ................................................................................. 6
Electricity consumption ...................................................................................................... 7
Production of desalinated water ......................................................................................... 8
Consumption of desalinated water ..................................................................................... 8
Oil and gas statistics ........................................................................................................ 11
Crude oil production and exports ..................................................................................... 11
Crude oil prices................................................................................................................ 12
Petroleum products ......................................................................................................... 13
Natural gas ...................................................................................................................... 15
Explanatory Notes ............................................................................................................. 16
Data sources……………………………………………………………………………………...16
Abbreviations used ......................................................................................................... 16
Notes on tables ............................................................................................................... 16
More information and next release .................................................................................. 16
References ..................................................................................................................... 16
3
Ener
gy a
nd W
ater
sta
tist
ic 201
4
Introduction
This report presents statistics of energy and water in the Emirate of Abu Dhabi for the year 2014, compromising statistics of water and electricity production sector and oil and gas sector. The main sources for these statistics are Abu Dhabi National Oil Company – ADNOC, Abu Dhabi Water and Electricity Authority – ADWEA, Abu Dhabi Future Energy Company – Masdar, Abu Dhabi Water and Electricity Company, Abu Dhabi Distribution Company, Al Ain Distribution Company and TAKREER.
The Explanatory Notes section at the end of this report provides an explanation of the key terms and technical concepts used in the compilation of energy and water statistics. Readers are encouraged to refer to that section in conjunction with reading the statistics and information outlined in the report.
4
Ener
gy a
nd W
ater
sta
tist
ic 201
4
Water and electricity statistics Water and electricity production sector has a great significance among the various economic sectors, given its big role in the provision of basic services that are necessary for Citizens, Non-Citizens in additional to other economic activities. Therefore, the Emirate of Abu Dhabi pays attention to the development of this sector.
“Water and Electricity” sector saw a remarkable growth after establishing the Abu Dhabi Water and Electricity Authority (ADWEA) in March 1998, a public supervisory body responsible for implementing government policy regarding water and electricity sector in the Emirate.
(ADWEA) is serving about 2.7 million inhabitants in the Emirate of Abu Dhabi, living over approximately 67,340 square kilometers, and equivalent to 87 % of the total area of the United Arab Emirates. In 2014, the total electricity production for the Emirate of Abu Dhabi, except Fujairah stations, was equivalent to 12,571 MW, while the total capacity of water desalination was approximately 916 million gallons per day.
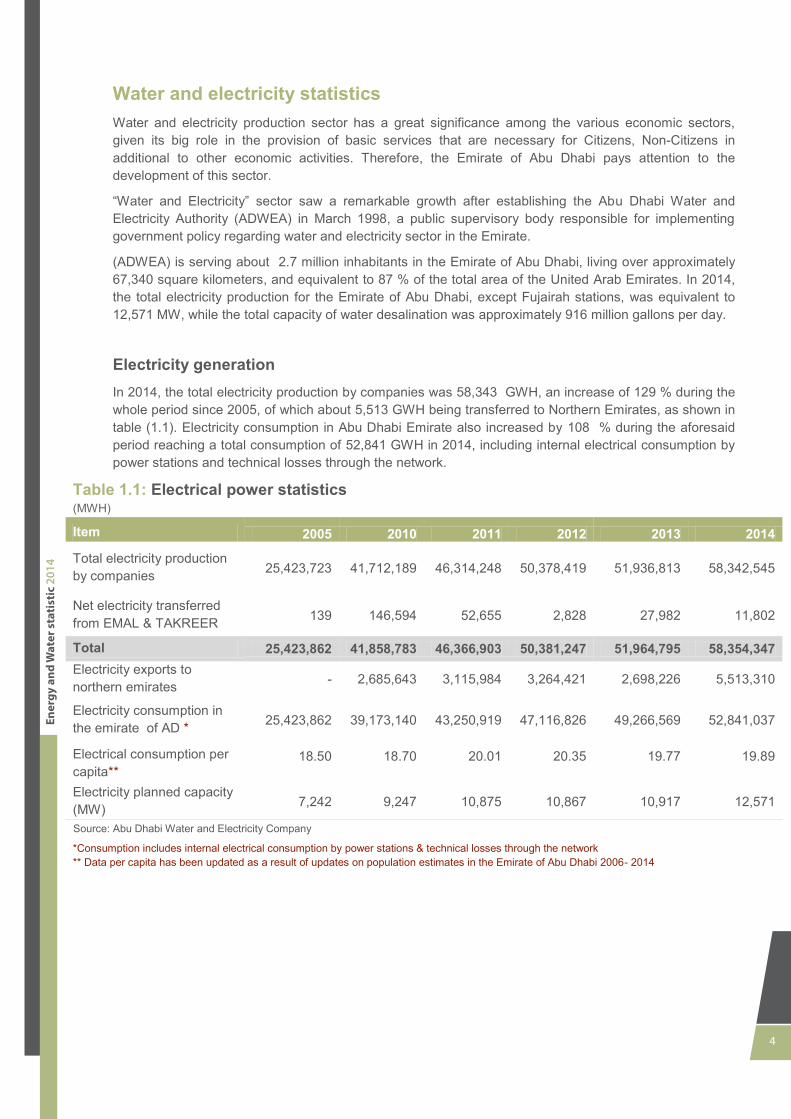
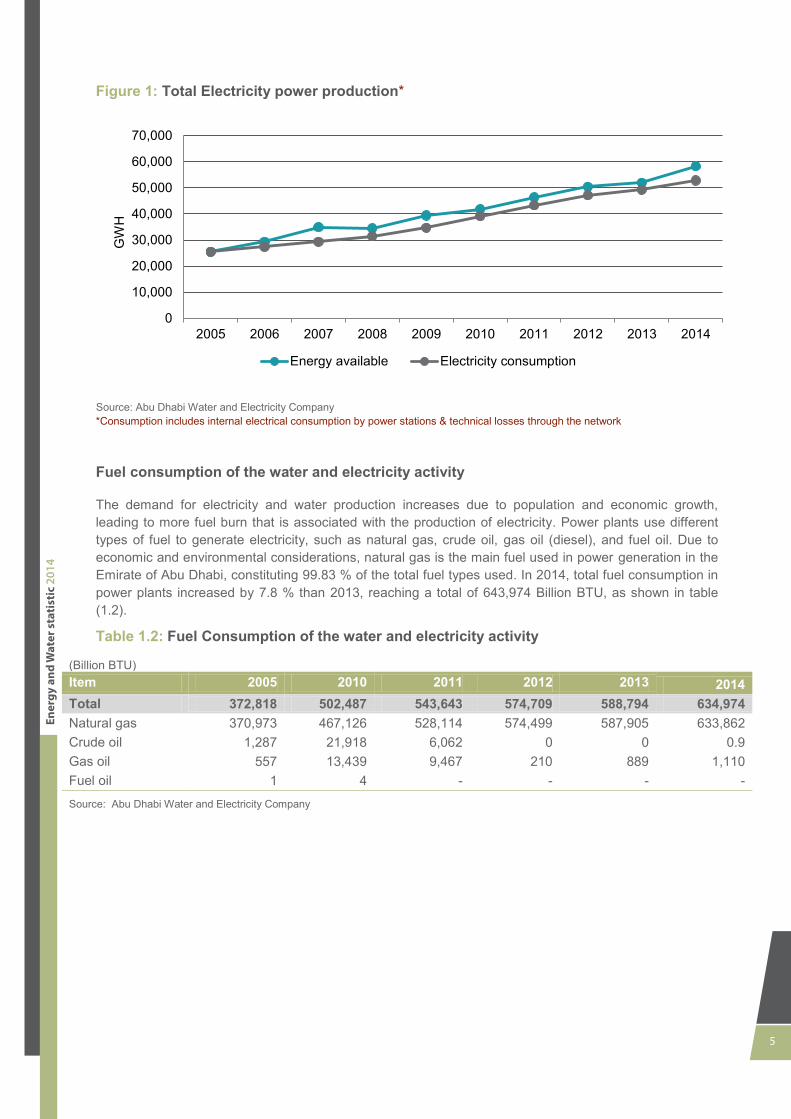
Electricity generation In 2014, the total electricity production by companies was 58,343 GWH, an increase of 129 % during the whole period since 2005, of which about 5,513 GWH being transferred to Northern Emirates, as shown in table (1.1). Electricity consumption in Abu Dhabi Emirate also increased by 108 % during the aforesaid period reaching a total consumption of 52,841 GWH in 2014, including internal electrical consumption by power stations and technical losses through the network.
Table 1.1: Electrical power statistics )MWH(
Item 2005 2010 2011 4104 2013 4102
Total electricity production by companies 25,423,723 41,712,189 46,314,248 91,,77,,05 90,5,3,70, 58,342,545
Net electricity transferred from EMAL & TAKREER 139 146,594 52,655 ,,7,7 ,7,57, 11,802
Total 25,423,862 41,858,783 46,366,903 213,103425 2031423512 58,354,347 Electricity exports to northern emirates - 2,685,643 3,115,984 ,,,3,,,,0 ,,357,,,3 5,513,310
Electricity consumption in the emirate of AD * 25,423,862 39,173,140 43,250,919 ,7,003,7,3 ,5,,33,935 52,841,037
Electrical consumption per capita**
18.50 18.70 20.01 20.35 19.77 19.89
Electricity planned capacity (MW) 7,242 9,247 10,875 01,737 01,507 12,571
Source: Abu Dhabi Water and Electricity Company
*Consumption includes internal electrical consumption by power stations & technical losses through the network ** Data per capita has been updated as a result of updates on population estimates in the Emirate of Abu Dhabi 2006- 2014
5
Ener
gy a
nd W
ater
sta
tist
ic 201
4
Figure 1: Total Electricity power production*
Source: Abu Dhabi Water and Electricity Company *Consumption includes internal electrical consumption by power stations & technical losses through the network
Fuel consumption of the water and electricity activity
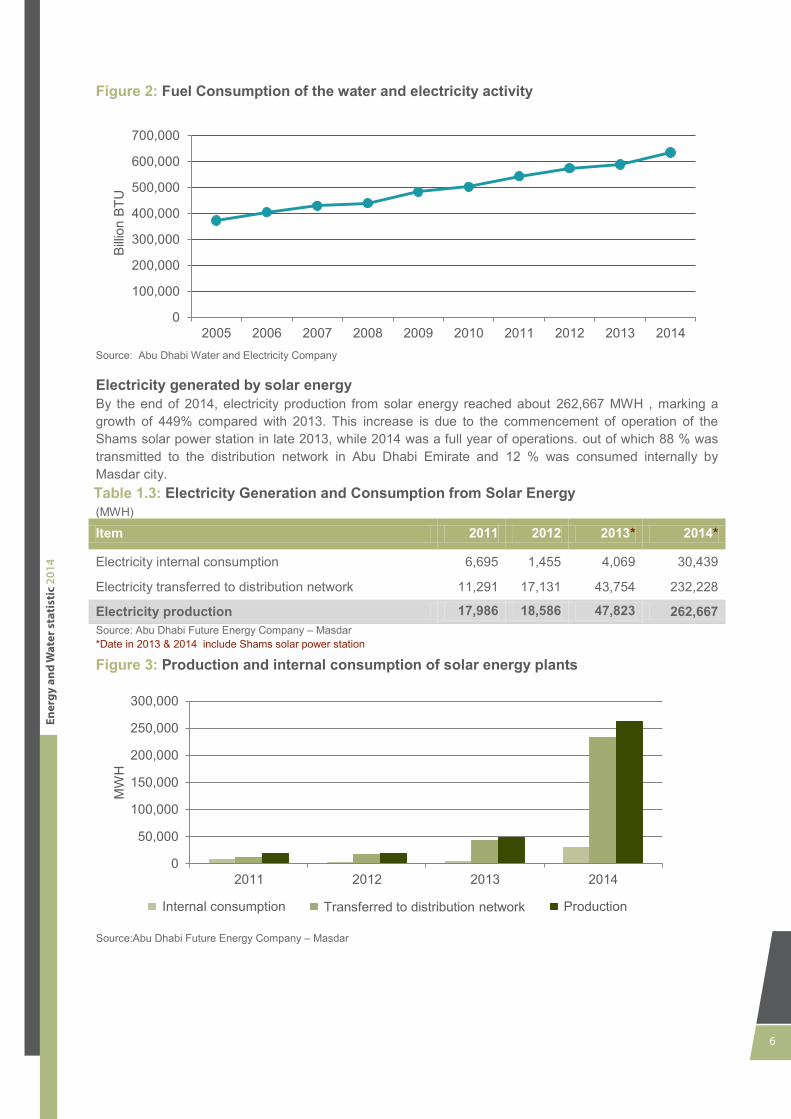
The demand for electricity and water production increases due to population and economic growth, leading to more fuel burn that is associated with the production of electricity. Power plants use different types of fuel to generate electricity, such as natural gas, crude oil, gas oil (diesel), and fuel oil. Due to economic and environmental considerations, natural gas is the main fuel used in power generation in the Emirate of Abu Dhabi, constituting 99.83 % of the total fuel types used. In 2014, total fuel consumption in power plants increased by 7.8 % than 2013, reaching a total of 643,974 Billion BTU, as shown in table (1.2).
Table 1.2: Fuel Consumption of the water and electricity activity
)Billion BTU (
Item 2005 2010 2011 4104 2013 4102 Total ,543101 2143215 543,643 574,709 588,794 634,974 Natural gas ,71,57, ,37,0,3 528,114 574,499 587,905 633,862 Crude oil 0,,77 ,0,507 6,062 0 0 0.9 Gas oil 997 0,,,,5 9,467 210 889 1,110 Fuel oil 0 , - - - -
Source: Abu Dhabi Water and Electricity Company
0
10,000
20,000
30,000
40,000
50,000
60,000
70,000
2005 2006 2007 2008 2009 2010 2011 2012 2013 2014
GW
H
Energy available Electricity consumption
6
Ener
gy a
nd W
ater
sta
tist
ic 201
4
Figure 2: Fuel Consumption of the water and electricity activity
Source: Abu Dhabi Water and Electricity Company
Electricity generated by solar energy By the end of 2014, electricity production from solar energy reached about 262,667 MWH , marking a growth of 449% compared with 2013. This increase is due to the commencement of operation of the Shams solar power station in late 2013, while 2014 was a full year of operations. out of which 88 % was transmitted to the distribution network in Abu Dhabi Emirate and 12 % was consumed internally by Masdar city.
Table 1.3: Electricity Generation and Consumption from Solar Energy )MWH(
Item 2011 2012 2013* 4102*
Electricity internal consumption 6,695 1,455 4,069 30,439
Electricity transferred to distribution network 11,291 17,131 43,754 232,228
Electricity production 17,986 18,586 47,823 262,667 Source: Abu Dhabi Future Energy Company – Masdar *Date in 2013 & 2014 include Shams solar power station
Figure 3: Production and internal consumption of solar energy plants
Source: Abu Dhabi Future Energy Company – Masdar
0
100,000
200,000
300,000
400,000
500,000
600,000
700,000
2005 2006 2007 2008 2009 2010 2011 2012 2013 2014
Billio
n BT
U
0
50,000
100,000
150,000
200,000
250,000
300,000
2011 2012 2013 2014
MW
H
Internal consumption Transferred to distribution network Production
7
Ener
gy a
nd W
ater
sta
tist
ic 201
4
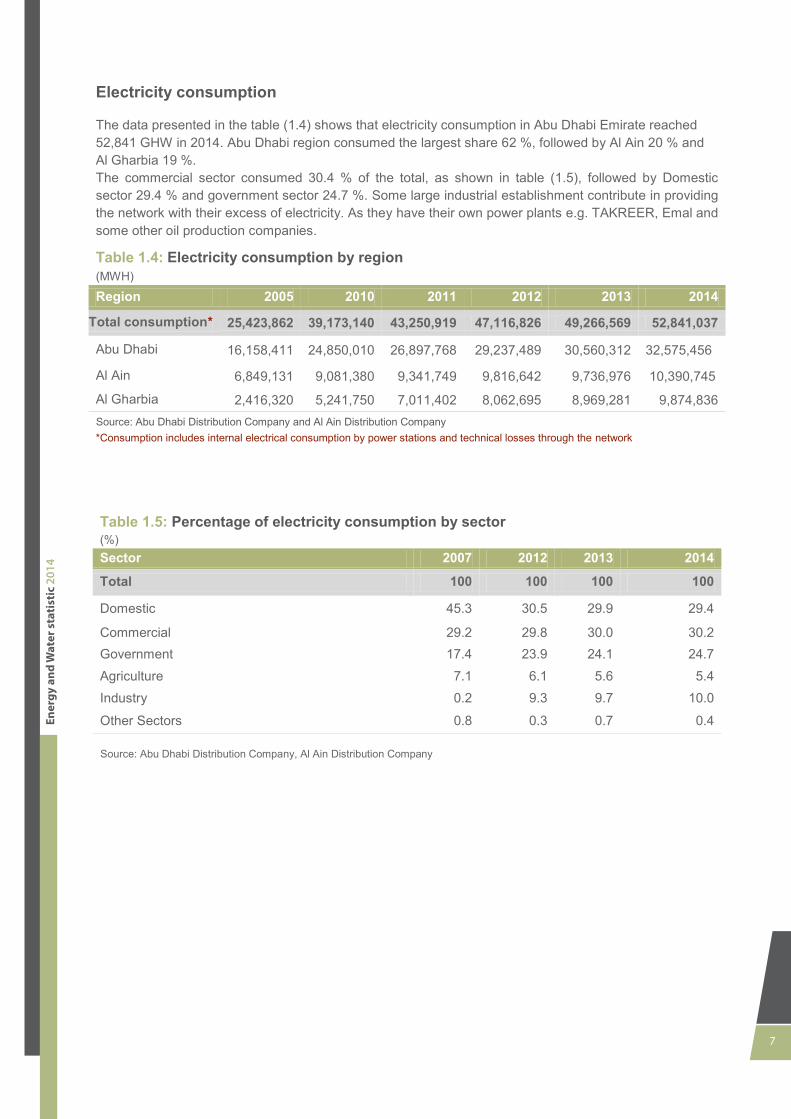
Electricity consumption
The data presented in the table (1.4) shows that electricity consumption in Abu Dhabi Emirate reached 52,841 GHW in 2014. Abu Dhabi region consumed the largest share 62 %, followed by Al Ain 20 % and Al Gharbia 19 %. The commercial sector consumed ,1.4 % of the total, as shown in table (1.5), followed by Domestic sector 29.4 % and government sector 24.7 %. Some large industrial establishment contribute in providing the network with their excess of electricity. As they have their own power plants e.g. TAKREER, Emal and some other oil production companies.
Table 1.4: Electricity consumption by region (MWH)
Region 2005 2010 2011 4104 2013 4102
Total consumption* 25,423,862 39,173,140 43,250,919 47,116,826 49,266,569 52,841,037
Abu Dhabi 16,158,411 24,850,010 26,897,768 29,237,489 30,560,312 32,575,456
Al Ain 6,849,131 9,081,380 9,341,749 9,816,642 9,736,976 10,390,745
Al Gharbia 2,416,320 5,241,750 7,011,402 8,062,695 8,969,281 9,874,836 Source: Abu Dhabi Distribution Company and Al Ain Distribution Company *Consumption includes internal electrical consumption by power stations and technical losses through the network
Table 1.5: Percentage of electricity consumption by sector (%)
Sector 2007 4104 2013 2014
Total 100 011 011 100
Domestic 45.3 30.5 29.9 29.4
Commercial 29.2 29.8 30.0 30.2 Government 17.4 23.9 24.1 24.7 Agriculture 7.1 6.1 5.6 5.4 Industry 0.2 9.3 9.7 10.0
Other Sectors 0.8 0.3 0.7 0.4 Source: Abu Dhabi Distribution Company, Al Ain Distribution Company
8
Ener
gy a
nd W
ater
sta
tist
ic 201
4
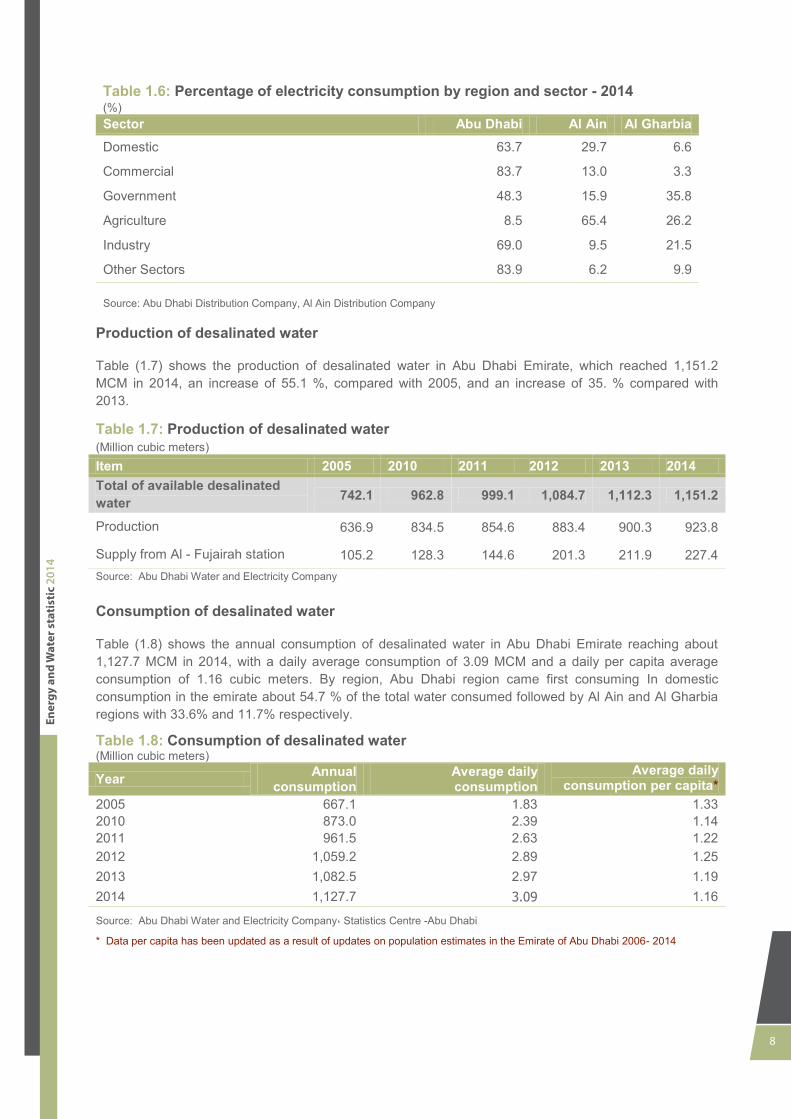
Table 1.6: Percentage of electricity consumption by region and sector - 4102 (%) Sector Abu Dhabi Al Ain Al Gharbia Domestic 63.7 29.7 6.6
Commercial 83.7 13.0 3.3
Government 48.3 15.9 35.8
Agriculture 8.5 65.4 26.2
Industry 69.0 9.5 21.5
Other Sectors 83.9 6.2 9.9 Source: Abu Dhabi Distribution Company, Al Ain Distribution Company
Production of desalinated water
Table (1.7) shows the production of desalinated water in Abu Dhabi Emirate, which reached 1,151.2 MCM in 2014, an increase of 55.1 %, compared with 2005, and an increase of 3 .9 % compared with 2013.
Table 1.7: Production of desalinated water (Million cubic meters)
Item 2005 2010 2011 4104 4103 4102 Total of available desalinated water 742.1 962.8 11190 1,084.7 1,112.3 1,151.2
Production 636.9 834.5 854.6 883.4 900.3 923.8
Supply from Al - Fujairah station 105.2 128.3 144.6 201.3 211.9 227.4 Source: Abu Dhabi Water and Electricity Company
Consumption of desalinated water
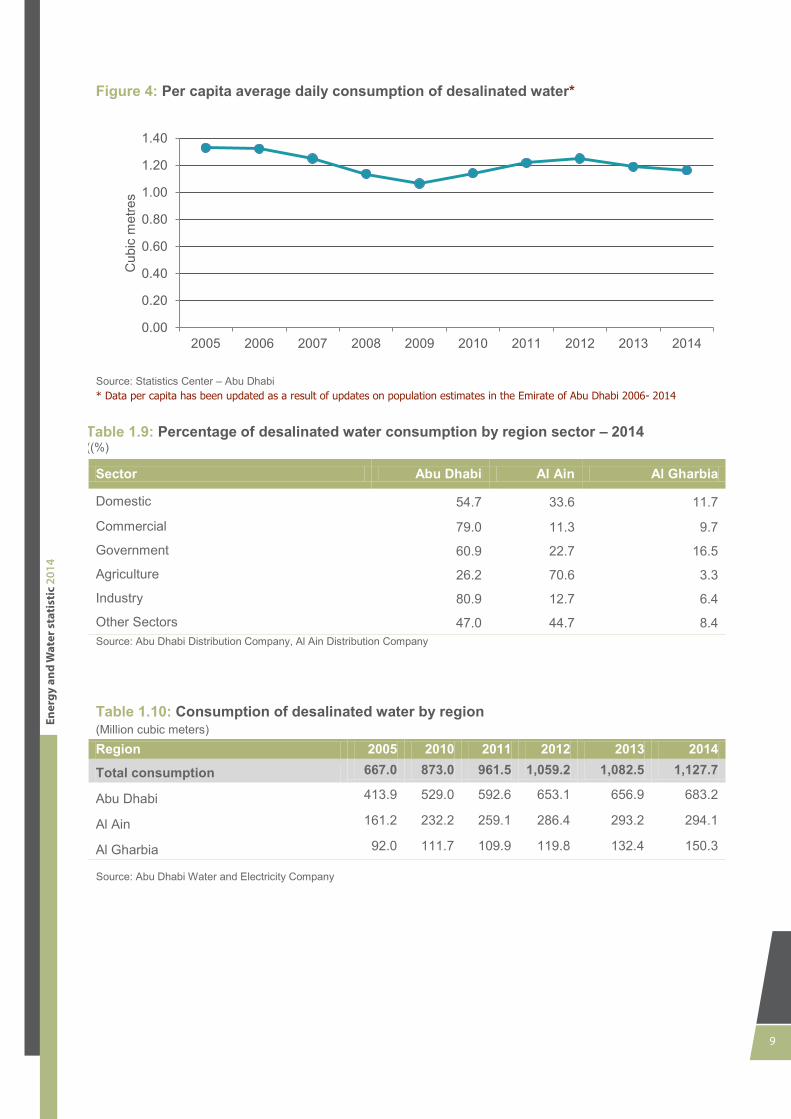
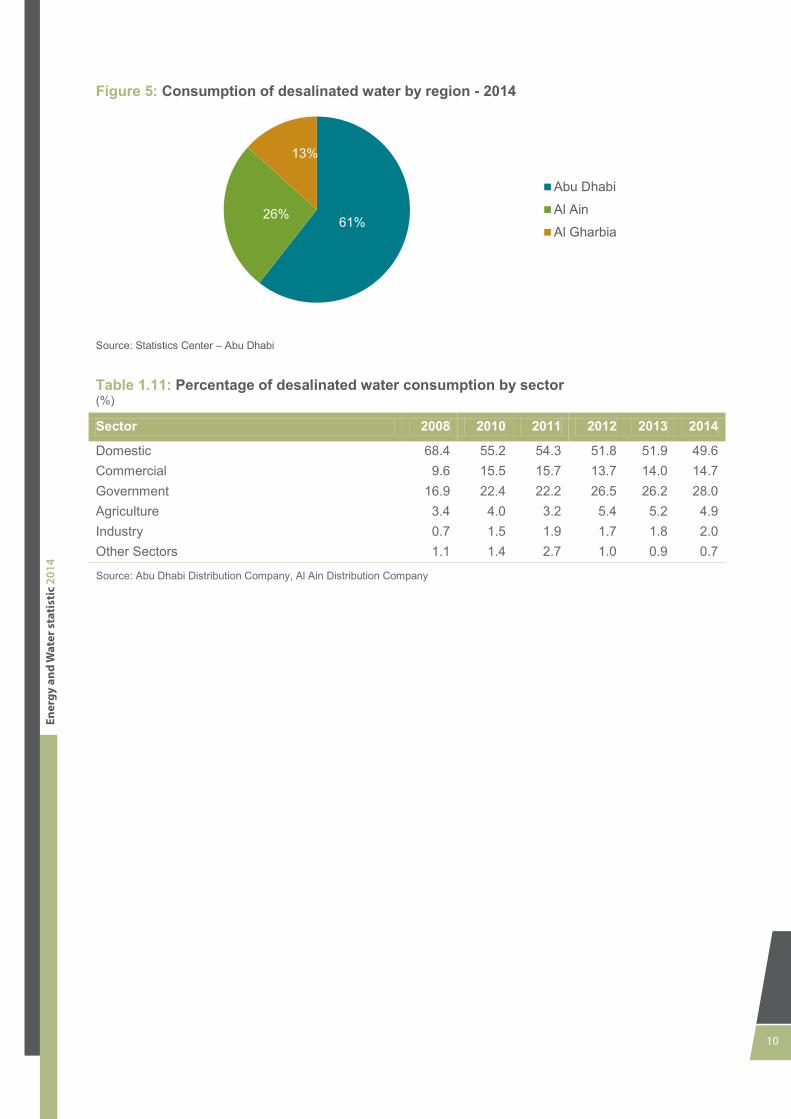
Table (1.8) shows the annual consumption of desalinated water in Abu Dhabi Emirate reaching about 1,127.7 MCM in 2014, with a daily average consumption of 3.09 MCM and a daily per capita average consumption of 1.16 cubic meters. By region, Abu Dhabi region came first consuming In domestic consumption in the emirate about 54.7 % of the total water consumed followed by Al Ain and Al Gharbia regions with 33.6% and 11.7% respectively.
Table 1.8: Consumption of desalinated water (Million cubic meters)
Year Annual consumption
Average daily consumption
Average daily consumption per capita*
2005 667.1 0.7, 0.,, 2010 77,.1 ,.,5 1.14 2011 530.9 ,.3, 1.22 ,10, 0,195., 2.89 1.25 ,103 0,17,.9 ,.57 1.19 ,10, 0,127.7 3.09 1.16
Source: Abu Dhabi Water and Electricity Company، Statistics Centre -Abu Dhabi
* Data per capita has been updated as a result of updates on population estimates in the Emirate of Abu Dhabi 2006- 2014
9
Ener
gy a
nd W
ater
sta
tist
ic 201
4
Figure 4: Per capita average daily consumption of desalinated water*
Source: Statistics Center – Abu Dhabi * Data per capita has been updated as a result of updates on population estimates in the Emirate of Abu Dhabi 2006- 2014
Table 1.9: Percentage of desalinated water consumption by region sector – 4102 ((%)
Sector Abu Dhabi Al Ain Al Gharbia
Domestic 54.7 33.6 11.7
Commercial 79.0 11.3 9.7
Government 60.9 22.7 16.5
Agriculture 26.2 70.6 3.3
Industry 80.9 12.7 6.4
Other Sectors 47.0 44.7 8.4 Source: Abu Dhabi Distribution Company, Al Ain Distribution Company
Table 1.10: Consumption of desalinated water by region (Million cubic meters)
Region 2005 2010 2011 4104 4103 4102
Total consumption 667.0 873.0 961.5 1,059.2 1,082.5 1,127.7
Abu Dhabi 413.9 529.0 592.6 653.1 656.9 683.2
Al Ain 161.2 232.2 259.1 286.4 293.2 294.1
Al Gharbia 92.0 111.7 109.9 119.8 132.4 150.3 Source: Abu Dhabi Water and Electricity Company
0.00
0.20
0.40
0.60
0.80
1.00
1.20
1.40
2005 2006 2007 2008 2009 2010 2011 2012 2013 2014
Cub
ic m
etre
s
10
Ener
gy a
nd W
ater
sta
tist
ic 201
4
Figure 5: Consumption of desalinated water by region - 4102
Source: Statistics Center – Abu Dhabi
Table 1.11: Percentage of desalinated water consumption by sector (%)
Sector 2008 2010 2011 2012 2013 4102
Domestic 37., 99., 9,., 51.8 51.9 49.6 Commercial 5.3 09.9 09.7 13.7 14.0 14.7 Government 03.5 ,,., ,,., 26.5 26.2 28.0 Agriculture ,., 4.0 ,., 5.4 5.2 4.9 Industry 1.7 0.9 0.5 1.7 1.8 2.0 Other Sectors 0.0 0., ,.7 1.0 0.9 0.7
Source: Abu Dhabi Distribution Company, Al Ain Distribution Company
61% 26%
13%
Abu Dhabi
Al Ain
Al Gharbia
11
Ener
gy a
nd W
ater
sta
tist
ic 201
4
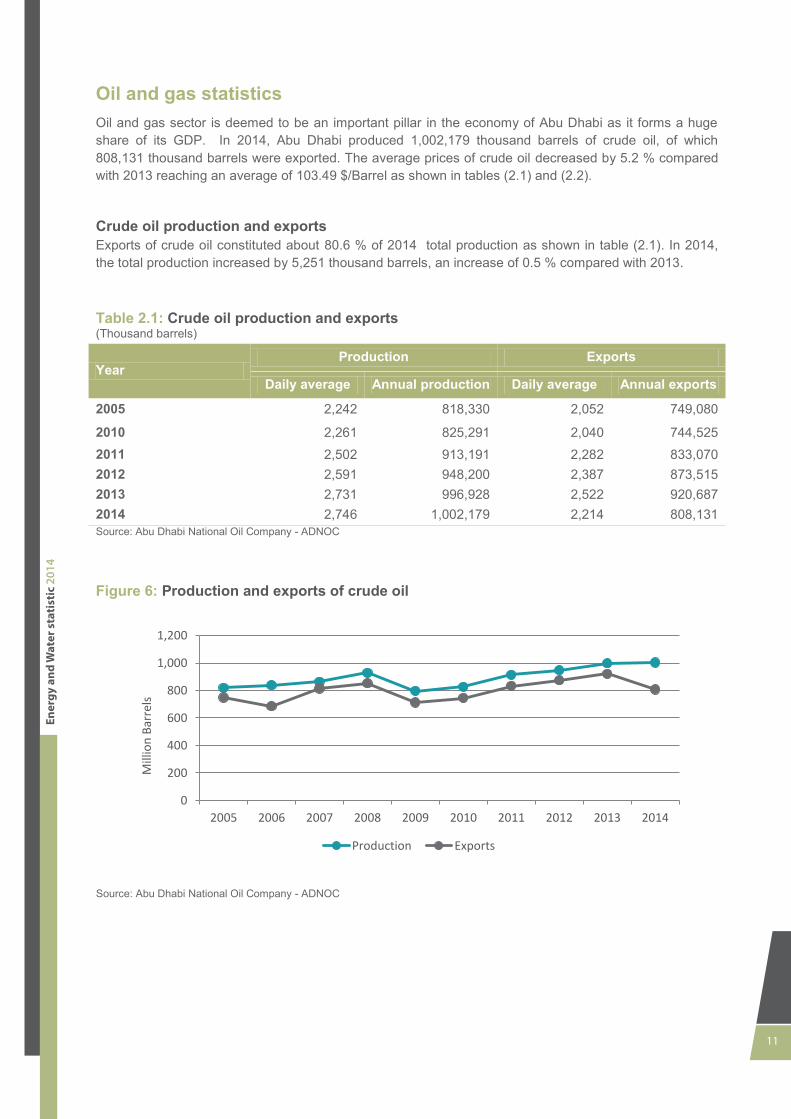
Oil and gas statistics Oil and gas sector is deemed to be an important pillar in the economy of Abu Dhabi as it forms a huge share of its GDP. In 2014, Abu Dhabi produced 1,002,179 thousand barrels of crude oil, of which 808,131 thousand barrels were exported. The average prices of crude oil decreased by 5.2 % compared with 2013 reaching an average of 103.49 $/Barrel as shown in tables (2.1) and (2.2).
Crude oil production and exports Exports of crude oil constituted about 80.6 % of 2014 total production as shown in table (2.1). In 2014, the total production increased by 5,251 thousand barrels, an increase of 0.5 % compared with 2013.
Table 2.1: Crude oil production and exports (Thousand barrels(
Year Production Exports
Daily average Annual production Daily average Annual exports
2005 ,,,,, 707,,,1 2,052 749,080
2010 2,261 825,291 2,040 744,525 2011 2,502 913,191 ,,,7, 7,,,171 2012 ,,950 5,7,,11 ,,,77 77,,909 2013 2,731 996,928 2,522 920,687 4102 2,746 1,002,179 2,214 808,131 Source: Abu Dhabi National Oil Company - ADNOC
Figure 4: Production and exports of crude oil
Source: Abu Dhabi National Oil Company - ADNOC
0
200
400
600
800
1,000
1,200
2005 2006 2007 2008 2009 2010 2011 2012 2013 2014
Mill
ion
Barr
els
Production Exports
12
Ener
gy a
nd W
ater
sta
tist
ic 201
4
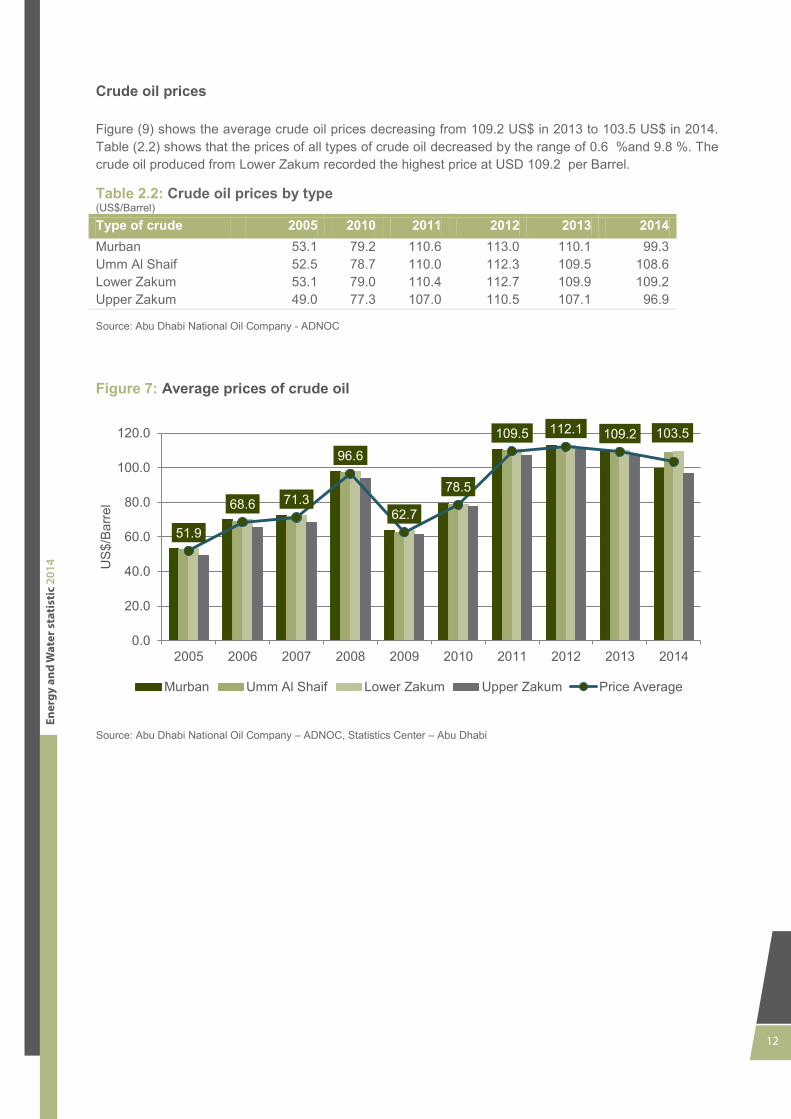
Crude oil prices
Figure (9) shows the average crude oil prices decreasing from 109.2 US$ in 2013 to 01,.9 US$ in ,10,. Table (2.2) shows that the prices of all types of crude oil decreased by the range of 1.3 %and 5.7 %. The crude oil produced from Lower Zakum recorded the highest price at USD 109.2 per Barrel.
Table 2.2: Crude oil prices by type (US$/Barrel)
Type of crude 2005 2010 2011 2012 2013 4102 Murban 53.1 79.2 110.6 113.0 110.1 99.3 Umm Al Shaif 52.5 78.7 110.0 112.3 109.5 108.6 Lower Zakum 53.1 79.0 110.4 112.7 109.9 109.2 Upper Zakum 49.0 77.3 107.0 110.5 107.1 96.9
Source: Abu Dhabi National Oil Company - ADNOC
Figure 5: Average prices of crude oil
Source: Abu Dhabi National Oil Company – ADNOC, Statistics Center – Abu Dhabi
51.9
68.6 71.3
96.6
62.7
78.5
109.5 112.1 109.2 103.5
0.0
20.0
40.0
60.0
80.0
100.0
120.0
2005 2006 2007 2008 2009 2010 2011 2012 2013 2014
US$
/Bar
rel
Murban Umm Al Shaif Lower Zakum Upper Zakum Price Average

13
Ener
gy a
nd W
ater
sta
tist
ic 201
4
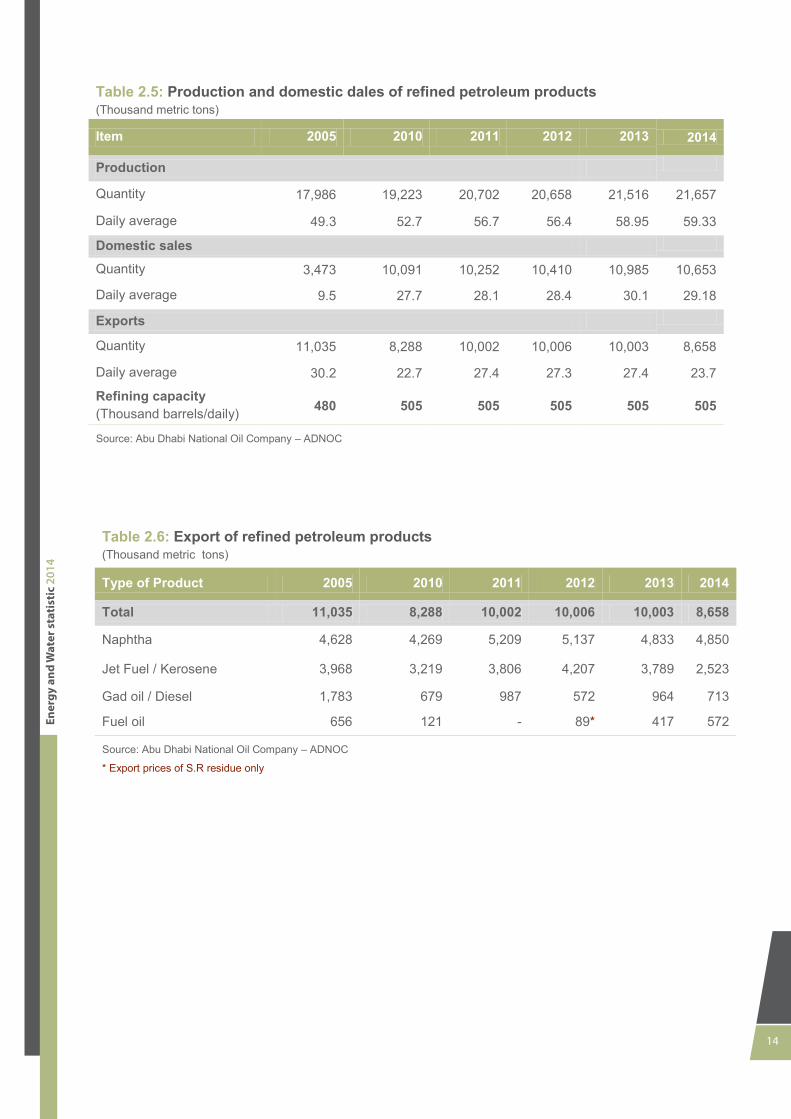
Petroleum products Abu Dhabi’s production of petroleum products increased by 0.7 % in 2014 compared with 2013. Table (2.3) shows the production of refined petroleum products.
Exports of refined petroleum products in 2014 formed 40.0 % of the total production, whereas domestic sales accounted for about 49.2 % of the total production as shown in table (2.5).
Table 2.3: Production of refined petroleum products )Thousand Metric Tons (
Product Type 4112 2010 2011 4104 4103 4102
Total 17,986 19,223 20,702 413421 403204 21,657
LPG 488 579.2 540.2 452.7 591.0 618
Unleaded gasoline 1,429 2,284.3 2,537.2 2,800.0 3,056.0 2,371
Naphtha 4,669 4,813.4 5,070.7 5,136.8 4,912.3 5,048
Jet Fuel / Kerosene 5,494 5,684.0 6,422.1 6,920.9 6,866.0 6,162
Gas Oil /diesel 4,217 4,775.1 5,024.4 4,441.9 4,476.8 4,482 Heavy fuel Oil / S.R.Residue
1,689 1,047.8 1,066.8 859.8 0,93,.1 2,927
Sulfur - 38.9 40.9 46.3 91.1 49
Source: Abu Dhabi National Oil Company – ADNOC, TAKREER
Table 2.4: Domestic sales of refined petroleum products )Million imperial gallons(
Product type Abu Dhabi Emirate Other Emirates
4104 410, 4102 4104 410, 4102
Total 8,307 8,589 8,661 2,103 2,396 1,991
LPG 167 168 187 - - -
Unleaded gasoline 2,801 3,027 2,681 - - -
Jet fuel / Kerosene 2,121 2,139 2,572 591 847 675
Gas oil / diesel 3,181 3,242 3,220 688 404 344
Heavy fuel Oil / S.R.Residue 27 13 0 824 1,145 973
Marine Bunker 9 - - - Source: Abu Dhabi National Oil Company – ADNOC, TAKREER
14
Ener
gy a
nd W
ater
sta
tist
ic 201
4
Table 2.5: Production and domestic dales of refined petroleum products )Thousand metric tons(
Item 2005 2010 2011 2012 2013 4102
Production
Quantity 17,986 19,223 20,702 20,658 ,0,903 21,657
Daily average 49., 52.7 93.7 56.4 97.59 59.33
Domestic sales
Quantity 3,473 10,091 10,252 10,410 01,579 10,653
Daily average 9.5 ,7.7 28.1 28.4 30.1 29.18
Exports
Quantity 11,035 8,288 10,002 10,006 10,003 8,658
Daily average 30., 22.7 27.4 27.3 27.4 23.7
Refining capacity (Thousand barrels/daily) 480 505 505 212 212 505
Source: Abu Dhabi National Oil Company – ADNOC
Table 2.6: Export of refined petroleum products )Thousand metric tons(
Type of Product 2005 2010 2011 2012 2013 4102
Total 11,035 8,288 10,002 013114 10,003 8,658
Naphtha 4,628 4,269 5,209 5,137 4,833 4,850
Jet Fuel / Kerosene 3,968 3,219 3,806 4,207 3,789 2,523
Gad oil / Diesel 1,783 679 987 572 964 713
Fuel oil 656 121 - 89* 417 572
Source: Abu Dhabi National Oil Company – ADNOC
* Export prices of S.R residue only
15
Ener
gy a
nd W
ater
sta
tist
ic 201
4
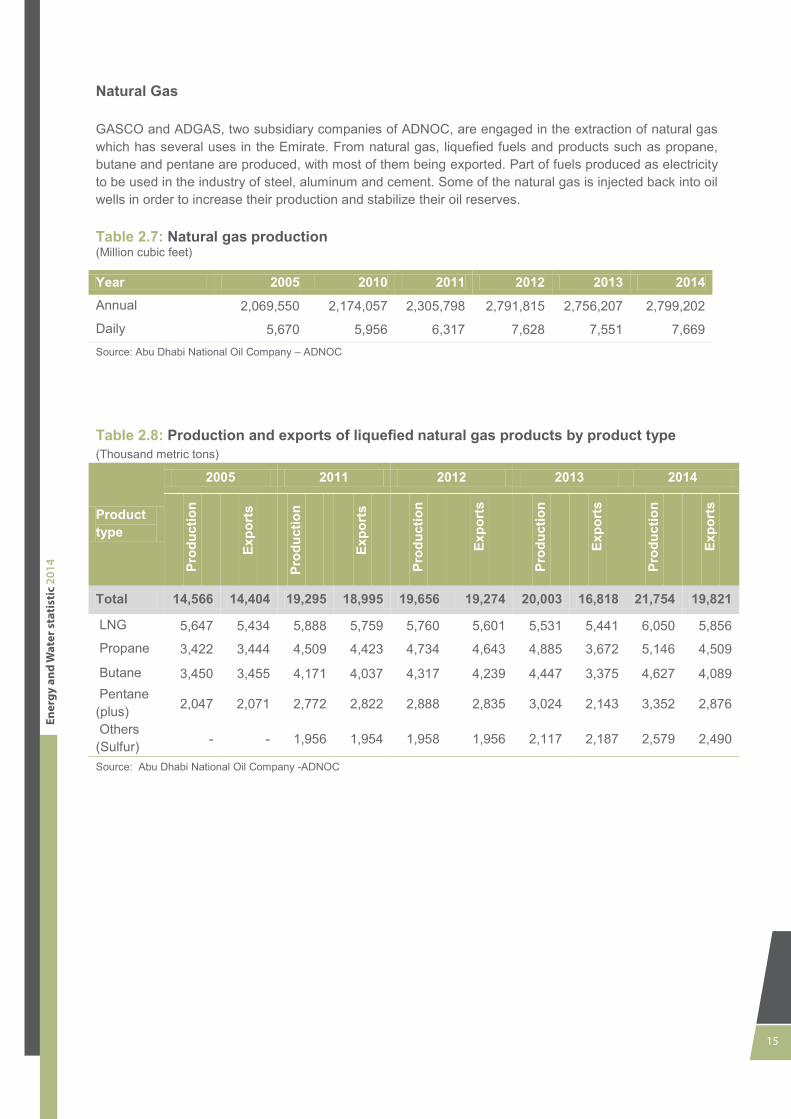
Natural Gas
GASCO and ADGAS, two subsidiary companies of ADNOC, are engaged in the extraction of natural gas which has several uses in the Emirate. From natural gas, liquefied fuels and products such as propane, butane and pentane are produced, with most of them being exported. Part of fuels produced as electricity to be used in the industry of steel, aluminum and cement. Some of the natural gas is injected back into oil wells in order to increase their production and stabilize their oil reserves.
Table 2.7: Natural gas production )Million cubic feet(
Year 2005 2010 4100 4104 4103 4102 Annual 2,069,550 2,174,057 2,305,798 2,791,815 2,756,207 2,799,202
Daily 5,670 5,956 6,317 7,628 7,551 7,669 Source: Abu Dhabi National Oil Company – ADNOC
Table 2.8: Production and exports of liquefied natural gas products by product type )Thousand metric tons(
Product type
2002 4100 4104 410, 4102
Prod
uctio
n
Exp
orts
Pro
duct
ion
Exp
orts
Prod
uctio
n
Expo
rts
Prod
uctio
n
Expo
rts
Prod
uctio
n
Expo
rts
Total 14,566 14,404 013412 013112 013424 013452 41311, 043101 21,754 19,821
LNG 5,647 5,434 5,888 5,759 5,760 5,601 5,531 5,441 6,050 5,856
Propane 3,422 3,444 4,509 4,423 4,734 4,643 4,885 3,672 5,146 4,509
Butane 3,450 3,455 4,171 4,037 4,317 4,239 4,447 3,375 4,627 4,089 Pentane (plus) 2,047 2,071 2,772 2,822 2,888 2,835 3,024 2,143 3,352 2,876
Others (Sulfur) - - 0,593 0,59, 0,597 0,593 ,,007 ,,077 2,579 2,490
Source: Abu Dhabi National Oil Company -ADNOC
16
Ener
gy a
nd W
ater
sta
tist
ic 201
4
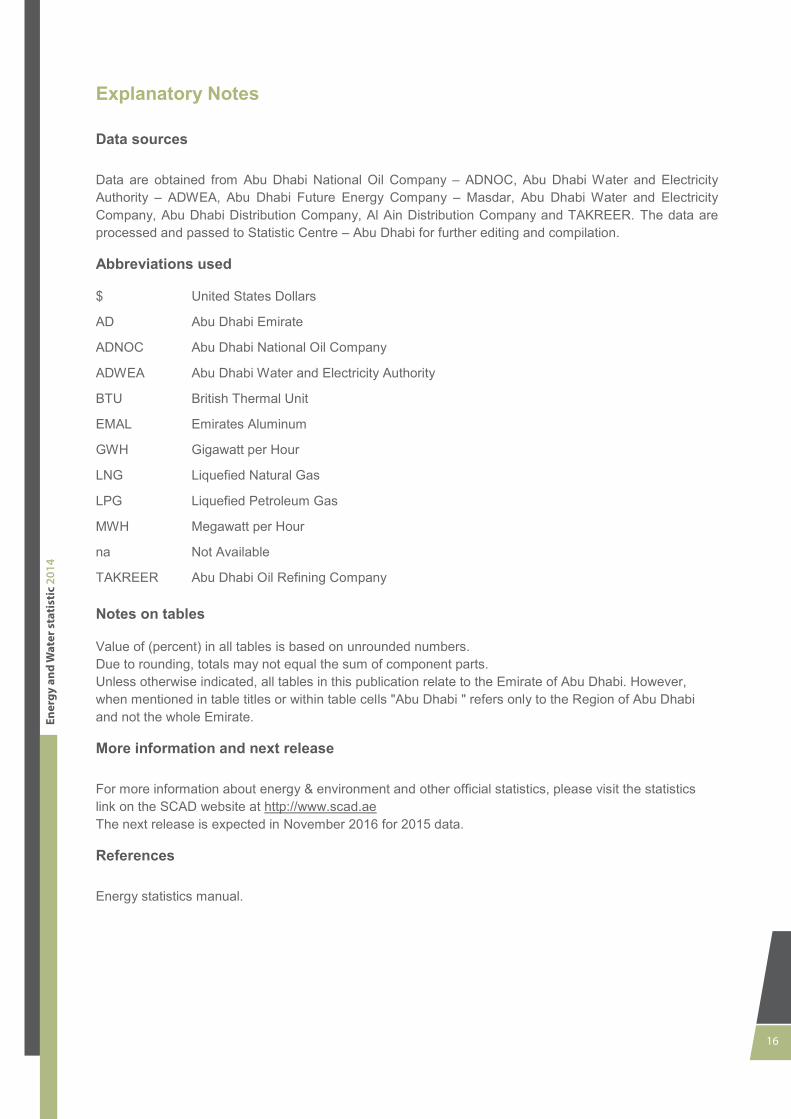
Explanatory Notes
Data sources
Data are obtained from Abu Dhabi National Oil Company – ADNOC, Abu Dhabi Water and Electricity Authority – ADWEA, Abu Dhabi Future Energy Company – Masdar, Abu Dhabi Water and Electricity Company, Abu Dhabi Distribution Company, Al Ain Distribution Company and TAKREER. The data are processed and passed to Statistic Centre – Abu Dhabi for further editing and compilation.
Abbreviations used
$ United States Dollars
AD Abu Dhabi Emirate
ADNOC Abu Dhabi National Oil Company
ADWEA Abu Dhabi Water and Electricity Authority
BTU British Thermal Unit
EMAL Emirates Aluminum
GWH Gigawatt per Hour
LNG Liquefied Natural Gas
LPG Liquefied Petroleum Gas
MWH Megawatt per Hour
na Not Available
TAKREER Abu Dhabi Oil Refining Company
Notes on tables
Value of (percent) in all tables is based on unrounded numbers. Due to rounding, totals may not equal the sum of component parts. Unless otherwise indicated, all tables in this publication relate to the Emirate of Abu Dhabi. However, when mentioned in table titles or within table cells "Abu Dhabi " refers only to the Region of Abu Dhabi and not the whole Emirate.
More information and next release
For more information about energy & environment and other official statistics, please visit the statistics link on the SCAD website at http://www.scad.ae The next release is expected in November 2016 for 2015 data.
References
Energy statistics manual.
17
Ener
gy a
nd W
ater
sta
tist
ic 201
4