Embed Size (px)
Citation preview

Energy Audit by Petroleum Conservation Research Association, ER Page -1 -
OF
Conducted By
(EASTERN REGION)
2, Gariahat Road South, Dhakuria Kolkata – 700 068
Ph: 033 – 2414 5092, 2414 5088, 2414 5094; Telefax: 033 – 2414 5091 e-mail: [email protected]
Website: http://www.pcra.org

Energy Audit by Petroleum Conservation Research Association, ER Page -2 -
Energy Audit by Petroleum Conservation Research Association, ER Page -3 -
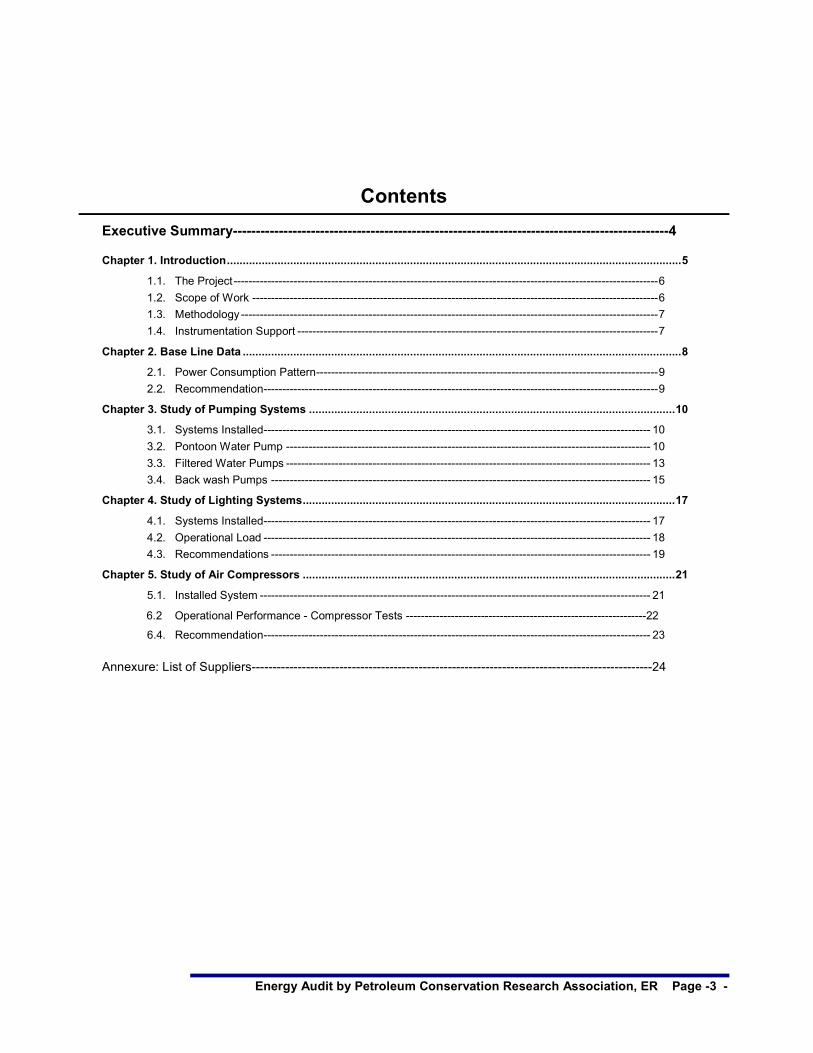
Contents
Executive Summary-----------------------------------------------------------------------------------------------4
Chapter 1. Introduction ................................................................................................................................................ 5
1.1. The Project ----------------------------------------------------------------------------------------------------------------- 6
1.2. Scope of Work ------------------------------------------------------------------------------------------------------------ 6
1.3. Methodology --------------------------------------------------------------------------------------------------------------- 7
1.4. Instrumentation Support ------------------------------------------------------------------------------------------------ 7
Chapter 2. Base Line Data ........................................................................................................................................... 8
2.1. Power Consumption Pattern ------------------------------------------------------------------------------------------- 9
2.2. Recommendation --------------------------------------------------------------------------------------------------------- 9
Chapter 3. Study of Pumping Systems .................................................................................................................... 10
3.1. Systems Installed ------------------------------------------------------------------------------------------------------- 10
3.2. Pontoon Water Pump ------------------------------------------------------------------------------------------------- 10
3.3. Filtered Water Pumps ------------------------------------------------------------------------------------------------- 13
3.4. Back wash Pumps ----------------------------------------------------------------------------------------------------- 15
Chapter 4. Study of Lighting Systems ...................................................................................................................... 17
4.1. Systems Installed ------------------------------------------------------------------------------------------------------- 17
4.2. Operational Load ------------------------------------------------------------------------------------------------------- 18
4.3. Recommendations ----------------------------------------------------------------------------------------------------- 19
Chapter 5. Study of Air Compressors ...................................................................................................................... 21
5.1. Installed System -------------------------------------------------------------------------------------------------------- 21
6.2 Operational Performance - Compressor Tests ----------------------------------------------------------------22
6.4. Recommendation ------------------------------------------------------------------------------------------------------- 23
Annexure: List of Suppliers------------------------------------------------------------------------------------------------24
Energy Audit by Petroleum Conservation Research Association, ER Page -4 -
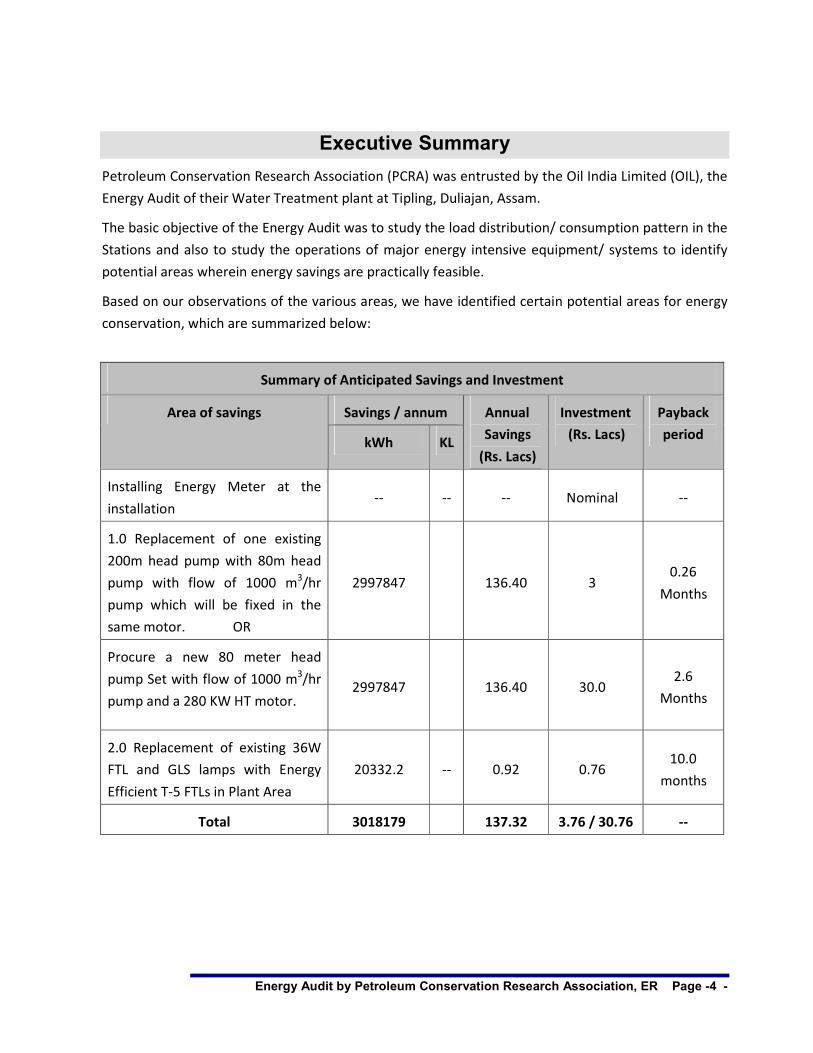
Executive Summary
Petroleum Conservation Research Association (PCRA) was entrusted by the Oil India Limited (OIL), the
Energy Audit of their Water Treatment plant at Tipling, Duliajan, Assam.
The basic objective of the Energy Audit was to study the load distribution/ consumption pattern in the
Stations and also to study the operations of major energy intensive equipment/ systems to identify
potential areas wherein energy savings are practically feasible.
Based on our observations of the various areas, we have identified certain potential areas for energy
conservation, which are summarized below:
Summary of Anticipated Savings and Investment
Area of savings Savings / annum Annual
Savings
(Rs. Lacs)
Investment
(Rs. Lacs)
Payback
period kWh KL
Installing Energy Meter at the
installation -- -- -- Nominal --
1.0 Replacement of one existing
200m head pump with 80m head
pump with flow of 1000 m3/hr
pump which will be fixed in the
same motor. OR
2997847 136.40 3 0.26
Months
Procure a new 80 meter head
pump Set with flow of 1000 m3/hr
pump and a 280 KW HT motor. 2997847 136.40 30.0
2.6
Months
2.0 Replacement of existing 36W
FTL and GLS lamps with Energy
Efficient T-5 FTLs in Plant Area
20332.2 -- 0.92 0.76 10.0
months
Total 3018179 137.32 3.76 / 30.76 --

Energy Audit by Petroleum Conservation Research Association, ER Page -5 -
CHAPTER-1 INTRODUCTION
The story of Oil India Limited (OIL) traces and symbolizes the development and growth of the
Indian petroleum industry. From the discovery of crude oil in the far east of India at Digboi,
Assam in 1889 to its present status as a fully integrated upstream petroleum company, OIL
has come far, crossing many milestones.
On February 18, 1959, Oil India Private Limited was incorporated to expand and develop the
newly discovered oil fields of Naharkatiya and Moran in the Indian North East. In 1961, it
became a joint venture company between the Indian Government and Burmah Oil Company
Limited, UK.
In 1981, OIL became a wholly-owned Government of India enterprise. Today, OIL is a premier
Indian National Oil Company engaged in the business of exploration, development and
production of crude oil and natural gas, transportation of crude oil and production of LPG. OIL
also provides various E&P related services and holds 26% equity in Numaligarh Refinery
Limited.
The Authorized share capital of the Company is Rs. 2000 Crores. The Issued, Subscribed and
Paid share capital of the company is Rs. 601.14 Crores. At present, The Government of India,
the Promoter of the Company is holding 78.43% of the total Issued & Paid-up Capital of the
Company. The balance 21.57% of the Equity capital is held by others.
OIL has over 1 lakh sq km of PEL/ML areas for its exploration and production activities; most
of it is in the Indian North East, which accounts for its entire crude oil production and majority
of gas production. Rajasthan is the other producing area of OIL, contributing 10 per cent of its
total gas production.
Additionally, OIL’s exploration activities are spread over onshore areas of KG Basin, Mahanadi
Basin, Cauvery Basin, Andaman Basin and Gujarat-Kutch Basin etc. OIL also has participating
interest in NELP exploration blocks in Mahanadi Offshore, Mumbai Deepwater, Krishna
Godavari Deepwater, etc. as well as various overseas projects in Libya, Gabon, Iran, Yemen,
Nigeria, Sudan and Venezuela.
In a recent CRISIL-India Today survey, OIL was adjudged as one of the five best major PSUs
and one of three best energy sector PSUs in the country.

Energy Audit by Petroleum Conservation Research Association, ER Page -6 -
1.1 Objective of Energy Audit:
With the advent of energy crisis and exponential hikes in the costs of different forms of energy, Energy Audit is manifesting its due importance in Industrial Establishments. Energy Audit helps to understand more about the ways energy and fuels are used in any Establishment and helps in identifying areas where waste may occur and scope for improvement exists.
Energy Audit is the key to a systematic approach for decision-making in the area of energy
management as it attempts to balance the total energy inputs with its use and serves to
identify all the energy streams in a facility/ Establishment.
It was with this objective that Petroleum Conservation Research Association (PCRA) was
entrusted by OIL, the Energy Audit of Water Pumping and Filtration unit at Tipling, Duliajan.
Function of the Installation:
The functions of Water Treatment Plant are to carry out:
1) Pumping of raw water from River Burhi Dihing at Pontoons.
2) Filtering the raw river water using chemicals like alum, lime, sodium aluminate and
infrastructures like pre-settler, clariflocculators and rapid gravity filter beds.
3) Storing filtered treated water in an underground reservoir at the plant.
4) Supply (Pumping) of filtered treated water to OIL Township, Duliajan and nearby OIL’s
Installations.
1.2 Scope of Work:
The objective of the Energy Audit was to study the load distribution/ consumption pattern in
the Stations and also to study the operations of major energy intensive equipment/ systems to
identify potential areas wherein energy savings are practically feasible.
Electrical Equipments
Measurement of all major electrical parameters viz. voltage, current, power factor, power
drawn, operating frequency etc. on energy intensive equipments (motors, air
compressors, lighting etc) for evaluation of their loading patterns, operating performance
etc.
Pumps
Study of Pump Operations and the corresponding energy consumption to assess the
scope for improvements.
Lighting
The entire Lighting system audit covered the Illumination levels required vis-à-vis
available lux levels.
Performance evaluation in terms of efficacy levels of various lighting fixtures including
Tube lights, HPSV Lamps installed.

Energy Audit by Petroleum Conservation Research Association, ER Page -7 -
1.3 Methodology
Methodology adopted for achieving the desired objectives viz. Assessment of the Current
operational status and Energy savings include the following:
Discussions with the concerned officials for identification of major areas of focus and other
related systems.
• A team of engineers visited the
pumping station and had
discussions with the concerned
officials/ supervisors to collect data/
information on the operations and
Load Distribution in the pumping
station. The data was analyzed to
arrive at a base line energy
consumption pattern.
• Measurements and monitoring
with the help of appropriate
instruments including continuous
and/ or time-lapse recording, as
appropriate and visual observations
were made to identify the energy
usage pattern and losses in the
system.
• Computation and in-depth analysis of the collected data, including utilization of
computerized analysis and other techniques as appropriate were done to draw inferences
and to evolve suitable energy conservation plan/s for improvement / reduction in specific
energy consumption.
1.4 Instrumentation Support:
Some of the instruments used for undertaking the audit include the following:
� Electrical Power Analyser for Power measurements;
� Ultrasonic Flow meter;
� Non-Contact Type Temperature Indicator;
� Digital Lux Meter;
Develop a Base Line of the Energy Consumption Pattern
Obtaining Energy Consumption data from the Plant
On Site Measurements based on the Mutually Decided Action Plan
Active involvement of
the Plant
Draft Report Submission
Plant Feedback
Final Report Submission

Energy Audit by Petroleum Conservation Research Association, ER Page -8 -
CHAPTER-2 BASE LINE DATA
General Details:
A
Brief description of assignment : Detailed Energy Audit of Electrical Systems /
Utility Equipments.
Name & Address of Installation : Water Treatment Plant, Tipling,
Oil India Limited,
Duliajan, Assam-786602
Contact person : Shri Sandeep Bhuyan, Installation Manager,
4MGD Water Treatment Plant
Telephone No. : 0374-2808338
Name of PCRA Team Leader
Members of the Team
: Shri A.Chakraborty , Jt. Director, CEA
Shri D. Mahapatro, Dy. Director, CEA
Shri D. Datta, Jt. Director,CEM
Address of communication of PCRA Petroleum Conservation Research
Association, IndianOil Bhawan,
2, Gariahat Raod South, Dhakuria,
Kolkata – 700 068
Ph: 033 – 2414 5092/5088/5094;
Telefax: 033 – 2414 5091
e-mail: [email protected]
Website: http://www.pcra.org
B
Activity : Filtration and Pumping of Water
C
Operational days : 7 days a Week (24 hrs a Day)
No. of shifts : Three
Power Generation & Consumption
(Average per month based on historical
data)
: Required power is met from captive power
plant at Duliajan
For measuring Industrial Consumption, meter
is not installed at the plant.
Supply Voltage : 415 V
Overall Electric Power Rate : Rs 4.55 per kWh

Energy Audit by Petroleum Conservation Research Association, ER Page -9 -
2.1 Power Consumption Pattern:
Power is generated in-house at Duliajan Power Station from OIL’s own produced Natural gas.
The 3.3 KV HT power is distributed centrally and power in the plant is drawn through a
transformer of 3.3 KV to 415 V.
It was observed that there is no energy meter to measure the consumption of energy in
Tipling Water Treatment Plant. So the monthly Power Consumption of the station could not
be determined. Power consumption for one instant at evening along with measurement of all
electrical parameters (including % Total Harmonic Distortion) was carried out at the
transformer. The measured data is tabulated below.
500 KVA 3.3 KV / 415 V Transformers:
500 KVA Transformer Reading( Cable-A)
Line Voltage Current Power
Factor Power Total
V1, Volt 220.4 I1 Amp 8.88 Pf1 0.72 P1, kW 1.409 Pt, kW 4.21
V2, Volt 221.4 I2 Amp 7.89 Pf2 0.59 P2, kW 1.031 Qt, kVAr 5.19
V3, Volt 220.1 I3 Amp 13.86 Pf3 0.58 P3, kW 1.769 St, kVA 6.68
Freq., Hz 50 Avg Pf = 0.63
500 KVA Transformer Reading( Cable-B)
Line Voltage Current Power
Factor Power Total
V1, Volt 220.3 I1 Amp 8.43 Pf1 0.72 P1, kW 1.337 Pt, kW 4.17
V2, Volt 221.4 I2 Amp 7.97 Pf2 0.58 P2, kW 1.023 Qt, kVAr 5.14
V3, Volt 219.8 I3 Amp 13.92 Pf3 0.59 P3, kW 1.805 St, kVA 6.61
Freq., Hz 50 Avg Pf = 0.63
The total Power demand for the plant is 8.4 Kwh and the transformer load is 13.3 KVA.
Therefore, the transformer loading is 13.3/500 = 3%
2.2 Recommendations:
1. One Energy Meter to be installed to measure the daily/monthly consumption of
Electrical energy (in KWH) for Water Treatment Plant.
2. It was observed that in main phase R &Y the load is more or less balanced but in the B Phase the
load is high. It is therefore advised to distribute the load uniformly in three phases.

Energy Audit by Petroleum Conservation Research Association, ER Page -10 -
CHAPTER-3 STUDY OF PUMPING SYSTEMS
3.1 Systems Installed:
There are three types of Electrical Motor Driven (EMD) pumps avaliable in the plant
1. Pontoon Water Pumps (5 nos.)
2. Filtered Water Pumps (4 nos.)
3. Backwash Pumps (2 nos.)
3.2 Pontoon Water Pump:
There are five EMD Pontoon water Pumps available in the pontoon for pumping water from River
Burhi Dihing to Inlet chamber of water treatment plant. The power consumed by the pumps was
measured by Three Phase Power Analyzer and discharge flow was measured with Ultrasonic flow
meter.
Pump Specifications:
Operational Performance of pumps:
Parameter Units SPP#1 SPP # 2 BPP # 1 BPP # 2 BPP # 3
Flow m3/hr 150.7 194 580.7 603.5 654.8
Discharge Head m 42.0 44.0 20.0 20.0 20.0
Suction Head m 0 0 0.00 0.00 0
Density kg/m3 1000 1000 1000 1000 1000
Input Power kW 66.93 76.66 74.54 66.32 74.33
Engine Efficiency % 90% 90% 90% 90% 90%
Pump Specifications Small Pontoon Pump (SPP)
Big Pontoon Pump (BPP)
Make Mather & Platt Mather & Platt
Pump Type Centrifugal Centrifugal
Max. Disch Press (Kg/Cm
2)
4.2 NA
Design Flow rate (m3/Hr) 500 750

Energy Audit by Petroleum Conservation Research Association, ER Page -11 -
Pump Shaft power kW 60.237 68.994 67.086 59.688 66.897
Pump Hyd. power kW 17.248 23.261 31.648 32.891 35.687
Pump Efficiency % 28.63 33.71 47.18 55.10 53.35
The flow rate of one Diesel Engine driven pump is also measured at 11.628 m3/2 min i.e. 348.8
m3/Hr
Pump- Motor Power measurement Data
Riverside Small Pontoon Pump No :1
Line Voltage Current Power Factor Power Total
V1, Volt 228.4 I1 Amp 109.90 Pf1 0.92 P1, kW 23.093 Pt, kW 66.93
V2, Volt 230.4 I2 Amp 111.90 Pf2 0.91 P2, kW 23.461 Qt, kVAr 35.52
V3, Volt 229.2 I3 Amp 108.40 Pf3 0.82 P3, kW 20.373 St, kVA 75.77
Freq., Hz 50.0 Avg Pf = 0.883
Riverside Small Pontoon Pump No :2
Line Voltage Current Power Factor Power Total
V1, Volt 228.2 I1 Amp 129.50 Pf1 0.850 P1, kW 25.119 Pt, kW 76.66
V2, Volt 229.7 I2 Amp 130.10 Pf2 0.84 P2, kW 25.103 Qt, kVAr 45.49
V3, Volt 228.9 I3 Amp 129.80 Pf3 0.89 P3, kW 26.443 St, kVA 89.14
Freq., Hz 50.0 Avg Pf = 0.860
Riverside Big Pontoon Pump No :3
Line Voltage Current Power Factor Power Total
V1, Volt 228.5 I1 Amp 126.90 Pf1 0.880 P1, kW 25.517 Pt, kW 74.33
V2, Volt 228.8 I2 Amp 123.90 Pf2 0.89 P2, kW 25.230 Qt, kVAr 42.13
V3, Volt 227.0 I3 Amp 123.70 Pf3 0.84 P3, kW 23.587 St, kVA 85.44
Freq., Hz 50.0 Avg Pf = 0.870
Riverside Big Pontoon Pump No :2
Line Voltage Current Power Factor Power Total
V1, Volt 227.7 I1 Amp 127.50 Pf1 0.870 P1, kW 25.258 Pt, kW 66.32
V2, Volt 228.0 I2 Amp 122.00 Pf2 0.87 P2, kW 24.200 Qt, kVAr 46.87
V3, Volt 226.0 I3 Amp 105.10 Pf3 0.71 P3, kW 16.864 St, kVA 81.21
Freq., Hz 50.0 Avg Pf = 0.817

Energy Audit by Petroleum Conservation Research Association, ER Page -12 -
Riverside Big Pontoon Pump No :1
Line Voltage Current Power Factor Power Total
V1, Volt 226.7 I1 Amp 119.10 Pf1 0.900 P1, kW 24.300 Pt, kW 74.54
V2, Volt 227.5 I2 Amp 124.70 Pf2 0.89 P2, kW 25.249 Qt, kVAr 36.80
V3, Volt 225.6 I3 Amp 123.10 Pf3 0.9 P3, kW 24.994 St, kVA 83.13
Freq., Hz 50.0 Avg Pf = 0.897
Motor Loading Details:
% Load = Pi/Pr X 100 where Pi= Input Power (Measured) and Pr= Rated Power at full load
Sl
No
Motor
Details
Rated
Motor
Power
(Kw)
Actual Input
Power
(Measured) (Kw)
Motor Loading
(%)
1 SPP#1 75 66.93 89.24
2 SPP#2 75 76.66 102.21
3 BPP#1 75 74.33 99.11
4 BPP#2 75 66.32 88.43
5 BPP#3 75 74.54 99.39
Observation and Recommendations:
1. The flow of small pontoon pump #1 is giving lower flow than Pump#2. It is suggested
to get the pump internally checked. Suspected impeller problem as it is taking less
power as well.
2. It is observed that there is no check valve at the discharge of the pontoon pumps. This
is causing pump to rotate in the reverse direction while opening the discharge valve of
the pump before starting for pressurization. It is recommended to have a small 1” line
with an isolation valve across the discharge valve to be used for pump pressurization
and the discharge valve to be opened only after starting the pumps. A pressure gauge
can be installed in the pump casing to indicate the pressurization of the pump. This
will avoid the reverse rotation of the pump at the time of startup which is causing
huge starting current of the pumps.
3. Big Pontoon pump #3 cables were found to be in hot condition. It is recommended to
check the cable condition and joints to avoid leakage and short circuit.

Energy Audit by Petroleum Conservation Research Association, ER Page -13 -
3.3 Filtered Water Pumps: Four numbers
Specifications:
Operational Performance of pumps:
Particulars Unit FWP # 1 FWP # 2 FWP # 3
Flow m3/hr 350.000 321.960 403.200
Discharge Head m 33.0 34.0 35.0
Suction Head m 0.00 0.00 0.00
Density kg/m3 1000 1000 1000
Input Power kW 162.70 182.33 168.30
Motor Efficiency % 95% 95% 95%
Pump Shaft power kW 154.565 173.214 159.885
Pump Hyd. power kW 31.474 29.830 38.455
Pump Efficiency % 20.36 17.22 24.05
Pump #4 was not started as discharge valve got stuck in closed position at the time of audit.
Cummins Diesel engine operated Pump flow was tested while other two electrical pumps were
running in parallel. The flow was measured at 4.652 m3/ min = 279.1 m
3/hr while discharge pressure
was 7.5 Kg/Cm2.
Pump Particulars
Make Mather & Platt
Head (M) 200
Capacity (m3/hr) 324
Motor Particulars
Make NGEF
Power, KW (HT:3.3 KV) 280
Voltage ( Volts) 3300
Current ( Amps) 64
Efficiency 82%

Energy Audit by Petroleum Conservation Research Association, ER Page -14 -
Observations:
1. 3 nos. filtered water pumps are generally operated for 24 hrs to supply average 910 m3/hr
filtered water by 16” Filtered water line. The Line pressure was found to be 7.5 Kg/Cm2.
2. The pump discharge valves are kept at max 40% open to avoid the motors of the pumps to trip
as per operations. This is due to high design discharge head of the pump than actual discharge
head.
3. The pump design head is 200m. As per the data supplied, the max static head (Height of tank
where water pumping to be done) is 25meter. The friction head available for the pump is 200-
25= 175 meter. The length of the pipe line is 9000 meters with 16” 20 schedule MS pipeline.
4. In present scenario, the discharge head is considered as 80meter. Therefore, friction head is
80-25=55 meters as static head remain fixed at 25 meters.
5. The present velocity of water in the pipeline is
4fLV2L/2gD= Frictional Head where f is pipeline constant = 0.006, V=Velocity, L=Length of
pipeline, D= Diameter of pipeline
V2= 55 X 2X9.81X0.410/(4X0.006X9000) = 2.04
V = 1.43 m/sec.
6. In the 20 schedule pipeline the max allowable pressure is 47 Kg/Cm2 but the limiting factor is
pump discharge head. The max frictional head allowed with the pump is 200-25= 175meters
7. The max allowable velocity which will generate the 175 meter friction head is 2.55 m/sec.
8. The max flow possible in the pipeline is 1211m3/hr at 175 meter of head.
Recommendation:
1. The present head of the pipeline is 80 meter. If a pump of 80 meter head can be installed
in place of 200m head pump with the same motor of 280 Kw (output power), a flow rate
of 899 m3/hr can be achieved with one pump saving the power of two pumps i.e 342.22
Kwh. Therefore, yearly power savings is 342.22 X24 X365 = 2997847.2 Kwh
= 2997847.2 X Rs. 4.55 = Rs.1,36,40,205/-
= 1.36 Crores(approx.)
(Instead of 3 pumps, only 1 pump will be utilized resulting in substantial saving of
power)
Calculation:
Motor output power is 280Kw. Power available for pump shaft is 280 x 0.7 = 196 Kw
(Considering pump efficiency is 70%)
Flow (m3/hr) = 196 X 3600 X 1000/ (80X1000X9.81) = 899 m
3/hr
Energy Audit by Petroleum Conservation Research Association, ER Page -15 -
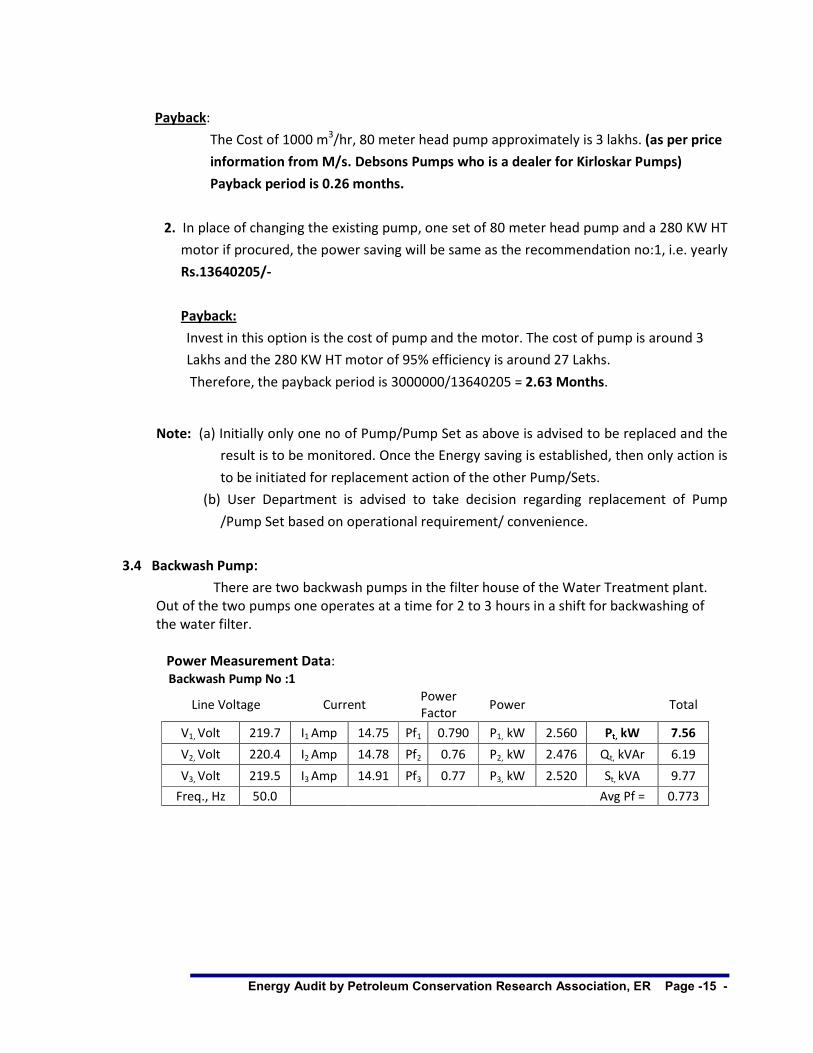
Payback:
The Cost of 1000 m3/hr, 80 meter head pump approximately is 3 lakhs. (as per price
information from M/s. Debsons Pumps who is a dealer for Kirloskar Pumps)
Payback period is 0.26 months.
2. In place of changing the existing pump, one set of 80 meter head pump and a 280 KW HT
motor if procured, the power saving will be same as the recommendation no:1, i.e. yearly
Rs.13640205/-
Payback:
Invest in this option is the cost of pump and the motor. The cost of pump is around 3
Lakhs and the 280 KW HT motor of 95% efficiency is around 27 Lakhs.
Therefore, the payback period is 3000000/13640205 = 2.63 Months.
Note: (a) Initially only one no of Pump/Pump Set as above is advised to be replaced and the
result is to be monitored. Once the Energy saving is established, then only action is
to be initiated for replacement action of the other Pump/Sets.
(b) User Department is advised to take decision regarding replacement of Pump
/Pump Set based on operational requirement/ convenience.
3.4 Backwash Pump:
There are two backwash pumps in the filter house of the Water Treatment plant.
Out of the two pumps one operates at a time for 2 to 3 hours in a shift for backwashing of
the water filter.
Power Measurement Data:
Backwash Pump No :1
Line Voltage Current Power
Factor Power Total
V1, Volt 219.7 I1 Amp 14.75 Pf1 0.790 P1, kW 2.560 Pt, kW 7.56
V2, Volt 220.4 I2 Amp 14.78 Pf2 0.76 P2, kW 2.476 Qt, kVAr 6.19
V3, Volt 219.5 I3 Amp 14.91 Pf3 0.77 P3, kW 2.520 St, kVA 9.77
Freq., Hz 50.0 Avg Pf = 0.773

Energy Audit by Petroleum Conservation Research Association, ER Page -16 -
Backwash Pump No :2
Line Voltage Current Power
Factor Power Total
V1, Volt 215.9 I1 Amp 14.50 Pf1 0.930 P1, kW 2.911 Pt, kW 8.25
V2, Volt 215.2 I2 Amp 14.93 Pf2 0.77 P2, kW 2.474 Qt, kVAr 4.75
V3, Volt 219.5 I3 Amp 14.50 Pf3 0.9 P3, kW 2.864 St, kVA 9.52
Freq., Hz 50.0 Avg Pf = 0.867
Pump Performance:
Motor Load Details:
Observations and recommendations:
1. The pump efficiencies are below normal. But considering the less running hours of pumps,
replacement of pumps are not recommended.
2. The motor loading is Ok.
3. It is advised to provide Pressure Gauge at the common discharge of the pumps to monitor
the pumps performance on periodical basis.
Particulars Unit BWP # 1 BWP # 2
Flow m3/hr 139.300 128.300
Discharge Head m 6.0 6.0
Suction Head m 0.00 0.00
Density kg/m3 1000 1000
Input Power kW 7.56 8.25
Motor Efficiency % 85% 85%
Pump Shaft power kW 6.426 7.013
Pump Hyd. power kW 2.278 2.098
Pump Efficiency % 35.44 29.91
Sl No Motor
Details
Rated
Motor
Power (Kw)
Actual Input
Power
(Measured) (Kw)
Motor Loading
(%)
1 BWP#1 12.5 7.56 60.48
2 BWP#2 12.5 8.25 66.00

17
CHAPTER-4 STUDY OF LIGHTING SYSTEMS
4.1 Systems Installed:
WATER TREATMENT PLANT AREA WISE LIGHTING DETAILS:
SL.No LOCATION 36W
T/LIGHT
18W
T/L
100W
BULB
250W
SON
1 ELECTRICAL CFS LT PENAL 8
2 BACKWASH PUMP SHED 6
3 AIR COMPRESSOR SHED 2
4 FILTER BED 24
5 PUMP HOUSE 26
6 S/STATION 14
7 FILTER HOUSE 44
8 FILTER HOUSE BACK SIDE WALL 0 6
9 AREA LIGHT 0 5
10 FILTER HOUSE STAIRCASE 3
11 CHEMICAL LAB 4
12 TOILET 2
13 INSTALLATION MANAGER 2
14 CHEMICAL HOUSE CORIDOOR 2
15 CHLORINE PUMP HOUSE SHED 16
16 LIME HOUSE 12
17 LIME GODOWN 8
18 OUT SIDE TOILET 0 2
19
CHEMICAL LIME MIXING SHED OUT
SIDE WALL 0 6
20 DIESEL ENGINE SHED 2
21 WATER MANIFOLD 2
22 KITCHEN 0 1
TOTAL NUMBER OF LIGHTS 177 2 13 5
8850 64 1300 1360
TOTAL KW LOAD INCLUDING CHOKE 11.57
TOTAL AMPS 55.38

18
4.2 Operational Load
Measured Lux Levels:
Location
Measured Lux Level
Remarks Max Min Avg.
HT Panel Room 62 31 40.8 Needs improvement
500 KVA Transformer Room
33 20 27.5 Needs improvement
Chemical House Panel Room
92 54 74 Illumination Normal
Chemical House Stair Case 203 59 123.2 Light is more than required.
Chemical Laboratory 51 36 43.5 Needs improvement
Corridor in front of Lab 70 52 61 Light is more than
required.
Chemical Addition Room (1
st Floor)
269 45 141.6 Illumination Normal
Chemical Addition Room (2nd Floor)
115 50 82.8 Illumination Normal
Filter House (1st Floor) 157 2 104.8
Illumination Normal except the area where lights are not glowing (13 nos lights)
Filter House Gr. Floor 159 27 95.6
Illumination Normal except the area where lights are not glowing (10 nos lights)
Filtered Water Pump House 60 1 20.1
Illumination Normal except the area where lights are not glowing (9 nos lights)
Air Compressor House 105 31 54.1 Needs improvement
Area Side of Clarifier 2 1 1.5 Needs improvement
Chemical Storage Area (Gr. Floor)
2 0 1.5
Illumination Normal except the area where lights are not glowing (7 nos lights)
Chlorine Neutralisation Plant (Gr. Fl)
49 12 32.2 Needs improvement
Road in front of Admin Block
1 0 1 Needs improvement

19
4.3 Recommendations:
Installation of Energy Efficient Lights:
It is suggested to replace some of the existing lights in Plant with energy efficient systems
as follows:
� Existing tube lights of 36 W / 40 W to be replaced with Energy Efficient Lights (T-5/
equivalent)
� 100 W GLS lamps in plant to be replaced by 28 W T5 FTL.
� It is also recommended to install solar power LED lights in the roads, presently lit by
250 HPSV lights. The present light is not sufficient.
The resultant benefit in terms of Energy Savings has been worked out as follows:
ENERGY SAVINGS IN ILLUMINATION BY REPLACEMENT OF LAMPS
Particulars Present Situation Post Implementation
Conventional tube lights of 36 W may be replaced with Energy Efficient (EE) Lights (T-5 or equivalent)
Power drawn per tube light (Watts) 50 29
No of lights to be replaced 177
Net Reduction in the Power drawl (A) (Watts) 3717
Conventional GLS bulbs (100 W) may be replaced with 28W EE T-5 FTL
Power drawn per light (Watts) 100 29
No of lights to be replaced 13
Net Reduction in the Power drawl (C) (Watts) 923
Total reduction in Power Drawl (kW) 4.64
Working Hours per annum 12 hrs x 365 4380
Energy Savings per annum (kWh) 20323.2
Electric Power Rate (Rs./kWh) 4.55
Monitory Benefit Rs. 92470.56
Estimated Investments Rs. 76000
EE T5 Tube Lights @ Rs 400 / with fittings 77500
Simple Payback Period 9.86 ~10 months.

20
Details of Solar Street Light installation:
The Cost of Installing 20W LED Solar Power Lights with 120 AH in the road is as below:
Approx Cost of 20W LED Solar Power Fittings with pole is 20000/-
Govt. subsidy obtainable from Central Govt Ministry of Non conventional Energy is 30% of
the installation cost under JNNSM.
Actual Cost of Installation of each light is Rs.14000/-
Power consumption per light per year is 20 X 12 X 365/1000 = 87.6 Kwh
Cost of running of one street light is 87.6 X Rs.4.55 = Rs. 398.6 ps
Note: It is recommended to appoint Govt. approved contractors who will install the lights
after availing the subsidy.

21
CHAPTER-5 Study of Air Compressors
5.1 System Installed:
There are two air compressors in the unit for use of air during back washing of filters. The details
of the compressors are as below:
Make Ingersol Rand Atlas Copco
Max allowable press 7.5 Bar 10 Bar
Motor Power 22 Kw 22 Kw
Capacity 3.54 m3/min 41.5 lps
Amps 43 NA
Volts 400 400
Power Drawn During Load
IR Compressor
Line Voltage Current
Power
Factor Power Total
V1, Volt 218.1 I1 Amp 35.41 Pf1 0.910 P1, kW 7.028 Pt, kW 21.06
V2, Volt 219.8 I2 Amp 36.24 Pf2 0.9 P2, kW 7.169 Qt, kVAr 10.00
V3, Volt 219.0 I3 Amp 34.81 Pf3 0.9 P3, kW 6.861 St, kVA 23.31
Freq., Hz 50.0 Avg Pf = 0.903
Atlas Copco Compressor
Line Voltage Current
Power
Factor Power Total
V1, Volt 217.9 I1 Amp 29.52 Pf1 0.850 P1, kW 5.468 Pt, kW 15.71
V2, Volt 218.9 I2 Amp 28.20 Pf2 0.84 P2, kW 5.185 Qt, kVAr 10.01
V3, Volt 221.0 I3 Amp 27.23 Pf3 0.84 P3, kW 5.055 St, kVA 18.63
Freq., Hz 50.0 Avg Pf = 0.843

22
5.2 Free Air Delivery Test:
Particulars Unit Air Comp-1(IR) Air Comp-2 (Atlas Copco)
Initial Pressure (P1) kg/cm2a 0.56 0.56
Final Pressure (P2) kg/cm2a 5.6 5.6
Atmos. Pressure (P0) kg/cm2a 1.01 1.01
Receiver Volume (V) m3 0.50 0.50
Time Taken (T) minutes 0.73 1.02
Ambient Temp. (t1) oC 20 20
Discharge Temp. (t2) oC 25 25
Air generated during test lpm 3431.908 2456.988
Rated lpm
Delivery FAD (Q1) lpm 3374.326 2415.763
Power Drawn (Measured) kW 21.06 15.71
Sp. Power Consumption kW/lpm 0.00624 0.00650
Compression Ratio (r) 5.5 5.5
Isothermal Power kW 13.417 9.605
Motor Drive Efficiency % 90.00% 90.00%
Isothermal Efficiency % 63.71% 61.14%
NOTE: All the formulae used for the above calculations are:
Actual Free air discharge, Q = 35.315 x ( P2 – P1 ) x V CFM P0 x T
Where
P2 = Final pressure after filling (kg/cm2a)
P1 = Initial pressure (kg/cm2a) after bleeding
P0 = Atmospheric Pressure (kg/cm2 a)
V = Storage Volume in M3 which includes receiver, after cooler and delivery piping
T = Time taken to build up pressure to P2 in minutes
In case the actual compressed air temperature at discharge, say t2°C is higher than ambient air temperature say t1°C (as is usual case),
The FAD is to be corrected by a factor (273 + t1) / (273 + t2).
Specific Power Consumption = Power consumed (kW) / Air generated (CFM)
Compression Ratio, r = Final Pressure/ Suction Pressure (both the pressures in same unit).

23
Isothermal power (kW) = P1 x Q1 x (loger) / 36.7
P1 = Absolute intake pressure kg/ cm2 Q1 = Free air delivered m
3/hr.
r = Pressure ratio P2/P1
Isothermal efficiency = Isothermal Power (kW)___
Actual Measured Input Power (kW)
5.3 Recommendations:
The compressors are used only for filter backwashing and not run regularly as there is no
other compressed air requirement. Hence there is no necessity for any change in the
compressed air system.
24
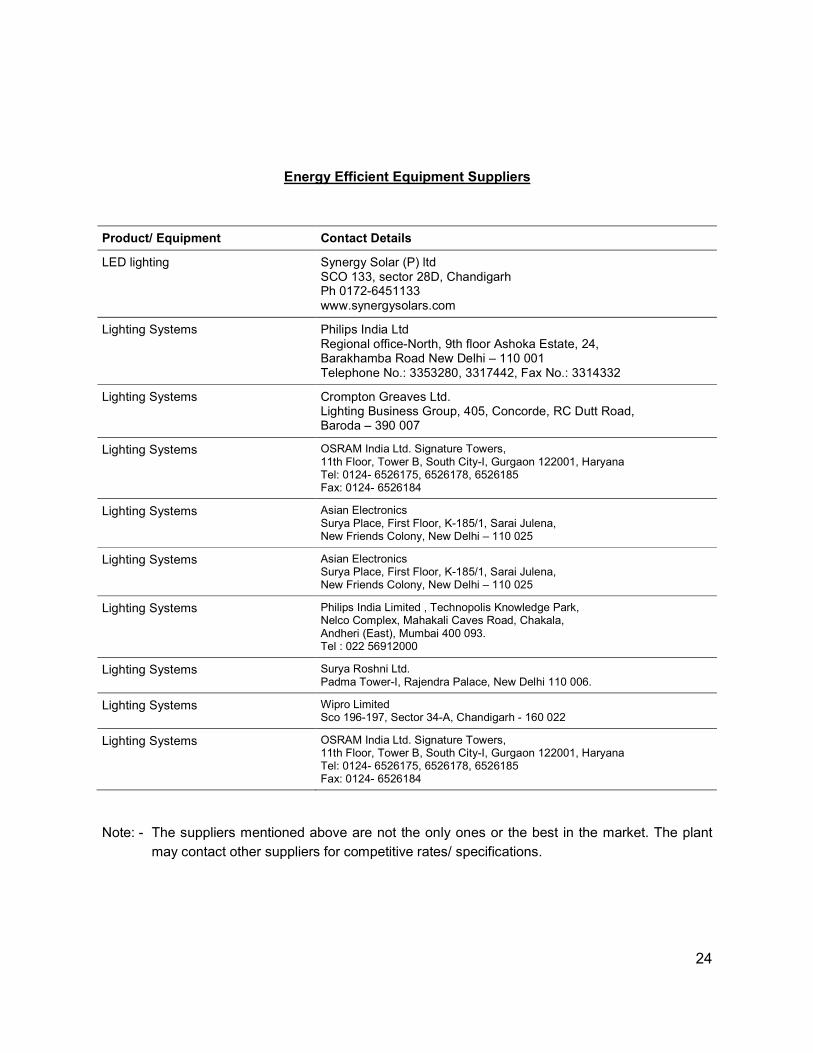
Energy Efficient Equipment Suppliers
Product/ Equipment Contact Details
LED lighting Synergy Solar (P) ltd SCO 133, sector 28D, Chandigarh Ph 0172-6451133 www.synergysolars.com
Lighting Systems Philips India Ltd Regional office-North, 9th floor Ashoka Estate, 24, Barakhamba Road New Delhi – 110 001 Telephone No.: 3353280, 3317442, Fax No.: 3314332
Lighting Systems Crompton Greaves Ltd. Lighting Business Group, 405, Concorde, RC Dutt Road, Baroda – 390 007
Lighting Systems OSRAM India Ltd. Signature Towers, 11th Floor, Tower B, South City-I, Gurgaon 122001, Haryana Tel: 0124- 6526175, 6526178, 6526185 Fax: 0124- 6526184
Lighting Systems Asian Electronics Surya Place, First Floor, K-185/1, Sarai Julena, New Friends Colony, New Delhi – 110 025
Lighting Systems Asian Electronics Surya Place, First Floor, K-185/1, Sarai Julena, New Friends Colony, New Delhi – 110 025
Lighting Systems Philips India Limited , Technopolis Knowledge Park, Nelco Complex, Mahakali Caves Road, Chakala, Andheri (East), Mumbai 400 093. Tel : 022 56912000
Lighting Systems Surya Roshni Ltd. Padma Tower-I, Rajendra Palace, New Delhi 110 006.
Lighting Systems Wipro Limited Sco 196-197, Sector 34-A, Chandigarh - 160 022
Lighting Systems OSRAM India Ltd. Signature Towers, 11th Floor, Tower B, South City-I, Gurgaon 122001, Haryana Tel: 0124- 6526175, 6526178, 6526185 Fax: 0124- 6526184
Note: - The suppliers mentioned above are not the only ones or the best in the market. The plant
may contact other suppliers for competitive rates/ specifications.