Embed Size (px)
Citation preview
Strategic Energy Management For Resilience
1
Energy Conservation Act
Energy Use Reports and
Energy Efficiency Improvement Plans 2014
Kwek Chin Hin
Head (Industrial Energy Efficiency)
7 Oct 2015
2
OutlineSingapore’s GHG Profile1
2 Industrial Energy Efficiency
Programmes
3 Key Findings from 2014 ECA
Submissions
4 Next Steps?

3
Singapore’s GHG
Profile1
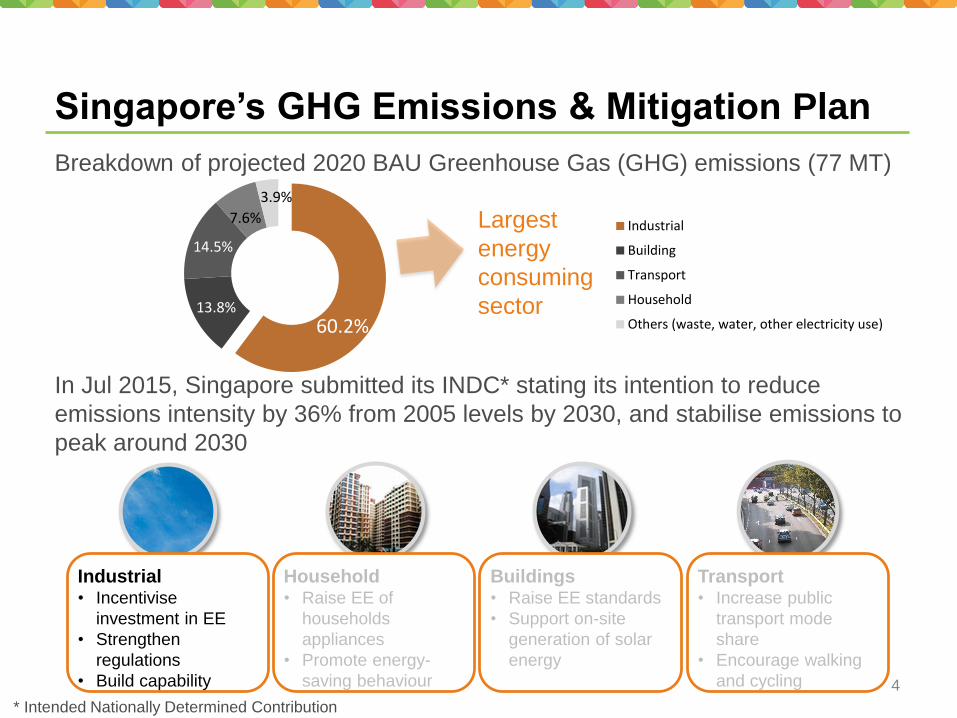
Breakdown of projected 2020 BAU Greenhouse Gas (GHG) emissions (77 MT)
In Jul 2015, Singapore submitted its INDC* stating its intention to reduce
emissions intensity by 36% from 2005 levels by 2030, and stabilise emissions to
peak around 2030
Singapore’s GHG Emissions & Mitigation Plan
Buildings• Raise EE standards
• Support on-site
generation of solar
energy
Industrial• Incentivise
investment in EE
• Strengthen
regulations
• Build capability
Household• Raise EE of
households
appliances
• Promote energy-
saving behaviour
Transport• Increase public
transport mode
share
• Encourage walking
and cycling
* Intended Nationally Determined Contribution
4
60.2%13.8%
14.5%
7.6%
3.9%
Industrial
Building
Transport
Household
Others (waste, water, other electricity use)
Largest
energy
consuming
sector
5
Industrial EE
Programmes2
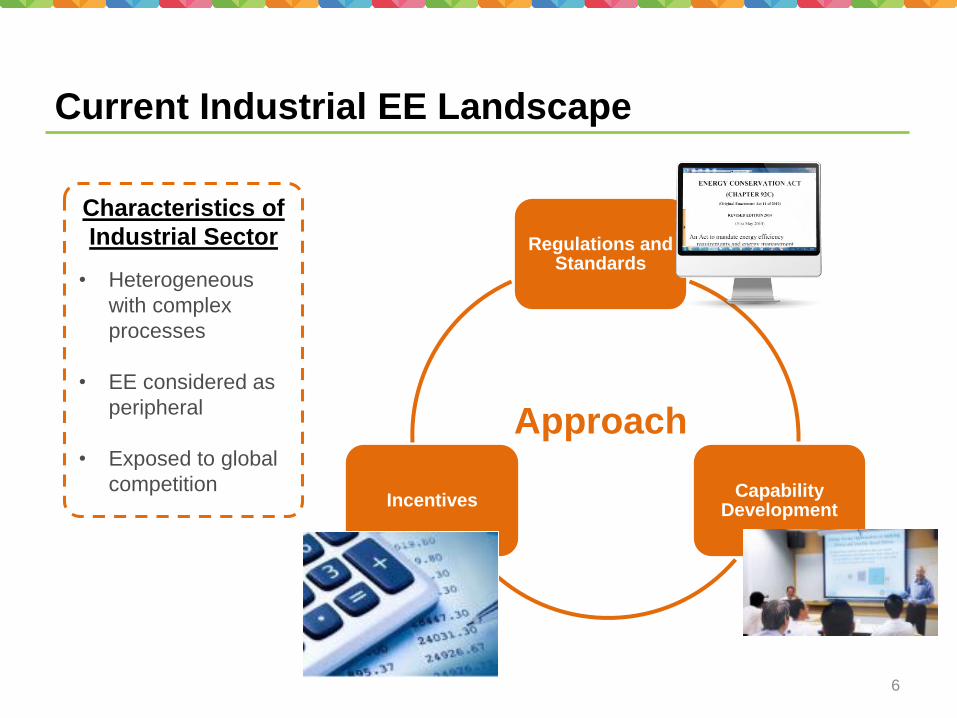
Current Industrial EE Landscape
Regulations and Standards
Capability Development
Incentives
Characteristics of
Industrial Sector
• Heterogeneous
with complex
processes
• EE considered as
peripheral
• Exposed to global
competition
Approach
6
Regulations and Standards
7
Mandatory Energy Management Practices under Energy Conservation Act (ECA)
• Mandatory energy management practices introduced in Apr 2013
• Energy-intensive users in the industrial sector consuming 54 TJ or more each year must:
- appoint a SCEM-certified energy manager
- monitor and report energy use and GHG emissions
- submit energy efficiency improvement plans
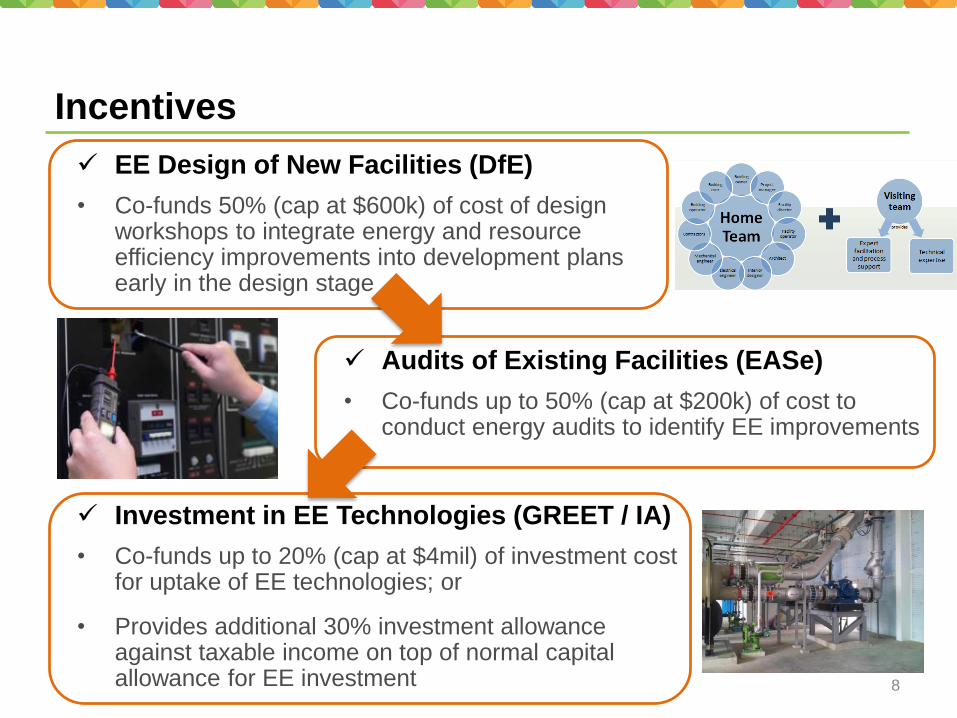
Incentives
8
EE Design of New Facilities (DfE)
• Co-funds 50% (cap at $600k) of cost of design workshops to integrate energy and resource efficiency improvements into development plans early in the design stage
Audits of Existing Facilities (EASe)
• Co-funds up to 50% (cap at $200k) of cost to conduct energy audits to identify EE improvements
Investment in EE Technologies (GREET / IA)
• Co-funds up to 20% (cap at $4mil) of investment cost for uptake of EE technologies; or
• Provides additional 30% investment allowance against taxable income on top of normal capital allowance for EE investment
Capability Development
9
Energy Efficiency National Partnership (EENP)
• EENP Learning Network & National Energy Efficiency Conference
• EENP Awards
Singapore Certified Energy Manager (SCEM)
• Training and certification programme in energy management
• Requirement for ECA energy managers
10
Key Findings from
2014 ECA
Submissions3

ECA Coverage
11
40%
13%1%
1%
45%
Primary Energy Consumption
Industrial
Transport
Commerce &Service
Household
Energy &Transformation
65%
18%
12%
5%
Final Energy Consumption
Industrial
Transport
Commerce &Service
Household
Others
83%
63%
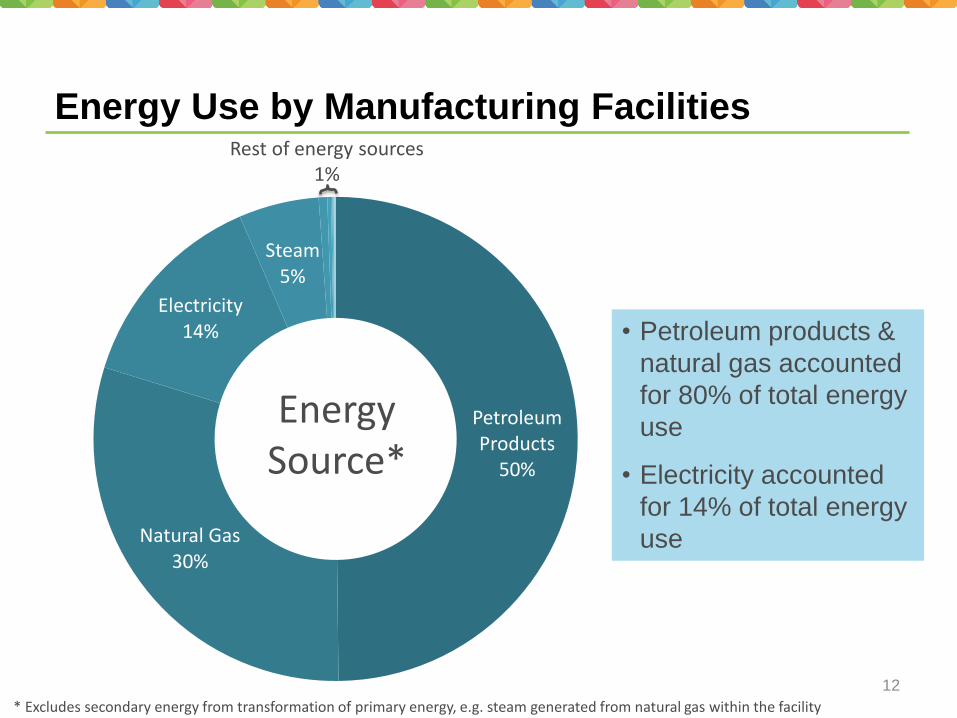
Energy Use by Manufacturing Facilities
12
Petroleum Products
50%
Natural Gas30%
Electricity14%
Steam5%
• Petroleum products &
natural gas accounted
for 80% of total energy
use
• Electricity accounted
for 14% of total energy
use
Rest of energy sources1%
* Excludes secondary energy from transformation of primary energy, e.g. steam generated from natural gas within the facility
EnergySource*
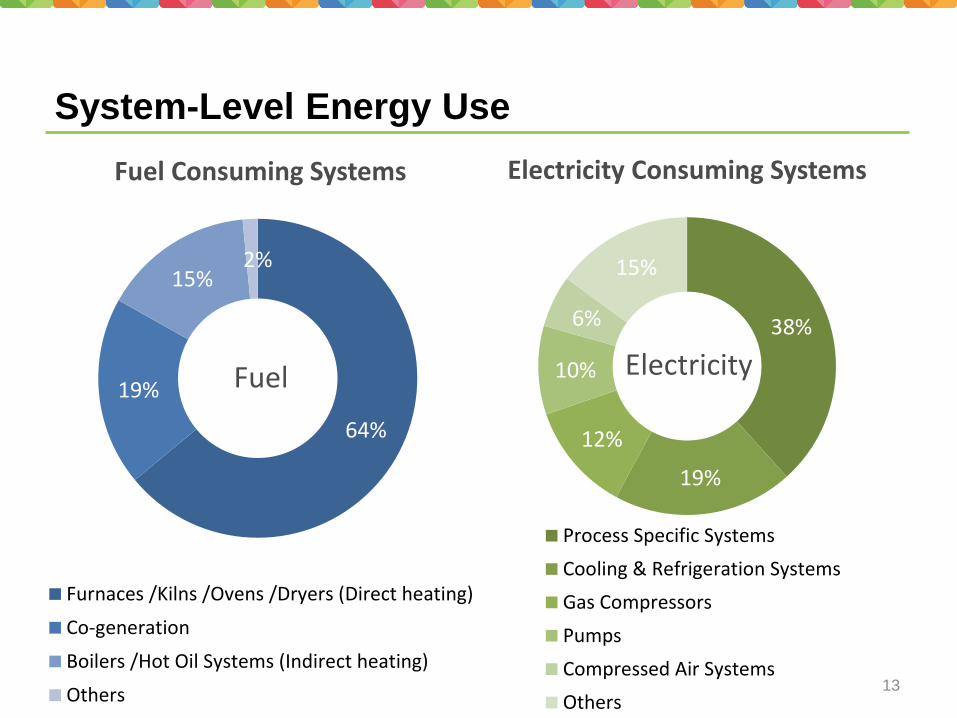
38%
19%
12%
10%
6%
15%
Electricity Consuming Systems
Process Specific Systems
Cooling & Refrigeration Systems
Gas Compressors
Pumps
Compressed Air Systems
Others
64%
19%
15%2%
Fuel Consuming Systems
Furnaces /Kilns /Ovens /Dryers (Direct heating)
Co-generation
Boilers /Hot Oil Systems (Indirect heating)
Others
System-Level Energy Use
13
Fuel Electricity
1.00
1.10
1.20
1.30
1.40
1.50
10 100 1,000
SEC (TJ/TJ)
Fuel Energy (TJ/Year)
Estimated Data Measured Data
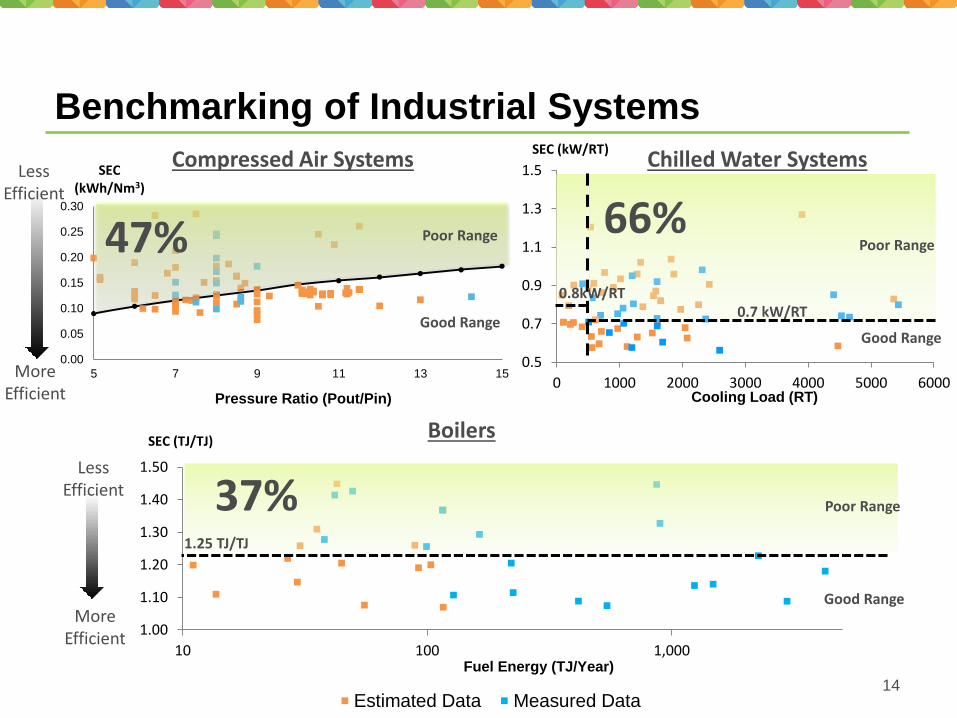
Benchmarking of Industrial Systems
14
MoreEfficient
LessEfficient
0.5
0.7
0.9
1.1
1.3
1.5
0 1000 2000 3000 4000 5000 6000
SEC (kW/RT)
Cooling Load (RT)
66%
0.8kW/RT0.7 kW/RT
37%1.25 TJ/TJ
Boilers
Chilled Water Systems
0.00
0.05
0.10
0.15
0.20
0.25
0.30
5 7 9 11 13 15
SEC (kWh/Nm3)
Pressure Ratio (Pout/Pin)
Poor Range
Good Range
47%
More Efficient
Less Efficient
Compressed Air Systems
Poor Range
Good Range
Poor Range
Good Range
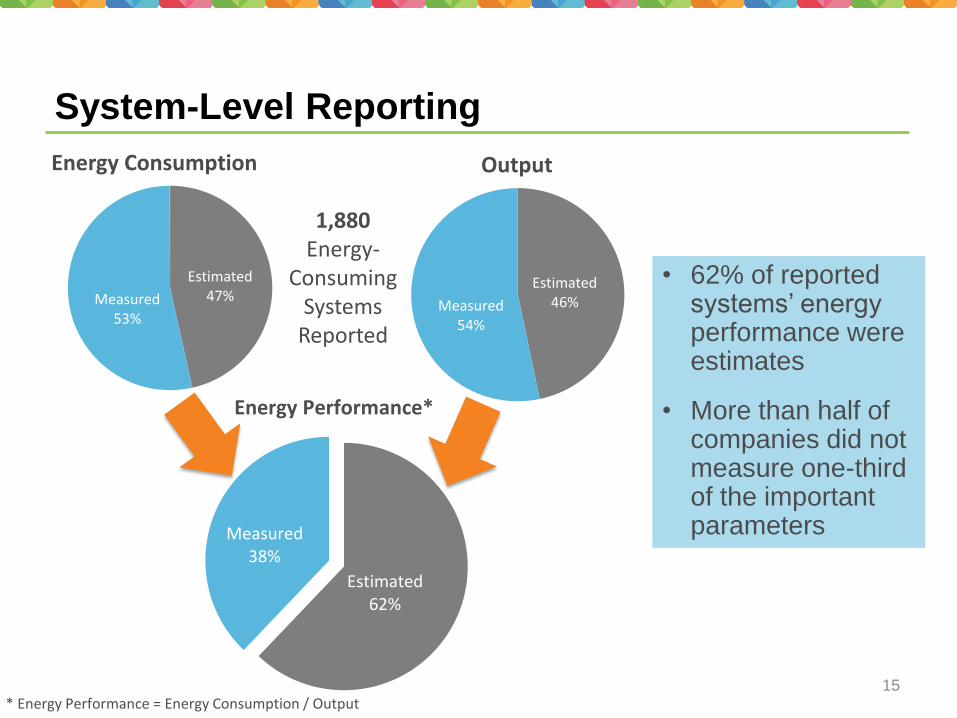
System-Level Reporting
15* Energy Performance = Energy Consumption / Output
Estimated47%Measured
53%
Energy Consumption
Estimated46%Measured
54%
Output
Estimated62%
Measured38%
Energy Performance*
1,880Energy-
Consuming Systems
Reported
• 62% of reported systems’ energy performance were estimates
• More than half of companies did not measure one-third of the important parameters
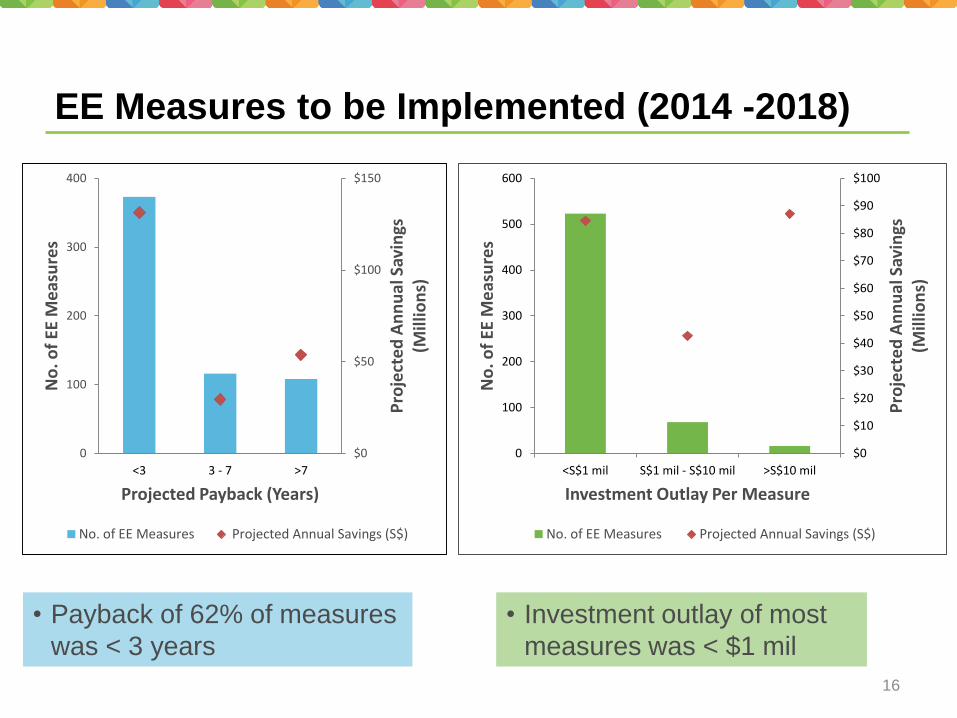
EE Measures to be Implemented (2014 -2018)
16
• Investment outlay of most
measures was < $1 mil
$0
$50
$100
$150
0
100
200
300
400
<3 3 - 7 >7
Pro
ject
ed
An
nu
al S
avin
gs(M
illio
ns)
No
. of
EE M
eas
ure
s
Projected Payback (Years)
No. of EE Measures Projected Annual Savings (S$)
• Payback of 62% of measures
was < 3 years
$0
$10
$20
$30
$40
$50
$60
$70
$80
$90
$100
0
100
200
300
400
500
600
<S$1 mil S$1 mil - S$10 mil >S$10 mil
Pro
ject
ed
An
nu
al S
avin
gs(M
illio
ns)
No
. of
EE M
eas
ure
sInvestment Outlay Per Measure
No. of EE Measures Projected Annual Savings (S$)
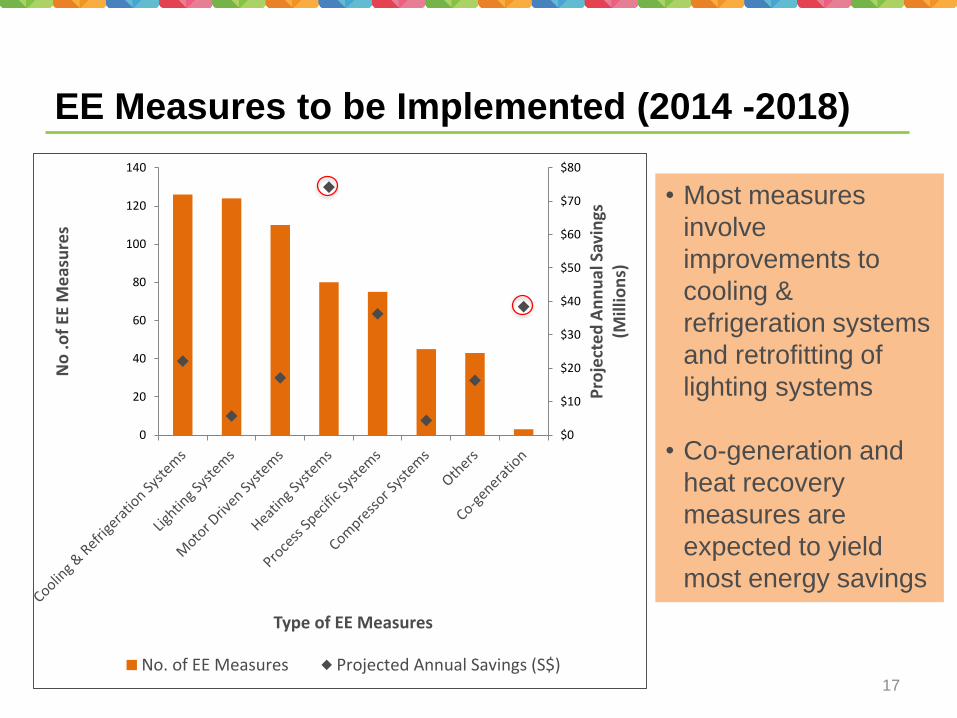
EE Measures to be Implemented (2014 -2018)
17
• Most measures
involve
improvements to
cooling &
refrigeration systems
and retrofitting of
lighting systems
• Co-generation and
heat recovery
measures are
expected to yield
most energy savings
$0
$10
$20
$30
$40
$50
$60
$70
$80
0
20
40
60
80
100
120
140
Pro
ject
ed
An
nu
al S
avin
gs(M
illio
ns)
No
.of
EE M
eas
ure
s
Type of EE Measures
No. of EE Measures Projected Annual Savings (S$)
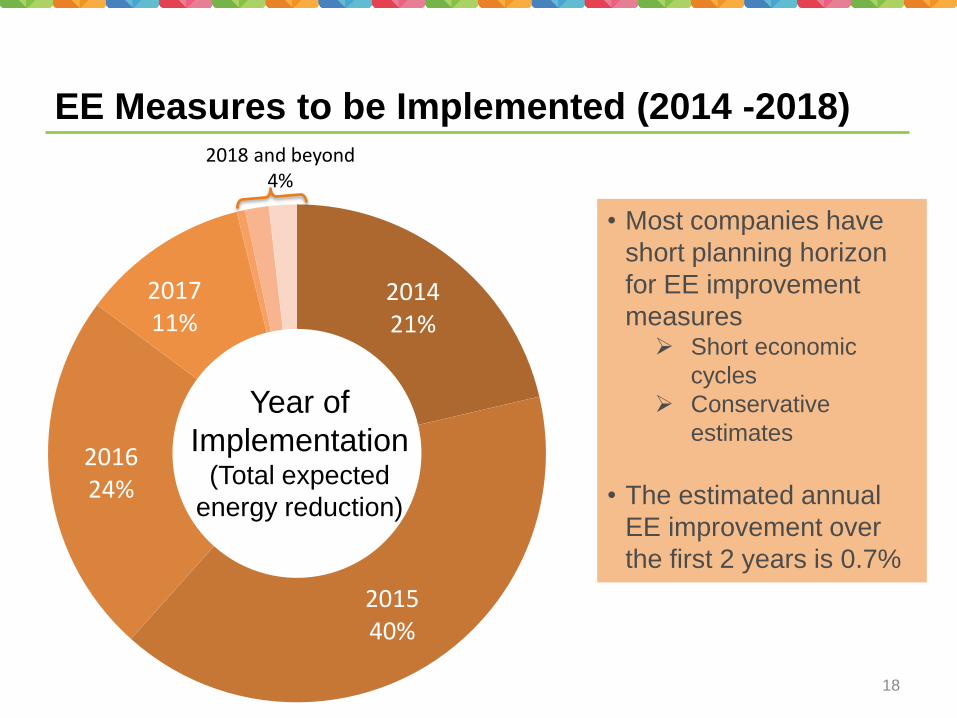
EE Measures to be Implemented (2014 -2018)
18
• Most companies have
short planning horizon
for EE improvement
measures Short economic
cycles
Conservative
estimates
• The estimated annual
EE improvement over
the first 2 years is 0.7%
201421%
201540%
201624%
201711%
Year of
Implementation (Total expected
energy reduction)
2018 and beyond4%

19
Next Steps?4
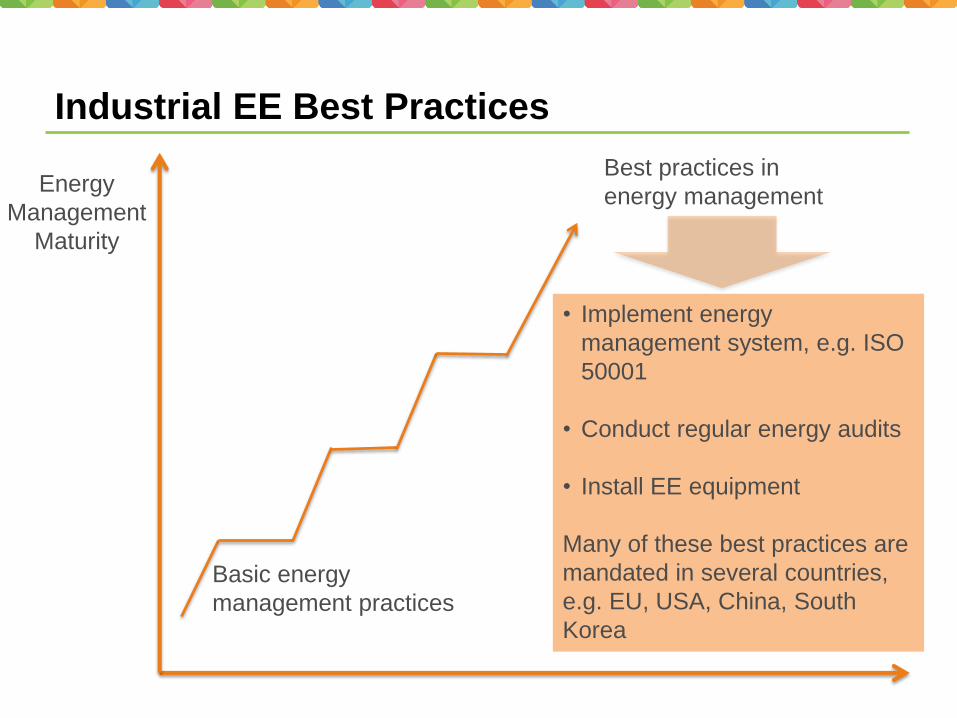
Industrial EE Best Practices
Energy
Management
Maturity
Basic energy
management practices
• Implement energy
management system, e.g. ISO
50001
• Conduct regular energy audits
• Install EE equipment
Many of these best practices are
mandated in several countries,
e.g. EU, USA, China, South
Korea
Best practices in
energy management
For More Information
21
www.e2singapore.gov.sg

22
THANK YOU