Embed Size (px)
Citation preview
ENERGY CONSUMPTION DETERMINANTS FOR APPAREL SEWING OPERATIONS:
AN APPROACH TO ENVIRONMENTAL SUSTAINABILITY
by
MD. IMRANUL ISLAM
B.S., University of Dhaka, 2006
M.B.A., University of Dhaka, 2011
M.Engg., Bangladesh University of Engineering and Technology, 2013
AN ABSTRACT OF A DISSERTATION
submitted in partial fulfillment of the requirements for the degree
DOCTOR OF PHILOSOPHY
Department of Apparel, Textiles, and Interior Design
College of Human Ecology
KANSAS STATE UNIVERSITY
Manhattan, Kansas
2016
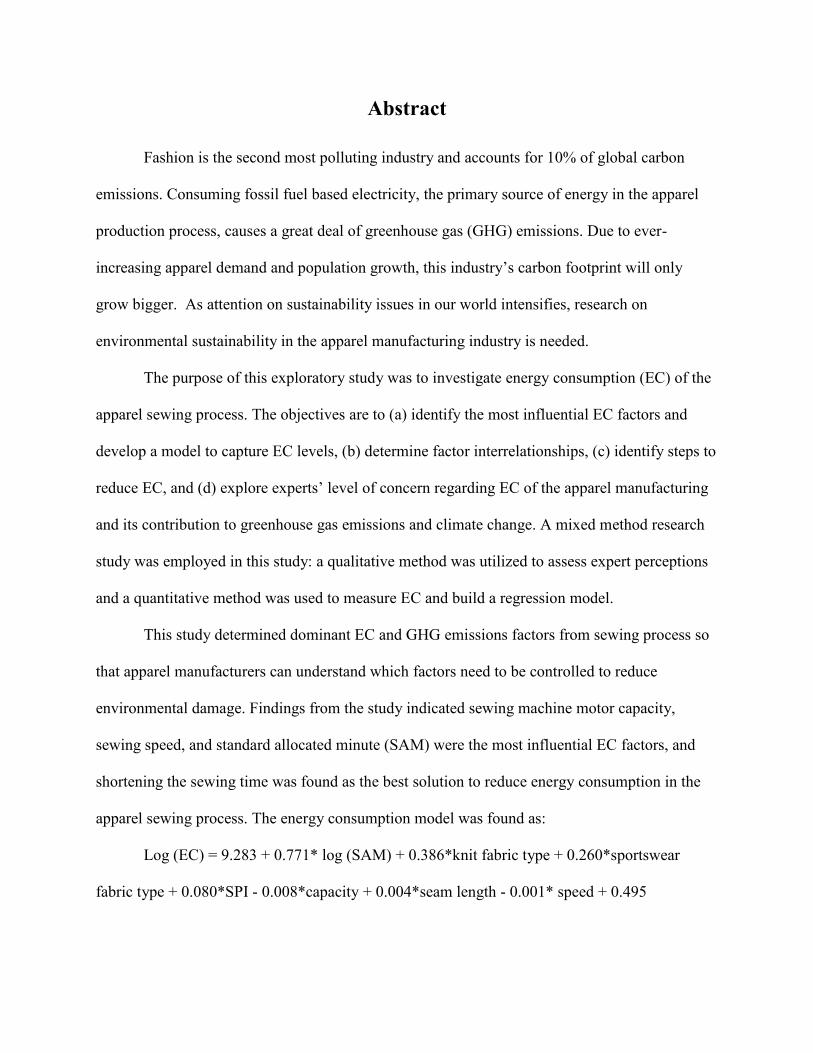
Abstract
Fashion is the second most polluting industry and accounts for 10% of global carbon
emissions. Consuming fossil fuel based electricity, the primary source of energy in the apparel
production process, causes a great deal of greenhouse gas (GHG) emissions. Due to ever-
increasing apparel demand and population growth, this industry’s carbon footprint will only
grow bigger. As attention on sustainability issues in our world intensifies, research on
environmental sustainability in the apparel manufacturing industry is needed.
The purpose of this exploratory study was to investigate energy consumption (EC) of the
apparel sewing process. The objectives are to (a) identify the most influential EC factors and
develop a model to capture EC levels, (b) determine factor interrelationships, (c) identify steps to
reduce EC, and (d) explore experts’ level of concern regarding EC of the apparel manufacturing
and its contribution to greenhouse gas emissions and climate change. A mixed method research
study was employed in this study: a qualitative method was utilized to assess expert perceptions
and a quantitative method was used to measure EC and build a regression model.
This study determined dominant EC and GHG emissions factors from sewing process so
that apparel manufacturers can understand which factors need to be controlled to reduce
environmental damage. Findings from the study indicated sewing machine motor capacity,
sewing speed, and standard allocated minute (SAM) were the most influential EC factors, and
shortening the sewing time was found as the best solution to reduce energy consumption in the
apparel sewing process. The energy consumption model was found as:
Log (EC) = 9.283 + 0.771* log (SAM) + 0.386*knit fabric type + 0.260*sportswear
fabric type + 0.080*SPI - 0.008*capacity + 0.004*seam length - 0.001* speed + 0.495

The EC model along with GHG calculator (a tool to convert GHG from EC) will help the
industry to determine their EC and GHG emissions level to boost their awareness and to
encourage greater impetus for environmental actions. Finally, this study will help designers,
retailers, and consumers to pursue environmentally friendly actions in terms of decisions
regarding apparel design, sourcing, and purchasing.
ENERGY CONSUMPTION DETERMINANTS FOR APPAREL SEWING OPERATIONS:
AN APPROACH TO ENVIRONMENTAL SUSTAINABILITY
by
MD. IMRANUL ISLAM
B.S., University of Dhaka, 2006
M.B.A., University of Dhaka, 2011
M.Engg., Bangladesh University of Engineering and Technology, 2013
A DISSERTATION
submitted in partial fulfillment of the requirements for the degree
DOCTOR OF PHILOSOPHY
Department of Apparel, Textiles, and Interior Design
College of Human Ecology
KANSAS STATE UNIVERSITY
Manhattan, Kansas
2016
Approved by:
Major Professor
Dr. Melody L. A. LeHew

Copyright
MD. IMRANUL ISLAM
2016

Abstract
Fashion is the second most polluting industry and accounts for 10% of global carbon
emissions. Consuming fossil fuel based electricity, the primary source of energy in the apparel
production process, causes a great deal of greenhouse gas (GHG) emissions. Due to ever-
increasing apparel demand and population growth, this industry’s carbon footprint will only
grow bigger. As attention on sustainability issues in our world intensifies, research on
environmental sustainability in the apparel manufacturing industry is needed.
The purpose of this exploratory study was to investigate energy consumption (EC) of the
apparel sewing process. The objectives are to (a) identify the most influential EC factors and
develop a model to capture EC levels, (b) determine factor interrelationships, (c) identify steps to
reduce EC, and (d) explore experts’ level of concern regarding EC of the apparel manufacturing
and its contribution to greenhouse gas emissions and climate change. A mixed method research
study was employed in this study: a qualitative method was utilized to assess expert perceptions
and a quantitative method was used to measure EC and build a regression model.
This study determined dominant EC and GHG emissions factors from sewing process so
that apparel manufacturers can understand which factors need to be controlled to reduce
environmental damage. Findings from the study indicated sewing machine motor capacity,
sewing speed, and standard allocated minute (SAM) were the most influential EC factors, and
shortening the sewing time was found as the best solution to reduce energy consumption in the
apparel sewing process. The energy consumption model was found as:
Log (EC) = 9.283 + 0.771* log (SAM) + 0.386*knit fabric type + 0.260*sportswear
fabric type + 0.080*SPI - 0.008*capacity + 0.004*seam length - 0.001* speed + 0.495

The EC model along with GHG calculator (a tool to convert GHG from EC) will help the
industry to determine their EC and GHG emissions level to boost their awareness and to
encourage greater impetus for environmental actions. Finally, this study will help designers,
retailers, and consumers to pursue environmentally friendly actions in terms of decisions
regarding apparel design, sourcing, and purchasing.
viii
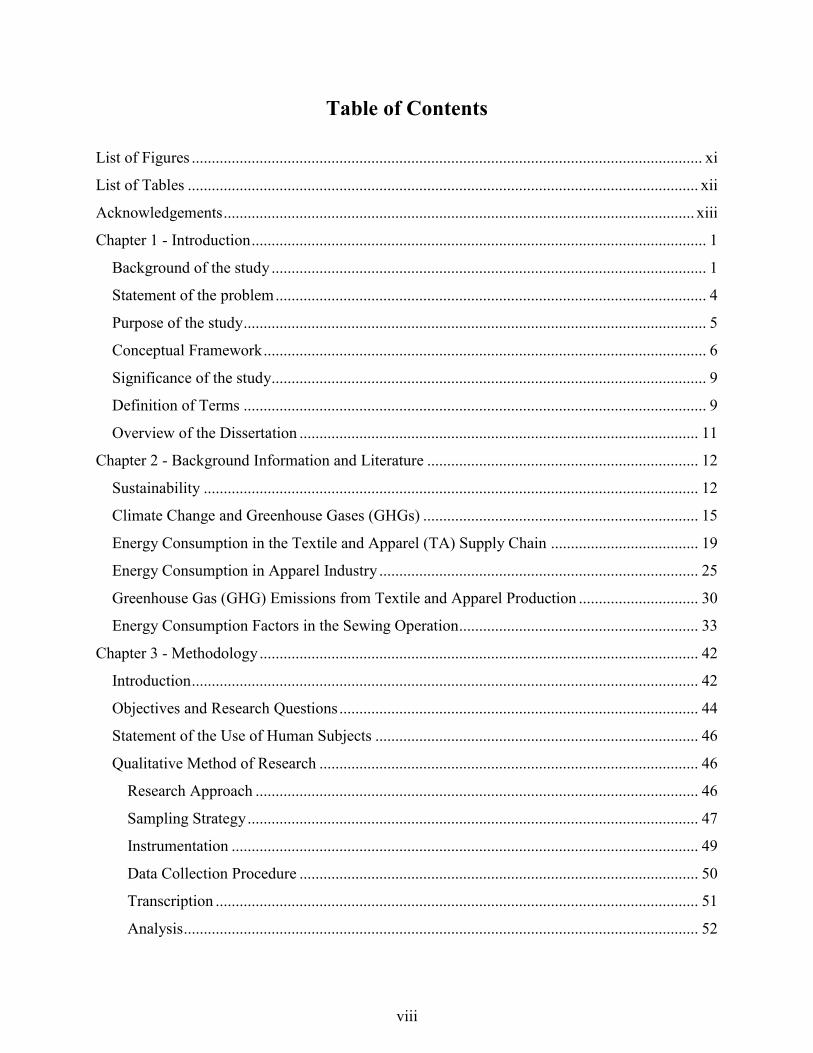
Table of Contents
List of Figures ................................................................................................................................ xi
List of Tables ................................................................................................................................ xii
Acknowledgements ...................................................................................................................... xiii
Chapter 1 - Introduction .................................................................................................................. 1
Background of the study ............................................................................................................. 1
Statement of the problem ............................................................................................................ 4
Purpose of the study .................................................................................................................... 5
Conceptual Framework ............................................................................................................... 6
Significance of the study ............................................................................................................. 9
Definition of Terms .................................................................................................................... 9
Overview of the Dissertation .................................................................................................... 11
Chapter 2 - Background Information and Literature .................................................................... 12
Sustainability ............................................................................................................................ 12
Climate Change and Greenhouse Gases (GHGs) ..................................................................... 15
Energy Consumption in the Textile and Apparel (TA) Supply Chain ..................................... 19
Energy Consumption in Apparel Industry ................................................................................ 25
Greenhouse Gas (GHG) Emissions from Textile and Apparel Production .............................. 30
Energy Consumption Factors in the Sewing Operation ............................................................ 33
Chapter 3 - Methodology .............................................................................................................. 42
Introduction ............................................................................................................................... 42
Objectives and Research Questions .......................................................................................... 44
Statement of the Use of Human Subjects ................................................................................. 46
Qualitative Method of Research ............................................................................................... 46
Research Approach ............................................................................................................... 46
Sampling Strategy ................................................................................................................. 47
Instrumentation ..................................................................................................................... 49
Data Collection Procedure .................................................................................................... 50
Transcription ......................................................................................................................... 51
Analysis ................................................................................................................................. 52
ix
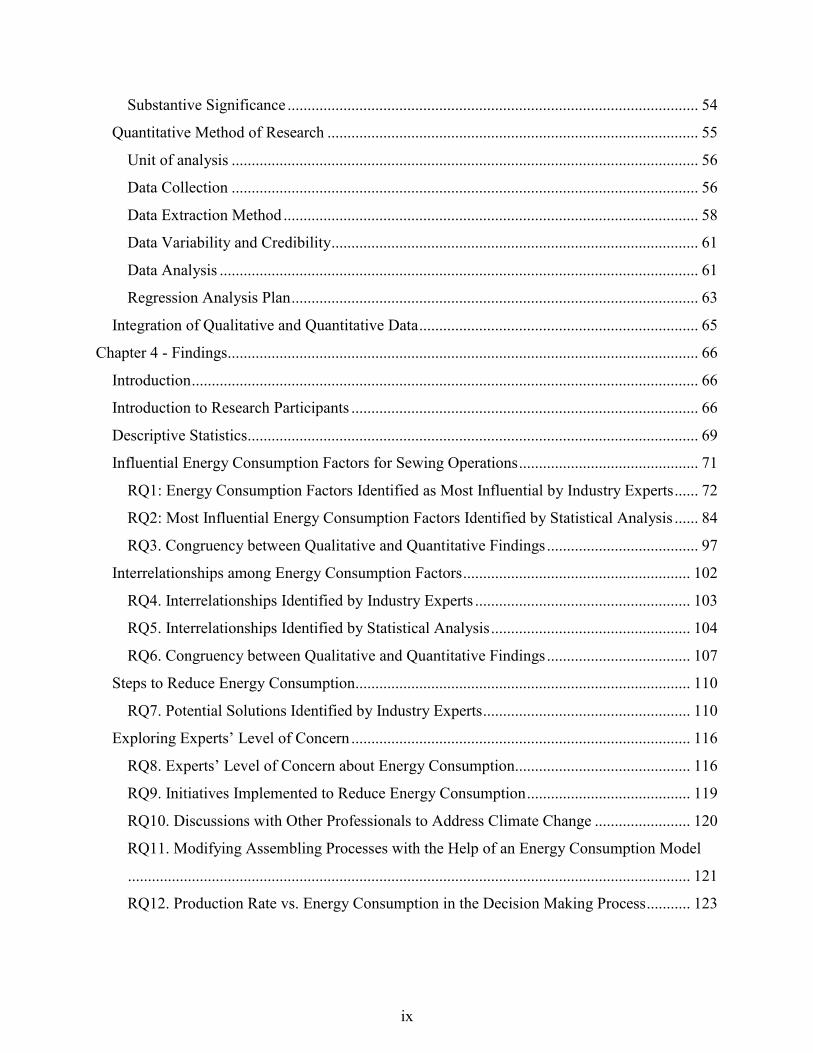
Substantive Significance ....................................................................................................... 54
Quantitative Method of Research ............................................................................................. 55
Unit of analysis ..................................................................................................................... 56
Data Collection ..................................................................................................................... 56
Data Extraction Method ........................................................................................................ 58
Data Variability and Credibility ............................................................................................ 61
Data Analysis ........................................................................................................................ 61
Regression Analysis Plan ...................................................................................................... 63
Integration of Qualitative and Quantitative Data ...................................................................... 65
Chapter 4 - Findings...................................................................................................................... 66
Introduction ............................................................................................................................... 66
Introduction to Research Participants ....................................................................................... 66
Descriptive Statistics ................................................................................................................. 69
Influential Energy Consumption Factors for Sewing Operations ............................................. 71
RQ1: Energy Consumption Factors Identified as Most Influential by Industry Experts ...... 72
RQ2: Most Influential Energy Consumption Factors Identified by Statistical Analysis ...... 84
RQ3. Congruency between Qualitative and Quantitative Findings ...................................... 97
Interrelationships among Energy Consumption Factors ......................................................... 102
RQ4. Interrelationships Identified by Industry Experts ...................................................... 103
RQ5. Interrelationships Identified by Statistical Analysis .................................................. 104
RQ6. Congruency between Qualitative and Quantitative Findings .................................... 107
Steps to Reduce Energy Consumption .................................................................................... 110
RQ7. Potential Solutions Identified by Industry Experts .................................................... 110
Exploring Experts’ Level of Concern ..................................................................................... 116
RQ8. Experts’ Level of Concern about Energy Consumption............................................ 116
RQ9. Initiatives Implemented to Reduce Energy Consumption ......................................... 119
RQ10. Discussions with Other Professionals to Address Climate Change ........................ 120
RQ11. Modifying Assembling Processes with the Help of an Energy Consumption Model
............................................................................................................................................. 121
RQ12. Production Rate vs. Energy Consumption in the Decision Making Process ........... 123
x
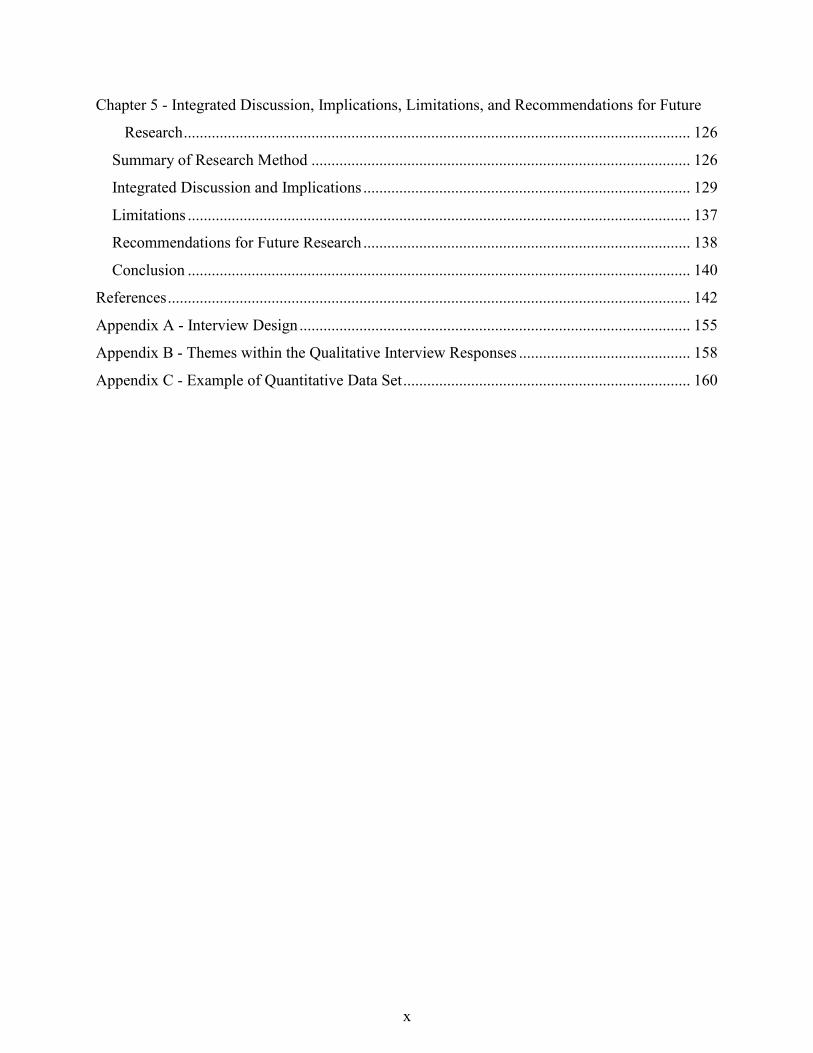
Chapter 5 - Integrated Discussion, Implications, Limitations, and Recommendations for Future
Research ............................................................................................................................... 126
Summary of Research Method ............................................................................................... 126
Integrated Discussion and Implications .................................................................................. 129
Limitations .............................................................................................................................. 137
Recommendations for Future Research .................................................................................. 138
Conclusion .............................................................................................................................. 140
References ................................................................................................................................... 142
Appendix A - Interview Design .................................................................................................. 155
Appendix B - Themes within the Qualitative Interview Responses ........................................... 158
Appendix C - Example of Quantitative Data Set ........................................................................ 160
xi
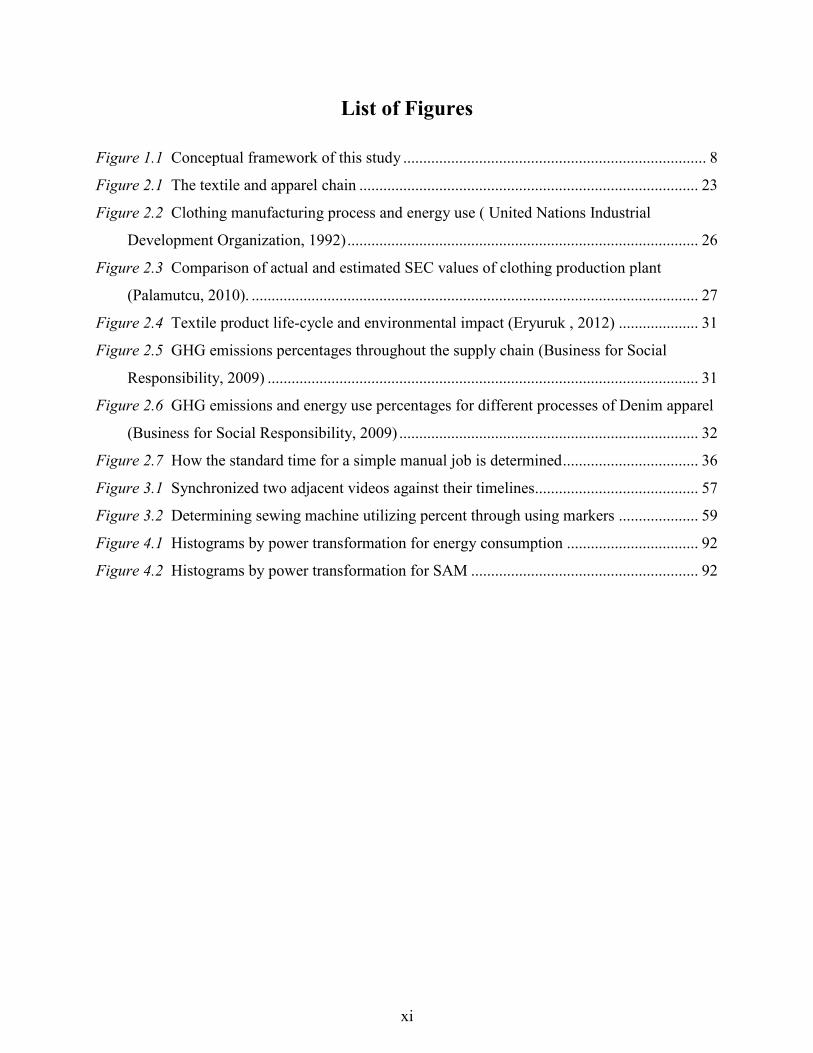
List of Figures
Figure 1.1 Conceptual framework of this study ............................................................................ 8
Figure 2.1 The textile and apparel chain ..................................................................................... 23
Figure 2.2 Clothing manufacturing process and energy use ( United Nations Industrial
Development Organization, 1992) ........................................................................................ 26
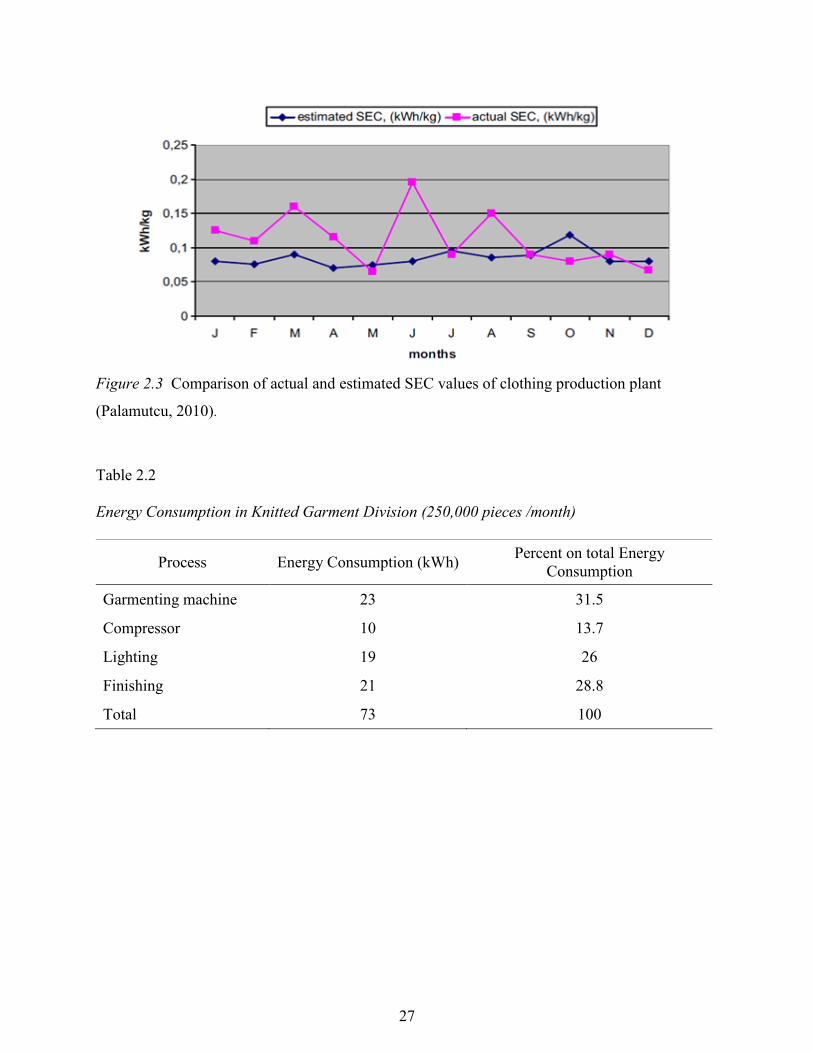
Figure 2.3 Comparison of actual and estimated SEC values of clothing production plant
(Palamutcu, 2010). ................................................................................................................ 27
Figure 2.4 Textile product life-cycle and environmental impact (Eryuruk , 2012) .................... 31
Figure 2.5 GHG emissions percentages throughout the supply chain (Business for Social
Responsibility, 2009) ............................................................................................................ 31
Figure 2.6 GHG emissions and energy use percentages for different processes of Denim apparel
(Business for Social Responsibility, 2009) ........................................................................... 32
Figure 2.7 How the standard time for a simple manual job is determined .................................. 36
Figure 3.1 Synchronized two adjacent videos against their timelines......................................... 57
Figure 3.2 Determining sewing machine utilizing percent through using markers .................... 59
Figure 4.1 Histograms by power transformation for energy consumption ................................. 92
Figure 4.2 Histograms by power transformation for SAM ......................................................... 92
xii
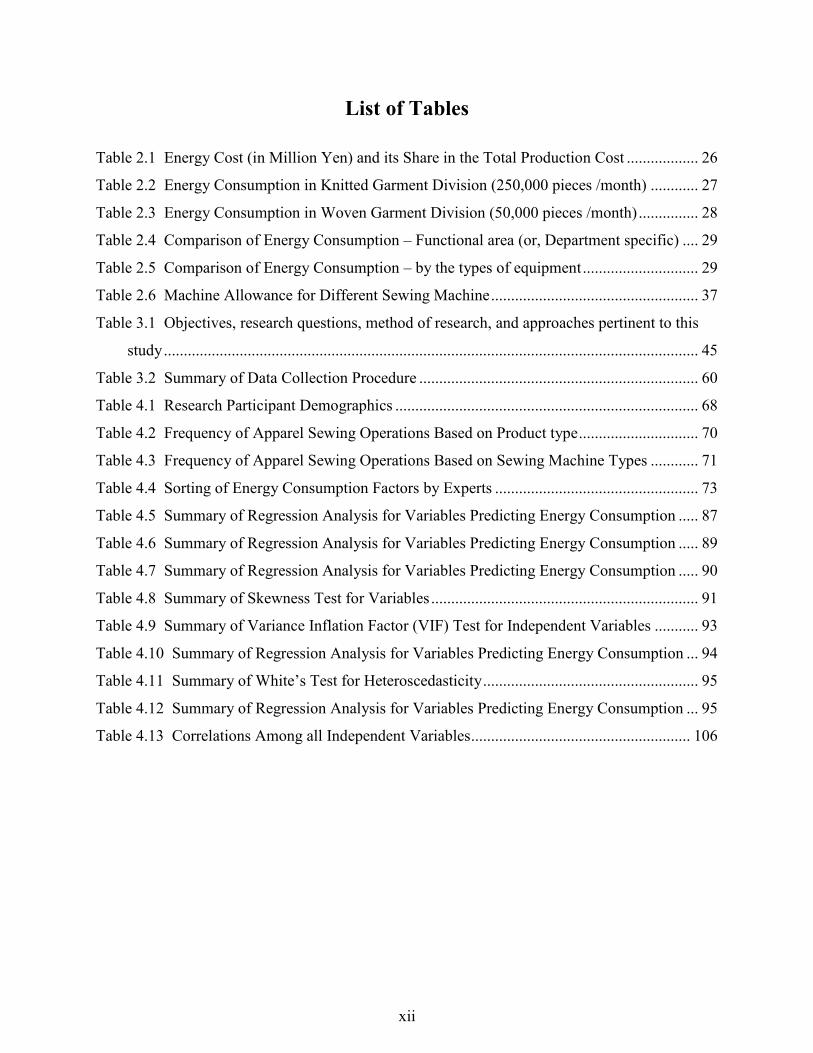
List of Tables
Table 2.1 Energy Cost (in Million Yen) and its Share in the Total Production Cost .................. 26
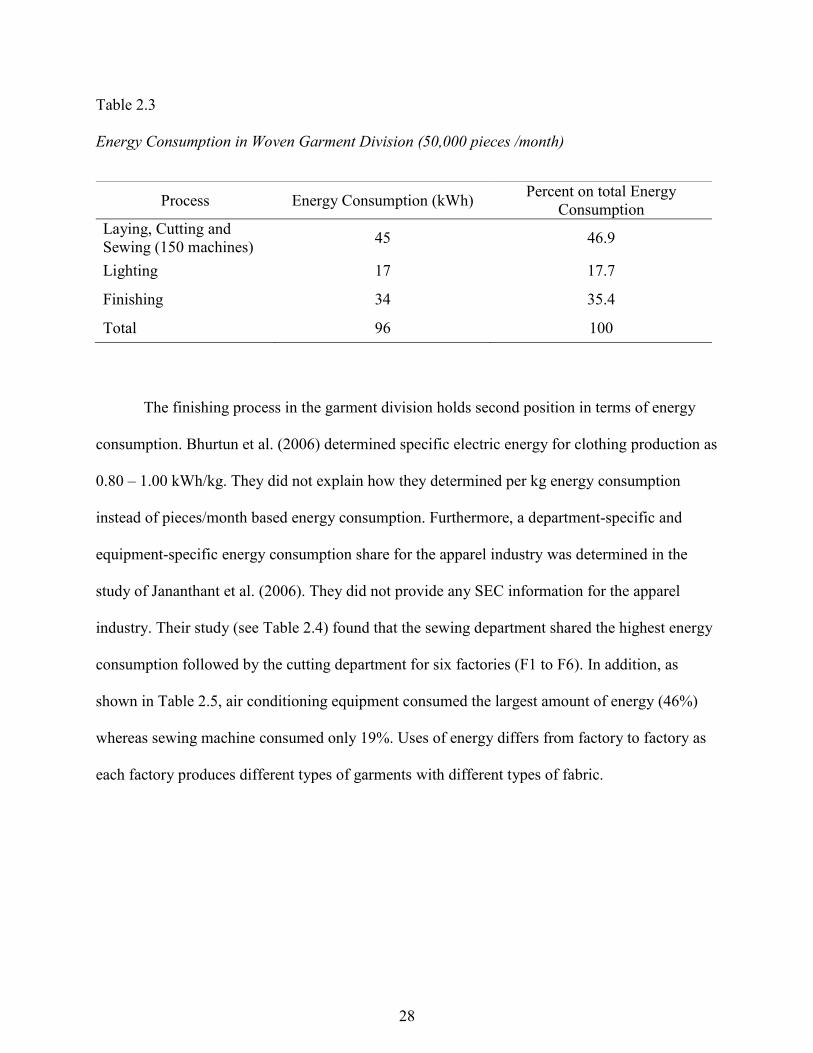
Table 2.2 Energy Consumption in Knitted Garment Division (250,000 pieces /month) ............ 27
Table 2.3 Energy Consumption in Woven Garment Division (50,000 pieces /month) ............... 28
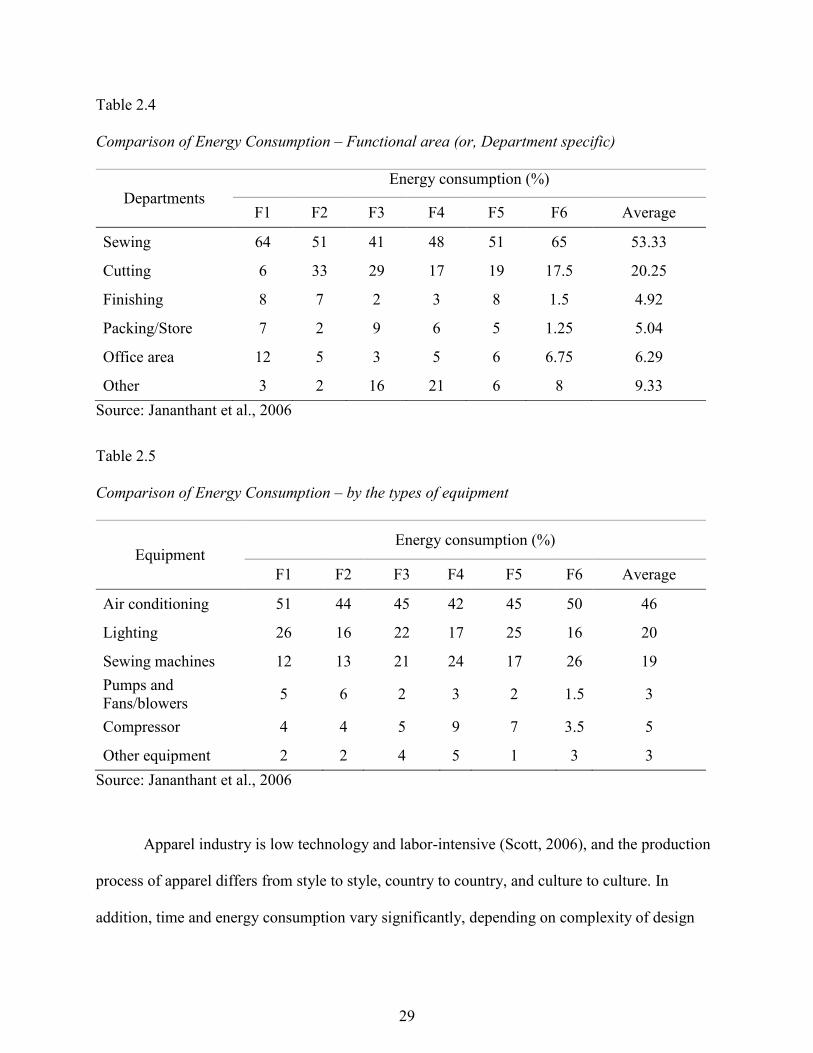
Table 2.4 Comparison of Energy Consumption – Functional area (or, Department specific) .... 29
Table 2.5 Comparison of Energy Consumption – by the types of equipment ............................. 29
Table 2.6 Machine Allowance for Different Sewing Machine .................................................... 37
Table 3.1 Objectives, research questions, method of research, and approaches pertinent to this
study ...................................................................................................................................... 45
Table 3.2 Summary of Data Collection Procedure ...................................................................... 60
Table 4.1 Research Participant Demographics ............................................................................ 68
Table 4.2 Frequency of Apparel Sewing Operations Based on Product type .............................. 70
Table 4.3 Frequency of Apparel Sewing Operations Based on Sewing Machine Types ............ 71
Table 4.4 Sorting of Energy Consumption Factors by Experts ................................................... 73
Table 4.5 Summary of Regression Analysis for Variables Predicting Energy Consumption ..... 87
Table 4.6 Summary of Regression Analysis for Variables Predicting Energy Consumption ..... 89
Table 4.7 Summary of Regression Analysis for Variables Predicting Energy Consumption ..... 90
Table 4.8 Summary of Skewness Test for Variables ................................................................... 91
Table 4.9 Summary of Variance Inflation Factor (VIF) Test for Independent Variables ........... 93
Table 4.10 Summary of Regression Analysis for Variables Predicting Energy Consumption ... 94
Table 4.11 Summary of White’s Test for Heteroscedasticity ...................................................... 95
Table 4.12 Summary of Regression Analysis for Variables Predicting Energy Consumption ... 95
Table 4.13 Correlations Among all Independent Variables ....................................................... 106
xiii
Acknowledgements
Above all, I would like to thank Almighty Allah who always guides me to the right path
and has helped me to complete this dissertation. Second, it is a pleasure and an honor to express
my deepest gratitude to my family, friends, colleagues, teachers, committee members, and
supervisor to whom I am extremely indebted for their friendship, kindness, and support.
My special, profound, and affectionate thanks, overwhelming love, and gratitude are due
to my wife, Ishrat Farzana Munni, who has struggled with me, hand in hand, to secure a brighter
future. Her understanding, quiet patience, and exemplary commitment during my studies all
stand behind my success. Without her moral support, unique forms of encouragement, and late
night tea supply, it would have been impossible for me to complete my higher education goals.
I also express my gratitude to my major Professor, Dr. Melody L. A. LeHew, for giving
me the opportunity to explore the world of sustainability and to guide my future-wellbeing-
centric vison. The completion of my Ph.D. would never have been possible without her endless
support, encouragement, significant guidance from the early stage of this research, and financial
support. She spent endless hours proofreading my dissertation and provided me excellent
suggestions. I am really indebted to her more than she knows.
I would also like to thank my committee members: Dr. Kim Y. Hiller Connell, Dr.
Jooyoun Kim, Dr. Karen S. Myers-Bowman, outside chair Dr. Keith L. Hohn, and ATID
department head Professor Barbara Anderson. I thank them for their encouragement, support,
valuable comments, and time taken to read this project. I would also like to thank the College of
Human Ecology, and specifically, the Dean’s Office for supporting my doctoral study through
the Doctoral Dissertation Research Award as well as Agricultural Experiment Station (AES) for
supporting my data collection.

xiv
Finally, I would like to thank my parents for their support and praying for my success.
1
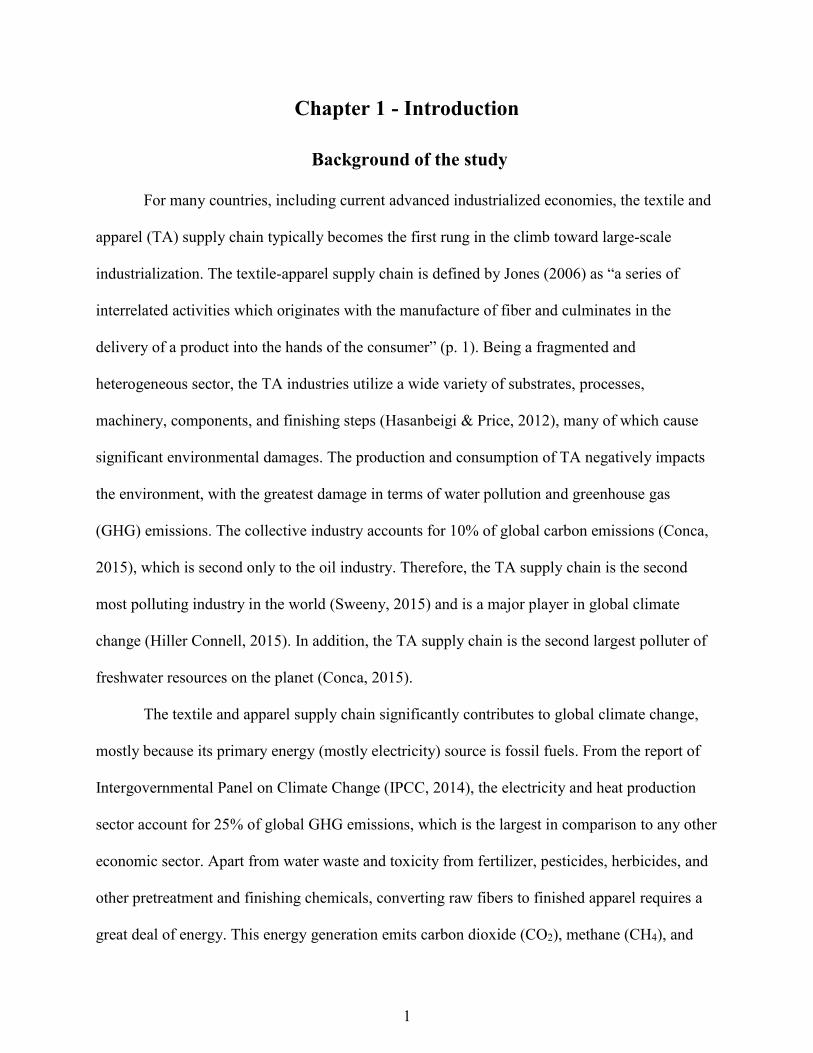
Chapter 1 - Introduction
Background of the study
For many countries, including current advanced industrialized economies, the textile and
apparel (TA) supply chain typically becomes the first rung in the climb toward large-scale
industrialization. The textile-apparel supply chain is defined by Jones (2006) as “a series of
interrelated activities which originates with the manufacture of fiber and culminates in the
delivery of a product into the hands of the consumer” (p. 1). Being a fragmented and
heterogeneous sector, the TA industries utilize a wide variety of substrates, processes,
machinery, components, and finishing steps (Hasanbeigi & Price, 2012), many of which cause
significant environmental damages. The production and consumption of TA negatively impacts
the environment, with the greatest damage in terms of water pollution and greenhouse gas
(GHG) emissions. The collective industry accounts for 10% of global carbon emissions (Conca,
2015), which is second only to the oil industry. Therefore, the TA supply chain is the second
most polluting industry in the world (Sweeny, 2015) and is a major player in global climate
change (Hiller Connell, 2015). In addition, the TA supply chain is the second largest polluter of
freshwater resources on the planet (Conca, 2015).
The textile and apparel supply chain significantly contributes to global climate change,
mostly because its primary energy (mostly electricity) source is fossil fuels. From the report of
Intergovernmental Panel on Climate Change (IPCC, 2014), the electricity and heat production
sector account for 25% of global GHG emissions, which is the largest in comparison to any other
economic sector. Apart from water waste and toxicity from fertilizer, pesticides, herbicides, and
other pretreatment and finishing chemicals, converting raw fibers to finished apparel requires a
great deal of energy. This energy generation emits carbon dioxide (CO2), methane (CH4), and
2
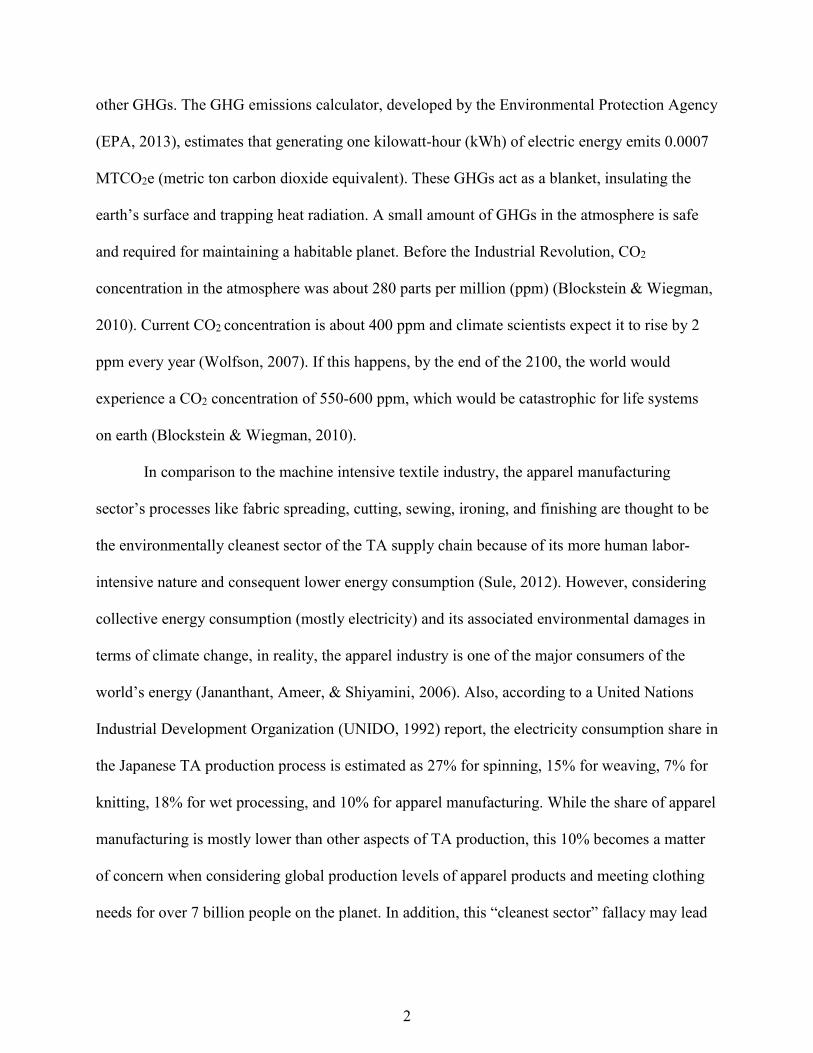
other GHGs. The GHG emissions calculator, developed by the Environmental Protection Agency
(EPA, 2013), estimates that generating one kilowatt-hour (kWh) of electric energy emits 0.0007
MTCO2e (metric ton carbon dioxide equivalent). These GHGs act as a blanket, insulating the
earth’s surface and trapping heat radiation. A small amount of GHGs in the atmosphere is safe
and required for maintaining a habitable planet. Before the Industrial Revolution, CO2
concentration in the atmosphere was about 280 parts per million (ppm) (Blockstein & Wiegman,
2010). Current CO2 concentration is about 400 ppm and climate scientists expect it to rise by 2
ppm every year (Wolfson, 2007). If this happens, by the end of the 2100, the world would
experience a CO2 concentration of 550-600 ppm, which would be catastrophic for life systems
on earth (Blockstein & Wiegman, 2010).
In comparison to the machine intensive textile industry, the apparel manufacturing
sector’s processes like fabric spreading, cutting, sewing, ironing, and finishing are thought to be
the environmentally cleanest sector of the TA supply chain because of its more human labor-
intensive nature and consequent lower energy consumption (Sule, 2012). However, considering
collective energy consumption (mostly electricity) and its associated environmental damages in
terms of climate change, in reality, the apparel industry is one of the major consumers of the
world’s energy (Jananthant, Ameer, & Shiyamini, 2006). Also, according to a United Nations
Industrial Development Organization (UNIDO, 1992) report, the electricity consumption share in
the Japanese TA production process is estimated as 27% for spinning, 15% for weaving, 7% for
knitting, 18% for wet processing, and 10% for apparel manufacturing. While the share of apparel
manufacturing is mostly lower than other aspects of TA production, this 10% becomes a matter
of concern when considering global production levels of apparel products and meeting clothing
needs for over 7 billion people on the planet. In addition, this “cleanest sector” fallacy may lead
3
scholars, policy makers, environmentalists, and governments to overlook the apparel industry’s
environmental impact. Perhaps this explains why there is a paucity of environmental research
focused on the apparel industry. The need for research is evident to understand better the
environmental impact of this sector.
The apparel industry is unique compared to other industries: it is the most geographically
dispersed as well as culturally diverse. Nearly every country in the world contributes to and
benefits from the global TA supply chain. Some nations are more involved in apparel production
while others are more involved in apparel consumption. The augmented demand from the ever-
increasing population and fast changing fashions makes this industry dynamic on a global scale,
attracting new apparel manufacturers intent on capturing a share of the growing market. New
manufacturers mean more apparel production, resulting in more environmental damage. In 2013,
among the 160 World Trade Organization (WTO) members, 83 members (including 28 countries
in the European Union) were actively involved in apparel production (World Trade
Organization, 2014). Therefore, the environmental footprint of apparel production is not only a
local problem, but also a global one.
Non-renewable sources of energy such as coal, used to generate electricity, are becoming
scarce (Robertson, 2014) and when coupled with the climate change realities linked to energy
consumption, the global energy crisis is becoming a more urgent topic. From the triple bottom
line (i.e., environment, economic, and social responsibility) perspective, the social responsibility
aspect of sustainability has garnered much attention, and improvements have been made within
the apparel manufacturing industry. However, there is a lack of information regarding
environmental consequences associated with apparel production. Across the board – designers,
manufacturers, contractors, retailers, and consumers – there is limited understanding about this
4
aspect of sustainability. Considering the lack of attention on environmental sustainability in the
apparel manufacturing along with the global climate change crisis, research regarding the
environmental impacts of clothing production is imperative.
Statement of the problem
In reality, the apparel industry’s emission of carbon dioxide has significant impact on
environmental degradation, and especially on climate change. According to Sule (2012), among
all apparel production processes (cutting, sewing, and finishing), the sewing process consumes
the largest amount of energy (49.8%) and is a significant contributor to environmental damages
including global warming potential (GWP 100), ozone layer depletion, and photochemical
oxidation.
With an intensified focus on the TA supply chain, overall sustainability in the last
decades, governments, retailers, brands, manufacturers, and individuals have become
increasingly aware of the necessity to reduce TA supply chain environmental footprints by
reducing GHG emissions. Considering this awareness, one would think there would be a plethora
of environmental research focusing on TA supply chain including the apparel industry. However,
the apparel industry’s energy consumption has not received much attention in comparison to that
of the textile industry. When analyzing the research literature base, it becomes evident that social
responsibility research received greater attention within the apparel industry. Likewise,
environmental aspects of consumers’ apparel purchase behavior have been the focus of many
studies. Though both apparel production and consumption contribute to environmental damage,
very little research has investigated the environmental impacts of apparel production. In order to
address the gap in the literature base, this study investigated the energy consumption and GHG
5
emissions associated with the sewing processes of the apparel industry as well as identified
practical pathways for increasing environmental sustainability within this sector.
Purpose of the study
It is evident that throughout the textile-apparel supply chain, the environmental
sustainability of apparel production processes so far has received limited attention. Without
filling this gap, it will not be possible to attain an overall sustainability within this supply chain.
However, it is nearly impossible to incorporate all the apparel production processes (e.g., cutting,
sewing, and packing) in a single study for environmental sustainability; therefore, this study will
focus on energy consumption and GHG emissions for different sewing operations in the apparel
manufacturing industry. The rationale behind conducting an environmental study focusing only
on the sewing process is that this process was determined to be the most energy intensive and
have the largest environmental footprint in comparison to other apparel production processes
such as cutting, finishing, etc. (Sivaramakrishnan, Muthuvelan, Ilango, & Alagarsamy, 2009;
Sule, 2012).
The purpose of this study is to capture a clear and comprehensive assessment of the
energy consumption associated with the sewing process. The goal is to develop an energy
consumption model through analyzing different sewing operations in the apparel industry. The
research objectives of this study are –
To identify most influential energy consumption factors of the sewing process in
apparel industry, and to develop a regression model to measure energy consumption.
To determine the interrelationships among energy consumption factors
To identify steps to reduce energy consumption within sewing process in apparel
industry, and
6
To explore the apparel industry experts’ level of concern regarding energy
consumption, the contribution to greenhouse gas emissions and climate change in the
apparel manufacturing.
Research reveals that the production and consumption of TA merchandise can cause a
great deal of damage to the environment. Though some researchers claim apparel production
process to be the cleanest process, some disagree (e.g., Sule, 2012). However, a wide body of
research regarding the environmental footprint of the apparel production process simply does not
exist, especially research that captures apparel industry experts’ voices on the energy
consumption and GHG emissions of the sewing process. Therefore, this study will develop a
proposed model of energy consumption and GHG emissions for the sewing process.
Conceptual Framework
Climate change is the result of the atmosphere’s increased heat radiation absorption, an
increase caused by GHG emissions. This study focused on CO2 emissions produced from
burning fossil fuels. Carbon dioxide is a significant GHG because of its global impacts and
higher rate of emission in our industrialized society in comparison to other GHGs.
According to Intergovernmental Panel on Climate Change (IPCC, 2007), by the end of
2100, the world will be 2° F to 11.5° F warmer than it was 100 years earlier. A small rise in the
temperature can cause great change. For example, if the earth becomes warmer by only 3-4° F,
20-30% of species will be at risk of extinction (Henson, 2011). Even if we stopped burning fossil
fuels (a significant source of GHG emissions) today, the world would still be at least 0.9°F
warmer because of the existing GHGs (Henson, 2011). In today’s world, burning fossil fuels is
the most established and depended-upon source of energy for the manufacturing industry, and
7
CO2 concentration has increased about 30-40% since the Industrial Revolution (Houghton,
2009). Similarly, burning fossil fuel is the only reliable energy source for the TA supply chain.
On a global scale, in 2008, 60 billion kg of textiles produced used one trillion kWh (kilowatt-
hour) of electric energy (Rupp, 2008).
The TA supply chain is energy intensive, requiring 10 times more energy to produce one
ton of textiles than does the production of one ton of glass (Draper, Murray, & Weissbrod, 2007).
Electricity is one of the most commonly used types of energy (Reddy & Ray, 2011) and one of
the key cost factors in the TA supply chain (Hasanbeigi, 2010). The International Energy Agency
(IEA, 2012) estimates that final energy consumption in the TA supply chain doubled from 47
Exajoule (EJ)/year to 90 EJ/year (1 EJ= 1012 MJ and 1 MJ = 0.28 kWh) between the years of
1971 and 2004 (as cited in Palamutcu, 2010).
Despite low technology and labor-intensive process (Scott, 2006), there are a number of
factors that affect the energy consumption and GHG emissions from sewing operations. Rogale,
Petrunic, Dragcevic, and Rogale (2005) identified various factors such as motor speed, seam
length, stitch density, and number of fabric layers as determinants of energy consumption for
sewing operations. However, there are numerous unexplored issues (e.g., energy efficiency of
the machine, productivity of the operator) as new machinery and new technology are emerging
daily in this dynamic industry. Based on investigating energy consumption factors, this study
proposes a model that might help apparel manufacturers determine the energy consumption of
the sewing process. Also part of this study is the incorporation of apparel industry experts’
responses through emerging qualitative approaches for curbing climate change issues.
8
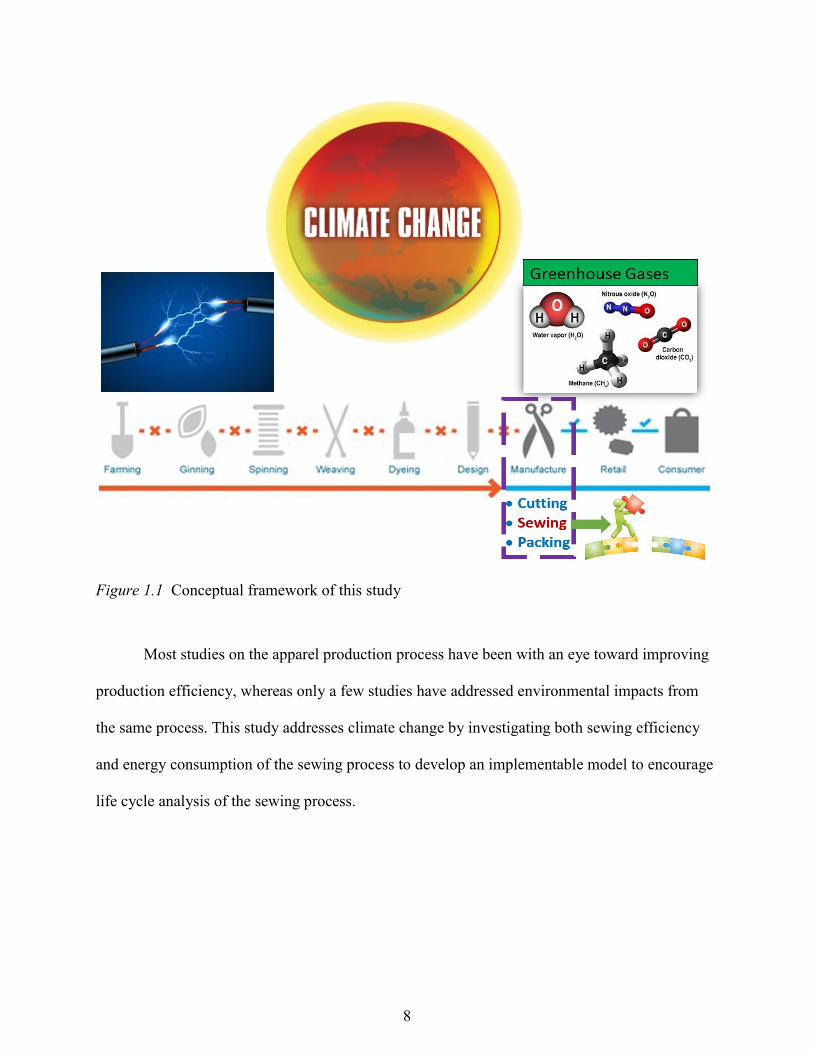
Figure 1.1 Conceptual framework of this study
Most studies on the apparel production process have been with an eye toward improving
production efficiency, whereas only a few studies have addressed environmental impacts from
the same process. This study addresses climate change by investigating both sewing efficiency
and energy consumption of the sewing process to develop an implementable model to encourage
life cycle analysis of the sewing process.
9
Significance of the study
The significance of this study is that it will enlighten apparel manufacturers about
different energy consumption factors as well as GHG emissions and will help them to analyze
and modify their processes to reduce emissions through conserve energy accordingly. In this age
of growing concern about global climate change, identifying a tool that reveals energy
consumption in the sewing process may bring greater attention to the environmental impact of
production. Companies that address environmental impacts from their processes will better meet
the growing demand in the marketplace. Additionally, Phylipsen et al. (2002) argued for using
energy consumption and efficiency comparisons as a tool within an industry to assess a
company’s performance relative to that of its competitors. Designers, retailers, and consumers
can then be better equipped to make sustainable sourcing decision and to purchase
environmentally friendly apparel.
Definition of Terms
To avoid confusion, definitions and delineations are provided for a number of terms that
are frequently used throughout this study.
Apparel manufacturing: Processes involved with merchandising, design, product development,
production, and wholesale marketing (Glock, 2005).
Apparel production: Garmenting process that includes fabric laying up, cutting, sewing,
cleaning with air suction, ironing, and transportation. This is a part of apparel manufacturing
process, which involves converting materials— including fabrics, findings, trims, and usually
thread— into a consumable good. Fabrics are cut, shaped, assembled, and trimmed as they are
converted into specific styles to meet customer needs.
10
Climate change: Climate change refers to any substantial changes in the measures of climate
(e.g., temperature, precipitation, or wind patterns, etc.) that occur over an extended period.
Energy consumption: Energy (mostly electricity) consumption measured in kilowatt-hour
(kWh) from running machinery, heating and cooling control systems, lighting, and operating
office equipment, etc., in the TA industry.
Greenhouse gas (GHG): Gases found in Earth’s atmosphere. GHGs include carbon dioxide
(CO2), methane (CH4), nitrous oxide (N2O), and fluorinated gases (Environmental Protection
Agency, 2013).
Sewing machine utilization percent: It refers to the time a sewing machine is actively used in a
sewing operation.
Sewing operation: The number of small tasks that make up the entire sewing process. This
number is dependent on a specific apparel style.
Specific energy consumption (SEC): Amount of consumed energy to produce one unit of
output.
Standard Allowed Minute (SAM): SAM is a unit that measures the amount of work to be done
by an operator in a sewing operation by the number of minutes in which it should be completed
(Solinger, 1988).
Stitch density: Denoted as the number of stitches per inch (SPI), which represents “the amount
of fabric that is advanced under the needle between penetrations” (Glock, 2005, p. 178).
Textile mill: Manufacturing facility where yarns and fabrics are produced.
Textile and apparel (TA) supply chain: “A series of interrelated activities which originates
with the manufacture of fiber and culminates in the delivery of a product into the hands of the
consumer” (Jones, 2006, p. 1).
11
Overview of the Dissertation
This research study is comprised of five chapters. Chapter 1 provides the background of
the study, statement of the problem, purpose of the study, definition of terms, significance of the
study, conceptual framework, and the assumptions of the study.
Chapter 2 presents a review of the literature, which includes research on climate change,
sustainability, greenhouse gases (GHGs), energy consumption in the textile and apparel (TA)
supply chain, various energy consumption factors within the apparel industry, and GHG
emissions from TA production.
Chapter 3 depicts the methodology used for this study including the sampling techniques,
data collection strategy, instrumentation, units of analysis, data collection, and data analysis
procedures for both qualitative and quantitative methods of inquiry.
Chapter 4 represents the findings and discussion of the study. It includes an introduction
to research participants, descriptive statistics, major findings and discussion of this study,
organized by each research question, to attain the four objectives mentioned above.
Chapter 5 summarizes the study and includes an integrated discussion drawn from
findings with implications for both academia and practitioner. It also presents the study’s
limitations and provides recommendations for further research.
12
Chapter 2 - Background Information and Literature
This chapter includes an overview of sustainability; a focused discussion regarding
environmental sustainability in terms of the textile and apparel supply chain; a summary of
scientific foundation of climate change in order to understand how energy consumption
contributes to greenhouse gas (GHG) emissions; and finally, an overview of key energy
consumption factors within sewing operations in the apparel industry.
Sustainability
Sustainability is so broad a topic that no single sufficient definition exists. However,
central to the concept is seeing and recognizing the cyclical, dynamic, and interdependent nature
of all parts and pieces of life (Robertson, 2014). It is also about becoming educated and involved
citizens of this living and changing world and determining what most needs to be done and what
we will do to take care of the planet and human systems from our individual corner of the world.
The United Nations’ World Commission on Environmental Development (WCED, 1987)
asserted that businesses and organizations valuing and desiring to practice sustainability should
consider balancing the triple bottom line – environment, economics, and social goals –while
simultaneously meeting present needs without compromising the ability for future generations to
meet their needs. This triple bottom line (TBL) is also sometimes referred to as the 3E’s
(environment, economics, and equity) (Edwards, 2005) or 3P’s (planet, profit, and people).
The first “P” represents the planet and the importance of restoring and preserving the
health of living systems. All life on planet earth depends on its complex ecosystem to purify
water and air, to pollinate crops, to provide foods, and to circulate the atmospheric gases,
chemical elements, and energy. Therefore, it is extremely important to maintain the Earth’s
ecosystems through the employment of environmental sustainability efforts. The second “P”
13
represents profit or economic growth and the belief that distribution of economic resources
should be equitable so that all humans can meet their basic needs. Meeting basic needs and
improving quality of life is sustainable, whereas unlimited economic growth is not (Daly &
Farley, 2011). Unlimited economic growth uses natural resources and pollutes air, water, and
soil, eventually leading to a decline in quality of life. The third “P” represents people, and more
specifically equity, social equity, or equality among people. Equity means freedom from
unhealthy living conditions and equal access to food, water, healthcare, education, etc. It also
means providing equal opportunity to all members of the society, not just a privileged few, to
grow and flourish in their own way (Edwards, 2005). This component of sustainability is
concerned with ensuring all people have fair quality of life.
The three related components of the TBL, if in good balance, can help a business become
more sustainable. Therefore, if a business entity implements the TBL with equal priority to each
component, it will move towards greater sustainability. The environmental aspect of
sustainability is about using renewable resources at a rate that they can be replenished and
available for future generations. This same is applicable to TA manufacturing. Environmental
sustainability in TA production means textiles are produced using raw materials, energy, and
other ingredients from renewable sources to preserve these existing resources and help future
generations to meet their needs. Sustainable fibers, which are produced from renewable sources
of raw materials, chemicals, energy, and other ingredients, play a big role in the TA industry’s
sustainability.
The dominant social paradigm puts emphasis on economics (e.g., perpetual growth,
financial business performance, etc.) and consequently, the TA supply chain addresses economic
growth through ‘the race to the bottom’. The impact of globalization and free trade on the TA
14
supply chain has led to the shifting of production sourcing from higher-wage countries to lower-
wage countries. In addition, after the phase out of the Multi-Fiber Agreement’s (MFA) quota
system for apparel in 2005, the TA supply chain entered into a fierce competition and all parties
involved in the global apparel market were seeking to display their products before customers at
the lowest price. In this intense competition of bottom price, outsourcing was a logical solution
for meeting low cost in operations, flexible production, and quick response to the changing
markets (Shelton & Wacher, 2005). Cheap labor, availability of skilled work force, and richness
of natural resources facilitate minimum operating cost. Outsourcing greatly increased
competition and created situations where companies and countries try to compete with each other
to survive in the market by cutting wages and weakening living standards for workers. These
situations are known as ‘the race to the bottom’ (Ross, 2002); apparel brands and vendors
(apparel manufacturers) are racing to source their products for the lowest price. These low prices
cause the overflow of apparel product in the market and creates unstainable demand to the
consumer.
Perry and Towers (2009) showed a connection between the rising demand for fashion
products with abusive social (e.g., forced labor, child labor, pregnant worker exploitation, gender
discrimination, and sexual harassment) and environmental practices. In terms of social abuses,
apparel industry workers are considered the most exploitable workers in the world (Bonacich,
1998). With the increasing public awareness and sense of social responsibility related to the
aforementioned social issues in the TA supply chain, governments (e.g., Bangladesh), brands
(e.g., Reformation, People Tree, Loomstate, Eileen Fisher, American Apparel, Amour Vert, etc.),
policy makers (e.g., Fair Labor Association), researchers (e.g., Hyllegard, Ogle, & Yan, 2009;
Strong ,1997), and customers have increasingly sought initiatives to curb these social abuses.
15
Therefore, the TA supply chain has made great strides in giving greater emphasis on social
responsibility. However, in comparison to both economic and social sustainability, there has
been less progress or less attention given to environmental sustainability, including climate
change issues facing the industry.
Climate Change and Greenhouse Gases (GHGs)
Climate is not weather. Weather is the short-term variations of temperature, precipitation,
and wind that occur day by day, whereas climate is long-term variation of these atmospheric
conditions measured over decades, centuries, or even longer periods (Intergovernmental Panel on
Climate Change [IPCC], 2007). Greenhouse gases (GHGs) have a significant impact on climate
change. Stated explicitly, with the increasing concentration of GHGs over time, the planet will
become warmer because GHGs trap heat radiation reflected by the Earth’s surface. Therefore,
climate change is the effect of GHG emissions (or, greenhouse effect) in the atmosphere through
warming the Earth and resultant wide-ranging impacts (e.g., rising sea levels, melting snow and
ice, more extreme heat events, fires and drought, and more extreme storms).
Based on the notion of increases in CO2 and other GHGs (e.g., methane, nitrous oxide,
ozone) atmospheric concentrations, the report of the IPCC (2007) revealed that by the end of
2100, the world would be 2° F to 11.5° F warmer than it was 100 years earlier. A small rise in
the temperature may cause great change in climate and the effects of rising temperature are
pervasive. Today, the world is experiencing numerous symptoms of climate change such as
changing ocean water salinity and temperature, more acidic seawater, rising sea levels,
decreasing differences between day and night time temperatures, increasing evaporation rate,
increasing intensity of hurricanes, melting polar icecaps, and overall warming of the Earth’s
surface (Robertson, 2014). From the report of the IPCC (2007), it was also found that the
16
average seawater level will rise by seven to 23 inches by the end of 2100. A small change in
ocean temperature could change the levels of marine planktons, tiny plants and animals on which
the ocean food system is dependent. If the planet becomes warmer by 3-4° F, 20-30% of species
will be at risk of extinction (Henson, 2011) and the effect of CO2 emissions into the environment
will be irreversible (Chestney, 2012). The damage level is so high that the world still would be at
least 0.9°F warmer in comparison to current temperature even if we stopped burning fossil fuels
tomorrow (Henson, 2011). This is because the existing GHGs are in play, acting as a warm
retainer, and their constant churning in the environment would result in this warming. This
churning could cause CO2 retention in the atmosphere for a century or more (Robertson, 2014).
The average Earth surface temperature is 59° F. If Earth had no atmosphere, all the light
coming from the sun would be reflected as infrared radiation and Earth’s surface temperature
would be 0° F (Wolfson, 2008). The earth, however, does have an atmosphere and the gases of
this environment absorb some of the infrared radiation, keeping it from escaping and producing a
warmer earth surface. These gases are called greenhouse gases (GHGs), as the process is similar
to how a greenhouse traps hot air, keeping it from escaping so that plants can grow even when
outside temperatures are low. GHGs trap infrared radiation and keep this radiated heat from
escaping, creating warmer temperatures that support life on earth.
Not all gases in the atmosphere have similar infrared radiation trapping capability.
Nitrogen (N2) and oxygen (O2) gases are diatomic or two-atom molecules and they are simple in
structure. They do not block much infrared radiation reflected from earth surface. Nitrous Oxide
(N2O), ozone (O3), carbon dioxide (CO2), and methane (CH4) are larger and more complex
molecules acting as GHGs. Among these, N2O, O3, and CO2 are triatomic or three-atom
molecules. They are complex in structure and can be rotated and oriented in different directions,
17
which causes significant infrared radiation blockage. Among them, CO2 was identified as a
highly significant GHG considering its drastic rate of emissions due to global industrialization
(National Aeronautics and Space Administration [NASA], 2016).
There are some other reasons for identifying CO2 as an especially threatening GHG. A
typical CO2 molecule remains in the atmosphere for at least five years (Wolfson, 2007). Fifty-
five percent of the CO2 humans put in the atmosphere is stored in the ocean and taken up by
plants and soil, and the remaining 45% stays in the atmosphere and mixes with preexisting CO2
(Henson, 2011). The amount of carbon dioxide emissions from natural sources is only
marginally predictable and not controllable (Salby, 2011). The current global average of CO2
concentration is 400 ppm (parts per million) and this concentration is rising by 2 ppm every year
(Wolfson, 2008). Adding CO2 to the air from any part of the world, it mixes with the air due to
constant churning of atmosphere and spreads globally. With the existing carbon cycle, CO2’s
impact remains for around 100 years (Wolfson, 2007). This means that releasing CO2 from one
part of the world becomes a global problem. It also means measuring CO2 concentration from
one region accurately represents average CO2 concentration globally. Conversely, reducing CO2
emissions from one region will positively affect the rest of the world.
According to National Aeronautics and Space Administration’s (2015) Global Climate
Change report, the temperature change in January 2015 was 0.87° C (or, 1.566 °F) against
399.96 ppm CO2 concentration measured over a one-year time period. The Intergovernmental
Panel on Climate Change (2007) concluded that there is a more than 90% probability that
human-produced GHGs (through various activities such as deforestation, industrialization,
burning fossil fuel) have caused today’s warmer planet over the last 50 years. If this happens in
same pattern over the next 50 years, we would see 550-600 ppm CO2 concentration by the end of
18
2100, which is high enough to be catastrophic to average global temperatures (Blockstein &
Wiegman, 2010).
Methane (CH4), another significant GHG, is produced when anaerobic bacteria digest
organic matters, emerging from decaying plant matters from marshes, landfills, sewage treatment
plants, and mining. The current atmospheric average of CH4 concentration is about 1800 ppb
(parts per billion) (Kump, Kasting, & Crane, 2010). The Intergovernmental Panel on Climate
Change developed a unit called Global Warming Potential (GWP), a relative measurement of
how much heat a GHG traps in the atmosphere, to compare strength among different GHGs. The
GWP of CO2 standardizes to one so that it compares the heat trapping ability by a certain mass of
other GHGs in relation to a similar mass of CO2. According to the Environmental Protection
Agency (EPA, 2013), CH4 has a GWP of 28, meaning that CH4 has 28 times stronger heat
trapping ability than that of CO2. On a molecule-for-molecule basis, CH4 is a far more active
greenhouse gas than CO2 (28 times stronger), but also one that is much less abundant in the
atmosphere (Robertson, 2014). Therefore, being the most prevalent GHG, CO2 draws all the
attention in discourse on climate change.
The major source of GHGs is from burning fossil fuels. Natural gas, oil, and coal are the
three types of fossil fuels. Natural gas and oil are fossilized marine plankton, and coal, the most
plentiful in nature, is fossilized terrestrial plant matter. They all are nonrenewable, one-time
energy sources. They cannot be regenerated, only depleted. Though coal is the most abundant in
nature, when burned it heavily pollutes the environment in comparison to oil and natural gas.
Burning coal emits CO2, mercury and generates carcinogens such as a variety of sulphur and
nitrogen oxides, which results in photochemical smog and acid rain (Martin & Griswold, 2009).
On the other hand, burning natural gas causes less environmental pollution (Randolph &
19
Masters, 2008). For today’s industries, including the TA supply chain, burning fossil fuels (and
most often, coal) is the most established and dependable source of energy; burning fossil fuels
emits a great deal of GHGs and hence, leads to severe climate change. Fossil fuels supply 87%
of global energy demands, and coal supplies nearly 30% of those energy demands (Institute for
Energy Research, 2013). Therefore, around 30- 40% of CO2 concentration increased after the
Industrial Revolution (Houghton, 2009). The apparel business is booming rapidly over last two
decades because of fast fashion, globalization, ease of cheap sourcing, and consumers’
unsustainable apparel consumption, and the supporting TA supply chain is growing
uncontrollably and hence becomes a source of substantial GHG emissions.
Energy Consumption in the Textile and Apparel (TA) Supply Chain
The TA supply chain has been identified as highly polluting compared to other
manufacturing industries (Challa, 2012). Sweeny (2015) identified it as the second most
polluting, after the oil industry. The environmental pollution of the TA supply chain is
significantly contributing to climate change issues and taking a vast toll on the planet. Most of
the TA products have a negative impact on the environment one way or another, through either
production, consumption, or clothing waste.
Electricity is the main energy component in the TA supply chain. The share or
consumption of energy varies from country to country because energy efficiency varies from
country to country (Martinez, 2010). A number of research studies have been completed based in
different countries, such as Turkey, China, India, Taiwan, the Netherlands, Iran, Greece,
Thailand, Germany, Columbia, Mauritius, Finland, Spain, Sri Lanka, and USA (e.g., Aranda-
Uson, Ferreira, Mainar-Toledo, Scarpellini, & Sastresa, 2012; Bhurtun, Kistamah, & Chummun,
2006; Hasanbeigi, 2010; Hasanbeigi, Hasanabadi, & Abdorrazaghi, 2012; Hong, Su, Lee, Hsu, &
20
Chen, 2010; Jananthant et al., 2006; Kalliala & Talvenmaa, 2000; Kim, Grady, & Hersh, 1983;
Kocabas, Yukseler, Dilek, & Yetis, 2009; Martinez, 2010; Ozturk, 2005; Palamutcu, 2010;
Palanichamy & Babu, 2005; Phylipsen, Blok, Worrell, & de Beer, 2002; Reddy & Ray, 2011;
Schönberger & Schäfer, 2003; Visvanathan, Kumar, Priambodo, & Vigneswaran, 1999;
Zabaniotou & Andreou, 2010). While it is important to understand energy consumption on a
country-to-country basis, GHG emissions are a global concern. Apart from country specific data,
some of the aforementioned studies captured process and sector specific energy information from
the TA supply chain. However, there are many unexplored issues particularly because new
machinery and new technology are emerging frequently in this supply chain.
With changes in technology and machinery, energy consumption and conservation
policies have evolved over time. Energy consumption patterns within industries have already
begun changing because of increased energy costs (International Energy Agency, 2012).
Government agencies and policy makers regulated firms to consume energy efficiently. To
improve energy efficiency levels, individual firm needs to track past trends in energy use,
assesses the factors that contribute to changes in energy intensity, and measures the performance
of energy-related policies (Reddy & Ray, 2011). With the increasing pressure to address energy
consumption in the industry one would think a plethora of research studies including journal
articles, conference proceedings, books, etc. would be available. Surprisingly, a limited number
of studies address TA supply chain energy issues, especially when compared to other energy
intensive industries such as steel/iron mill, cement industry, petro-chemical industry, etc. In light
of the ubiquitous nature of the TA supply chain discussed earlier in terms of employment
generation, global energy use, and economic impact there is an urgent need for TA supply chain
energy consumption research.
21
Most of the limited existing research has captured energy information from major sectors
of TA supply chain; these sectors are spinning, fabric production (knitting and weaving), wet
processing (dyeing and finishing), apparel manufacturing, etc. In this regard, several energy
analysis models were reported. Jebaraj and Iniyan (2006) attempted to understand and review the
various emerging issues related to energy modeling including: energy planning models, energy
supply-demand models, forecasting models, renewable energy models, emission reduction
models, optimization models, etc. The authors found that efficiency and cost factors were critical
parameters in the objective function formulation (energy conservation and GHG emissions
reduction); which is an attempt to express a business goal in term of decision analysis through
mathematical terms. Again, Phylipsen et al. (2002) argued that energy efficiency comparisons
could be used as a tool within the industry to assess a company’s performance relative to that of
its competitors. In contrast, monetary-units based energy analysis led to erroneous policy
implications because price related reasons affect the analysis without any real change in
efficiency (Martinez, 2010; Reddy & Ray, 2011). Volatility in currency conversion rate over
time may be another important reason for this. As mentioned earlier, the share or consumption of
energy differed by country to country due to varying energy efficiency in diverse industry
(Martinez, 2010). However, a few researchers have tried to provide information in terms of
energy cost instead of energy consumption from the textile mills. Researchers found that the
proportion of energy cost within total production cost is generally around 5-10% (Kiran-Ciliz,
2003), which devalued the importance of energy consumption reduction as well as the reduction
of GHG emissions. So, instead of monetary and energy efficiency based data, this study focuses
on energy consumption, especially energy consumption on a particular sector of the TA supply
chain.
22
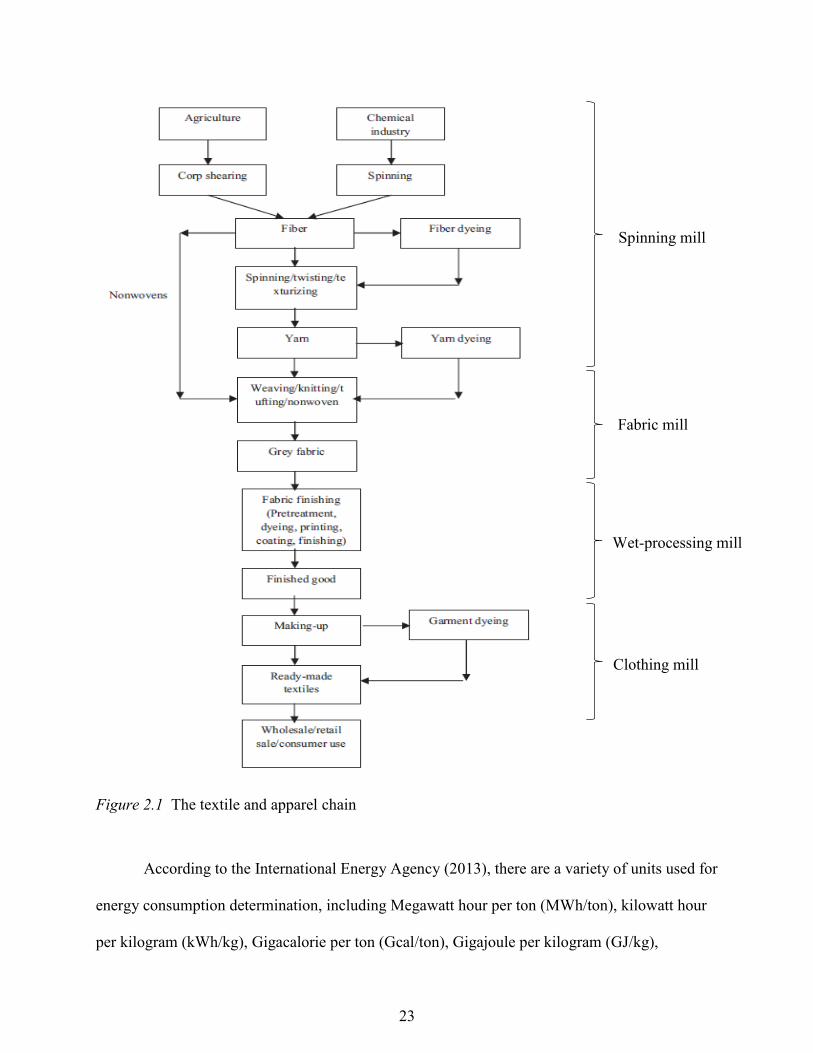
To understand the energy consumption of the TA production processes, it is important to
understand the TA supply chain. Figure 2.1 illustrates the typical textile and apparel chain, found
from the study of Schönberger and Schäfer (2003). It categorizes the entire textile-apparel supply
chain into four sub-sectors: spinning mill (to produce fiber and yarn), fabric mill, wet-processing
mill (to dye and finish fabrics and yarns), and apparel mill. The textile production starts with
fiber production and culminates in either grey fabric or finished fabric. Though the authors used
ready-made textiles under the apparel mill sub-sector, they actually referred to ready-made
garments as they indicated making-up process (which included cutting, sewing, and assembling)
before mentioning ready-made textiles. This study focused upon the making up process, more
specifically on sewing process.
23
Figure 2.1 The textile and apparel chain
According to the International Energy Agency (2013), there are a variety of units used for
energy consumption determination, including Megawatt hour per ton (MWh/ton), kilowatt hour
per kilogram (kWh/kg), Gigacalorie per ton (Gcal/ton), Gigajoule per kilogram (GJ/kg),
Spinning mill
Fabric mill
Wet-processing mill
Clothing mill
24
Gigacalorie per kilogram (Gcal/kg), Gigajoule per ton (GJ/ton), and Gigawatt hour per ton
(GWh/ton). Different researchers have used different consumption units. Using a unit converter
provided on the International Energy Agency website, one can convert these units into any
desired units. Also, during a review of energy consumption literature, the terms “energy
intensity” and “specific energy consumption” (SEC) were used to indicate how much energy is
consumed. SEC deals with energy units per kg of yarn produced (kWh/kg) or units per kg or
meter of fabric processed (kWh/m) or units per 1000 meters of fabric garmented (kWh/1,000m).
The International Energy Agency defined energy intensity as total primary energy consumption
per dollar of GDP. In addition, from the study of Hasanbeigi et al. (2012), energy intensity is
defined as:
Energy intensity= 𝐸𝑛𝑒𝑟𝑔𝑦 𝑐𝑜𝑛𝑠𝑢𝑚𝑝𝑡𝑖𝑜𝑛 (𝑘𝑊ℎ 𝑜𝑟 𝐺𝐽)
𝑃𝑟𝑜𝑑𝑢𝑐𝑡𝑖𝑜𝑛 𝑞𝑢𝑎𝑛𝑡𝑖𝑡𝑦 (𝑢𝑛𝑖𝑡 𝑜𝑓 𝑜𝑢𝑡𝑝𝑢𝑡) (1)
The rationale of focusing on energy consumption in the TA supply chain was supported
by the findings of several researchers. For instance, Palanichamy and Babu (2005) determined
that a 1% reduction in energy consumption could substantially reduce annual production costs in
the spinning mill and sewing thread industry in India. They have shown that equipment
operational changes, building structural modifications, changes in machinery accessories, and
steam heating in place of electrical heating could result in a consumption reduction of 171.10
kWh for every ton of produced textile product. Price, Wang, and Yun (2010) found that the
Chinese government’s goal regarding reducing energy consumption in top 1000 energy intensive
enterprises, including the TA supply chain, could contribute to somewhere between 10% and
25% of the savings required to achieve a 20% reduction in energy use per unit of GDP by 2010.
Reddy and Ray (2011) stated that between 1991 and 2005, cotton yarn had the highest increase
in emission compared to gray cloth, jute goods, and polyester chips production. This increase
25
was due to a transformation from a manual to intensive mechanization process of production
where fuel use is very high. They have found substantial improvements in energy consumption
in production of textiles (cloth and gray cloth) by changes in energy intensities and specific
energy consumption. Steinberger, Friot, Jolliet, and Erkman (2009) have found that a t-shirt
accounts for over 70% of the energy used and CO2 emissions in the consuming country, whereas
for a jacket, more than 70% of energy consumption and CO2 emissions occur in the producing
country. On the other hand, Zabaniotou and Andreou (2010) focused on the utilization of cotton
ginning waste for energy production as an alternative energy source in the TA industry.
Energy Consumption in Apparel Industry
Apparel or clothing production has been an important industrial activity for many nations
like Bangladesh, China, and Vietnam because of its contribution to their gross national products
(GDPs), employment rates, and export rates. This industry has become one of the major energy
consumers of the world (Jananthant et al., 2006). It uses energy for the production of garments,
thermal and visual comfort of the factory occupants, as well as maintenance purposes and office
equipment such as computers, printers, and photocopy machines. The energy consumed by the
apparel production division consists of large numbers of small-sized companies and their
employees in the overall textile mill, is not necessarily low compared to other sub-sectors, but
the share percentage of energy cost to the total cost (personnel cost + energy cost + material cost)
is relatively low ( United Nations Industrial Development Organization, 1992), which can be
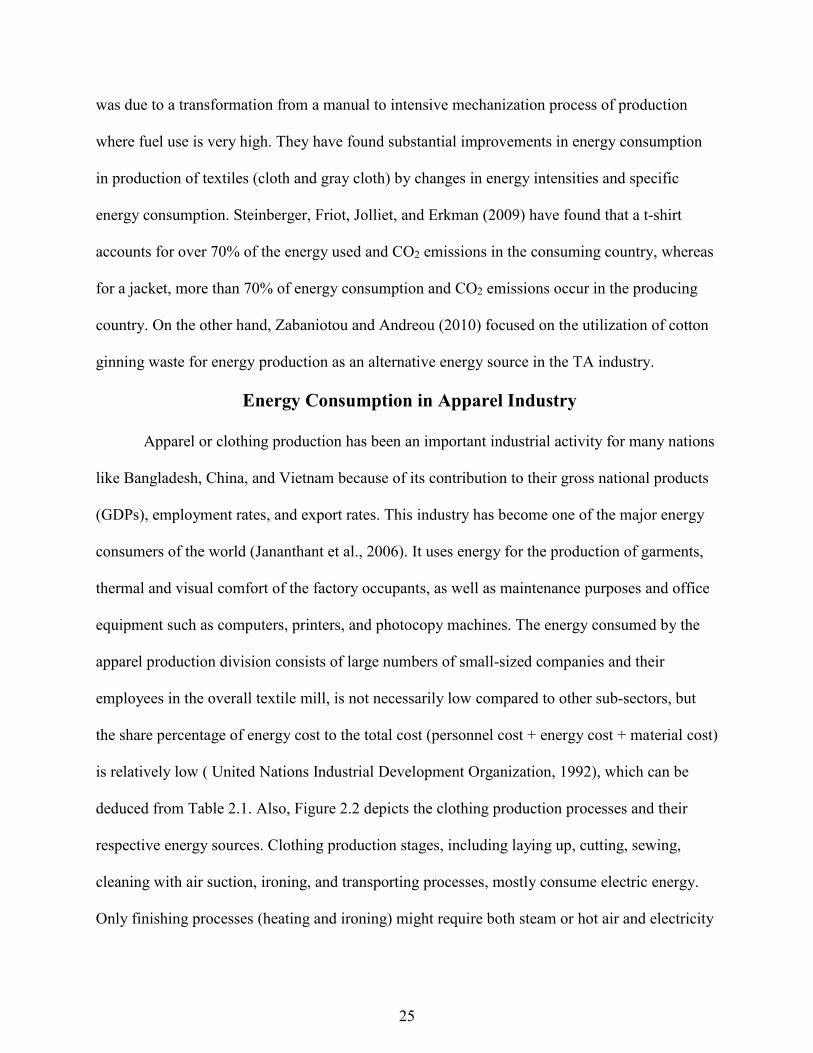
deduced from Table 2.1. Also, Figure 2.2 depicts the clothing production processes and their
respective energy sources. Clothing production stages, including laying up, cutting, sewing,
cleaning with air suction, ironing, and transporting processes, mostly consume electric energy.
Only finishing processes (heating and ironing) might require both steam or hot air and electricity
26
(Palamutcu, 2010). Palamutcu found that specific electric energy consumption of clothing
production plants varied between 0.065 and 0.195 kWh/kg for actual SEC and 0.07 - 0.09
kWh/kg for estimated SEC (see Figure 2.3). Possible differences in product properties of fabric
weight, product type and model, production quantity, and machine efficiency may explain the
varying actual SEC values year round. Sivaramakrishnan, Muthuvelan, Ilango, and Alagarsamy
(2009) have studied process based energy consumption for woven apparel production and knit
apparel production. As shown in Table 2.2 and Table 2.3, knit apparel production (73 kWh)
consumes less energy than woven apparel production does (96 kWh). The machine intensive
nature to produce woven fabric is the most probable reason that woven garment production
consumes more energy.
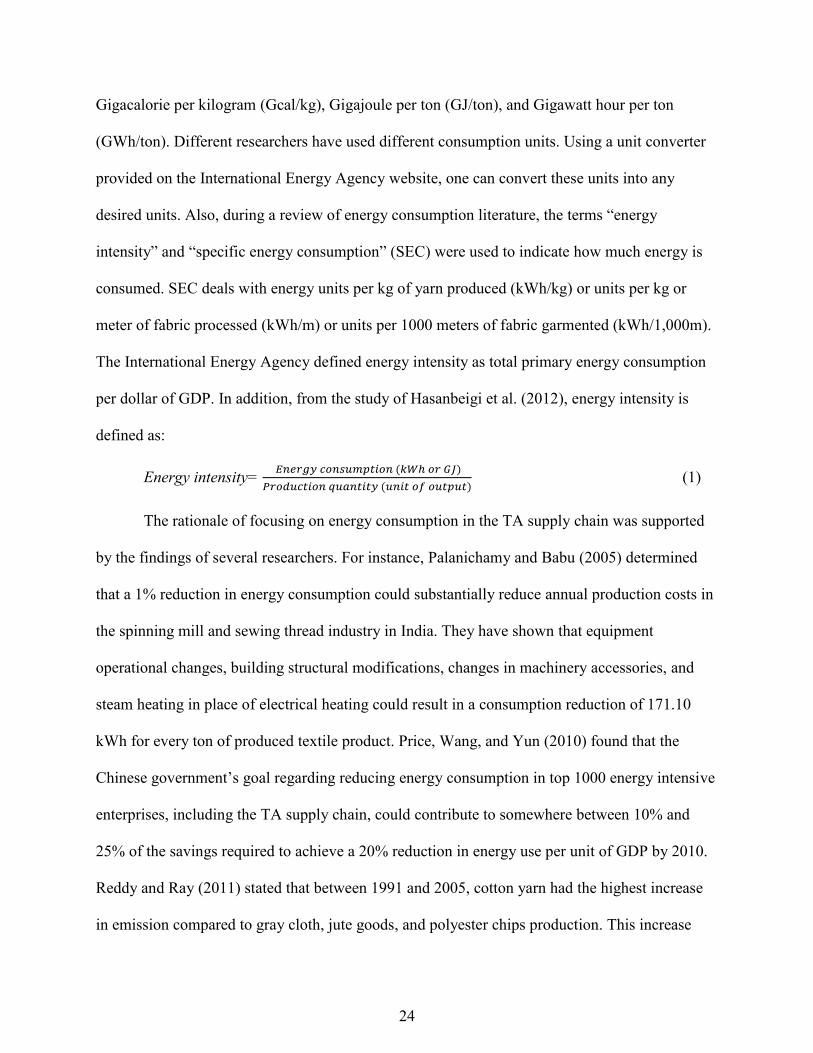
Table 2.1
Energy Cost (in Million Yen) and its Share in the Total Production Cost
Year
Fiber Production Spinning Fabric Production Dyeing Clothing Manufacturing
Energy Cost
Total Cost
Share %
Energy Cost
Total Cost
Share %
Energy Cost
Total Cost
Share %
Energy Cost
Total Cost
Share %
Energy Cost
Total Cost
Share %
1969 2.8 33.3 8.41% 2.1 80.5 2.61% 1.3 67.8 1.92% 4.7 66.1 7.11% 0.8 68.7 1.16%
1973 4.1 57.9 7.08% 1.8 74.8 2.41% 1.2 66.7 1.80% 4.2 64 6.56% 0.8 65.2 1.23%
1977 10.3 84.8 12.15% 4.2 83 5.06% 2.7 66.3 4.07% 9 70.6 12.75% 1.1 66.8 1.65%
1981 12.6 81.6 15.44% 6.2 81.8 7.58% 3.8 63.4 5.99% 12.8 67.7 18.91% 1.6 64.5 2.48%
1985 10.2 77.3 13.20% 5.6 79.2 7.07% 3.8 66.1 5.75% 10.7 67.2 15.92% 1.4 64.8 2.16%
1989 5.3 61.2 8.66% 5.3 77.7 6.82% 3.1 62.4 4.97% 5.5 60.1 9.15% 1.1 59.1 1.86%
Source: United Nations Industrial Development Organization, 1992
Figure 2.2 Clothing manufacturing process and energy use ( United Nations Industrial
Development Organization, 1992)
Inspection Spreading
•Electricity
Marking
•Electricity
Cutting
•Electricity
Sewing
•Electricity
Finishing
•Electricity and steam
27
Figure 2.3 Comparison of actual and estimated SEC values of clothing production plant
(Palamutcu, 2010).
Table 2.2
Energy Consumption in Knitted Garment Division (250,000 pieces /month)
Process Energy Consumption (kWh) Percent on total Energy
Consumption
Garmenting machine 23 31.5
Compressor 10 13.7
Lighting 19 26
Finishing 21 28.8
Total 73 100
28
Table 2.3
Energy Consumption in Woven Garment Division (50,000 pieces /month)
The finishing process in the garment division holds second position in terms of energy
consumption. Bhurtun et al. (2006) determined specific electric energy for clothing production as
0.80 – 1.00 kWh/kg. They did not explain how they determined per kg energy consumption
instead of pieces/month based energy consumption. Furthermore, a department-specific and
equipment-specific energy consumption share for the apparel industry was determined in the
study of Jananthant et al. (2006). They did not provide any SEC information for the apparel
industry. Their study (see Table 2.4) found that the sewing department shared the highest energy
consumption followed by the cutting department for six factories (F1 to F6). In addition, as
shown in Table 2.5, air conditioning equipment consumed the largest amount of energy (46%)
whereas sewing machine consumed only 19%. Uses of energy differs from factory to factory as
each factory produces different types of garments with different types of fabric.
Process Energy Consumption (kWh) Percent on total Energy
Consumption
Laying, Cutting and
Sewing (150 machines) 45 46.9
Lighting 17 17.7
Finishing 34 35.4
Total 96 100
29
Table 2.4
Comparison of Energy Consumption – Functional area (or, Department specific)
Departments
Energy consumption (%)
F1 F2 F3 F4 F5 F6 Average
Sewing 64 51 41 48 51 65 53.33
Cutting 6 33 29 17 19 17.5 20.25
Finishing 8 7 2 3 8 1.5 4.92
Packing/Store 7 2 9 6 5 1.25 5.04
Office area 12 5 3 5 6 6.75 6.29
Other 3 2 16 21 6 8 9.33
Source: Jananthant et al., 2006
Table 2.5
Comparison of Energy Consumption – by the types of equipment
Equipment Energy consumption (%)
F1 F2 F3 F4 F5 F6 Average
Air conditioning 51 44 45 42 45 50 46
Lighting 26 16 22 17 25 16 20
Sewing machines 12 13 21 24 17 26 19
Pumps and
Fans/blowers 5 6 2 3 2 1.5 3
Compressor 4 4 5 9 7 3.5 5
Other equipment 2 2 4 5 1 3 3
Source: Jananthant et al., 2006
Apparel industry is low technology and labor-intensive (Scott, 2006), and the production
process of apparel differs from style to style, country to country, and culture to culture. In
addition, time and energy consumption vary significantly, depending on complexity of design
30
and fabric selection. Total monthly production quantity of a heavy terry towel sewing process
may increase (because of simple sewing process), whereas production may decrease for a time
consuming sewing process of a lightweight silk dress. Apart from this, 20-30% of sewing time is
made up of machine-hand sub-operations (i.e., operations using the machine), whereas the
remaining 70-80% is done by hand (Cooklin, 2006; Rogale et al., 2003). Furthermore, reworking
garments that did not meet quality standards the first time consumes additional energy and time
without further contribution to the manufactured quantity. This might be another important
reason for variations in energy consumption througout the apparel industry (Palamutcu, 2010).
In terms of energy conservation in the apparel industry, several considerations are
needed, including: efficient use of finishing and lighting (e.g., the use of a servo stabilizer in the
lighting circuit, high efficient fluorescent tubes, reflectors and electronic ballasts); maintaining
optimum height for fittings; and in some cases, improved work methods and practices
(Sivaramakrishnan et al., 2009). Additional recommendations included: checking for compressed
air leakages; insulation replacement of inefficient magnetic ballasts with efficient electronic
ballasts; checking the steam leakages in boilers; and introducing good movement and thermal
sensors in the air-conditioning systems (Jananthant et al., 2006).
Greenhouse Gas (GHG) Emissions from Textile and Apparel Production
The TA supply chain is identified as one of the leading contributors to GHG emissions
and accounts for nearly 10% of total global carbon emissions (Conca, 2015). Some large retailers
(e.g., Marks & Spencer, Nike) measure their carbon footprints as a step to reduce GHG
emissions (Eryuruk, 2012). Figure 2.4 shows Eryuruk’s (2012) textile product life cycle and its
environmental impact. Additionally, Figure 2.5 depicts the Business for Social Responsibility’s
(BSR, 2009) percentages of GHG emissions for the entire supply chain of all clothing types.
31
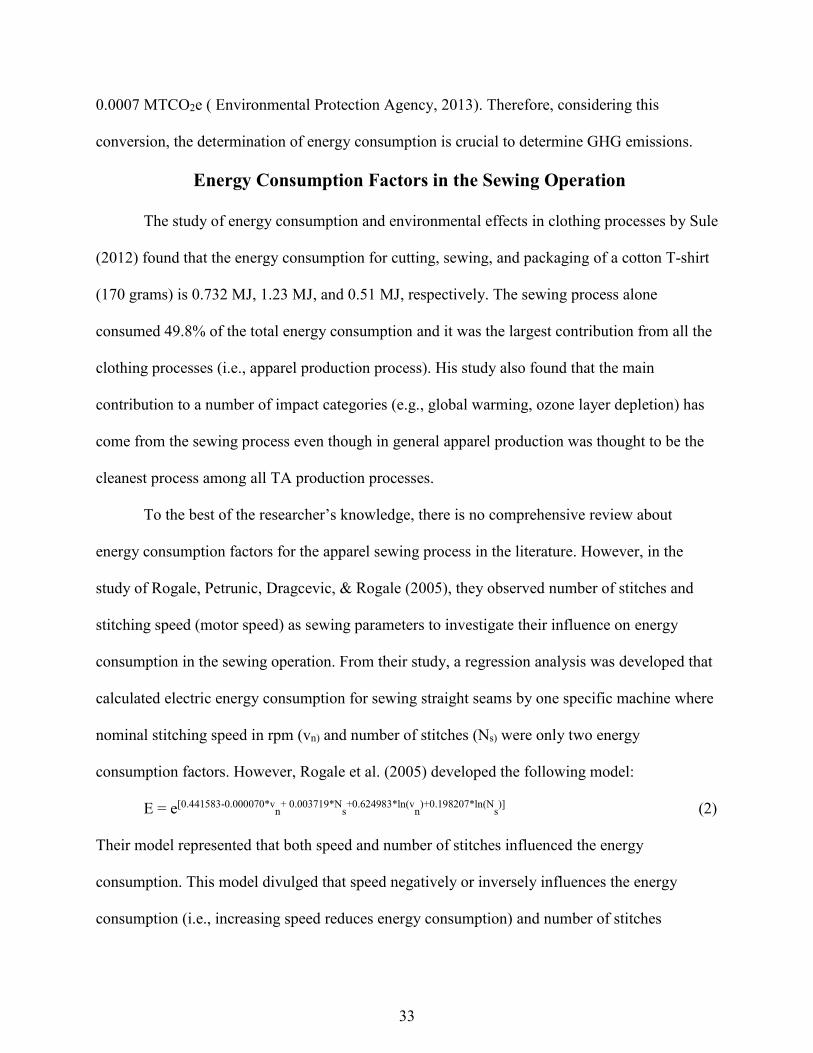
BSR also performed a comparative study between energy consumption and GHG emissions of
denim apparel (Figure 2.6).
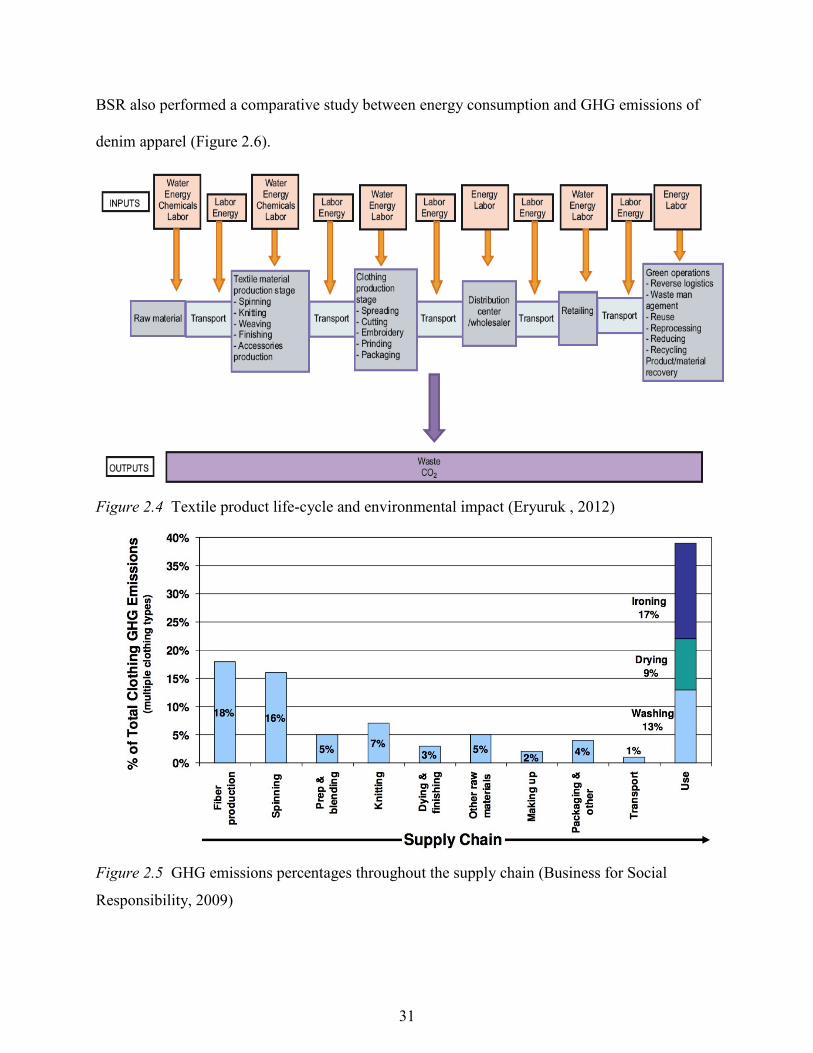
Figure 2.4 Textile product life-cycle and environmental impact (Eryuruk , 2012)
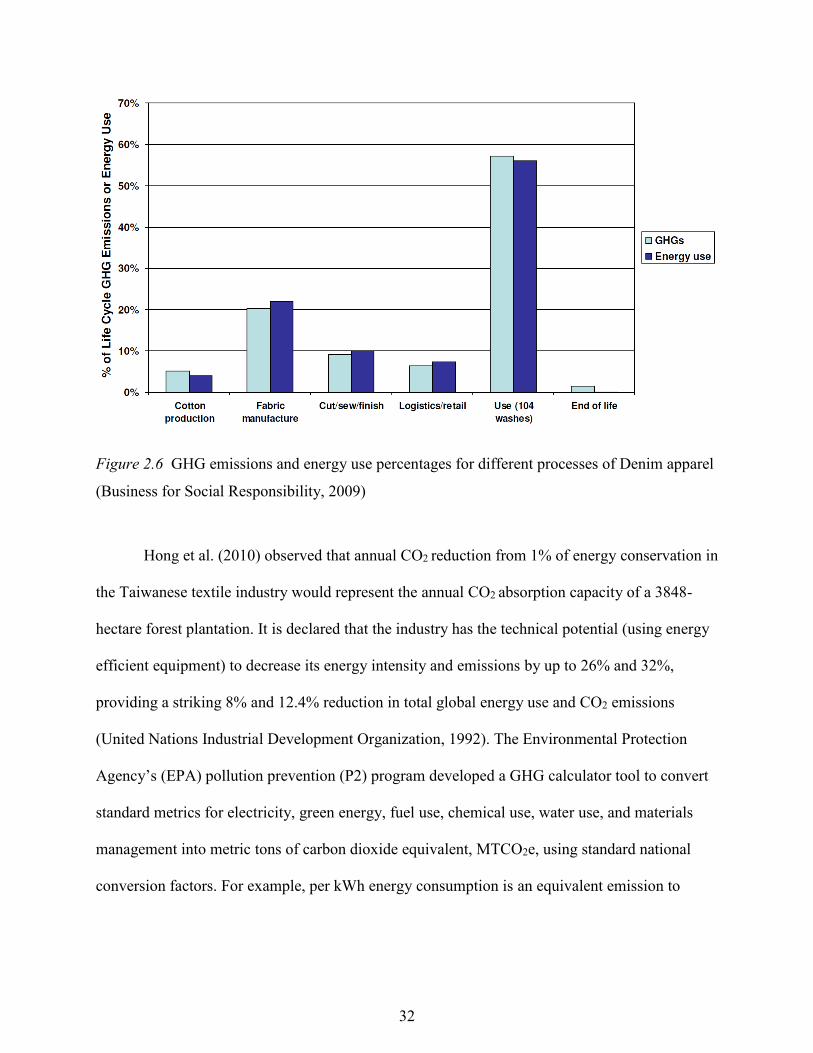
Figure 2.5 GHG emissions percentages throughout the supply chain (Business for Social
Responsibility, 2009)
32
Figure 2.6 GHG emissions and energy use percentages for different processes of Denim apparel
(Business for Social Responsibility, 2009)
Hong et al. (2010) observed that annual CO2 reduction from 1% of energy conservation in
the Taiwanese textile industry would represent the annual CO2 absorption capacity of a 3848-
hectare forest plantation. It is declared that the industry has the technical potential (using energy
efficient equipment) to decrease its energy intensity and emissions by up to 26% and 32%,
providing a striking 8% and 12.4% reduction in total global energy use and CO2 emissions
(United Nations Industrial Development Organization, 1992). The Environmental Protection
Agency’s (EPA) pollution prevention (P2) program developed a GHG calculator tool to convert
standard metrics for electricity, green energy, fuel use, chemical use, water use, and materials
management into metric tons of carbon dioxide equivalent, MTCO2e, using standard national
conversion factors. For example, per kWh energy consumption is an equivalent emission to
33
0.0007 MTCO2e ( Environmental Protection Agency, 2013). Therefore, considering this
conversion, the determination of energy consumption is crucial to determine GHG emissions.
Energy Consumption Factors in the Sewing Operation
The study of energy consumption and environmental effects in clothing processes by Sule
(2012) found that the energy consumption for cutting, sewing, and packaging of a cotton T-shirt
(170 grams) is 0.732 MJ, 1.23 MJ, and 0.51 MJ, respectively. The sewing process alone
consumed 49.8% of the total energy consumption and it was the largest contribution from all the
clothing processes (i.e., apparel production process). His study also found that the main
contribution to a number of impact categories (e.g., global warming, ozone layer depletion) has
come from the sewing process even though in general apparel production was thought to be the
cleanest process among all TA production processes.
To the best of the researcher’s knowledge, there is no comprehensive review about
energy consumption factors for the apparel sewing process in the literature. However, in the
study of Rogale, Petrunic, Dragcevic, & Rogale (2005), they observed number of stitches and
stitching speed (motor speed) as sewing parameters to investigate their influence on energy
consumption in the sewing operation. From their study, a regression analysis was developed that
calculated electric energy consumption for sewing straight seams by one specific machine where
nominal stitching speed in rpm (vn) and number of stitches (Ns) were only two energy
consumption factors. However, Rogale et al. (2005) developed the following model:
E = e[0.441583-0.000070*vn
+ 0.003719*Ns+0.624983*ln(v
n)+0.198207*ln(N
s)] (2)
Their model represented that both speed and number of stitches influenced the energy
consumption. This model divulged that speed negatively or inversely influences the energy
consumption (i.e., increasing speed reduces energy consumption) and number of stitches
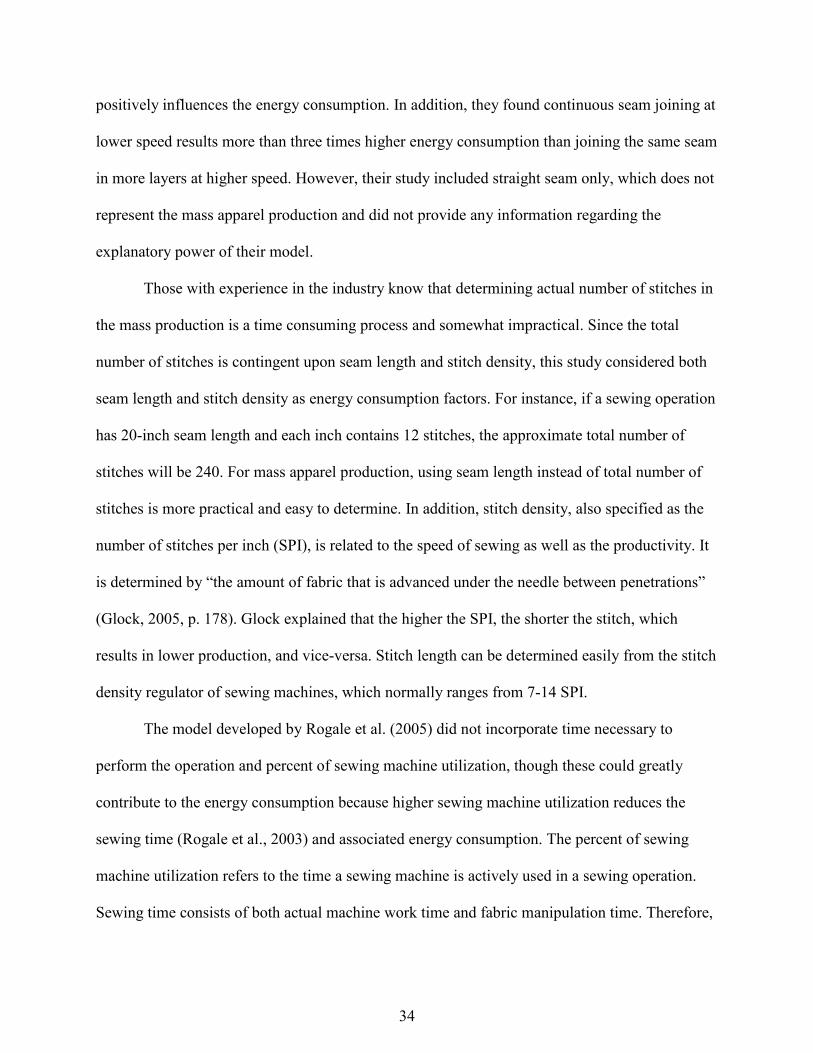
34
positively influences the energy consumption. In addition, they found continuous seam joining at
lower speed results more than three times higher energy consumption than joining the same seam
in more layers at higher speed. However, their study included straight seam only, which does not
represent the mass apparel production and did not provide any information regarding the
explanatory power of their model.
Those with experience in the industry know that determining actual number of stitches in
the mass production is a time consuming process and somewhat impractical. Since the total
number of stitches is contingent upon seam length and stitch density, this study considered both
seam length and stitch density as energy consumption factors. For instance, if a sewing operation
has 20-inch seam length and each inch contains 12 stitches, the approximate total number of
stitches will be 240. For mass apparel production, using seam length instead of total number of
stitches is more practical and easy to determine. In addition, stitch density, also specified as the
number of stitches per inch (SPI), is related to the speed of sewing as well as the productivity. It
is determined by “the amount of fabric that is advanced under the needle between penetrations”
(Glock, 2005, p. 178). Glock explained that the higher the SPI, the shorter the stitch, which
results in lower production, and vice-versa. Stitch length can be determined easily from the stitch
density regulator of sewing machines, which normally ranges from 7-14 SPI.
The model developed by Rogale et al. (2005) did not incorporate time necessary to
perform the operation and percent of sewing machine utilization, though these could greatly
contribute to the energy consumption because higher sewing machine utilization reduces the
sewing time (Rogale et al., 2003) and associated energy consumption. The percent of sewing
machine utilization refers to the time a sewing machine is actively used in a sewing operation.
Sewing time consists of both actual machine work time and fabric manipulation time. Therefore,
35
sewing machine utilization refers to the ratio of actual machine work time to sewing time. In this
study, the percent of sewing machine utilization was considered as energy consumption factor
and its influence over the energy consumption of apparel sewing operation was evaluated.
Standard Allowed Minute (SAM), also known as Standard Minute Value (SMV), is an
industry term representing the time necessary to finish a sewing operation or a garment.
Therefore, energy consumption can be coupled with the SAM. SAM is a unit that measures the
amount of work to be done by an operator in a sewing operation by the number of minutes in
which it should be completed (Solinger, 1988). For example, if the SAM of a sewing operation
(e.g., bottom hemming) of t-shirt is two, this operation should take two minutes to complete.
SAM could represent standard assembling time for a whole garment or a particular sewing
operation. In case of whole garment, SAM represents number of operation and the summation of
each operation’s SAM. Different garments have different SAM in terms of different number of
operations and their respective SAM. Since SAM deals with the time required for sewing
operations in the apparel industry as well as the productivity (Babu, 2012), it could be considered
an important energy consumption factor for the apparel industry. It is predictable that a higher
SAM results in higher energy consumption as well as greater GHG emissions unless this SAM
contains extremely high material handling time or fabric manipulation time. However, no study
was found which represented the influence of SAM on energy consumption; instead, the focus
was on its contribution to productivity. In this study, both number of sewing operations and
SAM was considered as factors to evaluate their contribution to the energy consumption.
SAM can be measured through employing the time study engineering tool or using the
general sewing data (GSD) software. According to General Sewing Data Limited (1990) student
manual, GSD software assigns codes for every commonly occurring human motion in the sewing
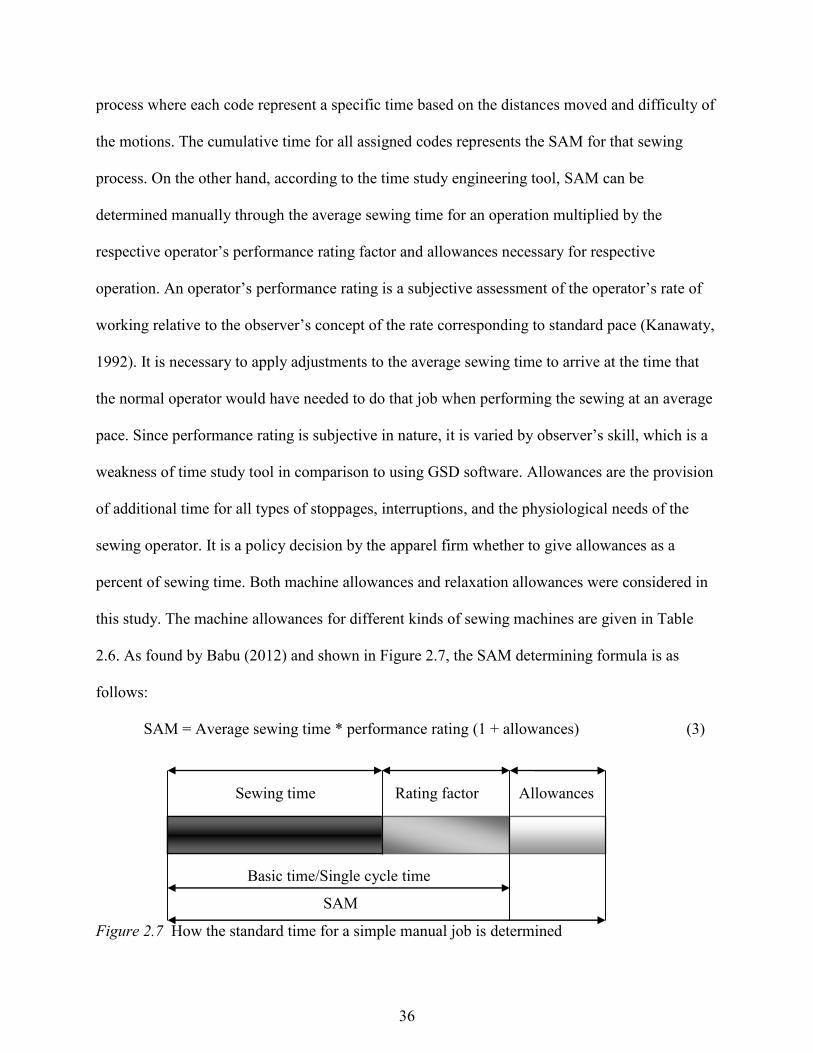
36
process where each code represent a specific time based on the distances moved and difficulty of
the motions. The cumulative time for all assigned codes represents the SAM for that sewing
process. On the other hand, according to the time study engineering tool, SAM can be
determined manually through the average sewing time for an operation multiplied by the
respective operator’s performance rating factor and allowances necessary for respective
operation. An operator’s performance rating is a subjective assessment of the operator’s rate of
working relative to the observer’s concept of the rate corresponding to standard pace (Kanawaty,
1992). It is necessary to apply adjustments to the average sewing time to arrive at the time that
the normal operator would have needed to do that job when performing the sewing at an average
pace. Since performance rating is subjective in nature, it is varied by observer’s skill, which is a
weakness of time study tool in comparison to using GSD software. Allowances are the provision
of additional time for all types of stoppages, interruptions, and the physiological needs of the
sewing operator. It is a policy decision by the apparel firm whether to give allowances as a
percent of sewing time. Both machine allowances and relaxation allowances were considered in
this study. The machine allowances for different kinds of sewing machines are given in Table
2.6. As found by Babu (2012) and shown in Figure 2.7, the SAM determining formula is as
follows:
SAM = Average sewing time * performance rating (1 + allowances) (3)
Sewing time Rating factor Allowances
Basic time/Single cycle time
SAM
Figure 2.7 How the standard time for a simple manual job is determined
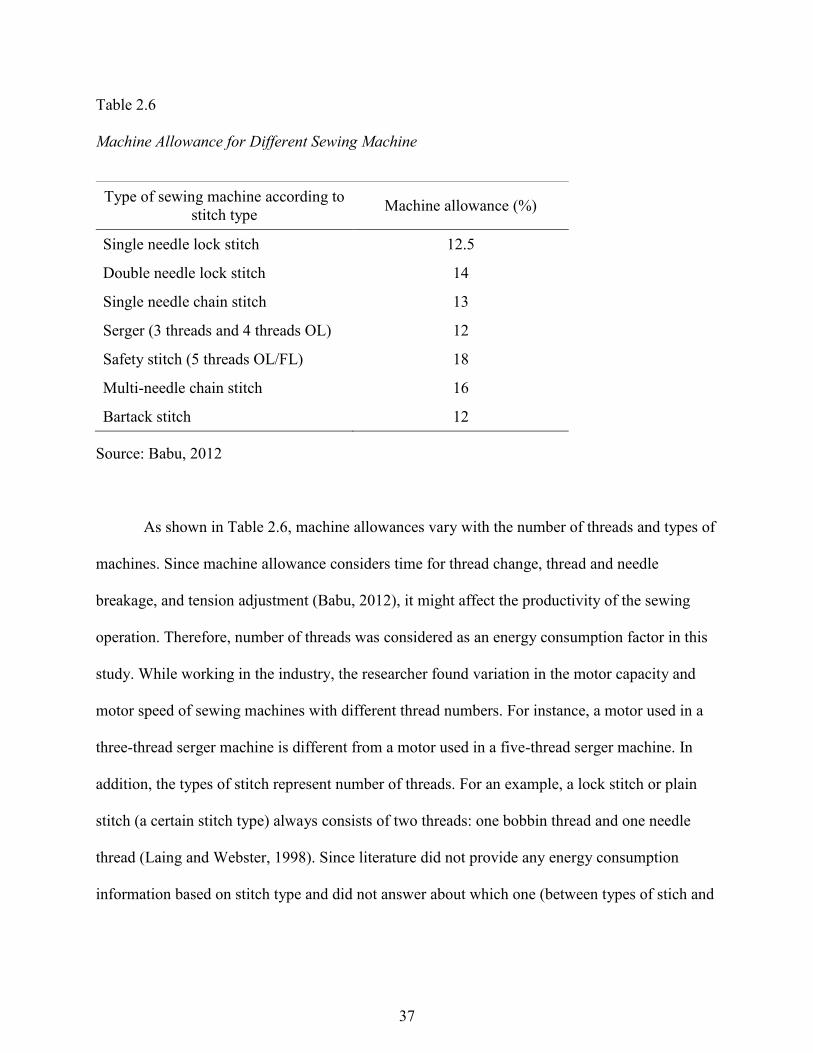
37
Table 2.6
Machine Allowance for Different Sewing Machine
Source: Babu, 2012
As shown in Table 2.6, machine allowances vary with the number of threads and types of
machines. Since machine allowance considers time for thread change, thread and needle
breakage, and tension adjustment (Babu, 2012), it might affect the productivity of the sewing
operation. Therefore, number of threads was considered as an energy consumption factor in this
study. While working in the industry, the researcher found variation in the motor capacity and
motor speed of sewing machines with different thread numbers. For instance, a motor used in a
three-thread serger machine is different from a motor used in a five-thread serger machine. In
addition, the types of stitch represent number of threads. For an example, a lock stitch or plain
stitch (a certain stitch type) always consists of two threads: one bobbin thread and one needle
thread (Laing and Webster, 1998). Since literature did not provide any energy consumption
information based on stitch type and did not answer about which one (between types of stich and
Type of sewing machine according to
stitch type Machine allowance (%)
Single needle lock stitch 12.5
Double needle lock stitch 14
Single needle chain stitch 13
Serger (3 threads and 4 threads OL) 12
Safety stitch (5 threads OL/FL) 18
Multi-needle chain stitch 16
Bartack stitch 12
38
number of threads) could be a better energy consumption factor, the researcher decided to
investigate both as factors in this study.
Rogale et al. (2005) identified number of fabric layers as an energy consumption factor.
They found that the sewing machine consumes 2.7% more energy when the number of fabric
layers increase from a single layer to four layers with the same RPM. Ideally, each operation
consists of different fabric layers. For instance, the shoulder joint operation for a dress shirt
consists of three layers of fabric whereas the same operation for a t-shirt consists of two layers of
fabric. The dynamic interaction between the fabric and the sewing machine is important to
ensure the correct production with right quality. In this context, fabric thickness could be another
factor that deals with the energy consumption in the sewing operation of the apparel industry.
With the appropriate feed mechanism and right thread, needle size, and sewing speed, increasing
fabric thickness leads to higher friction between fabric and pressure foot, requires high needle
penetration force to sew (Clapp, Little, Thiel, & Vass, 1992; Hayes & Mcloughlin, 2013),
influence the productivity and hence, might contribute to energy consumption. The thickness of
each layer of fabric represented the total fabric thickness and hence, the number of fabric layers
represents total fabric thickness and vice-versa. Therefore, both layers of fabric and fabric
thickness considered as one energy consumption factor in this study.
Regardless of the industry, the industrial motor uses a significant fraction of total
industrial energy consumption. It is evident that electric motors are generally responsible for
about 67% of industrial power consumption in each nation and about 40% of overall power
consumption (Asia-Pacific Economic Cooperation [APEC], 2008, as cited in Saidur, 2010). This
scenario is not different for the apparel industry. Jananthant et al. (2006) revealed that sewing
departments shared the highest energy consumption followed by cutting departments in their
39
analysis of six apparel firms. Since the sewing operation is a machine-man operation, sewing
machines are the major energy consumer in the apparel sewing process. For the apparel industry,
there is a great diversity of sewing machines in order to perform numerous sewing operations.
The motor is the only part that uses electric energy unless there are no energy-consumption
working aids such as additional light and compressed air. Work aids are devices built into
machines or added to the sewing machine to improve productivity, quality standards, and
minimize sewing operators’ fatigue (Tyler, 2008). The horsepower (HP) or Watt unit used to
represent electrical sewing machine’s motor capacity or motor power defines how much energy
it will consume. The nameplate on the electrical motors represents their power and RPM (e.g., ½
HP and 3450 RPM). Rogale et al. (2003) provides detailed information regarding motor power of
sewing machine and its rotation/revolution per minute (RPM) or main shaft rotation/motor
speed. They have found that the sewing motor is constantly under tension and continuously
consumes electric energy, whether in active-use mode or not.
Volume of output per unit time also directly affects the productivity. Since Specific
Energy Consumption (SEC) for the apparel industry deals with energy units per operation or per
number of apparel garments produced and is a measurement of productivity (Bheda, Narag, &
Singla, 2003; Glock, 2005), volume of output per hour is an important energy consumption
factor for the apparel industry (Rogale et al., 2003). However, some researchers (e.g., Raggi &
Barbiroli, 1992; Reitler, Rudolph, & Schaefer, 1987) directly referred to the production quantity
as an important energy consumption factor. It was conceivable that a higher volume of output per
hour will result in less average energy consumption than a lower volume of output per hour. In
addition, a similar term – energy productivity index (the ratio between value of output to value of
energy input) – was found in the study of Juan (1998) to describe productivity as the factor of
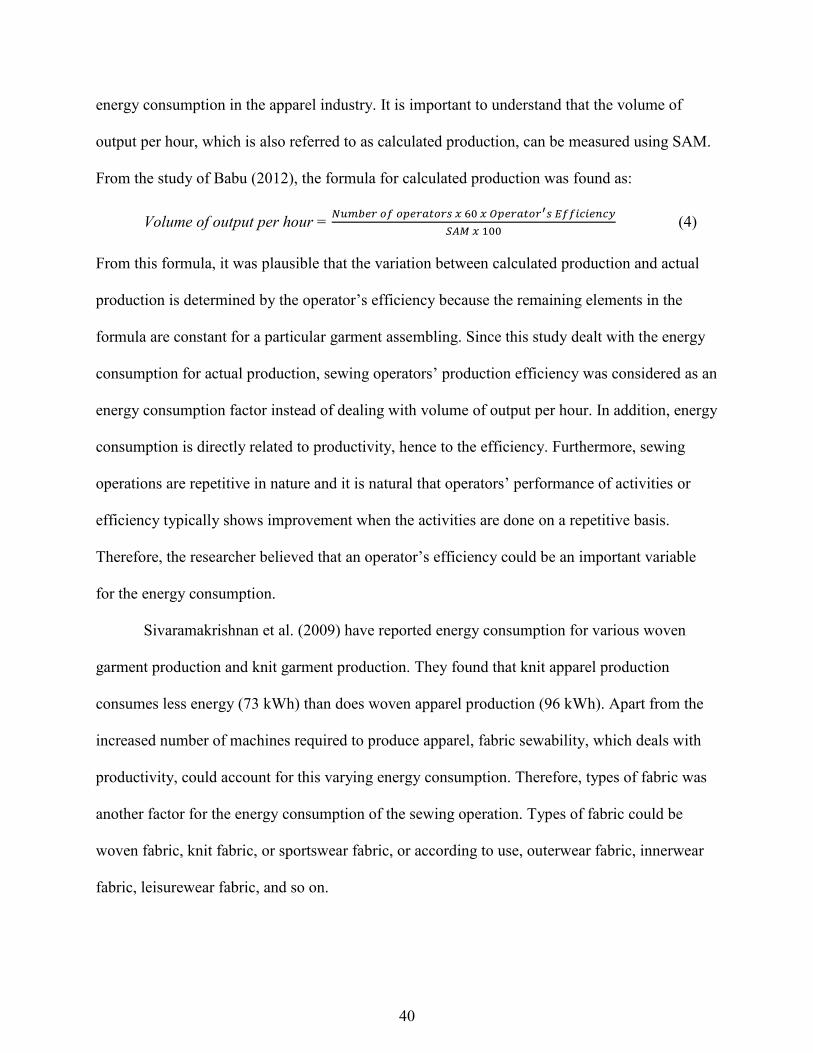
40
energy consumption in the apparel industry. It is important to understand that the volume of
output per hour, which is also referred to as calculated production, can be measured using SAM.
From the study of Babu (2012), the formula for calculated production was found as:
Volume of output per hour = 𝑁𝑢𝑚𝑏𝑒𝑟 𝑜𝑓 𝑜𝑝𝑒𝑟𝑎𝑡𝑜𝑟𝑠 𝑥 60 𝑥 𝑂𝑝𝑒𝑟𝑎𝑡𝑜𝑟′𝑠 𝐸𝑓𝑓𝑖𝑐𝑖𝑒𝑛𝑐𝑦
𝑆𝐴𝑀 𝑥 100 (4)
From this formula, it was plausible that the variation between calculated production and actual
production is determined by the operator’s efficiency because the remaining elements in the
formula are constant for a particular garment assembling. Since this study dealt with the energy
consumption for actual production, sewing operators’ production efficiency was considered as an
energy consumption factor instead of dealing with volume of output per hour. In addition, energy
consumption is directly related to productivity, hence to the efficiency. Furthermore, sewing
operations are repetitive in nature and it is natural that operators’ performance of activities or
efficiency typically shows improvement when the activities are done on a repetitive basis.
Therefore, the researcher believed that an operator’s efficiency could be an important variable
for the energy consumption.
Sivaramakrishnan et al. (2009) have reported energy consumption for various woven
garment production and knit garment production. They found that knit apparel production
consumes less energy (73 kWh) than does woven apparel production (96 kWh). Apart from the
increased number of machines required to produce apparel, fabric sewability, which deals with
productivity, could account for this varying energy consumption. Therefore, types of fabric was
another factor for the energy consumption of the sewing operation. Types of fabric could be
woven fabric, knit fabric, or sportswear fabric, or according to use, outerwear fabric, innerwear
fabric, leisurewear fabric, and so on.
41
It was evident that sewing machines operate slowly because of wear and tear (Juan,
1998). A sewing machine’s age and frequency of maintenance are correlated with slow or
smooth sewing operation and can cause delay in production and can also contribute to the energy
consumption as well. The apparel firm normally maintains a maintenance record register
including the equipment or sewing machines’ installation dates.
A thorough review of the literature revealed a definite gap in the understanding of energy
consumption in apparel production process. The current study is expected that the current to
begin filling this gap. However, it is not possible to determine all energy consumption factors in
the apparel sewing operation in one study. Rogale et al. (2003) claimed in their research that
higher productivity in the apparel industry has a direct beneficial impact on energy consumption:
increasing output units and consequently reducing the energy consumption. Therefore, only the
elements directly consuming energy and directly relating to sewing production were considered
as factors in this study. In summary, from the literature review these factors are sewing
machine’s motor speed, motor capacity, seam length, SPI, percent of sewing machine utilization,
number of sewing operations, SAM, number of threads, types of stitch, number of fabric layers
and thickness, operator’s efficiency, types of fabric, sewing machine age, and frequency of
maintenance.
42
Chapter 3 - Methodology
Introduction
This chapter covers the rationale of employing a mixed method of research, qualitative
and quantitative, and the approaches of both methods to investigate the energy consumption
determinants for different sewing operations in the apparel industry. This methodology chapter
outlines the study’s research questions, sampling strategy, data collection procedures, and the
data analysis process for both the qualitative and quantitative methods.
A mixed method of research was employed based on the purpose of this study as well as
to practice pragmatism. Creswell (2009) claimed that the results from one method could help
develop or inform the other method to provide comprehensive insights. Qualitative methods
emphasize depth through capturing detail, miniscule nuances, and multiple perspectives with
vigilant devotion with small sample sizes, whereas quantitative methods focus on breadth
through acquiring information from large sample sizes. Recognizing that both quantitative and
qualitative methods have different merits and demerits in the context of focusing on depth only
or breadth only, this study takes a holistic approach by utilizing on both.
The qualitative method (i.e., expert interview) in this study helps to determine reality-
oriented stances about the energy consumption phenomenon. Even though qualitative methods
are highly subjective in nature, the added benefit of asking follow-up questions to research
participants facilitates a deeper examination of research questions. On the other hand,
quantitative methods provide a discrete method of identifying the most influential factors, but do
not provide depth of understanding beyond what it measures. Since the energy consumption
phenomenon in the apparel sewing process is an unexplored area, the mixed method brings
methods triangulation to reveals complementary aspects of the phenomenon (Patton, 2002). In
43
order to identify the most influential energy consumption factors and their interrelationships in
this study, the qualitative method might reveal the deeper understanding of them but would
unable to explain the magnitude of their influences on the energy consumption and the
quantitative method might divulge the extent of influence but failed to explain comprehensively.
Therefore, implementing a sequential exploratory strategy through mixed method of research
deemed logical considering pragmatism nature of this study.
The sequential exploratory strategy includes two-phase approach, a first phase of
qualitative data collection and analysis followed by a second phase of quantitative data collection
analysis (Creswell, 2009). The purpose of this strategy includes assisting the interpretation of
qualitative findings by using quantitative data and results. Creswell mentioned the primary focus
of this strategy is “to initially explore a phenomenon” (p. 211) and energy consumption was the
phenomenon in this current study. The mixed method of research ideally places equal weight
between the qualitative and quantitative data, but often times in practice, it may be given priority
to one or the other (Creswell, 2009). However, it addresses thorough approach by offsetting one
method’s inherent weaknesses with the strengths of the other (Creswell, 2009) as well as
overcoming individual method’s intrinsic biasness (Patton, 2002).
44
Objectives and Research Questions
The overarching objectives of this study were to understand the phenomenon of energy
consumption, and by extension GHG emissions, for different sewing operations in the apparel
industry. The objectives were:
1. To identify most influential energy consumption factors of the sewing process in apparel
industry, and to develop a regression model to measure energy consumption.
2. To determine the interrelationships among energy consumption factors
3. To identify steps to reduce energy consumption within sewing process in apparel industry,
and
4. To explore the apparel industry experts’ level of concern regarding energy consumption, the
contribution to greenhouse gas emissions and climate change in the apparel manufacturing.
Objectives 1 and 2 were addressed using a mixed method approach, incorporating
experts’ opinions from qualitative interviews and quantifying each factor’s degree of influence
(i.e. influencing strength) over energy consumption along with the direction and magnitude of
association. The remaining two objectives were answered with a qualitative method of research.
Based on the above-mentioned objectives, 12 research questions were developed; these questions
along with their respective research method and analysis technique are provided in Table 3.1.
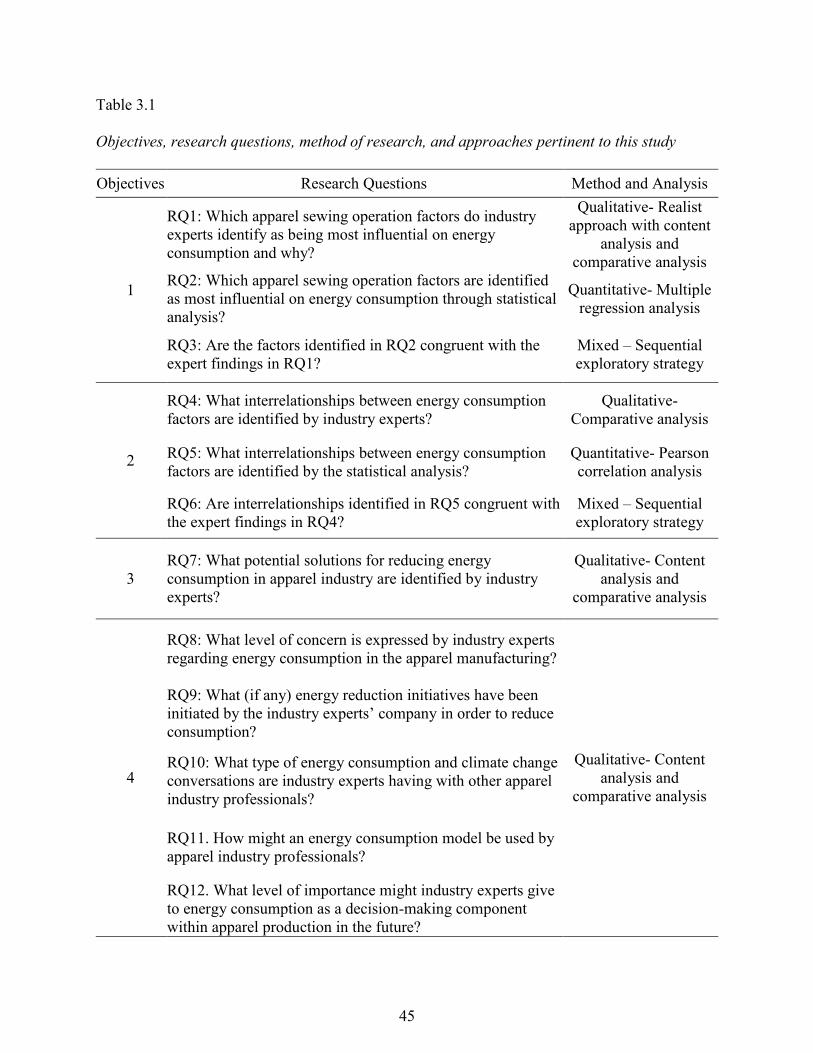
45
Table 3.1
Objectives, research questions, method of research, and approaches pertinent to this study
Objectives Research Questions Method and Analysis
1
RQ1: Which apparel sewing operation factors do industry
experts identify as being most influential on energy
consumption and why?
Qualitative- Realist
approach with content
analysis and
comparative analysis
RQ2: Which apparel sewing operation factors are identified
as most influential on energy consumption through statistical
analysis?
Quantitative- Multiple
regression analysis
RQ3: Are the factors identified in RQ2 congruent with the
expert findings in RQ1?
Mixed – Sequential
exploratory strategy
2
RQ4: What interrelationships between energy consumption
factors are identified by industry experts?
Qualitative-
Comparative analysis
RQ5: What interrelationships between energy consumption
factors are identified by the statistical analysis?
Quantitative- Pearson
correlation analysis
RQ6: Are interrelationships identified in RQ5 congruent with
the expert findings in RQ4?
Mixed – Sequential
exploratory strategy
3
RQ7: What potential solutions for reducing energy
consumption in apparel industry are identified by industry
experts?
Qualitative- Content
analysis and
comparative analysis
4
RQ8: What level of concern is expressed by industry experts
regarding energy consumption in the apparel manufacturing?
Qualitative- Content
analysis and
comparative analysis
RQ9: What (if any) energy reduction initiatives have been
initiated by the industry experts’ company in order to reduce
consumption?
RQ10: What type of energy consumption and climate change
conversations are industry experts having with other apparel
industry professionals?
RQ11. How might an energy consumption model be used by
apparel industry professionals?
RQ12. What level of importance might industry experts give
to energy consumption as a decision-making component
within apparel production in the future?
46
Statement of the Use of Human Subjects
This study utilized an online survey and semi-structured interviews to examine the
apparel industry experts’ opinions to identify substantial energy consumption factors in the
apparel sewing operations, to determine interrelationships among these factors, and to
understand approaches used to reduce the energy consumption in the apparel industry. Prior to
beginning the research study, the Kansas State University’s Institutional Review Board (IRB)
board reviewed and approved the study (IRB #8001). “The Institutional Review Board (IRB) is
committed to providing a comprehensive and compliant Research with Human Subjects program
for researchers, students, and potential human subjects. At Kansas State University the
Committee on Research Involving Human Subjects serves as the IRB and is mandated by federal
laws and regulations for oversight of all activities involving research with human subjects”
(Kansas State University IRB, 2014, para. 1).
Qualitative Method of Research
Research Approach
Qualitative research includes a variety of approaches. Patton (2002) claimed it as “not a
single, monolithic approach to research” (p. 76). However, selecting the right approach to
develop framework, to lodge plans and ideas is crucial for any research project. For this study,
the researcher selected the realist approach was selected as appropriate for the objectives. A
realist approach incorporates reality-oriented stances that correspond to the “real world.” Reality-
oriented stances represent the inclination toward literal truth and pragmatism based on what is
practical, more insightful, valid, and useful (Maxwell, 2012). While explaining how to conduct
research that will be more insightful and practical, Maxwell mentioned,
47
I believe that a realist approach can do this by enabling researchers to develop more
relevant and insightful theories about the things they study, to plan their strategies and
methods to be more productive, valuable, and ethical, and to develop conclusions that
more validly indicate what is actually happening in the situations they study (p. 181).
A realist approach focuses on processes and pays close attention to what is actually going
on rather than regularities. Since Patton referred to real knowledge as “limited to what could be
logically deduced from theory, operationally measured, and empirically replicated” (p. 92), this
realist approach aims to search for current facts (i.e., energy consumption phenomenon) from the
real world (i.e., apparel production process). It helps to determine current realities from the
opinions of research participants by stimulating them to reveal practical knowledge in terms of
usefulness. In order to provide the actual information, the participants must have lived
experience on that particular fact. Therefore, this study utilized apparel industry experts as
participants and engaged them to discuss energy consumption phenomena in the sewing
operations from their lived experience.
Sampling Strategy
The power of qualitative research lies in the ability of selecting appropriate sampling
techniques and nesting them (Patton, 2002). According to the nature of this study, purposeful
intensity sampling strategy was employed. Intensity samples consist of “information-rich cases
that manifest the phenomenon of interest intensely” (Patton, 2002, p. 234) and purposeful
represents non-random sample selection. In this study, the sampling strategy includes
participants who are information-rich along with having intense lived experience with apparel
production (especially the sewing process). The samples were apparel industry experts who are
capable enough to identify potential energy consumption factors for the different sewing
operations. The expert selection criteria included working in the apparel industry for at least four
48
years; being directly involved with apparel production decision processes; and preferably,
holding a managerial post. In addition, a snowball or chain sampling strategy was employed to
get connected with more experts from different types of apparel production (e.g., woven-wear,
knitwear, and sportswear).
Sample size (i.e., number of experts) was determined utilizing the saturation technique;
data collection ended when no new information was reported from the experts. From the
recommendations of Romney, Batchelder, and Weller (1986) as well as Guest, Bunce, and
Johnson (2006), it was expected that the number of participants would be around 4-12. The final
determination of the number of participants was based on the researcher’s judgement of when
experts were no longer revealing any new information. A total of nine participants were
interviewed for the qualitative analysis portion of the study. The targeted apparel industry
experts were drawn from production managers, apparel production engineers, vice presidents of
apparel sales and production, and general managers, and they were fairly experienced in all types
of apparel industry.
The researcher knew three experts in person, having met them at various conferences,
seminars, and summer internships. He approached them first for this study and asked for their
help connecting with other apparel industry experts in the US. Possible participants were
contacted through email with a short description of the project and an invitation to participate.
Once they agreed to participate and returned a signed informed consent form, they were
interviewed.
49
Instrumentation
The instrument in the qualitative component of this study was interview questions and the
data collection technique was semi-structured, open-ended interviews with oral responses.
Immediately before the interview, a Q-sort (i.e., dragging and dropping) technique online survey
was distributed via the Qualtrics software platform to the interviewees. The survey consisted of
an initial list of energy consumption factors, developed from literature review and research
experience. The participants were asked to sort the factors into different groups based on their
level of influence on energy consumption (e.g., most influential, less influential). From his
industrial experience, the researcher witnessed a lack of concern regarding energy consumption
in the apparel production process. This lack of concern might lead to a lack of knowledge and
may make experts less competent to provide a holistic picture of energy consumption in the
apparel sewing process. Therefore, experts were given the list of energy consumption factors
instead of asking them directly which factors contribute to the energy consumption.
The semi-structured interview evolved from the combination of both structured and
unstructured questions (Merriam, 2009). The semi-structured and open-ended nature of
interviewing allows the participants freedom and creativity in their responses. In addition, this
technique offers the interviewer the flexibility to probe, which eventually facilitates information-
rich responses to open-ended questions and encourages depth of responses. Semi-structured
interviewing also provides hints to the interviewee about the level of desired response (Barriball
& While, 1994). At the beginning of the interview, the researcher introduced himself to the
participants, followed by a short description of this study. The interview was then initiated with
asking an opening question to make the ambience familiar to both experts and interviewer and to
develop rapport between the two parties. The same question helped participants to engage with
50
the subsequent questions related to the energy consumption in the sewing process and elicited the
experiences to support their responses.
The interviews occurred via teleconferencing (audio recorded, upon IRB approval and
participants’ consent) and the researcher utilized an interview guide (see Appendix A). All of the
participants were given the same questions. This increases comparability and limits the
interviewer effects and bias. All the interview questions were directly related to the research
questions and sequentially designed. However, the researcher pursued interesting related topics if
introduced by a participant.
Data Collection Procedure
In qualitative research, data must be descriptive in nature. All participants were contacted
via email to elicit their participation in this study. Follow-up emails were sent to participants to
confirm time and place at their convenience for the interview. All interviewees were provided
with an explanation of this study’s purposes and intended outcomes. Each participant was
guaranteed confidentiality. Participants also were provided the assurance that they could
withdraw from the research process at any time without any explanation. For the local apparel
industry experts, the interview was conducted face to face by using voice recorder, while for
those who were not in vicinity, it was conducted via using online video conferencing service
(i.e., Zoom). All the interviews were audio and video recorded according to the consent of
interviewees. Participants were contacted again after the interview (based on prior consent) if the
researcher deemed it necessary to clarify any issues from the initial interview.
51
Transcription
Verbatim and denaturalized transcription was used. The denaturalized practice eliminates
idiosyncratic elements of speech (e.g., stutters, pauses, nonverbal, gestures, involuntary
vocalizations) from the transcription process (Oliver, Serovich, & Mason, 2005). Transcription
was conducted by the researcher with the help of NVivo version 11.0 through moving back and
forth between recording(s) and transcript(s).
During transcription, the researcher’s cultural standpoint and significant power difference
in relation to participants could have biased his analysis. The difference in class, culture, and
language between the interviewer and the interviewees, along with preconceptions of the
interviewees, influenced the transcripts (MacLean, Meyer, & Estable, 2004; Tilley, 2003).
However, according to Poland’s (1995) recommendation, these limitations were overcome
through capturing the utterances as closely as possible as they were audiotaped, and utilizing
denaturalized transcription made it easy to perform. Having experience in the apparel
manufacturing process, the researcher considered himself as a ‘relative insider’ in this research,
which placed him in privileged position with respect to transcription and interpretation (Witcher,
2010). Since the researcher did not conduct the interviews with a completely blank slate, being a
‘relative insider’ led to the improvement in transcription quality, in reflexivity, and in
maintaining research rigor and trustworthiness.
Sometimes the lack of coherence in the discourse makes it harder to understand (Forbat
& Henderson, 2005; Tilley & Powick, 2002). In addition, being a non-native English speaker,
some culturally specific words (e.g., unfamiliar accents or colloquialisms) were difficult to
understand and the researcher went back to re-listen to the recorded interviews several times.
Furthermore, the researcher sought help from his advisor who is a native English speaker to
52
overcome these problems. However, in spite of requiring more time, overall rigor,
trustworthiness, and transcription quality were not compromised. While re-listening to the
recorded interviews, the researcher sincerely tried to eliminate transcription errors including
missed words, misinterpreted words, and misheard words. Overall, knowing these above-
mentioned limitations related to transcription before the interview helped the researcher better
ensure transcription quality.
Because the data gathered for the qualitative research are voluminous in nature, it could
be difficult to handle and organize. In this regard, the researcher followed a pre-plan for
managing data. Immediately after an interview, gathered information was transcribed verbatim
through reviewing the audio recording. The interviews were scheduled in such a way that the
interviewer had 24 hours free after conducting the interview to do this immediate transcription.
In addition, the researcher went through field notes to get insights and to determine
inconsistencies from the interview to augment the quality of analysis. Throughout the interview
process, comparisons of responses provided a sense of the emerging factors and relationships
across interviews. Challenges and complications from each interview and its analysis were
overcome in subsequent interviews and analyses. The researcher became aware of potential
complications in handling interview responses in the form of incomplete field notes, unfinished
field notes that were put off to write later, insufficient data collection, a significant gap in the
interviewee responses, improper data categorization, and inappropriate labeling.
Analysis
In this study, there were two steps in the qualitative data analysis plan: content analysis to
facilitate coding and categorizing the data, and comparative analysis to identify themes. Content
53
analysis facilitates a flexible, pragmatic method for developing and extending knowledge of the
human experience to the researchers. It is described as “the subjective interpretation of the
content of text data through the systematic classification process of coding and identifying
themes or patterns” (Hsieh & Shannon, 2005, p. 1278). In addition, coding is referred as “the
pivotal link between collecting data and to explain these data” (Charmaz, 2014, p. 46). Incident-
to-incident coding was utilized in this qualitative analysis. Apart from word-by-word and line-
by-line coding, the incident-to-incident coding deals with events or occurrences. The explanation
about an energy consumption factor, description of two factors’ interrelationship, and
justification of a particular suggestion to reduce energy consumption were examples of an
incident in this study. The reason behind using incident-to-incident coding was to faclitate
making comparison between incidents. This works better than word-by-word or line-by-line
coding to grasp a comprehensive sense of the study contexts (Charmaz, 2014) and addressed the
goal of content analysis as “to provide knowledge and understanding of the phenomenon under
study” (Downe-Wamboldt, 1992, p. 314).
The qualitative content analysis included searching of key incidents that referred to
energy consumption factors, their interrelationships, solutions related to energy conservation,
and the experts’ level of concern on global climate change. A coding scheme was developed
from the key incidents of expert responses to the research questions. Codes were then sorted into
categories based on how different codes are related and linked. In this regard, sensitizing
concepts were implemented. According to Patton (2002), a sensitizing concept “refers to
categories that the analyst brings to the data” (p. 456). Using sensitizing concepts helped the
researcher to determine categories that provide a general sense of reference to both academia and
practitioners. It also helped to identify central element of a good description. Since this study is
54
based on expert interviews from the same industry (apparel manufacturing), the researcher
encountered somewhat similar jargon (e.g., SAM) throughout experts’ responses. However, the
purpose of using qualitative content analysis was to classify voluminous text from the interview
into an efficient number of categories that represent similar meanings.
Data analysis started with reading transcriptions repeatedly to obtain a sense of the whole
(Tesch, 1990). In addition, the task of discovering themes is the heart of qualitative data analysis
and one of the most fundamental tasks (Ryan & Bernard, 2003). A comparative analysis was
implemented to identify themes through analyzing similarities and differences written interview
statements and incidents within the same interview and among different interviews. While
analyzing similarities and differences, word-based techniques— word repetitions and key-words-
in-contexts (KWIC) — were applied for theme identification. The frequency of mention was the
key strategy to identify factors and their interrelationships. Furthermore, the same technique was
applied to identify patterns as well as to utilize saturation technique in this project.
Substantive Significance
The study’s substantive significance depends on the consistency and congruency of
findings, how the findings are captured, consistency of the findings with others’ knowledge, and
findings’ usefulness (Patton, 2002). Seeking experts’ opinion could be another supporting issue
for determining substantive significance in this study. All the participants held extensive
expertise from the apparel industry and therefore provided in-depth, coherent, and consistent
responses reflected from actual apparel production. Witcher (2010) mentioned, “[W]hen working
with unique or distinct populations, remaining faithful to the aural record can be difficult and
may present the relative outsider with particular challenges to maintaining data quality” (p. 130).
55
Since this project involves a distinct population (i.e., industry experts), as a ‘relative insider’
(i.e., having experience in the apparel production process) the researcher could play a vital role
in maintaining rigor of analysis and interpretation through relying on his own intelligence,
judgment, and on his own experience. Since ‘correspondence of findings to reality’ is an
important criteria for judging the quality and credibility of a qualitative inquiry (Patton, 2002),
the researcher’s ‘relative insider’ status could assist to maintain this criteria.
Most importantly, the findings of research questions were achieved through triangulation.
The experts shared energy consumption information about sportswear, woven-wear, and
knitwear companies from the US. Apart from the methodological triangulation (i.e., using both
qualitative and quantitative method) in this study, including experts from various types of the
apparel industry (e.g., sportswear, woven, and knit) addressed the triangulation of data sources; it
enhanced the likelihood of capturing all potential energy consumption factors from diverse
production units. In addition, triangulation provides greater credibility of data and greater
understanding of the findings across different data sources (Patton, 2002). Furthermore, the
representation of extensive verbatim transcription of the interviews (e.g., direct quotes)
supported the transferability of the data.
Quantitative Method of Research
After the qualitative portion of the project, the study utilized quantitative data collection
and analysis. Identified energy consumption factors from the literature were quantified and
collected through direct observation. Factors were analyzed to determine explanatory power over
energy consumption, investigate correlations among them, and develop an energy consumption
model for sewing operation in the apparel industry.
56
Unit of analysis
Selection of the unit of analysis is a crucial part in any research project and it should be
commensurate with the research questions. Based on the specific research questions for this
study, the unit of analysis was different sewing operations (e.g., side seam, label attaching)
which are common in any apparel industry. At the end of the study, determining influential
energy consumption factors for apparel sewing operation was the primary outcome of the
quantitative part.
Data Collection
The number of observations for the quantitative part was determined from the guidelines
provided by Green (1991) and Maxwell (2000). Green indicated the traditional rule of thumb of
having at least five observations or cases per independent variable (i.e., 5:1 ratio) in the multiple
regression analysis whereas Maxwell recommended of having 10: 1 ratio (i.e., 10 observations
per independent variable). In addition, Vittinghoff and McCulloch (2007) claimed the 10:1 ratio
is too strict, even though they found numerous errors associated with ratios of 2:1 to 4:1 at the
same time. However, they were indicating that the ratio should be at least 5:1. Ninety-eight
observations from 98 sewing operations in three apparel factories— one woven-wear, one
knitwear, and one sportswear apparel factories represented the data for this study. These three
factories are located in western part of the United States. Each observation consisted of 11
independent variables and one dependent variable (approximate ratio 9:1).
Two high-resolution video recorders, an energy consumption meter, and a fabric
thickness gauge were used as instruments to capture real time energy consumption and to
quantify factors pertinent to sewing operations. One high-resolution camera was used to capture
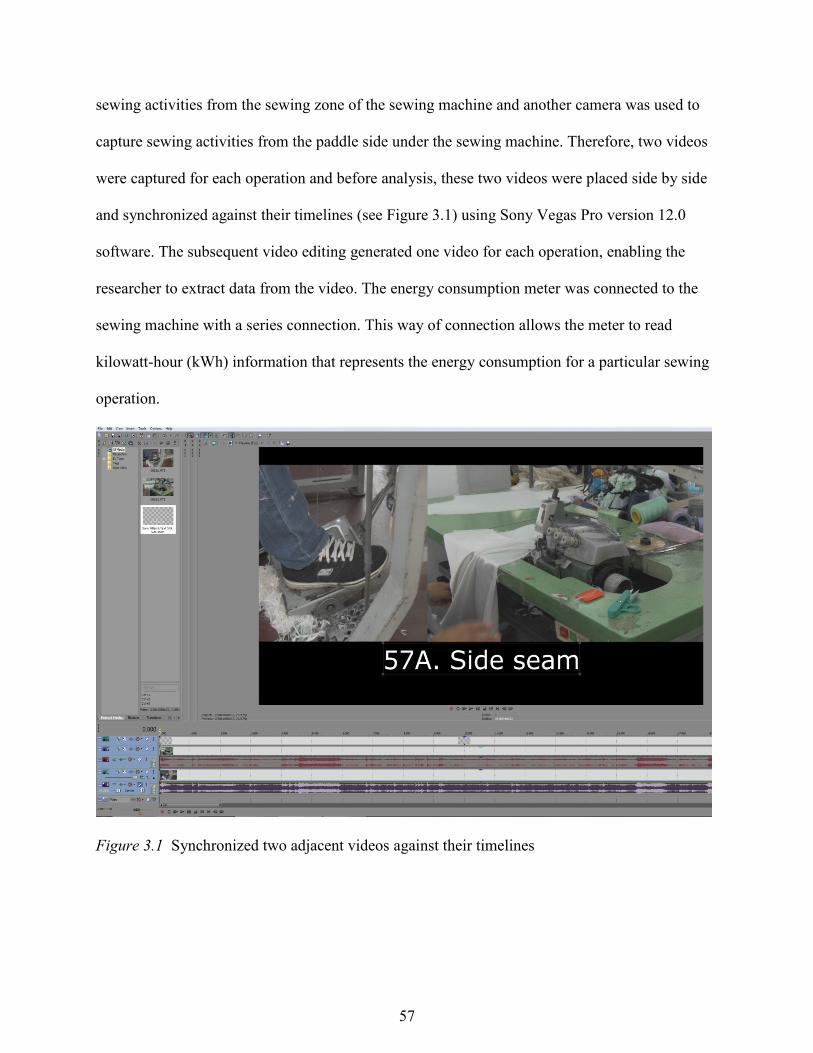
57
sewing activities from the sewing zone of the sewing machine and another camera was used to
capture sewing activities from the paddle side under the sewing machine. Therefore, two videos
were captured for each operation and before analysis, these two videos were placed side by side
and synchronized against their timelines (see Figure 3.1) using Sony Vegas Pro version 12.0
software. The subsequent video editing generated one video for each operation, enabling the
researcher to extract data from the video. The energy consumption meter was connected to the
sewing machine with a series connection. This way of connection allows the meter to read
kilowatt-hour (kWh) information that represents the energy consumption for a particular sewing
operation.
Figure 3.1 Synchronized two adjacent videos against their timelines
58
Data Extraction Method
Some data were directly collected from the observations and the remaining data were
extracted from the videotaped observations. Sewing machine motor capacity, motor speed, layers
of fabric, SPI, number of threads, types of fabric, and seam length per operation per piece were
directly collected from the observations. Fabric thickness was measured with a fabric thickness
gauge, and energy consumption per operation per piece was collected with an energy
consumption meter. SAM, operator production efficiency, and percent of sewing machine
utilization was extracted from the recorded video for each operation.
In order to calculate SAM or SMV, first the total sewing time for each operation was
extracted from the video. Second, the average sewing time and operator’s subjective
performance rating were measured, also by video. The percent of allowances (e.g., machine
allowance and relaxation allowance) to be utilized in the formula were based on guidelines
provided in the literature (see Equation 3 in Chapter 2).
Operator production efficiency is the ratio between SAM and required SAM (R-SAM).
R-SAM represents the actual sewing time per piece in a minute for an operation. R-SAM was
extracted and determined from the sewing time recorded.
Percent of sewing machine utilization represents how much time the sewing machine is
actually being utilized by the operator. The sewing time for an operation consists of both actual
machine running time and fabric manipulation time. The actual machine running time was
marked (see Figure 3.2) from the previously extracted R-SAM video clip and determined against
total R-SAM value.
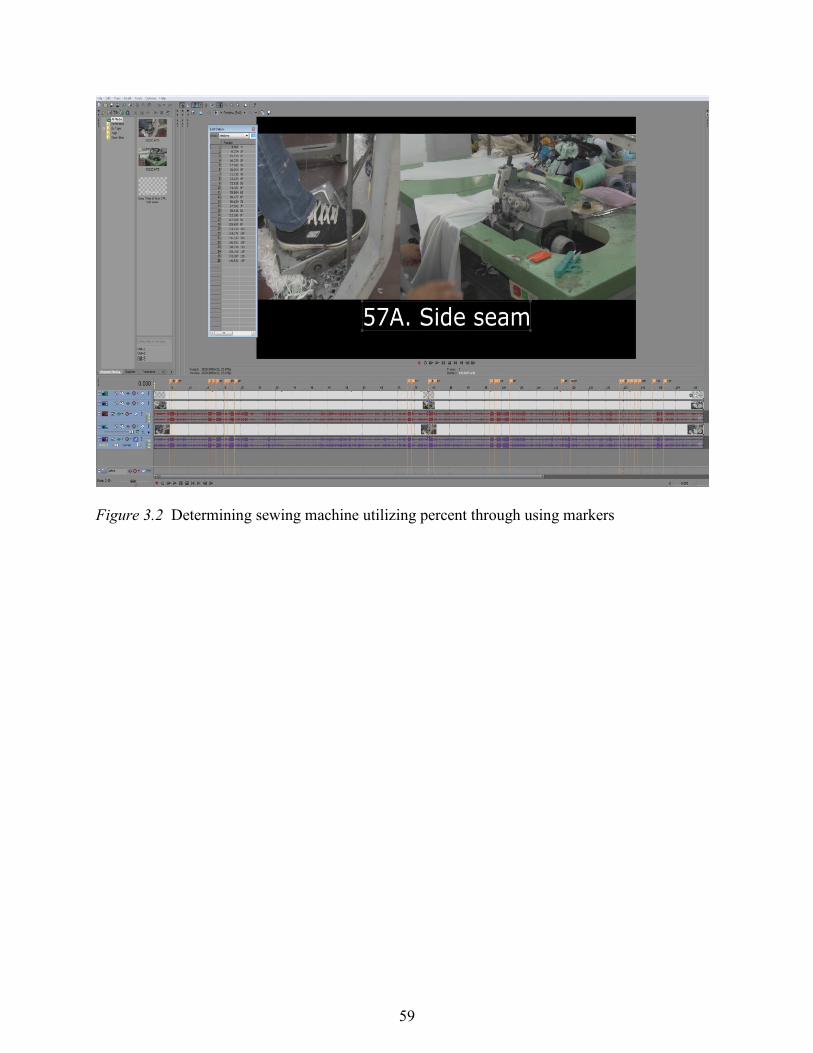
59
Figure 3.2 Determining sewing machine utilizing percent through using markers
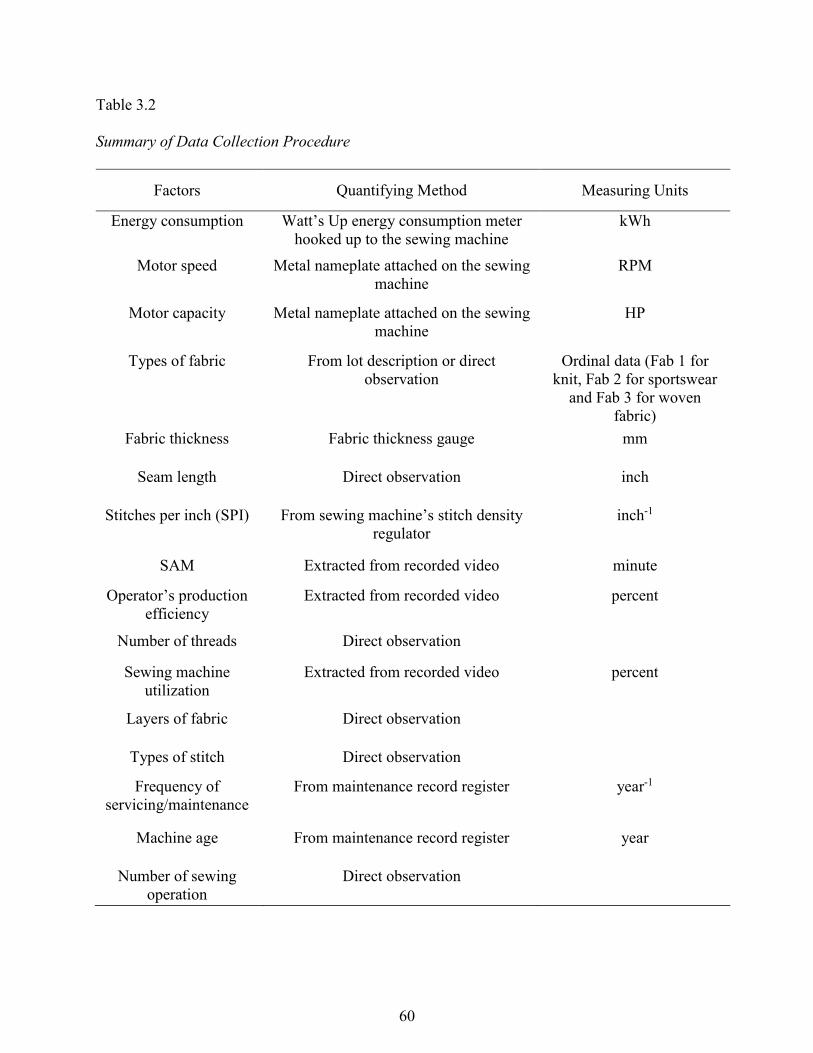
60
Table 3.2
Summary of Data Collection Procedure
Factors Quantifying Method Measuring Units
Energy consumption Watt’s Up energy consumption meter
hooked up to the sewing machine
kWh
Motor speed Metal nameplate attached on the sewing
machine
RPM
Motor capacity Metal nameplate attached on the sewing
machine
HP
Types of fabric From lot description or direct
observation
Ordinal data (Fab 1 for
knit, Fab 2 for sportswear
and Fab 3 for woven
fabric)
Fabric thickness Fabric thickness gauge mm
Seam length Direct observation inch
Stitches per inch (SPI) From sewing machine’s stitch density
regulator
inch-1
SAM Extracted from recorded video minute
Operator’s production
efficiency
Extracted from recorded video percent
Number of threads Direct observation
Sewing machine
utilization
Extracted from recorded video percent
Layers of fabric Direct observation
Types of stitch Direct observation
Frequency of
servicing/maintenance
From maintenance record register year-1
Machine age From maintenance record register year
Number of sewing
operation
Direct observation
61
Data Variability and Credibility
Data was directly collected from three apparel production firms in such a way that
observations were obtained for different operations, from different operators, and different
machines. For example, two sewing operations might be same, performed by same operator but
by different machine or, two sewing operations might be different but performed by same
operator and machine or, two sewing operations might be same, performed by same machine but
by different operator. Therefore, observations had variability, either in operation, operator, or
sewing machine. The method of data collection enhanced credibility in the sense that all
observations were collected using sewing operations and operators in current apparel mass
production facilities. In addition, a careful approach was used in selecting factors to avoid
redundancy. For instance, either SAM or the average sewing time could be selected as factors
because both are interrelated and can be converted one from the other. However, SAM was
selected in this study because it is widely used by the industry. Similarly, any redundant
variables and variables that could not be quantified from reliable sources (i.e., lacking of record
or evidence) were not included in the quantitative study.
Data Analysis
Data was analyzed using statistical tools in STATA version 12.0. The researcher
employed a variety of statistical approaches to analyze and draw conclusions about the variables.
The influential energy consumption factors were selected based on higher beta coefficients (β)
and lower significance level of T (p ≤ .05) from the multiple regression analysis and were
eventually used to determine which factor(s) highly contributed to the energy consumption of the
62
sewing operation in the apparel industry. The higher the beta coefficients, the higher the factor’s
(independent variable) influence over energy consumption (dependent variable).
The magnitude (strength of association) and direction of relations among independent
variables were determined through employing Pearson’s correlation coefficients (r) with a
significance level of 5% or less (p ≤ .05). Since there are three strengths of association – weak (r
= ±.1 to ±.3), moderate (r = ±.3 to ±.5), and strong (r = ±.5 to ±1.0) – only the variables with
moderate and strong strengths of association were considered in this study and are discussed in
Chapter 4. Another reason for using Pearson’s correlation coefficients is that it allowed
eliminating highly correlated variables to avoid redundancy in the multiple regression analysis.
A regression model was developed using primary data collected from the apparel
industry. If the independent variables or energy consumption factors are denoted as X1, X2, X3,…,
Xn, and dependent variable or energy consumption is denoted as Y, the multiple regression model
can be represented as:
Y= a0+ aX1 + bX2 + ……………………………. + nXn + e (5)
(a0 is an intercept or constant coefficient, e is the constant error term, and a, b, c,………,
n are respective variables’ coefficients)
The value of a0, a, b,…, n of the regression model were determined from coefficients (B),
and the value of e was determined from standard error term (constant). While adjusted
coefficient of multiple determination (Ra2) provides an estimate of the strength of the
relationship between the regression model and the response variables as well as represents the
goodness of fit of the model, Ra2 value was used to evaluate the model’s explanatory power. In
addition, using Ra2 for the multiple regression model is recommended over coefficient of
multiple determination (R2) because Ra2 incorporates the model’s degrees of freedom and hence,

63
increases the independent variables prediction to the dependent variable. Furthermore, since the
F-test determines whether the proposed relationship between the dependent variable and the set
of independent variables is statistically reliable, the reliability of the model was determined from
the F-test of overall significance.
Regression Analysis Plan
Step 1. An initial multiple regression analysis was performed to evaluate the influence of
all independent variables on the dependent variable (energy consumption). The regression model
strength was evaluated based on the Ra2 value. An Ra2 value closer to one represents the
independent variables’ better predictability to the dependent variable in the model.
Step 2. A second multiple regression analysis was computed using the independent
variables having better explanatory power from the earlier model. Independent variables with
better explanatory power were selected based on higher beta coefficient (β) value. A stepwise
regression analysis was performed to crosscheck how many independent variables provide a
better prediction over the dependent variable. A comparison between Ra2 value of the two
models: sub-regression model (model from step 2) and original model (model from step 1) was
evaluated. If the Ra2 of sub-regression model increased substantially, it was considered over the
original model (after checking that any absolute value of r was not greater than 0.75).
Step 3. Basic multiple regression analysis assumptions (i.e., linearity and additivity, no or
little multicollinearity, multivariate normality, homoscedasticity) were evaluated. The method of
evaluating assumptions is discussed below.
Linearity and additivity. The regression model assumes that the relationships between the
independent variables and the dependent variable are both linear and additive. If the model does
64
not comply with this assumption, there is a chance that relevant independent variables are
excluded, irrelevant independent variables are included, or both (Berry & Feldman, 1985).
Partial regression residual plot and component plus residual plot were applied to detect the nature
of the relation. In case of monotonic non-linear relationships between the independent variable
and dependent variable, a common rule of power transformation is to be carried out according to
Tukey’s bulging rule. After power transformation, the new model’s strength is compared to the
earlier model’s strength (based on Ra2 value). The product-term approach would be implemented
to evaluate the additivity assumption of the multiple regression analysis.
Multicollinearity. In order to test the assumption of multicollinearity, the variance
inflation factor (VIF) was applied. If the VIF coefficient is less than 4.0 and absolute value of
correlation coefficient (r) is not greater than 0.75, the model depicts no multicollinearity (Berry
& Feldman, 1985). However, if multicollinearity exists, combining two or more highly
correlated independent variables into a single variable and then using the composite variable in
the place of correlated variables in the regression would be carried out.
Multivariate normality. A skewness test was performed for the variables to detect
multivariate normality within the regression model. The acceptable range for skewness is
considered between -2 to +2. If the skewness of any variables extends beyond this range, a power
transformation would be applied to minimize it.
Homoscedasticity. Finally, the evaluation of homoscedasticity assumption was carried
out through plotting the studentized residuals against fitted values. If the pattern of non-constant
error variance is linear, then the Breusch-Pagan test would be carried out. Alternatively, if the
pattern is non-linear, then White’s test would be carried out. For both tests, if the chi-square
value for the test is significant (p<0.050), then the model depicts heteroscedasticity and hence,
65
the White’s corrected standard errors (also known as ‘robust’ standard errors) would be
computed and t-test for each independent variable recomputed.
Integration of Qualitative and Quantitative Data
After analyzing quantitative and qualitative data, findings (qualitative and quantitative)
were compared to draw conclusions in terms of the study’s objectives and research questions.
The findings of influential energy consumption factors and their interrelations were compared
across the qualitative and quantitative results. These results were then checked against the
literature review discussed in Chapter 2. However, the researcher used judgement as to whether
the qualitative and quantitative findings corroborated, contradicted, or were not related to each
other (Driscoll, Appiah-Yeboah, Salib & Rupert, 2007).
66
Chapter 4 - Findings
Introduction
Using both qualitative and quantitative research methods, this study investigated energy
consumption within the apparel production process, more specifically the sewing process. The
qualitative methodology included apparel industry experts’ opinions; they were asked about their
experiences with apparel production, their opinion about the most influential
determinants/factors contributing to energy consumption in the apparel sewing process, their
perceptions about the interdependence among these factors, and their experience-based
suggestions for reducing energy consumption for different sewing operations. At the very end of
each interview, questions were asked about their level of concern regarding energy consumption,
the apparel industry’s contribution to greenhouse gas (GHG) emissions, and climate change. The
interview was recorded and transcribed, and themes (see Appendix B) were identified based
upon each research question. The quantitative part of this study included gathering real-time
energy consumption data from the apparel sewing process. This chapter presents analysis and
discussion of both the qualitative and quantitative data.
Introduction to Research Participants
All research participants in this study were apparel industry experts. A total of nine
experts participated in the interviews. These experts were selected through purposeful intensity
and snowball sampling. There were six males and three females, and they were all US citizens
between the ages of 31 and 63 years. They had noteworthy apparel industry expertise ranging
from 4-40 years with the production process along with 4-35 years of direct involvement with
management and/or production.
67
The mean age of the research participants was 53, where the youngest one was 31 and the
oldest one was 63. The mean number of years these experts have been involved in the apparel
manufacturing process was 27, and the mean number of these years they were involved in
management and/or production was 23. Their current designations included Managing Director
for Production, Apparel Industry Production Consultant, Senior Vice President of Supply Chain,
and Lecturer and Associate Professor in Apparel and Textiles. Though two participants’ current
position titles were Lecturer and Associate Professor, both had sufficient apparel industry
experience to qualify as an expert in this study. See Table 4.1 for all the research participants’
demographic information.
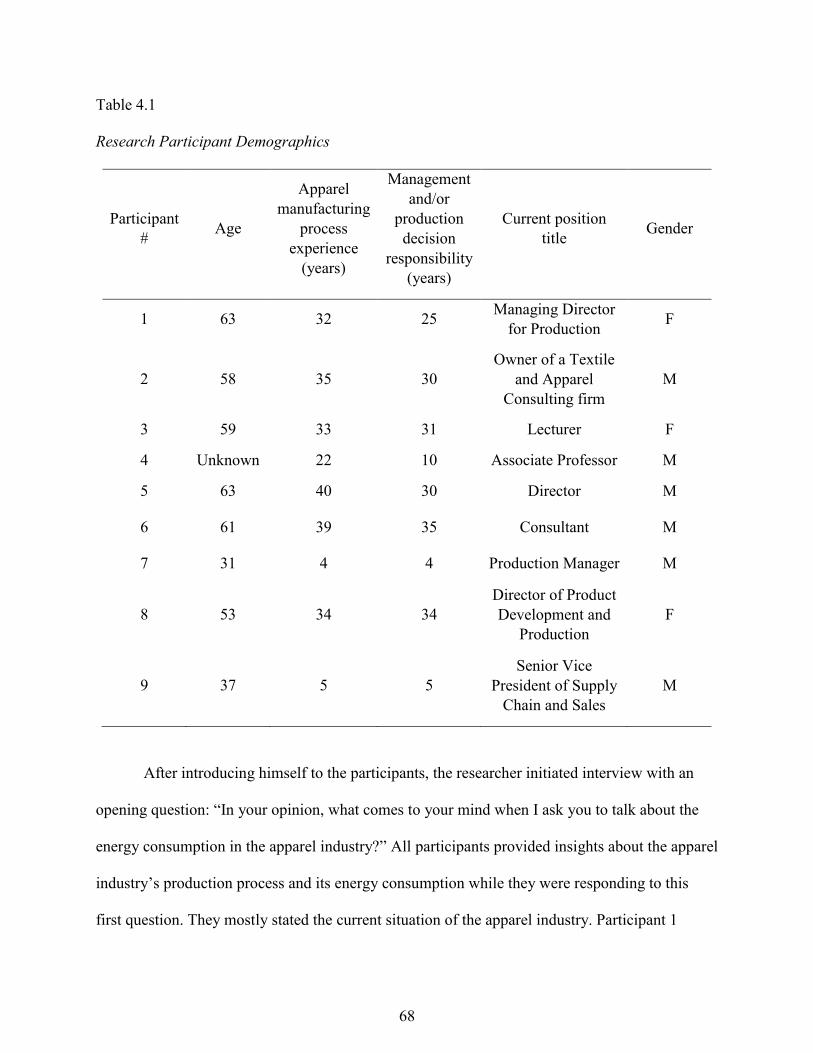
68
Table 4.1
Research Participant Demographics
Participant
# Age
Apparel
manufacturing
process
experience
(years)
Management
and/or
production
decision
responsibility
(years)
Current position
title Gender
1 63 32 25 Managing Director
for Production F
2 58 35 30
Owner of a Textile
and Apparel
Consulting firm
M
3 59 33 31 Lecturer F
4 Unknown 22 10 Associate Professor M
5 63 40 30 Director M
6 61 39 35 Consultant M
7 31 4 4 Production Manager M
8 53 34 34
Director of Product
Development and
Production
F
9 37 5 5
Senior Vice
President of Supply
Chain and Sales
M
After introducing himself to the participants, the researcher initiated interview with an
opening question: “In your opinion, what comes to your mind when I ask you to talk about the
energy consumption in the apparel industry?” All participants provided insights about the apparel
industry’s production process and its energy consumption while they were responding to this
first question. They mostly stated the current situation of the apparel industry. Participant 1
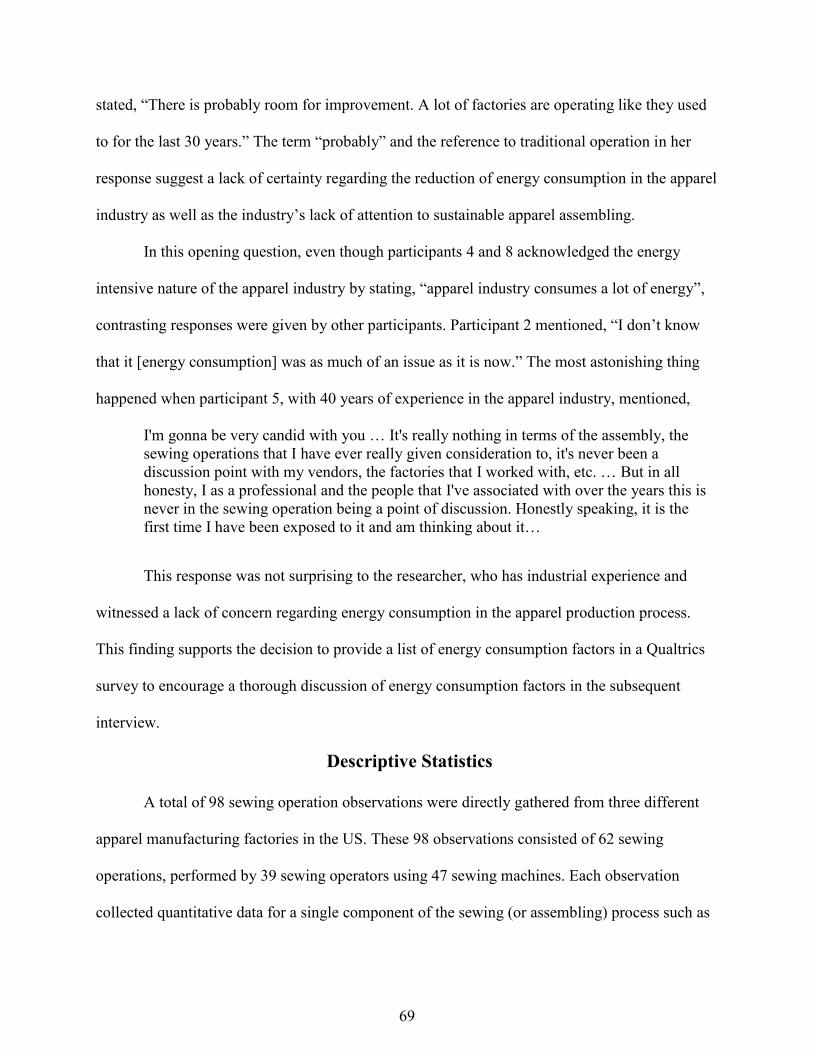
69
stated, “There is probably room for improvement. A lot of factories are operating like they used
to for the last 30 years.” The term “probably” and the reference to traditional operation in her
response suggest a lack of certainty regarding the reduction of energy consumption in the apparel
industry as well as the industry’s lack of attention to sustainable apparel assembling.
In this opening question, even though participants 4 and 8 acknowledged the energy
intensive nature of the apparel industry by stating, “apparel industry consumes a lot of energy”,
contrasting responses were given by other participants. Participant 2 mentioned, “I don’t know
that it [energy consumption] was as much of an issue as it is now.” The most astonishing thing
happened when participant 5, with 40 years of experience in the apparel industry, mentioned,
I'm gonna be very candid with you … It's really nothing in terms of the assembly, the
sewing operations that I have ever really given consideration to, it's never been a
discussion point with my vendors, the factories that I worked with, etc. … But in all
honesty, I as a professional and the people that I've associated with over the years this is
never in the sewing operation being a point of discussion. Honestly speaking, it is the
first time I have been exposed to it and am thinking about it…
This response was not surprising to the researcher, who has industrial experience and
witnessed a lack of concern regarding energy consumption in the apparel production process.
This finding supports the decision to provide a list of energy consumption factors in a Qualtrics
survey to encourage a thorough discussion of energy consumption factors in the subsequent
interview.
Descriptive Statistics
A total of 98 sewing operation observations were directly gathered from three different
apparel manufacturing factories in the US. These 98 observations consisted of 62 sewing
operations, performed by 39 sewing operators using 47 sewing machines. Each observation
collected quantitative data for a single component of the sewing (or assembling) process such as
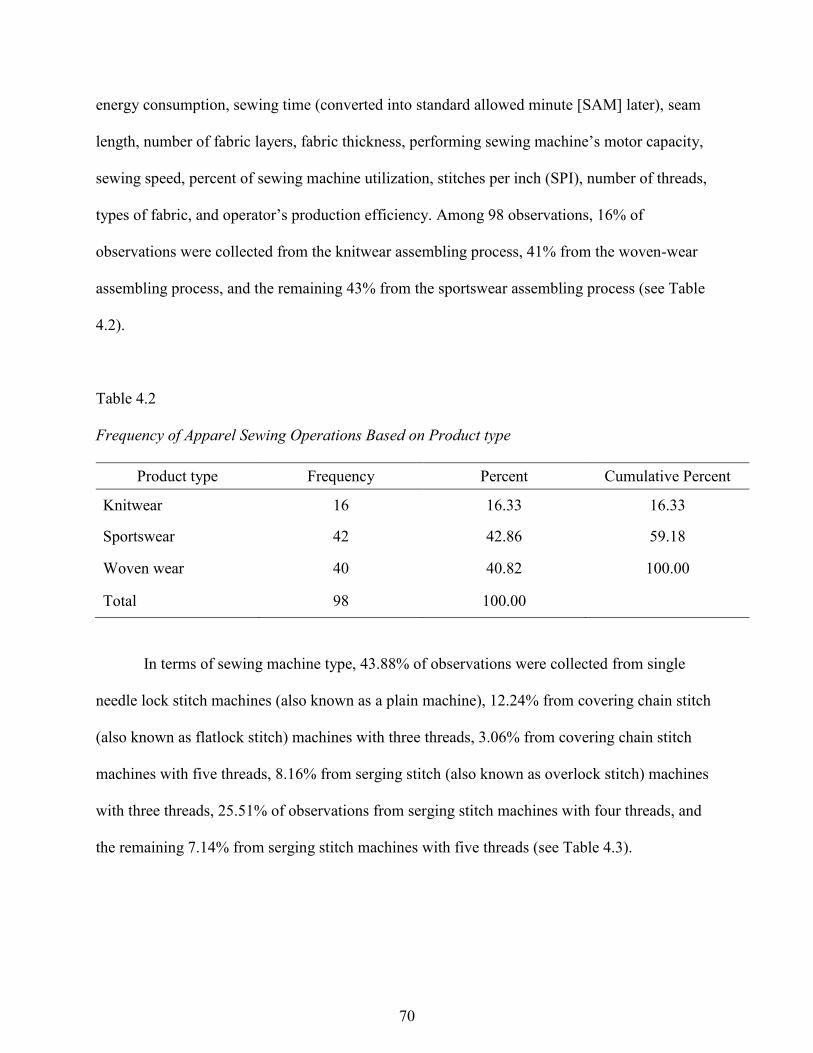
70
energy consumption, sewing time (converted into standard allowed minute [SAM] later), seam
length, number of fabric layers, fabric thickness, performing sewing machine’s motor capacity,
sewing speed, percent of sewing machine utilization, stitches per inch (SPI), number of threads,
types of fabric, and operator’s production efficiency. Among 98 observations, 16% of
observations were collected from the knitwear assembling process, 41% from the woven-wear
assembling process, and the remaining 43% from the sportswear assembling process (see Table
4.2).
Table 4.2
Frequency of Apparel Sewing Operations Based on Product type
Product type Frequency Percent Cumulative Percent
Knitwear 16 16.33 16.33
Sportswear 42 42.86 59.18
Woven wear 40 40.82 100.00
Total 98 100.00
In terms of sewing machine type, 43.88% of observations were collected from single
needle lock stitch machines (also known as a plain machine), 12.24% from covering chain stitch
(also known as flatlock stitch) machines with three threads, 3.06% from covering chain stitch
machines with five threads, 8.16% from serging stitch (also known as overlock stitch) machines
with three threads, 25.51% of observations from serging stitch machines with four threads, and
the remaining 7.14% from serging stitch machines with five threads (see Table 4.3).
71
Table 4.3
Frequency of Apparel Sewing Operations Based on Sewing Machine Types
Sewing machine types Frequency Percent Cumulative
percent
Single needle lock stitch machine 43 43.88 43.88
Covering chain stitch machine (3 thread) 12 12.24 56.12
Covering chain stitch machine (5 thread) 3 3.06 59.18
Serging stitch machine (3 thread) 8 8.16 67.34
Serging stitch machine (4 thread) 25 25.51 92.85
Serging stitch machine (5 thread) 7 7.14 100.00
Total 98 100.00
Influential Energy Consumption Factors for Sewing Operations
The first research objective includes identifying the most influential energy consumption
factors of the sewing process in the apparel manufacturing industry and developing a regression
model to measure energy consumption. In order to attain this objective, three research questions
were developed and both qualitative and quantitative research methods were integrated. The
three research questions were:
RQ1: Which apparel sewing operation factors do industry experts identify as being most
influential on energy consumption and why?
RQ2: Which apparel sewing operation factors are identified as most influential on energy
consumption through statistical analysis?
RQ3: Are the factors identified in RQ2 congruent with the expert findings in RQ1?
72
RQ1: Energy Consumption Factors Identified as Most Influential by Industry Experts
A list of factors was initially developed from the review of academic literature and
researcher experience in the apparel industry. The list of factors was sent to the research
participants in the form of an online survey via Qualtrics software. Participants were asked to
help refine the list by dragging and dropping these factors into any of the following four groups:
A. Most influential energy consumption factor in the apparel sewing process
B. Factor that falls between groups A and C
C. Least influential energy consumption factor in the apparel sewing process
D. Factor that does not contribute to energy consumption in the apparel sewing process
Apart from the factors mentioned in the Qualtrics Survey, respondents were also asked to
identify any additional factor(s) they think might be influential energy consumption factor(s) in
the apparel sewing process. Table 4.4 summarizes the participants’ responses to the Qualtrics
survey.
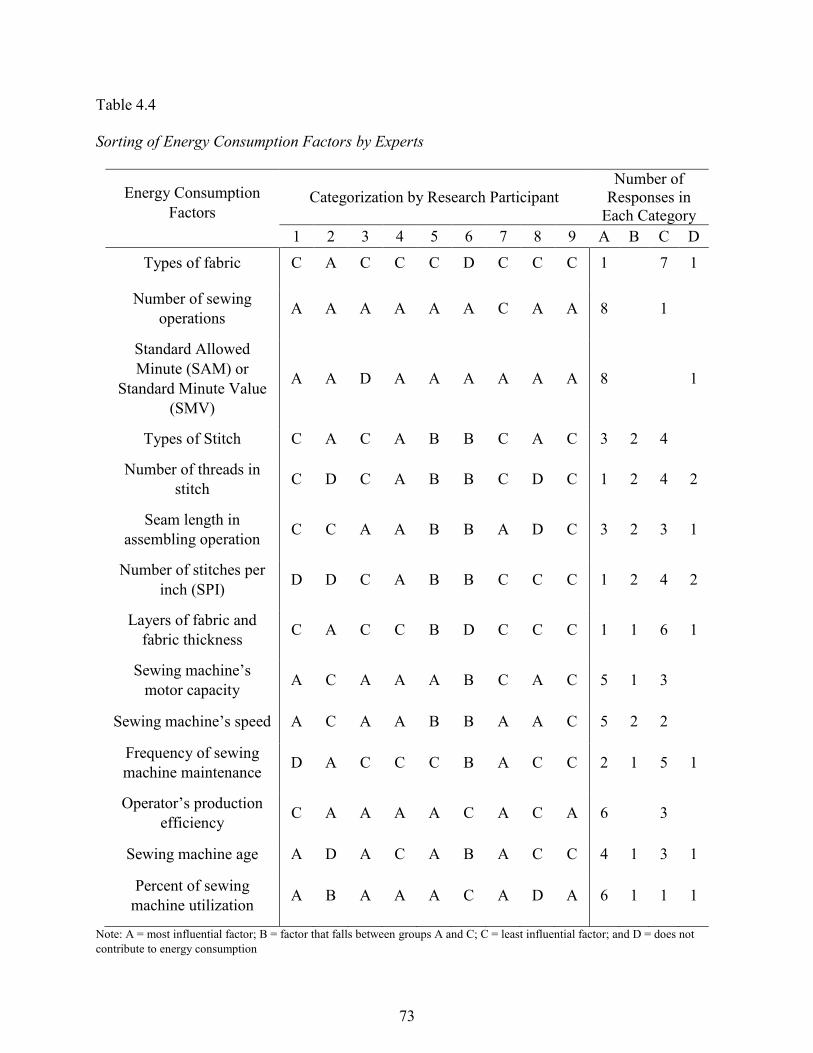
73
Table 4.4
Sorting of Energy Consumption Factors by Experts
Energy Consumption
Factors Categorization by Research Participant
Number of
Responses in
Each Category
1 2 3 4 5 6 7 8 9 A B C D
Types of fabric C A C C C D C C C 1 7 1
Number of sewing
operations A A A A A A C A A 8 1
Standard Allowed
Minute (SAM) or
Standard Minute Value
(SMV)
A A D A A A A A A 8 1
Types of Stitch C A C A B B C A C 3 2 4
Number of threads in
stitch C D C A B B C D C 1 2 4 2
Seam length in
assembling operation C C A A B B A D C 3 2 3 1
Number of stitches per
inch (SPI) D D C A B B C C C 1 2 4 2
Layers of fabric and
fabric thickness C A C C B D C C C 1 1 6 1
Sewing machine’s
motor capacity A C A A A B C A C 5 1 3
Sewing machine’s speed A C A A B B A A C 5 2 2
Frequency of sewing
machine maintenance D A C C C B A C C 2 1 5 1
Operator’s production
efficiency C A A A A C A C A 6 3
Sewing machine age A D A C A B A C C 4 1 3 1
Percent of sewing
machine utilization A B A A A C A D A 6 1 1 1
Note: A = most influential factor; B = factor that falls between groups A and C; C = least influential factor; and D = does not
contribute to energy consumption
74
The experts were asked to explain their reasons for selecting different sewing processes
as highly contributing energy consumption factors from their Qualtrics survey response. Due to
the exploratory nature of this study, the researcher sought explanations in the interview only for
the most influential energy consumption factors. As each factor was selected as most influential
(A) by at least one participant, the researcher determined the most influential factors as
mentioned by the majority (at least by five out of the nine participants). The researcher
conducted an intensive search for factors and their relationships. Having incongruent responses
during semi-structured interviews is somewhat predictable, so this sense-making effort reduced
the chance of erroneous analysis and helped to identify core-consistencies and meanings as well
as similarities and differences between the participants’ responses. As shown in Table 4.4, the
participants identified the most influential energy consumption factors as: number of sewing
operations, Standard Allowed Minute (SAM) or Standard Minute Value (SMV), sewing
machine’s motor capacity, sewing machine’s speed, operator’s production efficiency, and
percent of sewing machine utilization.
Number of sewing operations. Assembling apparel deals with a series of sewing
operations, and eight participants identified number of sewing operations as the most influential
energy consumption factor in the apparel sewing process. The complexity and design of a
garment determine the sequence and the number of sewing operations. Participant 1 described
the sewing complexity of a garment by stating “there's a huge range of complexity from simple
garments to a jacket. The jacket would definitely take a lot more sewing time and have a lot
more stitches in it than a simple garment.” Each sewing operation requires a certain time to
accomplish. The total assembling time for a particular garment can be determined from the sum
of each operation’s sewing time. The sewing time also determines how long the sewing
75
machines need to run. Hence, it is logical that both assembling time and energy consumption
would be higher with the increasing number of sewing operations. Participant 5 pointed to this
link by stating, “Concerning the number of operations is gonna speak to how long that product is
gonna be in assembling. To me, the longer it's gonna be in assembling going back to energy, a lot
more energy it's gonna consume to finish the process.”
The participants illustrated their assertion that sewing operations were the most
influential energy consumption factor with examples. Participant 3 gave an example of a t-shirt
and a lined wool coat and said, “Obviously if you have like (sic) a simple t-shirt … that's gonna
require much less energy than if you're making like a lined wool coat with many many
operations and stuffs.” Similarly, participant 8 offered this example:
Number of sewing operations is how long that garment is on the machine….A very
simple garment that just uses one machine and just has a few operations will have fewer
minutes of a machine running, taking less electricity than let’s say for example apparel
leggings, which basically have an inseam and have a rise seam and then have an elastic
and hem. Basically four operations in two different machines. It's only going to probably
be directly on the sewing machine for 6 minutes whereas if you have a full length coat,
you have several machines, many operations, then you have buttons and button holes and
it is probably on a machine nearly 40 minutes of total sewing time. So, that total sewing
time is the amount of time that sewing machines were up and running and using
electricity.
These participants’ opinions and examples put forward a clear relationship between the
number of sewing operations and energy consumption. The responses of participant 4 and 8
made clear that the number of sewing operations was related to Standard Allowed Minute (SAM)
or Standard Minute Value (SMV). Participant 8 stated, “So, number of operations directly ties
into SAM. Those are probably the most significant factors.” Participant 5 stated, “I think that the
number of sewing operations also has a direct impact on the SAM.” Participant 4 mentioned,
So, more the operations you have, the more machines you have to utilize depending on
the SAM and SMV to balance the line. So, these have a direct relationship. I mean they
76
are pretty much interconnected. The more operations you have, you have to use more
energy with more machines.
However, this factor was not included in the quantitative part of the study because
quantifying energy consumption for a whole garment was not feasible considering the data
collection process. Additionally, mass apparel production deals with different operators using
different sewing machines for different operations. While collecting data, the researcher found
different garments were in the sewing line at the same time. Therefore, it was more practical to
collect energy consumption data from one sewing operator in a specific time period. If the
particular manufacturers in this study had a tailoring system of production, where one operator
sewed all the operations of a garment at a time, number of sewing operations could have been
included in the quantitative study.
Standard allowed minute (SAM) or standard minute value (SMV). SAM or SMV is
the standard time for accomplishing a sewing operation by a trained operator (Babu, 2012). It
consists of both machine time and fabric handling/manipulation time to facilitate the sewing
operation. In the garment industry’s sewing process, the production managers and/or the
industrial engineers use this term to determine time for each operation as well as to set targets for
daily production for that operation. The accumulation of the SAMs of all operations determines
the SAM for the whole garment. If a garment consists of complex elements in sewing, it requires
a higher SAM than for a garment that consists of simple elements.
When selecting SAM as the most influential energy consumption factor, the experts
emphasized time to finish the garment, overall cost, and SAM as a mechanism to reduce idle
time. Participant 8 mentioned SAM as “the dictator of how much energy is gonna go in.” All the
experts pretty much mentioned the same thing about SAM in term of its influence on the energy
consumption. Participant 5 stated, “I think that the number of operations also has a direct impact
77
on the SAM, meaning the more operations, the more minutes that garment is going to require,
the more achievement in the machine, the more energy it's going to consume.” Similar
statements were made by participants 2, 6, and 7. Participant 6 stated,
Basically with a higher SAM, the more complex the assembly of it is. And the more
complex the assembly of a garment is, the more time you can have machines sitting
powered on, but not actually sewing. Because there's a lot of handling and so forth that
goes on to the garment.
Participant 9 gave an elaborate explanation of why he sees SAM or SMV as the most
influential energy consumption factor in comparison to other factors. He linked SAM or SMV
with the sewing efficiency and reducing idle time. He stated,
I think all the things that were listed you can make an argument for being important in
some way but I think it is the total impact to reduce the amount of energy consumption.
It's really about making the system as efficient as possible and that's being very well
engineered and having well trained people who understand the tasks and the tasks are laid
out very clear and the process is simplified to avoid unnecessary manufacturing time and
unnecessary idle time because I feel like there is a lot of wasted minutes in the sewing
operation. So, that was my theory and the things that I selected as being most important.
They were more about well-engineered processes that reduce idle time.
Sewing machine motor capacity and sewing machine speed. Sewing machines are run
by an electric motor and the capacity of the motor is indicated in terms of horsepower (or
sometimes watts). The machine speed is denoted as revolutions per minute (rpm). Both capacity
and speed are written on the nameplate attached outside of the motor. All experts mentioned that
both motor capacity and sewing machine speed are interdependent. Participant 5 stated,
Yes, contingent upon the capacity of the motor is how fast the sewing machine will
function. The faster the machine, more than likely the less time the operator will spend on
it and albeit I don't know this definitively, my thought is, my opinion is that it would
probably consume less electricity if we got it off the machine faster and that's why I gave
that response.

78
Similarly, participant 4 said, “[sewing machine speed] is tied up to the motor capacity, I
believe.” He used a V6 and V4 car engine analogy to establish motor capacity as an energy
consumption factor. He stated, “I'm just thinking, in terms of V6 versus V4 engine for a
car…you might need to burn more gas for V6 than V4… I exactly don't know what the real
relationship would be. But I think motor capacity has a relationship to energy.”
Likewise, participant 8 mentioned her home sewing machine experience while explaining
sewing machine speed as the most influential energy consumption factor. She mentioned, “When
I run my home machine on high, I can actually see the lights in the house dim. I know it’s using
more and more electricity.” She also stated, “machine speed obviously uses more energy.” In
addition to that, she asserted that both motor capacity and sewing machine speed varied by fabric
types (heavy fabric vs. light fabric). She mentioned,
Some sewing machines are special for heavy fabrics and they have a stronger motor
capacity than others. So, some types of machines use a lot more energy than others. It has
to deal with the stitches, how many stitches, how many needles it’s forcing, and the
layers of fabric. Although layers of fabric may not dictate the type of machine, the type of
fabric does. Definitely, the type of stitch definitely dictates the machine. So, if we are
sewing denim for example, it's gonna take a heavier duty engine, heavier duty machine,
the motor capacity has to be stronger and it's gonna use more electricity.
Participant 4 echoed this idea, saying “I believe the motor has to run faster and that way it
might be consuming more energy.” However, the participants gave no objective explanation for
this idea; they just assumed it to be true. While explaining motor capacity and sewing machine
speed as the most influential energy consumption factors, they used sentences such as, “just a
supposition,” “I don’t know whether it’s really significant,” “I’m not an electrician, I really don’t
know,” and “I think this is just conjecture but I would imagine that...” Though experts mentioned
higher speed consumes more energy, a counter argument could be that because higher speed
reduces the time to sew an operation, it consequently reduces energy consumption. In addition,
79
as discussed in more detail in the next section, even though a machine can run in a higher rpm, if
the operator is not skilled enough to run the machine at that speed, energy consumption will be
impacted. In this regard, participant 1 mentioned, “The capacity of sewing machine, some
machines can go a lot faster than others and they are varied by experience then she can get a lot
more done in the same amount of time and that influence the energy consumption.” The
researcher deemed it necessary to investigate further this relationship between sewing machine
motor capacity and sewing machine speed in regards to energy consumption quantitatively
during the factory production observations phase of the study, discussed in RQ3.
Operator production efficiency. Six among nine participants selected sewing operator
production efficiency as the most influential energy consumption factor in the apparel sewing
process. Participant 2 stressed that “operator efficiency is critical in every aspect of the sewing
process.” Experts linked this efficiency factor to manufacturing cost, speed, quality, and
eventually waste. Participant 5 clarified the connection among operator efficiency, sewing speed,
and energy consumption by stating,
It [operator production efficiency] speaks to the amount of time that the product is going
to be in the sewing machine. An operator who is much more highly efficient than their
colleague spends less time on the machine and although I don't have any data to support
this my instinct is that the faster a product gets out of the machine, the less energy it will
consume. I have observed operators sewing for instance, let's say a bottom hem, one
could do it in half the time of the other. My assumption is that the person who does it
quickly will consume less electricity than the person who is keeping the motor running,
sewing at a slower speed. The speed of the sewing by the operators is a direct function of
the energy consumption.
In addition, participant 3 linked machine rpm and machine downtime with the operator’s
efficiency, saying, “an efficient operator is going to be operating at higher rpms and it’s gonna
have much less downtime than an inefficient operator.” Furthermore, a connection between
operator training and operator efficiency was discussed by participant 4: “So, the more trained
80
the operator that means the efficiency is high so that they finish the operation faster and
therefore, they will consume less energy.”
In terms of quality control associated with operator efficiency, it is expected that the
sewing output from an inefficient operator will not be as error-free as it should be from an
efficient operator. An inefficient operator is unproductive in terms of both speed and quality. A
portion of her work might need to be reworked which results in further energy consumption and
a portion of her work might end up as scrap material, which will eventually end up as waste. In
this regard, participant 9 divulged,
It's the skill of the worker that matters. You can have a well-engineered line but if you
have somebody that doesn't understand what is being asked of them then there's a lot of
reworking involved and then, not just consuming more energy you have to go back and
fix something. So the training and skill of the worker I think plays a very important role.
You want to get everything out as error-free as possible, as fast as possible.
Participant 9 also connected operator efficiency to cost savings, saying, “I'm going to go
a little bit to the side with the operator efficiency because in my industry I deal with it costing a
lot.” He came back to connecting efficiency to energy consumption, though, and said,
I always found that operator efficiency, getting the better operator, most experienced
operator, you may spend more [in wages] but in the end you will save more and gain
efficiency which means, you know, conservation of energy. So, if you can squeeze the
process, you lower consumption of energy.
Percent of sewing machine utilization. In a typical apparel sewing operation, a portion
of time is known as machine work time and another portion of time is known as fabric
manipulation time. Machine work time includes when the machine is on, the paddle is engaged,
and all the mechanical gears are engaged (in short, when stitching). Machine utilization percent
is the percent of machine work time in the total operation time. Six experts selected percent of
sewing machine utilization as the most influential energy consumption factor for the apparel
81
sewing process. Participant 4 connected machine utilization percent with energy consumption as
follows:
I know when the machine is on, the motor runs always. When you engage the paddle, the
mechanics will get engaged and then might need more energy. I think there's a difference,
between just the motor running and when the machine is run with the mechanical gears
and everything engaged. I think that's the difference, but I don't know how much that
difference is. So therefore, I think sewing machine utilization, how much time the
machine is on versus how much time it's actually sewing, has a relationship. I think
there's different energy consumption in that case.
From the participants’ opinions, it was found that machine aids (additional features or
functions that are available to the sewing machine to facilitate sewing operations) influence this
machine utilization factor. It also reduced the manual time spent by operators. Participant 1
exemplified this as follows:
Some machines have more functions than others. Like cutting the threads, sometimes
there's even machines that don't cut the thread. So, somebody would have to cut that or it
would be a manual function. If the machine does that it would save time and it would be
a function of the machine. So the higher the machine utilization, it will consume more
energy.
Both participants 7 and 9 urged better capacity and professional planning to reduce the
time the sewing machines sit idle (since they still consume energy), and maximize the efficient
use of the machine. Similarly, participant 3 mentioned, “if you have a style that has higher
utilization of your existing machine and you got 80% of your machines running gonna have a
higher energy consumption.” Participant 5 also made a connection between percent of sewing
machine utilization, number of sewing operations, SAM or SMV, the complexity of garment,
and energy consumption, stating,
Yes, obviously it [sewing machine utilization] is significant and this may be also related
to the standard allowed minutes. The more machine is being utilized and the more
equipment that's being utilized to construct the garment, I think that is a significant
contributing factor to the consumption of energy or electricity. The complexity of the
82
garment, the number of operations and how often the machines are utilized to do that if
that makes it clearer.
Factors by industry type. In addition to being asked about the most influential energy
consumption factors for the apparel sewing process in general, participants were also asked about
these factors as they relate to specific types of apparel manufacturing such as woven, knit, and
sportswear. Participants 1, 4, 5, and 8 said the energy consumption factor they identified as most
influential would remain same regardless of fabric. Participant 1 stated, “Whether it’s knit or
woven, yes, I think the factors would be the same.” Participant 4 said, “Of course, they [most
influential energy consumption factors] will. They will act in the same way irrespective to what
the industry is.” Participant 8 agreed that energy consumption factors remain same regardless of
the product. She said, “I would say the factors that you have included which directly relates to
the sewing process, the answers to those questions are identical across all aspects of the apparel
industry.” She stressed that the number of operations and the SAM (or SMV) dictate energy
consumption rather than fabric type. However, it is conceivable that both number of sewing
operations and SAM might change with product differentiation. Participant 5 elaborated on this
point:
I don't think that the product differentiation between different market segments is going
to have an impact. I think it's pretty much going to be the same throughout the products
that you discussed and it all gets back to the matter of the other criteria that we said. In
other words, a woven or knitted garment depending on how many standard allowed
minutes there are in each of those products is gonna be the direct function as to the
consumption of the energy. I don't think the products matter as much as what is involved
in assembling those products.
On the contrary, participants 2, 3, and 8 thought the most influential energy consumption
factor might vary according to the specific segment of apparel industry. These participants
identified variables such as product complexity, operator efficiency, fabric handling difficulty
83
(heavier fabric vs. thinner slippery fabric), and stitch and seam intricacy. For example,
participant 2 explained that the sportswear industry uses a wide variety of fabrics, from thinner,
more slippery fabric to thicker pile fabrics and said that an operator’s efficiency in handling
these fabrics plays a role in how much energy is consumed. Participant 3 provided this
observation:
I think that probably there is a difference whether you're running knits or wovens
regardless of it being sportwear or outerwear or innerwear or careerwear, I think there's
gonna be less energy consumption for knits because they don't require as complicated of
a stitch and seam classes and they are a little bit easier, quicker to assemble in my opinion
anyway.
Additional factors identified by industry experts. A follow up interview question
asked if participants wished to add any additional factor(s) that might contribute to energy
consumption of the apparel sewing process. Participant 2 stated, “Your list is pretty broad. Some
of the areas I never actually thought about, some of the areas to me are very consistent.”
Participant 3 said “I think you pretty much done a good job of covering everything.” Participant
8 mentioned, “In just the sewing process, you are very thorough.”
Participants mentioned a number of additional factors that were influencing energy
consumption to the apparel industry as a whole instead of the sewing process only. These factors
related to production (direct and supportive elements) and waste. Factors related to direct
production elements were running machines for cutting, finishing, and packaging (participants 3
and 4), operating handling equipment such as conveyors and trollies (participant 4), production
display units such as monitors to illustrate workflow, product information, and production rate
(participant 4), and creating steam for pressing (participant 5). Energy consumption factors
related to production supportive elements were heating and cooling to maintain appropriate room
temperature (participants 1, 3, and 4), lighting (participants 3 and 4), equipment for
84
administrative work (participants 3, 4, and 9), and sometimes cooking (participant 1). Participant
9 referred to direct production elements as specific construction issues and production supportive
elements as tangential issues. He encompassed many of the abstract thoughts expressed by other
participants in this statement:
I think the list covers the specific issues but I think that there's tangent issues so like
facility energy requirements while you are doing that…so, you have to heat or cool the
room and there is energy requirements associated with that or even just sustaining of the
people you have restroom facilities or the lounge and refrigerator all those other things,
copiers. Computers are used in the process, in order to make that happen you have to
have the people available and there are things that support them being able to do their
job. The specific construction elements I think you covered in here.
Participants 7 and 8 added factors related to waste. Participant 8 said, “Waste is a huge
factor in this industry.” She also mentioned, “It’s truly waste that is (sic) I see as our largest
problem in what we spend time and energy making garments that nobody buys and end up going
on sales.” Participant 7 linked quality control issue with operator skill and scrapping garments.
He mentioned, “You’re also wasting whatever energy went into sewing them [scrapped
garments].” Since the list of factors included operator efficiency (a quantitative way of
measuring operator skill) as an energy consumption factor, the researcher believed that waste as
an energy consumption factor was indirectly covered in this study. However, waste that results
from overproduction, dealt by sales forecasting and production-planning departments, was an
issue that will need another study to address.
RQ2: Most Influential Energy Consumption Factors Identified by Statistical Analysis
As explained earlier, number of sewing operations was not included in the quantitative
analysis. In addition, types of stitch, sewing machine age, and frequency of maintenance were
not included. Types of stitch was not included as a factor because each sewing operation would
85
be completed using a particular stitch on a single machine. So, the number of threads on a
specific sewing machine represented a specific type of stitch and hence, stitch type would be a
redundant variable. For instance, a serger machine with three threads represents a 3-thread
serging stitch (a stitch type) whereas the same machine with four threads represents a 4-thread
serging stitch (another stitch type). Moreover, instead of types of stitch, number of threads was
easy to analyze because of its quantitative nature. Though it was found from the literature that
both sewing machine age and frequency of sewing machine maintenance influence the apparel
production (Juan, 1998) and hence, energy consumption of a sewing machine, these two
variables were not included in the data collected. This decision was made because the three
factories did not maintain maintenance records and were unable to provide any reliable
information.
On the other hand, number of fabric layers and total fabric thickness was combined as
one factor in the qualitative study, but they were used as separate variables in the quantitative
part. Initially, they seemed redundant. However, while collecting data, the researcher found
examples of two different fabrics with different thickness being sewn together. Both thickness
and layers made the fabric manipulation complex, thereby influencing energy consumption in
different ways.
In the quantitative analysis, energy consumption was considered a dependent variable and
other factors (e.g., sewing machine motor speed, motor capacity, seam length, SPI, number of
threads, SAM, operator production efficiency, machine utilization, layers of fabric, fabric
thickness, and type of fabric) were considered independent variables. By using statistical
software STATA version 12.0, a multiple linear regression analysis was computed.
86
Some variables (e.g., type of fabric, motor capacity, energy consumption, operator
efficiency, and sewing machine utilization) were converted to quantitative data or transformed
into similar units of measurement (e.g. watts) to ease comparison prior to statistical analysis.
Since type of fabric (e.g., knit, woven) had no quantitative value, a dummy variable was
implemented to convert type of fabric into a numeric value. This dummy variable created three
variables: knit (Fab 1), sportswear (Fab 2), and woven (Fab 3). In the statistical analysis, one
fabric type must be held constant (omitted) in order to test the effect of the other two. In addition,
an energy consumption unit and motor capacity unit were converted from kilowatt-hour (kWh)
to watt-minute (Wmin) and horsepower to watts, respectively, in order to maintain unit
consistency. Finally, operator production efficiency and percent of sewing machine utilization
were converted from percentages to decimal values. An example of quantitative data set was
given in Appendix C.
An initial multiple regression analysis was performed to test the influence of all 11
independent variables (including one dummy variable) on the dependent variable (energy
consumption). This analysis also indicated how much better the function predicts the dependent
variable from the adjusted coefficient of multiple determination (Ra2) value. The results of the
regression model are shown in Table 4.5.
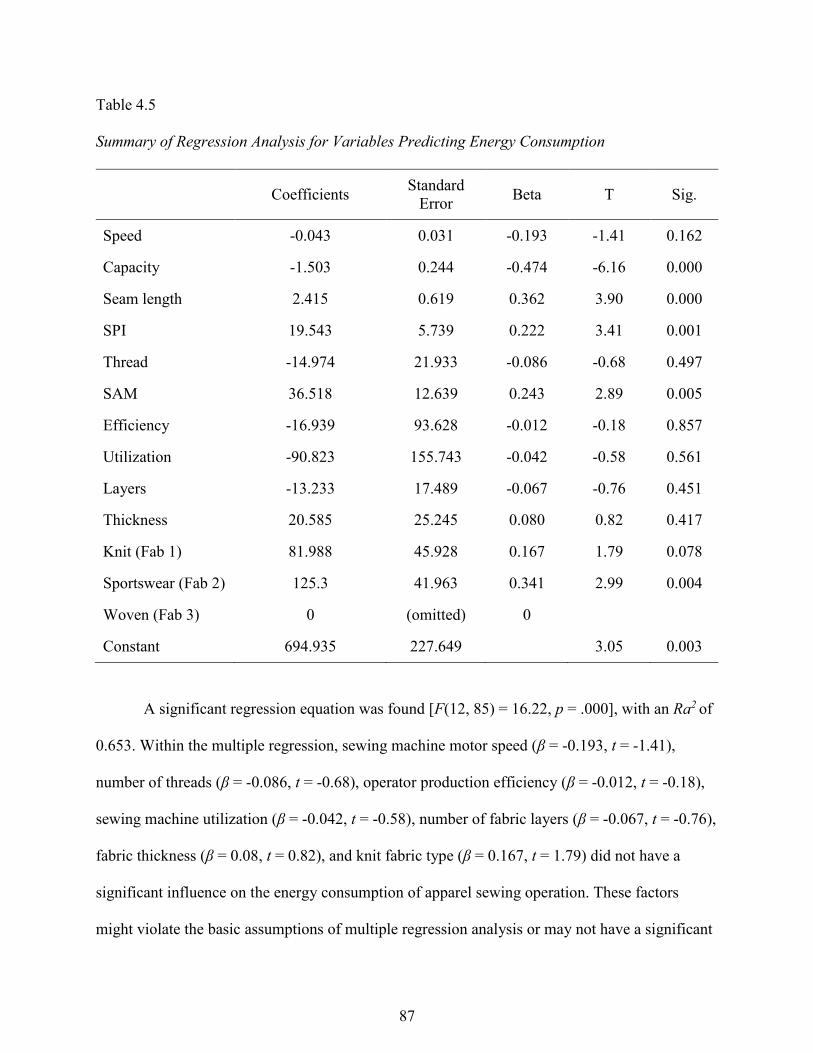
87
Table 4.5
Summary of Regression Analysis for Variables Predicting Energy Consumption
Coefficients Standard
Error Beta T Sig.
Speed -0.043 0.031 -0.193 -1.41 0.162
Capacity -1.503 0.244 -0.474 -6.16 0.000
Seam length 2.415 0.619 0.362 3.90 0.000
SPI 19.543 5.739 0.222 3.41 0.001
Thread -14.974 21.933 -0.086 -0.68 0.497
SAM 36.518 12.639 0.243 2.89 0.005
Efficiency -16.939 93.628 -0.012 -0.18 0.857
Utilization -90.823 155.743 -0.042 -0.58 0.561
Layers -13.233 17.489 -0.067 -0.76 0.451
Thickness 20.585 25.245 0.080 0.82 0.417
Knit (Fab 1) 81.988 45.928 0.167 1.79 0.078
Sportswear (Fab 2) 125.3 41.963 0.341 2.99 0.004
Woven (Fab 3) 0 (omitted) 0
Constant 694.935 227.649 3.05 0.003
A significant regression equation was found [F(12, 85) = 16.22, p = .000], with an Ra2 of
0.653. Within the multiple regression, sewing machine motor speed (β = -0.193, t = -1.41),
number of threads (β = -0.086, t = -0.68), operator production efficiency (β = -0.012, t = -0.18),
sewing machine utilization (β = -0.042, t = -0.58), number of fabric layers (β = -0.067, t = -0.76),
fabric thickness (β = 0.08, t = 0.82), and knit fabric type (β = 0.167, t = 1.79) did not have a
significant influence on the energy consumption of apparel sewing operation. These factors
might violate the basic assumptions of multiple regression analysis or may not have a significant
88
influence on the energy consumption at all. On the other hand, other factors or independent
variables such as motor capacity (β = -0.474, t = -6.16), seam length (β = 0.362, t = 3.90), SPI (β
= 0.222, t = 3.41), SAM (β = 0.243, t = 2.89), and sportswear fabric type (β = 0.341, t = -2.99)
had a significant influence on the energy consumption. Since type of fabric was a dummy
variable and there was collinearity among different types, woven fabric type was omitted by the
analysis.
It is known that beta coefficients (β) represent explanatory power of each independent
variable and measure how strongly each independent variable influences the dependent variable.
Based on higher absolute β value, a sub-regression analysis was performed to test the influence
of six independent variables (e.g., motor capacity, seam length, sportswear fabric type, SAM,
SPI, and sewing machine motor speed) over the dependent variable (energy consumption). In the
case of motor speed, literature (Rogale et al., 2005) directly supported its influence on energy
consumption and the higher β value explains its explanatory power even though motor speed was
found to have non-significant influence (p > .05) on energy consumption. This indicated that the
non-significant influence of motor speed may be occurring due to noncompliance with basic
assumptions of multiple regression and hence, it was included in the subsequent regression
model along with testing assumptions. The remaining factors depicted very small effect size (i.e.,
lower absolute β value), did not hold stronger explanatory power and hence, were not included
the subsequent multiple regression analysis. The stepwise regression analysis validated the
choice to use these same six independent variables. The results of the sub-regression model are
shown in Table 4.6.
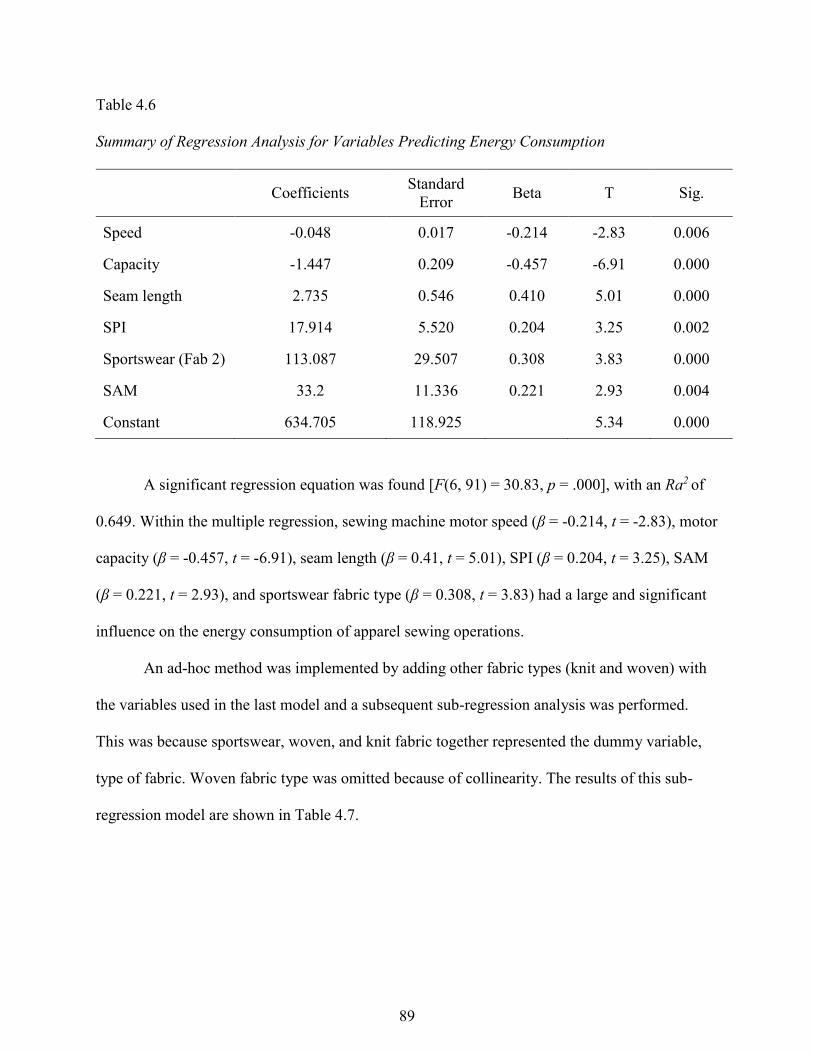
89
Table 4.6
Summary of Regression Analysis for Variables Predicting Energy Consumption
Coefficients Standard
Error Beta T Sig.
Speed -0.048 0.017 -0.214 -2.83 0.006
Capacity -1.447 0.209 -0.457 -6.91 0.000
Seam length 2.735 0.546 0.410 5.01 0.000
SPI 17.914 5.520 0.204 3.25 0.002
Sportswear (Fab 2) 113.087 29.507 0.308 3.83 0.000
SAM 33.2 11.336 0.221 2.93 0.004
Constant 634.705 118.925 5.34 0.000
A significant regression equation was found [F(6, 91) = 30.83, p = .000], with an Ra2 of
0.649. Within the multiple regression, sewing machine motor speed (β = -0.214, t = -2.83), motor
capacity (β = -0.457, t = -6.91), seam length (β = 0.41, t = 5.01), SPI (β = 0.204, t = 3.25), SAM
(β = 0.221, t = 2.93), and sportswear fabric type (β = 0.308, t = 3.83) had a large and significant
influence on the energy consumption of apparel sewing operations.
An ad-hoc method was implemented by adding other fabric types (knit and woven) with
the variables used in the last model and a subsequent sub-regression analysis was performed.
This was because sportswear, woven, and knit fabric together represented the dummy variable,
type of fabric. Woven fabric type was omitted because of collinearity. The results of this sub-
regression model are shown in Table 4.7.
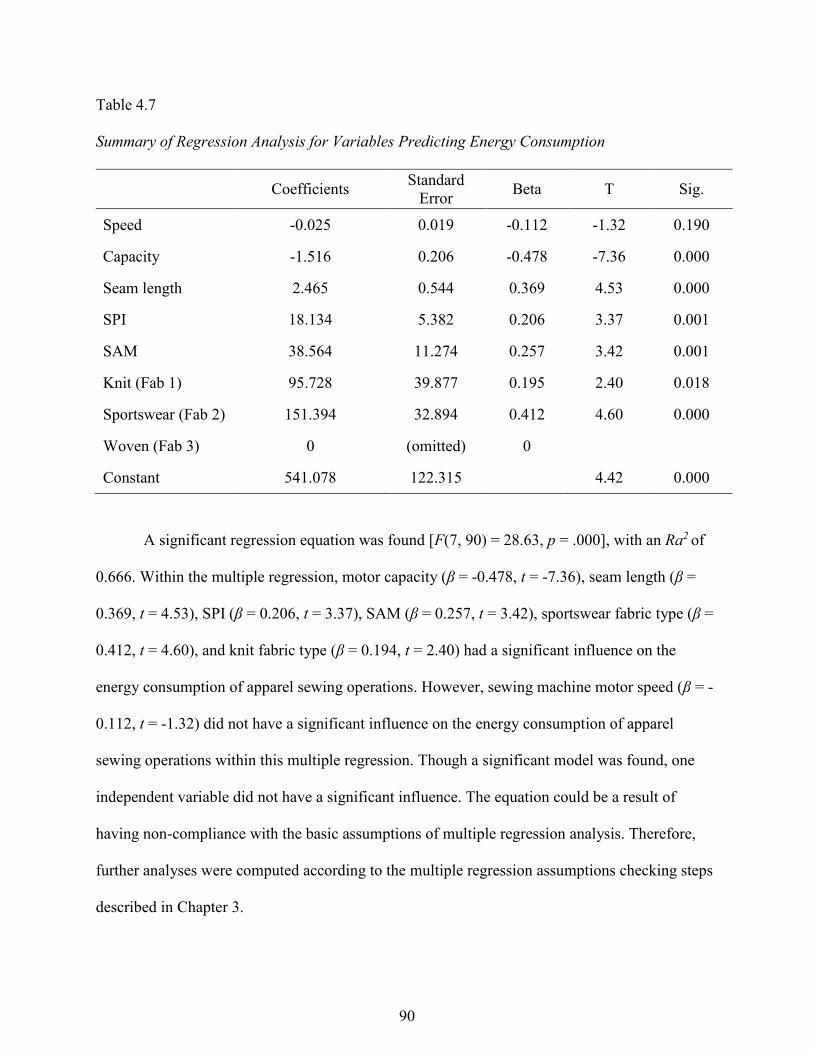
90
Table 4.7
Summary of Regression Analysis for Variables Predicting Energy Consumption
Coefficients Standard
Error Beta T Sig.
Speed -0.025 0.019 -0.112 -1.32 0.190
Capacity -1.516 0.206 -0.478 -7.36 0.000
Seam length 2.465 0.544 0.369 4.53 0.000
SPI 18.134 5.382 0.206 3.37 0.001
SAM 38.564 11.274 0.257 3.42 0.001
Knit (Fab 1) 95.728 39.877 0.195 2.40 0.018
Sportswear (Fab 2) 151.394 32.894 0.412 4.60 0.000
Woven (Fab 3) 0 (omitted) 0
Constant 541.078 122.315 4.42 0.000
A significant regression equation was found [F(7, 90) = 28.63, p = .000], with an Ra2 of
0.666. Within the multiple regression, motor capacity (β = -0.478, t = -7.36), seam length (β =
0.369, t = 4.53), SPI (β = 0.206, t = 3.37), SAM (β = 0.257, t = 3.42), sportswear fabric type (β =
0.412, t = 4.60), and knit fabric type (β = 0.194, t = 2.40) had a significant influence on the
energy consumption of apparel sewing operations. However, sewing machine motor speed (β = -
0.112, t = -1.32) did not have a significant influence on the energy consumption of apparel
sewing operations within this multiple regression. Though a significant model was found, one
independent variable did not have a significant influence. The equation could be a result of
having non-compliance with the basic assumptions of multiple regression analysis. Therefore,
further analyses were computed according to the multiple regression assumptions checking steps
described in Chapter 3.
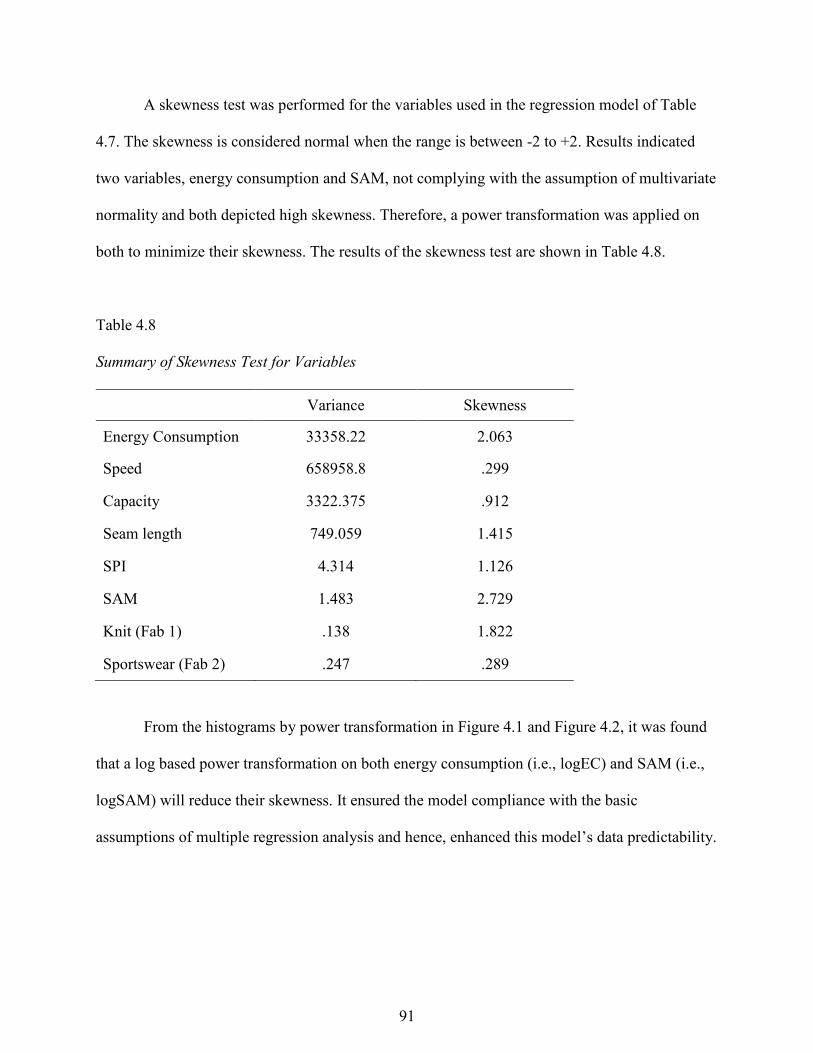
91
A skewness test was performed for the variables used in the regression model of Table
4.7. The skewness is considered normal when the range is between -2 to +2. Results indicated
two variables, energy consumption and SAM, not complying with the assumption of multivariate
normality and both depicted high skewness. Therefore, a power transformation was applied on
both to minimize their skewness. The results of the skewness test are shown in Table 4.8.
Table 4.8
Summary of Skewness Test for Variables
Variance Skewness
Energy Consumption 33358.22 2.063
Speed 658958.8 .299
Capacity 3322.375 .912
Seam length 749.059 1.415
SPI 4.314 1.126
SAM 1.483 2.729
Knit (Fab 1) .138 1.822
Sportswear (Fab 2) .247 .289
From the histograms by power transformation in Figure 4.1 and Figure 4.2, it was found
that a log based power transformation on both energy consumption (i.e., logEC) and SAM (i.e.,
logSAM) will reduce their skewness. It ensured the model compliance with the basic
assumptions of multiple regression analysis and hence, enhanced this model’s data predictability.
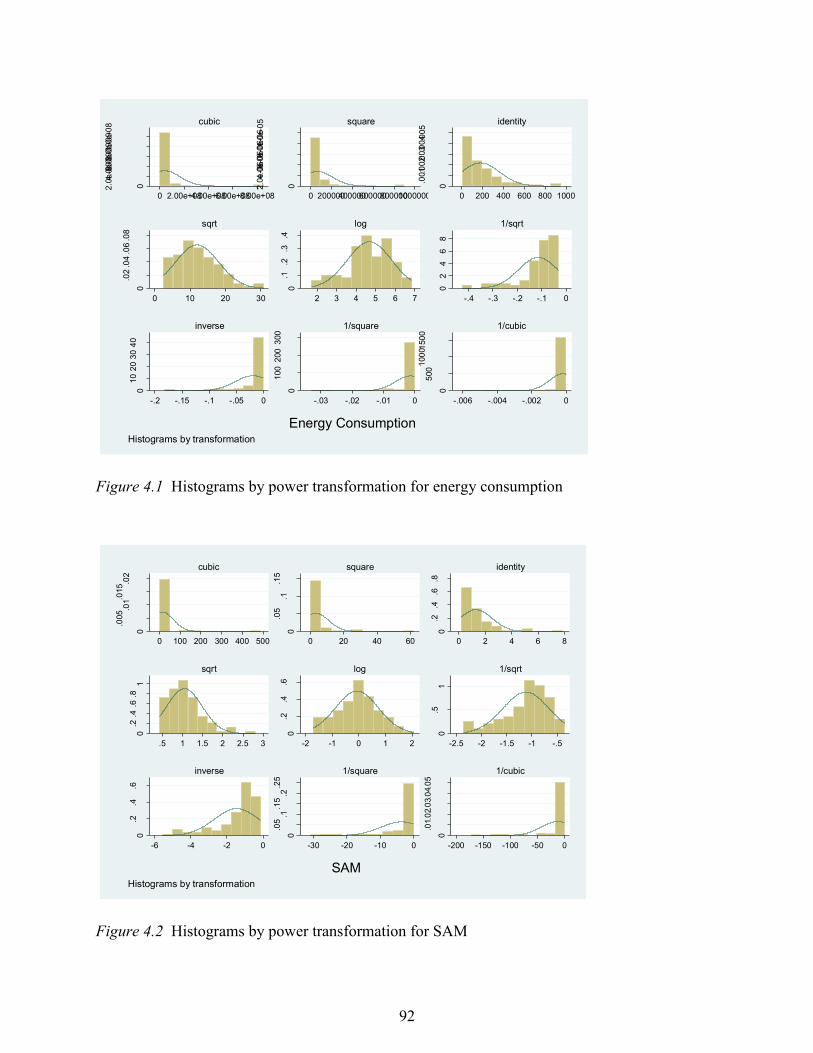
92
Figure 4.1 Histograms by power transformation for energy consumption
Figure 4.2 Histograms by power transformation for SAM
02.0
e-0
94
.0e
-09
6.0
e-0
98
.0e
-09
1.0
e-0
8
0 2.00e+084.00e+086.00e+088.00e+08
cubic
02.0
e-0
64
.0e
-06
6.0
e-0
68
.0e
-06
1.0
e-0
5
0 2000004000006000008000001000000
square
0
.001.0
02.0
03.0
04 .0
05
0 200 400 600 800 1000
identity
0
.02
.04
.06
.08
0 10 20 30
sqrt
0.1
.2.3
.4
2 3 4 5 6 7
log
02
46
8
-.4 -.3 -.2 -.1 0
1/sqrt
01
02
03
04
0
-.2 -.15 -.1 -.05 0
inverse
0
100
200
300
-.03 -.02 -.01 0
1/square
0
500
100
0 150
0
-.006 -.004 -.002 0
1/cubic
De
nsity
Energy ConsumptionHistograms by transformation
0
.005.0
1.015.0
2
0 100 200 300 400 500
cubic
0
.05
.1.1
5
0 20 40 60
square
0.2
.4.6
.8
0 2 4 6 8
identity
0.2
.4.6
.81
.5 1 1.5 2 2.5 3
sqrt
0.2
.4.6
-2 -1 0 1 2
log
0.5
1
-2.5 -2 -1.5 -1 -.5
1/sqrt
0.2
.4.6
-6 -4 -2 0
inverse
0
.05
.1.1
5.2
.25
-30 -20 -10 0
1/square
0
.01.
02.
03.
04.
05
-200 -150 -100 -50 0
1/cubic
De
nsity
SAM Histograms by transformation
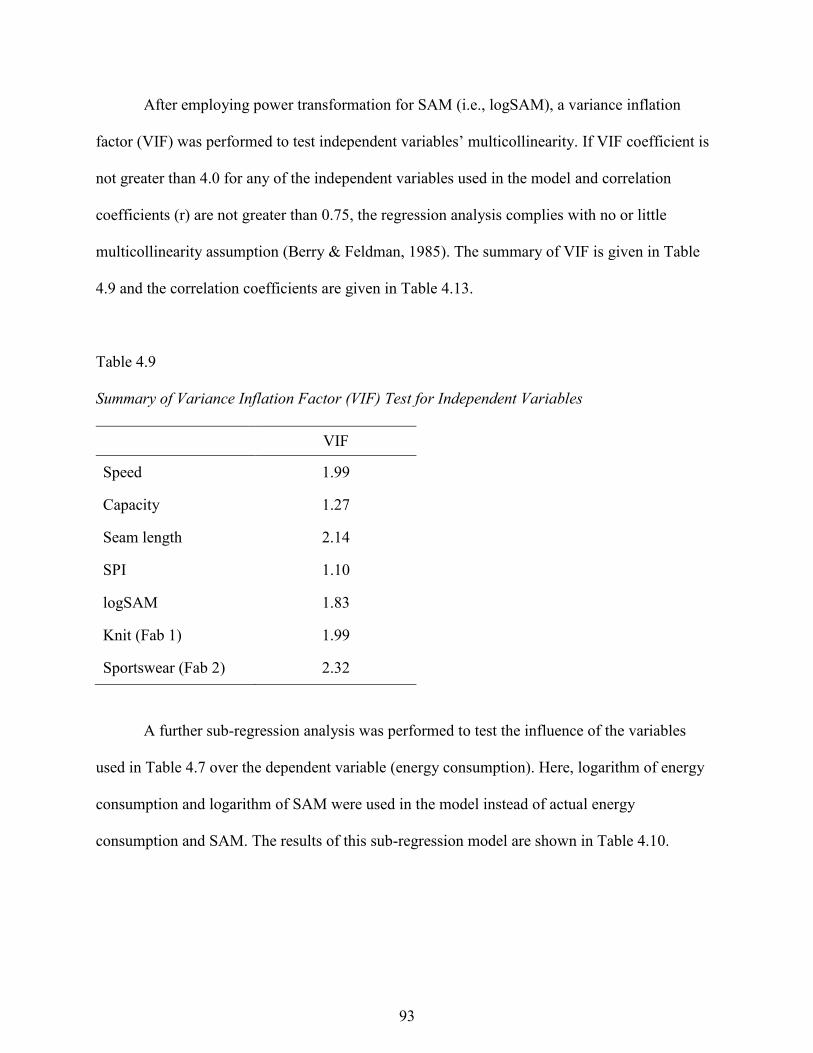
93
After employing power transformation for SAM (i.e., logSAM), a variance inflation
factor (VIF) was performed to test independent variables’ multicollinearity. If VIF coefficient is
not greater than 4.0 for any of the independent variables used in the model and correlation
coefficients (r) are not greater than 0.75, the regression analysis complies with no or little
multicollinearity assumption (Berry & Feldman, 1985). The summary of VIF is given in Table
4.9 and the correlation coefficients are given in Table 4.13.
Table 4.9
Summary of Variance Inflation Factor (VIF) Test for Independent Variables
VIF
Speed 1.99
Capacity 1.27
Seam length 2.14
SPI 1.10
logSAM 1.83
Knit (Fab 1) 1.99
Sportswear (Fab 2) 2.32
A further sub-regression analysis was performed to test the influence of the variables
used in Table 4.7 over the dependent variable (energy consumption). Here, logarithm of energy
consumption and logarithm of SAM were used in the model instead of actual energy
consumption and SAM. The results of this sub-regression model are shown in Table 4.10.
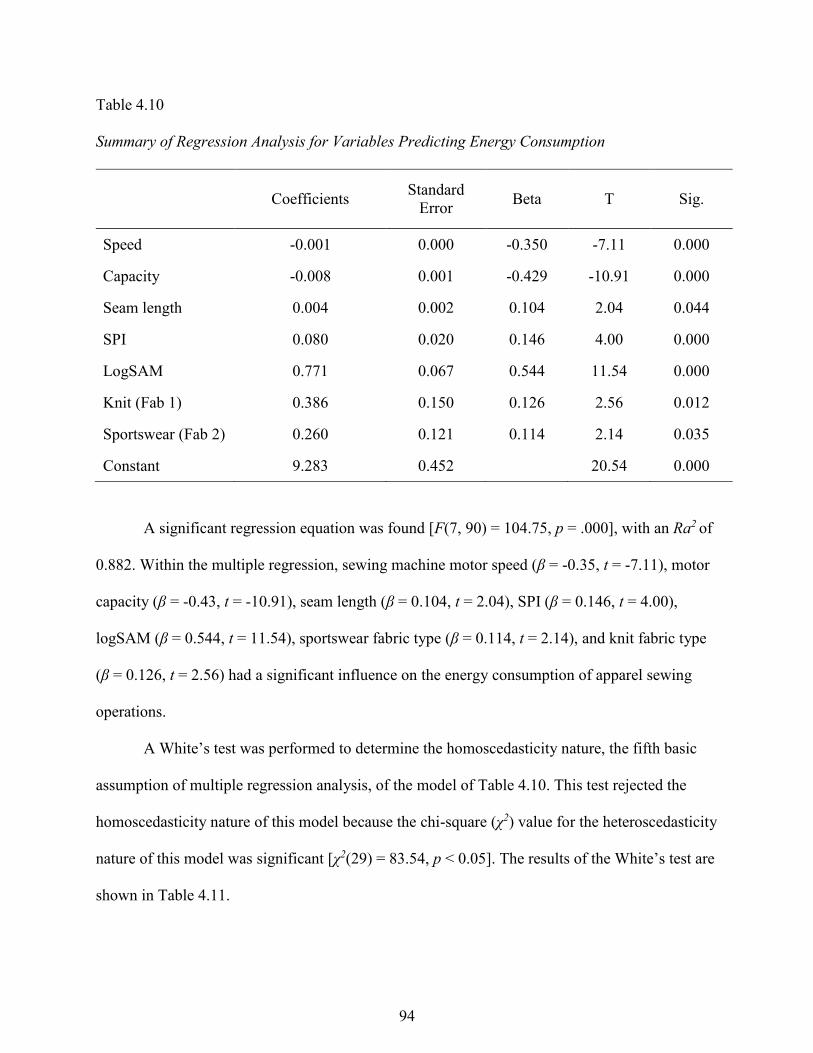
94
Table 4.10
Summary of Regression Analysis for Variables Predicting Energy Consumption
Coefficients Standard
Error Beta T Sig.
Speed -0.001 0.000 -0.350 -7.11 0.000
Capacity -0.008 0.001 -0.429 -10.91 0.000
Seam length 0.004 0.002 0.104 2.04 0.044
SPI 0.080 0.020 0.146 4.00 0.000
LogSAM 0.771 0.067 0.544 11.54 0.000
Knit (Fab 1) 0.386 0.150 0.126 2.56 0.012
Sportswear (Fab 2) 0.260 0.121 0.114 2.14 0.035
Constant 9.283 0.452 20.54 0.000
A significant regression equation was found [F(7, 90) = 104.75, p = .000], with an Ra2 of
0.882. Within the multiple regression, sewing machine motor speed (β = -0.35, t = -7.11), motor
capacity (β = -0.43, t = -10.91), seam length (β = 0.104, t = 2.04), SPI (β = 0.146, t = 4.00),
logSAM (β = 0.544, t = 11.54), sportswear fabric type (β = 0.114, t = 2.14), and knit fabric type
(β = 0.126, t = 2.56) had a significant influence on the energy consumption of apparel sewing
operations.
A White’s test was performed to determine the homoscedasticity nature, the fifth basic
assumption of multiple regression analysis, of the model of Table 4.10. This test rejected the
homoscedasticity nature of this model because the chi-square (χ2) value for the heteroscedasticity
nature of this model was significant [χ2(29) = 83.54, p < 0.05]. The results of the White’s test are
shown in Table 4.11.
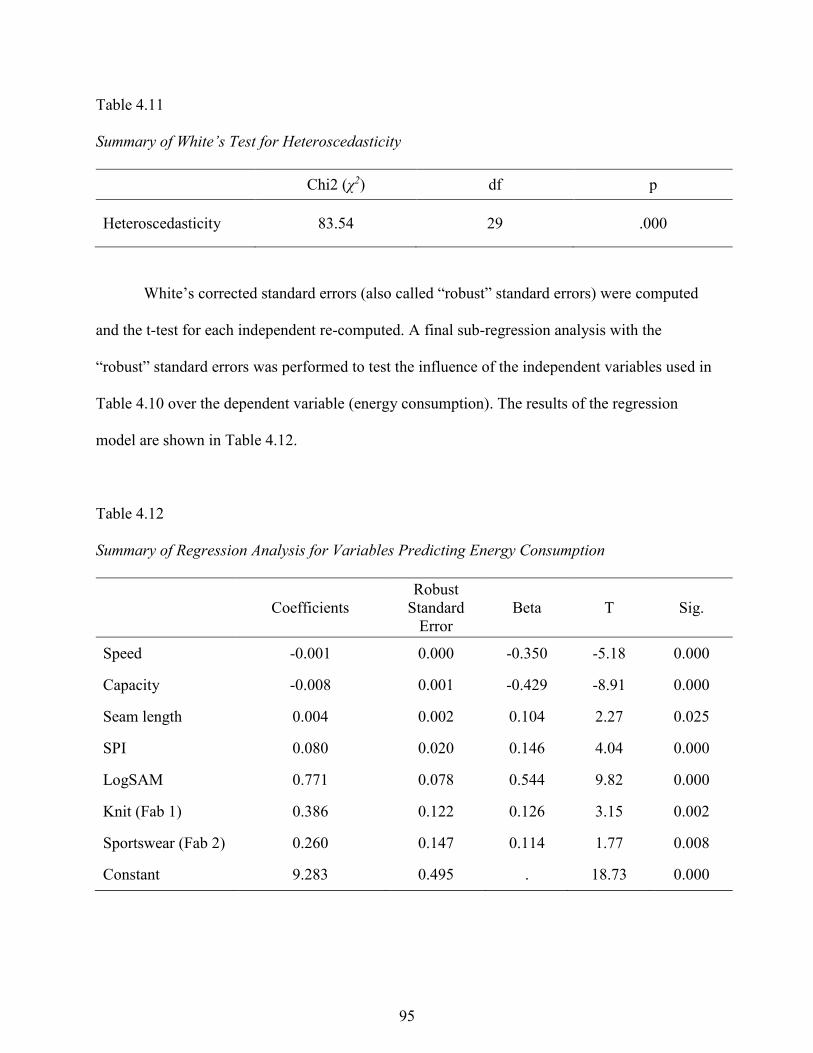
95
Table 4.11
Summary of White’s Test for Heteroscedasticity
Chi2 (χ2) df p
Heteroscedasticity 83.54 29 .000
White’s corrected standard errors (also called “robust” standard errors) were computed
and the t-test for each independent re-computed. A final sub-regression analysis with the
“robust” standard errors was performed to test the influence of the independent variables used in
Table 4.10 over the dependent variable (energy consumption). The results of the regression
model are shown in Table 4.12.
Table 4.12
Summary of Regression Analysis for Variables Predicting Energy Consumption
Coefficients
Robust
Standard
Error
Beta T Sig.
Speed -0.001 0.000 -0.350 -5.18 0.000
Capacity -0.008 0.001 -0.429 -8.91 0.000
Seam length 0.004 0.002 0.104 2.27 0.025
SPI 0.080 0.020 0.146 4.04 0.000
LogSAM 0.771 0.078 0.544 9.82 0.000
Knit (Fab 1) 0.386 0.122 0.126 3.15 0.002
Sportswear (Fab 2) 0.260 0.147 0.114 1.77 0.008
Constant 9.283 0.495 . 18.73 0.000
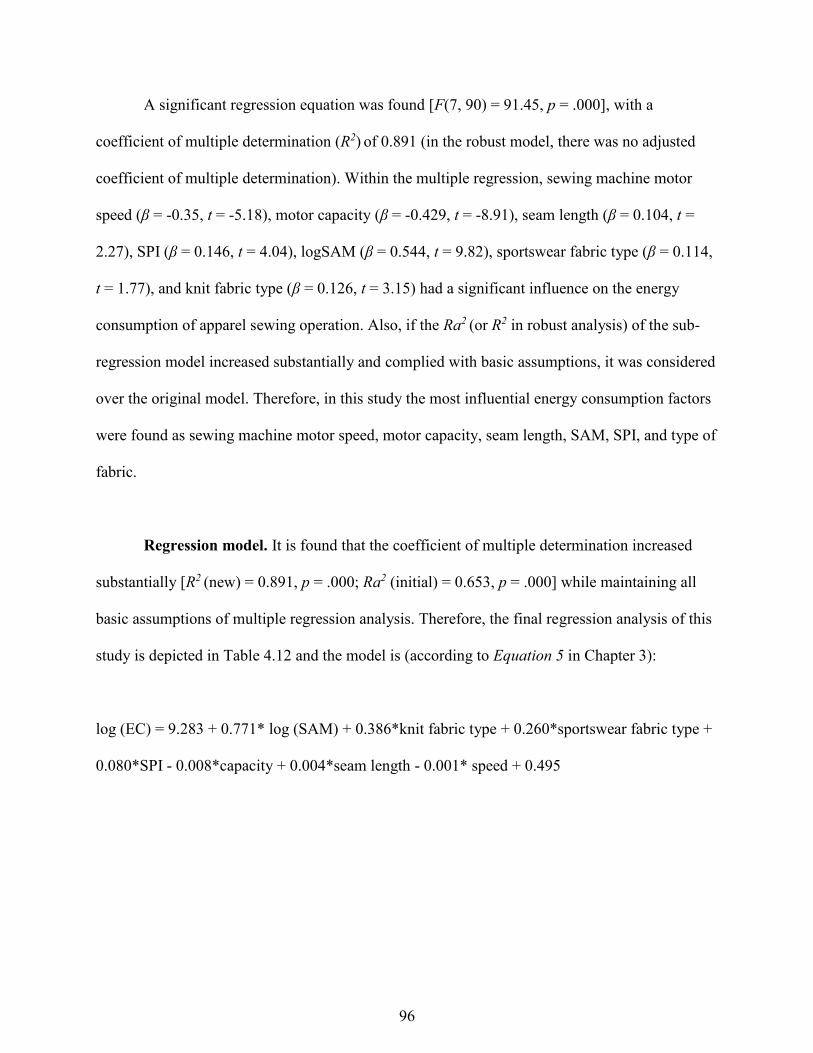
96
A significant regression equation was found [F(7, 90) = 91.45, p = .000], with a
coefficient of multiple determination (R2) of 0.891 (in the robust model, there was no adjusted
coefficient of multiple determination). Within the multiple regression, sewing machine motor
speed (β = -0.35, t = -5.18), motor capacity (β = -0.429, t = -8.91), seam length (β = 0.104, t =
2.27), SPI (β = 0.146, t = 4.04), logSAM (β = 0.544, t = 9.82), sportswear fabric type (β = 0.114,
t = 1.77), and knit fabric type (β = 0.126, t = 3.15) had a significant influence on the energy
consumption of apparel sewing operation. Also, if the Ra2 (or R2 in robust analysis) of the sub-
regression model increased substantially and complied with basic assumptions, it was considered
over the original model. Therefore, in this study the most influential energy consumption factors
were found as sewing machine motor speed, motor capacity, seam length, SAM, SPI, and type of
fabric.
Regression model. It is found that the coefficient of multiple determination increased
substantially [R2 (new) = 0.891, p = .000; Ra2 (initial) = 0.653, p = .000] while maintaining all
basic assumptions of multiple regression analysis. Therefore, the final regression analysis of this
study is depicted in Table 4.12 and the model is (according to Equation 5 in Chapter 3):
log (EC) = 9.283 + 0.771* log (SAM) + 0.386*knit fabric type + 0.260*sportswear fabric type +
0.080*SPI - 0.008*capacity + 0.004*seam length - 0.001* speed + 0.495
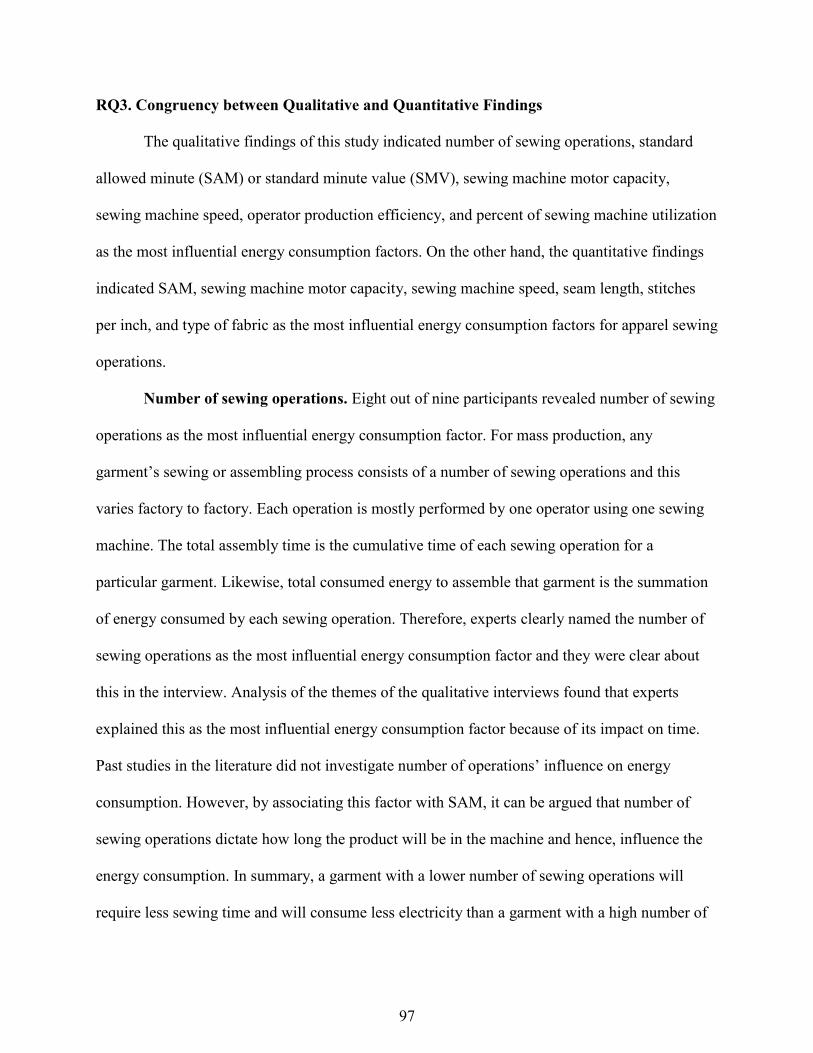
97
RQ3. Congruency between Qualitative and Quantitative Findings
The qualitative findings of this study indicated number of sewing operations, standard
allowed minute (SAM) or standard minute value (SMV), sewing machine motor capacity,
sewing machine speed, operator production efficiency, and percent of sewing machine utilization
as the most influential energy consumption factors. On the other hand, the quantitative findings
indicated SAM, sewing machine motor capacity, sewing machine speed, seam length, stitches
per inch, and type of fabric as the most influential energy consumption factors for apparel sewing
operations.
Number of sewing operations. Eight out of nine participants revealed number of sewing
operations as the most influential energy consumption factor. For mass production, any
garment’s sewing or assembling process consists of a number of sewing operations and this
varies factory to factory. Each operation is mostly performed by one operator using one sewing
machine. The total assembly time is the cumulative time of each sewing operation for a
particular garment. Likewise, total consumed energy to assemble that garment is the summation
of energy consumed by each sewing operation. Therefore, experts clearly named the number of
sewing operations as the most influential energy consumption factor and they were clear about
this in the interview. Analysis of the themes of the qualitative interviews found that experts
explained this as the most influential energy consumption factor because of its impact on time.
Past studies in the literature did not investigate number of operations’ influence on energy
consumption. However, by associating this factor with SAM, it can be argued that number of
sewing operations dictate how long the product will be in the machine and hence, influence the
energy consumption. In summary, a garment with a lower number of sewing operations will
require less sewing time and will consume less electricity than a garment with a high number of
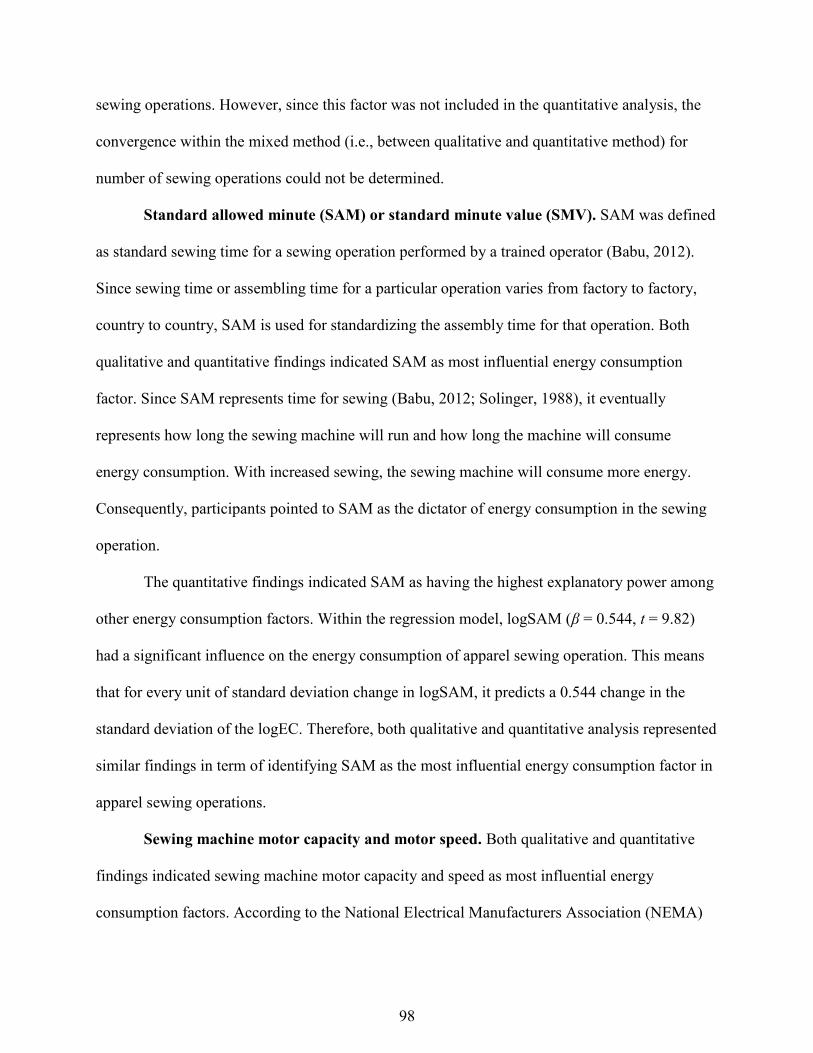
98
sewing operations. However, since this factor was not included in the quantitative analysis, the
convergence within the mixed method (i.e., between qualitative and quantitative method) for
number of sewing operations could not be determined.
Standard allowed minute (SAM) or standard minute value (SMV). SAM was defined
as standard sewing time for a sewing operation performed by a trained operator (Babu, 2012).
Since sewing time or assembling time for a particular operation varies from factory to factory,
country to country, SAM is used for standardizing the assembly time for that operation. Both
qualitative and quantitative findings indicated SAM as most influential energy consumption
factor. Since SAM represents time for sewing (Babu, 2012; Solinger, 1988), it eventually
represents how long the sewing machine will run and how long the machine will consume
energy consumption. With increased sewing, the sewing machine will consume more energy.
Consequently, participants pointed to SAM as the dictator of energy consumption in the sewing
operation.
The quantitative findings indicated SAM as having the highest explanatory power among
other energy consumption factors. Within the regression model, logSAM (β = 0.544, t = 9.82)
had a significant influence on the energy consumption of apparel sewing operation. This means
that for every unit of standard deviation change in logSAM, it predicts a 0.544 change in the
standard deviation of the logEC. Therefore, both qualitative and quantitative analysis represented
similar findings in term of identifying SAM as the most influential energy consumption factor in
apparel sewing operations.
Sewing machine motor capacity and motor speed. Both qualitative and quantitative
findings indicated sewing machine motor capacity and speed as most influential energy
consumption factors. According to the National Electrical Manufacturers Association (NEMA)
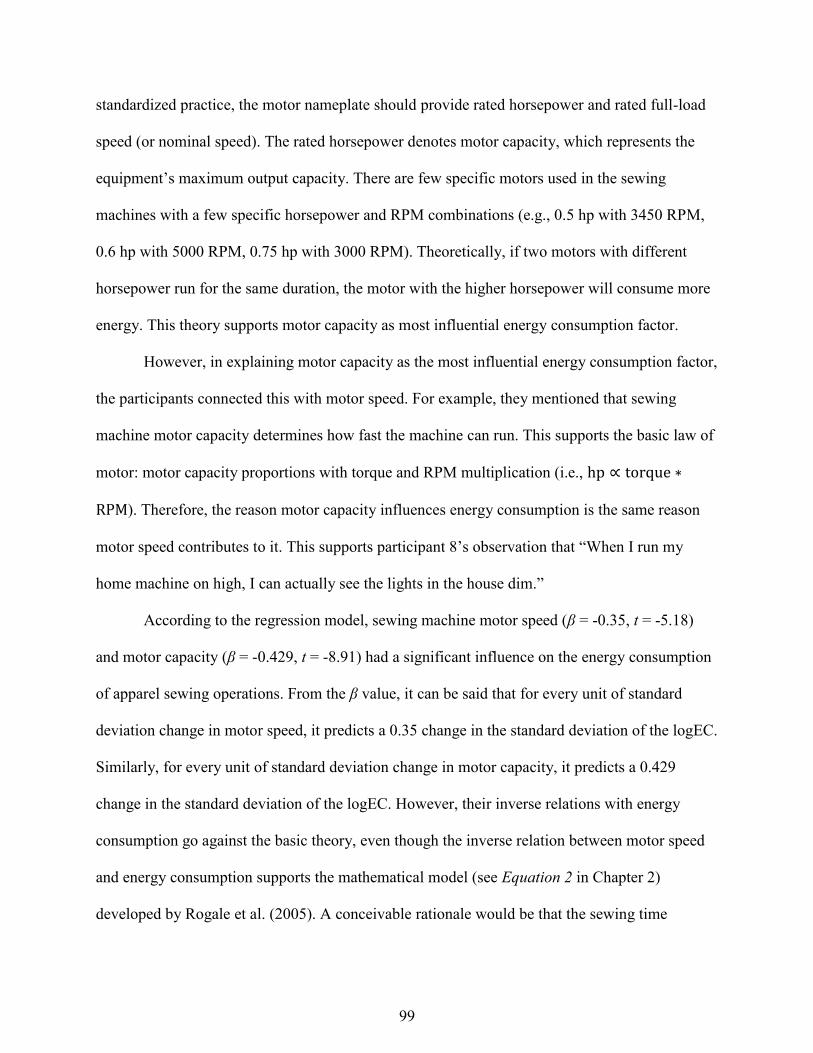
99
standardized practice, the motor nameplate should provide rated horsepower and rated full-load
speed (or nominal speed). The rated horsepower denotes motor capacity, which represents the
equipment’s maximum output capacity. There are few specific motors used in the sewing
machines with a few specific horsepower and RPM combinations (e.g., 0.5 hp with 3450 RPM,
0.6 hp with 5000 RPM, 0.75 hp with 3000 RPM). Theoretically, if two motors with different
horsepower run for the same duration, the motor with the higher horsepower will consume more
energy. This theory supports motor capacity as most influential energy consumption factor.
However, in explaining motor capacity as the most influential energy consumption factor,
the participants connected this with motor speed. For example, they mentioned that sewing
machine motor capacity determines how fast the machine can run. This supports the basic law of
motor: motor capacity proportions with torque and RPM multiplication (i.e., hp ∝ torque ∗
RPM). Therefore, the reason motor capacity influences energy consumption is the same reason
motor speed contributes to it. This supports participant 8’s observation that “When I run my
home machine on high, I can actually see the lights in the house dim.”
According to the regression model, sewing machine motor speed (β = -0.35, t = -5.18)
and motor capacity (β = -0.429, t = -8.91) had a significant influence on the energy consumption
of apparel sewing operations. From the β value, it can be said that for every unit of standard
deviation change in motor speed, it predicts a 0.35 change in the standard deviation of the logEC.
Similarly, for every unit of standard deviation change in motor capacity, it predicts a 0.429
change in the standard deviation of the logEC. However, their inverse relations with energy
consumption go against the basic theory, even though the inverse relation between motor speed
and energy consumption supports the mathematical model (see Equation 2 in Chapter 2)
developed by Rogale et al. (2005). A conceivable rationale would be that the sewing time
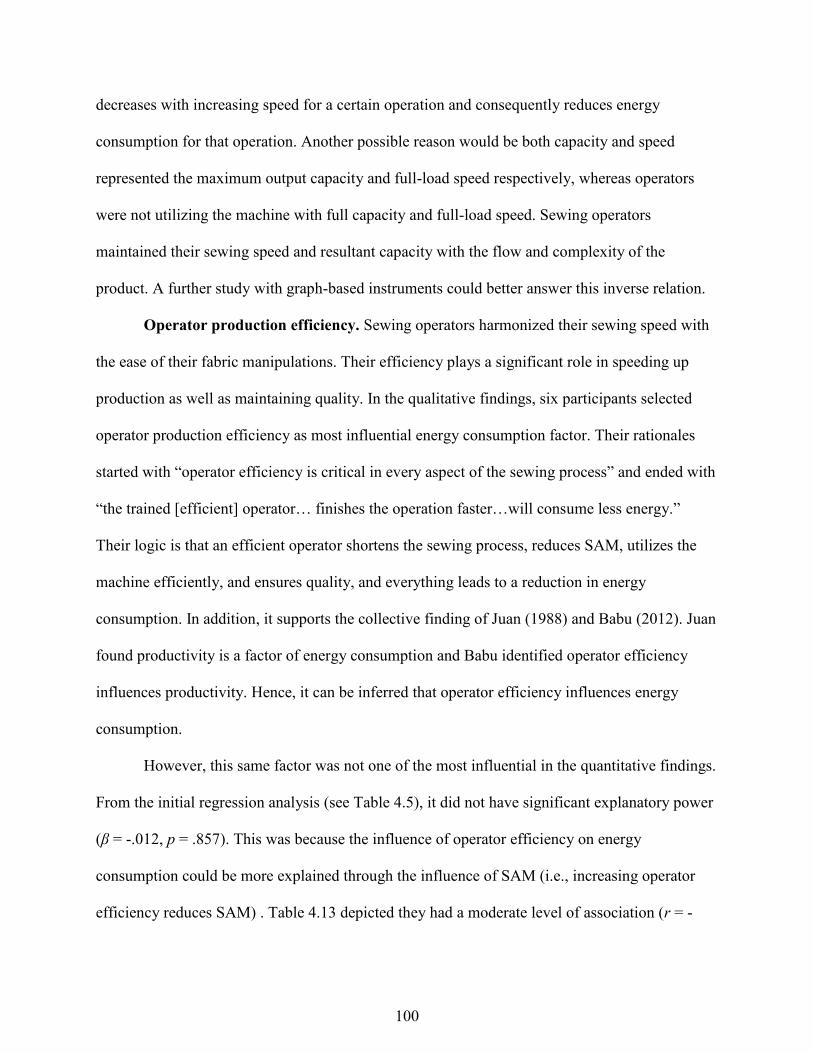
100
decreases with increasing speed for a certain operation and consequently reduces energy
consumption for that operation. Another possible reason would be both capacity and speed
represented the maximum output capacity and full-load speed respectively, whereas operators
were not utilizing the machine with full capacity and full-load speed. Sewing operators
maintained their sewing speed and resultant capacity with the flow and complexity of the
product. A further study with graph-based instruments could better answer this inverse relation.
Operator production efficiency. Sewing operators harmonized their sewing speed with
the ease of their fabric manipulations. Their efficiency plays a significant role in speeding up
production as well as maintaining quality. In the qualitative findings, six participants selected
operator production efficiency as most influential energy consumption factor. Their rationales
started with “operator efficiency is critical in every aspect of the sewing process” and ended with
“the trained [efficient] operator… finishes the operation faster…will consume less energy.”
Their logic is that an efficient operator shortens the sewing process, reduces SAM, utilizes the
machine efficiently, and ensures quality, and everything leads to a reduction in energy
consumption. In addition, it supports the collective finding of Juan (1988) and Babu (2012). Juan
found productivity is a factor of energy consumption and Babu identified operator efficiency
influences productivity. Hence, it can be inferred that operator efficiency influences energy
consumption.
However, this same factor was not one of the most influential in the quantitative findings.
From the initial regression analysis (see Table 4.5), it did not have significant explanatory power
(β = -.012, p = .857). This was because the influence of operator efficiency on energy
consumption could be more explained through the influence of SAM (i.e., increasing operator
efficiency reduces SAM) . Table 4.13 depicted they had a moderate level of association (r = -
101
.307, p = .000), and participants supported this interrelationship. Another reason would be a
skilled operator could reduce the sewing process only to a certain extent. Time reduction of a
sewing process is more likely when designers and industrial engineers reduce the number of
operations.
Furthermore, while it is true that an efficient operator might reduce energy consumption
for a single sewing operation, they can also finish more operations in a specific time period
which might cancel out that energy conservation. If the product quantity is fixed, an efficient
operator would conserve energy, but in reality, the product quantity is indefinite and companies
tend to produce more to earn more profit.
Percent of sewing machine utilization. Similar to operator efficiency, machine
utilization was found as another most influential factor in the qualitative findings but not in the
quantitative findings. The sewing machine is employed when the operator engages the paddle
while the machine is on. The consensus among the study participants was that efficient
utilization of the machine reduces its down time, thus reducing sewing time and hence reducing
energy consumption. Rogale et al. (2003) and Cooklin (2006) also found that higher machine
utilization reduces the sewing time. The sewing time is the combination of machine time and
fabric manipulation time. Machine utilization denotes how much the machine is actively
involved with the sewing process instead of employed with fabric manipulation and thread
changing.
However, in reality the machine consumes energy continuously if it is on, even when idle
during fabric manipulation or thread changing. Therefore, sewing machines consume energy
according to the total sewing time not according to when the machine is actually utilized. Hence,
SAM explains energy consumption better than machine utilization because it represents the total
102
sewing time. Finally, additional functions (e.g., small spotlight, working aids) in the sewing
machine enhances machine utilization, which also consumes additional energy. Therefore, no
observations were taken from machines with these types of functions.
Seam length, stitches per inch (SPI), and type of fabric. Three factors – seam length (β
= 0.104, t = 2.27), SPI (β = 0.146, t = 4.04), type of fabric (sportswear fabric type [β = 0.114, t =
1.77], and knit fabric type [β = 0.126, t = 3.15]) – were identified as most influential factors in
the quantitative findings. However, they were not identified as most influential factors by the
majority of the participants. The incongruence between these two findings could be explained
their explanatory power, their β value. They have significant influence on the energy
consumption but not as strong as machine speed, capacity, and SAM. Therefore, a few experts
might select these three as most influential factors but not the majority of them.
Interrelationships among Energy Consumption Factors
The second research objective includes determining interrelationships among energy
consumption factors of the sewing process in the apparel industry. In order to attain this
objective, three research questions were developed and both qualitative and quantitative research
methods were used. The three research questions were:
RQ4: What interrelationships between energy consumption factors are identified by industry
experts?
RQ5: What interrelationships between energy consumption factors are identified by the
statistical analysis?
RQ6: Are interrelationships identified in RQ5 congruent with the expert findings in RQ4?
103
RQ4. Interrelationships Identified by Industry Experts
This research question focused on exploring interdependencies or interrelationships
among energy consumption factors based on expert opinions. The researcher believed that
knowing the interrelationships among factors might help explain energy consumption in apparel
sewing operations more comprehensively as well as provide a realistic solution to reducing
energy consumption. Some interrelationships (e.g., motor capacity with speed, motor capacity
with fabric type, motor speed with fabric type, machine utilization with operator efficiency,
machine utilization with SAM, and SAM with operator efficiency) were found from the
participants’ responses in RQ1. However, the interview design and survey did not reveal
interdependencies as expected. Considering the limited interview time with experts, the
researcher should ask interrelationship among most influential factors only. In addition, asking
for explanation about factors’ interdependency did not yield quality responses perhaps because
participants felt that the question was redundant with earlier questions. Therefore, after the first
interview, the researcher decided to move the interdependency question to the very end of the
interview. Even changing the interview strategy, however, did not result responses with more
descriptive. For example, participants 4, 6, and 9 mentioned, “Again it comes back to the
situation we were discussing earlier,” “You know [researcher name], it’s same thing,” and “Well
again, it’s the same thing,” respectively. Face-to-face interviews resulted in similar responses.
In addition, discrepancy between responses to the online survey and to the interview for
the same participant was found. Participant 5 selected number of sewing operations and type of
fabric as interdependent. However, when he was being asked to explain this relationship, he
mentioned, “I don’t know that there is an interrelationship. I may have miss-spoken and then if
that’s the case in the survey. I think that there probably isn’t.”
104
In the survey and interview, almost all experts mentioned the energy consumption factors
as interrelated in some ways. Participants did not specify any two factors’ interrelationship over
others. In addition, participants did not mention any direction and strength of the relationship;
rather, they simply mentioned that they were interdependent or related. Mostly participants gave
common responses while responding to the interdependency question and provided some
examples. In response to the question “In your opinion, which factors are interdependent with the
types of fabric?” participant 1 replied,
So, it would be number of sewing operations, SAM, types of stitch, number of threads,
stitches per inch, layers of fabric, motor capacity, sewing speed, machine age, frequency
of maintenance, operator's efficiency and machine utilization. I think those could all be
interdependent with types of fabric.
All participants gave similar answers except they provided different examples while
explaining the relationships. For instance, while explaining the relationship between stitch
density (or stitches per inch) and type of fabric, participant 8 provided an example of sewing
ribbed fabric, whereas participant 9 gave an example of sewing a waterproof garment.
Consequently, the comparative analysis was unable to provide better explanation about the
interrelationships among factors. The direct and quantitative observations used in the developed
model yielded results about factor interrelationships and these are discussed in RQ5.
Additionally, the good examples provided within the interviews helped the researcher interpret
the combined findings, which are discussed in RQ6.
RQ5. Interrelationships Identified by Statistical Analysis
The evaluations of all the basic assumptions of multiple regression analysis in the earlier
analysis were eventually evaluated for the basic assumptions of correlation analysis (the
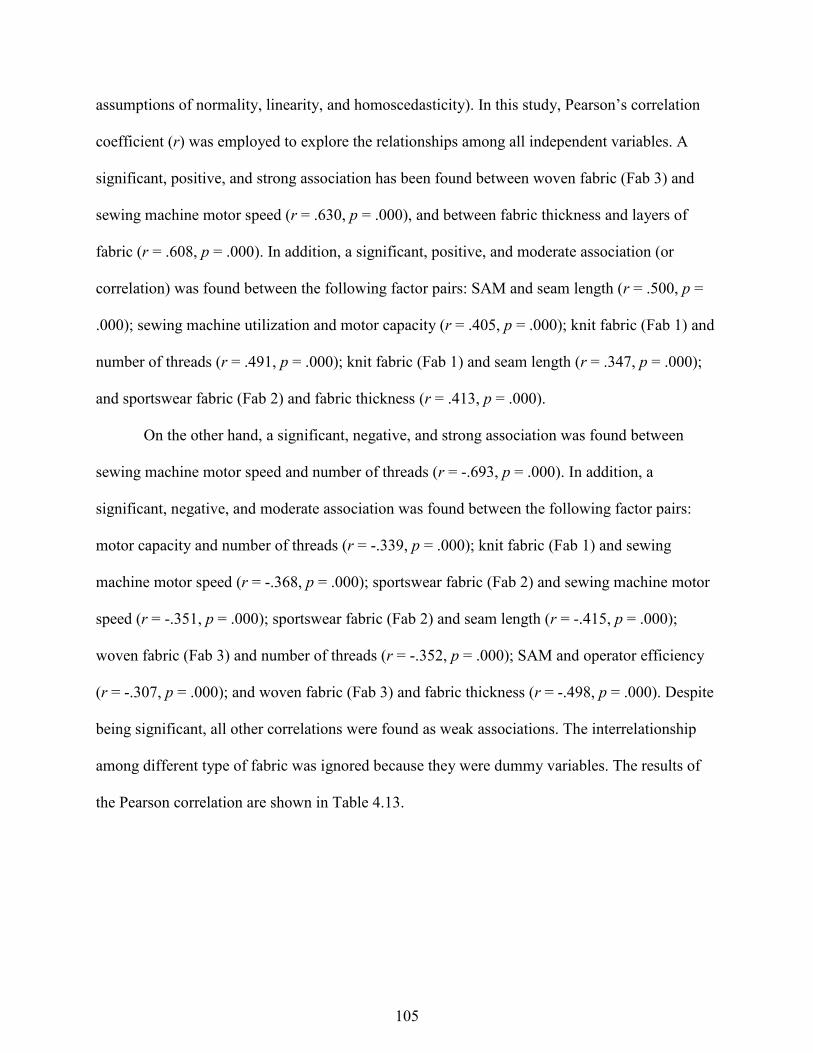
105
assumptions of normality, linearity, and homoscedasticity). In this study, Pearson’s correlation
coefficient (r) was employed to explore the relationships among all independent variables. A
significant, positive, and strong association has been found between woven fabric (Fab 3) and
sewing machine motor speed (r = .630, p = .000), and between fabric thickness and layers of
fabric (r = .608, p = .000). In addition, a significant, positive, and moderate association (or
correlation) was found between the following factor pairs: SAM and seam length (r = .500, p =
.000); sewing machine utilization and motor capacity (r = .405, p = .000); knit fabric (Fab 1) and
number of threads (r = .491, p = .000); knit fabric (Fab 1) and seam length (r = .347, p = .000);
and sportswear fabric (Fab 2) and fabric thickness (r = .413, p = .000).
On the other hand, a significant, negative, and strong association was found between
sewing machine motor speed and number of threads (r = -.693, p = .000). In addition, a
significant, negative, and moderate association was found between the following factor pairs:
motor capacity and number of threads (r = -.339, p = .000); knit fabric (Fab 1) and sewing
machine motor speed (r = -.368, p = .000); sportswear fabric (Fab 2) and sewing machine motor
speed (r = -.351, p = .000); sportswear fabric (Fab 2) and seam length (r = -.415, p = .000);
woven fabric (Fab 3) and number of threads (r = -.352, p = .000); SAM and operator efficiency
(r = -.307, p = .000); and woven fabric (Fab 3) and fabric thickness (r = -.498, p = .000). Despite
being significant, all other correlations were found as weak associations. The interrelationship
among different type of fabric was ignored because they were dummy variables. The results of
the Pearson correlation are shown in Table 4.13.
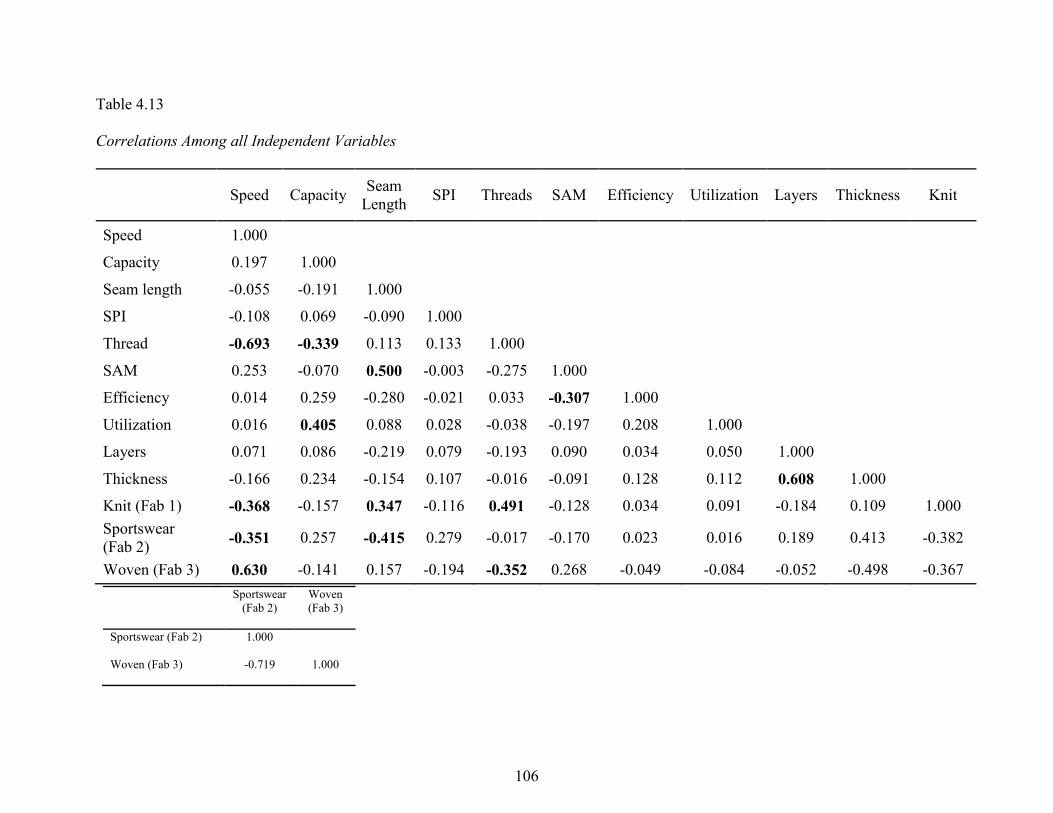
106
Table 4.13
Correlations Among all Independent Variables
Speed Capacity Seam
Length SPI Threads SAM Efficiency Utilization Layers Thickness Knit
Speed 1.000
Capacity 0.197 1.000
Seam length -0.055 -0.191 1.000
SPI -0.108 0.069 -0.090 1.000
Thread -0.693 -0.339 0.113 0.133 1.000
SAM 0.253 -0.070 0.500 -0.003 -0.275 1.000
Efficiency 0.014 0.259 -0.280 -0.021 0.033 -0.307 1.000
Utilization 0.016 0.405 0.088 0.028 -0.038 -0.197 0.208 1.000
Layers 0.071 0.086 -0.219 0.079 -0.193 0.090 0.034 0.050 1.000
Thickness -0.166 0.234 -0.154 0.107 -0.016 -0.091 0.128 0.112 0.608 1.000
Knit (Fab 1) -0.368 -0.157 0.347 -0.116 0.491 -0.128 0.034 0.091 -0.184 0.109 1.000
Sportswear
(Fab 2) -0.351 0.257 -0.415 0.279 -0.017 -0.170 0.023 0.016 0.189 0.413 -0.382
Woven (Fab 3) 0.630 -0.141 0.157 -0.194 -0.352 0.268 -0.049 -0.084 -0.052 -0.498 -0.367
Sportswear
(Fab 2)
Woven
(Fab 3)
Sportswear (Fab 2) 1.000
Woven (Fab 3) -0.719 1.000
107
RQ6. Congruency between Qualitative and Quantitative Findings
Since the interview question to identify factors’ interrelationships did not yield overall
trustworthy findings, the congruency between qualitative and quantitative findings could not be
determined. However, participants gave some examples while explaining a couple of
interrelationships. All the energy consumption factors were used in the regression model.
Therefore, no correlation will be found higher than 0.75 (i.e., r < |0.75|); otherwise it would
violate the assumptions of the regression model.
From the quantitative analysis, it was found that sewing machine motor speed is
correlated with fabric type and number of sewing threads. From direct observation, the
researcher found that high RPM (revolution per minute) based sewing machines are used in the
woven garment assembling process. On the other hand, low RPM based sewing machines are
used in the knit and sportswear assembling process. Therefore, a positive relation was found for
woven fabric type and negative relations were found for knit and sportswear fabric types. Also,
the relationship between fabric type and speed can be explained from participant 1’s response.
She stated, “If you’re sewing a very heavy fabric, it’s going to take more effort by the machine.
Your sewing speed would generally be slower for heavier fabric.” Both thickness and number of
fabric layers represent the fabric’s bulkiness and they have a strong association (r = .608, p =
.000). Based on participant 1’s explanation, fabric type correlated with speed and can be
explained in terms of fabric thickness. From the correlation table, it can be said that woven fabric
type has a negative correlation with fabric thickness (r = -.498, p = .000), which means woven
fabric has less thickness therefore allowing the machine to run at a higher speed. The same
explanation can be provided for the relationships among knit and sportswear fabric type, speed,
and thickness.
108
Another strong association was found between sewing machine motor speed and number
of sewing threads. Different stitch types used different numbers of threads. The researcher
observed that the industry’s multi-thread machines are slower and lower capacity. Therefore,
both speed (r = -.693, p = .000) and capacity (r = -.339, p = .000) has a negative correlation with
number of threads. However, these relationships can be explained in terms of fabric type. While
explaining the interrelation between type of fabric and number of threads, participant 1 revealed
that number of threads is affected by fabric type, and participant 3 mentioned,
Different types of fabric are going to require different numbers of threads. So, the
simplest form you could use is 301 single needle lock stitch to make a seam and the most
complex you would use a 600 class, six thread flat seam to do a butt seam on a
sportswear or on woven. You would use 516 five thread to safety stitch. So, depending on
what your fabric is, different fabrics require different numbers of thread to sew the proper
seam.
Generally, the industry uses stich type 301 (i.e., single needle lock stitch) with two
threads for woven fabric and stitch type 516 and 600 with 3-6 threads for knitwear and
sportswear. Participant 8 elaborated on this:
[Since] knit stretches, they need types of stitches that stretch, and there are machines
made specifically for wovens and machines made specifically for knits. And the only
machine that tends to work for both are be used is single needle machine which is
standard types of stitch [stitch type 301] that you get on a home sewing machine. But
single needle [lock stitch] does not stretch, so single needle for knit has to be very
carefully use. So, types of stitches also directly related to the type of fabric.
This explains the relationship between knit fabric (Fab 1) and number of threads (r = .491, p =
.000) and between woven fabric (Fab 3) and number of threads (r = -.352, p = .000). Therefore,
the interrelation between sewing machine motor speed and number of threads can be explained
from the earlier interrelation between sewing machine motor speed and fabric types.
The interrelation between SAM and seam length (r = .500, p = .000) and between SAM
and operator efficiency (r = -.307, p = .000) can be explained by SAM. A longer seam will take
longer time to accomplish and hence depicts a higher SAM. Since other issues such as operator
109
performance rating and allowances (see Equation 3 in Chapter 2) determine SAM, the value of r
is less than 1. The interrelation between SAM and operator efficiency is illustrated by participant
5: “it [operator production efficiency] speaks to the amount of time the product is going to be in
the sewing machine.” In addition, participant 3 mentioned, “an efficient operator is going to be
operating at higher rpms and it’s gonna have much less downtime than an inefficient operator.”
Therefore, an operator with high efficiency will take less time to stitch, which results in a lower
SAM and vice-versa.
The relationships between sportswear fabric (Fab 2) and seam length (r = -.415, p =
.000), between knit fabric (Fab 1) and seam length (r = .347, p = .000), and between sewing
machine utilization and motor capacity (r = .405, p = .000) cannot be explained by the
participants’ responses. In this study, the observed data from the sportswear factory and knitwear
factory included small seam lengths and longer seam lengths, respectively, because at the time of
data collection, that was the nature of product being produced. It might not be the same for the
whole year of their production. Therefore, sportswear fabric (Fab 2) and seam length might be
depicted as having a negative correlation and knit fabric (Fab 1) and seam length might be
represented as having a positive correlation. In general, seam length is contingent upon type of
garment rather than type of fabric. For example, a pair of pants has a longer seam length than a
dress shirt or a t-shirt, regardless of fabric type.
Similarly, the relationships between sewing machine utilization and motor capacity (r =
.405, p = .000) cannot be explained by the participants’ responses. Machine utilization represents
the time a sewing machine is actively involved in a sewing operation in comparison to the total
operation time (i.e., combination of both machine time and fabric manipulation time). Participant
9 defined it as, “it [machine utilization] gets back to idle time and how much of that machine is
110
being used.” No matter what capacity the motor has, machine utilization is dependent on the
simplicity of the operation and the sewing machine. From the response of participant 6, it can be
inferred that machine utilization will be higher for sewing a straight seam or sometimes a curve
seam than a complex seam.
Steps to Reduce Energy Consumption
The third research objective included identifying steps to reduce energy consumption
within sewing processes in the apparel industry. In order to attain this objective, only the
qualitative method of research was employed and the following research question was
developed:
RQ7: What potential solutions for reducing energy consumption in apparel industry are
identified by industry experts?
RQ7. Potential Solutions Identified by Industry Experts
The participants suggested solutions related to the themes of greener energy, production,
management, and government. In terms of greener energy, participants emphasized using
alternative sources of energy (e.g., solar power, wind power, hydroelectric plant). Participant 8
suggested, “find alternative ways to provide that energy so that it is sustainable.” Experts’
mentioned alternative sources of energy were also renewable in nature and their recommendation
of using alternative energy supported the findings of a report by Working Group III of the
Intergovernmental Panel on Climate Change (IPCC, 2012). The report showed that for every
kWh of electrical energy generated, concentrating solar power plants emit 89 grams of carbon
dioxide equivalent (g CO2e), compared to 43 g CO2e hydroelectric plants, 81 g CO2e for wind
energy plants, 217 g CO2e for solar photovoltaic plant, 220 g CO2e for nuclear energy plant, and
111
1,689 g CO2e for coal-fired power plants (all at maximum level). Therefore, using alternative
source of energy emits less CO2 and is beneficial for the environment. In addition to using solar
panels as a sustainable means of alternative energy, participant 4 suggested using natural light in
the factory to reduce dependency on overhead electric lights.
In terms of production-related solutions, participants advocated the use of energy
efficient equipment, upgrading equipment or equipment modernization, restyling garments, and
implementing standard operating procedures in the sewing room. The argument for using
upgraded equipment or newer equipment was they would be more energy efficient, would
engage automation, and would speed up the sewing operations by reducing labor-intensive work.
In this regard, participant 6 stated, “as you gain more and more automation, there is less manual
work” and participant 2 mentioned, “just the amount of humans touching the process, if you
lower it, you’re saving on energy, no doubt about that.” Here, they inferred that human touches
for fabric manipulation in the sewing operator kept the machine running longer and hence
consuming more energy. Similarly, participant 6 said that automation helps to eliminate complex
handling needed in positioning the product in preparation for assembling. On the other hand,
participant 1 recommended using efficient machines that have more functions. She pointed out,
“use more efficient machines that do more or add more functions on them [sewing operations]
and are more reliable.” However, the participants did not address another point of view;
automation could be a cause for more energy consumption because automation requires
electricity. It seems experts were unable to provide a balanced solution in this regard.
Another production-based solution to reduce energy consumption dealt with
reengineering product construction, finding simpler ways to do the sewing that involves less
stitching, and adopting consequential standard operating procedures pertaining to restyled
112
garments. Participants 5, 7 and 8 suggested hiring industrial engineers or garment construction
engineers for garment reengineering and for fine-tuning sewing processes. Using templates to
fine-tune sewing processes was recommended by participant 2. It supported the recommendation
of Cooklin (2006) to reduce the sewing time; using templates, a common work-aid in the sewing
process, ensure smooth and faster fabric handling while stitching. The restyling solution was
based on the notion that “the amount of energy is dictated by the design house that provided
production work to the factory,” as said by participant 8. She gave an example from Levi’s by
stating, “sewing factory has very little control over the design of the garment…Levi’s controls
that.” However, participant 5 recommended that the restyling would be a viable solution when it
is implemented without sacrificing the style integrity and the marketability of a garment.
Adhering to the standard operating procedures suggested by participant 9 supported the earlier
finding of maintaining improved work method and practices to conserve energy by
Sivaramakrishnan et al., (2009).
Another production-based solution that emerged from the conversations is designers
should design a garment from the very beginning in such a way that requires less energy to
assemble. However, participant 8 addressed this issue and found it unrealistic:
[T]he perspective of designing a garment that uses less energy…puts a constraint on the
industry. This is unrealistic because folks want to make what consumers want to buy and
consumers don’t care that much about how much energy went into making their clothes.
Production-based solutions related to operators included more training to hone their
sewing skills and to change their attitudes. Sewing skills consist of speeding up the process,
reducing idle time, gaining efficiency, and enhancing quality while reducing waste. In summary,
speeding up the process reduces sewing time for a particular operation, specifically operations
related to a complex design or delicate fabric, and consequently reduces energy consumption.
113
Participant 7 emphasized “efficiency training” because he mentioned “operator efficiency skill”
as the biggest way to reduce energy consumption of sewing operations. All these skills were
summarized as “shortening the process” by participant 2. When asked about his suggestions to
reduce energy consumption, he specified, “[T]o me, it’s always shortening the process of every
aspect of garment production.”
Operator skill influences garment quality in terms of having to rework or re-stitch
garments and wasting garments (producing garments that cannot be sold because of inferior
quality). Both reworking and wasting garments have consequences on time, money, and energy
consumption. Especially, reworking garments consumes additional energy and time (Palamutcu,
2010) and hence, employing right-first-time (RFT) approach in the sewing process reduces
energy consumption in the apparel industry. Participant 2 coupled operator efficiency and quality
output in this regard and mentioned, “the more efficient your worker is, the higher the [quality]
output and the higher percentage of the output that doesn’t go back into the line.” According to
Participant 9, improving the training and skill of the operator should “get everything out as error
free as possible, as fast as possible” and this error free and speedy output would reduce time,
cost, and energy consumption. Participant 7 linked operator efficiency with garment reworking
by stating
You're not talking about a tiny marginal increase in efficiency, you're talking about
reducing your energy consumption directly by a factor of how much reworked and
scarpped out garments you need to redo.
Mostly, turning off sewing machines during breaks and at the end of the shift was related
to operator attitude. It is very logical that keeping a machine on unnecessarily will consume
energy without contributing to production. The importance of turning off machines was equally
articulated by participants 3 and 4. The recommendation of Participant 3 was,
114
[W]hen operators go on break or lunch they should shut down their machines, they
should turn them off. And then, obviously at the end of the shift it's important that all the
machines get turned off …if you move to another machine to do another operation and
you're not going to be using the machine for a while it should be turned off.
A number of participants highlighted solutions related to management and a company’s
investment in reducing its environmental footprint. From the interviews, it was found that
management support is one side of the solution and production and operator support are another
side of the solution. Some participants mentioned that management should take the lead to
reduce energy consumption and implement it with the help of operators. In addition, participants
urged consideration of cost factors such as profit and return on investment when making
decisions related to energy consumption reduction. In this regard, participant 9 stated, “I think
that [reducing energy consumption] is part of education on the management side by thinking
about how you can save money…it [reducing energy consumption] is about making the return on
investment argument for it too.”
A similar response was given by participant 7. He thought that considering the cost is the
starting point. He stated, “I think that the starting point is that costs need to be studied,
quantified, and recognized so that you can make informed decisions.” In addition, participant 4
defined this management related solution as a “top-down approach” and he stressed dealing with
cost factors as the best way to reduce energy consumption:
I think it [reducing energy consumption] should be a top-down approach also. I think the
management has to understand in two ways. One way is if you can reduce energy usage,
it will be more sustainable in terms of the resources. The other side of it is, the less the
energy consumption, you can make more profit. So, I think you can tackle it in both
ways, but the cost factor would be the best way to tackle it.
In addition to the above-mentioned energy reduction solutions, participants articulated
government support related to law enforcement, regulations, and work ethic. Both participants 4
115
and 8 discussed these ideas. While discussing sustainable energy sources, participant 8
mentioned, “I believe that local and federal government should assist with sewing factories
seeking out and setting up alternate means of energy.” However, participants did not mention
any specific ideas for laws, regulations, and work ethic that would reduce energy consumption.
In summary, all participants gave realistic solutions – using greener energy, training
people, improving production, and engaging management and government – to reduce energy
consumption of apparel sewing operations. In order to address solutions related to global climate
change, incorporating management and government along with other stakeholders (e.g.,
suppliers, designers, manufacturers, consumers, etc.) also recommended by the Department for
Environment, Food, and Rural Affairs (DEFRA, 2011). This study addressed global climate
change issue through exploring energy consumption and associated GHG emissions in the
apparel manufacturing process. However, the industry may undervalue these recommendations
as factories seek immediate results. In addition, factories may find difficulties in relating energy
reduction to profit, and according to participant 9, “money is the language everybody speaks.”
Regardless, participants urged these solutions even if only a small fraction of time and associated
energy consumption can be reduced. The summation of small fractions could result in a huge
time and energy savings and eventually, substantial cost savings. In this regard, participant 2
mentioned, “if you cut seconds, seconds become minutes, minutes become hours,” and
participant 8 said:
I will give you an example – Levi's. If you wear a pair of Levi's [jeans] you can look at
the back yoke. That back yoke used to be lapped up. It is now easily lapped down and
that was a direct result of an engineer watching a sewing operator work and flipping the
direction for efficiency sake. It probably only saved less than 10 seconds per garment but
that 10 seconds adds up over millions and millions of garments. But even that saved
Levi's some money and other companies have since followed and begun to adopt the
same construction method.
116
Exploring Experts’ Level of Concern
The final research objective includes exploring the level of concern regarding energy
consumption, the contribution to greenhouse gas emissions, and climate change in the apparel
manufacturing. Other research objectives focused on energy consumption from the apparel
sewing process. However, this objective covers the whole apparel manufacturing in terms of
achieving sustainability and related issues. In order to attain this objective, five research
questions were developed and they were posed to industry experts:
RQ8: What level of concern is expressed by industry experts regarding energy consumption in
the apparel manufacturing?
RQ9: What (if any) energy reduction initiatives have been initiated by the industry experts’
company in order to reduce consumption?
RQ10: What type of energy consumption and climate change conversations are industry experts
having with other apparel industry professionals?
RQ11. How might an energy consumption model be used by apparel industry professionals?
RQ12. What level of importance might industry experts give to energy consumption as a
decision-making component within apparel production in the future?
RQ8. Experts’ Level of Concern about Energy Consumption
Seven out of nine participants revealed that they were concerned about the apparel
manufacturing’s energy consumption. They discussed cost related to energy consumption and
sustainability in terms of garment waste and fossil fuels. The interview responses suggest that
participants’ concern about energy consumption is mostly based on product cost. This sentiment
is illustrated by participant 6’s generalized answer to explain his level of concern: “I think
117
everyone has to be to some degree because there is a cost factor.” His further argument was
energy becomes more expensive and it becomes scarce as the population grows around the
world. Consequently, there are power failures, requiring factories to use generators to keep their
production running, which is much more expensive and less efficient. Participants 8 and 9 stated,
“one of their largest expenses is electricity” and “[garment] costs rise because electricity bills go
up,” respectively. Similarly, participant 3 stated, “[energy consumption] is a fixed expense that
has to be factored in when you set the cost of the garment.” Her argument was energy
consumption need to be reduced to earn higher profit margin.
Another concern about energy consumption related to waste. “Our industry is really an
unsustainable industry, not from an energy point of view only, also wastage point view.” His
wastage argument was based on the industry making excess garments. When they cannot sell the
garment, they dump it, which is a waste of resources (e.g., raw material, energy, labor). A similar
statement was given by participant 7. He blamed the rise of fast fashion, international brands like
H&M and Zara, and consumers for facilitating unsustainable apparel consumption. He quoted a
national newspaper that mentioned waste:
The New York Times is accusing essentially the apparel industry for producing these
disposable garments that people buy over and over again and one of the big problems
with that is the effect on the environment. So, I think both consumers and producers need
to be increasingly aware about the energy consumption of the apparel industry.
Two participants mentioned they were not concerned about the level of energy
consumption before this interview. Their argument was water consumption is a more serious
issue than energy consumption, specifically in California. In the opening question, it was evident
that a number of experts expressed their surprise when asked about energy consumption of the
apparel industry, particularly the sewing process. They were well aware of the high level of
energy consumption by textile production (participant 4), by dye houses (participant 7), by
118
sublimation print (participant 5), water consumption in the denim industry (participant 2), global
ecosystem (participant 9), global warming (participant 2), and so on. By contrast, most of the
participants were unaware of energy consumption issues in the apparel sewing process, with the
exception of participants 4 and 8. Participant 8 mentioned, “It is the largest cost the [apparel]
factory faces in their electrical bill,” and participant 4 said that the “apparel industry consumes a
lot of energy… pretty much every sewing operator needs a machine.” However, this interview
prompted them to ponder this issue and they both agreed that cost saving was a benefit of
reducing energy consumption.
Some participants also thought of garment waste and fossil fuel usage as environmental
issues. In addition to the cost issue, participant 9 stated, “it [energy consumption] is about the
environment, being a good stewardship of the environment too.” Though he did not clarify how
energy consumption affects environment, participant 1 discussed our reliance on fossil fuels to
generate electricity. She mentioned, “We are consuming a lot of energy [electricity] in the
factories using fossil fuels, it’s a global issue.” It is indeed a global issue because GHG
emissions occur with burning fossil fuels and fossil fuel is still the most-used source of
generating electricity around the globe. A few participants tied sustainability into their responses.
Participant 2 associated energy consumption with global warming and mentioned, “We are
looking at global warming, we are looking at all these [energy consumption and global warming]
things much closer than we ever looked at before.” While responding to this question, participant
9 also linked energy consumption with the cost savings and sustainability by stating,
In general, I think the first thing is cost savings, I think sustainability, being good
stewards of the land those things and then it is about… I think they are interconnected to
the whole process; I think it is part of the larger ecosystem of how we get something from
the raw material to consumers.
119
RQ9. Initiatives Implemented to Reduce Energy Consumption
The participants mentioned having implemented both direct and indirect initiatives to
reduce energy consumption in their respective organizations. The direct initiatives were meant to
reduce energy consumption and the indirect initiatives were meant to gain something else but
energy consumption reduction was resultant effect. The direct initiatives were installing energy
efficient lights (participant 7), gaining efficiency in the heat transfer press of the dye sublimation
process (participant 5), establishing a scheme to turn off the HVAC system during national
holidays (participant 3), and purchasing energy efficient machines (participant 4). The indirect
initiatives were measuring compressed air leaks (participant 7), using templates to shorten the
sewing process to achieve production efficiency (participant 2), finding ways to reduce SAM and
number of operations to save cost (participant 8), and cooling the factory through having plants
and trees on the roof (participant 4).
Both participants 4 and 9 undertook initiatives to reduce energy consumption in order to
establish their organizations as social responsible companies rather than directly as
environmentally friendly companies. Their organizations were members of the Fair Labor
Association (FLA). They said their association with the FLA bound them to reducing their
environmental footprint; hence, indirectly they tried to reduce energy consumption. According to
participant 9:
Fair Labor Association looks at the entire supply chain and they do ask questions such as
are you partnering with socially responsible people, are you partnering with people who
care about issues like the environment, and how to minimize the footprint in the
manufacturing process.
On the other hand, some participants said they had not implemented any initiatives to
reduce energy consumption. Even though participant 7 undertook some initiative to reduce
120
energy consumption, he indicated lack of knowledge as a reason for not focusing on this issue. It
is true that energy consumption has not yet been a big focus, but it also means a big area of
opportunity to save energy and eventually save cost. In addition, both participants 1 and 6
mentioned labor cost and prioritized it over energy cost. Their argument was factories are closing
their domestic production units and outsourcing because of higher labor costs and therefore there
is no point of discussing how to reduce energy consumption in their facilities. Participant 6
explained this situation by stating:
I think we are still in a situation where people are able to move product around the world
from more expensive to less expensive locations basically because of labor rates rather
than the energy rates. I think we are almost reaching the point of saturation where simple
movement of product from one region to another is not going to really start making
significant cost differences. So, I think once that happens then they are gonna look for
other areas of efficiency and energy certainly could be a consideration.
RQ10. Discussions with Other Professionals to Address Climate Change
Four participants discussed the importance of reducing GHG emissions while the other
five were not concerned about this. Participants said this issue was discussed with professionals
like apparel manufacturers, stakeholders, supply chain personnel, and various accreditation
authorities (e.g., FLA, Worldwide Responsible Apparel Production) in trade organizations,
seminars, conferences, overseas factories, and other sponsored events. They discussed diverse
issues including supporting alternative means of supplying energy (participant 5), finding
solutions to reduce carbon footprints and attaining sustainability (participant 3), knowing
environmental impacts on logistics to get raw materials from one place to another (participant 9),
and balancing costs and environmental components within apparel products (participant 7).
Interacting with environmentally-friendly accreditation authorities was one of the motives for
discussing such issues, and another motive was the fact that sustainability is a buzzword in the
121
apparel industry and consumers are increasingly aware of it, and trying to be green is one of the
best ways to sell garments to a brand.
Participants who had not discussed GHG emissions and global climate change with
professionals said they had general conversations about water conservation (participant 2),
changing of weather patterns (participant 4), global warming (participant 5) and reducing waste
(participant 1). In addition, their general conversations were not tied to the apparel production
industry. Nonetheless, participant 6 discussed sustainable apparel production through facilitating
the reuse of materials. His argument was reusing raw materials could help conserve energy
because “a lot of energy and resources are used in the actual manufacturing of the raw fiber and
so forth.”
Based on the responses of participants 5 and 6, it was evident that they had a clear
understanding of GHG emissions and global climate change issues. Participant 5 mentioned
“global warming is a reality…burning coal and flowing it into the environment” and participant
6 stated “there is a move on for sustainable production and that is a catch word that’s gaining
more and more momentum in the industry.” Therefore, lack of knowledge was not an issue for
not having this discussion. However, participant 5 explained the reason for not having this kind
of discussion with other professionals as,
I think it's endemic of business in general. We're trying to get more done with less
personnel so the question is do we have enough time to get the business side of it done as
well as the social responsibility…. It's just not expedient and it doesn't have a direct
impact today, we tend as humans to procrastinate about the future. I'm not saying it's a
good thing. I'm not saying I'm proud of it.
RQ11. Modifying Assembling Processes with the Help of an Energy Consumption Model
This study developed a regression based energy consumption model for apparel sewing
operations. Before developing this model, participants were asked about the usability of such a
122
model. All participants agreed to use this model in their respective factories with the intention to
reduce energy consumption. However, they wanted to see certain features, specifically cost-
related features, to ensure the model’s functionality. The cost related features identified by the
participants were ability to show cost savings (participant 3), quantifiable results in terms of cost
savings (participant 7), quick return on investment (participant 5), ability to determine both
energy and cost savings (participant 2), and tied up with dollar value (participant 4). It was
evident that they were interested in the model primarily for cost savings. Other expected features
were flexibility according to product and quantity changes (participant 8), ease of comprehension
and implementation (participant 3), and being visual based and interactive (participant 4).
The researcher believed that flexibility according to product and quantity changes would be
difficult to achieve. However, a solution for this was provided by participant 8 when she
mentioned, “If you were broken down to a specific part of the garment that was generic, it [the
energy consumption model] could be applied.” The researcher found the sewing operation is
generic in the apparel assembling process, and therefore, he developed the energy consumption
model for apparel sewing operations.
It is imperative that energy consumption first be quantified to determine energy savings.
The researcher found that the apparel industry does not use any instrument or mathematical
model to determine energy consumption of their sewing process. Therefore, energy conservation
and subsequent environmental footprint reduction could not be addressed by the industry. The
energy consumption model developed in this study was able to determine energy consumption
level and it might be a small step towards achieving environmental sustainability in the apparel
sewing process.
123
RQ12. Production Rate vs. Energy Consumption in the Decision Making Process
In apparel production decisions, production rate is at the heart of the decision process.
The production schedule, machine allocation, sequence of the operations, and product flows are
all decided based on production rate. Even though production rate is the primary consideration,
this research question asked industry experts to consider whether energy consumption might
become another important consideration. All participants unequivocally denied energy
consumption as another important consideration in the context of current apparel production
practices, at least presently. In this regard, participant 4 stated, “it [energy consumption as an
important consideration] is not going to happen very soon, it will happen one day” and
participant 6 mentioned, “I think it will in the future. I don’t think it’s there on the radar so to
speak yet.” In addition, they explained why energy consumption could not be considered in the
current apparel manufacturing decision making process. The reasons as stated by participants 3
and 6, respectively, were “I think we are still looking at cost, efficiency is a big part of cost” and
“probably production rate would trump the energy consumption because of profit issues.” These
same reasons also confirmed that the triple bottom line has not been adopted in apparel
manufacturing sector.
If any product has a low production rate, all the efforts from the production personnel
will be related to increasing this production rate. Sometimes, using additional equipment is a
means to increase productivity even though this equipment might consume more energy. In
every aspect, the production rate trumps energy consumption and cost is the biggest reason
behind this. Labor cost is much higher than energy cost around the globe. In addition, higher
production rate ensures faster product availability in the market and subsequent profit. However,
124
participant 4 suggested that inserting energy consumption into the cost sheet might be a solution
for considering it (energy consumption) as an important decision making tool.
From the convergence of qualitative and quantitative method of analysis, SAM, motor
capacity, and motor speed were evident as most influential energy consumption factors. The
qualitative portion of this study revealed potential solutions to reduce energy consumption. One
such finding, from the experts’ perspective, included speeding up or gaining efficiency in the
production process to reduce energy consumption, yet energy consumption was more of a
secondary focus behind earning profit. Overall, experts divulged deeper understanding of energy
consumption phenomenon in the sewing process. However, in terms of pragmatism in net energy
conservation, they explicitly and implicitly introduced a debate of production rate versus energy
consumption. One participant (participant 6) mentioned, “[P]roduction rate would trump the
energy consumption because of profit issues.” This debate encompasses the notion that gaining
efficiency results in higher production rate by reducing sewing time for a particular garment and
hence, saves energy. On the other hand, some may argue that a higher production rate translates
into increased apparel production (and profit), as well as greater net energy consumed. Apart
from this debate, reusing raw materials and ensuring sewing quality from the beginning to avoid
reworking and waste were additional solutions to reduce energy consumption in the apparel
industry.
From a more holistic perspective, an important outcome of this study was the disclosure
regarding the lack of environmental awareness by these industry experts. Subsequently, the triple
bottom line characteristic of sustainability has not been fully practiced in the apparel industry.
Apart from experts’ profit concern, lack of tools to determine energy consumption levels and
associated GHG emissions might make it difficult to comprehend the importance of triple bottom
125
line. Among various approaches for increasing awareness of environmental impact discussed in
the literature, measuring a company’s carbon footprint (GHG emission levels) is imperative.
Robertson (2014) suggested a four-step program to reduce climate impact from any process:
make a plan, measure, reduce emissions, and offset the emissions that remain. The measuring
step included preparing a GHG inventory along with knowing all process-based carbon
footprints. In another study, Thiede, Posselt, and Hermann (2013) developed a seven-step
approach to reduce environmental footprints from any textile and apparel processes. Four steps
in this approach included identification of potential energy consumption sources, calculation of
consumed energy, and assessment of improvement measures to reduce energy consumption (or,
energy conservation) and resulted GHG emissions. The current study facilitated assessment of
GHG emission levels by developing an energy consumption model and assists the apparel
industry to advance toward greater environmental sustainability in the apparel sewing process.
126
Chapter 5 - Integrated Discussion, Implications, Limitations, and
Recommendations for Future Research
This concluding chapter summarizes the study’s sample, design, and analysis. Though
most of the discussions were covered in the earlier chapter, this chapter provides an integrated
discussion, implications and recommendations for textile and apparel (TA) practitioners,
particularly apparel manufacturers, as well as for educators. The chapter concludes with
identification of the study’s limitations and recommendations for future research.
Summary of Research Method
The research questions of this study addressed energy consumption in apparel sewing
processes. The TA supply chain starts with fiber cultivation and ends with final product
consumption. Every step within the supply chain causes a great deal of environmental damage.
Some damages are direct in nature and some are indirect by way of energy consumption and
resultant greenhouse gas (GHG) emissions. Since burning fossil fuels is still the single most
reliable source for generating electric energy, reducing energy consumption is key to minimize
environmental footprints of apparel sewing process. Therefore, this study investigated means for
reducing energy consumption of apparel sewing operation through identifying energy
consumption factors and their interrelationships. The following research questions guided this
study:
RQ1: Which apparel sewing operation factors do industry experts identify as being most
influential on energy consumption and why?
RQ2: Which apparel sewing operation factors are identified as most influential on energy
consumption through statistical analysis?
RQ3: Are the factors identified in RQ2 congruent with the expert findings in RQ1?
127
RQ4: What interrelationships between energy consumption factors are identified by
industry experts?
RQ5: What interrelationships between energy consumption factors are identified by the
statistical analysis?
RQ6: Are interrelationships identified in RQ5 congruent with the expert findings in RQ4?
RQ7: What potential solutions for reducing energy consumption in apparel industry are
identified by industry experts?
RQ8: What level of concern is expressed by industry experts regarding energy
consumption in the apparel manufacturing?
RQ9: What (if any) energy reduction initiatives have been initiated by the industry
experts’ company in order to reduce consumption?
RQ10: What type of energy consumption and climate change conversations are industry
experts having with other apparel industry professionals?
RQ11. How might an energy consumption model be used by apparel industry
professionals?
RQ12. What level of importance might industry experts give to energy consumption as a
decision-making component within apparel production in the future?
Summary of the Data Collection
A mixed method approach was utilized and the data was collected through qualitative and
quantitative techniques. For the qualitative data, an online survey was distributed using the
Qualtrics survey distribution platform followed by participant interviews. The interviews were
conducted by utilizing the Zoom software for distant participants and by using voice recorder for
128
local participants. The interview was semi-structured in nature and all interviews were subjected
to audio recording. The recorded interviews were then transcribed by the researcher.
The quantitative portion of the study utilized direct observation to collect and quantify
energy consumption and its factors from the apparel sewing operations of three factories. An
energy consumption meter and two high-resolution video recorders were used for this direct
observation and data collection. Then, Sony Vegas Pro software was used for extracting data
from the direct observation.
Summary of the Sample
The population of interest in this study was US apparel industry experts. Through
employing both purposeful intensity and snowball sampling, a total of nine US apparel industry
experts participated in this study. All experts had remarkable experience in the apparel industry
and were able to provide current information from the industry. The mean age of the experts was
53 years old, the average number of years of experience in the apparel production process was
27, and the number of years they had been involved in managerial and/or production decisions
averaged 23. Three participants were female and six were male.
The quantitative data were collected from the apparel sewing operations. A total of 98
sewing operations were observed to gather data directly from three apparel production factories
(a knitwear, a sportswear, and a woven-wear). Among 98 observations, 16% were collected from
knitwear sewing operations, 41% from woven-wear sewing operations, and the remaining 43%
from sportswear sewing operations. These 98 observations consisted of 62 sewing operations,
performed by 39 sewing operators using 47 sewing machines.
129
Summary of Data Analysis
A realist approach was employed to reveal the participants’ lived experience with energy
consumption in the apparel industry. The analysis of the interviews is composed of qualitative
content analysis and comparative analysis. In addition, incident-to-incident approach of coding
was applied in this study and word-based techniques (e.g., word repetitions and key-words-in-
context) were applied to identify themes.
The quantitative data analysis focused on determining the most influential energy
consumption factors and developing an energy consumption model using multiple regression
analysis. In order to measure factors’ interrelationships, Pearson correlation analysis was
conducted. Both qualitative and quantitative findings were reviewed, compared, and then
integrated to understand the energy consumption of apparel sewing process comprehensively.
Integrated Discussion and Implications
The overarching purpose of this study was to determine a way for the apparel industry to
quantify effortlessly their energy consumption of sewing process. Currently, apparel firms might
determine their overall energy consumption from the electric bill, but they do not know their
energy consumption based on specific sewing operation or specific garment assembly processes.
Rogale et al., (2005) and Sivaramakrishnan et al., (2009) identified several factors influencing
energy consumption: motor speed, seam length, stitch density, number of fabric layers, and type
of fabric; however, they did not test these factors in a mass production setting (except type of
fabric) and did not directly measure energy consumed by apparel sewing processes. In a more
comprehensive approach, this study investigated these factors as well as additional factors
related to productivity that have not been tested in relation to energy consumption. Rogale et al.
(2003) found that higher productivity has a direct beneficial impact on energy consumption in
130
the apparel industry. Hence, the inclusion of these additional factors as well as seeking input
from industry practitioners was deemed important to ensure that all influential factors were
tested and explained.
From experience gained while the researcher was employed in the apparel industry, it
became evident that there was no easy way to determine the level of energy consumed during the
sewing process. The developed model in this study could be used to determine energy
consumption for each sewing operation. The independent variables or factors – SAM, fabric
type, motor speed and capacity, seam length, and SPI – used in the model were readily available
in the industry to determine individual sewing operations’ energy consumption. The prediction
capability of the model (i.e., coefficient of multiple determination [R2 = 0.891, p = .000]) was
very reliable. It enabled the practitioner to measure energy consumption level with 90%
accuracy. It also meant that by manipulating these factors, energy consumption by apparel
sewing processes could be reduced. Apparel firms need to reduce the energy consumption of
each sewing operation to achieve a substantial reduction in their carbon footprints. However, it is
imperative for these firms to be able to determine easily the current energy consumption levels
so that they can seek effective ways to reduce them.
A garment sewing process consists of series of sewing operations. The model developed
in this study can determine energy consumption for each sewing operation. A sewing operation
is the smallest generic part in the apparel sewing process. Therefore, developing a model that can
determine energy consumption for a sewing operation is logical considering its practical
application. The same rationale was found from the response of participant 8. She stated, “If you
were broken down to a specific part of the garment that was generic, it [the energy consumption
model] could be applied.” However, determining all sewing operations’ energy consumption and
131
associated GHG emissions (by using GHG calculator) levels would reveal the magnitude of
energy consumption and GHG emissions of a whole garment.
Implications for Practitioners
The findings of this study have far-reaching implications for apparel practitioners. These
implications include:
Energy consumption reduction strategies.
Associating energy consumption with global climate change in terms of GHG emissions.
Argument or persuasive appeal to practitioners regarding energy consumption reduction.
Challenge to implement energy consumption reduction strategies in the light of Jevons’
Paradox or Rebound Effect
Among the most influential factors, seam length, SPI, and fabric type are contingent upon
the product category. For instance, children’s apparel has a smaller seam length than that of
menswear. The apparel production unit has no control over this. Other factors, except SAM, do
not influence energy consumption remarkably for the sewing process. Therefore, developing
solutions aimed at reducing SAM will be the biggest and most practical energy consumption
reduction initiative.
Almost every expert interviewed supported speeding up production, gaining efficiency,
and shortening the sewing process. Both designers and industrial engineers need to play a part in
these efforts, because sewing operators have little control over these issues. Designers and
industrial engineers need to work together to restyle the apparel product through reengineering
product construction, finding simpler ways of sewing, and adopting consequential standard
132
operating procedures. Even shortening each operation by 10-20 seconds would be a significant
time saving as well as cost saving in terms of bulk quantity. At one point, participant 8
mentioned that both designers and industrial engineers were able to save 10 seconds from the
back yoke joint operation in a pair of Levi’s jeans and that 10 seconds added up over millions
and millions of garments.
In order to see how much a change in SAM explains a change in energy consumption, an
additional analysis was computed. An ad hoc based bivariate analysis (β = 0.903, p = .000)
between logEC (log-transformed energy consumption) and logSAM depicts that a 1% decrease
in the average SAM would yield a 0.90% decrease in the average energy consumption. In this
study, the average SAM was 1.29 minutes (77.4 seconds) and average energy consumption was
180.4 watt-minutes (Wmins). Therefore, by eliminating 10 seconds (13% of average SAM) from
a sewing operation, it is possible to save 21 Wmins energy consumption.
A typical apparel industry performs hundreds of sewing operations each day. Conserving
20 Wmins from each operation will reduce greenhouse emissions significantly over the course of
a year. For example, the average weekly apparel production for one small factory (used in this
study) was 800 pieces and they had an average 15 sewing operations per garment. The average
energy consumption per operation in this study was 180.4 Wmins. With reducing 20 Wmins
energy consumption per operation, according to the Environmental Protection Agency’s (EPA,
2013) GHG emissions calculator, it is possible to reduce 0.146 metric tons equivalent CO2
(MTCO2e) in a year. This amount from one small factory (with annual production around 42,000
pieces) is not a dramatic savings and perhaps that is why the energy consumption from the
apparel sewing process had not received much attention. However, against total apparel
produced for over seven billion people on the planet, the environmental gain would be
133
remarkable. Since more than 150 billion garments are produced annually in 2010 (Kirchain,
Olivetti, Miller, & Greene, 2015), it is possible to save over 527,082 MTCO2e emissions
globally from the sewing process (considering the same production scenario of a conservative 15
sewing operations for each garment). The same emission occurs from burning over 562 million
pounds of coal.
In this study, the average machine utilization was 21%, meaning the sewing machine was
actively involved in stitching only 21% of the sewing time. The remaining 79% of the sewing
time was taken up with arranging, handling and disposing of work, changing bobbins, re-
threading, and attending personal needs. This supports the earlier findings of Rogale et al. (2003)
and Cooklin (2006), who found that operators in the apparel industry use sewing machines only
for 20-25% of their total working time in a typical day. About 80% of energy consumed by the
sewing machine when it is not actively stitching. This finding revealed that there is an
opportunity to conserve energy from 80% of sewing time for each sewing operation. From the
recommendations of Cooklin (2006), using work-aids (e.g., fabric guides, templates, auto thread
trimmer) could reduce the fabric manipulation time.
With globalization, new exporters enter the market, increasing competition among
existing players. New competitors mean new lines of textile and apparel, resulting in a broader
spectrum of clothing options to consumers. In order to compete in this dynamic market, the TA
industry needs to meet diversifying consumer tastes through launching new products prior to
their competitors. To cope with and stay in this fierce competition, apparel brands split their
orders into a number of factories (mostly outsourcing). Splitting orders reduces lead-time (time
between the placement of an order and delivery), and subsequently it leads to a shorter product
life cycle (PLC) – the lifespan of a product. The whole process is cyclical: more competitors
134
(because of globalization) lead to frequent introduction of new products, which in turn leads to
shorter PLC and adoption of fast fashion. Consequently, factories and brands have to embrace
niche production (specialized production) instead of mass production (volume production)
(Yuasa, 2001). Even though the majority of this study’s participants selected operator efficiency
as the most influential factor on energy consumption, this efficiency cannot play a big role in
niche production. Beard (2008) claimed that the marketing strategy for sustainable apparel in
general is still based on niche production rather than mass-market reality. In addition, an operator
gains efficiency through repetition and long-term repetition does not happen with niche
production. Therefore, producing a higher quantity of fewer styles (i.e., different designs) in the
apparel sewing process would be beneficial for the environment in relation to energy
consumption.
Jevons’ Paradox or Rebound Effect
The sewing efficiency suggestions provided by the participants inferred that speeding up
the production process through gaining efficiency is the best solution to reduce energy
consumption. However, “increased efficiency does not by itself lower consumption” (Heinberg,
2011, p. 171); rather, it leads to increased energy consumption because more apparel products
could be produced through gaining efficiency as well as higher production rate. Higher
production rates might lead to overproduction, which in turn might lead to lower product prices
and ultimately over consumption. Globally 150 billion garments production represented more
than 20 new articles per person in 2010 (Kirchain et al., 2015). The consequence of this
overconsumption is that people discard 7.5 billion clothing items every year globally (ABAC
Women’s Forum, 2012). It seems the solution to energy consumption reduction, as conceived by
135
these industry experts, is also the direction to higher energy consumption. This paradoxical
situation is known as the rebound effect or Jevons’ Paradox (Robertson, 2014).
It is a vicious cycle and either way the environment is the unintended victim. There is no
simple and straightforward solution for breaking this cycle: neither governments, non-
governmental organizations (NGOs), industries, nor consumers can address these issues on their
own. Therefore, perhaps the most important implication of this study is the need to work closely
with TA industry experts and stakeholders (e.g., suppliers, designers, manufacturers, consumer,
retailers, and waste managers) to understand this paradoxical situation holistically, and to
develop a coordinated action, including action by government and NGOs. A similar suggestion
was found in the sustainable clothing roadmap, initiated by the Department for Environment,
Food, and Rural Affairs (DEFRA, 2011), UK. They undertook four steps approach (review
impacts, engaging stakeholders, action plan, and implementation and evaluation) in the TA
sector to deal with climate change.
All stakeholders need to work together to better manage this unsustainable demand either
by slowing the rate of stylistic changes or by increasing price. Brands need to step away from a
business-as-usual mindset and consumers need to avoid their hedonic mentality that lead to
overconsumption. Hutchins (2016) recommended applying future-fit logic (e.g., for-purpose,
multi-stakeholder perspective, enhances current and future well-being, guided by moral
compass) in business instead of yesterday’s logic (e.g., for-profit, shareholder focus, undermines
the future for today, guided by money). Chapman (2015) asserted, “[A]sk a developed world
human to stop consuming and you might as well ask a vampire not to suck blood” (p. 29),
however, hedonic motivated consumers must understand that their unsustainable consumption
causes significant environmental damage. In comparison to garments worn 50 times and kept for
136
a whole year, fast fashion garments (i.e., wear less than five times and keep for 35 days) produce
over 400% more CO2 emissions per item per year (Conca, 2015). Since the average energy
consumption was 180.4 Wmins in this study, removing only one million garments from
production, as a result of changing consumers’ hedonic attitude, would save 31.7 MTCO2e
globally from the sewing process alone. The same emission occurs from burning 33,822 pounds
of coal.
Implications for Academia
University-industry collaboration is needed to address problem-based research like this.
Such collaboration needs to include two-way education between both parties – academics and
practitioners. In this study, practitioners’ interest in conserving energy was motivated by cost
savings, and their suggestions focused on increasing productivity within the apparel industry.
They then tried to connect energy conservation and faster production with the environmental
benefits, but not as their primary focus. Academic researchers can educate practitioners in the
form of university-industry collaboration in order to transform their current mindset into future-
fit logic.
Academic researchers could use the findings from this study in the classroom to illustrate
how factors are influencing energy consumption, thus educating the next generation of apparel
industry professionals, especially designers and product developers. Nielsen (2010) made a link
between designer with sustainable design by stating that “The designer creates products and
thereby consumption. This is why the role of the designer in relation to sustainable design is so
important to investigate.” (p. 88). The learning process will facilitate future professionals’
137
understanding of how they could contribute to producing environmental friendly apparel though
the designing and developing process.
Limitations
This study’s findings are limited by a number of issues. The sewing operations observed
for this study are not representative of sewing processes of all apparel industries in the US and
not a truly random sample. In addition, due to limited access to the industry and lack of specific
knowledge about distinctive US apparel production process, the researcher’s data collection
process had a few weaknesses. Some energy consumption factors could not be used identically in
both the qualitative and quantitative methods. The researcher was unable to predict a few data
collection related hurdles while quantifying factors such number of sewing operations, types of
stitch, and fabric thickness from the industry. Also, factories were unable to provide reliable
information regarding sewing machine age and maintenance. The method used to determine
SAM in this study included the subjective prediction of operators’ ratings, which varies
according to observer’s skills. The method of determining SAM based on general sewing data
(GSD) could overcome this limitation, because it eliminates subjective rating. However, lacking
the ability to purchase expensive GSD software prevented its use.
The interview question designed for exploring interrelationships between factors did not
elicit information as expected. After the first interview, the interrelationship question was moved
to the end of interview period as it changed the tone and mood of the session, however, it still did
not yield information as hoped. Additionally, the quantitative analysis (e.g., regression analysis)
is bound by hard-and-fast rules; it oftentimes restricted the ability for explorations and new
findings and instead simply identifies a factor as significant or not. Even though some of the
interrelationships were significant (e.g., thickness with fabric types; seam length with fabric
138
types) in the quantitative analysis, these interrelationships may not hold true for other apparel
production cases. For instance, both corduroy and terry fabrics hold greater thickness but are
different types of fabric. Also, children-wear has smaller seam lengths than that of menswear
regardless of the fabric type. Their interrelationships were right for the three factories studied in
this project, but they might not apply to the whole apparel sector.
Another limitation of the study was that the analyses of the interview responses might not
represent experts’ intended meanings due to the researcher being a non-native English speaker.
However, the researcher asked help from his academic supervisor on multiple occasions to
overcome this problem. Also, the knowledge level of experts and their personal characteristics
might affect the comprehensiveness of interview responses. In addition, the participants’ busy
schedule, their inability to provide sufficient time, their job-related interference during
interviews, and the power differential between experts and researcher may have had an impact
on interview quality. Finally, since this is an exploratory research study, there was a lack of
relevant literature related to energy consumption in the apparel sewing process; therefore, some
of the findings could not be supported by previous research.
Recommendations for Future Research
Future research recommendations are provided; several address limitations of this study.
The study participants were clearly more concerned about reducing cost than achieving
environmental sustainability. They considered reducing energy consumption from their apparel
production process mostly for the consequential cost reduction. Therefore, there is lack of
incorporating triple bottom line (TBL) aspect of sustainability in their apparel production and
sourcing decisions. Since SAM in the apparel sewing process has a clear connection to overall
production cost, it is an important element in the cost sheet of garments. Researchers interested
139
in apparel production environmental sustainability should focus on economic sustainability in
term of SAM at the outset of their research instead of starting with an environmental
sustainability angle. Subsequently, they could explore a way of integrating energy consumption
or carbon footprint information into the cost sheet of garments. This combined study will help
tracking carbon footprints from apparel production process along with educating both apparel
producers and brands, and will facilitate their environmental friendly decisions related to apparel
production and sourcing.
Another recommendation for future research is to use GSD based SAM on energy
consumption and compare the results with the current findings. It is believed that a study with
GSD based SAM would provide more accurate explanatory power on energy consumption,
because GSD does not include subjective evaluation. Also, a future study on different volts could
be pursued to determine any voltage-based difference in energy consumption because during
data collection, the researcher found some manufacturers use sewing machines with 220-volt
electricity, but the energy consumption meter used in this study was not compatible with 220-
volt. In addition, since this study fails to explain the negative relation of motor capacity with
energy consumption, future research using an instrument with more graphic display is
recommended. Such a study might provide additional findings related to energy conservation
through controlling motor capacity of sewing machines.
A similar study could also be replicated in different countries. Since the US is not
involved with apparel production extensively, both incorporating expert input and data from
different countries could provide more insights and further practical-based solutions. Finally, an
important future study focused upon developing a motor for industrial sewing machines that will
140
not consume any electricity without paddle engagement is highly recommended. This would be a
revolutionary energy savings project for the apparel sewing process.
Conclusion
This study set out to identify the most influential energy consumption factors of apparel
sewing processes in order to increase environmental sustainability in the apparel industry. This
study integrated a mixed method of research: qualitative and quantitative analysis of a list of
energy consumption factors. The list was developed from a review of academic literature and
researcher experience in the apparel industry. A realist approach with expert interview was
employed in the qualitative part. The quantitative part consisted of multiple regression analysis
where energy consumption was the response variable and factors were predictor variables.
Despite discrepancy between the qualitative and quantitative analyses findings, overall the idea
of incorporating mixed-method research holds merit in terms of attaining comprehensive insights
regarding energy consumption and to comprehend the implications holistically of this study.
This study also investigated the interrelationships among energy consumption factors and
identified solutions to reduce energy consumption. It further explored industry experts’ level of
concern regarding energy consumption, the contribution to greenhouse gas emissions, and
climate change in the apparel manufacturing. Knowing interrelationships among factors from
statistical analysis and expert opinions helped idential potential solutions to reduce energy
consumption in the sewing process. Experts provided factual solutions (with examples) to
produce energy efficient apparel and battled between environmental gains versus incurred cost.
However, a summary of their concerns can be expressed as follows: “I don’t think people are
going to be willing to pay more for energy efficient products.”
141
Today and even more so in the future, the pressure to reduce energy consumption will
come from the twin drivers of improving cost competitiveness and the growing demand for
garments with low environmental footprints. Performing energy conservation through studying
energy consumption can considerably reduce the energy cost. With maintaining a sustainable
production quantity, minimizing the waste of energy will be a win-win effort on both sides:
reducing energy cost and reducing environmental damage. Addressing the most influential
energy consumption factors and conservation opportunities will enhance the global
competitiveness of the apparel industry and its related sectors (e.g., spinning mill, fabric mill,
and wet processing mill) while reducing their environmental impact. This study identifies
potential energy consumption factors, develops an energy consumption model, and assesses
conservation improvement measures. With boundless apparel consumption and day-by-day
increasing consumed energy, it is now time to put our utmost focus on efficient use of energy
within the TA supply chain, especially in the short-focused apparel industry. The crisis related to
global climate change is cumulative, but the solutions are cumulative too. A small solution
carried out from the findings of this study along with other potential solutions might have a
bigger impact if we apply them together. According to Robertson (2014), we need to be
concentrated instead of diluted, focused instead of aimless, and integrated instead of
disconnected.
142
References
ABAC Women’s Forum. (2016). Hong Kong NGO makes work of reducing waste in the fashion
market. Retrieved from http://www.abacwomen.com/tag/fashion-industry/
Aranda-Uson, A., Ferreira, G., Mainar-Toledo, M., Scarpellini, S., & Sastresa, E. L. (2012).
Energy consumption analysis of Spanish food and drink, textile, chemical and non-
metallic mineral products sectors. Energy, 42(1), 477-485.
doi:10.1016/j.energy.2012.03.021
Babu, V. R. (2012). Industrial engineering in apparel production (1st ed.). India: Woodhead
Publishing India Pvt. Ltd.
Barriball, K. L., & While, A. (1994). Collecting Data using a semi‐structured interview: A
discussion paper. Journal of advanced nursing, 19(2), 328-335.
Beard, N. D. (2008). The branding of ethical fashion and the consumer: a luxury niche or mass-
market reality? Fashion Theory, 12(4), 447-467.
Berry, W. D., & Feldman, S. (1985). Multiple regression in practice (Sage University Paper
series on quantitative Applications in the Social Sciences, 07-050). Thousand Oaks, CA:
Sage Publications, Inc.
Bheda, R., Narag, A. S., & Singla, M. L. (2003). Apparel manufacturing: A strategy for
productivity improvement. Journal of Fashion Marketing and Management, 7(1), 12-22.
Bhurtun, C., Kistamah, N., & Chummun, J. (2006). Energy saving strategies in textile industry:
The case of Mauritius. Paper presented at the Proceedings of Industrial and Commercial
Use of Energy Conference, 53-57.
Blockstein, D., & Wiegman, L. (Eds.). (2010). The climate solutions consensus: What we know
and what to do about it. Washington, DC: Island Press.
143
Bonacich, E. (1998). Latino immigrant workers in the Los Angeles apparel industry. New
Political Science, 20(4), 459-473. doi:10.1080/07393149808429841
Business for Social Responsibility. (2009). Apparel industry life cycle carbon mapping.
Retrieved from
http://www.bsr.org/reports/BSR_Apparel_Supply_Chain_Carbon_Report.pdf
Challa, L. (2012). Impact of textile and clothing industry on environment: Approach to
ecofriendly textiles. Retrieved from http://www.fibre2fashion.com/industryarticle/
textile-industry-articles/impact-of-textiles-and-clothing-industry-onenvironment/
impact-of-textiles-and-clothing-industry-on-environment1.asp
Chapman, J. (2015). Emotionally durable design: objects, experiences and empathy (2nd ed.).
London and New York: Routledge, Taylor and Francis Group.
Charmaz, K. (2014). Constructing grounded theory (2nd ed.). California: Sage Publications Inc.
Chestney, N. (2012). Global warming close to becoming irreversible- scientists. Retrieved
from www.reuters.com/assets/print?aid=USBRE82P0UJ20120326
Clapp, T. G., Little, T. J., Thiel, T. M., & Vass, D. J. (1992). Sewing dynamics: Objective
measurement of fabric/ machine interaction. International Journal of Clothing Science
and Technology, 4(2-3), 45-53.
Creswell, J. W. (2009). Research design: Qualitative, quantitative, and mixed methods
approaches (3rd ed.). USA: Sage Publication Inc.
Cooklin, G. (2006). Introduction to clothing manufacture (2nd ed.). UK: Blackwell Publishing.
Conca, J. (2015). Making climate change fashionable - The garment industry takes on global
warming. Retrieved from http://www.forbes.com/sites/jamesconca/2015/12/03/making-
climate-change-fashionable-the-garment-industry-takes-on-global-warming/
144
Daly, H. E., & Farley, J. (2011). Ecological economics: Principles and applications.
Washington, DC: Island Press.
Department for Environment, Food & Rural Affairs. (2011). Sustainable clothing roadmap.
(Progress report 2011). UK: Department for Environment, Food & Rural Affairs.
Retrieved from
https://www.gov.uk/government/uploads/system/uploads/attachment_data/file/69299/pb1
3461-clothing-actionplan-110518.pdf
Downe-Wamboldt, B. (1992). Content analysis: Method, applications, and issues. Health Care
for Women International, 13, 313-321.
Draper, S., Murray, V., & Weissbrod, I. (2007, March). Fashioning sustainability— a review
of sustainability impacts of the clothing industry. London, UK: Forum for the Future.
Driscoll, D., Appiah-Yeboah, A., Salib, P., & Rupert, D. (2007). Merging qualitative and
quantitative data in mixed methods research: How to and why not. Ecological and
Environmental Anthropology, 3, (19-28).
Edwards, A. R. (2005). The sustainability revolution: Portrait of a paradigm shift. Gabriola
Island: New Society Publishers.
Environmental Protection Agency. (2013). Environmental protection agency: Greenhouse gas
equivalences calculator. Retrieved from https://www.epa.gov/energy/greenhouse-gas-
equivalencies-calculator
Eryuruk, S. H. (2012). Greening of the textile and clothing industry. Fibres & Textiles in Eastern
Europe, 20(6), 22-27.
Forbat, L., & Henderson, J. (2005). Theoretical and practical reflections on sharing transcripts
with participants. Qualitative Health Research, 15(8), 1114-1128.
145
General Sewing Data Limited, (1990). General sewing data (GSD): Student manual. UK:
Methods Workshop.
Glock, R. E. (2005). Apparel manufacturing: Sewn product analysis (4th ed.). NJ: Upper Saddle
River.
Green, S. B. (1991). How many subjects does it take to do a regression analysis? Multivariate
behavioral research, 26(3), 499-510.
Guest, G., Bunce, A., & Johnson, L. (2006). How many interviews are enough? An experiment
with data saturation and variability. Field Methods, 18(1), 59-82.
Hasanbeigi, A. (2010). Energy-efficiency improvement opportunities for the textile industry.
(Research No. LBNL-3970E). University of California: Lawrence Berkeley National
Laboratory. Retrieved from http://escholarship.org/uc/item/6jw8s2gz
Hasanbeigi, A., Hasanabadi, A., & Abdorrazaghi, M. (2012). Energy-efficiency technologies and
benchmarking the energy intensity for the textile industry. Paper presented at the
Proceedings of the American Council for an Energy-Efficient Economy’s 2011 Summer
Study on Energy Efficiency in Industry, Niagara Falls, New York, U.S.A.
Hasanbeigi, A., & Price, L. (2012). A review of energy use and energy efficiency technologies
for the textile industry. Renewable and Sustainable Energy Reviews, 16(6), 3648-3665.
Hayes, S., & Mcloughlin, J. (2013). 3 - The sewing of textiles. In I. Jones, & G. K. Stylios
(Eds.), Joining textiles (pp. 62-122). UK: Woodhead Publishing.
doi:http://dx.doi.org/10.1533/9780857093967.1.62
Heinberg, R. (2011). The end of growth: Adapting to our new economic reality. Canada: New
Society Publishers.
Henson, R. (2011). The rough guide to climate change. New York: Dorling Kindersley Ltd.
146
Hiller Connell, K. Y. (2015). Environmental impacts of apparel production, distribution,
and consumption: An overview. (pp. 167-180). In S. S. Muthu (Ed.), Handbook of
sustainable apparel production. New York, NY: CRC Press.
Hong, G. B., Su, T. L., Lee, J. D., Hsu, T. C., & Chen, H. W. (2010). Energy conservation
potential in Taiwanese textile industry. Energy Policy, 38(11), 7048-7053.
Houghton, J. (2009). Global warming: The complete briefing (4th ed.). Cambridge: Cambridge
University Press.
Hsieh, H. F., & Shannon, S. E. (2005). Three approaches to qualitative content analysis.
Qualitative Health Research, 15(9), 1277-1288.
Hutchins, G. (2016). Phoenix rising: Creating a 'future fit' business. Retrieved from
https://www.greenbiz.com/article/phoenix-rising-creating-future-fit-business
Hyllegard, K., Ogle, J., & Yan, R. N. (2009). The impact of advertising message strategy-fair
labor v. sexual appeal-upon Gen Y consumers' intent to patronize an apparel retailer.
Journal of Fashion Marketing and Management: An International Journal, 13(1), 109-
127.
International Energy Agency. (2012). World energy outlook' 2013. Retrieved from
http://www.iea.org/newsroomandevents/speeches/131112_WEO2013_Presentation.pdf
International Energy Agency. (2013). Unit converter. Retrieved from
http://www.iea.org/stats/unit.asp
Institute for Energy Research. (2013). Statistical review of world energy 2013. Retrieved from
http://www.instituteforenergyresearch.org/2013/06/27/statistical-review-ofworld-energy-
2013-viva-la-shale-revolucion/
147
Intergovernmental Panel on Climate Change. (2007). Climate change 2007: The physical science
basis. Contribution of Working Group I to the fourth assessment report of the
Intergovernmental Panel on Climate Change. Cambridge: Cambridge University Press.
Intergovernmental Panel on Climate Change. (2012). Renewable energy sources and climate
change mitigation (Special Report). Contribution of Working Group III to the summary
of policymakers and technical summary. Retrieved from IPCC website:
https://www.ipcc.ch/pdf/special-reports/srren/SRREN_FD_SPM_final.pdf
Intergovernmental Panel on Climate Change. (2014). Climate change 2014: Mitigation of
climate change (5th Assessment Report). Contribution of Working Group III to the 5th
assessment report of the Intergovernmental Panel on Climate Change. Retrieved from
IPCC website:
https://www.ipcc.ch/pdf/assessment-report/ar5/wg3/ipcc_wg3_ar5_full.pdf
Jananthant, R., Ameer, S., & Shiyamini, R. (2006). Comparative study of energy assessment
from apparel industries: The context of Sri Lanka. Paper presented at the First
International Conference on Industrial and Information Systems (ICIIS), Sri Lanka. 217-
220.
Jebaraj, S., Iniyan, S. (2006). A review of energy models. Renewable and Sustainable Energy
Reviews, 10(4), 281-311.
Jones, R. M. (2006). The apparel industry (2nd ed.). UK: Blackwell Publishing.
Juan, C. H. (1998). Improving working conditions and productivity in the garment industry:
Practical ideas for owners and managers of small and medium-sized enterprises. (Action
manual No. 137). Geneva: International Labour Office.
148
Kalliala, E., & Talvenmaa, P. (2000). Environmental profile of textile wet processing in Finland.
Journal of Cleaner Production, 8(2), 143-154. doi:10.1016/S0959-6526(99)00313-3
Kanawaty, G. (1992). Introduction to work study (4th ed.). Geneva: International Labour
Organization.
Kansas State University. (2015). Institutional review board. Retrieved from
https://www.k-state.edu/comply/irb/
Kim, S. Y., Grady, P. L., & Hersh, S. P. (1983). Energy consumption and conservation in the
fiber-producing and textile industries. Textile Progress, 13(3), 1-14.
doi:10.1080/00405168308688996
Kiran-Ciliz, N. (2003). Reduction in resource consumption by process modifications in cotton
wet processes. Journal of Cleaner Production, 11(4), 481-486. doi:10.1016/S0959-
6526(02)00069-0
Kirchain, R., Olivetti, E., Miller, T. R., & Greene, S. (2015). Sustainable apparel materials.
Retrieved from http://msl.mit.edu/publications/SustainableApparelMaterials.pdf
Kocabas, A. M., Yukseler, H., Dilek, F. B., & Yetis, U. (2009). Adoption of European Union's
IPPC directive to a textile mill: Analysis of water and energy consumption. Journal of
Environmental Management, 91(1), 102. Retrieved from
http://search.proquest.com/docview/195627555?accountid=11789
Kump, L. R., Kasting, J. F., & Crane, R. G. (2010). The earth system (3rd ed.). Upper Saddle
River, NJ: Prentice Hall.
Laing, R. M., & Webster, J. (1998). Stitches & seams. UK: The Textile Institute Publication.
MacLean, L. M., Meyer, M., & Estable, A. (2004). Improving accuracy of transcripts in
qualitative research. Qualitative Health Research, 14(1), 113-123.
149
Martin, S., & Griswold, W. (2009). Human health effects of heavy metals. Environmental
Science and Technology Briefs for Citizens, 15, 1-6.
Martinez, C. (2010). Energy use and energy efficiency development in the German and
Colombian textile industries. Energy for Sustainable Development, 14(2), 94-103.
doi:10.1016/j.esd.2010.02.001
Maxwell, J. A. (2012). A realist approach for qualitative research. Thousand Oaks, CA: Sage
Publications, Inc.
Maxwell, S. E. (2000). Sample size and multiple regression analysis. Psychological methods,
5(4), 434.
Merriam, S. B. (2009). Qualitative research: A guide to design and implementation. San
Francisco, CA: Jossey-Bass.
National Aeronautics and Space Administration. (2015). Global climate change vital signs of the
planet. Retrieved from http://climate.nasa.gov/vital-signs/global-temperature/
National Aeronautics and Space Administration. (2016). A blanket around the Earth. Retrieved
from http://climate.nasa.gov/causes/
Nielsen, L. H. (2010). The role of the designer. (pp. 66-89). Sustainable fashion –Issues to be
addressed. Denmark: Laboratory for Design, Innovation and Sustainability at Kolding
School of Design.
Oliver, D. G., Serovich, J. M., & Mason, T. L. (2005). Constraints and opportunities with
interview transcription: Towards reflection in qualitative research. Social forces, 84(2),
1273-1289.
Ozturk, H. K. (2005). Energy usage and cost in textile industry: A case study for turkey. Energy,
30(13), 2424-2446.
150
Palamutcu, S. (2010). Electric energy consumption in the cotton textile processing stages.
Energy, 35(7), 2945-2952.
Palanichamy, C., & Babu, N. S. (2005). Second stage energy conservation experience with a
textile industry. Energy Policy, 33(5), 603-609. Retrieved from
http://search.proquest.com/docview/205313918?accountid=11789
Patton, M. Q. (2002). Qualitative research & evaluation methods (3rd ed.). Thousand Oaks,
CA.: Sage Publications Inc.
Perry, P., & Towers, N. (2009). Determining the antecedents for a strategy of corporate social
responsibility by small- and medium-sized enterprises in the UK fashion apparel industry.
Journal of Retailing and Consumer Services, 16(5), 377-385.
doi:10.1016/j.jretconser.2009.05.003
Phylipsen, D., Blok, K., Worrell, E., & de Beer, J. (2002). Benchmarking the energy efficiency
of Dutch industry: An assessment of the expected effect on energy consumption and CO2
emissions. Energy Policy, 30(8), 663-679.
Poland, B. D. (1995). Transcription quality as an aspect of rigor in qualitative research.
Qualitative Inquiry, 1, 290–310.
Price, L., Wang, X. J., & Yun, J. A. (2010). The challenge of reducing energy consumption of
the top-1000 largest industrial enterprises in China. Energy Policy, 38(11), 6485-6498.
doi:10.1016/j.enpol.2009.02.036
Raggi, A., & Barbiroli, G. (1992). Factors influencing changes in energy consumption - the case
of Italy, 1975-85. Energy Economics, 14(1), 49-56.
Randolph, J., & Masters, G. M. (2008). Energy for sustainability: Technology, planning, policy.
Washington, DC: Island Press.
151
Reddy, B. S., & Ray, B. K. (2011). Understanding industrial energy use: Physical energy
intensity changes in Indian manufacturing sector. Energy Policy, 39(11), 7234. Retrieved
from http://search.proquest.com/docview/902839567?accountid=11789
Reitler, W., Rudolph, M., & Schaefer, H. (1987). Analysis of the factors influencing energy
consumption in industry: A revised method. Energy Economics, 9(3), 145-148.
Robertson, M. (2014). Sustainability principles and practice. New York: Routledge.
Rogale, D., Dragčević, Z., & Petrunić, I. (2003). Determining energy parameters in garment
sewing operations. Paper presented at the 4th International Conference Innovation and
Modelling of Clothing Engineering Processes, IMCEP 2003
Rogale, D., Petrunic, I., Dragcevic, Z., & Rogale, S. F. (2005). Equipment and methods used to
investigate energy processing parameters of sewing technology operations. International
Journal of Clothing Science and Technology, 17(3-4), 179-187.
doi:10.1106/09556220510590876
Romney, A., Batchelder, W., & Weller, S. (1986). Culture as consensus: A theory of culture and
informant accuracy. American Anthropologist, 88, 313-338.
Ross, R. J. S. (2002). The "race to the bottom" in imported clothes: Worldwide, apparel
production has been shifting dramatically to low-wage countries in recent years.
(Economy in numbers). Retrieved from
http://go.galegroup.com/ps/i.do?id=GALE%7CA87425308&v=2.1&u=ksu&it=r&p=AO
NE&sw=w&asid=08bc1d2372fd1f54d4acae3e3d75d8d9
Rupp, J. (2008). Ecology and economy in textile finishing. Textile World, 158, 38-41.
Ryan, G. W., & Bernard, H. R. (2003). Techniques to identify themes. Field methods, 15(1), 85-
109.
152
Saidur, R. (2010). A review on electrical motors energy use and energy savings. Renewable and
Sustainable Energy Reviews, 14 (3), 877–898. doi:10.1016/j.rser.2009.10.018
Salby, M (2011, August 2). Global Emission of Carbon Dioxide: The Contribution from Natural
Sources. The Sydney Institute Podcasts. Podcast retrieved from
http://thesydneyinstitute.com.au/blog/podcast/global-emission-of-carbon-dioxide-the-
contribution-from-natural-sources/
Schönberger, H., & Schäfer, T. (2003). Best available techniques in textile industry. (Research
report). Germany: Federal Environmental Agency (Umweltbundesamt). Retrieved from
http://www.umweltdaten.de/publikationen/fpdf-l/2274.pdf.
Scott, A. J. (2006). The changing global geography of low-technology, labor-intensive industry:
Clothing, footwear, and furniture. World Development, 34(9), 1517-1536.
Shelton, R. K., & Wacher, K. (2005). Effects of global sourcing on textiles and apparel. Journal
of Fashion Marketing and Management, 9(3), 318-329.
doi:10.1108/13612020510610444
Sivaramakrishnan, A., Muthuvelan, M., Ilango, G., & Alagarsamy, M. (2009). Energy saving
potential in spinning, weaving, knitting, processing, and garmenting, Retrieved from
http://www.emt-india.net/Presentations2009/3L_2009Aug8_Textile/06-SITRA.pdf
Solinger, J. (1988). Apparel manufacturing handbook: Analysis, principles and practice. USA:
Bobbin Blenheim Media Corporation.
Steinberger, J. K., Friot, D., Jolliet, O., & Erkman, S. (2009). A spatially explicit life cycle
inventory of the global textile chain. International Journal of Life Cycle Assessment,
14(5), 443-455. doi:10.1007/s11367-009-0078-4
153
Strong, C. (1997). The problems of translating fair trade principles into consumer purchase
behavior. Marketing Intelligence & Planning, 15(1), 32-37.
Sule, A. (2012). Life cycle assessment of clothing process. Research Journal of Chemical
Sciences, 2(2), 87-89.
Sweeny, G. (2015). Fast fashion is the second dirtiest industry in the world, next to big oil.
AlterNet. Retrieved from http://ecowatch.com/2015/08/17/fast-fashion-second-dirtiest-
industry/
Tesch, R. (1990). Qualitative research: Analysis types and software tools. Bristol, PA: Falmer.
Thiede, S., Posselt, G., & Herrmann, C. (2013). SME appropriate concept for continuously
improving the energy and resource efficiency in manufacturing companies. CIRP Journal of
Manufacturing Science and Technology, 6(3), 204-211. doi:10.1016/j.cirpj.2013.02.006
Tilley, S. A. (2003). “Challenging” research practices: Turning a critical lens on the work of
transcription. Qualitative Inquiry, 9(5), 750-773.
Tilley, S. A., & Powick, K. D. (2002). Distanced data: Transcribing other people's research
tapes. Canadian Journal of Education/Revue Canadienne De L'Education, 27(2/3), 291-
310. doi:10.2307/1602225
Tyler D. J. (2008). Carr and Latham’s technology of clothing manufacturing (4th ed.). UK:
Blackwell Publishing.
United Nations Industrial Development Organization. (1992). Output of a seminar on energy
conservation in textile industry. (Handy manual). Japan: The Energy Conservation Center
(ECC).
Visvanathan, C., Kumar, S., Priambodo, A., & Vigneswaran, S. (1999). Energy and
environmental indicators in the Thai textile industry. (Technical Report). Thailand:
154
School of Environment, Resources and Development, Asian Institute of Technology.
Retrieved from
http://www.faculty.ait.ac.th/visu/SMI_Roadmap/Publications/Conf_Work_Smnr/Thai_te
xtile_Visu.pdf
Vittinghoff, E., & McCulloch, C. E. (2007). Relaxing the rule of ten events per variable in
logistic and Cox regression. American journal of epidemiology, 165(6), 710-718.
World Commission on Environmental Development. (1987). Our common future: World
commission on environmental development. The Brundtland-Report. Oxford: Oxford
University Press.
Witcher, C. S. (2010). Negotiating transcription as a relative insider: implications for rigor.
International Journal of Qualitative Methods, 9(2), 122-132.
Wolfson, R. (2007). Earth’s changing climate. Chantilly, VA: The Teaching Company.
Wolfson, R. (2008). Energy, environment, and climate. New York: W. W. Norton & Company,
Inc.
World Trade Organization. (2014). International trade statistics 2014. (Annual). World Trade
Organization.
Yuasa, M. (2001). Globalization and flexibility in the textile/apparel industry of Japan. Asia
Pacific Business Review, 8(1), 80-101.
Zabaniotou, A., & Andreou, K. (2010). Development of alternative energy sources for GHG
emissions reduction in the textile industry by energy recovery from cotton ginning waste.
Journal of Cleaner Production, 18(8), 784-790. doi:10.1016/j.jclepro.2010.01.006
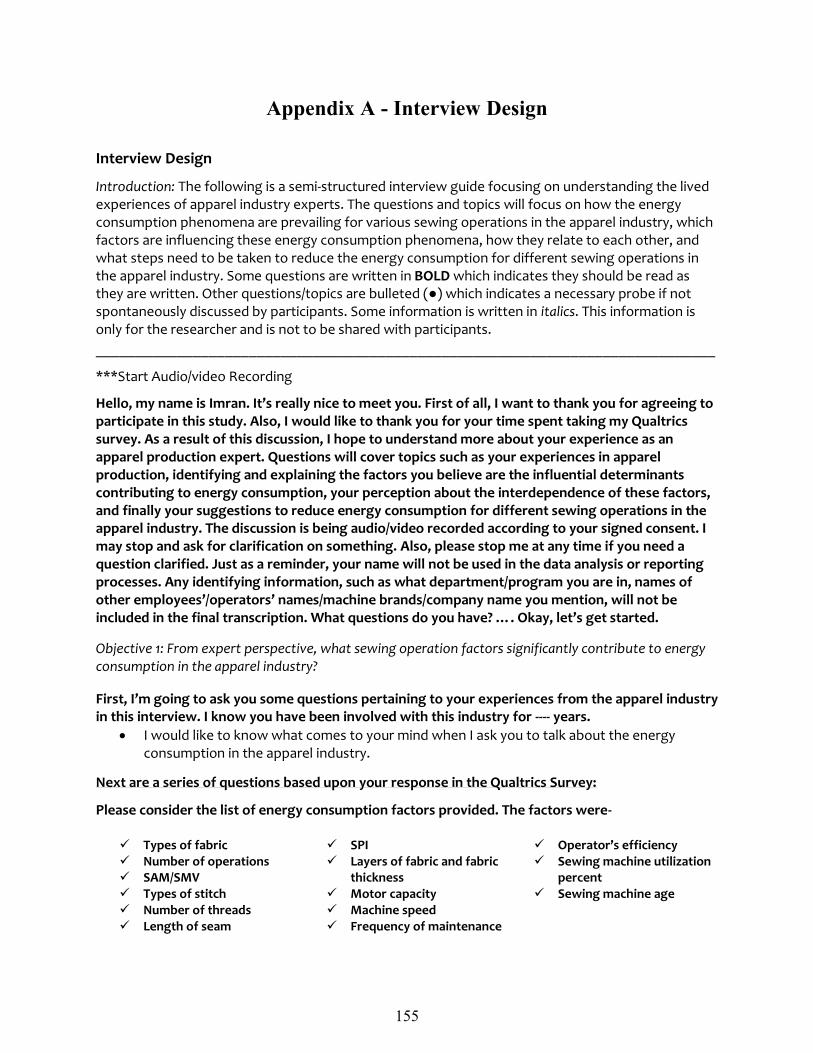
155
Appendix A - Interview Design
Interview Design
Introduction: The following is a semi-structured interview guide focusing on understanding the lived experiences of apparel industry experts. The questions and topics will focus on how the energy consumption phenomena are prevailing for various sewing operations in the apparel industry, which factors are influencing these energy consumption phenomena, how they relate to each other, and what steps need to be taken to reduce the energy consumption for different sewing operations in the apparel industry. Some questions are written in BOLD which indicates they should be read as they are written. Other questions/topics are bulleted (●) which indicates a necessary probe if not spontaneously discussed by participants. Some information is written in italics. This information is only for the researcher and is not to be shared with participants.
_____________________________________________________________________________
***Start Audio/video Recording
Hello, my name is Imran. It’s really nice to meet you. First of all, I want to thank you for agreeing to participate in this study. Also, I would like to thank you for your time spent taking my Qualtrics survey. As a result of this discussion, I hope to understand more about your experience as an apparel production expert. Questions will cover topics such as your experiences in apparel production, identifying and explaining the factors you believe are the influential determinants contributing to energy consumption, your perception about the interdependence of these factors, and finally your suggestions to reduce energy consumption for different sewing operations in the apparel industry. The discussion is being audio/video recorded according to your signed consent. I may stop and ask for clarification on something. Also, please stop me at any time if you need a question clarified. Just as a reminder, your name will not be used in the data analysis or reporting processes. Any identifying information, such as what department/program you are in, names of other employees’/operators’ names/machine brands/company name you mention, will not be included in the final transcription. What questions do you have? …. Okay, let’s get started.
Objective 1: From expert perspective, what sewing operation factors significantly contribute to energy consumption in the apparel industry?
First, I’m going to ask you some questions pertaining to your experiences from the apparel industry in this interview. I know you have been involved with this industry for ---- years.
I would like to know what comes to your mind when I ask you to talk about the energy consumption in the apparel industry.
Next are a series of questions based upon your response in the Qualtrics Survey:
Please consider the list of energy consumption factors provided. The factors were-
Types of fabric Number of operations SAM/SMV Types of stitch Number of threads Length of seam
SPI Layers of fabric and fabric
thickness Motor capacity Machine speed Frequency of maintenance
Operator’s efficiency Sewing machine utilization
percent Sewing machine age
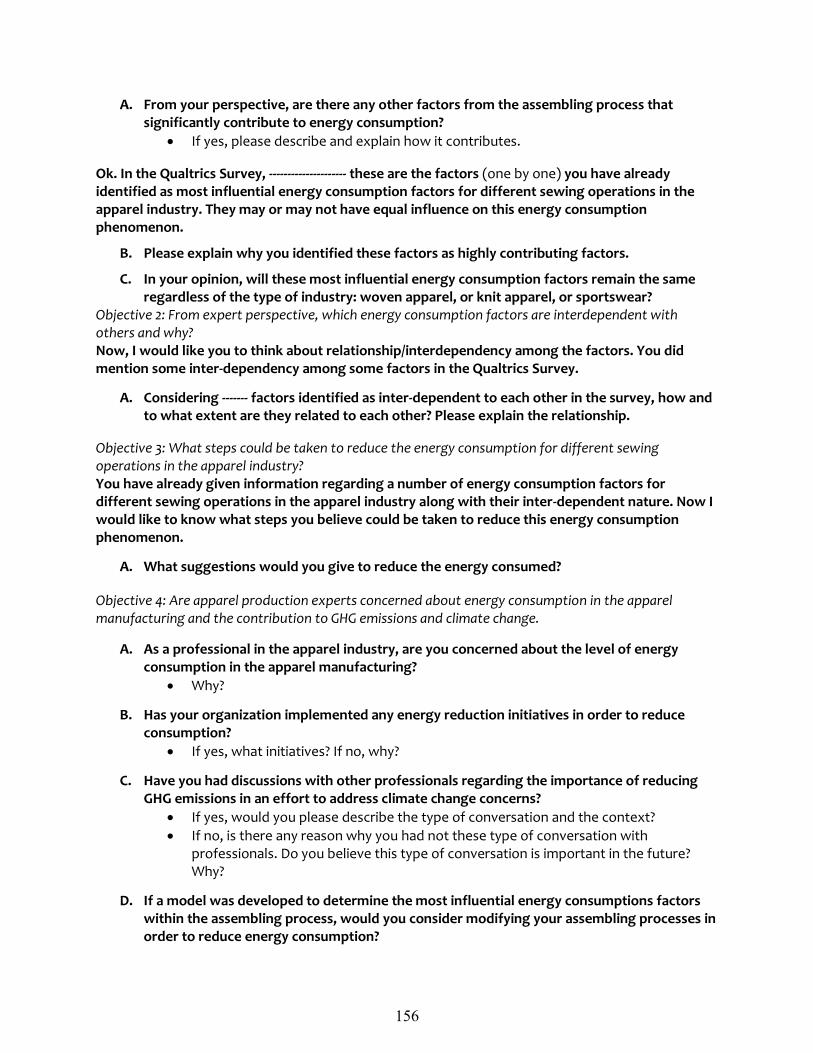
156
A. From your perspective, are there any other factors from the assembling process that significantly contribute to energy consumption?
If yes, please describe and explain how it contributes.
Ok. In the Qualtrics Survey, --------------------- these are the factors (one by one) you have already identified as most influential energy consumption factors for different sewing operations in the apparel industry. They may or may not have equal influence on this energy consumption phenomenon.
B. Please explain why you identified these factors as highly contributing factors.
C. In your opinion, will these most influential energy consumption factors remain the same regardless of the type of industry: woven apparel, or knit apparel, or sportswear?
Objective 2: From expert perspective, which energy consumption factors are interdependent with others and why? Now, I would like you to think about relationship/interdependency among the factors. You did mention some inter-dependency among some factors in the Qualtrics Survey.
A. Considering ------- factors identified as inter-dependent to each other in the survey, how and to what extent are they related to each other? Please explain the relationship.
Objective 3: What steps could be taken to reduce the energy consumption for different sewing operations in the apparel industry? You have already given information regarding a number of energy consumption factors for different sewing operations in the apparel industry along with their inter-dependent nature. Now I would like to know what steps you believe could be taken to reduce this energy consumption phenomenon.
A. What suggestions would you give to reduce the energy consumed?
Objective 4: Are apparel production experts concerned about energy consumption in the apparel manufacturing and the contribution to GHG emissions and climate change.
A. As a professional in the apparel industry, are you concerned about the level of energy consumption in the apparel manufacturing?
Why?
B. Has your organization implemented any energy reduction initiatives in order to reduce consumption?
If yes, what initiatives? If no, why?
C. Have you had discussions with other professionals regarding the importance of reducing GHG emissions in an effort to address climate change concerns?
If yes, would you please describe the type of conversation and the context?
If no, is there any reason why you had not these type of conversation with professionals. Do you believe this type of conversation is important in the future? Why?
D. If a model was developed to determine the most influential energy consumptions factors within the assembling process, would you consider modifying your assembling processes in order to reduce energy consumption?

157
If yes, are there certain features or characteristics you would like to see in this model?
If no, what barriers are in place that will keep you from using such a model?
E. In the decision making process, production rate is an important consideration. Do you believe energy consumption may become another important consideration in your decision making?
If yes, could you please explain?
If no, why?
We have come to the end of the interview. Is there anything that you would like to add that was not asked or covered?
Again, thank you for your participation in this interview. All the information and unique experiences you offered will be helpful in understanding more about how energy consumption can be reduced in the apparel industry. On the informed consent, there was a place for you to initial if you consent to being contacted in the future regarding this research topic. If you initialed that area, I may be getting in touch with you in the coming weeks to make sure that I captured what you said correctly. If at any time you wish to withdraw your interview data from the study, you may do so. **End Audio/Video Recording
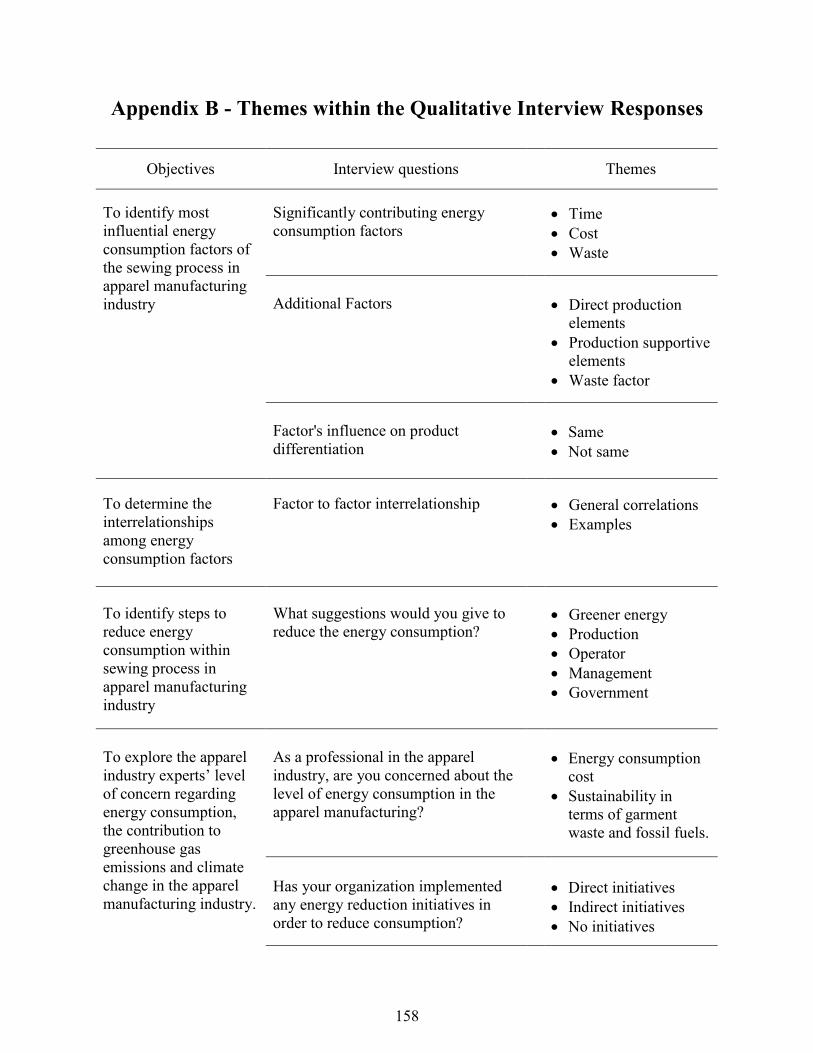
158
Appendix B - Themes within the Qualitative Interview Responses
Objectives Interview questions
Themes
To identify most
influential energy
consumption factors of
the sewing process in
apparel manufacturing
industry
Significantly contributing energy
consumption factors
Time
Cost
Waste
Additional Factors Direct production
elements
Production supportive
elements
Waste factor
Factor's influence on product
differentiation
Same
Not same
To determine the
interrelationships
among energy
consumption factors
Factor to factor interrelationship General correlations
Examples
To identify steps to
reduce energy
consumption within
sewing process in
apparel manufacturing
industry
What suggestions would you give to
reduce the energy consumption?
Greener energy
Production
Operator
Management
Government
To explore the apparel
industry experts’ level
of concern regarding
energy consumption,
the contribution to
greenhouse gas
emissions and climate
change in the apparel
manufacturing industry.
As a professional in the apparel
industry, are you concerned about the
level of energy consumption in the
apparel manufacturing?
Energy consumption
cost
Sustainability in
terms of garment
waste and fossil fuels.
Has your organization implemented
any energy reduction initiatives in
order to reduce consumption?
Direct initiatives
Indirect initiatives
No initiatives
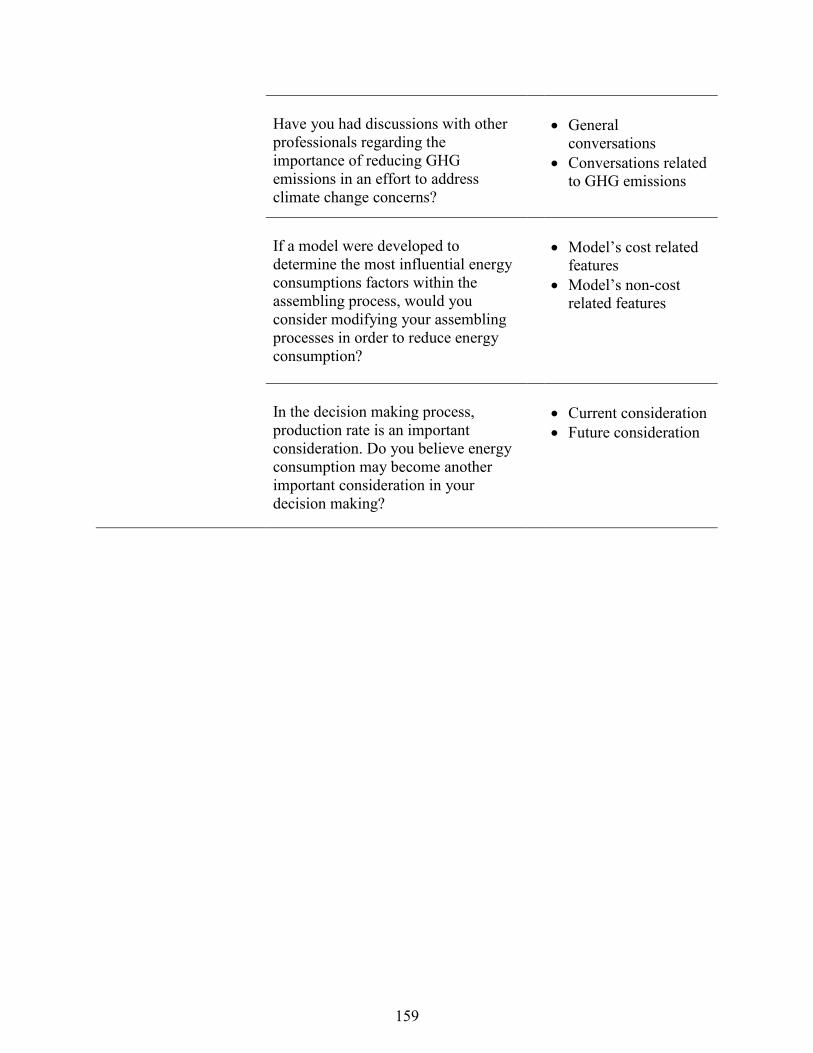
159
Have you had discussions with other
professionals regarding the
importance of reducing GHG
emissions in an effort to address
climate change concerns?
General
conversations
Conversations related
to GHG emissions
If a model were developed to
determine the most influential energy
consumptions factors within the
assembling process, would you
consider modifying your assembling
processes in order to reduce energy
consumption?
Model’s cost related
features
Model’s non-cost
related features
In the decision making process,
production rate is an important
consideration. Do you believe energy
consumption may become another
important consideration in your
decision making?
Current consideration
Future consideration
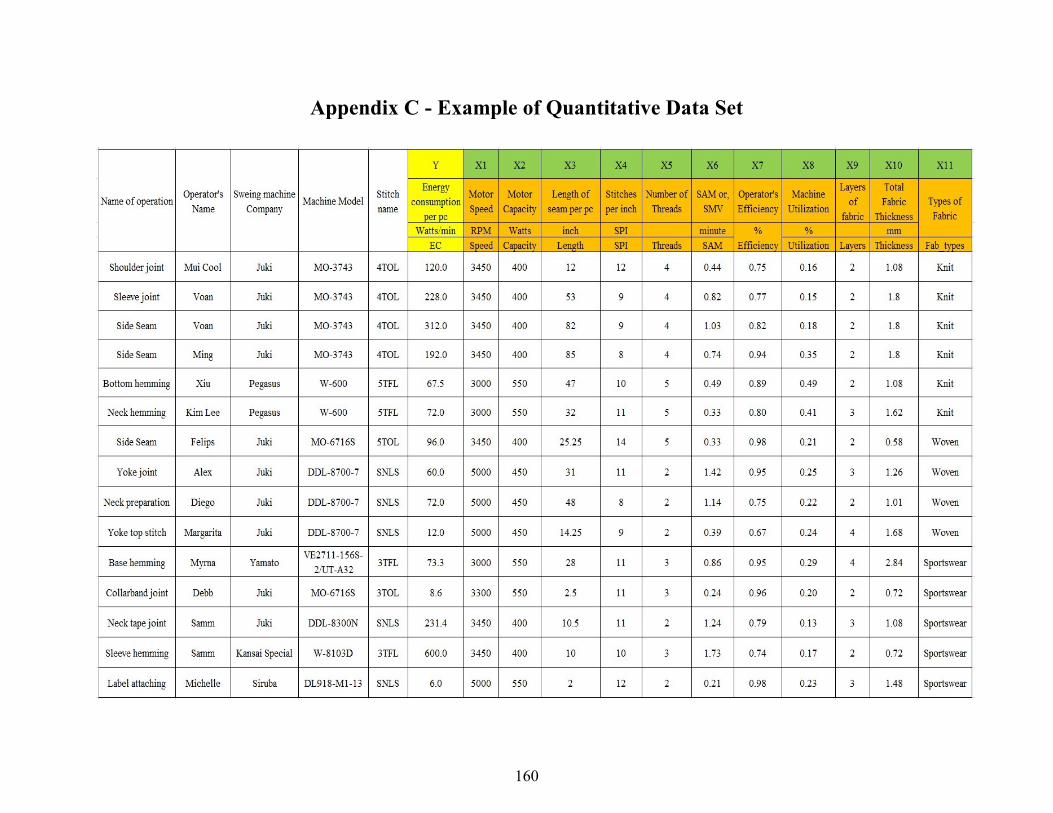
160
Appendix C - Example of Quantitative Data Set