Embed Size (px)
Citation preview

Post-2015 Development Agenda
Brazil Perspectives
Energy
1
SPEAKERS AND CONTRIBUTORS
Isabel Galiana Isabel Galiana is lecturer at the Department of Economics, McGill University, Canada and a guest researcher
at the Center for Climate Science and Policy Research at the Linkoping University, Sweden. Isabel was a
former advisor to Minister for Sustainable Development, the Environment and Parks in the province of
Quebec. Much of her research focuses on the links between environmental policy and innovation. She is
particularly interested in how policy can shape the development and implementation of low-carbon
technologies. She holds a PhD in economics from McGill University.
Brazilian Foundation for Sustainable Development The Brazilian Foundation for Sustainable Development (In Portuguese Fundação Brasileira para o
Desenvolvimento Sustentável - FBDS) is a nonprofit organization differentiated by its network with the
scientific community, international finance agencies and national corporations. It is an organization which
considers and structures projects and partnerships on the subject of sustainable development by means of an
organization which integrates the forefront of know-how with management capacity.

Table of Contents
Summary: White Paper Report by Isabel Galiana .................................................................... 1
White Paper Report by Isabel Galiana ..................................................................................... 3
Presentation by Isabel Galiana .............................................................................................. 12
Presentation by Brazilian Foundation for Sustainable Development ........................................ 24

1
Summary: White Paper Report by Isabel Galiana Brazil is blessed with a wide range of energy resources. The country has a large hydroelectricity capacity –
although longer-term reliance on this has been put into question to some extent by the current extended
period of drought – as well as being a large producer of ethanol, has good wind resources and large reserves
of oil, gas and coal.
Brazil is the world’s eighth largest energy consumer and tenth largest producer, and is nearly self-sufficient in
energy. By 2035, energy production is forecast to rise by 115%, with consumption growing by only 72%.
A primary post-2015 development goal it to ensure universal access to both electricity and modern cooking
fuels. Brazil already has a very good record on these issues. The Luz para todos program increased access to
electricity from 71% in 2000 to 98% in 2010, and has since been refocused on mini-grids and isolated systems
to target the most remote consumers. Consumption of firewood for cooking has declined by 2.9% per annum
since 1970 and over 95% of the population now has access to modern cooking fuels.
Another target is to double the rate of energy efficiency improvement. This is more difficult for Brazil than
some countries because it already has very low energy intensity and its rate of efficiency improvement has
stagnated; it has actually been rising by about 0.2% annually since 2000. The country is ranked 21st in terms
of global energy efficiency, but there is still some way to go to reach the level of the most efficient countries
such as Colombia, the UK, Spain and Italy.
To reach the top ten and achieve the current efficiency level of the EU will need an efficiency improvement of
1.1% each year. But there are some real challenges. There has been a trend away from hydro towards
thermal power generation, and the old, strained electricity network suffers from considerable losses, for
technical reasons as well as energy theft. Also, grid capacity will need to be expanded to meet future
demand.
The Plano Nacional de Energia 2030 (PNE) and Plano Decenal de Expansão de Energia (PDE) both include
energy efficiency targets. Increasing the efficiency of energy use would save money for consumers and
businesses and reduce the risk of energy shortages, and some of the measures to be used are directly cost-
saving. Overall, investing a Real in improved energy efficiency would pay back around 2.3 Reals in benefits,
mainly avoiding further investment, improving business productivity and lowering consumer bills, and
reducing CO2 emissions.
A further global target is to double the share of renewable energy. But Brazil already has a 40% share and
doubling this to 80% would not be cost-effective. A more realistic target is to reduce the share of fossil fuels
to 40% by 2035 (from the expected 52-57% for business as usual). This allows for a greater contribution of
nuclear energy as well as renewables.
Investing more in nuclear and renewable electricity generation would reduce both climate impacts and
pollution and increase energy security and improve the balance of payments. With population growth in
Brazil being quite low, most increased demand for transport energy comes from greater prosperity. Investing
in public transport, electric vehicle infrastructure and ethanol expansion could avoid greater use of fossil
fuels. Investing a Real in this way would be expected to produce over two Reals of benefits.
A final goal is doubling investment in R&D in energy technologies. Brazil has a well-educated population and
experience in high tech industries which should make the country well placed to achieve this. R&D spending

2
per capita is a fifth of that of South Korea, so there is plenty of scope for improvement. Estimating costs and
benefits is really difficult, but it seems clear that this effort could be very beneficial to the Brazilian economy.
3
White Paper Report by Isabel Galiana
Current State of Affairs
Brazil is well known for its clean energy mix, including hydro, wind and ethanol, but with recent discovery and accelerated extraction of its large oil reserves, the picture is changing. Furthermore, rapidly growing internal energy demands, ageing infrastructure, and the impacts of climate change need to be addressed within the nation’s energy policy.
Brazil is the largest country in South America and the fifth largest country in the world in terms of surface area. It has vast resources including; a diverse geography (long coast line, rain forest, etc.), a population of over 200 million (the fifth largest in the world), a diversified economy and an abundance of energy resources. Brazil is the seventh largest economy in the world: in 2014 GDP reached 2.2 trillion US$. As a BRICS country, it is considered an emerging economy with a GDP/capita of 5823USD and relatively rapid GDP growth. Annual growth rates in Brazil averaged 2.98 percent from 1991 until 2014, but the last three quarters have seen economic contraction. Brazil has reduced the share of the population living in poverty from 20.1% in 2005 to 8.9% in 2013. Population and economic growth contribute to driving the steady increase in Brazil’s demand for energy. By 2025, the country will have to nearly double its power supply capacity to meet demand.
Brazil is well placed as a global energy powerhouse and could act as a global leader on energy policy as well. Brazil is the 8th largest total energy consumer and 10th largest producer in the world.1 Brazil is has a highly diversified energy mix and is nearly energetically self-sufficient. BP forecasts that by 2035 Brazilian energy production will rise by 115% while consumption grows by only 72%. The world's largest oil discoveries in recent years have come from Brazil's offshore, pre-salt basins. The country has the second-largest reserves of natural gas in South America. It is expected to produce 4.0 million bbl/d of crude oil by 2020-22 and export 1.5-2.0 million bbl/d by 2022, sustained by the pre-salt oil fields.2 In addition, Brazil has the largest coal reserves in Central and South America and the 6th largest uranium reserves. It has the third-largest electricity sector in the Americas, behind the United States and Canada and is planning new hydroelectric power projects to meet growing demand for electricity. For the second consecutive year, parts of Brazil experienced drought conditions, resulting in declining hydro generation in 2013. The share of hydroelectricity in total power generation fell to 69%, from 75% in 2012 and 81% in 2011. As we will see, Brazil no longer has traditional energy access issues. However, power outages are becoming a concern due to transmission and distribution constraints as well as low water levels for hydro generation.
Post 2015 targets – The Brazilian context
With regards to the Post 2015-recommendation on Energy, many lessons can be extracted from Brazil’s
progressive approach to energy policy. Here the targets assessed within Galiana & Sopinka (2014) are
discussed in the Brazilian context. This section examines the relevance of the proposed targets to Brazil
and offers modifications where appropriate.
1 http://www.eia.gov/countries/country-data.cfm?fips=BR 2 Platts, "Brazil to Export Up to 2 million b/d by 2018-2020: ANP," (September 15, 2014), http://www.platts.com/latest-news/oil/riodejaneiro/brazil-to-export-up-to-2-million-bd-by-2018-2020-21231640.

4
A primary target in POST 2015 millennium development goals is ensuring universal energy access, both in
terms of electricity and modern cooking fuels. Here, Brazil can provide lessons as an example for
countries struggling with energy access issues. The program ‘Luz para todos’ increased electricity access
from ~71% to 98% from 2000-2010 and current World Bank data suggests access is now at 99%. Luz para
Tudos, loosely translated as Electricity for All, was implemented in 2003. This program was set up to
provide free energy to low-income consumers, and to residential consumers with consumption less than
80kW/month (Coelho and Goldenberg 2013). The cost was initially estimated at 7billion USD with a target
of 100% electrification by 2008. The program was re-launched in 2011 focusing on mini-grids and isolated
systems to target the most remote consumers. Ultimately the program is thought to have benefited ~15
million people at a cost of ~7billion$, just over 450$ per person currently using the system. The benefits
are extremely likely to be significantly higher given the long-term benefits to future generations. The
program, initially developed for poverty alleviation, will need to be re-evaluated as these new consumers’
energy demand increases and thus improvements in energy efficiency, increasing the share of renewables
and new energy technologies will be needed. Brazil is a particular case in which 100% electrification seems
to have been cost effective and worthwhile. The Brazilian Ministry of Mines and Energy estimates that
the benefits in terms of quality of life, access to health care and education were significant. 3 In the case
of modern cooking fuels, the consumption of wood fuel declined by an average of 2.9% per annum since
1970. In large part due to economic development and migration to cities but also thanks to a
governmental program to subsidize LPG, a cooking fuel to replace the use of wood. Currently over 95%
of the population has access to modern cooking fuels.
Double the rate of energy efficiency improvement - Brazil
The most economical and greenest energy source, energy efficiency, has a central role in Brazil’s energy
future. The target as stated above makes sense globally where energy efficiency has been improving at
about 1% per annum but not so for Brazil. While Brazil has a very low energy-intensity, its rate of
improvement had stagnated, increasing by 0.2% since the year 2000. Notwithstanding Brazil’s low
absolute energy-intensity, well below the global average and closer to OECD countries than BRICS, there
is still need and room for improvement (figure 1). Brazil is currently (2013) ranked 21st globally in terms
of energy efficiency with the most efficient countries (Colombia, the UK, Spain, Italy) having close to
double the level of efficiency. In order to achieve the current level of efficiency of the European Union
(putting it within the top 10 in the world), Brazil will need to improve efficiency by 1.1% per annum. Since
the year 2000, Brazil has had the 8th lowest rate of efficiency improvement globally and one of only eight
to see a decrease in energy efficiency (Enerdata 2014).
3 https://www.mme.gov.br/luzparatodos/Asp/o_programa.asp

5
Recent trends away from hydropower and
towards thermal power as well as an increasing
demand for air conditioning have contributed to
the recent rise in energy intensity. Brazil faces
three main challenges associated with its
electricity network. First, it is old and strained
electricity network, resulting significant losses.
For the past two decades, in addition to
technical losses and energy theft, electricity
transmission and distribution losses have been
quite high, at ~17 per cent (IEA 2013c). Second,
Brazil will need to expand the grid and capacity
to meet future demand (WEC 2012.) In 2011,
losses totalled 88 TWh. (World Bank 2013).
These challenges can also be seen as
opportunities to develop smart grid capabilities
and reduce inefficiencies, losses and theft.
Brazil has a number of polices and institutions that target energy efficiency. The Plano Nacional de Energia
2030 (PNE) and the Plano Decenal de Expansão de Energia 2023 (PDE) both developed by the ministry of
Mines and Energy have targets for energy efficiency built in. The PNE provides over 200 pages of detailed
analyses of the potential costs and benefits of efficiency improvements of various technologies. A policy
goal included in the PDE is to maintain the carbon intensity of the economy (measured in emissions/GNP)
below 2005 levels, which given rising use of fossil fuels and will require large improvements in energy
efficiency. In 2011, the Ministry of Mines and Energy published the National Energy Efficiency Plan, Plano
Nacional de Eficiencia Energetica: Premissas e Diretrizes Basicas, PNEf, which stipulates a 10% reduction
in electricity consumption in 2030 compared to business as usual consumption. According to Abesco, the
Brazilian energy service companies’ association, efficiency measures by consumers alone could result in a
10 per cent reduction in consumption and R$11.5bn (US$5.2bn) in savings (Ordonez 2014).
Increasing the efficiency of energy use would save consumers and businesses money and reduce the risk
of new energy shortages (Geller et al 2004). Some of the measures needed to improve energy efficiency
are directly cost-saving with huge benefit-cost ratios. Examples of these include, labelling, building
efficiency, vehicle fleet efficiency, building codes for new buildings, performance standards for major
appliances, use of best available technologies and efficiency improvements in industry, and vehicle fuel
economy standards and labelling.. In the case of Brazil, some of the most significant improvements will
come from reducing losses on the grid including electricity theft and oil saved in the transport, buildings,
and industrial sectors.
The IEA’s World Energy Outlook 2006 estimates that an investment of US$3.2 trillion will be required
worldwide to double the rate of energy efficiency improvement. These efficiency investments avoid new
supply investments of US$3 trillion worldwide, and result in a net incremental investment of US$200
billion worldwide. These relatively small net efficiency investments generate significant additional
benefits in improved business productivity and reduced consumer energy bills worth approximately
0.100
0.120
0.140
0.160
0.180
0.200
0.220
0.240
0.260
19
91
19
93
19
95
19
97
19
99
20
01
20
03
20
05
20
07
20
09
20
11
Energy intensity of GDP at constant purchasing power
parities (koe/$2005p)
Brazil World
Figure 1: Energy Intensity (source: IEa 2015)
6
US$500 billion annually by 2030. According to the IEA, investments of ~US$360 billion in energy efficient
technology will be needed and lifetime savings in energy costs are estimated to be more than US$900
billion (IEA 2006). This is expected generate capital expenditure savings of save more than US$270 billion
worldwide along with fuel savings of almost US$0.001 per kWh that would offset the capital cost in only
four years (MIT, 2007). The imposition of efficiency standards for coal-and oil and gas fired plants would
reduce projected CO2 emissions in 2030 by 5 billion tonnes per year (Moss, Chandler et al. 2007).
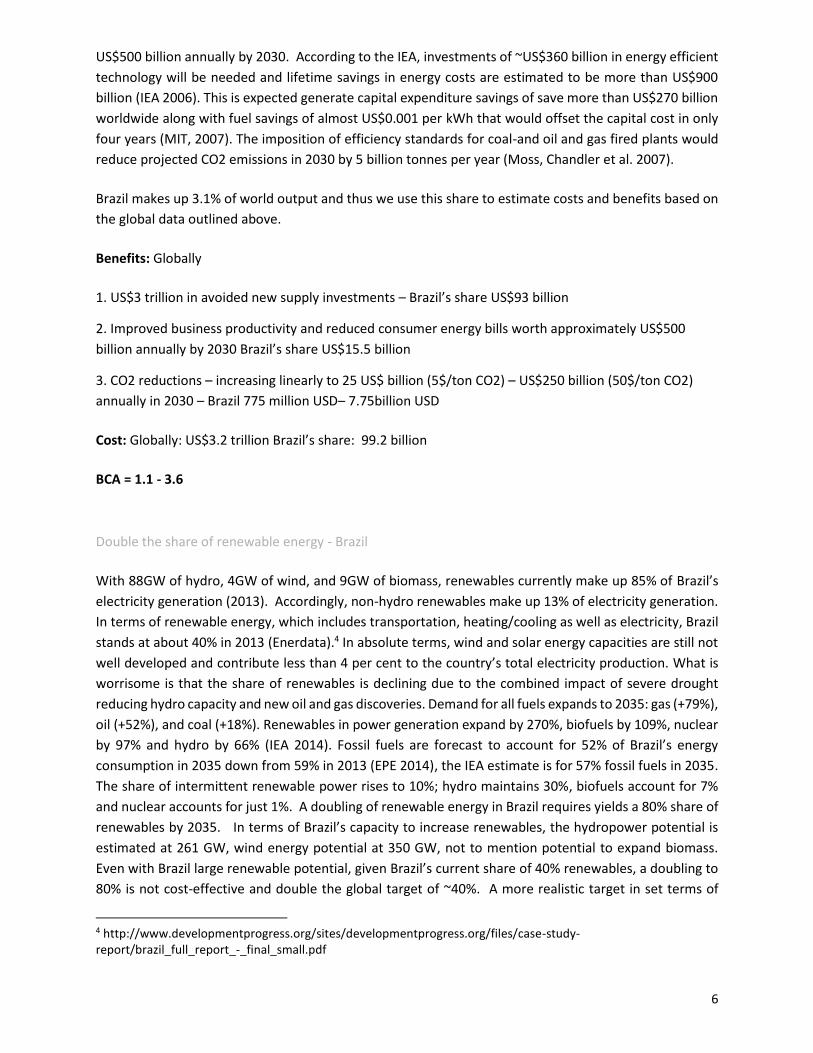
Brazil makes up 3.1% of world output and thus we use this share to estimate costs and benefits based on
the global data outlined above.
Benefits: Globally
1. US$3 trillion in avoided new supply investments – Brazil’s share US$93 billion
2. Improved business productivity and reduced consumer energy bills worth approximately US$500
billion annually by 2030 Brazil’s share US$15.5 billion
3. CO2 reductions – increasing linearly to 25 US$ billion (5$/ton CO2) – US$250 billion (50$/ton CO2)
annually in 2030 – Brazil 775 million USD– 7.75billion USD
Cost: Globally: US$3.2 trillion Brazil’s share: 99.2 billion
BCA = 1.1 - 3.6
Double the share of renewable energy - Brazil
With 88GW of hydro, 4GW of wind, and 9GW of biomass, renewables currently make up 85% of Brazil’s
electricity generation (2013). Accordingly, non-hydro renewables make up 13% of electricity generation.
In terms of renewable energy, which includes transportation, heating/cooling as well as electricity, Brazil
stands at about 40% in 2013 (Enerdata).4 In absolute terms, wind and solar energy capacities are still not
well developed and contribute less than 4 per cent to the country’s total electricity production. What is
worrisome is that the share of renewables is declining due to the combined impact of severe drought
reducing hydro capacity and new oil and gas discoveries. Demand for all fuels expands to 2035: gas (+79%),
oil (+52%), and coal (+18%). Renewables in power generation expand by 270%, biofuels by 109%, nuclear
by 97% and hydro by 66% (IEA 2014). Fossil fuels are forecast to account for 52% of Brazil’s energy
consumption in 2035 down from 59% in 2013 (EPE 2014), the IEA estimate is for 57% fossil fuels in 2035.
The share of intermittent renewable power rises to 10%; hydro maintains 30%, biofuels account for 7%
and nuclear accounts for just 1%. A doubling of renewable energy in Brazil requires yields a 80% share of
renewables by 2035. In terms of Brazil’s capacity to increase renewables, the hydropower potential is
estimated at 261 GW, wind energy potential at 350 GW, not to mention potential to expand biomass.
Even with Brazil large renewable potential, given Brazil’s current share of 40% renewables, a doubling to
80% is not cost-effective and double the global target of ~40%. A more realistic target in set terms of
4 http://www.developmentprogress.org/sites/developmentprogress.org/files/case-study-report/brazil_full_report_-_final_small.pdf

7
fossil fuels use and allows for greater nuclear is to ‘reduce the share of fossil fuels by 2035 to 40%’ from
the forecast 52-57%. This is a quite ambitious target but given Brazil’s renewable energy potential,
combined with a push to electric or ethanol vehicles and energy efficiency improvements is cost effective.
An important consideration is the current impact of climate variability on hydropower. The current long
lasting drought has impacted the hydro capacity (previously 80% of electricity). This may hint at a need
to diversify their energy sources if droughts are expected more frequently. Hydropower is by far the most
economical and environmentally friendly option, at around a third of the cost of sugarcane bagasse and
natural gas, and 35–40 per cent of the cost of nuclear and coal (Carvalho and Sauer 2009), with some
studies estimating an even greater price difference, with large-scale hydropower at R$85/MWh (US$38)
at one extreme and oil-powered thermal power at R$600/MWh (US$270) at the other (Oliveira 2014).
Brazil's hydropower generating facilities are located far from the main demand centers (cities), resulting
in high transmission and distribution losses. However recent droughts have reduced the hydro potential
and have increased use of natural gas. This has had three important effects, fluctuations in the cost of
electricity production, increased the share of fossil fuels in the energy mix and decreased energy efficiency
(thermal plants are less efficient than hydro). Huge market price fluctuations adversely affect the
economy and thus Brazil should consider increasing its share of nuclear and wind to offset these scenarios.
The PNE 203 (BRASIL, 2007), forecasts expansion of the electric grid to include 1) renewable energy –
191,35 GW (92 GW in 2010); 2) Conventional thermal plants – 21,5 GW (16 GW in 2010); e, 3) Nuclear –
8GW (2 GW in 2010). In December 2014 the ministry of mines and energy approved the PDE (Plano
Decenal de Expansão de Energia 2023) (PDE 2023), that sets investments of 1,3 trillionR$ in the in order
to guarantee energy access5. Installed capacity is set to increase from 124.8GW to 195.9 GW.
5 http://www.epe.gov.br/Estudos/Paginas/Plano%20Decenal%20de%20Energia%20–%20PDE/MMEaprovaPDE2023.aspx

8
The estimates for the share of fossil fuels in 2035 are 55% of the 480 Mtoe (5580TWh) total primary energy
consumption forecast up from the 267Mtoe in 2013 (Enerdata). Reducing this share to 40% implies an
increase of 72 Mtoe (837 TWh) in non-fossil energy consumption from business as usual (BAU)
projections. Currently, 11Mtoe (128TWh) are fossil fuel energy in electricity consumption, expected to
rise to 32Mtoe (372 TWh). Fossil fuels in the transport sector are at 61Mtoes (709TWh), forecast to
increase to 96 Mtoes (1 116TWh), and industrial consumption of fossil fuels is forecast to double to
59Mtoes.
The cost-benefit analysis is undertaken on the modified target: ‘reduce the share of fossil fuels by 2035
to 40%. We will consider reducing the share of fossil fuels in the electricity sector by 244TWh (21 Mtoe),
the entire planned expansion, and the transport sectors, by 51 Mtoe. The production increases assigned
in Table 1 in non-fossil shares are well below the estimated potential production for each energy source.
Population growth in Brazil is quite low and so the majority of the increased demand for transport energy
comes from increased wealth. Preemptive investment in well-functioning public transport, railways,
electric vehicle infrastructure and ethanol expansion are ways in which fossil energy could be excluded
from transportation. This requires a significant reduction in oil consumption from forecast levels. Despite
the relatively popularity of flex-fuel vehicles in Brazil, ethanol use is currently disadvantaged due to the
government-imposed cap on domestic oil prices. In fact, as a result of artificially low oil prices, ethanol
use has decreased, and Petrobras has been forced to import gasoline to cover the growing demand
(Laporta 2013; IEA 2013). Brazil’s currently produces ethanol on 1% of its territory and studies show 7.6%
is suitable. The elimination of these fuel subsidies (price ceilings) would encourage a natural expansion
Table 1: IEA 2011 IEA 2035 40% non-fossil
target ∆ from
BAU Total primary energy demand (TPED,
Mtoe) 267 480 480 0
– TPED of oil/natural gas/coal (Mtoe) 109/23/15 165/77/24 100/77/15 -65/0/9
– TPED of bioenergy (Mtoe) 78 138 160 +22
– TPED of hydropower (Mtoe) 37 58 75 +17
– TPED of other clean energy (incl.
nuclear, wind, Mtoe) 5 19 53 +34
Total final consumption of fossil energy (Mtoe) by sector
– Consumption of fossil fuels in transport
(Mtoe) 61 96 45 -51
– Consumption of fossil fuels in industry
(excl. electricity, Mtoe) 30 59 50 -9
– Use of fossil fuels in electricity
generation (Mtoe) 11 32 11 -21
Share of non-fossil of energy supply 55% 55% 40% -15%

9
of ethanol and easily allow for the additional 16Mtoe saved. Moreover, by expanding biofuel production,
large quantities of oil would be available for export generating significant revenues. Natural gas is
recommended to increase as projected as local consumption is though to be more economical a option
than export. There do not appear to be any significant costs associated with this policy.
With respect to the electricity sector, the benefits of increasing the share of non-fossil energy are estimated as the avoided climate impacts and air pollution as well as increased energy security, balance of payments and net job creation and the levelized cost of the fossil fuel not utilized. Air pollution costs and climate change costs are based the RFF report “The true cost of Electric Power”6. It is expected however that these external costs would rise with increased future fossil consumption and thus the benefit cost ratios provide are lower bounds. Balance of payments and net job creation also come from the IADB report on renewables in Latin America. There has recently been some concern about the ability to integrate large quantities of renewables and maintaining the stability and reliability of the electric grid due to the intermittency of wind and solar. Brazil is uniquely positioned in this respect. First, given its privileged geography, wind blows quite constantly near coastal densely populated areas. Second, the share of intermittent renewables would remain quite low (likely <15%) of electricity production with the rest of the increased non-fossil share coming from base load hydro, nuclear and biomass. The costs are the addition cost of electricity production based on current levelized costs of production. Levelized costs in Brazil for various energy sources: Nuclear 90 USD/MWh; coal 123 USD/MWh; gas fired plant 65 USD/MWh; large hydro 60 USD/MWh ; biomass 110 USD/MWh; wind 70 USD/MWh.
Results indicate that the aggregated value of societal benefits of non-fossil fuels over fossil fuels are from US$19/MWh to US$92/MWh. Thus in the case of the electricity sector, if the 244 TWh of capacity expansion expected to be undertaken with fossil fuels were to be undertaken instead with non-fossil sources we could expect a benefit/cost ratio of:
Benefits = 127 to 219 USD per MWh (incudes cost of fossil electricity not incurred, and the social costs not incurred)
Costs = 82.5 USD per MWh using an average mix for non-fossil fuels: wind, hydro, biomass and nuclear equally weighted. 80 USD/MWh, if using only wind and nuclear (this is feasible given domestic potential). Though hydro is less costly, it has political limitation particularly given the current drought situation.
BCR = 1.54 – 2.74
Double investment in R&D in energy technologies
Brazil has a large and diverse economy, a large population with a tertiary education and experience in
high tech industries. High-tech exports already make up 10% of manufacturing exports in Brazil. All of
these qualities make managing and undertaking a sustained R&D effort in energy technologies possible
an interesting from a developmental perspective. For example, Brazil’s development of ethanol has
resulted in the development of ‘flex-fuel’ car engines that can use both petrol and bio-fuel though
sustained leadership, responsive regulation, public and private investment in research and technology.7
Public investment in research is well known to have been instrumental to improving yields in the early
6 http://www.ren21.net/Portals/0/documents/Resources/RFF-Rpt-BurtrawKrupnick.TrueCosts_Summary_web.pdf 7http://www.developmentprogress.org/sites/developmentprogress.org/files/case-study-report/brazil_full_report_-_final_small.pdf

10
stages of the ethanol’s development. R&D in ethanol in now dominated by private firms thanks to early
government-supported investment. Brazilian R&D expenditure per capita are more than ten times
smaller than the US per capita expenditure and five times less than South Korea (Jannuzzi 2005). It has
been shown that an important positive influencing factor in energy efficiency is energy technology R&D
(Cui 2014).
Moreover, given the wide range of energy sources available in Brazil, it is an ideal ground for testing and
demonstration of new technologies. For example, CCS in the pre-salt oil fields, integration of large
amounts of renewables, and more basic research in storage and biofuels. Estimating the potential costs
and benefits of a broad R&D programme is an incredibly difficult task but it is clear that increasing efforts
in existing programmes and pushing new areas could be extremely beneficial to the Brazilian economy.
Conclusion
Brazil is an energy powerhouse in terms of its hydro resources, fuel reserves (oil, gas, coal) and also its
potential for renewable energy integration. Rapid economic growth has driven energy demand in recent
years although the current economic situation is reducing investment incentives. Nonetheless, Brazil is
uniquely placed to lead on energy policy. In the wake of Brazil’s success in providing energy access, it
should turn its attention to energy efficiency improvements, integrating large shares of renewables and
developing a strong research, development and demonstration program. It is important to note that there
are strong synergies between these objectives. Integrating renewables at a large scale will require
developing, testing and demonstrating a much smarter electric grid. A modernized grid is an important
component of reducing losses and thus improving energy efficiency. And lastly the transportation sector
will be critical to achieving both the efficiency and renewable energy targets.
Target Benefit-Cost Revised target Comments
Double the rate of
energy efficiency
improvement
1.1 – 3.6
Improve global energy
efficiency ranking from
current 21st to top ten in
the world.
As an emerging economy,
Brazil has significant
inefficiencies, particularly
in the electricity sector.
Double the share of
renewable energy 1.54 – 2.74
Reduce the share of
fossil fuels to 20%
Brazil already has very high
levels of renewables
(mainly hydro)
Double investment
in R&D in energy
technologies
Uncertain No revision necessary
Brazil has all the
characteristics necessary
to implement a successful
RD&D program
11
References http://www.reegle.info/policy-and-regulatory-overviews/BR
http://www.forbes.com/sites/statoil/2015/01/21/ensuring-access-to-energy-in-developing-countries-2/
http://energy-access.gnesd.org/cases/32-energy-access-program-in-brazil-lighting-for-all.html
http://www.iprofesional.com/notas/208758-Brasil-importar-electricidad-desde-Argentina-y-Uruguay-
este-ao?page_y=161
http://www.rtcc.org/2015/02/16/brazil-faces-water-rationing-amid-worst-drought-in-84-years/
Calili, Rodrigo F., et al. "Estimating the cost savings and avoided CO 2 emissions in Brazil by
implementing energy efficient policies." Energy Policy 67 (2014): 4-15.
Carvalho, Joaquim F. de, and Ildo L. Sauer. 2009. ‘Does Brazil need new nuclear power plants?’. Energy
Policy 37:1580–4.
Cui, Qiang, et al. "The changing trend and influencing factors of energy efficiency: The case of nine
countries." Energy 64 (2014): 1026-1034.
EPE. Empresa de Pesquisa Energetica. 2007. Plano Nacional de Energia 2030. Brasilia: Ministerio de
Minas e Energia, Secretaria de Planejamento e Desenvolvimento Energetico, November.
EPE. 2013. Plano Decenal de Expansao de Energia 2022. Brasilia: Ministerio de Minas e Energia,
Secretaria de Planejamento e Desenvolvimento Energetico.
EPE 2013. Anuario Estatistico de Energia Eletrica 2013. Rio de Janeiro: Ministerio de Minas e Energia.
EPE 2013. Balanco Energetico Nacional 2013. Relatorio Sintese. Ano Base 2012. Rio de Janeiro:
Ministerio de Minas e Energia.
Geller, Howard, Roberto Schaeffer, Alexandre Szklo, and Mauricio Tolmasquim. 2004. ‘Policies for
Advancing Energy Efficiency and Renewable Energy Use in Brazil’. Energy Policy 32: 1437–50.
Ordonez, Ramona. 2014. ‘Setor energetico polui 30% mais e gera 'meia Itaipu' de desperdicio por ano’.
O Globo. 26 January.
Richardson, David B. "Electric vehicles and the electric grid: A review of modeling approaches, Impacts,
and renewable energy integration." Renewable and Sustainable Energy Reviews 19 (2013): 247-254.
Suani T. Coelho, José Goldemberg, Energy access: Lessons learned in Brazil and perspectives for
replication in other developing countries, Energy Policy, Volume 61, October 2013

Post-2015 Development
GoalsEnergia no Brasil
Isabel Galiana
Estado Atual das Coisas
O Brasil é reconhecido internacionalmente
por sua mistura de energia limpa, incluindo
a hídrica, eólica e etanol,
Com a descoberta recente e extração
acelerada de suas grandes reservas de
petróleo, o quadro está mudando.
A extração vai continuar mas a escolha e:
será para consumo domestico?
ou para exportação?
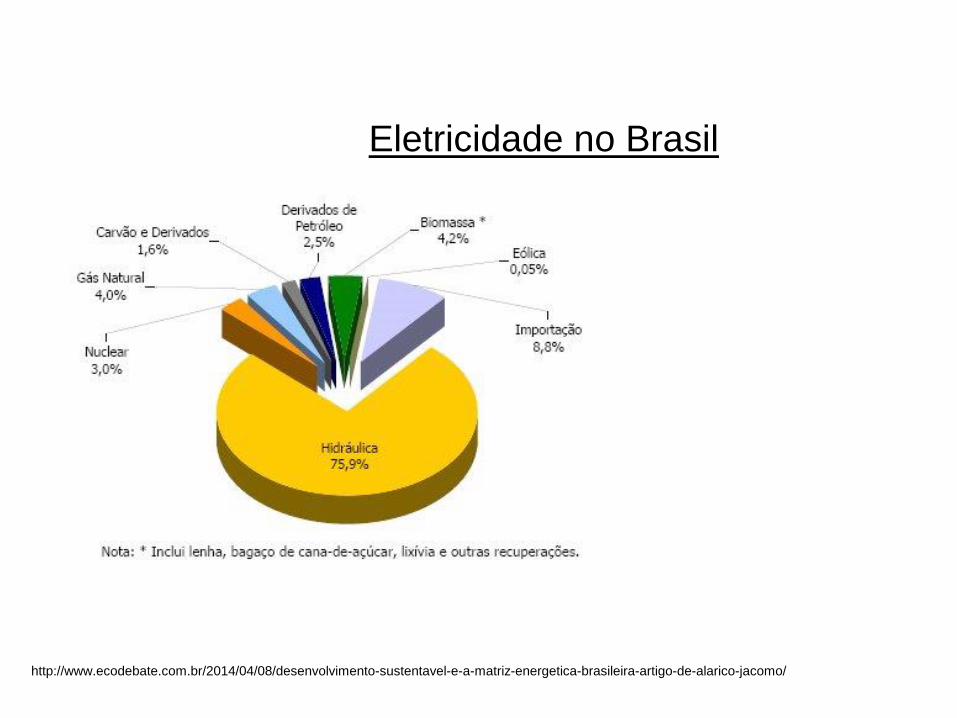
Eletricidade no Brasil
http://www.ecodebate.com.br/2014/04/08/desenvolvimento-sustentavel-e-a-matriz-energetica-brasileira-artigo-de-alarico-jacomo/
Eficiência energética
O Brasil tem um nível de eficiência muito bom com respeito ao resto do mundo mas tem muitas perdidas associadas e muito potencial para melhorar.
A eficiência energética do Brasil empioro nos últimos anos.
Perdidas na rede elétrica são de ~17% - o equivalente de 88TWh
Uma melhoria de 1%/ano levaria o Brasil entre os melhores 10 países do mundo em términos de eficiência energética além de custar só R$ 1 para cada R$ 2 de beneficio.

Energia renovável et não-fósseis
O Brasil tem uma potencialidade energética muito grande portanto, a utilização desses recursos requer investimento consideráveis no tratamento e redes de distribuição.
O Brasil possui a matriz energética mais renovável do mundo industrializado. 42% da energia produzida é proveniente de fontes como recursos hídricos, biomassa e etanol, além da energia eólica.
As usinas hidrelétricas são responsáveis pela geração de mais de 75% da eletricidade do pais.
O uso da expressão não-fosseis em vês de renovável, permite a inclusão de nuclear na mistura energética limpa.
Benefícios de energia não-fósseis
ambientais – polução atmosférica, emissões
de CO2
saúde -- polução atmosférica causa
enfermidades respiratórias et ate mortes
emprego – um sector industrial renovável
tem o potencial de gerar muitos empregos
em investigação, fabricação, instalação e
manutenção.
aumentar a exportação de recursos fósseis
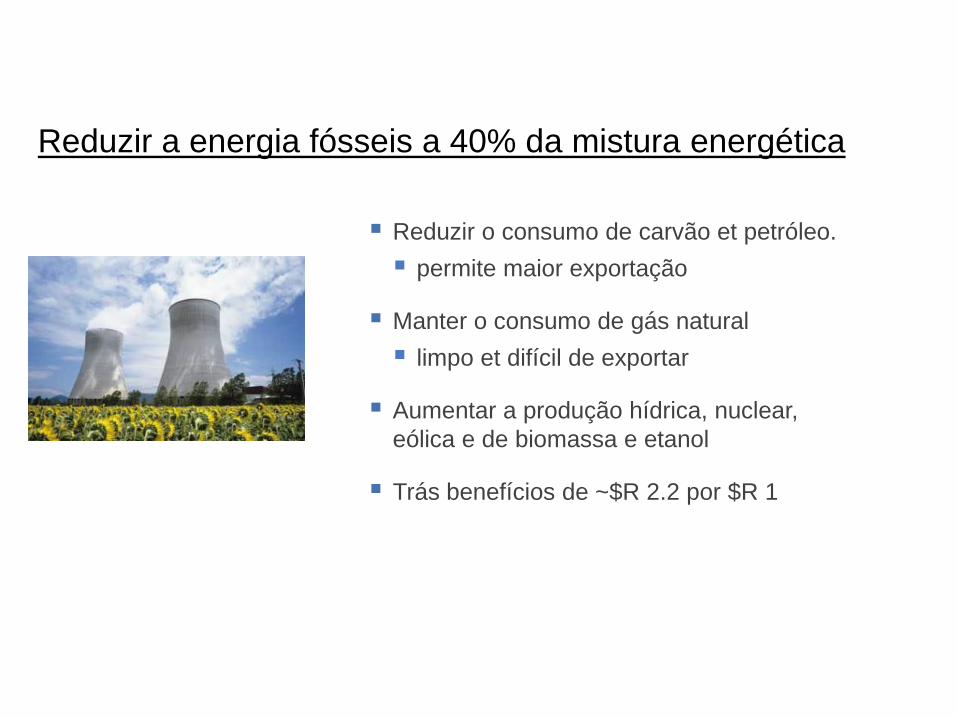
Reduzir a energia fósseis a 40% da mistura energética
Reduzir o consumo de carvão et petróleo.
permite maior exportação
Manter o consumo de gás natural
limpo et difícil de exportar
Aumentar a produção hídrica, nuclear,
eólica e de biomassa e etanol
Trás benefícios de ~$R 2.2 por $R 1
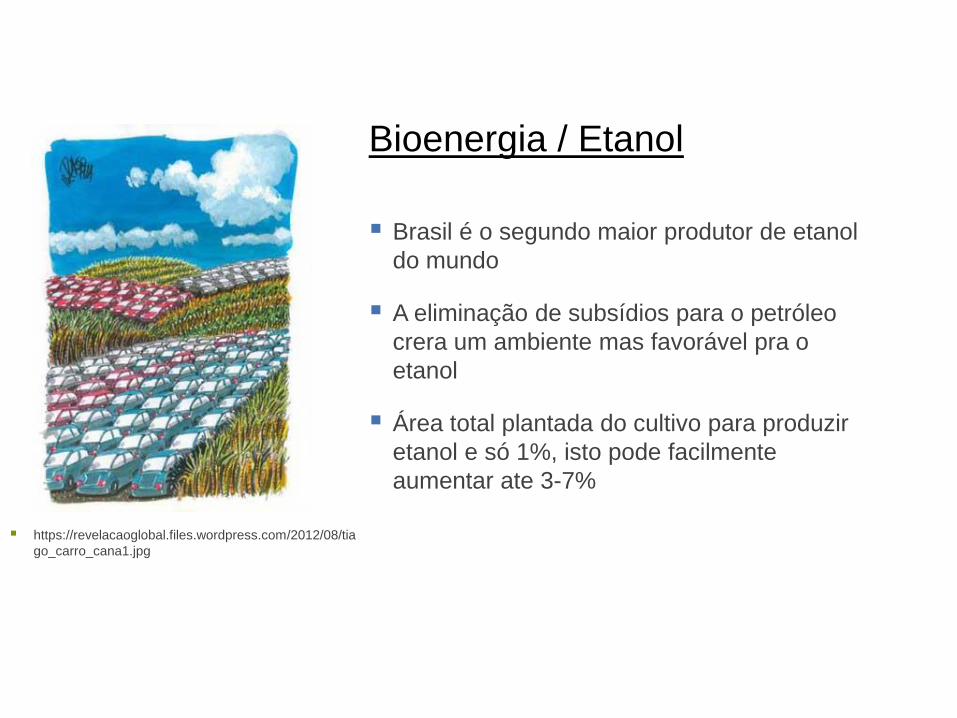
Bioenergia / Etanol
Brasil é o segundo maior produtor de etanol
do mundo
A eliminação de subsídios para o petróleo
crera um ambiente mas favorável pra o
etanol
Área total plantada do cultivo para produzir
etanol e só 1%, isto pode facilmente
aumentar ate 3-7%
https://revelacaoglobal.files.wordpress.com/2012/08/tia
go_carro_cana1.jpg

Energia hidrelétrica
O Brasil produz 70-80% da eletricidade com
recursos hídricos
Só 1/3 do potencial é desarrolhado
A proposição é de aumentar de 17mtoe do
previsto em 2035

Nuclear
O Brasil tem 1/6 das reservas globais de uranio
Hoje só produz 3% da eletricidade brasileira
Existem 2 centrais e uma em construção
A proposição é de aumentar o nuclear de 3.3 mtoe hoje a 20 mtoes (232TWh)
O Plano Nacional de Energia 2030 – PNE 2030 pede 5,345 megawatts (MW) a mais 2030
Isto e aproximadamente 5 centrais com capacidade total de 33 000 MW
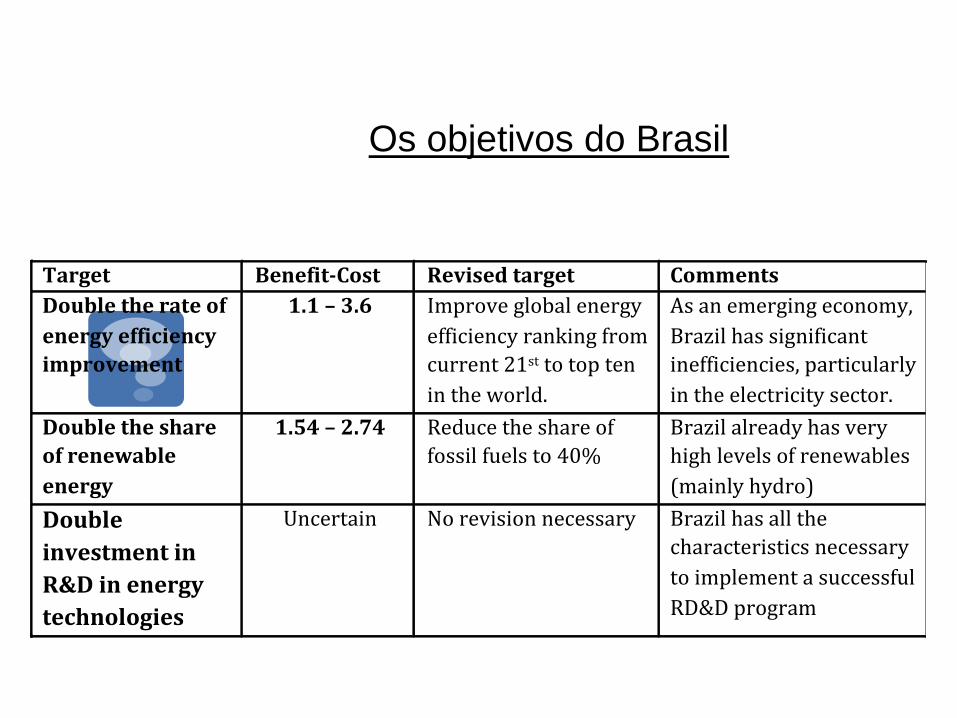
Os objetivos do Brasil
Target Benefit-Cost Revisedtarget Comments
Doubletherateof
energyefficiency
improvement
1.1–3.6 Improveglobalenergy
efficiencyrankingfrom
current21sttotopten
intheworld.
Asanemergingeconomy,
Brazilhassignificant
inefficiencies,particularly
intheelectricitysector.
Doubletheshare
ofrenewable
energy
1.54–2.74 Reducetheshareof
fossilfuelsto40%
Brazilalreadyhasvery
highlevelsofrenewables
(mainlyhydro)
Double
investmentin
R&Dinenergy
technologies
Uncertain Norevisionnecessary Brazilhasallthe
characteristicsnecessary
toimplementasuccessful
RD&Dprogram

F U N D A Ç Ã O B R A S I L E I R A P A R A O D E S E N V O L V I M E N T O S U S T E N T Á V E L
05 de maio de 2015
Post-2015 Consensus: Energy

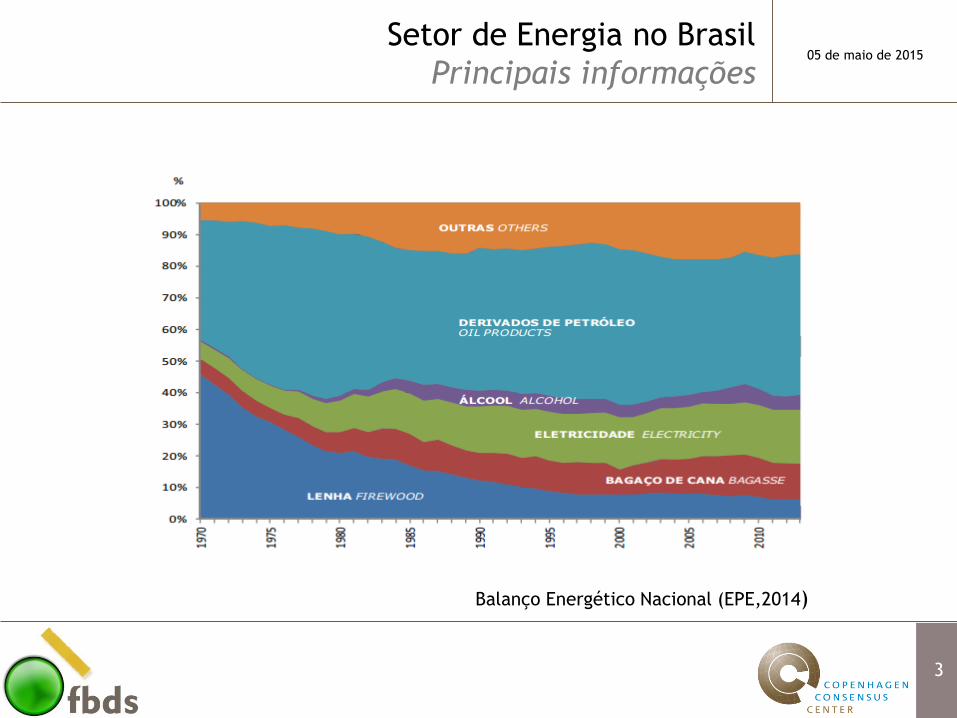
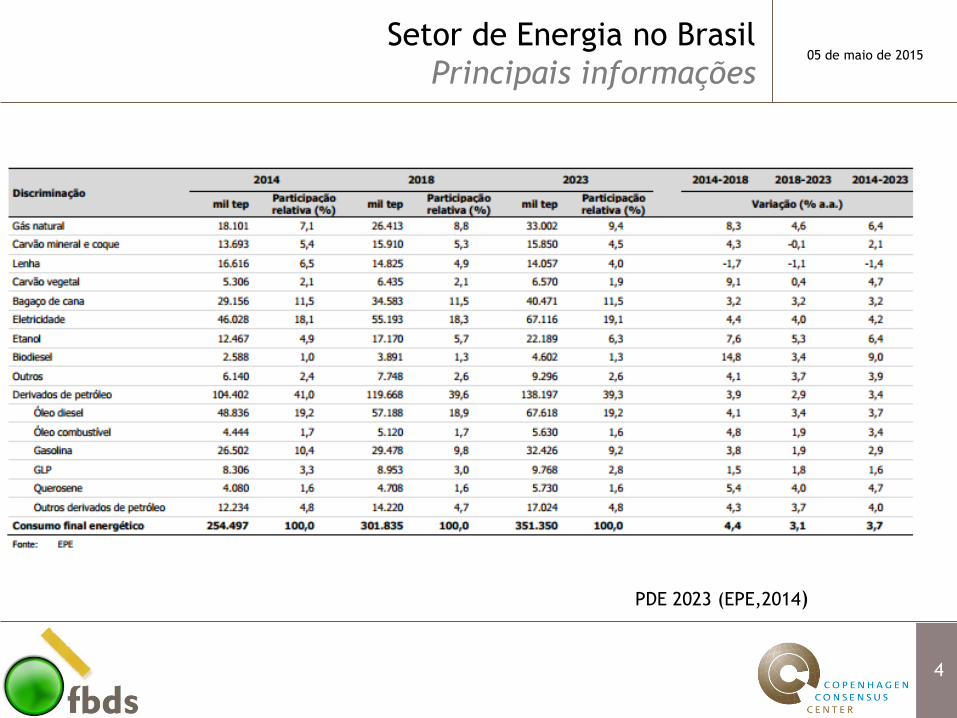
05 de maio de 2015Setor de Energia no Brasil
Principais informações
2
Balanço Energético Nacional (EPE,2014)
05 de maio de 2015Setor de Energia no Brasil
Principais informações
3
Balanço Energético Nacional (EPE,2014)
05 de maio de 2015Setor de Energia no Brasil
Principais informações
4
PDE 2023 (EPE,2014)

05 de maio de 2015Universalização – Eletricidade
Luz para Todos
5

05 de maio de 2015Universalização – Eletricidade
Luz para Todos
● Até 2014:
● 3,1 milhões de ligações (equivalente a 15 milhões de pessoas atendidas)
● Investimentos de R$ 23 milhões desde 2003
● Em 2010, 98,73% dos domicílios cobertos (CENSO 2010)
6
05 de maio de 2015Universalização – Eletricidade
Luz para Todos
DESAFIO
● Financiado pela CDE (Conta de Desenvolvimento Energético)
● A partir de 2015, o governo retirou quase todo o financiamento público da CDE
● Custos de R$ 23 bilhões de reais foram transferidos para os consumidores
● Novas expansões impactam valor da conta de luz
● Haverá apoio?
7

05 de maio de 2015Universalização – Cocção
Lenha
8
Balanço Energético Nacional (EPE,2014)
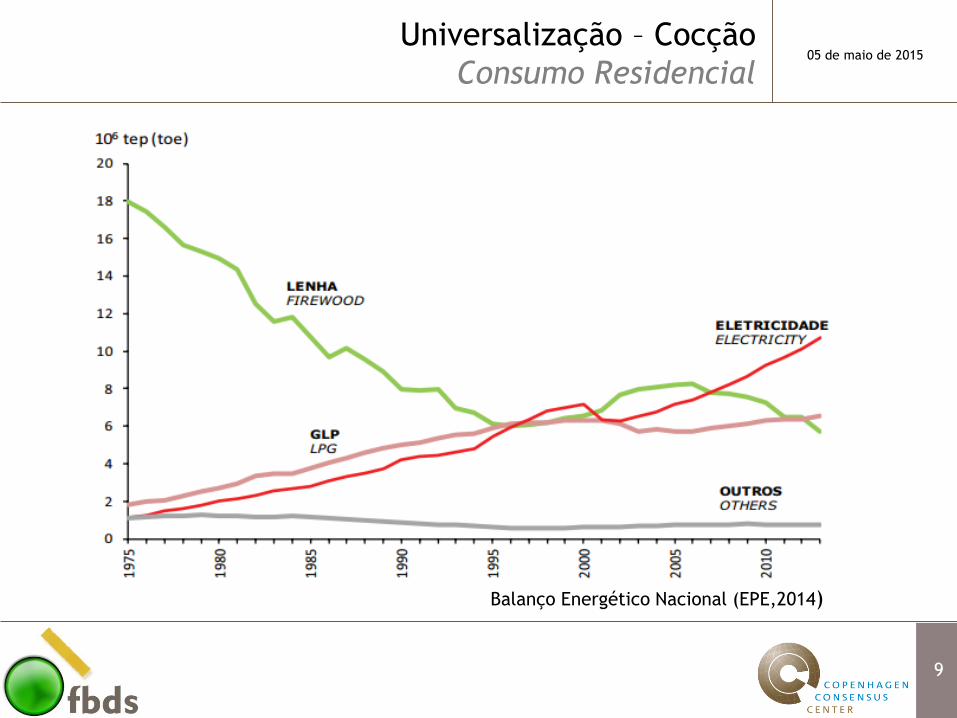
05 de maio de 2015Universalização – Cocção
Consumo Residencial
9
Balanço Energético Nacional (EPE,2014)
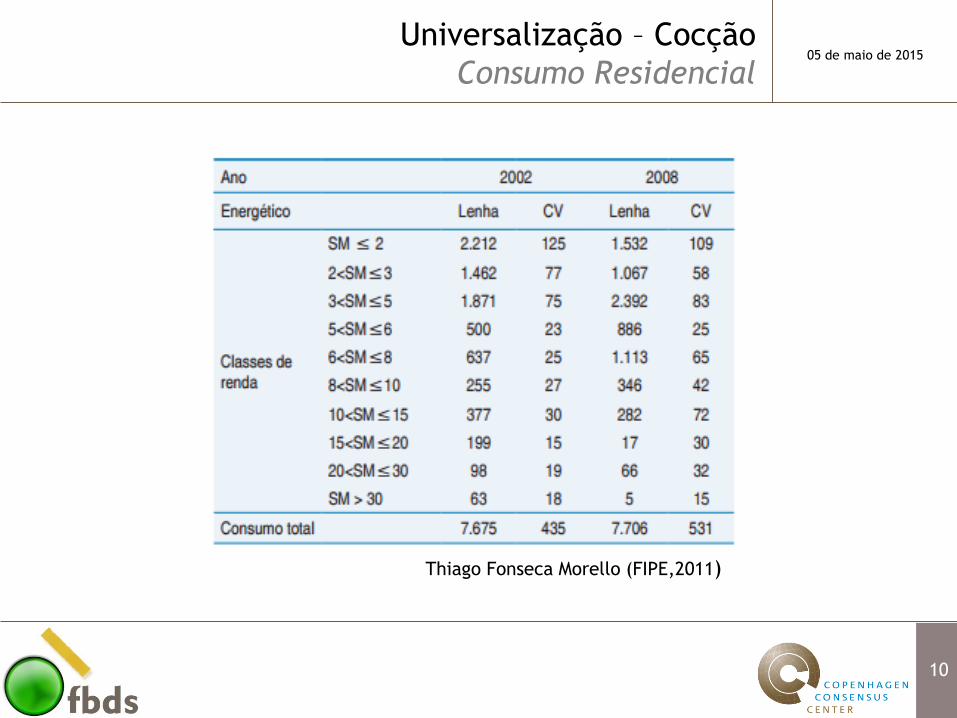
05 de maio de 2015Universalização – Cocção
Consumo Residencial
10
Thiago Fonseca Morello (FIPE,2011)

05 de maio de 2015Eficiência Energética
Indicadores
11
NOTA TÉCNICA DEA 14/10 Avaliação da Eficiência energética na indústria e nas residências (EPE,2010)

05 de maio de 2015Eficiência Energética
Indicadores
12
NOTA TÉCNICA DEA 14/10 Avaliação da Eficiência energética na indústria e nas residências (EPE,2010)
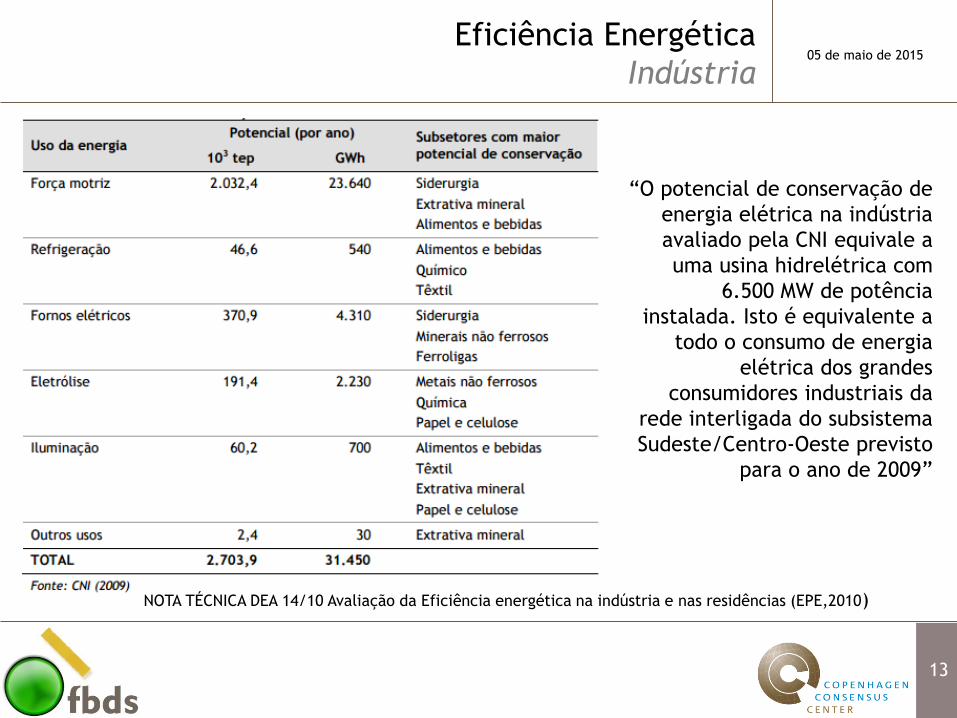
05 de maio de 2015Eficiência Energética
Indústria
13
“O potencial de conservação de
energia elétrica na indústria
avaliado pela CNI equivale a
uma usina hidrelétrica com
6.500 MW de potência
instalada. Isto é equivalente a
todo o consumo de energia
elétrica dos grandes
consumidores industriais da
rede interligada do subsistema
Sudeste/Centro-Oeste previsto
para o ano de 2009”
NOTA TÉCNICA DEA 14/10 Avaliação da Eficiência energética na indústria e nas residências (EPE,2010)

05 de maio de 2015Eficiência Energética
Residências
14
NOTA TÉCNICA DEA 14/10 Avaliação da Eficiência energética na indústria e nas residências (EPE,2010)
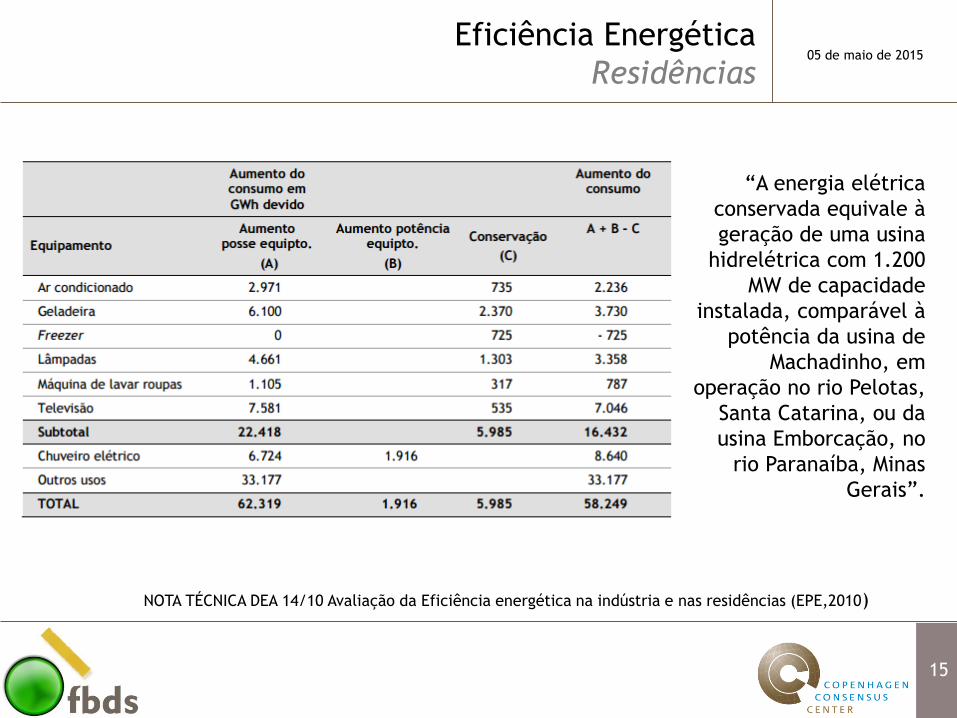
05 de maio de 2015Eficiência Energética
Residências
15
“A energia elétrica
conservada equivale à
geração de uma usina
hidrelétrica com 1.200
MW de capacidade
instalada, comparável à
potência da usina de
Machadinho, em
operação no rio Pelotas,
Santa Catarina, ou da
usina Emborcação, no
rio Paranaíba, Minas
Gerais”.
NOTA TÉCNICA DEA 14/10 Avaliação da Eficiência energética na indústria e nas residências (EPE,2010)

05 de maio de 2015Energias Renováveis
Consumo Residencial
16
● A porcentagem de renováveis na demanda final fica estável no período 2014-
2023 (cerca de 40% do total) – BUSINESS –AS -USUAL
● Na geração elétrica, há uma queda da participação das hidroelétricas, mas que
será compensada pela entrada de outras fontes renováveis
PDE 2023 (EPE,2014)

05 de maio de 2015Energias Renováveis
Consumo Residencial
17
PRINCIPAIS POTENCIAIS
● Geração distribuída fotovoltaica
● Preço da eletricidade no consumo torna a fonte mais competitiva
● Eólica
● Crescimento de 30% na produção e 16,5% na capacidade instalada em um
ano (2012-2013)
● Biomassa
● Usina de cana-de-açúcar têm grande potencial de aumento de eficiência
na geração com uso de caldeiras de alta pressão

05 de maio de 2015Energias Renováveis
Consumo Residencial
18
SOBRE INTERMITÊNCIA
● Reservatórios de hidroelétrica podem fazer o papel de baterias gigantes
● Sazonalidade das fontes são intercaladas
● CSP tem avançado no armazenamento térmico e hibridização com GN

05 de maio de 2015
1
9
Contatos
FBDS- Fundação Brasileira para o Desenvolvimento SustentávelRua Eng. Álvaro Niemeyer, 76 – São Conrado
22610-180 Rio de Janeiro – RJTel: (21) 3322-4520 – Fax: (21) 3322-5903
www.fbds.org.br
Luis Saporta
19