Embed Size (px)
Citation preview
1
Energy Demand and Supply Outlook in China for 2030 and A Northeast Asian Energy Community
- The automobile strategy and nuclear power strategy of China -
Zhidong Li* Kokichi Ito** Ryoichi Komiyama***
1. Introduction China achieved high economic growth by expanding its GDP by 8.8 times during the 24 years up to 2004. On the
other hand, however, it came to face various problems including increased net energy import dependence, domestic environmental
pollution and ecological destruction, cross-border pollution, and a rapid increase in CO2 emissions. The Chinese government plans
to quadruple the 2000 GDP by 2020, but this plan involves a risk of further exacerbating these problems.
Meanwhile, the international community has indicated the following concerns regarding China’s energy problems.
Firstly, as seen in the electric power supply shortage that has been surfacing since 2003, a lack of energy supply could slowdown
the growth of China’s domestic economy—which is positioned as a driving force of the world economy—and could have an
adverse impact on the world economy as a result. Secondly, the rapid increase in oil import and a decline in coal export could
tighten the supply-and-demand balance of the international energy markets and trigger a fierce competition for resources. Lastly,
the rapid increase in fossil energy consumption centering on coal could further worsen air pollution, acid rain pollution, and global
warming, and deteriorate the basis for sustainable development not only in China, but throughout the whole of Northeast Asia or
even the whole world. Therefore, the current challenge for the international community is considered to be to identify the energy
and environmental issues facing China and address these problems.
This paper provides simulation analyses of the Chinese economy, energy, and environment up to 2030 by using
econometric models in order to identify problems and examine countermeasures. It also provides a detailed examination of the
progress of motorization (the increase in the car ownership), which is the major factor behind the growth in China’s oil
demand—a development that is currently drawing much attention in the international oil markets—as well as China’s automobile
strategy. In addition, the paper studies the medium to long-term outlook for nuclear power generation in China, which is expected
to become the largest market of the 21st century. Lastly, it attempts to analyze an ideal comprehensive energy strategy for China
and the possibility of international cooperation under the framework of a “Northeast Asian Energy Community.”
2. Energy security problems and environmental problems 2-1 Downslide to the status of a major net energy importer
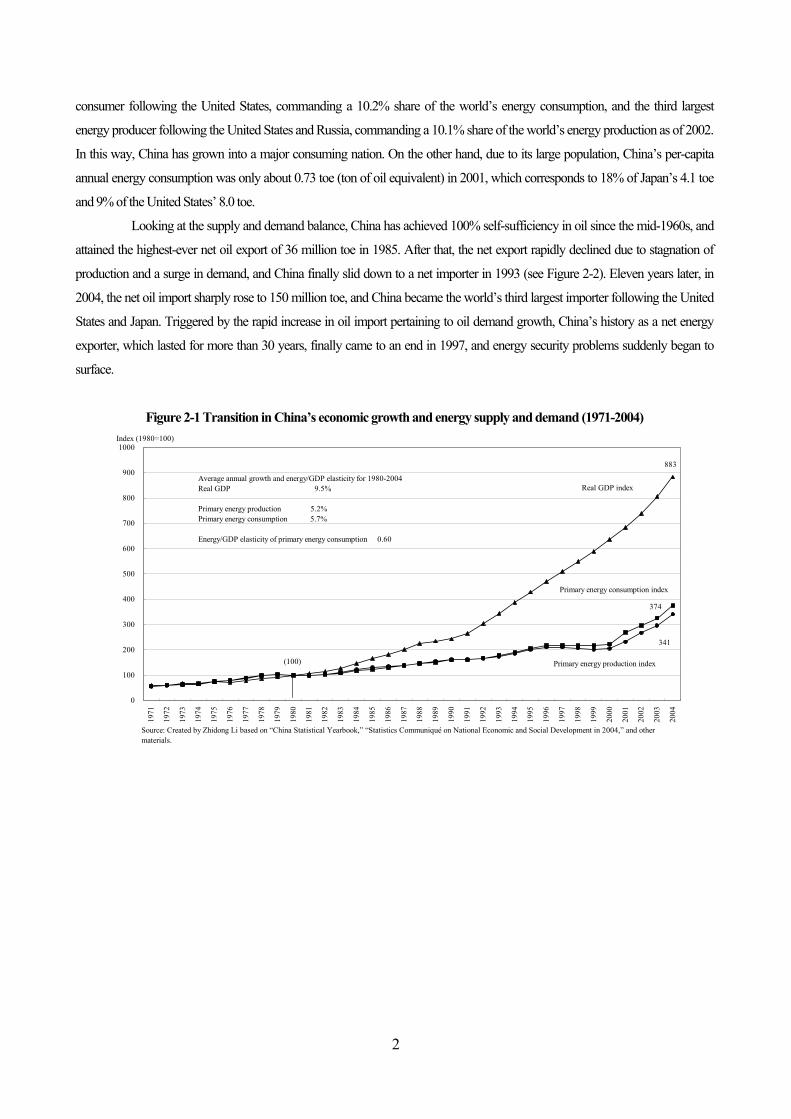
China entered a high economic growth phase around the end of the 1970s, and compared to the 1980 level, its real
GDP expanded by 8.8 times in 2004 with the average annual economic growth rate reaching 9.5% (see Figure 2-1). In contrast,
the growth of energy demand was far slower than the GDP growth due to the penetration of energy conservation, but still, the
amount of demand was 3.7 times the 1980 level and the average annual growth rate was 5.7%. Considering that the world’s total
energy demand only increased by 1.4 times from 1980 to 2001 with the average annual growth rate of 1.6%, the energy demand
growth in China is extremely high. Consequently, as Table 2-1 shows, China has become the world’s second largest energy
* Visiting Researcher, the Institute of Energy Economics, Japan (IEEJ); Associate Professor, Nagaoka University of Technology ** Managing Director, Charge of Energy Data and Modelling Center (EDMC) and Energy Strategy Unit, IEEJ. *** Researcher, Energy Data and Modelling Center (EDMC) and Energy Strategy Unit, IEEJ.
2
consumer following the United States, commanding a 10.2% share of the world’s energy consumption, and the third largest
energy producer following the United States and Russia, commanding a 10.1% share of the world’s energy production as of 2002.
In this way, China has grown into a major consuming nation. On the other hand, due to its large population, China’s per-capita
annual energy consumption was only about 0.73 toe (ton of oil equivalent) in 2001, which corresponds to 18% of Japan’s 4.1 toe
and 9% of the United States’ 8.0 toe.
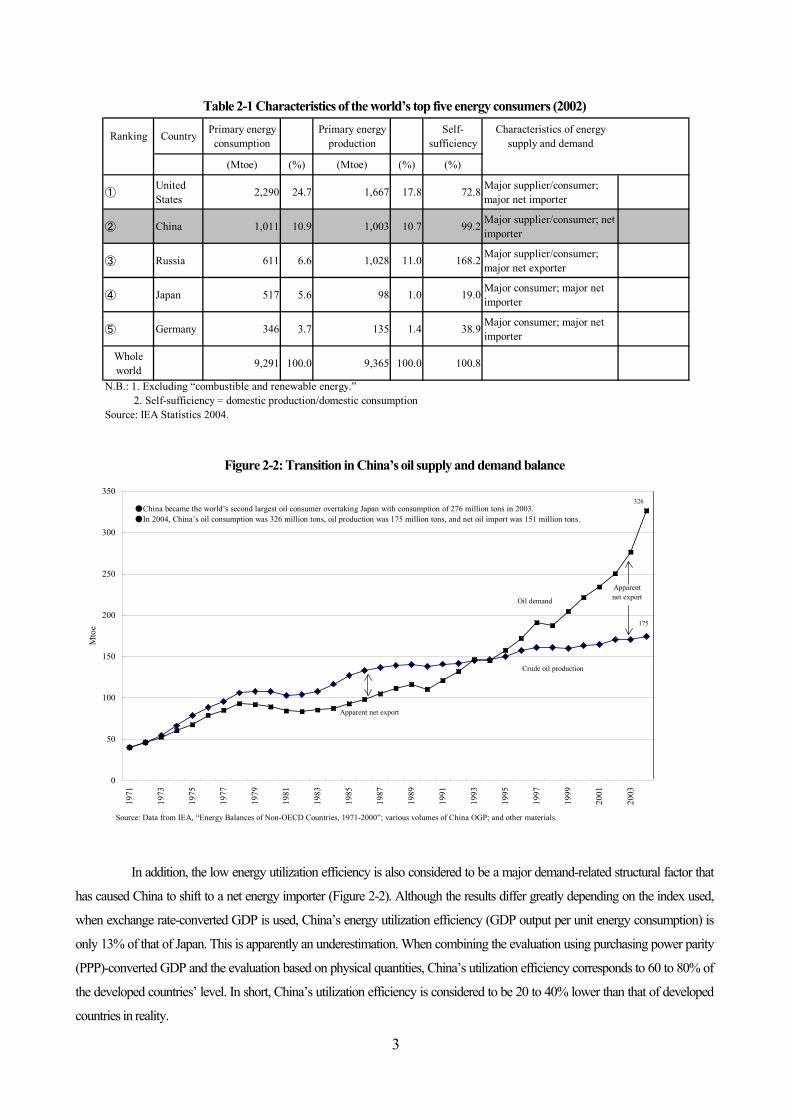
Looking at the supply and demand balance, China has achieved 100% self-sufficiency in oil since the mid-1960s, and
attained the highest-ever net oil export of 36 million toe in 1985. After that, the net export rapidly declined due to stagnation of
production and a surge in demand, and China finally slid down to a net importer in 1993 (see Figure 2-2). Eleven years later, in
2004, the net oil import sharply rose to 150 million toe, and China became the world’s third largest importer following the United
States and Japan. Triggered by the rapid increase in oil import pertaining to oil demand growth, China’s history as a net energy
exporter, which lasted for more than 30 years, finally came to an end in 1997, and energy security problems suddenly began to
surface.
Figure 2-1 Transition in China’s economic growth and energy supply and demand (1971-2004)
0
100
200
300
400
500
600
700
800
900
1000
1971
1972
1973
1974
1975
1976
1977
1978
1979
1980
1981
1982
1983
1984
1985
1986
1987
1988
1989
1990
1991
1992
1993
1994
1995
1996
1997
1998
1999
2000
2001
2002
2003
2004
Index (1980=100)
(100)
883
374
341
Real GDP index
Primary energy production index
Primary energy consumption index
Source: Created by Zhidong Li based on “China Statistical Yearbook,” “Statistics Communiqué on National Economic and Social Development in 2004,” and othermaterials.
Average annual growth and energy/GDP elasticity for 1980-2004Real GDP 9.5%
Primary energy production 5.2%Primary energy consumption 5.7%
Energy/GDP elasticity of primary energy consumption 0.60
3
Table 2-1 Characteristics of the world’s top five energy consumers (2002)
Figure 2-2: Transition in China’s oil supply and demand balance
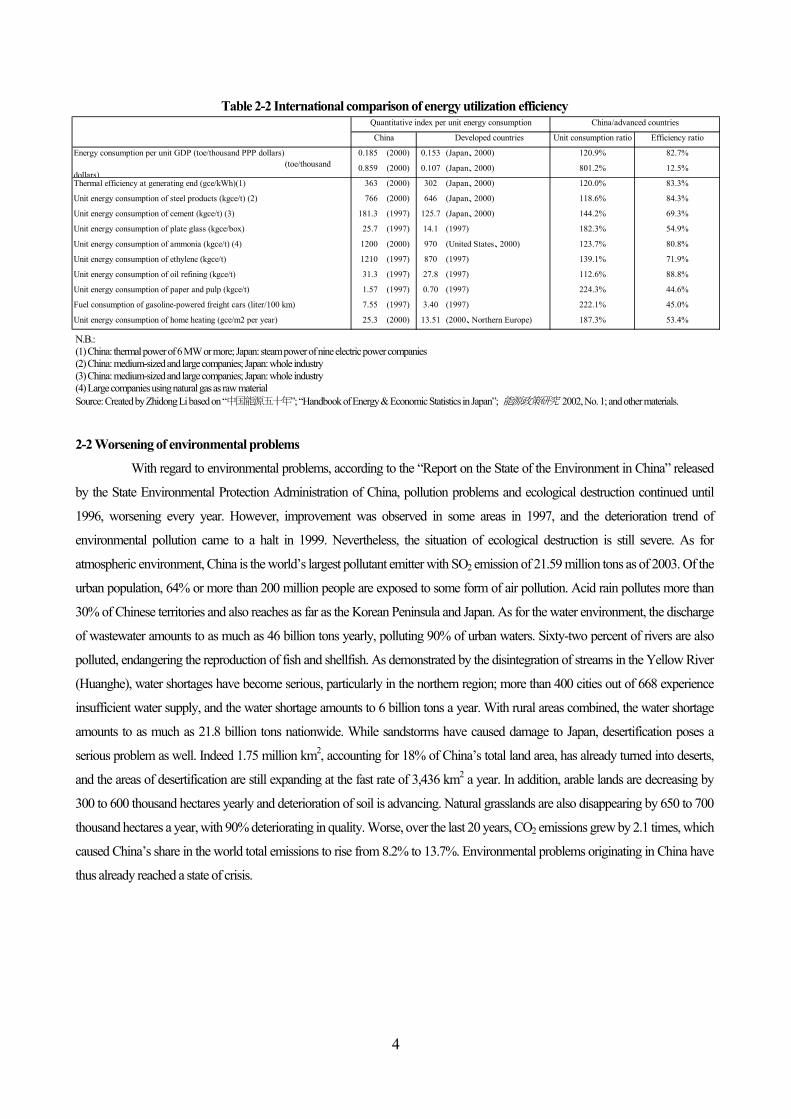
In addition, the low energy utilization efficiency is also considered to be a major demand-related structural factor that
has caused China to shift to a net energy importer (Figure 2-2). Although the results differ greatly depending on the index used,
when exchange rate-converted GDP is used, China’s energy utilization efficiency (GDP output per unit energy consumption) is
only 13% of that of Japan. This is apparently an underestimation. When combining the evaluation using purchasing power parity
(PPP)-converted GDP and the evaluation based on physical quantities, China’s utilization efficiency corresponds to 60 to 80% of
the developed countries’ level. In short, China’s utilization efficiency is considered to be 20 to 40% lower than that of developed
countries in reality.
0
50
100
150
200
250
300
350
1971
1973
1975
1977
1979
1981
1983
1985
1987
1989
1991
1993
1995
1997
1999
2001
2003
Mto
e
Crude oil production
Oil demand
326
175
Source: Data from IEA, “Energy Balances of Non-OECD Countries, 1971-2000”; various volumes of China OGP; and other materials.
●China became the world’s second largest oil consumer overtaking Japan with consumption of 276 million tons in 2003.●In 2004, China’s oil consumption was 326 million tons, oil production was 175 million tons, and net oil import was 151 million tons.
Apparentnet export
Apparent net export
Ranking Country Primary energyconsumption
Primary energyproduction
Self-sufficiency
Characteristics of energysupply and demand
(Mtoe) (%) (Mtoe) (%) (%)
①UnitedStates
2,290 24.7 1,667 17.8 72.8 Major supplier/consumer;major net importer
② China 1,011 10.9 1,003 10.7 99.2 Major supplier/consumer; netimporter
③ Russia 611 6.6 1,028 11.0 168.2 Major supplier/consumer;major net exporter
④ Japan 517 5.6 98 1.0 19.0 Major consumer; major netimporter
⑤ Germany 346 3.7 135 1.4 38.9 Major consumer; major netimporter
Wholeworld
9,291 100.0 9,365 100.0 100.8
N.B.: 1. Excluding “combustible and renewable energy.” 2. Self-sufficiency = domestic production/domestic consumptionSource: IEA Statistics 2004.
4
Table 2-2 International comparison of energy utilization efficiency
N.B.: (1) China: thermal power of 6 MW or more; Japan: steam power of nine electric power companies (2) China: medium-sized and large companies; Japan: whole industry (3) China: medium-sized and large companies; Japan: whole industry (4) Large companies using natural gas as raw material Source: Created by Zhidong Li based on “中国能源五十年”; “Handbook of Energy & Economic Statistics in Japan”; 能源政策研究 2002, No. 1; and other materials.
2-2 Worsening of environmental problems
With regard to environmental problems, according to the “Report on the State of the Environment in China” released
by the State Environmental Protection Administration of China, pollution problems and ecological destruction continued until
1996, worsening every year. However, improvement was observed in some areas in 1997, and the deterioration trend of
environmental pollution came to a halt in 1999. Nevertheless, the situation of ecological destruction is still severe. As for
atmospheric environment, China is the world’s largest pollutant emitter with SO2 emission of 21.59 million tons as of 2003. Of the
urban population, 64% or more than 200 million people are exposed to some form of air pollution. Acid rain pollutes more than
30% of Chinese territories and also reaches as far as the Korean Peninsula and Japan. As for the water environment, the discharge
of wastewater amounts to as much as 46 billion tons yearly, polluting 90% of urban waters. Sixty-two percent of rivers are also
polluted, endangering the reproduction of fish and shellfish. As demonstrated by the disintegration of streams in the Yellow River
(Huanghe), water shortages have become serious, particularly in the northern region; more than 400 cities out of 668 experience
insufficient water supply, and the water shortage amounts to 6 billion tons a year. With rural areas combined, the water shortage
amounts to as much as 21.8 billion tons nationwide. While sandstorms have caused damage to Japan, desertification poses a
serious problem as well. Indeed 1.75 million km2, accounting for 18% of China’s total land area, has already turned into deserts,
and the areas of desertification are still expanding at the fast rate of 3,436 km2 a year. In addition, arable lands are decreasing by
300 to 600 thousand hectares yearly and deterioration of soil is advancing. Natural grasslands are also disappearing by 650 to 700
thousand hectares a year, with 90% deteriorating in quality. Worse, over the last 20 years, CO2 emissions grew by 2.1 times, which
caused China’s share in the world total emissions to rise from 8.2% to 13.7%. Environmental problems originating in China have
thus already reached a state of crisis.
Unit consumption ratio Efficiency ratio
0.185 (2000) 0.153 (Japan、2000) 120.9% 82.7%
0.859 (2000) 0.107 (Japan、2000) 801.2% 12.5%
Thermal efficiency at generating end (gce/kWh)(1) 363 (2000) 302 (Japan、2000) 120.0% 83.3%
Unit energy consumption of steel products (kgce/t) (2) 766 (2000) 646 (Japan、2000) 118.6% 84.3%
Unit energy consumption of cement (kgce/t) (3) 181.3 (1997) 125.7 (Japan、2000) 144.2% 69.3%
Unit energy consumption of plate glass (kgce/box) 25.7 (1997) 14.1 (1997) 182.3% 54.9%
Unit energy consumption of ammonia (kgce/t) (4) 1200 (2000) 970 (United States、2000) 123.7% 80.8%
Unit energy consumption of ethylene (kgce/t) 1210 (1997) 870 (1997) 139.1% 71.9%
Unit energy consumption of oil refining (kgce/t) 31.3 (1997) 27.8 (1997) 112.6% 88.8%
Unit energy consumption of paper and pulp (kgce/t) 1.57 (1997) 0.70 (1997) 224.3% 44.6%
Fuel consumption of gasoline-powered freight cars (liter/100 km) 7.55 (1997) 3.40 (1997) 222.1% 45.0%
Unit energy consumption of home heating (gce/m2 per year) 25.3 (2000) 13.51 (2000、Northern Europe) 187.3% 53.4%
Energy consumption per unit GDP (toe/thousand PPP dollars) (toe/thousanddollars)
Quantitative index per unit energy consumption China/advanced countries
China Developed countries
5
3. China’s long-term energy supply and demand outlook up to 2030
3-1 Future prospects for the Chinese economy and society
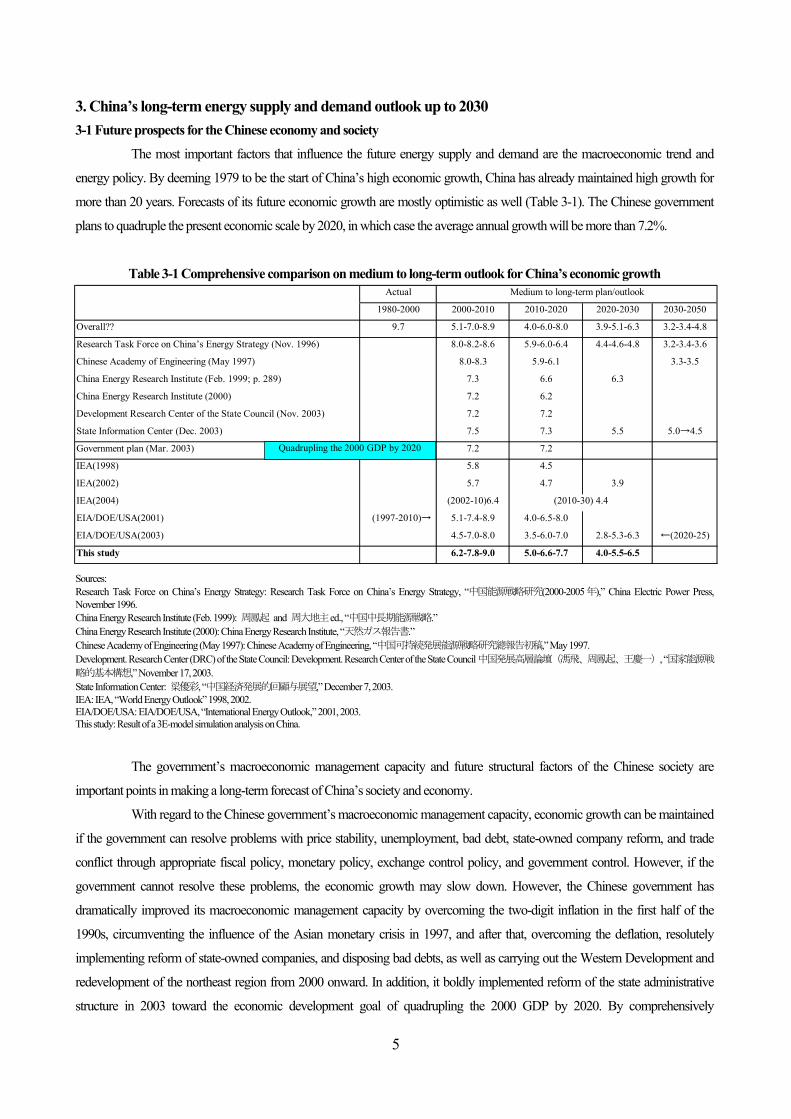
The most important factors that influence the future energy supply and demand are the macroeconomic trend and
energy policy. By deeming 1979 to be the start of China’s high economic growth, China has already maintained high growth for
more than 20 years. Forecasts of its future economic growth are mostly optimistic as well (Table 3-1). The Chinese government
plans to quadruple the present economic scale by 2020, in which case the average annual growth will be more than 7.2%.
Table 3-1 Comprehensive comparison on medium to long-term outlook for China’s economic growth
Sources: Research Task Force on China’s Energy Strategy: Research Task Force on China’s Energy Strategy, “中国能源戦略研究(2000-2005年),” China Electric Power Press, November 1996. China Energy Research Institute (Feb. 1999): 周鳳起 and 周大地主ed., “中国中長期能源戦略.” China Energy Research Institute (2000): China Energy Research Institute, “天然ガス報告書.” Chinese Academy of Engineering (May 1997): Chinese Academy of Engineering, “中国可持続発展能源戦略研究總報告初稿,” May 1997. Development. Research Center (DRC) of the State Council: Development. Research Center of the State Council中国発展高層論壇(馮飛、周鳳起、王慶一), “国家能源戦
略的基本構想,” November 17, 2003. State Information Center: 梁優彩, “中国経済発展的回顧与展望,” December 7, 2003. IEA: IEA, “World Energy Outlook” 1998, 2002. EIA/DOE/USA: EIA/DOE/USA, “International Energy Outlook,” 2001, 2003. This study: Result of a 3E-model simulation analysis on China.
The government’s macroeconomic management capacity and future structural factors of the Chinese society are
important points in making a long-term forecast of China’s society and economy.
With regard to the Chinese government’s macroeconomic management capacity, economic growth can be maintained
if the government can resolve problems with price stability, unemployment, bad debt, state-owned company reform, and trade
conflict through appropriate fiscal policy, monetary policy, exchange control policy, and government control. However, if the
government cannot resolve these problems, the economic growth may slow down. However, the Chinese government has
dramatically improved its macroeconomic management capacity by overcoming the two-digit inflation in the first half of the
1990s, circumventing the influence of the Asian monetary crisis in 1997, and after that, overcoming the deflation, resolutely
implementing reform of state-owned companies, and disposing bad debts, as well as carrying out the Western Development and
redevelopment of the northeast region from 2000 onward. In addition, it boldly implemented reform of the state administrative
structure in 2003 toward the economic development goal of quadrupling the 2000 GDP by 2020. By comprehensively
Actual
1980-2000 2000-2010 2010-2020 2020-2030 2030-2050
Overall?? 9.7 5.1-7.0-8.9 4.0-6.0-8.0 3.9-5.1-6.3 3.2-3.4-4.8
Research Task Force on China’s Energy Strategy (Nov. 1996) 8.0-8.2-8.6 5.9-6.0-6.4 4.4-4.6-4.8 3.2-3.4-3.6
Chinese Academy of Engineering (May 1997) 8.0-8.3 5.9-6.1 3.3-3.5
China Energy Research Institute (Feb. 1999; p. 289) 7.3 6.6 6.3
China Energy Research Institute (2000) 7.2 6.2
Development Research Center of the State Council (Nov. 2003) 7.2 7.2
State Information Center (Dec. 2003) 7.5 7.3 5.5 5.0→4.5
Government plan (Mar. 2003) 7.2 7.2
IEA(1998) 5.8 4.5
IEA(2002) 5.7 4.7 3.9
IEA(2004) (2002-10)6.4
EIA/DOE/USA(2001) (1997-2010)→ 5.1-7.4-8.9 4.0-6.5-8.0
EIA/DOE/USA(2003) 4.5-7.0-8.0 3.5-6.0-7.0 2.8-5.3-6.3 ←(2020-25)
This study 6.2-7.8-9.0 5.0-6.6-7.7 4.0-5.5-6.5
(2010-30) 4.4
Medium to long-term plan/outlook
Quadrupling the 2000 GDP by 2020
6
considering these points, it is very likely that the Chinese government’s management capacity will further improve in the medium
to long-term. The government’s macroeconomic management capacity is reflected in this analysis by using government
consumption and government investment as policy variables.
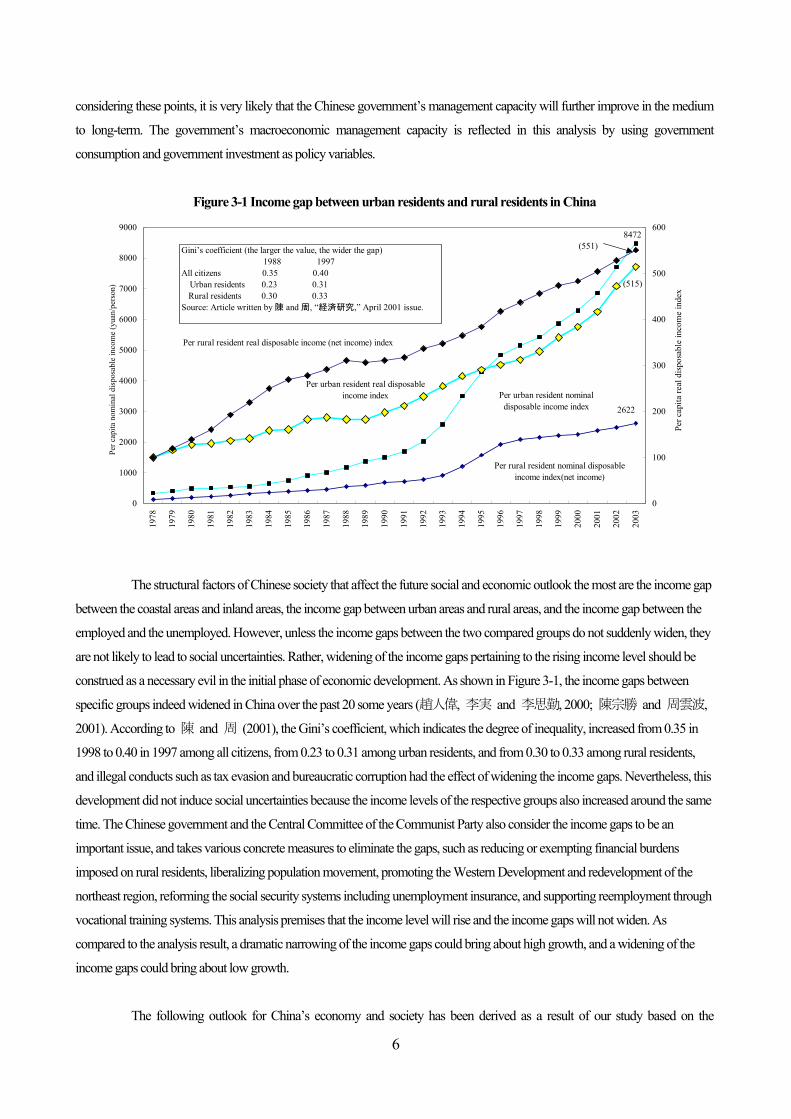
Figure 3-1 Income gap between urban residents and rural residents in China
The structural factors of Chinese society that affect the future social and economic outlook the most are the income gap
between the coastal areas and inland areas, the income gap between urban areas and rural areas, and the income gap between the
employed and the unemployed. However, unless the income gaps between the two compared groups do not suddenly widen, they
are not likely to lead to social uncertainties. Rather, widening of the income gaps pertaining to the rising income level should be
construed as a necessary evil in the initial phase of economic development. As shown in Figure 3-1, the income gaps between
specific groups indeed widened in China over the past 20 some years (趙人偉, 李実 and 李思勤, 2000; 陳宗勝 and 周雲波,
2001). According to 陳 and 周 (2001), the Gini’s coefficient, which indicates the degree of inequality, increased from 0.35 in
1998 to 0.40 in 1997 among all citizens, from 0.23 to 0.31 among urban residents, and from 0.30 to 0.33 among rural residents,
and illegal conducts such as tax evasion and bureaucratic corruption had the effect of widening the income gaps. Nevertheless, this
development did not induce social uncertainties because the income levels of the respective groups also increased around the same
time. The Chinese government and the Central Committee of the Communist Party also consider the income gaps to be an
important issue, and takes various concrete measures to eliminate the gaps, such as reducing or exempting financial burdens
imposed on rural residents, liberalizing population movement, promoting the Western Development and redevelopment of the
northeast region, reforming the social security systems including unemployment insurance, and supporting reemployment through
vocational training systems. This analysis premises that the income level will rise and the income gaps will not widen. As
compared to the analysis result, a dramatic narrowing of the income gaps could bring about high growth, and a widening of the
income gaps could bring about low growth.
The following outlook for China’s economy and society has been derived as a result of our study based on the
0
1000
2000
3000
4000
5000
6000
7000
8000
9000
1978
1979
1980
1981
1982
1983
1984
1985
1986
1987
1988
1989
1990
1991
1992
1993
1994
1995
1996
1997
1998
1999
2000
2001
2002
2003
0
100
200
300
400
500
600
Per rural resident real disposable income (net income) index
Per urban resident real disposableincome index
Per rural resident nominal disposableincome index(net income)
Per urban resident nominaldisposable income index 2622
8472
(515)
(551)Gini’s coefficient (the larger the value, the wider the gap) 1988 1997All citizens 0.35 0.40 Urban residents 0.23 0.31 Rural residents 0.30 0.33Source: Article written by 陳 and 周, “経済研究,” April 2001 issue.
Per c
apita
nom
inal
dis
posa
ble
inco
me
(yua
n/pe
rson
)
Per c
apita
real
dis
posa
ble
inco
me
inde
x
7
economy, energy, and environment model (3Es-model).
(i) The population is expected to increase from the 2003 level, which is a little less than 1.3 billion, until the first half of the 2030s,
and start declining after peaking at 1.55 to 1.6 billion. The increase rate will gradually decrease from 1.1% in the 1990s and turn to
negative in around 2040. Aging and urbanization of the population will proceed as a trend.
(ii) The economic growth until 2030 is 6.6% for the reference scenario, 7.7% for the high-growth case, and 5.0% for the
low-growth case. The probabilities of the respective cases are 60% for the reference scenario and 30% for the high growth case,
but the probability is about 10% for the low-growth case. In short, it is most likely that an economic growth of about 7% will
continue for the next 30 years.
(iii) The driving force that will support high growth is improvement in the total factor productivity attributable to technological
progress, and its contribution rate will increase from the conventional rate of a little less than 50% to more than 60%. As
represented by the fact that the overall level of the Chinese automobile industry is said to be 20 to 30 years behind the level of
developed countries, it is common knowledge that China’s current technological level is low. However, this has a positive effect
on economic growth, because there is high potential for introducing new technology.
(iv) In terms of industrial structure, the weight of the primary industry will decrease, that of the tertiary industry will increase, and
that of the secondary industry will remain more or less at the present level. While plans to expand facilities for material products
such as iron, steel, and cement were announced one after another in China until March 2004, this is regarded as a “bubble”
situation. The appropriate production scale for iron, steel, and cement is expected to increase to twice the 2000 level and that for
ethylene to five times the 2000 level in the long term.
(v) Due to continued high economic growth and maintained population policy, per-capita income level in purchasing power parity
is expected to increase from 5,800 dollars (1.8 yuan/PPP dollars) in 2004 to 15,000 dollars (4.0 yuan/PPP dollars) in 2030.
Automobiles will come into wider use due to increased income, and car ownership will increase from 27.42 million cars in 2004
to 120 million cars by 2020, and further to more than 240 million cars by 2030. The automobile diffusion rate will rise from 2.1%
to 16.1% in 2030. There is also a view that the diffusion rate will exceed 40% and car ownership will reach a level of 600 million
cars by 2050 (周/周, 1999). At the same time, car production is expected to expand rapidly from more than 5.07 million cars in
2004 to more than 7.6 million cars in 2010, more than 16 million cars in 2020, and to more than 32 million cars in 2030. This
figure indeed corresponds to half the present car production in the world. The spread of cars will be achieved by a surge in the
income level, and a rapid expansion in production will serve as a powerful driving force for high economic growth.
3-2 Future energy and environmental situation
3-2-1 Reference scenario
What kinds of problems would occur in energy supply and demand and the environment, and what kinds of measures
would be required if the aforementioned economic growth is maintained until 2030? A simulation analysis was conducted by
assuming various cases, mainly reference scenario.
8
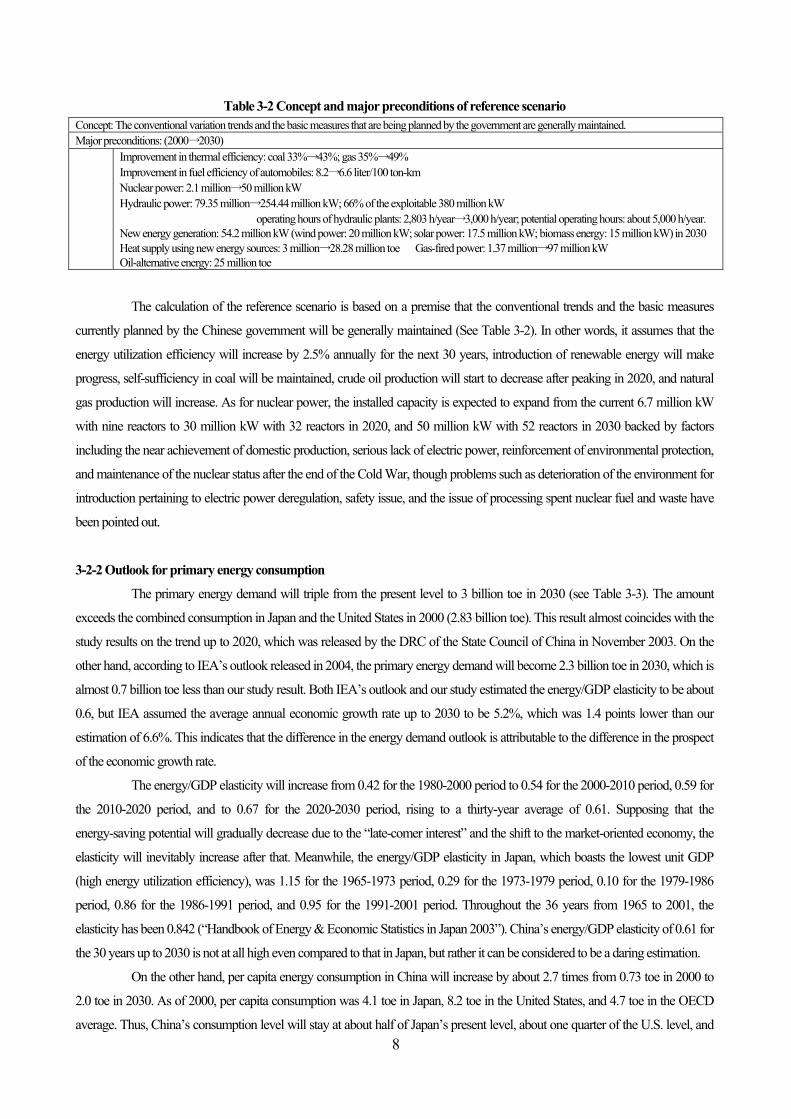
Table 3-2 Concept and major preconditions of reference scenario Concept: The conventional variation trends and the basic measures that are being planned by the government are generally maintained. Major preconditions: (2000→2030) Improvement in thermal efficiency: coal 33%→43%; gas 35%→49%
Improvement in fuel efficiency of automobiles: 8.2→6.6 liter/100 ton-km Nuclear power: 2.1 million→50 million kW Hydraulic power: 79.35 million→254.44 million kW; 66% of the exploitable 380 million kW operating hours of hydraulic plants: 2,803 h/year→3,000 h/year; potential operating hours: about 5,000 h/year. New energy generation: 54.2 million kW (wind power: 20 million kW; solar power: 17.5 million kW; biomass energy: 15 million kW) in 2030 Heat supply using new energy sources: 3 million→28.28 million toe Gas-fired power: 1.37 million→97 million kW Oil-alternative energy: 25 million toe
The calculation of the reference scenario is based on a premise that the conventional trends and the basic measures
currently planned by the Chinese government will be generally maintained (See Table 3-2). In other words, it assumes that the
energy utilization efficiency will increase by 2.5% annually for the next 30 years, introduction of renewable energy will make
progress, self-sufficiency in coal will be maintained, crude oil production will start to decrease after peaking in 2020, and natural
gas production will increase. As for nuclear power, the installed capacity is expected to expand from the current 6.7 million kW
with nine reactors to 30 million kW with 32 reactors in 2020, and 50 million kW with 52 reactors in 2030 backed by factors
including the near achievement of domestic production, serious lack of electric power, reinforcement of environmental protection,
and maintenance of the nuclear status after the end of the Cold War, though problems such as deterioration of the environment for
introduction pertaining to electric power deregulation, safety issue, and the issue of processing spent nuclear fuel and waste have
been pointed out.
3-2-2 Outlook for primary energy consumption
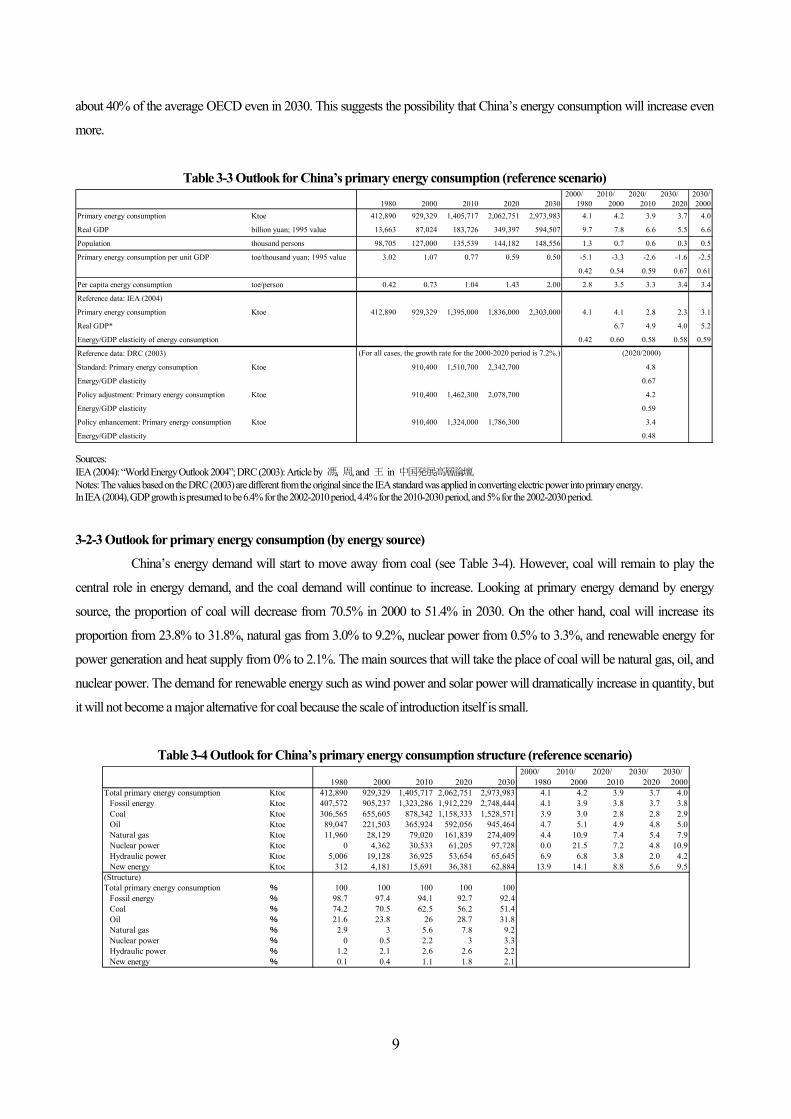
The primary energy demand will triple from the present level to 3 billion toe in 2030 (see Table 3-3). The amount
exceeds the combined consumption in Japan and the United States in 2000 (2.83 billion toe). This result almost coincides with the
study results on the trend up to 2020, which was released by the DRC of the State Council of China in November 2003. On the
other hand, according to IEA’s outlook released in 2004, the primary energy demand will become 2.3 billion toe in 2030, which is
almost 0.7 billion toe less than our study result. Both IEA’s outlook and our study estimated the energy/GDP elasticity to be about
0.6, but IEA assumed the average annual economic growth rate up to 2030 to be 5.2%, which was 1.4 points lower than our
estimation of 6.6%. This indicates that the difference in the energy demand outlook is attributable to the difference in the prospect
of the economic growth rate.
The energy/GDP elasticity will increase from 0.42 for the 1980-2000 period to 0.54 for the 2000-2010 period, 0.59 for
the 2010-2020 period, and to 0.67 for the 2020-2030 period, rising to a thirty-year average of 0.61. Supposing that the
energy-saving potential will gradually decrease due to the “late-comer interest” and the shift to the market-oriented economy, the
elasticity will inevitably increase after that. Meanwhile, the energy/GDP elasticity in Japan, which boasts the lowest unit GDP
(high energy utilization efficiency), was 1.15 for the 1965-1973 period, 0.29 for the 1973-1979 period, 0.10 for the 1979-1986
period, 0.86 for the 1986-1991 period, and 0.95 for the 1991-2001 period. Throughout the 36 years from 1965 to 2001, the
elasticity has been 0.842 (“Handbook of Energy & Economic Statistics in Japan 2003”). China’s energy/GDP elasticity of 0.61 for
the 30 years up to 2030 is not at all high even compared to that in Japan, but rather it can be considered to be a daring estimation.
On the other hand, per capita energy consumption in China will increase by about 2.7 times from 0.73 toe in 2000 to
2.0 toe in 2030. As of 2000, per capita consumption was 4.1 toe in Japan, 8.2 toe in the United States, and 4.7 toe in the OECD
average. Thus, China’s consumption level will stay at about half of Japan’s present level, about one quarter of the U.S. level, and
9
about 40% of the average OECD even in 2030. This suggests the possibility that China’s energy consumption will increase even
more.
Table 3-3 Outlook for China’s primary energy consumption (reference scenario)
Sources: IEA (2004): “World Energy Outlook 2004”; DRC (2003): Article by 馮, 周, and 王 in 中国発展高層論壇. Notes: The values based on the DRC (2003) are different from the original since the IEA standard was applied in converting electric power into primary energy. In IEA (2004), GDP growth is presumed to be 6.4% for the 2002-2010 period, 4.4% for the 2010-2030 period, and 5% for the 2002-2030 period.
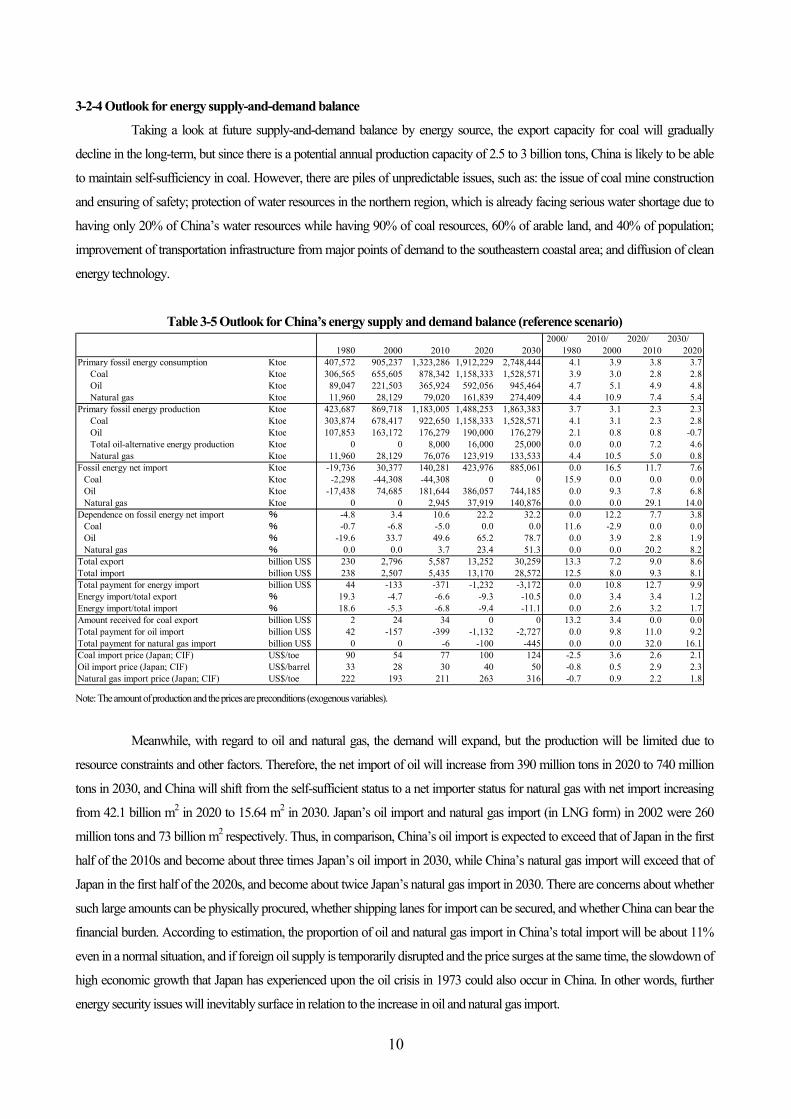
3-2-3 Outlook for primary energy consumption (by energy source)
China’s energy demand will start to move away from coal (see Table 3-4). However, coal will remain to play the
central role in energy demand, and the coal demand will continue to increase. Looking at primary energy demand by energy
source, the proportion of coal will decrease from 70.5% in 2000 to 51.4% in 2030. On the other hand, coal will increase its
proportion from 23.8% to 31.8%, natural gas from 3.0% to 9.2%, nuclear power from 0.5% to 3.3%, and renewable energy for
power generation and heat supply from 0% to 2.1%. The main sources that will take the place of coal will be natural gas, oil, and
nuclear power. The demand for renewable energy such as wind power and solar power will dramatically increase in quantity, but
it will not become a major alternative for coal because the scale of introduction itself is small.
Table 3-4 Outlook for China’s primary energy consumption structure (reference scenario)
2000/ 2010/ 2020/ 2030/ 2030/1980 2000 2010 2020 2030 1980 2000 2010 2020 2000
Primary energy consumption Ktoe 412,890 929,329 1,405,717 2,062,751 2,973,983 4.1 4.2 3.9 3.7 4.0
Real GDP billion yuan; 1995 value 13,663 87,024 183,726 349,397 594,507 9.7 7.8 6.6 5.5 6.6
Population thousand persons 98,705 127,000 135,539 144,182 148,556 1.3 0.7 0.6 0.3 0.5
Primary energy consumption per unit GDP toe/thousand yuan; 1995 value 3.02 1.07 0.77 0.59 0.50 -5.1 -3.3 -2.6 -1.6 -2.5
0.42 0.54 0.59 0.67 0.61
Per capita energy consumption toe/person 0.42 0.73 1.04 1.43 2.00 2.8 3.5 3.3 3.4 3.4
Reference data: IEA (2004)
Primary energy consumption Ktoe 412,890 929,329 1,395,000 1,836,000 2,303,000 4.1 4.1 2.8 2.3 3.1
Real GDP* 6.7 4.9 4.0 5.2
Energy/GDP elasticity of energy consumption 0.42 0.60 0.58 0.58 0.59
Reference data: DRC (2003)
Standard: Primary energy consumption Ktoe 910,400 1,510,700 2,342,700 4.8
Energy/GDP elasticity 0.67
Policy adjustment: Primary energy consumption Ktoe 910,400 1,462,300 2,078,700 4.2
Energy/GDP elasticity 0.59
Policy enhancement: Primary energy consumption Ktoe 910,400 1,324,000 1,786,300 3.4
Energy/GDP elasticity 0.48
(2020/2000)(For all cases, the growth rate for the 2000-2020 period is 7.2%.)
2000/ 2010/ 2020/ 2030/ 2030/1980 2000 2010 2020 2030 1980 2000 2010 2020 2000
Total primary energy consumption Ktoe 412,890 929,329 1,405,717 2,062,751 2,973,983 4.1 4.2 3.9 3.7 4.0 Fossil energy Ktoe 407,572 905,237 1,323,286 1,912,229 2,748,444 4.1 3.9 3.8 3.7 3.8 Coal Ktoe 306,565 655,605 878,342 1,158,333 1,528,571 3.9 3.0 2.8 2.8 2.9 Oil Ktoe 89,047 221,503 365,924 592,056 945,464 4.7 5.1 4.9 4.8 5.0 Natural gas Ktoe 11,960 28,129 79,020 161,839 274,409 4.4 10.9 7.4 5.4 7.9 Nuclear power Ktoe 0 4,362 30,533 61,205 97,728 0.0 21.5 7.2 4.8 10.9 Hydraulic power Ktoe 5,006 19,128 36,925 53,654 65,645 6.9 6.8 3.8 2.0 4.2 New energy Ktoe 312 4,181 15,691 36,381 62,884 13.9 14.1 8.8 5.6 9.5(Structure)Total primary energy consumption % 100 100 100 100 100 Fossil energy % 98.7 97.4 94.1 92.7 92.4 Coal % 74.2 70.5 62.5 56.2 51.4 Oil % 21.6 23.8 26 28.7 31.8 Natural gas % 2.9 3 5.6 7.8 9.2 Nuclear power % 0 0.5 2.2 3 3.3 Hydraulic power % 1.2 2.1 2.6 2.6 2.2 New energy % 0.1 0.4 1.1 1.8 2.1
10
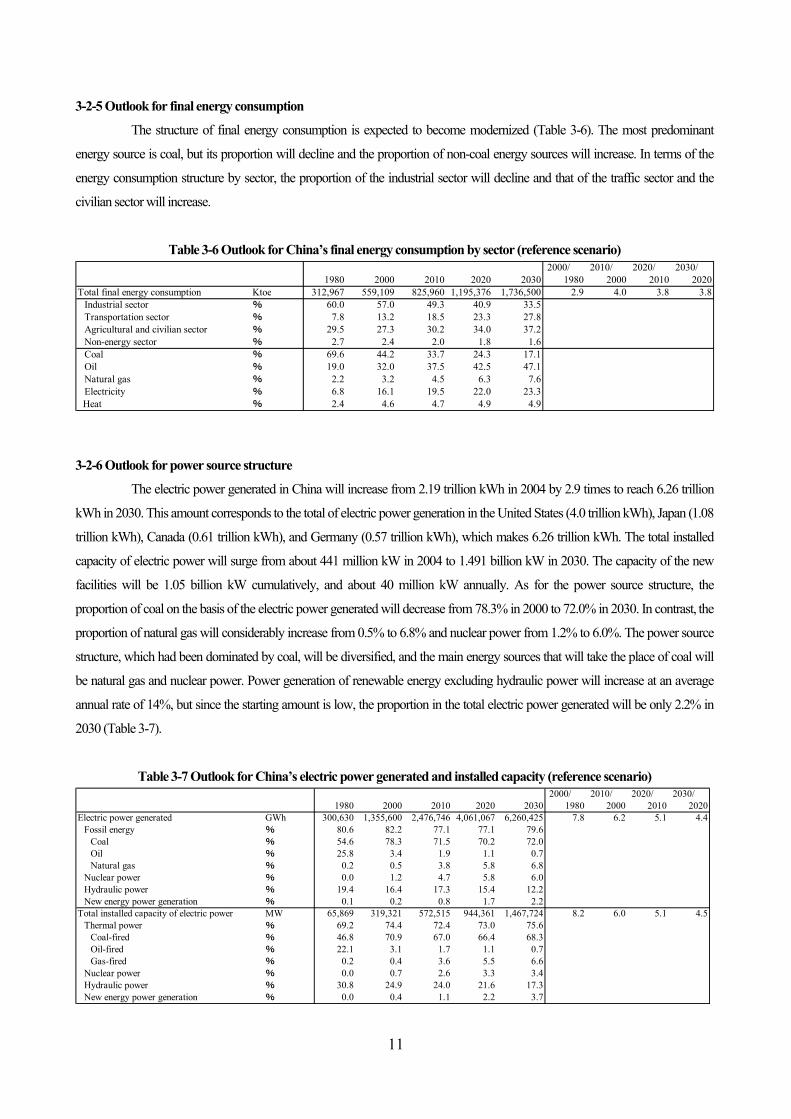
3-2-4 Outlook for energy supply-and-demand balance
Taking a look at future supply-and-demand balance by energy source, the export capacity for coal will gradually
decline in the long-term, but since there is a potential annual production capacity of 2.5 to 3 billion tons, China is likely to be able
to maintain self-sufficiency in coal. However, there are piles of unpredictable issues, such as: the issue of coal mine construction
and ensuring of safety; protection of water resources in the northern region, which is already facing serious water shortage due to
having only 20% of China’s water resources while having 90% of coal resources, 60% of arable land, and 40% of population;
improvement of transportation infrastructure from major points of demand to the southeastern coastal area; and diffusion of clean
energy technology.
Table 3-5 Outlook for China’s energy supply and demand balance (reference scenario)
Note: The amount of production and the prices are preconditions (exogenous variables).
Meanwhile, with regard to oil and natural gas, the demand will expand, but the production will be limited due to
resource constraints and other factors. Therefore, the net import of oil will increase from 390 million tons in 2020 to 740 million
tons in 2030, and China will shift from the self-sufficient status to a net importer status for natural gas with net import increasing
from 42.1 billion m2 in 2020 to 15.64 m2 in 2030. Japan’s oil import and natural gas import (in LNG form) in 2002 were 260
million tons and 73 billion m2 respectively. Thus, in comparison, China’s oil import is expected to exceed that of Japan in the first
half of the 2010s and become about three times Japan’s oil import in 2030, while China’s natural gas import will exceed that of
Japan in the first half of the 2020s, and become about twice Japan’s natural gas import in 2030. There are concerns about whether
such large amounts can be physically procured, whether shipping lanes for import can be secured, and whether China can bear the
financial burden. According to estimation, the proportion of oil and natural gas import in China’s total import will be about 11%
even in a normal situation, and if foreign oil supply is temporarily disrupted and the price surges at the same time, the slowdown of
high economic growth that Japan has experienced upon the oil crisis in 1973 could also occur in China. In other words, further
energy security issues will inevitably surface in relation to the increase in oil and natural gas import.
2000/ 2010/ 2020/ 2030/1980 2000 2010 2020 2030 1980 2000 2010 2020
Primary fossil energy consumption Ktoe 407,572 905,237 1,323,286 1,912,229 2,748,444 4.1 3.9 3.8 3.7 Coal Ktoe 306,565 655,605 878,342 1,158,333 1,528,571 3.9 3.0 2.8 2.8 Oil Ktoe 89,047 221,503 365,924 592,056 945,464 4.7 5.1 4.9 4.8 Natural gas Ktoe 11,960 28,129 79,020 161,839 274,409 4.4 10.9 7.4 5.4Primary fossil energy production Ktoe 423,687 869,718 1,183,005 1,488,253 1,863,383 3.7 3.1 2.3 2.3 Coal Ktoe 303,874 678,417 922,650 1,158,333 1,528,571 4.1 3.1 2.3 2.8 Oil Ktoe 107,853 163,172 176,279 190,000 176,279 2.1 0.8 0.8 -0.7 Total oil-alternative energy production Ktoe 0 0 8,000 16,000 25,000 0.0 0.0 7.2 4.6 Natural gas Ktoe 11,960 28,129 76,076 123,919 133,533 4.4 10.5 5.0 0.8Fossil energy net import Ktoe -19,736 30,377 140,281 423,976 885,061 0.0 16.5 11.7 7.6 Coal Ktoe -2,298 -44,308 -44,308 0 0 15.9 0.0 0.0 0.0 Oil Ktoe -17,438 74,685 181,644 386,057 744,185 0.0 9.3 7.8 6.8 Natural gas Ktoe 0 0 2,945 37,919 140,876 0.0 0.0 29.1 14.0Dependence on fossil energy net import % -4.8 3.4 10.6 22.2 32.2 0.0 12.2 7.7 3.8 Coal % -0.7 -6.8 -5.0 0.0 0.0 11.6 -2.9 0.0 0.0 Oil % -19.6 33.7 49.6 65.2 78.7 0.0 3.9 2.8 1.9 Natural gas % 0.0 0.0 3.7 23.4 51.3 0.0 0.0 20.2 8.2Total export billion US$ 230 2,796 5,587 13,252 30,259 13.3 7.2 9.0 8.6Total import billion US$ 238 2,507 5,435 13,170 28,572 12.5 8.0 9.3 8.1Total payment for energy import billion US$ 44 -133 -371 -1,232 -3,172 0.0 10.8 12.7 9.9Energy import/total export % 19.3 -4.7 -6.6 -9.3 -10.5 0.0 3.4 3.4 1.2Energy import/total import % 18.6 -5.3 -6.8 -9.4 -11.1 0.0 2.6 3.2 1.7Amount received for coal export billion US$ 2 24 34 0 0 13.2 3.4 0.0 0.0Total payment for oil import billion US$ 42 -157 -399 -1,132 -2,727 0.0 9.8 11.0 9.2Total payment for natural gas import billion US$ 0 0 -6 -100 -445 0.0 0.0 32.0 16.1Coal import price (Japan; CIF) US$/toe 90 54 77 100 124 -2.5 3.6 2.6 2.1Oil import price (Japan; CIF) US$/barrel 33 28 30 40 50 -0.8 0.5 2.9 2.3Natural gas import price (Japan; CIF) US$/toe 222 193 211 263 316 -0.7 0.9 2.2 1.8
11
3-2-5 Outlook for final energy consumption
The structure of final energy consumption is expected to become modernized (Table 3-6). The most predominant
energy source is coal, but its proportion will decline and the proportion of non-coal energy sources will increase. In terms of the
energy consumption structure by sector, the proportion of the industrial sector will decline and that of the traffic sector and the
civilian sector will increase.
Table 3-6 Outlook for China’s final energy consumption by sector (reference scenario)
3-2-6 Outlook for power source structure
The electric power generated in China will increase from 2.19 trillion kWh in 2004 by 2.9 times to reach 6.26 trillion
kWh in 2030. This amount corresponds to the total of electric power generation in the United States (4.0 trillion kWh), Japan (1.08
trillion kWh), Canada (0.61 trillion kWh), and Germany (0.57 trillion kWh), which makes 6.26 trillion kWh. The total installed
capacity of electric power will surge from about 441 million kW in 2004 to 1.491 billion kW in 2030. The capacity of the new
facilities will be 1.05 billion kW cumulatively, and about 40 million kW annually. As for the power source structure, the
proportion of coal on the basis of the electric power generated will decrease from 78.3% in 2000 to 72.0% in 2030. In contrast, the
proportion of natural gas will considerably increase from 0.5% to 6.8% and nuclear power from 1.2% to 6.0%. The power source
structure, which had been dominated by coal, will be diversified, and the main energy sources that will take the place of coal will
be natural gas and nuclear power. Power generation of renewable energy excluding hydraulic power will increase at an average
annual rate of 14%, but since the starting amount is low, the proportion in the total electric power generated will be only 2.2% in
2030 (Table 3-7).
Table 3-7 Outlook for China’s electric power generated and installed capacity (reference scenario)
2000/ 2010/ 2020/ 2030/1980 2000 2010 2020 2030 1980 2000 2010 2020
Total final energy consumption Ktoe 312,967 559,109 825,960 1,195,376 1,736,500 2.9 4.0 3.8 3.8 Industrial sector % 60.0 57.0 49.3 40.9 33.5 Transportation sector % 7.8 13.2 18.5 23.3 27.8 Agricultural and civilian sector % 29.5 27.3 30.2 34.0 37.2 Non-energy sector % 2.7 2.4 2.0 1.8 1.6 Coal % 69.6 44.2 33.7 24.3 17.1 Oil % 19.0 32.0 37.5 42.5 47.1 Natural gas % 2.2 3.2 4.5 6.3 7.6 Electricity % 6.8 16.1 19.5 22.0 23.3 Heat % 2.4 4.6 4.7 4.9 4.9
2000/ 2010/ 2020/ 2030/1980 2000 2010 2020 2030 1980 2000 2010 2020
Electric power generated GWh 300,630 1,355,600 2,476,746 4,061,067 6,260,425 7.8 6.2 5.1 4.4 Fossil energy % 80.6 82.2 77.1 77.1 79.6 Coal % 54.6 78.3 71.5 70.2 72.0 Oil % 25.8 3.4 1.9 1.1 0.7 Natural gas % 0.2 0.5 3.8 5.8 6.8 Nuclear power % 0.0 1.2 4.7 5.8 6.0 Hydraulic power % 19.4 16.4 17.3 15.4 12.2 New energy power generation % 0.1 0.2 0.8 1.7 2.2Total installed capacity of electric power MW 65,869 319,321 572,515 944,361 1,467,724 8.2 6.0 5.1 4.5 Thermal power % 69.2 74.4 72.4 73.0 75.6 Coal-fired % 46.8 70.9 67.0 66.4 68.3 Oil-fired % 22.1 3.1 1.7 1.1 0.7 Gas-fired % 0.2 0.4 3.6 5.5 6.6 Nuclear power % 0.0 0.7 2.6 3.3 3.4 Hydraulic power % 30.8 24.9 24.0 21.6 17.3 New energy power generation % 0.0 0.4 1.1 2.2 3.7
12
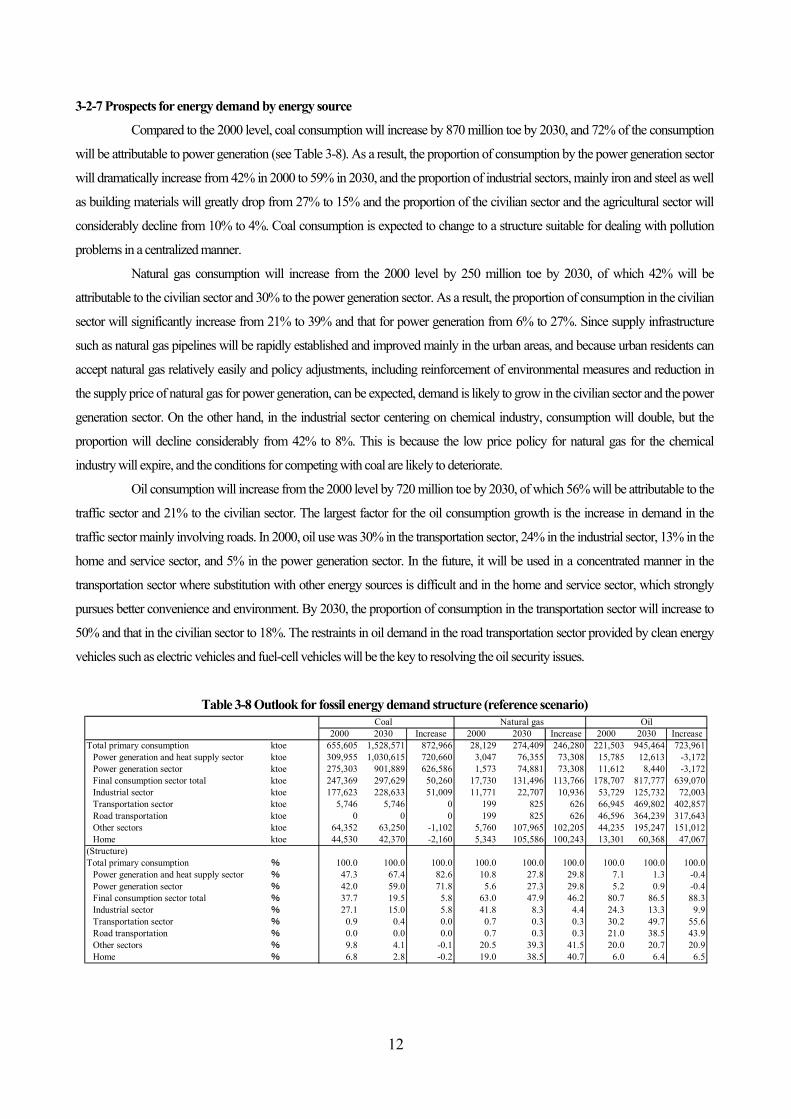
3-2-7 Prospects for energy demand by energy source
Compared to the 2000 level, coal consumption will increase by 870 million toe by 2030, and 72% of the consumption
will be attributable to power generation (see Table 3-8). As a result, the proportion of consumption by the power generation sector
will dramatically increase from 42% in 2000 to 59% in 2030, and the proportion of industrial sectors, mainly iron and steel as well
as building materials will greatly drop from 27% to 15% and the proportion of the civilian sector and the agricultural sector will
considerably decline from 10% to 4%. Coal consumption is expected to change to a structure suitable for dealing with pollution
problems in a centralized manner.
Natural gas consumption will increase from the 2000 level by 250 million toe by 2030, of which 42% will be
attributable to the civilian sector and 30% to the power generation sector. As a result, the proportion of consumption in the civilian
sector will significantly increase from 21% to 39% and that for power generation from 6% to 27%. Since supply infrastructure
such as natural gas pipelines will be rapidly established and improved mainly in the urban areas, and because urban residents can
accept natural gas relatively easily and policy adjustments, including reinforcement of environmental measures and reduction in
the supply price of natural gas for power generation, can be expected, demand is likely to grow in the civilian sector and the power
generation sector. On the other hand, in the industrial sector centering on chemical industry, consumption will double, but the
proportion will decline considerably from 42% to 8%. This is because the low price policy for natural gas for the chemical
industry will expire, and the conditions for competing with coal are likely to deteriorate.
Oil consumption will increase from the 2000 level by 720 million toe by 2030, of which 56% will be attributable to the
traffic sector and 21% to the civilian sector. The largest factor for the oil consumption growth is the increase in demand in the
traffic sector mainly involving roads. In 2000, oil use was 30% in the transportation sector, 24% in the industrial sector, 13% in the
home and service sector, and 5% in the power generation sector. In the future, it will be used in a concentrated manner in the
transportation sector where substitution with other energy sources is difficult and in the home and service sector, which strongly
pursues better convenience and environment. By 2030, the proportion of consumption in the transportation sector will increase to
50% and that in the civilian sector to 18%. The restraints in oil demand in the road transportation sector provided by clean energy
vehicles such as electric vehicles and fuel-cell vehicles will be the key to resolving the oil security issues.
Table 3-8 Outlook for fossil energy demand structure (reference scenario)
Coal Natural gas Oil2000 2030 Increase 2000 2030 Increase 2000 2030 Increase
Total primary consumption ktoe 655,605 1,528,571 872,966 28,129 274,409 246,280 221,503 945,464 723,961 Power generation and heat supply sector ktoe 309,955 1,030,615 720,660 3,047 76,355 73,308 15,785 12,613 -3,172 Power generation sector ktoe 275,303 901,889 626,586 1,573 74,881 73,308 11,612 8,440 -3,172 Final consumption sector total ktoe 247,369 297,629 50,260 17,730 131,496 113,766 178,707 817,777 639,070 Industrial sector ktoe 177,623 228,633 51,009 11,771 22,707 10,936 53,729 125,732 72,003 Transportation sector ktoe 5,746 5,746 0 199 825 626 66,945 469,802 402,857 Road transportation ktoe 0 0 0 199 825 626 46,596 364,239 317,643 Other sectors ktoe 64,352 63,250 -1,102 5,760 107,965 102,205 44,235 195,247 151,012 Home ktoe 44,530 42,370 -2,160 5,343 105,586 100,243 13,301 60,368 47,067(Structure)Total primary consumption % 100.0 100.0 100.0 100.0 100.0 100.0 100.0 100.0 100.0 Power generation and heat supply sector % 47.3 67.4 82.6 10.8 27.8 29.8 7.1 1.3 -0.4 Power generation sector % 42.0 59.0 71.8 5.6 27.3 29.8 5.2 0.9 -0.4 Final consumption sector total % 37.7 19.5 5.8 63.0 47.9 46.2 80.7 86.5 88.3 Industrial sector % 27.1 15.0 5.8 41.8 8.3 4.4 24.3 13.3 9.9 Transportation sector % 0.9 0.4 0.0 0.7 0.3 0.3 30.2 49.7 55.6 Road transportation % 0.0 0.0 0.0 0.7 0.3 0.3 21.0 38.5 43.9 Other sectors % 9.8 4.1 -0.1 20.5 39.3 41.5 20.0 20.7 20.9 Home % 6.8 2.8 -0.2 19.0 38.5 40.7 6.0 6.4 6.5
13
By type of oil product, diesel oil demand will increase by 4.2 times from 69 million toe in 2000 to 361 million toe in
2030, gasoline demand will increase by 3.2 times from 36 million toe to 163 million toe, naphtha demand will triple from 22
million toe to 87 million toe, aviation fuel demand will increase by 13 times from 5 million toe to 75 million toe, and LPG demand
will increase by 2.7 times from 17 million toe to 63 million toe. As for production structure in 2030, the proportion of diesel oil will
be 43%, gasoline 19%, naphtha 10%, aviation fuel 9%, and LPG 7%. Heavy oil demand will increase by 52% from 33 million toe
to 50 million toe, but its proportion will decline from 16% to 6%.
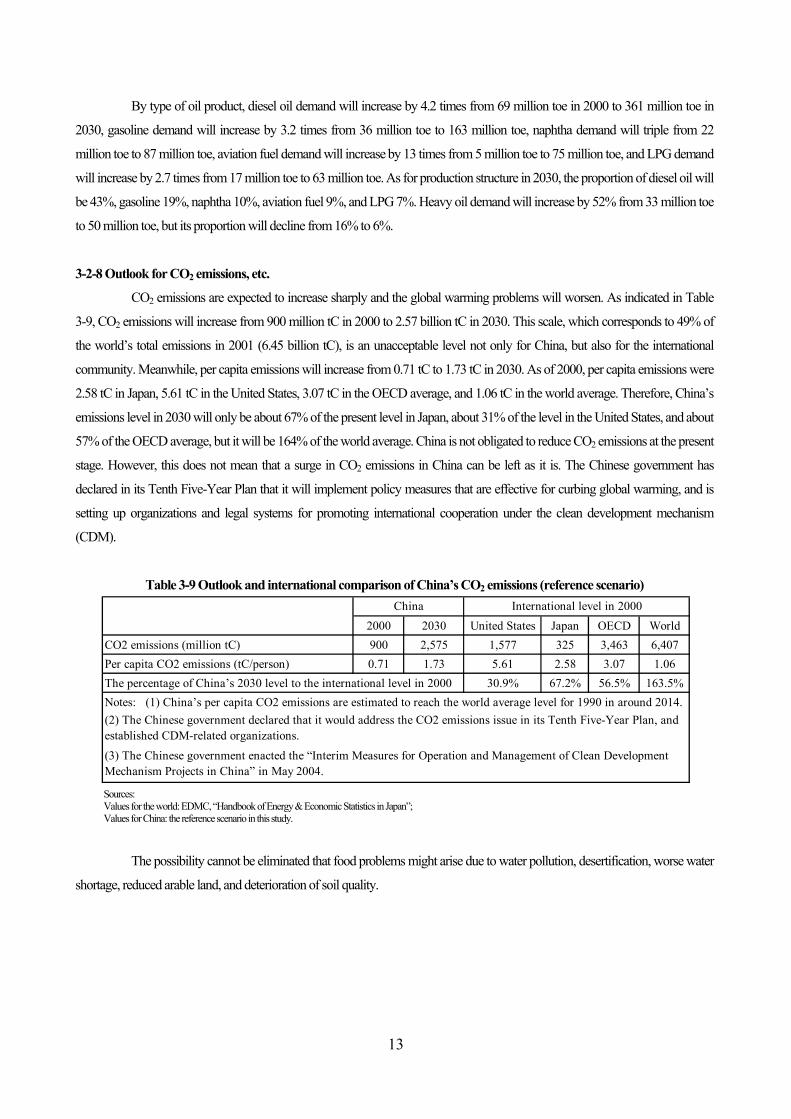
3-2-8 Outlook for CO2 emissions, etc.
CO2 emissions are expected to increase sharply and the global warming problems will worsen. As indicated in Table
3-9, CO2 emissions will increase from 900 million tC in 2000 to 2.57 billion tC in 2030. This scale, which corresponds to 49% of
the world’s total emissions in 2001 (6.45 billion tC), is an unacceptable level not only for China, but also for the international
community. Meanwhile, per capita emissions will increase from 0.71 tC to 1.73 tC in 2030. As of 2000, per capita emissions were
2.58 tC in Japan, 5.61 tC in the United States, 3.07 tC in the OECD average, and 1.06 tC in the world average. Therefore, China’s
emissions level in 2030 will only be about 67% of the present level in Japan, about 31% of the level in the United States, and about
57% of the OECD average, but it will be 164% of the world average. China is not obligated to reduce CO2 emissions at the present
stage. However, this does not mean that a surge in CO2 emissions in China can be left as it is. The Chinese government has
declared in its Tenth Five-Year Plan that it will implement policy measures that are effective for curbing global warming, and is
setting up organizations and legal systems for promoting international cooperation under the clean development mechanism
(CDM).
Table 3-9 Outlook and international comparison of China’s CO2 emissions (reference scenario)
Sources: Values for the world: EDMC, “Handbook of Energy & Economic Statistics in Japan”; Values for China: the reference scenario in this study.
The possibility cannot be eliminated that food problems might arise due to water pollution, desertification, worse water
shortage, reduced arable land, and deterioration of soil quality.
2000 2030 United States Japan OECD WorldCO2 emissions (million tC) 900 2,575 1,577 325 3,463 6,407Per capita CO2 emissions (tC/person) 0.71 1.73 5.61 2.58 3.07 1.06The percentage of China’s 2030 level to the international level in 2000 30.9% 67.2% 56.5% 163.5%Notes: (1) China’s per capita CO2 emissions are estimated to reach the world average level for 1990 in around 2014.
(3) The Chinese government enacted the “Interim Measures for Operation and Management of Clean DevelopmentMechanism Projects in China” in May 2004.
China International level in 2000
(2) The Chinese government declared that it would address the CO2 emissions issue in its Tenth Five-Year Plan, andestablished CDM-related organizations.
14
4. China’s automobile strategy - Outlook for automobile diffusion in China and the automobile industry development strategy - Future car ownership in China is currently drawing the attention of the international community. There are concerns
that, if a population giant with about 1.3 billion citizens becomes an automobile society, the world map of energy supply and
demand centering on oil will dramatically change, and the problems of air pollution, acid rain pollution, and global warming will
become even worse. On the other hand, automobile companies around the world, which have run into an era of mega-competition,
hold expectations for China to become the largest automobile market of the 21st century. How China can promote its automobile
industry so as to satisfy the needs for automobile diffusion and to minimize the impacts on the energy security issues and the
environmental issues is a future task for China, which aims at sustainable development. Thus, this section analyzes the current
status and forecasts the future of automobile diffusion in China in an attempt to examine the various automobile-related problems
and the automobile industry development strategy.
4-1 Current status and future outlook of automobile diffusion
As of the end of 2004, China’s car ownership was 27.42 million cars, and the diffusion rate was 2.1%. Compared to
the fact that the diffusion rates in developed countries are 77.7% in the United States, 56.9% in Japan, and 26.8% in the Republic
of Korea (2000 actual; based on EIA/DOE/USA, “International Energy Outlook 2001”), the diffusion rate in China is apparently
low. However, China is considered to be on the verge of becoming an automobile society due to the following reasons.
Firstly, car ownership has surged, the style of ownership has shifted from public ownership (owned by private business
operators excluding personal businesses or owned by government-related organizations excluding the military) to private
ownership, and the type of vehicles has changed from freight cars to passenger cars. Ownership had increased at an annual rate of
13.3% mainly involved publicly-owned freight cars in the 1970s, but after the reform and liberalization—from 1980 to 2004—it
has increased at an annual rate of 12.1% mainly in the area of privately-owned passenger cars. The average annual increase rate
from 1985 to 2003 was 17.6% for passenger cars, which far exceeds the 7.6% for freight cars. In particular, the average annual
increase rate for privately-owned passenger cars reaches 40.2%. Looking at the composition of the vehicle types owned, the share
of passenger cars increased by 37.3 points from 24.7% in 1985 to 62.1% in 2003, and the share of privately-owned passenger cars
increased by 34.9 points from 0.6% to 35.5%.
Secondly, the income level has risen. From 1980 to 2004, China’s GDP growth rate reached 9.5% and per capita GDP
growth rate 8.3%. As a result, in 2004, per capita nominal GDP was 10,502 yuan, which is 1,270 dollars based on the exchange
rate (8.27 yuan/dollar) and 5,834 dollars based on purchasing power parity (1.8 yuan/PPP dollars). As of May 2005, the lowest
price for China’s domestic brand car was 29,000 yuan for a 800 cc car (Chery’s QQ) and 43,200 yuan for a 1300 cc car (Geely’s
Merrie). The prices are about three to four times the average annual income, so families of three can purchase a small domestic
passenger car for one to 1.4 times the average annual income per household.
Thirdly, the automobile industry has begun to develop at a fast pace. Automobile production increased from 222,000
cars in 1980 to 5.07 million cars in 2004.
There are three major views on the future of the diffusion of automobiles in China.
First is a conservative view that “privately-owned cars are far from booming in China” (“Jidōsha sangyō handobukku
(Handbook on automobile industry) 2000”). The major basis is the low per capita income level. However, the conservative theory
seems unconvincing in front of the prevalent prediction that the economic growth of more than 7% will continue for about 30
years.
15
Second is a view that the diffusion of automobiles will not be so fast. For example, “Chūgoku enerugī senryaku
kenkyū (Study on China’s energy strategy) (2000-2050)” expects the diffusion rate of privately-owned passenger cars to be 1.3%
in 2020 and 6.0% in 2050. The major basis is that tangible problems involving parking spaces and roads, intangible problems
concerning for example the automobile control system, as well as the oil supply and demand problems and environmental
problems will hinder the diffusion of automobiles. However, these are all problems that developed countries have faced in the past
and have already solved or are in the process of solving, so they are not insoluble problems for China.
Third is a view that the diffusion of automobiles will advance at a rapid pace. The major basis is that promotion of the
automobile industry is necessary for maintaining economic growth, and because of this, any obstacles that hinder the diffusion of
automobiles will gradually be removed as in developed countries.
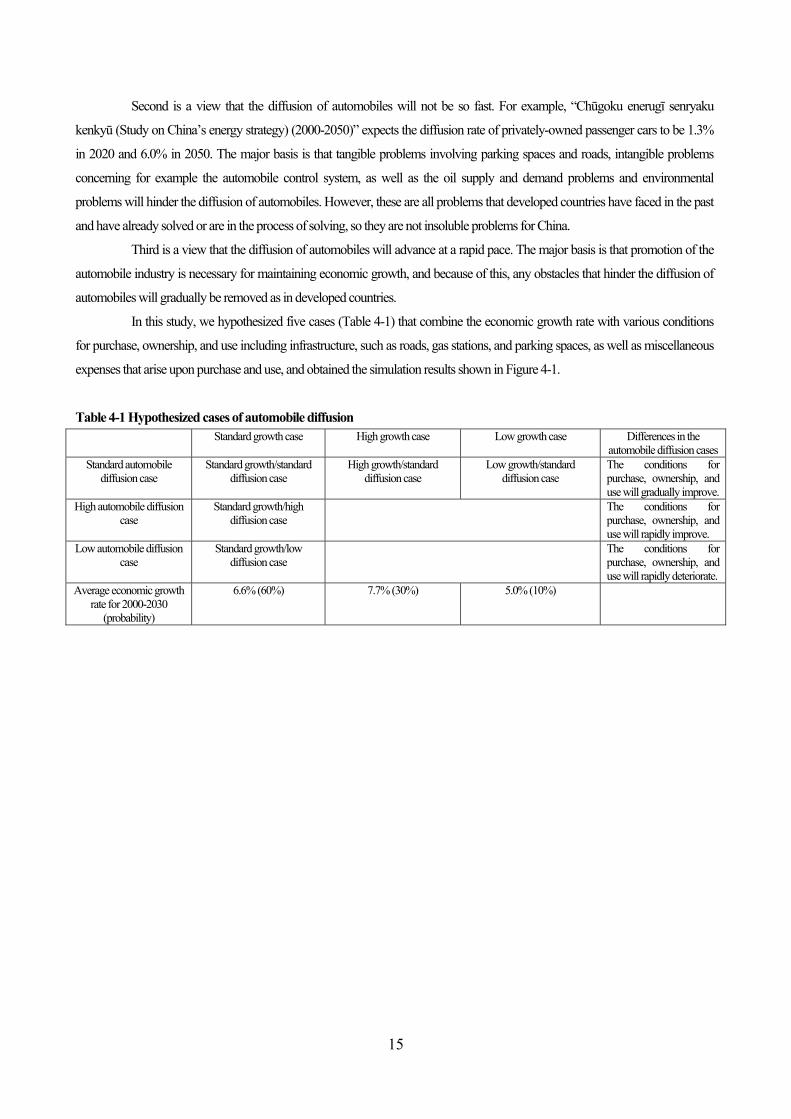
In this study, we hypothesized five cases (Table 4-1) that combine the economic growth rate with various conditions
for purchase, ownership, and use including infrastructure, such as roads, gas stations, and parking spaces, as well as miscellaneous
expenses that arise upon purchase and use, and obtained the simulation results shown in Figure 4-1.
Table 4-1 Hypothesized cases of automobile diffusion Standard growth case High growth case Low growth case Differences in the
automobile diffusion casesStandard automobile
diffusion case Standard growth/standard
diffusion case High growth/standard
diffusion case Low growth/standard
diffusion case The conditions for purchase, ownership, and use will gradually improve.
High automobile diffusion case
Standard growth/high diffusion case
The conditions for purchase, ownership, and use will rapidly improve.
Low automobile diffusion case
Standard growth/low diffusion case
The conditions for purchase, ownership, and use will rapidly deteriorate.
Average economic growth rate for 2000-2030
(probability)
6.6% (60%) 7.7% (30%) 5.0% (10%)
16
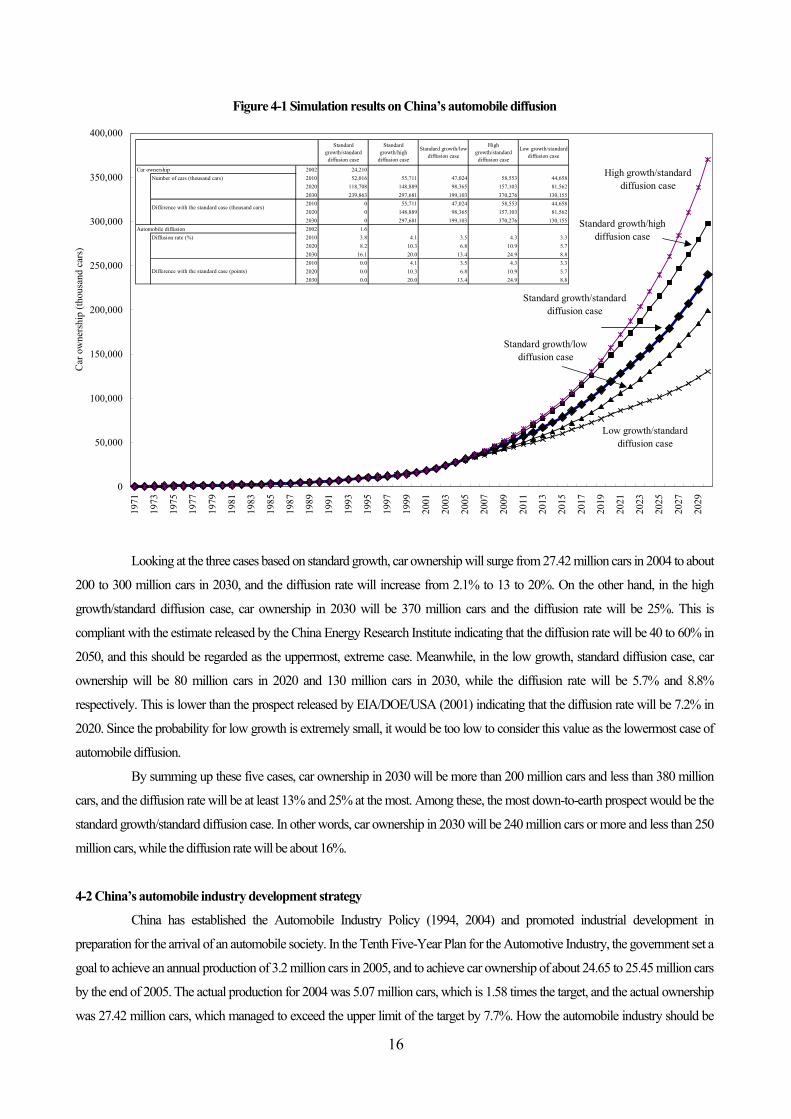
Figure 4-1 Simulation results on China’s automobile diffusion
Looking at the three cases based on standard growth, car ownership will surge from 27.42 million cars in 2004 to about
200 to 300 million cars in 2030, and the diffusion rate will increase from 2.1% to 13 to 20%. On the other hand, in the high
growth/standard diffusion case, car ownership in 2030 will be 370 million cars and the diffusion rate will be 25%. This is
compliant with the estimate released by the China Energy Research Institute indicating that the diffusion rate will be 40 to 60% in
2050, and this should be regarded as the uppermost, extreme case. Meanwhile, in the low growth, standard diffusion case, car
ownership will be 80 million cars in 2020 and 130 million cars in 2030, while the diffusion rate will be 5.7% and 8.8%
respectively. This is lower than the prospect released by EIA/DOE/USA (2001) indicating that the diffusion rate will be 7.2% in
2020. Since the probability for low growth is extremely small, it would be too low to consider this value as the lowermost case of
automobile diffusion.
By summing up these five cases, car ownership in 2030 will be more than 200 million cars and less than 380 million
cars, and the diffusion rate will be at least 13% and 25% at the most. Among these, the most down-to-earth prospect would be the
standard growth/standard diffusion case. In other words, car ownership in 2030 will be 240 million cars or more and less than 250
million cars, while the diffusion rate will be about 16%.
4-2 China’s automobile industry development strategy
China has established the Automobile Industry Policy (1994, 2004) and promoted industrial development in
preparation for the arrival of an automobile society. In the Tenth Five-Year Plan for the Automotive Industry, the government set a
goal to achieve an annual production of 3.2 million cars in 2005, and to achieve car ownership of about 24.65 to 25.45 million cars
by the end of 2005. The actual production for 2004 was 5.07 million cars, which is 1.58 times the target, and the actual ownership
was 27.42 million cars, which managed to exceed the upper limit of the target by 7.7%. How the automobile industry should be
0
50,000
100,000
150,000
200,000
250,000
300,000
350,000
400,00019
71
1973
1975
1977
1979
1981
1983
1985
1987
1989
1991
1993
1995
1997
1999
2001
2003
2005
2007
2009
2011
2013
2015
2017
2019
2021
2023
2025
2027
2029
Car
ow
ners
hip
(thou
sand
car
s)
High growth/standarddiffusion case
Standard growth/highdiffusion case
Standard growth/standarddiffusion case
Standard growth/lowdiffusion case
Low growth/standarddiffusion case
Car ownership 2002 24,210Number of cars (thousand cars) 2010 52,016 55,711 47,024 58,553 44,658
2020 118,708 148,889 98,365 157,103 81,5622030 239,863 297,681 199,103 370,276 130,1552010 0 55,711 47,024 58,553 44,6582020 0 148,889 98,365 157,103 81,5622030 0 297,681 199,103 370,276 130,155
Automobile diffusion 2002 1.6Diffusion rate (%) 2010 3.8 4.1 3.5 4.3 3.3
2020 8.2 10.3 6.8 10.9 5.72030 16.1 20.0 13.4 24.9 8.82010 0.0 4.1 3.5 4.3 3.32020 0.0 10.3 6.8 10.9 5.72030 0.0 20.0 13.4 24.9 8.8
Difference with the standard case (thousand cars)
Difference with the standard case (points)
Standardgrowth/standarddiffusion case
Standardgrowth/high
diffusion case
Standard growth/lowdiffusion case
Highgrowth/standarddiffusion case
Low growth/standarddiffusion case
17
developed so as to meet the demand for automobile diffusion and to resolve, or at least prevent worsening of, energy security
problems and environmental problems is the central challenge for China’s automobile industry development strategy.
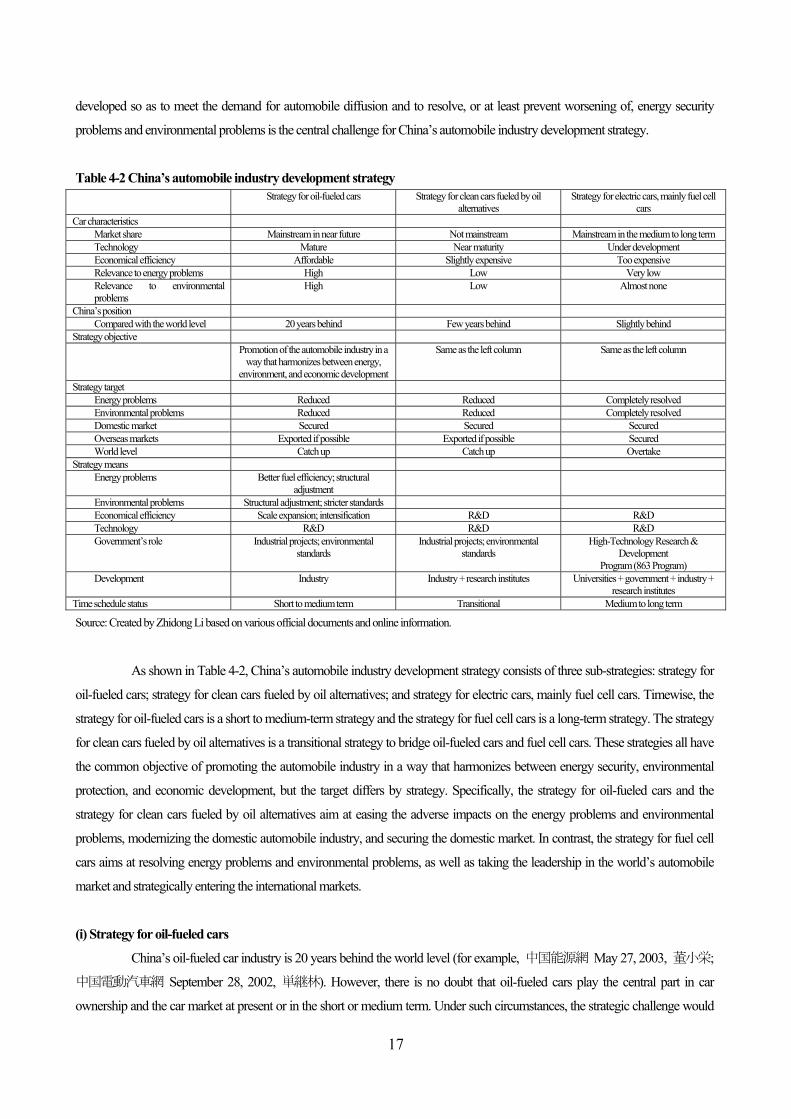
Table 4-2 China’s automobile industry development strategy Strategy for oil-fueled cars Strategy for clean cars fueled by oil
alternatives Strategy for electric cars, mainly fuel cell
cars Car characteristics
Market share Mainstream in near future Not mainstream Mainstream in the medium to long term Technology Mature Near maturity Under development Economical efficiency Affordable Slightly expensive Too expensive Relevance to energy problems High Low Very low Relevance to environmental problems
High Low Almost none
China’s position Compared with the world level 20 years behind Few years behind Slightly behind
Strategy objective Promotion of the automobile industry in a
way that harmonizes between energy, environment, and economic development
Same as the left column Same as the left column
Strategy target Energy problems Reduced Reduced Completely resolved Environmental problems Reduced Reduced Completely resolved Domestic market Secured Secured Secured Overseas markets Exported if possible Exported if possible Secured World level Catch up Catch up Overtake
Strategy means Energy problems Better fuel efficiency; structural
adjustment
Environmental problems Structural adjustment; stricter standards Economical efficiency Scale expansion; intensification R&D R&D Technology R&D R&D R&D Government’s role Industrial projects; environmental
standards Industrial projects; environmental
standards High-Technology Research &
Development Program (863 Program)
Development Industry Industry + research institutes Universities + government + industry + research institutes
Time schedule status Short to medium term Transitional Medium to long term
Source: Created by Zhidong Li based on various official documents and online information.
As shown in Table 4-2, China’s automobile industry development strategy consists of three sub-strategies: strategy for
oil-fueled cars; strategy for clean cars fueled by oil alternatives; and strategy for electric cars, mainly fuel cell cars. Timewise, the
strategy for oil-fueled cars is a short to medium-term strategy and the strategy for fuel cell cars is a long-term strategy. The strategy
for clean cars fueled by oil alternatives is a transitional strategy to bridge oil-fueled cars and fuel cell cars. These strategies all have
the common objective of promoting the automobile industry in a way that harmonizes between energy security, environmental
protection, and economic development, but the target differs by strategy. Specifically, the strategy for oil-fueled cars and the
strategy for clean cars fueled by oil alternatives aim at easing the adverse impacts on the energy problems and environmental
problems, modernizing the domestic automobile industry, and securing the domestic market. In contrast, the strategy for fuel cell
cars aims at resolving energy problems and environmental problems, as well as taking the leadership in the world’s automobile
market and strategically entering the international markets.
(i) Strategy for oil-fueled cars
China’s oil-fueled car industry is 20 years behind the world level (for example, 中国能源網 May 27, 2003, 董小栄;
中国電動汽車網 September 28, 2002, 単継林). However, there is no doubt that oil-fueled cars play the central part in car
ownership and the car market at present or in the short or medium term. Under such circumstances, the strategic challenge would
18
be how fuel-efficient, clean oil-fueled cars could be produced and sold. In the Tenth Five-Year Plan for the Automotive Industry,
the government prioritizes improvement in fuel burning efficiency, adjustment of the vehicle type structure, and reinforcement of
exhaust emission standards.
a) Improvement in fuel and combustion efficiency
The plan indicates a target to improve the average fuel burning efficiency of various cars by 10% in 2005, specifically,
5 to 10% for passenger cars and small freight cars, and 10 to 15% for medium-sized and large freight cars.
b) Adjustment of the vehicle type structure
With regard to the structure of vehicle types produced, the proportion of production of passenger cars, medium-sized
and large freight vehicles, and special cars will be increased. In terms of composition of vehicles types, the proportion of diesel
freight cars and small diesel buses will be increased, and medium-sized cars will all be diesel cars. In 2005, the proportion of
passenger cars in total car production will be raised to more than 35% from 29.2% in 2000, and the proportion of diesel cars will
be raised to around 35% from 29.7%. The priority vehicle types by usage are as follows.
<Passenger cars and taxis>
- (Gasoline) passenger cars: Cars with displacement of 1300 cc or less, which clear the domestic high fuel efficiency standard, are
priced at around 80,000 yuan, and comply with the Euro 2 emission standards, will be intensively developed.
- Diesel passenger cars: Cars that comply with the Euro 2 emission standards or Euro 3 emission standards will be moderately
developed.
- Other passenger cars: CNG, LPG, and hybrid cars will be moderately developed.
- Taxis: Clean energy cars will be intensively developed.
<Freight cars>
- Large (displacement of 9000 cc or more; 300 horsepower or more) diesel freight cars complying with the Euro 2 emission
standards or Euro 3 emission standards will be intensively developed.
- CNG freight cars and LPG freight cars complying with the Euro 2 emission standards or Euro 3 emission standards will be
moderately developed.
- Light freight cars and small freight cars will be actively developed.
<Buses>
- Clean energy vehicles will be intensively developed.
c) Reinforcement of exhaust emission standards
The five-year plan stipulates the following as the target for automobile exhaust emission control in 2005: (i) new
passenger cars, light cars, small cars, medium-sized and large buses, and medium-sized and large freight cars shall comply with
the Euro 2 emission standards; (ii) efforts shall be made to have part of medium-class and luxury-class cars as well as luxury-class,
large and medium-sized buses comply with the Euro 3 emission standards as much as possible; and (iii) the exhaust emission level
of new four-wheeled agricultural vehicles (author’s note: this generally refers to light trucks) shall be gradually improved, and
four-wheeled agricultural vehicles equipped with multiple turbos shall comply with the Euro 1 emission standards. In addition, the
plan provides that the exhaust emission level of the respective vehicles shall be gradually improved to the international level by
19
around 2010.
(2) Strategy for clean energy cars fueled by oil alternatives
Clean energy cars fueled by oil alternatives include CNG cars, LPG cars, cars fueled with methanol-blended gasoline,
cars fueled with ethanol-blended gasoline, methanol cars, cars fueled with ethanol-blended diesel, and cars fueled with dimethyl
ether (DME). R&D on clean energy cars was conducted on a worldwide scale in response to the oil crisis in the 1970s, but the cars
have yet to be diffused due to technical problems and the problems in fuel supply infrastructure. Nevertheless, because they have
better environmental performance and can restrain oil consumption compared to existing oil-fueled cars, clean energy vehicles are
used for taxis, buses, mail cars, and garbage trucks.
The Chinese government is considered to be focusing on the right types of vehicles in the right fields in its policy on
clean energy cars fueled by oil alternatives.
In the Tenth Five-Year Plan for the Automotive Industry, the government hammered out a strategy to: (i) intensively
develop taxis and buses; (ii) moderately develop CNG, LPG, and hybrid cars as passenger cars; (iii) moderately develop CNG
freight cars and LPG freight cars; and (iv) limit development of bi-fuel (gasoline + CNG; gasoline + LPG) cars as being a
transitional existence.
At the same time, in the Tenth Five-Year Plan for National Economic and Social Development and the plan for energy,
the government indicated a policy to promote the development of alcohol fuel. In line with this, production projects were set up in
some regions, and the national standards for “denatured fuel alcohol” and “alcohol gasoline for automobiles” were formulated.
Nevertheless, the problem of raw material supply in the case of using food as raw materials, the problem of cost competitiveness,
and the problems of car engine development have been pointed out (中国能源網 August 1, 2001, 中国化工報記事; ibid.,
March 15, 2002, 元国家計画発展委員会産業発展司劉鉄男).
(3) Strategy for fuel cell cars
In China, R&D of fuel cells started around the mid-1950s and full-fledged R&D of fuel cell cars started after the
adoption of the High-Technology Research & Development Program (863 Program).
The 863 Program is known as a technological development plan to be intensively promoted by the government with
respect to the priority technologies in national strategy. The program was launched in March 1986 under the leadership of the late
Deng Xiaoping. The technological development project of electric cars including fuel cell cars, pure electric cars, and hybrid cars
was formally adopted as a key project of the 863 Program in the Tenth Five-Year Plan for Science and Technology, and the
project has been initiated. In particular, R&D of fuel cell cars is positioned as a priority task.
Why is China promoting the R&D of cutting-edge fuel cell cars? One of the reasons is that fuel cell cars are important
technology for a hydrogen society, which is expected to arrive in the future, and they can resolve energy problems, environmental
problems, and economic development problems all at once. More important, however, is the Chinese government’s awareness
that if the R&D is promoted as a national effort, China may achieve remarkable success just as it has once succeeded in manned
space flight. In other words, the development of fuel cell cars is the one and only field in which the Chinese automobile industry
can compete with automobile companies around the world, and has a chance of success.
The following section introduces the brief outline and progress status of the key project on electric cars, mainly fuel
cars, under the 863 Program, based mainly on electronic data (中国能源網, 中国電動自動車網, etc.).
20
a) Project outline
Development framework: (i) government + industry + universities + research institutes; (ii) divided into six sub-projects; and (iii) a
competitive development mechanism introduced.
Budget for development: 2.4 billion yuan during the Tenth Five-Year Plan period (State: 880 million yuan)
Budget for diffusion: Besides 2 billion yuan for the Beijing Olympic Games in 2008, independent measures will be taken by local
governments such as Shanghai and Guangong.
2005 target: achieve industrialization of pure electric cars and mass production of hybrid cars, and develop a model car for
commercialization of fuel cell cars.
b) Project progress status
The production of pure electric cars and hybrid cars was launched in 2004. As for fuel cell cars (passenger cars), the
first-generation experimental model car “Chao Yue I” was released in August 2003. The main specifications are as shown below.
Vehicle weight: 1.6 to 1.7 tons
Fuel cell: 40 kW
Acceleration: 80 km/h in 14 seconds
Top speed: 110 km/h
Cruising distance: 210 km
Lastly, the Japanese automobile industry, which has a competitive edge in the world, is not necessarily demonstrating
its advantage fully in China. This is because in the 1980s when Europe and the United States actively advanced to China with eyes
to the potential of the Chinese market, Japan had judged it to be too early. There is a good possibility that Japan, which is currently
ahead in fuel cell car development, might dominate the world in this field if it promotes the establishment of international standards
and cost reduction by using China’s potential market through cooperation with China. Japan-China cooperation in this field will
become part of the future agenda.
21
5. China’s nuclear power strategy - Medium to long-term outlook for China’s nuclear power development – China’s nuclear power development is drawing the attention of the international community. Today when the world’s
nuclear power development is slowing down, the nuclear power companies throughout the world, mainly in developed countries,
hold expectations for China to become the largest market of the 21st century. On the other hand, there are concerns that, as seen in
the past, rapid introduction of nuclear power generation centering on overseas technology would involve various problems in the
areas of safety, cost competitiveness, and lack of employment opportunities, as well as delay domestic production of the
technology, and consequently hinder development of nuclear power generation in China. In addition, many people do not
understand why China, which has considerably high potential for energy conservation and development of renewable energy such
as hydraulic power and wind power, fails to produce such energy internally and rather implement nuclear power generation that
still involves the problem of safe waste disposal. This section clarifies the current situation of the development of nuclear power
generation in China, and outlines its medium to long-term outlook and the related issues.
5-1 Current situation of the development of nuclear power generation
Immediately after the national foundation in 1949, China established the China Institute of Atomic Energy (CIAE),
concluded an agreement on nuclear cooperation with former Soviet Union in 1955, and established a competent government
organization in 1956. Later, prompted by a confrontation between China and the Soviet Union, China launched independent
nuclear power development for military purpose in 1960. After the success of the development for military purpose, China
established the Shanghai Nuclear Engineering Research and Design Institute in 1972, and started designing the Qinshan nuclear
power plant (300,000 kW; pressurized water reactor (PWR)). The construction plan for the Qinshan nuclear power plant was
included in the Sixth Five-Year Plan (1981-1985) for National Economic and Social Development, which was formulated in 1982.
The construction started in March 1985, test operation was launched in December 1991, and commercial operation was initiated in
May 1994. This event signifies the start of China’s nuclear power industry.
With construction of the Qinshan nuclear power plant as a start, the Chinese government hammered out the following
policies and promoted nuclear power development based on the respective national programs: “build nuclear power plants
intensively and in a phased manner” in the Seventh Five-Year Plan (1986-1990); “build large and medium-sized power plants of a
certain scale, including nuclear power plants, in an organized manner, and build the Qinshan II nuclear power plant in an intensive
manner” in the Eighth Five-Year Plan (1991-1995) and the Ten-Year Program; “achieve remarkable progress in industrialization
of advanced technology such as nuclear power and appropriately develop nuclear power generation” in the Ninth Five-Year Plan
(1996-2000); and “moderately develop nuclear power generation” in the Tenth Five-Year Plan. As a result, the installed capacity
became 8.7 million kW with 11 reactors at the end of April 2005, including the 2 million kW of the two reactors under
construction. The share of nuclear power in total installed capacity became 1.5% (end of 2004) and the share in total power
generation became 2.3% (2004).
5-2 Medium to long-term outlook for nuclear power development
In China, many plans and concepts have been announced on the construction of nuclear power plants mainly in coastal
regions (Table 5-1) in order to respond to the high economic growth and active electric power demand pertaining to reform and
liberalization. Half of them were announced before the mid-1990s and the rest were announced in recent years when electric
22
power shortage became a problem once again.
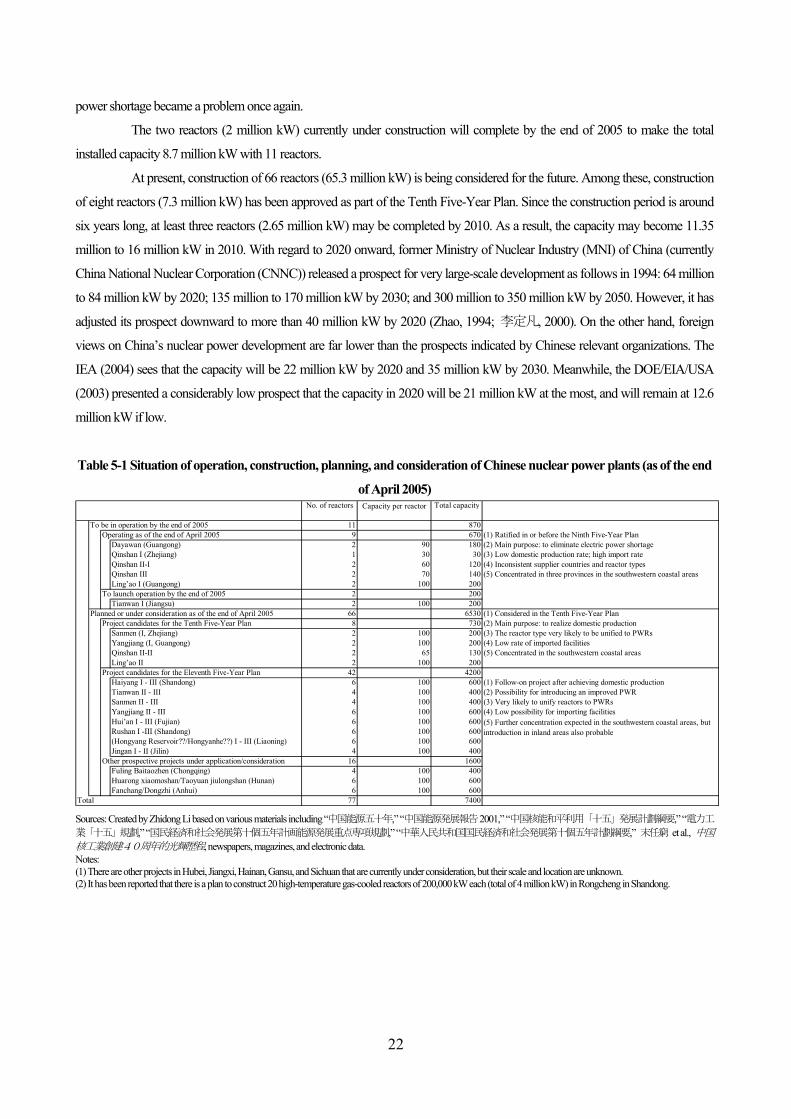
The two reactors (2 million kW) currently under construction will complete by the end of 2005 to make the total
installed capacity 8.7 million kW with 11 reactors.
At present, construction of 66 reactors (65.3 million kW) is being considered for the future. Among these, construction
of eight reactors (7.3 million kW) has been approved as part of the Tenth Five-Year Plan. Since the construction period is around
six years long, at least three reactors (2.65 million kW) may be completed by 2010. As a result, the capacity may become 11.35
million to 16 million kW in 2010. With regard to 2020 onward, former Ministry of Nuclear Industry (MNI) of China (currently
China National Nuclear Corporation (CNNC)) released a prospect for very large-scale development as follows in 1994: 64 million
to 84 million kW by 2020; 135 million to 170 million kW by 2030; and 300 million to 350 million kW by 2050. However, it has
adjusted its prospect downward to more than 40 million kW by 2020 (Zhao, 1994; 李定凡, 2000). On the other hand, foreign
views on China’s nuclear power development are far lower than the prospects indicated by Chinese relevant organizations. The
IEA (2004) sees that the capacity will be 22 million kW by 2020 and 35 million kW by 2030. Meanwhile, the DOE/EIA/USA
(2003) presented a considerably low prospect that the capacity in 2020 will be 21 million kW at the most, and will remain at 12.6
million kW if low.
Table 5-1 Situation of operation, construction, planning, and consideration of Chinese nuclear power plants (as of the end
of April 2005)
Sources: Created by Zhidong Li based on various materials including “中国能源五十年,” “中国能源発展報告2001,” “中国核能和平利用「十五」発展計劃綱要,” “電力工
業「十五」規劃,” “国民経済和社会発展第十個五年計画能源発展重点専項規劃,” “中華人民共和国国民経済和社会発展第十個五年計劃綱要,” 末任窮 et al., 中国核工業創建40周年的光輝歴程, newspapers, magazines, and electronic data. Notes: (1) There are other projects in Hubei, Jiangxi, Hainan, Gansu, and Sichuan that are currently under consideration, but their scale and location are unknown. (2) It has been reported that there is a plan to construct 20 high-temperature gas-cooled reactors of 200,000 kW each (total of 4 million kW) in Rongcheng in Shandong.
No. of reactors Total capacity
To be in operation by the end of 2005 11 870Operating as of the end of April 2005 9 670 (1) Ratified in or before the Ninth Five-Year Plan
Dayawan (Guangong) 2 90 180 (2) Main purpose: to eliminate electric power shortageQinshan I (Zhejiang) 1 30 30 (3) Low domestic production rate; high import rateQinshan II-I 2 60 120 (4) Inconsistent supplier countries and reactor types Qinshan III 2 70 140 (5) Concentrated in three provinces in the southwestern coastal areasLing’ao I (Guangong) 2 100 200
To launch operation by the end of 2005 2 200Tianwan I (Jiangsu) 2 100 200
Planned or under consideration as of the end of April 2005 66 6530 (1) Considered in the Tenth Five-Year PlanProject candidates for the Tenth Five-Year Plan 8 730 (2) Main purpose: to realize domestic production
Sanmen (I, Zhejiang) 2 100 200 (3) The reactor type very likely to be unified to PWRsYangjiang (I, Guangong) 2 100 200 (4) Low rate of imported facilitiesQinshan II-II 2 65 130 (5) Concentrated in the southwestern coastal areasLing’ao II 2 100 200
Project candidates for the Eleventh Five-Year Plan 42 4200 Haiyang I - III (Shandong) 6 100 600 (1) Follow-on project after achieving domestic productionTianwan II - III 4 100 400 (2) Possibility for introducing an improved PWRSanmen II - III 4 100 400 (3) Very likely to unify reactors to PWRsYangjiang II - III 6 100 600 (4) Low possibility for importing facilitiesHui’an I - III (Fujian) 6 100 600Rushan I -III (Shandong) 6 100 600(Hongyang Reservoir??/Hongyanhe??) I - III (Liaoning) 6 100 600Jingan I - II (Jilin) 4 100 400
Other prospective projects under application/consideration 16 1600Fuling Baitaozhen (Chongqing) 4 100 400Huarong xiaomoshan/Taoyuan jiulongshan (Hunan) 6 100 600Fanchang/Dongzhi (Anhui) 6 100 600
Total 77 7400
Capacity per reactor
(5) Further concentration expected in the southwestern coastal areas, butintroduction in inland areas also probable
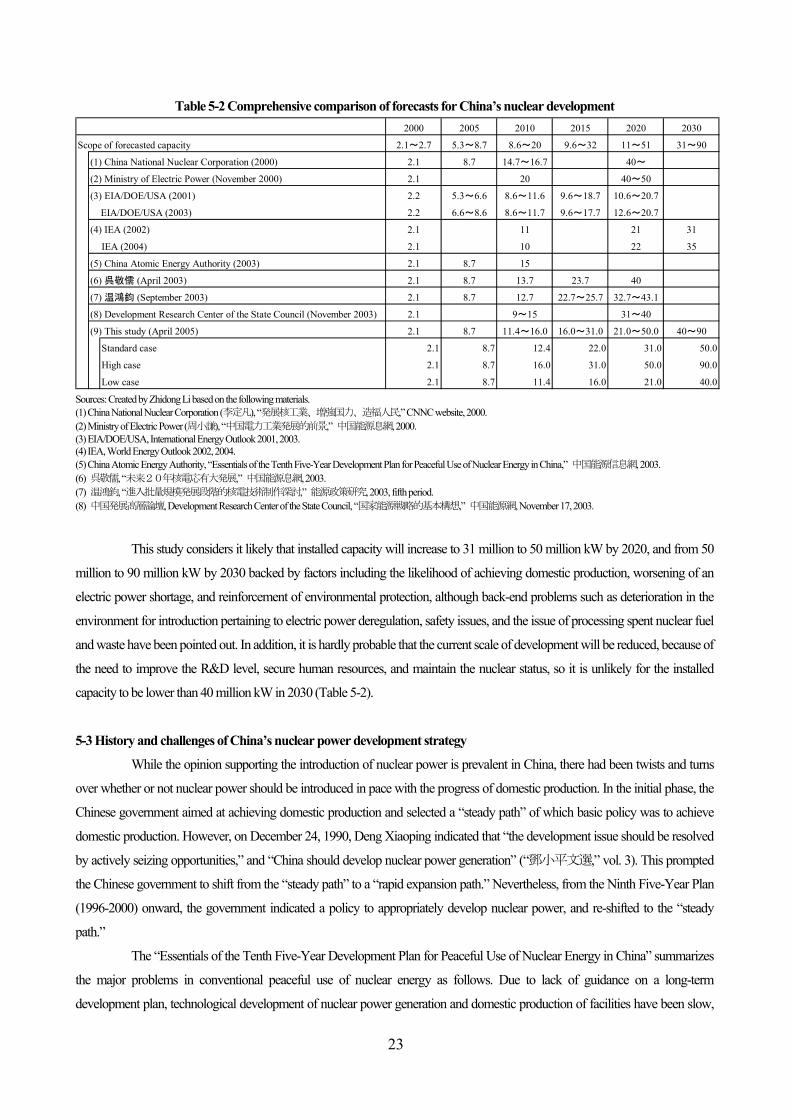
23
Table 5-2 Comprehensive comparison of forecasts for China’s nuclear development
Sources: Created by Zhidong Li based on the following materials. (1) China National Nuclear Corporation (李定凡), “発展核工業、増強国力、造福人民,” CNNC website, 2000. (2) Ministry of Electric Power (周小謙), “中国電力工業発展的前景,” 中国能源息網, 2000. (3) EIA/DOE/USA, International Energy Outlook 2001, 2003. (4) IEA, World Energy Outlook 2002, 2004. (5) China Atomic Energy Authority, “Essentials of the Tenth Five-Year Development Plan for Peaceful Use of Nuclear Energy in China,” 中国能源信息網, 2003. (6) 呉敬儒, “未来20年核電応有大発展,” 中国能源息網, 2003. (7) 温鴻鈞, “進入批量規模発展段階的核電技術制作深討,” 能源政策研究, 2003, fifth period. (8) 中国発展高層論壇, Development Research Center of the State Council, “国家能源戦略的基本構想,” 中国能源網, November 17, 2003.
This study considers it likely that installed capacity will increase to 31 million to 50 million kW by 2020, and from 50
million to 90 million kW by 2030 backed by factors including the likelihood of achieving domestic production, worsening of an
electric power shortage, and reinforcement of environmental protection, although back-end problems such as deterioration in the
environment for introduction pertaining to electric power deregulation, safety issues, and the issue of processing spent nuclear fuel
and waste have been pointed out. In addition, it is hardly probable that the current scale of development will be reduced, because of
the need to improve the R&D level, secure human resources, and maintain the nuclear status, so it is unlikely for the installed
capacity to be lower than 40 million kW in 2030 (Table 5-2).
5-3 History and challenges of China’s nuclear power development strategy
While the opinion supporting the introduction of nuclear power is prevalent in China, there had been twists and turns
over whether or not nuclear power should be introduced in pace with the progress of domestic production. In the initial phase, the
Chinese government aimed at achieving domestic production and selected a “steady path” of which basic policy was to achieve
domestic production. However, on December 24, 1990, Deng Xiaoping indicated that “the development issue should be resolved
by actively seizing opportunities,” and “China should develop nuclear power generation” (“鄧小平文選,” vol. 3). This prompted
the Chinese government to shift from the “steady path” to a “rapid expansion path.” Nevertheless, from the Ninth Five-Year Plan
(1996-2000) onward, the government indicated a policy to appropriately develop nuclear power, and re-shifted to the “steady
path.”
The “Essentials of the Tenth Five-Year Development Plan for Peaceful Use of Nuclear Energy in China” summarizes
the major problems in conventional peaceful use of nuclear energy as follows. Due to lack of guidance on a long-term
development plan, technological development of nuclear power generation and domestic production of facilities have been slow,
2000 2005 2010 2015 2020 2030
Scope of forecasted capacity 2.1~2.7 5.3~8.7 8.6~20 9.6~32 11~51 31~90
(1) China National Nuclear Corporation (2000) 2.1 8.7 14.7~16.7 40~
(2) Ministry of Electric Power (November 2000) 2.1 20 40~50
(3) EIA/DOE/USA (2001) 2.2 5.3~6.6 8.6~11.6 9.6~18.7 10.6~20.7
EIA/DOE/USA (2003) 2.2 6.6~8.6 8.6~11.7 9.6~17.7 12.6~20.7
(4) IEA (2002) 2.1 11 21 31
IEA (2004) 2.1 10 22 35
(5) China Atomic Energy Authority (2003) 2.1 8.7 15
(6) 呉敬儒 (April 2003) 2.1 8.7 13.7 23.7 40
(7) 温鴻鈞 (September 2003) 2.1 8.7 12.7 22.7~25.7 32.7~43.1
(8) Development Research Center of the State Council (November 2003) 2.1 9~15 31~40
(9) This study (April 2005) 2.1 8.7 11.4~16.0 16.0~31.0 21.0~50.0 40~90
Standard case 2.1 8.7 12.4 22.0 31.0 50.0
High case 2.1 8.7 16.0 31.0 50.0 90.0
Low case 2.1 8.7 11.4 16.0 21.0 40.0
24
the industry size is smaller and the technological level is behind that of developed countries. Also, because of a serious lack of
funds for basic research and technological development, the facilities are old and there is a notable outflow of human resources, so
there is a relatively large gap with other countries in terms of core technology. This can also be considered the main reason for
taking the “steady path” that emphasizes domestic production again.
On the other hand, though hardly any official documents squarely oppose to the introduction, there are views
emphasizing that the introduction should be considered more carefully (for example, 傅氷駿, Institute of Geology and
Geophysics, Chinese Academy of Sciences, December 19, 2002). According to these views, firstly, China has extremely high
potential for energy conservation (energy utilization efficiency is roughly 20% to 40% lower than that of developed countries) and
potential for development of renewable energy such as hydraulic power (hydraulic resource: 380 million kW; installed capacity in
2003: 90 million kW), so efforts should be made in these areas first. Secondly, nuclear power safety issues, particularly the
problem of the disposal of highly radioactive nuclear waste, remain unsolved. Thirdly, there is a need to reconsider whether or not
nuclear power generation will contribute to energy security. It cannot be denied that accidents and incidents such as hiding
problems could induce movements against nuclear power and bring about an electric power supply crisis. Fourthly, economical
efficiency of nuclear power generation has yet to be sufficiently established. In the case of Guangong, which has the Dayawan
nuclear power plant, the electric charge for nuclear power transmission is 0.53 to 0.54 yuan/kW, which is 32.5% to 35.0% higher
than the average charge for thermal power transmission of 0.40 yuan/kW (周 and 張, 1999; 王 and 他, 1999). A successful
domestic project, the Qinshan II nuclear power plant, boasts a record low transmission charge at 0.414 yuan/kW, but it is still
higher than coal-fired thermal power that uses desulfurization equipment (0.4 yuan/kW) (定軍, 2005). The Essentials of the Tenth
Five-Year Development Plan presents a target to lower the nuclear power transmission charge to a level that can compete with
coal-fired thermal power using desulfurization equipment in the coastal region. However, in the cost calculation process, it does
not take into consideration the cost for disposal of highly radioactive nuclear waste.
Many of the above indications also apply to nuclear power generation development in other countries as well, but for
late-comer China, these are all challenges that must be addressed seriously. It will become increasingly important for China, a
major energy consumer, to formulate an optimum nuclear power development plan that will overcome these problems and
contribute to resolving energy security problems and global environmental problems at the same time.
25
6. China’s comprehensive energy strategy and the Northeast Asian Energy Community The energy problems originating in China may not only undermine China’s foundation for sustainable development as
a matter concerning a single country, but could also become a threat to the international community. In order to prevent this
universal threat, China’s independent efforts are basically required, but cooperation of the international community is also
indispensable.
6-1 Obstacles for resolving the energy problems and the expected measures for independent efforts
In the Tenth Five-Year Plan, the Chinese government hammered out an energy strategy composed of four items: (i) to
diversify the energy supply and demand structure; (ii) to achieve energy security; (iii) to improve the energy utilization efficiency;
and (iv) to promote environmental protection. Furthermore, it has taken the following energy security measures: (i) to promote
domestic development of oil and natural gas, and maximize production; (ii) to import oil and natural gas from multiple countries in
order to reduce the supplier risks; (iii) to have Chinese companies participate in overseas resource development projects for oil and
natural gas, and promote the import of resources developed abroad by securing overseas resources; (iv) to improve the
transportation infrastructure for oil and natural gas; (v) to promote development of oil-alternative energy, mainly coal liquefaction
and fuel alcohols; and (vi) to improve the oil stockpiling system. Furthermore, in response to the electric power shortage and
concerns over coal supply in recent years, the National Development and Reform Commission (NDRC) formulated a draft of the
medium to long-term energy development plan (2004-2020) in June 2004, and gained the approval of the State Council. The plan
contains eight priority measures including attaching primary importance to energy conservation. Accordingly, the NDRC
formulated and announced a medium to long-term energy conservation plan (Chinese title: 節能中長期専項規劃) in November
2004 as a concrete plan for energy conservation.
These measures have all achieved results to a certain extent. In particular, notable success has been observed in
importing resources from multiple countries and conducting overseas development. The oil suppliers were diversified to about 40
countries and regions, and the dependence on Middle East oil is currently held down to 50% as a result. In addition, the overseas
development locations have expanded to 50 countries and regions. Meanwhile, efforts are presently being made with regard to
improvement of the stockpiling system and development of oil-alternative energy.
However, the above energy strategy and energy security measures were formulated in the absence of a government
office for comprehensive energy administration. From April 1993 to March 2003, energy administration had been jointly
undertaken by the National Development and Planning Commission, the State Economic and Trade Commission, the Ministry of
Science and Technology, the China Atomic Energy Authority, the Ministry of Agriculture, the Ministry of Land and Resources,
and the National Bureau of Statistics. In April 2003, administrative reform was implemented, and the Energy Bureau was set up in
the newly established NDRC. However, there is still no government office for comprehensive energy administration befitting a
country that is the world’s second largest energy consumer and the third largest energy supplier.
The absence of a government office for comprehensive energy administration may become an institutional hindrance
to resolving energy supply-and-demand problems and the related environmental problems (see 藩, September 2002; 呉, October
2002; and Andrews-Speed et al., 2002). Therefore, in order to resolve the problems, an administrative organ for comprehensive
energy control must be first set up to carry out comprehensive energy administration such as the establishment of statistical data
and formulation of supply-and-demand plans, as well as formulation, implementation, and supervision of energy strategies
centering on the energy security strategy in a centralized manner. Next, in formulating energy strategies, sufficient consideration
must be given to ensuring energy security, ensuring economical efficiency, and resolving environmental problems.
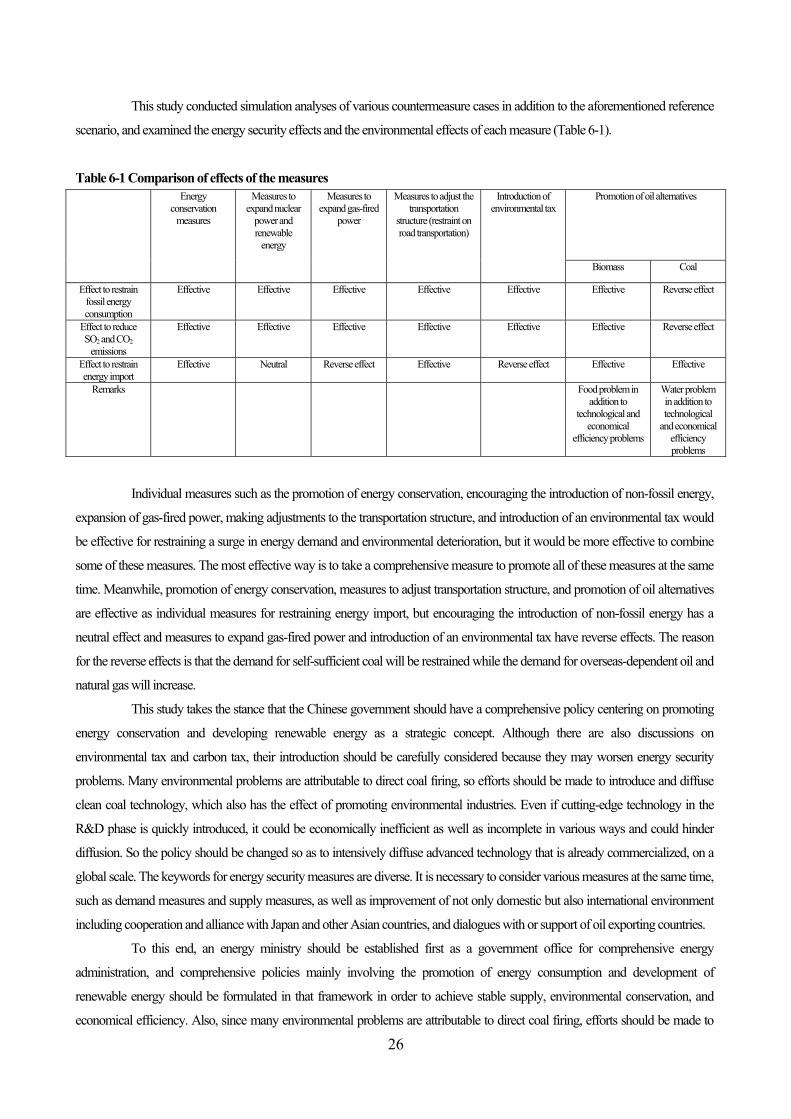
26
This study conducted simulation analyses of various countermeasure cases in addition to the aforementioned reference
scenario, and examined the energy security effects and the environmental effects of each measure (Table 6-1).
Table 6-1 Comparison of effects of the measures Promotion of oil alternatives Energy
conservation measures
Measures to expand nuclear
power and renewable
energy
Measures to expand gas-fired
power
Measures to adjust the transportation
structure (restraint on road transportation)
Introduction of environmental tax
Biomass Coal
Effect to restrain fossil energy consumption
Effective Effective Effective Effective Effective Effective Reverse effect
Effect to reduce SO2 and CO2
emissions
Effective Effective Effective Effective Effective Effective Reverse effect
Effect to restrain energy import
Effective Neutral Reverse effect Effective Reverse effect Effective Effective
Remarks Food problem in addition to
technological and economical
efficiency problems
Water problem in addition to technological
and economical efficiency problems
Individual measures such as the promotion of energy conservation, encouraging the introduction of non-fossil energy,
expansion of gas-fired power, making adjustments to the transportation structure, and introduction of an environmental tax would
be effective for restraining a surge in energy demand and environmental deterioration, but it would be more effective to combine
some of these measures. The most effective way is to take a comprehensive measure to promote all of these measures at the same
time. Meanwhile, promotion of energy conservation, measures to adjust transportation structure, and promotion of oil alternatives
are effective as individual measures for restraining energy import, but encouraging the introduction of non-fossil energy has a
neutral effect and measures to expand gas-fired power and introduction of an environmental tax have reverse effects. The reason
for the reverse effects is that the demand for self-sufficient coal will be restrained while the demand for overseas-dependent oil and
natural gas will increase.
This study takes the stance that the Chinese government should have a comprehensive policy centering on promoting
energy conservation and developing renewable energy as a strategic concept. Although there are also discussions on
environmental tax and carbon tax, their introduction should be carefully considered because they may worsen energy security
problems. Many environmental problems are attributable to direct coal firing, so efforts should be made to introduce and diffuse
clean coal technology, which also has the effect of promoting environmental industries. Even if cutting-edge technology in the
R&D phase is quickly introduced, it could be economically inefficient as well as incomplete in various ways and could hinder
diffusion. So the policy should be changed so as to intensively diffuse advanced technology that is already commercialized, on a
global scale. The keywords for energy security measures are diverse. It is necessary to consider various measures at the same time,
such as demand measures and supply measures, as well as improvement of not only domestic but also international environment
including cooperation and alliance with Japan and other Asian countries, and dialogues with or support of oil exporting countries.
To this end, an energy ministry should be established first as a government office for comprehensive energy
administration, and comprehensive policies mainly involving the promotion of energy consumption and development of
renewable energy should be formulated in that framework in order to achieve stable supply, environmental conservation, and
economical efficiency. Also, since many environmental problems are attributable to direct coal firing, efforts should be made to
27
introduce and diffuse clean coal technology, which also has the effect of promoting environmental industries. The keywords for
energy security measures are diverse. It is necessary to consider various measures at the same time, such as demand measures and
supply measures, as well as improvement of not only domestic but also international environment including cooperation and
alliance with Japan and other Asian countries, and dialogues with or support of oil exporting countries.
6-2 Northeast Asian Energy Community
International cooperation, particularly regional cooperation through the Northeast Asian Energy Community, would be
important in forecasting China’s future energy strategy. Northeast Asian countries are facing similar energy-related problems,
though there are differences in priority. Also, while Japan has the world’s most advanced energy conservation technology and
environmental technology as well as affluent funds, China has a comparative advantage in terms of market capacity, cost
competitiveness, and resources. It would benefit the entire region if the countries could make the most of their respective
advantages and cooperate to complement each other, and avoid the disputes over import through the east Siberian oil pipeline and
offshore gas development.
Figure 6-1 indicates the common energy-related problems facing Japan and China and the cooperative frameworks for
Japan and China, which are positioned as key countries in the Northeast Asian Energy Community. Important areas of
cooperation include cooperation in diffusion of clean coal technology, cooperation in promoting substitution of fossil energy by
renewable, and joint promotion of imports through the natural gas pipeline. Meanwhile, cooperation towards a stable supply of
energy and energy security includes establishment of a joint stockpiling system as well as joint development with and
development support of China, and cooperation toward resolving environmental problems includes transfer of pollution control
technology and joint development of CO2 recovery technology. The following section briefly examines the main areas of
cooperation.
(1) Cooperation in energy conservation
Energy conservation can contribute to resolving all problems by restraining consumption of fuel energy. Compared to
Japan, the energy utilization rate in China is low and its potential for energy conservation is high in almost all fields. Therefore,
there are expectations for Japan-China cooperation in areas centering on technology transfer, human resources development,
establishment of countermeasure systems, and institutional design. In the power generation field, a large energy conservation effect
could be expected if China liberalizes the market entry of independent power producers (IPP) and if Japan, which has technology
and funds, can independently operate thermal power plants in China.
(2) Cooperation in diffusion of clean coal technology (CCT)
Although China is the world’s largest coal producer and consumer, it lags behind in clean utilization of coal. On the
other hand, Japan, which faces resource constraints and environmental constraints, achieves the world-level CCT. Japan’s
cooperation with China in areas centering on technology transfer, technological development in China, and human resources
development will not only contribute to resolution of air pollution, cross-border acid rain pollution, and global warming through
restraint of coal consumption, it will also contribute to a stable supply of coal in Japan. In addition, since China has a large resource
of coal seam gas, Japan-China cooperation in development and utilization of such gas will have high potential and are extremely
beneficial for both countries. Furthermore, one way to reduce emissions of CO2, SOx, and pollutants throughout the Northeast
Asian region would be to reduce low-efficiency coal-fired power plants in China and expand cutting-edge coal-fired power
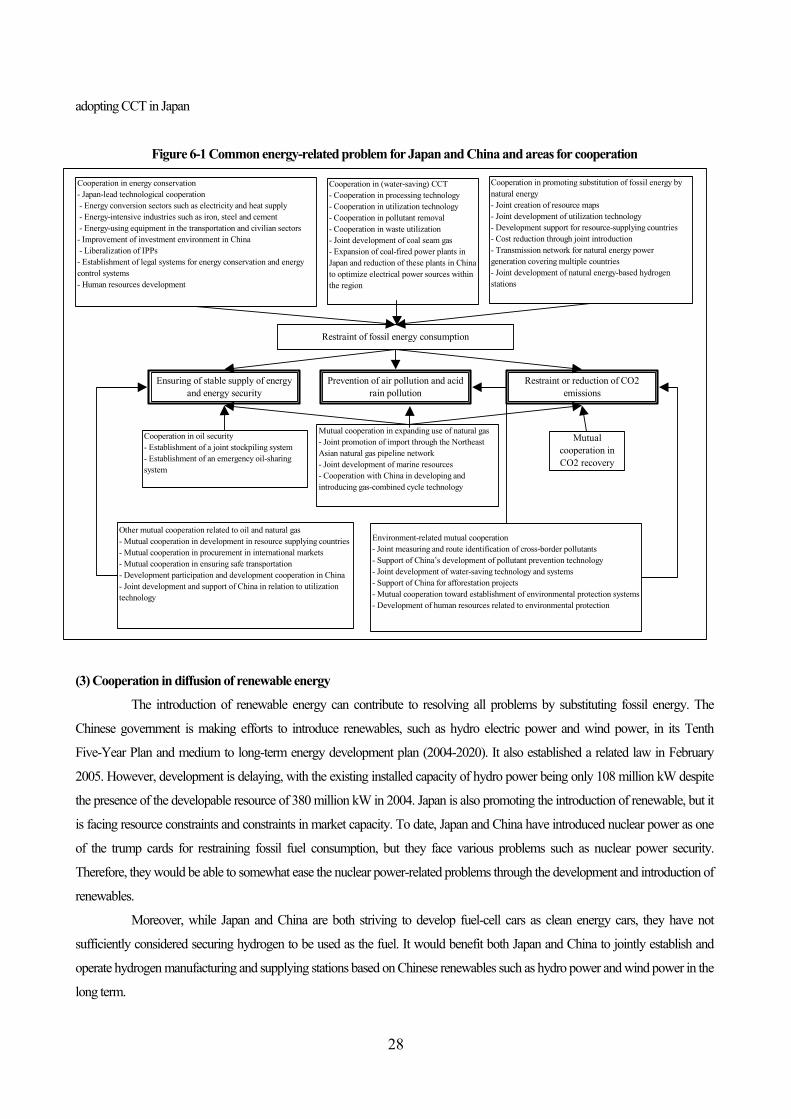
28
adopting CCT in Japan
Figure 6-1 Common energy-related problem for Japan and China and areas for cooperation
(3) Cooperation in diffusion of renewable energy
The introduction of renewable energy can contribute to resolving all problems by substituting fossil energy. The
Chinese government is making efforts to introduce renewables, such as hydro electric power and wind power, in its Tenth
Five-Year Plan and medium to long-term energy development plan (2004-2020). It also established a related law in February
2005. However, development is delaying, with the existing installed capacity of hydro power being only 108 million kW despite
the presence of the developable resource of 380 million kW in 2004. Japan is also promoting the introduction of renewable, but it
is facing resource constraints and constraints in market capacity. To date, Japan and China have introduced nuclear power as one
of the trump cards for restraining fossil fuel consumption, but they face various problems such as nuclear power security.
Therefore, they would be able to somewhat ease the nuclear power-related problems through the development and introduction of
renewables.
Moreover, while Japan and China are both striving to develop fuel-cell cars as clean energy cars, they have not
sufficiently considered securing hydrogen to be used as the fuel. It would benefit both Japan and China to jointly establish and
operate hydrogen manufacturing and supplying stations based on Chinese renewables such as hydro power and wind power in the
long term.
Cooperation in energy conservation- Japan-lead technological cooperation - Energy conversion sectors such as electricity and heat supply - Energy-intensive industries such as iron, steel and cement - Energy-using equipment in the transportation and civilian sectors- Improvement of investment environment in China - Liberalization of IPPs- Establishment of legal systems for energy conservation and energycontrol systems- Human resources development
Cooperation in (water-saving) CCT- Cooperation in processing technology- Cooperation in utilization technology- Cooperation in pollutant removal- Cooperation in waste utilization- Joint development of coal seam gas- Expansion of coal-fired power plants inJapan and reduction of these plants in Chinato optimize electrical power sources withinthe region
Cooperation in promoting substitution of fossil energy bynatural energy- Joint creation of resource maps- Joint development of utilization technology- Development support for resource-supplying countries- Cost reduction through joint introduction- Transmission network for natural energy powergeneration covering multiple countries- Joint development of natural energy-based hydrogenstations
Restraint of fossil energy consumption
Ensuring of stable supply of energyand energy security
Prevention of air pollution and acidrain pollution
Restraint or reduction of CO2emissions
Mutual cooperation in expanding use of natural gas- Joint promotion of import through the NortheastAsian natural gas pipeline network- Joint development of marine resources- Cooperation with China in developing andintroducing gas-combined cycle technology
Cooperation in oil security- Establishment of a joint stockpiling system- Establishment of an emergency oil-sharingsystem
Mutualcooperation inCO2 recovery
Other mutual cooperation related to oil and natural gas- Mutual cooperation in development in resource supplying countries- Mutual cooperation in procurement in international markets- Mutual cooperation in ensuring safe transportation- Development participation and development cooperation in China- Joint development and support of China in relation to utilizationtechnology
Environment-related mutual cooperation- Joint measuring and route identification of cross-border pollutants- Support of China’s development of pollutant prevention technology- Joint development of water-saving technology and systems- Support of China for afforestation projects- Mutual cooperation toward establishment of environmental protection systems- Development of human resources related to environmental protection
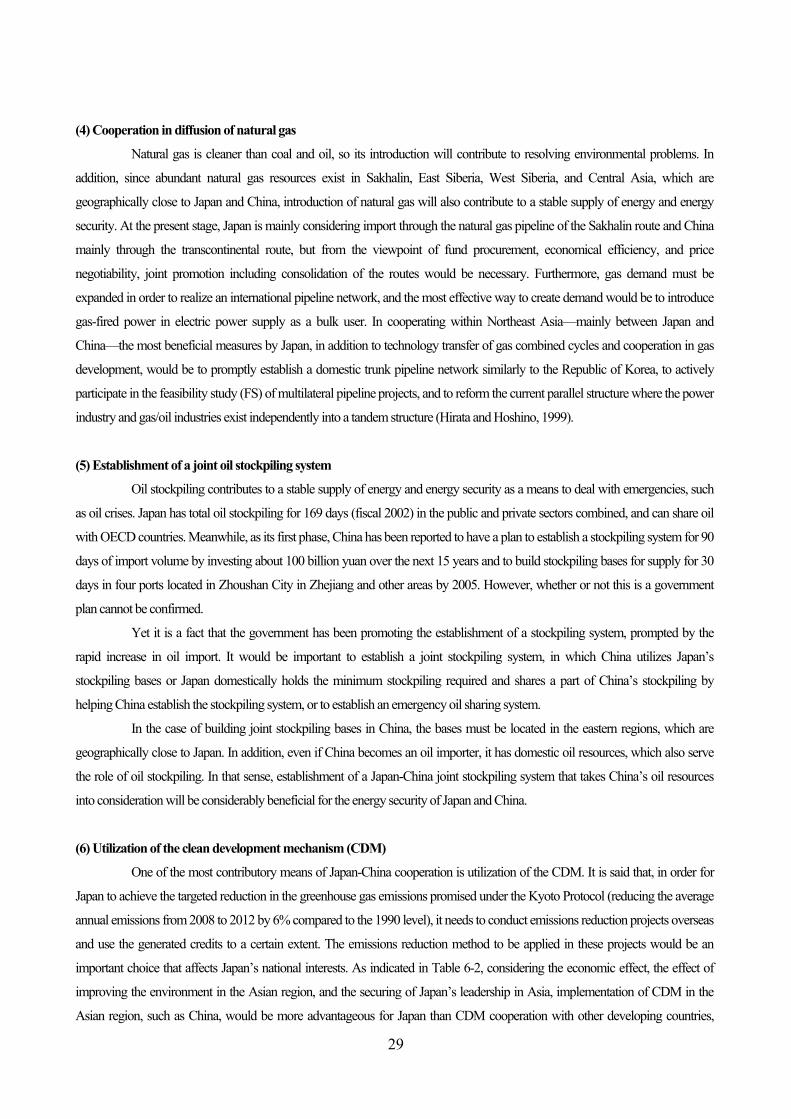
29
(4) Cooperation in diffusion of natural gas
Natural gas is cleaner than coal and oil, so its introduction will contribute to resolving environmental problems. In
addition, since abundant natural gas resources exist in Sakhalin, East Siberia, West Siberia, and Central Asia, which are
geographically close to Japan and China, introduction of natural gas will also contribute to a stable supply of energy and energy
security. At the present stage, Japan is mainly considering import through the natural gas pipeline of the Sakhalin route and China
mainly through the transcontinental route, but from the viewpoint of fund procurement, economical efficiency, and price
negotiability, joint promotion including consolidation of the routes would be necessary. Furthermore, gas demand must be
expanded in order to realize an international pipeline network, and the most effective way to create demand would be to introduce
gas-fired power in electric power supply as a bulk user. In cooperating within Northeast Asia—mainly between Japan and
China—the most beneficial measures by Japan, in addition to technology transfer of gas combined cycles and cooperation in gas
development, would be to promptly establish a domestic trunk pipeline network similarly to the Republic of Korea, to actively
participate in the feasibility study (FS) of multilateral pipeline projects, and to reform the current parallel structure where the power
industry and gas/oil industries exist independently into a tandem structure (Hirata and Hoshino, 1999).
(5) Establishment of a joint oil stockpiling system
Oil stockpiling contributes to a stable supply of energy and energy security as a means to deal with emergencies, such
as oil crises. Japan has total oil stockpiling for 169 days (fiscal 2002) in the public and private sectors combined, and can share oil
with OECD countries. Meanwhile, as its first phase, China has been reported to have a plan to establish a stockpiling system for 90
days of import volume by investing about 100 billion yuan over the next 15 years and to build stockpiling bases for supply for 30
days in four ports located in Zhoushan City in Zhejiang and other areas by 2005. However, whether or not this is a government
plan cannot be confirmed.
Yet it is a fact that the government has been promoting the establishment of a stockpiling system, prompted by the
rapid increase in oil import. It would be important to establish a joint stockpiling system, in which China utilizes Japan’s
stockpiling bases or Japan domestically holds the minimum stockpiling required and shares a part of China’s stockpiling by
helping China establish the stockpiling system, or to establish an emergency oil sharing system.
In the case of building joint stockpiling bases in China, the bases must be located in the eastern regions, which are
geographically close to Japan. In addition, even if China becomes an oil importer, it has domestic oil resources, which also serve
the role of oil stockpiling. In that sense, establishment of a Japan-China joint stockpiling system that takes China’s oil resources
into consideration will be considerably beneficial for the energy security of Japan and China.
(6) Utilization of the clean development mechanism (CDM)
One of the most contributory means of Japan-China cooperation is utilization of the CDM. It is said that, in order for
Japan to achieve the targeted reduction in the greenhouse gas emissions promised under the Kyoto Protocol (reducing the average
annual emissions from 2008 to 2012 by 6% compared to the 1990 level), it needs to conduct emissions reduction projects overseas
and use the generated credits to a certain extent. The emissions reduction method to be applied in these projects would be an
important choice that affects Japan’s national interests. As indicated in Table 6-2, considering the economic effect, the effect of
improving the environment in the Asian region, and the securing of Japan’s leadership in Asia, implementation of CDM in the
Asian region, such as China, would be more advantageous for Japan than CDM cooperation with other developing countries,
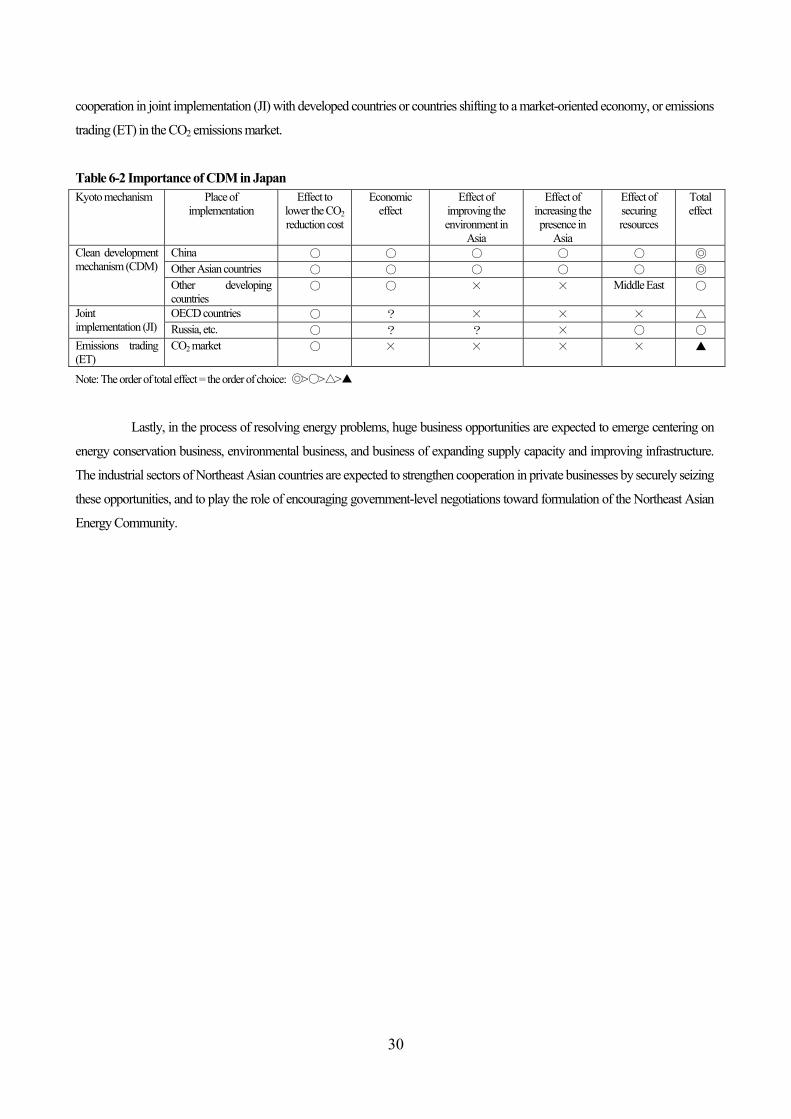
30
cooperation in joint implementation (JI) with developed countries or countries shifting to a market-oriented economy, or emissions
trading (ET) in the CO2 emissions market.
Table 6-2 Importance of CDM in Japan Kyoto mechanism Place of
implementation Effect to
lower the CO2 reduction cost
Economic effect
Effect of improving the environment in
Asia
Effect of increasing the presence in
Asia
Effect of securing resources
Total effect
China ○ ○ ○ ○ ○ ◎ Other Asian countries ○ ○ ○ ○ ○ ◎
Clean development mechanism (CDM)
Other developing countries
○ ○ × × Middle East ○
OECD countries ○ ? × × × △ Joint implementation (JI) Russia, etc. ○ ? ? × ○ ○ Emissions trading (ET)
CO2 market ○ × × × × ▲
Note: The order of total effect = the order of choice: ◎>○>△>▲
Lastly, in the process of resolving energy problems, huge business opportunities are expected to emerge centering on
energy conservation business, environmental business, and business of expanding supply capacity and improving infrastructure.
The industrial sectors of Northeast Asian countries are expected to strengthen cooperation in private businesses by securely seizing
these opportunities, and to play the role of encouraging government-level negotiations toward formulation of the Northeast Asian
Energy Community.
31
<Bibliography> China Oil, Gas & Petrochemicals EIA/DOE/USA, International Energy Outlook IEA, World Energy Outlook. Paris, OECD/IEA IEA, Energy Balances of Non-OECD Countries. Paris, OECD/IEA Li Zhidong, China’s Energy-related Issues: Implications for Regional and Inter-regional Coorperation. Francois Godement,
Francoise Nicolas, Taizo Yakushiji (edited), Asia and Europe Coorperating for Energy Security, ifri, Paris, 2004.
Philip Andrews-Speed, Xuanli Liao and Roland Dannreuther, the Strategic Implications of China’s Energy Needs, Oxford University
Press, 2002.
Zhao Renkai,「Present Status and Prospects of Nuclear Power Development in China」 9th Pacific Basin Nuclear Conference, Sydney,Australia,1-6 May 1994.
中国国家発展改革委員会HP(http://www.sdpc.gov.cn/) 中国国家原子能機構HP(http://www.caea.gov.cn/) 中国核工業集団公司HP(http://www.cnnc.com.cn/) 中国能源網(http://www.china5e.com.cn/) 中国電動汽車網(http://www.chinaev.org/) 伊藤浩吉、李志東、小宮山涼一『アジア/世界エネルギーアウトルック:急成長するアジア経済と変化するエネルギー需給構造』、財団
法人日本エネルギー経済研究所,2004年3月. 王慶一編『中国能源』冶金工業出版社,1988年. 王良友・他「“西電東送”市場需給予測分析」国家電力公司『中国電力市場分析与研究1999年』中国電力出版社,1999年. 温鴻鈞「進入批量規模発展階段的核電技術政策探討」,能源政策研究,2003年第5号. 厳緒朝・楊景民『為21世紀中国加油:中国石油工業提昇国際競争力報告』企業管理出版社,2000/11. 顧樹華・劉鴻鵬(国家経済貿易委員会資源節約と総合利用司)主編『新能源と可再生能源産業発展規劃2000-2015年』中国経済出版社、2001/4。
呉吟「我が国エネルギー管理体制に関する思考」『中国能源』2002年第10期. 呉敬儒「未来20年核電応有大発展」,2003年,中国能源網.
賈文瑞・徐青・王燕灵「中国2020年GDP3倍増目標下の石油天然ガス工業発展戦略」『中国能源』2003年第7期.
国務院発展研究Center中国発展高層論壇(馮飛・周鳳起・王慶一)「国家能源戦略的基本構想」,2003/11. 国家環境保護局「中国環境状況公報」各年版. 国家統計局『中国統計年鑑』各年版,中国統計出版社. 朱宝芝・他「十五期間我国能源交通発展思路与生産力布局研究」,1999年,中国能源網. 周家麟・張一心「広東核電的現状与発展戦略」,(推定)1999年,中国能源網. 周小謙「中国電力工業発展的前掲」,2000年,中国能源網. 周鳳起・周大地主編『中国中長期能源発展戦略』中国計画出版社,1999年2月. 蒋心雄「核工業的歴史性跨越:記念党的十一届三中全会召開20周年」,中国核工業報,1998年12月16日. 石丁「専家称北山是世界上最理想的核廃棄物庫址之一」,2003年4月25日,中国能源網. 宋任窮・他「中国核工業創建40周年的光輝歴程」,中国核工業報,1995年1月9日. 中国工程院能源項目組『中国可持続発展能源戦略研究總報告初稿』1997年.
中国社会科学院環境と発展研究 Center『中国と環境発展評論第1巻』社会科学文献出版社,2001年.
中国能源戦略研究課題組『中国能源戦略研究(2000~2050年)』中国電力出版社,1996年. 中国能源研究会・国家電力公司戦略研究と企画部『中国能源五十年』中国電力出版社、2002/1. 丁燕「国産化的抉択」,2002年4月24日,中国能源網.
定軍「核電棋局」2005/4/1,中国能源網.
鄧小平「善于利用時機解決発展問題」,1990年12月24日,『鄧小平文選』第3巻. 趙人偉・李実・李思勤『中国居民収入分配再研究』,中国財政経済出版社,2000. 陳宗勝・周雲波「非法非正常収入対居民収入差別的影響及其経済学解釈」,経済研究,2001年第4期. 日本エネルギー経済研究所計量分析部『エネルギー経済統計要覧』各年版,省エネルギーセンター.
日本原子力産業会議『世界の原子力発電開発の年次報告』各年版. 日本『自動車産業 Handbook2000年』. 藩偉爾「我が国エネルギー管理体制問題に関する討論」『中国能源』2002年第9期. 平田賢・星野進保「日本のエネルギー選択」『NIRA政策研究』,1999年,VOL.12,NO.6. 傅氷駿「核電是一種安全清潔的能源嗎?」,2002年,中国能源網. 李志東「中国の高度経済成長の陰に潜むエネルギー・環境問題」『エネルギー経済』第29巻第3号(2003年夏季号). 李志東「中国における原子力発電開発の現状と中長期展望」『エネルギー経済』第29巻第3号(2003年夏季号). 李志東「第2章:中国のエネルギー・環境の動向」,田辺靖雄編著『アジアエネルギーパートナーシップ』エネルギーフォーラム,2004/11. 李永江「加快我国核電国産化建設的歩伐」,2003年3月7日,中国能源網. 李定凡「努力開創核工業改革発展的新局面」,1999年,中国核工業集団公司HP. 李定凡「発展核工業、増強国力、造福人民」,(推定)2000年,中国核工業集団公司HP. 梁優彩「中国経済発展的回顧与展望」2003/12/7,日中3E研究プロジェクトWS、IEEJ. 魯志強・熊賢良「対我国核電産業発展戦略和政策的建議」,(推定)2000年,中国能源網.