Embed Size (px)
Citation preview

ENERGY DEMANDS ON
WATER RESOURCES
REPORT TO CONGRESS ON THE INTERDEPENDENCY OF ENERGY AND WATER
U.S. DEPARTMENT OF ENERGY
DECEMBER 2006

2

3
PREFACE This report has been prepared in response to a letter to the Secretary of Energy from the chairmen and ranking members of the House and Senate Subcommittees on Energy and Water Development Appropriations, dated December 9, 2004, wherein they asked for:
“a report to Congress on the interdependency of energy and water focusing on threats to national energy production resulting from limited water supplies, utilizing where possible the multi-laboratory Energy-Water Nexus Committee.”
The report presents background information on the connections between energy and water, identifies concerns regarding water demands of energy production, and discusses science and technologies to address water use and management in the context of energy production and use.

4
CONTENTS
Executive Summary ........................................................................................................ 9 Chapter I. Energy and Water Are Essential, Interdependent Resources...................... 13 Chapter II. Supplying Energy Requires Water and Impacts Water Quality................... 17
Water Use for Thermoelectric Power Generation ....................................................... 18 Water Use for Hydroelectric Power Generation.......................................................... 19 Water Use for Energy Extraction and Fuel Production ............................................... 20 Water Produced During Energy Extraction ................................................................. 21 Energy Impacts on Water Quality ............................................................................... 21
Chapter III. Supplying Water Requires Energy............................................................. 25
Supply and Conveyance............................................................................................. 25 Treatment and Distribution ......................................................................................... 26 End Use of Water ....................................................................................................... 26 Future Energy Demand for Water Supply and Treatment .......................................... 27
Chapter IV. Water Shortages and Impacts on Energy Infrastructure ........................... 29
Water Management Challenges ................................................................................. 31 Surface Water Concerns ............................................................................................ 32 Groundwater Concerns .............................................................................................. 32 Potential Impact of Future Power Generation on Water Supplies............................... 33
Chapter V. Opportunities to Secure America’s Energy and Water Future.................... 37
Addressing Future Water Needs in the Power Sector ................................................ 37 Addressing Water Needs in the Emerging Fuel Sector .............................................. 43 Addressing Future U.S. Water Needs ........................................................................ 45
Chapter VI. Addressing Critical Energy-Water Challenges: Bridging the Gaps............ 49
Collaboration on Critical Resource Planning .............................................................. 49 Science and System-Based Natural Resource Policies and Regulations................... 49 Energy-Water Infrastructure Synergies ...................................................................... 49 Bridging the Gaps: Direction and Implementation ...................................................... 50
Appendix A: Water Use in Energy Extraction, Processing, Storage, and
Transportation ............................................................................................................ 53 Appendix B: Water Use in Electrical Power Generation ............................................... 63 References and Bibliography ........................................................................................ 71

5
Figures
Figure I-1. Examples of Interrelationships Between Water and Energy ..................................................................13 Figure I-2. Water Shortages and Population Growth. ..............................................................................................15 Figure II-1. Estimated Freshwater Withdrawals by Sector, 2000..............................................................................18 Figure II-2. Open-Loop Cooling System...................................................................................................................18 Figure II-3. Closed-Loop Cooling System ................................................................................................................19 Figure II-4. Estimated Freshwater Consumption by Sector, 1995.............................................................................19 Figure II-5. U.S. Hydropower Production .................................................................................................................19 Figure II-6. Forecast for Produced Water (Wp) from Oil and Gas Extraction ..........................................................22 Figure III-1. Percent of U.S. Electricity Consumption by Sector ...............................................................................25 Figure III-2. Per Capita Energy Use for Water Supply and Wastewater Treatment in 2000
and Projected for 2050. ..........................................................................................................................26 Figure IV-1. Survey of Likely Water Shortages over the Next Decade under Average Conditions...........................29 Figure IV-2. Examples of Energy-Water Conflicts ....................................................................................................30 Figure IV-3. Trends in Total Freshwater Withdrawals, 1950–2000...........................................................................31 Figure IV-4. Comparison of Regional Thermoelectric Generation Capacity by North American Electric Reliability Council Region, 1995–2025...................................................................34 Figure IV-5. Projected Steam-Electric Generation Capacity by Type Projected from EIA Reference Case..............35 Figure IV-6. Range of Projected Daily Freshwater Withdrawal for Thermoelectric Power Generation ....................36 Figure IV-7. Range of Projected Freshwater Consumption for Thermoelectric Power Generation ...........................36 Figure V-1. Water Withdrawal for Power Generation...............................................................................................39 Figure V-2. Water Consumption for Power Generation ............................................................................................39 Figure V-3. Peak Reduction from Combined Use of Solar Energy and Demand Management in a
Residential Application..........................................................................................................................42 Figure V-4. Water Consumption Per-Unit-Energy and Current Water Use for Fuel Extraction and Processing ......44 Figure V-5. Degraded Water Resources of the U.S...................................................................................................46 Figure V-6. Energy Requirements for Water Desalination .......................................................................................47 Figure V-7. U.S. Oil and Gas Resources. ..................................................................................................................48
Tables
Table II-1. Connections Between the Energy Sector and Water Availability and Quality........................................17 Table III-1. Energy Requirements for Water Supply and Treatment in California ....................................................25 Table IV-1. Examples of Declining Groundwater Levels ..........................................................................................33 Table V-1. Water Intensity for Various Power Generation Technologies.................................................................38

6
Acronyms
API American Petroleum Institute
AwwaRF Awwa Research Foundation
bbl barrel
boe barrel of oil equivalent
CEC California Energy Commission
DOE U.S. Department of Energy
EERE Office of Energy Efficiency and Renewable Energy, U.S. Department of Energy
EIA Energy Information Administration, U.S. Department of Energy
EOR Enhanced Oil Recovery
EPRI Electric Power Research Institute
EST Eastern Standard Time
FE Office of Fossil Energy, U.S. Department of Energy
ft feet
FY fiscal year
gal gallons
GAO General Accounting Office
GW gigawatt
IGCC Integrated Gasification Combined Cycle
kW kilowatt
kWh kilowatt-hour
LNG Liquefied Natural Gas
MGD million gallons per day
MMbbls million barrels
MMBtu Million British Thermal Units
MTBE methyl tertiary-butyl ether
MW megawatt
MWh Megawatt-hour
MWhe Megawatt-hour of electric energy
MWht Megawatt-hour of thermal energy
NETL National Energy Technology Laboratory

7
NCPA Northern California Power Authority
NGCC Natural Gas Combined Cycle
PV Photovoltaic
PNM Public Service Company of New Mexico
psi pound per square inch
RFA Renewable Fuels Association
SWAQ Subcommittee on Water Availability and Quality
TVA Tennessee Valley Authority
USDA United States Department of Agriculture
USGS United States Geological Survey
Wp water produced
WW wastewater
yr year

8

9
Executive Summary
For the past century, America has invested significant research, development, and con-struction funding to develop both fresh sur-face-water and groundwater resources. The result is a water infrastructure that allows us to harness the vast resources of the country’s rivers and watersheds, control floods, and store water during droughts to provide re-liable supplies of freshwater for agricultural, industrial, domestic, and energy uses. Dur-ing this same period, the U.S. developed extensive natural resources such as coal, oil, natural gas, and uranium and created an infrastructure to process and transport these resources in an efficient and cost-effective manner to consumers. These two achieve-ments have helped stimulate unprecedented economic growth and development. However, as population has increased, de-mand for energy and water has grown. Competing demands for water supply are affecting the value and availability of the resource. Operation of some energy facili-ties has been curtailed due to water con-cerns, and siting and operation of new en-ergy facilities must take into account the value of water resources. U.S. efforts to re-place imported energy supplies with non-conventional domestic energy sources have the potential to further increase demand for water. Energy Demands on Water Resources re-sponds to a Congressional directive within a letter to the Secretary of Energy from the chairmen and ranking members of the House and Senate Subcommittees on Energy and Water Development Appropriations, dated December 9, 2004, wherein they asked for “a report on energy and water interdepend-encies, focusing on threats to national en-ergy production that might result from lim-ited water supplies.”
This report draws on the work of the multi-laboratory Energy-Water Nexus committee as well as reports and papers from research-ers in other federal agencies and elsewhere. ENERGY AND WATER INTER-DEPENDENCIES Water is an integral element of energy re-source development and utilization. It is used in energy-resource extraction, refining and processing, and transportation. Water is also an integral part of electric-power gen-eration. It is used directly in hydroelectric generation and is also used extensively for cooling and emissions scrubbing in thermo-electric generation. For example, in calen-dar year 2000, thermoelectric power gen-eration accounted for 39 percent of all fresh-water withdrawals in the U.S., roughly equivalent to water withdrawals for irrigated agriculture (withdrawals are water diverted or withdrawn from a surface-water or groundwater source) (Hutson et al., 2004). Water withdrawal statistics for thermo-electric power are dominated by power plants that return virtually all the withdrawn water to the source. While this water is returned at a higher temperature and with other changes in quality, it becomes available for further use. Many power plants, including most of those built since 1980, withdraw much less water but con-sume most of what they withdraw by evap-orative cooling. In 1995, agriculture accounted for 84 percent of total freshwater consumption. Thermoelectric power accounted for 3.3 percent of total freshwater consumption (3.3 billion gallons per day) and represented over 20 percent of nonagricultural water consumption (Solley et al., 1998).

10
The Energy Information Administration (EIA) projects, assuming the latest Census Bureau projections in its reference case, the U.S. population to grow by about 70 million in the next 25 years and electricity demand to grow by approximately 50 percent (EIA, 2006). The EIA reference case is a projection which assumes that current laws, regulations, policies, technological progress and consumer preferences continue through the projection period as they have in the past. The EIA reference case provides a use-ful baseline against which possible changes to these assumptions can be evaluated. Much of this growth is expected to occur in the Southeast, Southwest, and Far West, where water is already in limited supply. In a business-as-usual scenario, consump-tion of water in the electric sector could grow substantially, though increased de-mand for water would provide an incentive for technologies that reduce water use, thus dampening the increase in water use. Tech-nologies are available that can reduce water use in the electric sector, including alterna-tive cooling for thermoelectric power plants, wind power, and solar photovoltaics, but cost and economics, among other factors, have limited deployment of these technolo-gies. In contrast, water use in the extraction and processing of transportation fuels is rela-tively small. However, as the U.S. seeks to replace imported petroleum and natural gas with fuels from domestic sources, such as biofuels, synfuel from coal, hydrogen, and possibly oil shale, the demand for water to produce energy fuels could grow signifi-cantly. Growth in energy demand occurs when freshwater resources and overall freshwater availability become strained from limitations on supply and increasing domestic, agricultural, and environmental demands. Few new reservoirs have been built since 1980, and fresh surface-water withdrawals
have leveled off at about 260 billion gallons per day. Many regions depend on groundwater to meet increasing water de-mands, but declining groundwater tables could severely limit future water availabil-ity. Some regions have seen groundwater levels drop as much as 300 to 900 feet over the past 50 years because of the pumping of water from aquifers faster than the natural rate of recharge. A 2003 General Account-ing Office study showed that most state wa-ter managers expect either local or regional water shortages within the next 10 years un-der average climate conditions (GAO, 2003). Under drought conditions, even more severe water shortages are expected. Depending on the water quality needs for particular applications, freshwater supplies can be augmented with degraded or brackish water. Water quantities available for use are dependent on the water qualities needed for each use. Increased use of brackish or de-graded water may be required in some areas if water users can accept the quality limita-tions or can afford the cost of energy and infrastructure for water treatment. ENERGY DEMANDS ON WATER RESOURCES These trends in energy use, water availabil-ity, and water demand suggest that the U.S. will continue to face issues related to the development, utilization, and management of the critical resources of water and energy. Increasing population will increase demand for water for direct use as well as for energy and agriculture. Historically, water with-drawals for domestic supplies have grown at about the same rate as the population, though recent trends show that rate growing about half the rate of population growth be-cause of the implementation of water con-servation measures in many regions (Hutson et al., 2004; GAO, 2003). If new power plants continue to be built with evaporative cooling, consumption of water for electrical energy production could more than double by 2030 from 3.3 billion gallons per day in

11
1995 to 7.3 billion gallons per day (Hoff-mann et al., 2004). Consumption by the electric sector alone could equal the entire country’s 1995 domestic water consumption. Consumption of water for extraction and production of transportation fuels from domestic sources also has the potential to grow substantially. Meanwhile, climate concerns and declines in groundwater levels suggest that less fresh-water, not more, may be available in the future. Therefore, the U.S. should carefully con-sider energy and water development and management so that each resource is used according to its full value. Since new tech-nologies can reduce water use, there will be a great incentive for their development by the public and private sectors. Given current constraints, many areas of the country will have to meet their energy and water needs by properly valuing each resource, rather than following the current U.S. path of largely managing water and energy sepa-rately while making small improvements in freshwater supply and small changes in energy and water-use efficiency. FEDERAL ROLES IN MEETING ENERGY-WATER CHALLENGES While regulation of electric and water utili-ties and resource allocations is primarily a state or local responsibility, federal agencies such as the Bureau of Reclamation manage some of our largest energy and water re-sources in cooperation with state and local entities. Expansion of this cooperation could improve the country’s ability to address these energy challenges. Collaboration on Resource Planning – Collaboration on energy and water resource planning is needed among federal, regional, and state agencies as well as with industry and other stakeholders. In most regions, energy planning and water planning are
done separately. The lack of integrated energy and water planning and management has already impacted energy production in many basins and regions across the country. For example, in three of the fastest growing regions in the country, the Southeast, Southwest, and the Northwest, new power plants have been opposed because of potential negative impacts on water supplies (Tucson Citizen, 2002; Reno-Gazette Journal, 2005; U.S. Water News Online, 2002 and 2003; Curlee, 2003). Also, recent droughts and emerging limitations of water resources have many states, including Texas, South Dakota, Wisconsin, and Tennessee, scrambling to develop water use priorities for different water use sectors (Clean Air Task Force, 2004a; Milwaukee Journal Sentinel, 2005; GAO, 2003; Curlee, 2003; Hoffman, 2004; U.S. Water News Online, 2003). Also see Chapter IV, Figure IV-2 for other examples. Mechanisms, such as regional natural re-sources planning groups, are needed to fos-ter collaboration between stakeholders and regional and state water and energy plan-ning, management, and regulatory groups and agencies. These collaborative efforts are needed to ensure proper evaluation and valuation of water resources for all needs, including energy development and genera-tion. Science and System-Based Natural Resource Policies and Regulations – Often, polices or regulations developed to support or enhance one area, such as in-creasing domestic energy supplies through enhanced oil recovery (EOR), could have unintended negative impacts on regional or national freshwater availability or water quality. System-level evaluations by stake-holders and government agencies can be used to assess the impact of current or pro-posed natural resource policies and regula-tions and improve future energy development and water availability.

12
Energy Water Infrastructure Synergies – When the energy infrastructure is evaluated in a system context, significant improve-ments in energy and water conservation can often be realized through implementation of innovative processes or technologies, co-location of energy and water facilities, or improvements to energy and water infra-structures. Past investments in the water infrastructure by creating dams and surface-water reservoirs in the U.S. over the past 80 years have significantly improved the avail-ability of water for some applications and decreased its availability for other applica-tions. There will continue to be competition for water resources between different users, and ways to reduce these conflicts through coordinated infrastructure development would be beneficial. ADDRESSING THE CHALLENGES Available surface water supplies have not increased in 20 years, and groundwater tables and supplies are dropping at an alarm-ing rate. New ecological water demands and changing climate could reduce available freshwater supplies even more. At the same time, populations continue to grow and move to areas with already limited water supplies. The growing competition of water availability for energy production and electric-power generation has already been documented in many river basins. Possible changes in energy strategies in the electricity or transportation sectors could put an even larger burden on freshwater supplies and consumption. As a result, the value of water may increase, impacting energy costs and providing incentives for developing and implementing approaches to decrease the water intensity of the energy sector. While there have been significant improvements in water-use and energy-use efficiency and conservation, market and political (e.g., state) forces will continue to expand these efforts to meet the growing energy and water demands.
Two reports currently under development, the Subcommittee on Water Availability and Quality (SWAQ) strategic plan for federal science and technology to support water availability and quality, and the Department of Energy's Energy-Water Science and Technology Research Roadmap, will pro-vide insight into emerging energy-water challenges. The two efforts are independent but closely related. The SWAQ was established in 2003 under the National Science and Technology Council Committee on Environment and Natural Resources and is comprised of the 25 federal agencies with responsibility for the science and technology of water avail-ability and quality. Their role is to coordi-nate a multiyear plan to improve research to understand the processes that control water availability and quality, and to collect and make available the data needed to ensure an adequate water supply for the Nation’s fu-ture. Many of the energy and water interde-pendencies and challenges identified in this report to Congress fall within the SWAQ charter and should be considered by the SWAQ. Congress provided funding in fiscal year (FY) 2005 for the U.S. Department of Energy (DOE) to initiate an Energy-Water Science and Technology Research Roadmap. The Roadmap process started in August 2005 and will be completed by the end of 2006. By the end of 2006, the combined efforts of the SWAQ and the Energy-Water Science and Technology Research Roadmap efforts should provide a detailed understanding of the major energy-water interdependencies, issues, needs, and challenges across the country. The results and conclusions from these efforts should be considered to help guide programs and approaches to address emerging energy and water challenges.

13
Chapter I. Energy and Water Are Essential, Interdependent Resources A strategic goal of the United States Department of Energy is
Promoting America’s energy security through reliable, clean, and affordable energy (USDOE, 2006a).
The availability of adequate water supplies has an impact on the availability of energy, and energy production and generation ac-tivities affect the availability and quality of water. In today’s economies, energy and water are linked, as illustrated in Figure I-1. Each requires the other. As these two re- sources see increasing demand and growing
limitations on supply, energy and water must begin to be managed together to main-tain reliable energy and water supplies. The interaction of energy and water supplies and infrastructures is becoming clearer. Low water levels from drought and com-peting uses have limited the ability of power plants to generate power (Columbia Basin News, 2006; also see Chapter IV, Figure IV-2). Additionally, water levels in aquifers in many regions of the U.S. have declined sig-nificantly, increasing energy requirements for pumping, and, in some cases, leading to ground subsidence issues.
Figure I-1. Examples of Interrelationships Between Water and Energy
14
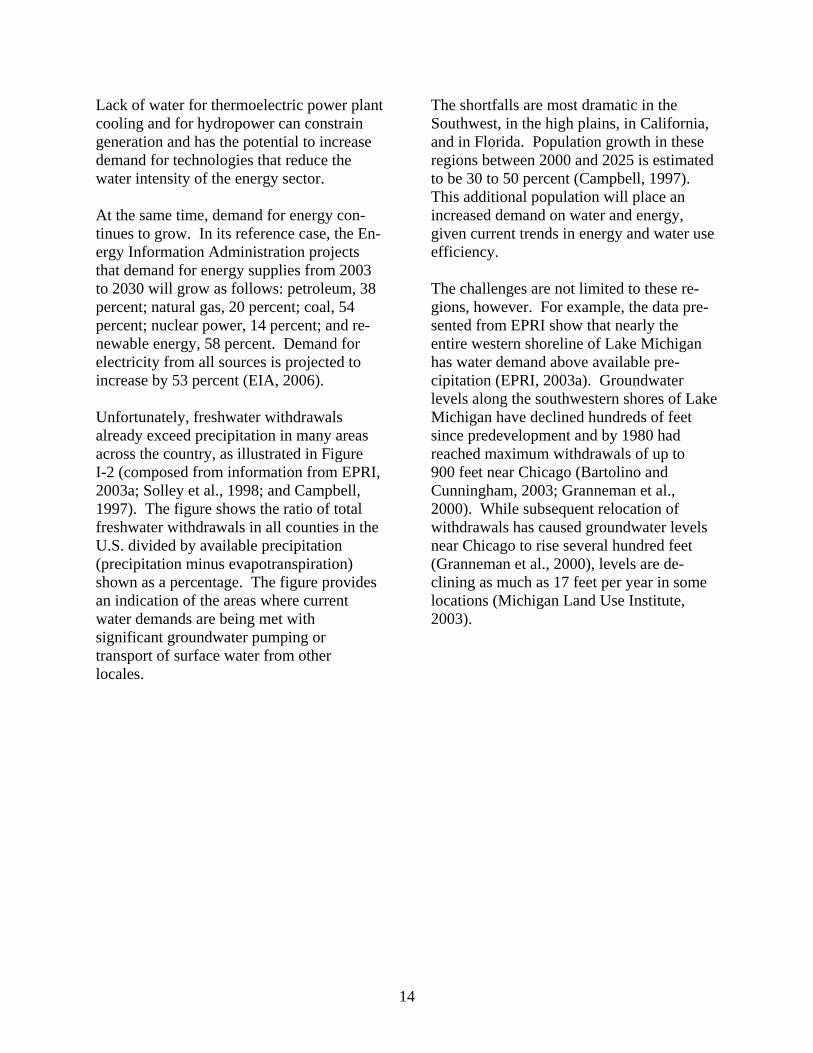
Lack of water for thermoelectric power plant cooling and for hydropower can constrain generation and has the potential to increase demand for technologies that reduce the water intensity of the energy sector. At the same time, demand for energy con-tinues to grow. In its reference case, the En-ergy Information Administration projects that demand for energy supplies from 2003 to 2030 will grow as follows: petroleum, 38 percent; natural gas, 20 percent; coal, 54 percent; nuclear power, 14 percent; and re-newable energy, 58 percent. Demand for electricity from all sources is projected to increase by 53 percent (EIA, 2006). Unfortunately, freshwater withdrawals already exceed precipitation in many areas across the country, as illustrated in Figure I-2 (composed from information from EPRI, 2003a; Solley et al., 1998; and Campbell, 1997). The figure shows the ratio of total freshwater withdrawals in all counties in the U.S. divided by available precipitation (precipitation minus evapotranspiration) shown as a percentage. The figure provides an indication of the areas where current water demands are being met with significant groundwater pumping or transport of surface water from other locales.
The shortfalls are most dramatic in the Southwest, in the high plains, in California, and in Florida. Population growth in these regions between 2000 and 2025 is estimated to be 30 to 50 percent (Campbell, 1997). This additional population will place an increased demand on water and energy, given current trends in energy and water use efficiency. The challenges are not limited to these re-gions, however. For example, the data pre-sented from EPRI show that nearly the entire western shoreline of Lake Michigan has water demand above available pre-cipitation (EPRI, 2003a). Groundwater levels along the southwestern shores of Lake Michigan have declined hundreds of feet since predevelopment and by 1980 had reached maximum withdrawals of up to 900 feet near Chicago (Bartolino and Cunningham, 2003; Granneman et al., 2000). While subsequent relocation of withdrawals has caused groundwater levels near Chicago to rise several hundred feet (Granneman et al., 2000), levels are de-clining as much as 17 feet per year in some locations (Michigan Land Use Institute, 2003).

15
Source: Solley, 1998; EPRI 2003, A Survey of Water Use
ProjectedPopulationGrowthFrom Campbell, 1997
+20%
+29%
+10%
+81%+68%
+37%
+36%
%
Figure I-2. Water Shortages and Population Growth (Water shortage is defined as total freshwater withdrawal divided by available precipitation. Water withdrawal data are taken from Solley et al., 1998; ratios shown are taken from EPRI,
2003a; and projected population growth is taken from Campbell, 1997.)

16

17
Chapter II. Supplying Energy Requires Water and Impacts Water Quality
Water is used throughout the energy sector, including in resource extraction, refining and processing, electric power generation, storage, and transport. The energy sector also can impact water quality via waste streams, runoff from mining operations, produced water from oil and gas extraction, and air emissions that may affect downwind watersheds. Examples of interactions, both large and small, are shown in Table II-1. Many energy facilities, such as power plants, mines, and refineries, are very large and can have a significant impact on local water supplies and water quality. For exam-ple, water withdrawals for thermoelectric power generation alone are comparable to water withdrawals for irrigation. Each represents about 40 percent of the national
water withdrawals (water that is diverted or withdrawn from a surface-water or ground-water source), as shown in Figure II-1 (Hutson et al., 2004). However, of the 132 billion gallons per day of freshwater with-drawn for thermoelectric power plants in 1995, all but about 3.3 billion gallons per day (3 percent) was returned to the source. While this water was returned at a higher temperature and with other changes in water quality, it was available for further use. In contrast, of the 134 billion gallons per day withdrawn for irrigation in 1995, 81 billion gallons per day were consumed by evapora-tion and transpiration (60 percent), and another 25 billion gallons per day (19 percent) were reported as lost in conveyance (but may have percolated to a groundwater source and been available for reuse) (Solley et al., 1998).
Table II-1. Connections Between the Energy Sector and Water Availability and Quality
*Impaired water may be saline or contain contaminants
Energy Element
Connection to Water Quantity
Connection to Water Quality
Refining and Processing Traditional Oil and Gas
Refining
Water needed to refine oil and gas
End use can impact water quality
Biofuels and Ethanol
Water for growing and refining
Refinery waste-water treatment
Synfuels and Hydrogen
Water for synthesis or steam reforming
Wastewater treatment
Energy Transportation and Storage Energy
Pipelines Water for hydrostatic testing
Wastewater requires treatment
Coal Slurry Pipelines
Water for slurry transport; water not returned
Final water is poor quality; requires treatment
Barge Transport of
Energy
River flows and stages impact fuel delivery
Spills or accidents can impact water quality
Oil and Gas Storage Caverns
Slurry mining of caverns requires large quantities of water
Slurry disposal impacts water quality and ecology
**Includes solar and geothermal steam-electric plants
Energy Element
Connection to Water Quantity
Connection to Water Quality
Energy Extraction and Production Oil and Gas Exploration
Water for drilling, completion, and fracturing
Impact on shallow groundwater quality
Oil and Gas Production
Large volume of produced, impaired water*
Produced water can impact surface and groundwater
Coal and Uranium Mining
Mining operations can generate large quantities of water
Tailings and drainage can impact surface water and ground-water
Electric Power Generation Thermo-electric (fossil,
biomass, nuclear)
Surface water and groundwater for cooling** and scrubbing
Thermal and air emissions impact surface waters and ecology
Hydro-electric
Reservoirs lose large quantities to evaporation
Can impact water temperatures, quality, ecology
Solar PV and Wind
None during operation; minimal water use for panel and blade washing
18
U.S. Freshwater Withdrawals, 345 Bgal/dayPublic Supply, 13%
Industrial, 5%
Thermoelectric, 39%
Irrigation, 40%
Aquaculture, 1%Livestock, 1%
Domestic, 1%
Mining, 1%
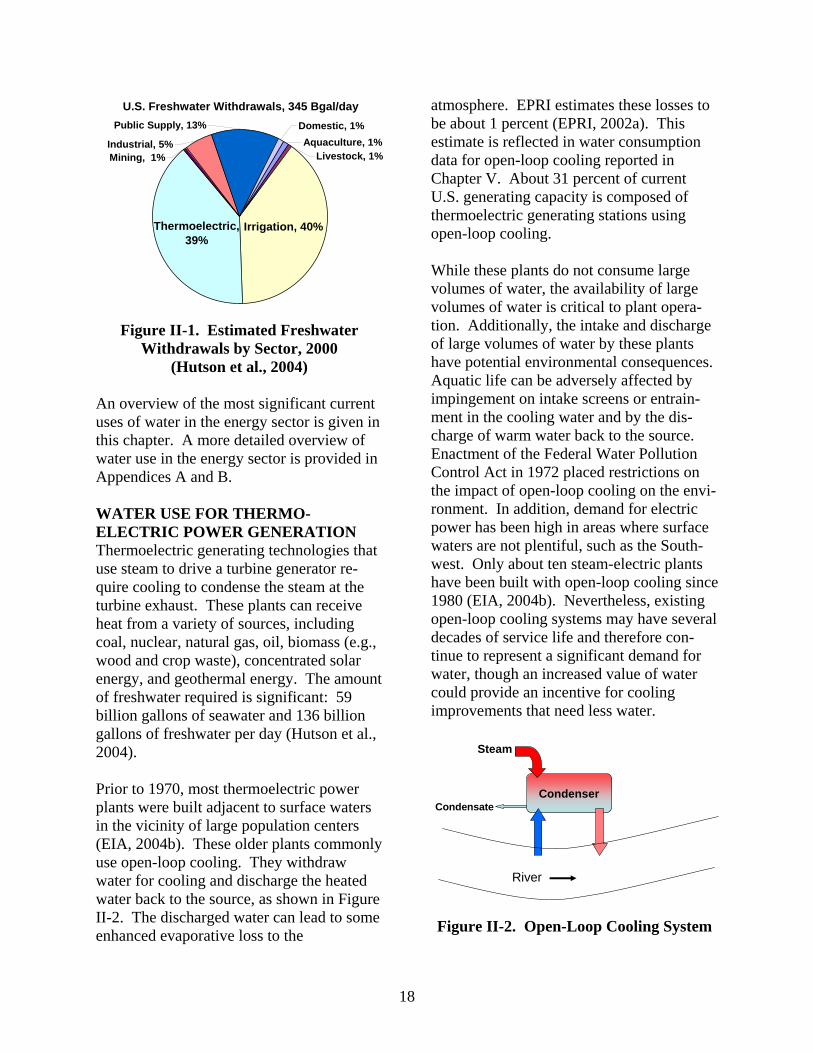
Figure II-1. Estimated Freshwater
Withdrawals by Sector, 2000 (Hutson et al., 2004)
An overview of the most significant current uses of water in the energy sector is given in this chapter. A more detailed overview of water use in the energy sector is provided in Appendices A and B. WATER USE FOR THERMO-ELECTRIC POWER GENERATION Thermoelectric generating technologies that use steam to drive a turbine generator re-quire cooling to condense the steam at the turbine exhaust. These plants can receive heat from a variety of sources, including coal, nuclear, natural gas, oil, biomass (e.g., wood and crop waste), concentrated solar energy, and geothermal energy. The amount of freshwater required is significant: 59 billion gallons of seawater and 136 billion gallons of freshwater per day (Hutson et al., 2004). Prior to 1970, most thermoelectric power plants were built adjacent to surface waters in the vicinity of large population centers (EIA, 2004b). These older plants commonly use open-loop cooling. They withdraw water for cooling and discharge the heated water back to the source, as shown in Figure II-2. The discharged water can lead to some enhanced evaporative loss to the
atmosphere. EPRI estimates these losses to be about 1 percent (EPRI, 2002a). This estimate is reflected in water consumption data for open-loop cooling reported in Chapter V. About 31 percent of current U.S. generating capacity is composed of thermoelectric generating stations using open-loop cooling. While these plants do not consume large volumes of water, the availability of large volumes of water is critical to plant opera-tion. Additionally, the intake and discharge of large volumes of water by these plants have potential environmental consequences. Aquatic life can be adversely affected by impingement on intake screens or entrain-ment in the cooling water and by the dis-charge of warm water back to the source. Enactment of the Federal Water Pollution Control Act in 1972 placed restrictions on the impact of open-loop cooling on the envi-ronment. In addition, demand for electric power has been high in areas where surface waters are not plentiful, such as the South-west. Only about ten steam-electric plants have been built with open-loop cooling since 1980 (EIA, 2004b). Nevertheless, existing open-loop cooling systems may have several decades of service life and therefore con-tinue to represent a significant demand for water, though an increased value of water could provide an incentive for cooling improvements that need less water.
Condenser
River
Steam
Condensate
Figure II-2. Open-Loop Cooling System

19
Most thermoelectric plants installed since the mid-1970s are cooled by evaporation of the cooling water (EIA, 2004b). As shown in Figure II-3, water is pumped in a closed loop through a cooling tower or a cooling pond. These systems withdraw less than 5 percent of the water withdrawn by open-loop systems, but most of the water with-drawn is lost to evaporation.
Condenser
Pump
Steam
Condensate
FreshwaterSupply
Blowdown
CoolingTower
WaterVapor
Figure II-3. Closed-Loop Cooling System Total freshwater consumption for the thermoelectric power sector was 3.3 billion gallons per day in 1995 (Solley et al., 1998). While that was only 3.3 percent of total U.S. water consumption (which amounts to about 100 billion gallons/day), it was nearly 20 percent of nonagricultural consumption, as shown in Figure II-4.
U.S. Freshwater Consumption, 100 Bgal/day
Livestock3.3%
Thermoelectric3.3%
Commercial1.2%
Domestic7.1%
Industrial3.3%
Mining1.2%Irrigation
80.6%
Figure II-4. Estimated Freshwater
Consumption by Sector, 1995 (Solley et al., 1998)
WATER USE FOR HYDROELECTRIC POWER GENERATION Hydroelectric power is an important compo-nent of U.S. electricity generation. Hydro-power supplied from 5.8 percent to 10.2 percent of generated power between 1990 and 2003 (EIA, 2005). As shown in Figure II-5, hydroelectric power production varies greatly with the amount of water available, depending upon weather patterns and local hydrology, as well as on competing water uses, such as flood control, water supply, recreation, and in-stream flow needs (e.g., navigation and the aquatic environment). In addition to being a major source of base-load generating capacity in some regions, hydroelectric power plays an important role in stabilizing the electrical transmission grid and in meeting peak loads, reserve require-ments, and other ancillary electrical energy needs because it can respond very quickly to changing demand.
0
50
100
150
200
250
300
350
400
1940 1950 1960 1970 1980 1990 2000 2010
Year
Bill
ion
Kilo
wat
thou
rs
Recent range (±35%) happened with essentially
no change in capacity
Figure II-5. U.S. Hydropower Production
(EIA, 2005) Hydroelectric plant design and operation is highly diverse. Projects vary from large, multipurpose storage reservoirs to run-of-river projects that have little or no active water storage. Approximately half the U.S. hydropower capacity is federally owned and operated; the other half is non-federal projects that are regulated by the Federal Energy Regulatory Commission.

20
There are more than ten times more non-federal hydropower projects in the U.S. than federal projects. Water flow through hydroelectric turbines averages 3,160 billion gallons/day (Solley et al., 1998) or nearly ten times the with-drawals of water from rivers. The United States Geological Survey (USGS) does not report it as withdrawn water because it re-mains in the river and, in fact, can be used multiple times by successive dams. How-ever, reservoir operation can shift water releases in time relative to natural flows. When hydropower projects involve large storage reservoirs, evaporation of water from those reservoirs can be a significant consumptive use. With an average loss for U.S. hydroelectric reservoirs of 4,500 gal/MWh (Gleick, 1994) and annual genera-tion of approximately 300 million MWh (EIA 2005), total losses are estimated at 3.8 billion gallons per day. However, the water storage in hydropower reservoirs usually has multiple purposes; thus, hydroelectric power is not the only cause of these evaporative losses. WATER USE FOR ENERGY EXTRACTION AND FUEL PRODUCTION Water consumption for energy extraction and fuel production is included by the USGS under the industrial/mining sector. While water is used in the conventional extraction of resources, more water is used in conver-sion to useful forms of energy, whether that is converting coal or uranium to electricity as described above or converting petroleum into fuels such as gasoline or diesel. Refin-ery use of water for processing and cooling is about 1 to 2.5 gallons of water for every gallon of product (Gleick, 1994). The United States refines nearly 800 million gallons of petroleum products per day (EIA,
2006). Therefore, refining consumes 1 to 2 billion gallons of water per day. Natural gas processing and pipeline operations consume an additional 0.4 billion gallons per day (Gleick, 1994; EIA, 2006). In the mining sector, water is used to cool or lubricate cutting and drilling equipment for dust suppression, fuel processing, and revegetation when mining and extraction are complete. Estimates of water for coal min-ing vary from 1 to 6 gallons per million British thermal units (MMBtu), depending on the source of the coal (Gleick, 1994; Lancet, 1993). Combining those figures with 2003 coal production data (EIA, 2006), total water use for coal mining is estimated at 70 to 260 million gallons per day. Oil shale is emerging as another potential source of oil. Initial recovery work to date has focused on mining and above-ground processing (retorting) that consumes 2 to 5 gallons of water per gallon of refinery-ready oil (Bartis, 2005). Currently, only limited amounts of oil shale are being developed, but based on current oil demands and prices, opportunities may exist for significant ex-pansion in the future. On the other hand, because oil shale resources are predomi-nantly located in areas where water has a high value, oil shale development may be constrained by both water availability and value. More recently, an electrically driven in situ underground process is being proto-typed that does not directly use water, potentially significantly reducing the water intensity of future oil shale development (Bartis, 2005). Biofuels currently provide about 3 percent of U.S. transportation fuel, with more than 130 ethanol and biodiesel plants in operation producing over 4 billion gallons of biofuel each year (Renewable Fuels Association,

21
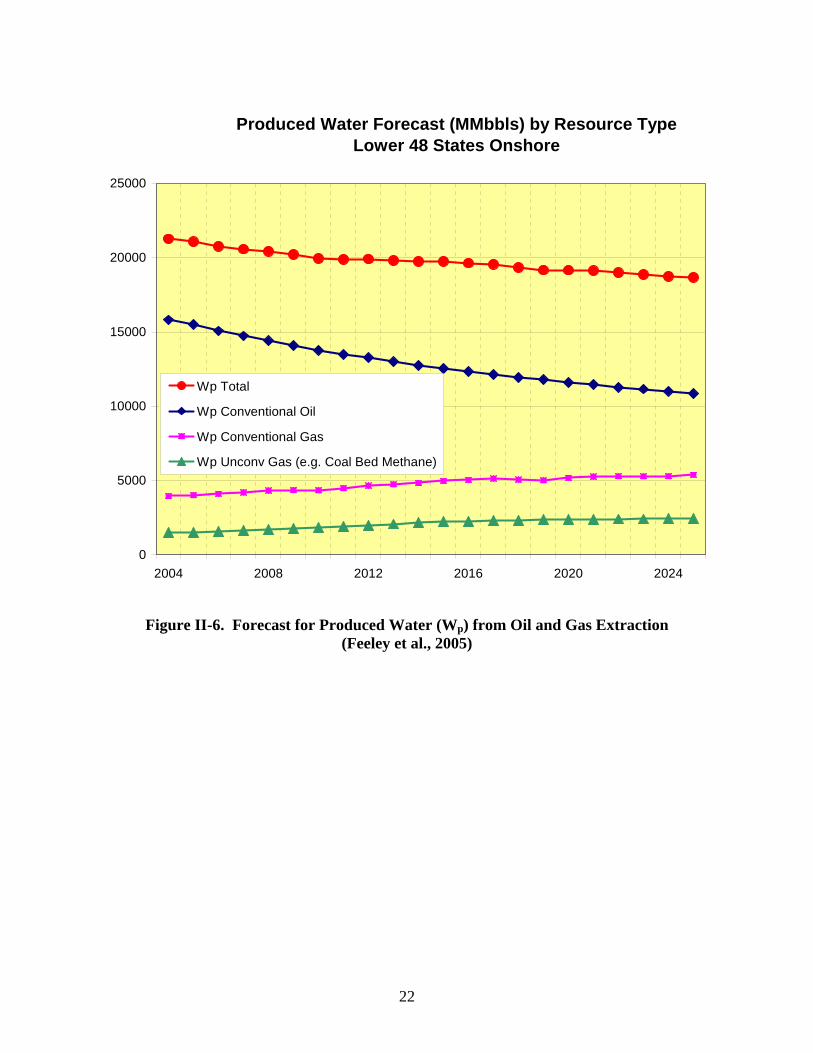
2005 and 2006; National Biodiesel Board, 2005). The most water-intensive aspect of biofuel production is growing the feedstock, with water consumption for refining generally similar to that for oil refining. When the feedstock is corn or soy (used to make ethanol and biodiesel, respectively) and grown on irrigated land, then the water consumption per gallon of fuel produced can exceed the water consumption for refining by a factor of one thousand based on USDA data (USDA, 2004a). Initial extraction of conventional oil and gas requires minimal consumption of water. Rather, significant quantities of water, called produced water, are extracted with the oil and gas. Produced water can range from being nearly fresh to being hypersaline brine, with the vast majority being at least as saline as seawater. As oil wells age, en-hanced recovery techniques are used to extract additional oil. Many of these recovery techniques involve injection of water or steam into the well, and some are very water-intensive. Gleick reports water consumption of 2 to 350 gallons of water per gallon of oil extracted, depending upon the recovery enhancement process. However, most of the water used for these purposes is not otherwise usable (Gleick, 1994). Most produced water associated with onshore production is injected back into the producing zones to enhance production or into other formations well below any usable groundwater resources. WATER PRODUCED DURING ENERGY EXTRACTION Significant quantities of produced water are extracted with oil and gas, as shown in Figure II-6. In 1995, the American Petroleum Institute (API) estimated that oil and gas operations generated 18 billion barrels of produced water (49 million
gallons per day), compared to total annual petroleum production of 6.7 billion barrels of oil equivalent (both onshore and offshore production, including crude oil, natural gas, and natural gas liquids production) (API, 2000). Such produced water varies in quality; with treatment, some might be used for other purposes. API indicates that in 1995, approximately 71 percent of produced water was recycled and used for EOR. The amount of water produced per well varies greatly. For example, water produced by coal-bed natural gas extraction can vary from 7 barrels of water per barrel of oil equivalent in the San Juan Basin (Colorado and New Mexico) to approximately 900 bar-rels of water per barrel of oil equivalent in the Powder River Basin (Wyoming and Montana) (Rice et al., 2000). Additionally, produced water rates for coal-bed natural gas wells are not consistent over the life of the wells. Water production rates are high initially but decline rapidly. ENERGY IMPACTS ON WATER QUALITY As noted in Table II-1, many of the elements associated with energy development have the potential to impact water quality nega-tively. Oil and gas production that is not adequately managed and monitored can contaminate surface water and shallow groundwater through drilling and production operations or from spills of produced hydro-carbons or produced brackish water. The refining and processing of oil and gas can generate by-products and wastewater streams that, if not handled appropriately, can cause water contamination. Fuel additives, such as methyl tertiary-butyl ether (MTBE), that have been used to reduce air emissions have also emerged as potential groundwater contaminants.
22
Produced Water Forecast (MMbbls) by Resource TypeLower 48 States Onshore
0
5000
10000
15000
20000
25000
2004 2008 2012 2016 2020 2024
Wp Total
Wp Conventional Oil
Wp Conventional Gas
Wp Unconv Gas (e.g. Coal Bed Methane)
Figure II-6. Forecast for Produced Water (Wp) from Oil and Gas Extraction (Feeley et al., 2005)

23
Energy resource mining and processing, such as coal and uranium mining and oil shale development, can contaminate surface and groundwater. Runoff from both main mine operations and tailings piles can sig-nificantly reduce pH levels and increase heavy metals concentrations in mine drain-age water. In addition, runoff from oil shale residue can wash into surface waters and by-products from in situ retort methods could impact groundwater quality. An increased interest in U.S. uranium supplies has led some older mines in New Mexico and Utah to considering reopening. By doing so, these mines might generate from 3 to 5 mil-lion gallons of water a day that would need to be handled and disposed of (Hopp, 2005). On occasion, water is spilled from mining operations; 300 million gallons of coal sludge spilled in an incident in Kentucky in October 2000 (Clean Air Task Force, 2004a). Water from some abandoned mines, including some in Pennsylvania, must be pumped and treated to prevent contamina-tion of surface waters (USGS, 2002a).
Energy transportation and storage develop-ment can also impact surface water and groundwater quality. Water used for pipe-line testing, coal slurry pipelines, and solu-tion mining for oil and gas storage caverns creates a range of contaminants that can contaminate fresh or coastal water sources if not adequately managed and disposed of. Finally, thermoelectric and hydroelectric power generation can impact water quality. Discharge from open-loop cooling systems can affect water temperature and oxygen levels. Air emissions from fuel combustion, such as mercury, sulfur, and nitrogen oxides, can lead to negative impacts on downwind water quality and aquatic ecosystems. Hydroelectric plants can impact water quality and river ecology in several ways. Operations can change water temperatures and dissolved oxygen and nitrogen levels in downstream waters. Operations can also change the natural flow characteristics of rivers so as to impact aquatic ecology.

24

25
Chapter III. Supplying Water Requires Energy Satisfying the Nation’s water needs requires energy for supply, purification, distribution, and treatment of water and wastewater. Nationwide, about 4 percent of U.S. power generation is used for water supply and treatment, which, as shown in Figure III-1, is comparable to several other industrial sectors (EPRI, 2002b). Electricity represents approximately 75 percent of the cost of municipal water processing and distribution (Powicki, 2002). A recent study funded by the Electric Power Research Institute (EPRI) looked at energy requirements for water supply and treatment across the country. The results are exam-ined in terms of per capita use of energy for water supply and treatment in Figure III-2. The biggest difference among regions is the amount of energy used to supply water for agriculture. In general, per capita non-agri-cultural use of energy for water is similar region to region. However, within regions, there can be sub-stantial variation in energy requirements for water supply and treatment, depending upon the source, the distance water is conveyed, and the local topography. California is an
0
1
2
3
4
5
6
7
Water/Wastewater Paper & Pulp Chemicals Petroleum Refining
% o
f US
Elec
tric
ty C
onsu
mpt
ion
Figure III-1. Percent of U.S. Electricity Consumption by Sector
(EPRI, 2002b; EIA, 1998)
interesting case study in electrical consump-tion and illustrates the cost of long-distance water conveyance. California uses about 5 percent of its electricity consumption for water supply and treatment (CEC, 2005). This is substantially above the national average. As shown in Table III-1, a study by the California Energy Commission (CEC) illustrates how energy use can vary among water systems. SUPPLY AND CONVEYANCE Supply and conveyance can be the most en-ergy-intensive portion of the water delivery chain. If the water source is groundwater, pumping requirements for supply of fresh-water from aquifers vary with depth: 540 kWh per million gallons from a depth of 120 feet, 2000 kWh per million gallons from 400 feet (Cohen et al., 2004). These energy needs will increase in areas where ground-water levels are declining. Table III-1. Energy Requirements for Water Supply and Treatment in California (CEC, 2005)
kWh/Million
gallons Water Cycle Segments Low High Supply and Conveyance 0 16,000 Treatment 100 1,500 Distribution 700 1,200 Wastewater Collection and Treatment 1,100 4,600 Wastewater Discharge 0 400 TOTAL 1,900 23,700 Recycled Water Treatment and Distribution for Non-potable Uses 400 1,200

26
2000
0 200 400 600 800 1000
Pacific
Mountain
West SouthCentral
West NorthCentral
East SouthCentral
East NorthCentral
Middle Atlantic
South Atlantic
New England
kWh/yr
Public Water SupplyDomestic SupplyCommercial SupplyIndustrial SupplyMining SupplyPublic WW TreatmentPrivate WW TreatmentLivestockIrrigation
2050
0 200 400 600 800 1000
Pacific
Mountain
West SouthCentral
West NorthCentral
East SouthCentral
East NorthCentral
Middle Atlantic
South Atlantic
New England
kWh/yr
Public Water SupplyDomestic SupplyCommercial SupplyIndustrial SupplyMining SupplyPublic WW TreatmentPrivate WW TreatmentLivestockIrrigation
Figure III-2. Per Capita Energy Use for Water Supply and Wastewater Treatment in 2000
and Projected for 2050 (EPRI, 2002b).
Energy requirements to pump water from surface waters can be negligible if users are located close to the source. But if water must be pumped long distances, then the en-ergy requirement is much higher. In Cali-fornia, water is conveyed from Northern California up to 400 miles via the State Water Project to the cities of Southern Cali-fornia. Energy requirements for long-dis-tance conveyance are indicated by the upper range in Table III-1. The table also illus-trates that energy savings can be realized when wastewater streams are made available for reuse, rather than having to pump and convey freshwater over long distances. TREATMENT AND DISTRIBUTION Groundwater, if not brackish, can require minimal energy for purification. Surface waters generally require more treatment, and
energy requirements for surface water treatment are at the upper end of the range in Table III-1. Energy requirements for distri-bution and collection vary depending on system size, topography, and age. Older systems often require more energy because of older infrastructure and less efficient equipment. END USE OF WATER One of the more interesting results that the California study noted is that energy con-sumption associated with using water is greater than the energy consumption for supply and treatment. Activities such as water heating, clothes washing, and clothes drying require 14 percent of California’s electricity consumption and 31 percent of its natural gas consumption. Most of that use is in the residential sector. These data
Total U.S. Energy for
Water Demand:
123 Million Mwh/yr

27
illustrate that both water and energy can be conserved through the use of appliances and fixtures that reduce hot water use. FUTURE ENERGY DEMAND FOR WATER SUPPLY AND TREATMENT Population growth will create an increased demand for water. As freshwater supplies become more limited, pumping water from greater distances or greater depths and treating water to access alternative sources will increase energy consumption to meet future water demands. Additionally, emerging water treatment requirements (e.g., standards for arsenic removal) are becoming more stringent, which will increase energy consumption for both purification and wastewater treatment. In agriculture, gravity-driven flood irrigation may be replaced with more water-efficient but more energy-intensive spray irrigation and micro-irrigation. An increased demand for water and water treatment could provide incentives to improve the efficiency of the water infrastructure. Aging supply, treatment, and distribution equipment may be replaced by newer, more energy-efficient equipment, and water conservation measures,
including improved irrigation practices, could reduce water use. The EPRI study estimated future energy demands for water supply and treatment in 2050. The results are presented on a per capita basis in Figure III-2. Compared to 2000, per capita energy requirements are expected to be largely unchanged, except in the industrial and agricultural sectors. Energy for public and commercial water supply and treatment are expected to grow with population, with an average increase for the Nation of almost 50 percent between 2000 and 2050. According to the EPRI study, energy use for water supply and treatment in the industrial sector is expected to triple because of growth projected in industrial activity, with strong growth in per capita use in the East North Central region. The study also projects that energy use for irrigation will triple based on projections of land use, with strong growth in per capita use in the South Central, West North Central, and West South Central regions. The study cites EPRI projections on industrial activity and U.S. Department of Agriculture (USDA) projections on land use (EPRI, 2002b).

28

29
Chapter IV. Water Shortages and Impacts on Energy Infrastructure Today’s U.S. energy infrastructure depends heavily on the availability of water, and there is likely to be increased issues con-cerning availability and value of that water due to growth in competing demands. Most state water managers expect shortages of water over the next decade, as shown in Figure IV-1 (GAO, 2003), and water supply issues are already affecting many existing and proposed power projects as shown in Figure IV-2. In some regions, power plants have had to limit generation because of insufficient water supplies, and citizens and public officials concerned about the availability of water have opposed new high-water-use energy facilities, suggesting clear incentives for using lower water intensity designs in future energy infrastructure developments. As illustrated in Figure IV-3, total U.S. water withdrawals peaked in 1980 and have been essentially level since then. Construc-tion of large reservoirs peaked in the 1970s,
and only one large water storage project is currently under construction—the Animas LaPlata project in Colorado and New Mex-ico (GAO, 2003). In 1980, major reservoirs were full. However, since then, droughts have caused some reservoir levels to decline, particularly in the West, and water managers have had to limit water withdraw-als. Also, groundwater levels have declined substantially in many areas of the country. Compounding the uncertainty regarding supply is the lack of current data on water consumption. Steady or declining rates of water withdrawal do not necessarily imply steady or declining consumption. For example, communities have responded to water shortages, in part, by increasing water re-use for such nonpotable uses as irrigation. Diverting wastewater effluent from return flows to consumptive uses reduces the need for water withdrawal, but does not reduce the rate of water consumption.
TX
CA
MT
AZ
ID
NV
NM
COIL
OR
UT
KS
WY
IANE
SD
MN
ND
OK
FL
WI
MO
AL
WA
GA
AR
LA
MI
IN
PA
NY
NC
MS
TN
KYVA
OH
SC
ME
WV
MI VTNH
MD
NJ
MACT
DE
RI
g
AK
AK
HI
HI
HI
HI
HI
shortageStatewideRegionalLocalNoneNo response or uncertain
Figure IV-1. Survey of Likely Water Shortages over the Next Decade under Average
Conditions (GAO, 2003)

30
Figure IV-2. Examples of Energy-Water Conflicts
1. As a result of a 1999 drought, water-dependent industries along the Susquehanna reported difficulty getting
sufficient water supplies to meet operational needs (GAO, 2003). 2. Browns Ferry Nuclear Power Plant, part of the TVA complex on the Tennessee River, often experiences warm
river flows, such that the temperature of the water at the plant’s cooling intakes often approaches or exceeds the Alabama water quality criterion of 86 °F, nearly the plant’s discharge limit of 90 °F (Curlee and Sale, 2003; Gibson, 2006).
3. Low water on the Missouri River leads to high pumping energy, blocked screens, lower efficiency, load reduction, or shutdown at power plants (Kruse and Womack, 2004).
4. Tennessee Governor imposed a moratorium in 2002 on the installation of new merchant power plants because of cooling constraints (Curlee and Sale, 2003).
5. Georgia Power lost a bid to draw water from the Chattahoochee River for power plant cooling (Hoffman, 2004). 6. Arizona rejected permitting for a proposed power plant because of potential impact on a local aquifer (Tucson
Citizen, 2002). 7. A New York Entergy plant was required to install a closed-cycle cooling water system to prevent fish deaths
resulting from operation of its once-through cooling water system (Clean Air Task Force, 2004a). 8. Southern States Energy Board member states cited water availability as a key factor in the permitting process
for new merchant power plants (Feldman and Routhe, 2003). 9. South Dakota Governor called for a summit to discuss drought-induced low flows on the Missouri River and the
impacts on irrigation, drinking-water systems, and power plants (U.S. Water News Online, 2003). 10. Washoe County, Nevada, residents expressed opposition to a proposed coal-fired power plant’s planned water
use (Reno-Gazette Journal, 2005). 11. Proposed coal-fired power plant on Lake Michigan (Wisconsin shore) strongly opposed by environmental
groups because of potential effects of the facility’s cooling-water-intake structures on the lake’s aquatic life (Milwaukee Journal Sentinel, 2005).
12. Hot discharge water from the Brayton Point coal plant on the Massachusetts/Rhode Island border cited by EPA as contributing to an 87 percent reduction in fin fish in Mt. Hope Bay; EPA mandates a 94 percent reduction in water withdrawal, replacing seawater cooling with freshwater cooling towers (Clean Air Task Force, 2004b).
13. University of Texas researchers said power plants would have to curtail production if 20th century drought conditions recurred (Clean Air Task Force, 2004a).
14. Idaho opposed two proposed power plants because of impact on aquifer (U.S. Water News Online, 2002).
11
1
2
3
4
56
7
8
910
12
13
14

31
0
50
100
150
200
250
300
350
400
1950 1955 1960 1965 1970 1975 1980 1985 1990 1995 2000
With
draw
als
(bill
ion
gallo
ns p
er d
ay)
Total FreshwaterSurface WaterGround Water
Figure IV-3. Trends in Total Freshwater Withdrawals, 1950–2000 (Hutson et al., 2000)
While the USGS reported water withdrawal data in 2000, USGS last reported data for consumption in 1995, and the last detailed study was done in 1978 (U.S. Water Resources Council, 1978). As the GAO reported to Congress in 2003 (GAO, 2003):
National water availability and use has not been comprehensively assessed in 25 years, but current trends indicate that demands on the Nation’s supplies are growing. In particular, the Nation’s capacity for storing surface-water is limited and groundwater is being depleted. At the same time, growing population and pressures to keep water in streams for fisheries and the environment places new demands on the freshwater supply. The potential effects of climate change also create uncertainty about future water availability and use.
WATER MANAGEMENT CHALLENGES Managing water resources requires balanc-ing the competing needs for water with the availability of supplies and storage capacity. Reservoirs store water to mitigate the effects of seasonal and annual variations in supply. Water resources are managed to meet the needs of a range of uses, including irriga-tion, recreation, hydroelectric power,
downstream communities, industry, ther-moelectric plants, and in-stream uses, such as navigation, fisheries, and wildlife habitat. The Tennessee River system provides an example of the challenges of managing a watershed to meet competing needs. Tennessee Valley Authority (TVA) operates the Tennessee River system to provide a wide range of public benefits: navigation, flood damage reduction, affordable electricity, water quality, water supply, recreation, and economic growth. Each of these benefit areas is supported by different stakeholders, who typically want the system managed to serve their interests first.
TVA conducted a Reservoir Operations Study to determine whether changes in river system operation would produce greater overall public value. The resulting new operational strategy improves recreation, commercial navigation, and aquatic habitat with a total economic benefit of $11.5 million ($9 million in revenues from recreation and shipper savings of approximately $2.5 million), which will be largely offset by the increase in power costs of approximately $14 million annually (TVA, 2004; Gibson, 2006).

32
SURFACE WATER CONCERNS Climate change and climate variability can have a dramatic impact on water supplies, with the most obvious impact being drought. But even high precipitation provides no guarantee of adequate water if the inflow from precipitation does not come at the right time. For example, snow pack provides 75 percent of the water supply in the West (USDA, 2004b), and snow pack is a key part of water storage in some areas. While reservoirs on the middle and lower Colorado River basin can store several times the annual river flow, reservoirs on the Columbia River can store only about 30 percent of annual flow. When warm temperatures cause rain instead of snow or snow melts earlier, Columbia River reservoirs do not have the capacity needed to store the early inflow. Water then has to be released early and is not available later for the reservoir’s customers. In the past 50 years, peak stream flow has occurred earlier, typically by 10 to 40 days, and spring snow pack has decreased by 11 percent (Mote, 2004). Long-term cyclical changes in precipitation patterns and the effect on flows in rivers and the operation of reservoirs and hydroelectric plants are a major concern to the energy in-dustry. The 2001 drought in the Northwest significantly reduced hydroelectric power production, leading to the loss of thousands of jobs in the energy-intensive aluminum industry (Washington State Hazard Mitiga-tion Plan, 2004). Such loss of hydroelectric power affects not only total power genera-tion, but also power reliability. Because the level of output from hydropower can be quickly changed, it is used to provide peak-ing power when demand is highest. Peaking capability is especially valuable in the summer, when high temperatures and high humidity can reduce generation efficiency from thermoelectric plants. In the absence
of hydroelectric power, peaking needs are being met in most cases by natural gas. As illustrated in Figure IV-2, for those who build and operate power plants across the Nation, the consequences of limited water availability are already clear: there is a sig-nificant incentive to decrease the water intensity of energy infrastructure in a cost-effective manner. Power plants that use open-loop cooling require plentiful supplies of water and may no longer be the economic design option. Limited availability, poor quality, and invasive species such as zebra mussels in rivers and lakes can restrict cooling and power generation by fouling intake structures, which has driven advancement of science to control zebra mussels. When warm weather or low flow leads to high water temperatures at the plant inlet, then plants may have to reduce generation to avoid exceeding discharge temperature limits specified in plant operating permits. In a few cases, low flows, other environmental concerns, and increasing value of water are providing incentives for the replacement or upgrade of open-loop cooling systems with new cooling systems to achieve water-efficient and economical generation of power. Low surface water levels can also affect thermoelectric plants using closed-loop cooling systems. Generally, these plants secure long-term access to water, if neces-sary, before installation. However, if surface waters are severely constrained by drought, plant water supplies could be impacted, especially if priority rights or water sharing are imposed. GROUNDWATER CONCERNS Almost 40 percent of water provided by private water suppliers is from groundwater sources, serving 90 million people in all 50 states; another 40 million are self-supplied

33
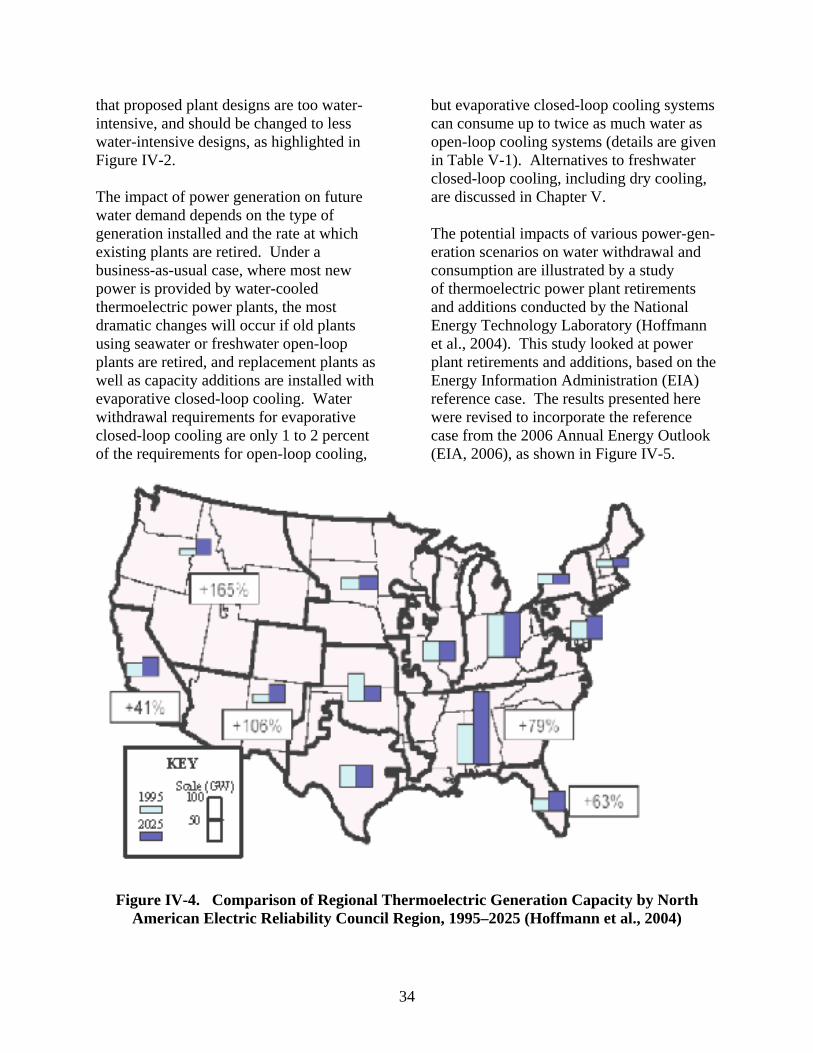
with groundwater (Solley et al., 1998). Some aquifers are adjacent to surface waters. When these aquifers are drained, levels of adjacent surface waters decline, and some riverbeds dry out. Other aquifers are isolated from surface waters. Recharge of these aquifers can be very slow, and the water that is being pumped may have taken decades, centuries, or even longer to accumulate. Visible impact of over-with-drawal occurs in some areas as the land surface sinks when the underlying water is removed. Table IV-1 highlights dramatic evidence of groundwater depletion around the country. Energy facilities dependent on groundwater supplies may have secured exclusive long-term withdrawal permits or may be drawing water from aquifers with multiple users. In either case, if the rate of withdrawal exceeds the rate of recharge, then over time, water must be pumped from ever greater depths. Ultimately, there is a risk that freshwater from the aquifer will become fully depleted, leading to loss of water supplies. As aquifers are drawn down, they often yield brackish waters; these require treatment before use in a closed-loop cooling system. The increased energy requirements for water pumping and treatment will decrease net plant output and could increase the cost of power. POTENTIAL IMPACT OF FUTURE POWER GENERATION ON WATER SUPPLIES Figure IV-4 shows the expected increases in power generating capacity from 1995 to 2025, as projected by the AEO2004 reference case (EIA, 2004c). (EIA’s reference case is based on business-as-usual trend forecasts, given known current technology, techno-logical and demographic trends, and current laws and regulations.)
The regions where capacity growth is expected are regions with high population growths, as shown in Chapter I, Figure I-2. Many of these areas are already facing water supply limitations, and efforts to build new power plants in these areas are encountering resistance from the public and from government officials because of concerns
Table IV-1. Examples of Declining Groundwater Levels (Bartolino and
Cunningham, 2003)
Region Groundwater Decline Long Island, NY Water table declined,
stream flows reduced, salt water moving inland
West-central Florida
Groundwater and surface water declining, salt water intruding, sink holes forming
Baton Rouge, LA
Groundwater declining up to 200 feet
Houston, TX Groundwater declining up to 400 feet, land subsidence up to 10 feet
Arkansas Sparta aquifer declared “critical”
High Plains Declines up to 100 feet, water supply (saturated thickness) reduced over half in some areas
Chicago-Milwaukee area
Groundwater serving 8.2 million people has declined as much as 900 feet, declining 17 feet/yr
Pacific Northwest
Declines up to 100 feet
Tucson/Phoenix, AZ
Declines of 300 to 500 feet, subsidence up to 12.5 feet
Las Vegas, NV Declines up to 300 feet, subsidence up to 6 feet
Antelope Valley, CA
Declines over 300 feet, subsidence over 6 feet
34
that proposed plant designs are too water-intensive, and should be changed to less water-intensive designs, as highlighted in Figure IV-2. The impact of power generation on future water demand depends on the type of generation installed and the rate at which existing plants are retired. Under a business-as-usual case, where most new power is provided by water-cooled thermoelectric power plants, the most dramatic changes will occur if old plants using seawater or freshwater open-loop plants are retired, and replacement plants as well as capacity additions are installed with evaporative closed-loop cooling. Water withdrawal requirements for evaporative closed-loop cooling are only 1 to 2 percent of the requirements for open-loop cooling,
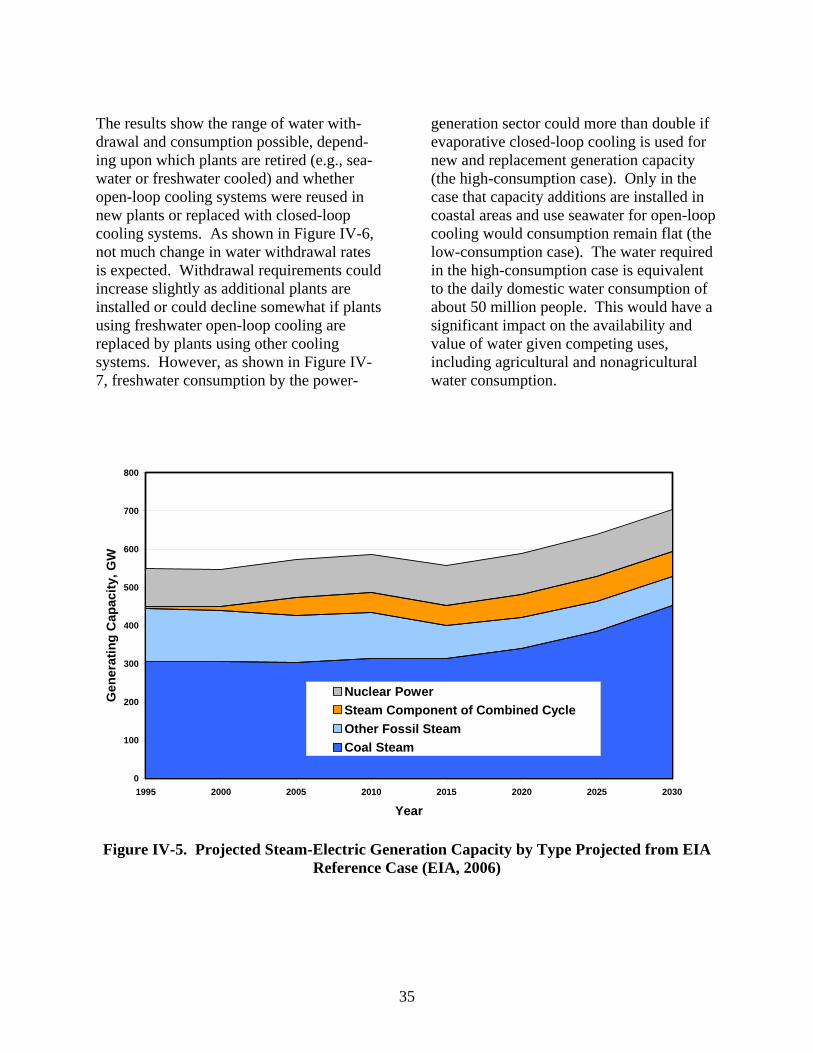
but evaporative closed-loop cooling systems can consume up to twice as much water as open-loop cooling systems (details are given in Table V-1). Alternatives to freshwater closed-loop cooling, including dry cooling, are discussed in Chapter V. The potential impacts of various power-gen-eration scenarios on water withdrawal and consumption are illustrated by a study of thermoelectric power plant retirements and additions conducted by the National Energy Technology Laboratory (Hoffmann et al., 2004). This study looked at power plant retirements and additions, based on the Energy Information Administration (EIA) reference case. The results presented here were revised to incorporate the reference case from the 2006 Annual Energy Outlook (EIA, 2006), as shown in Figure IV-5.
Figure IV-4. Comparison of Regional Thermoelectric Generation Capacity by North
American Electric Reliability Council Region, 1995–2025 (Hoffmann et al., 2004)
35
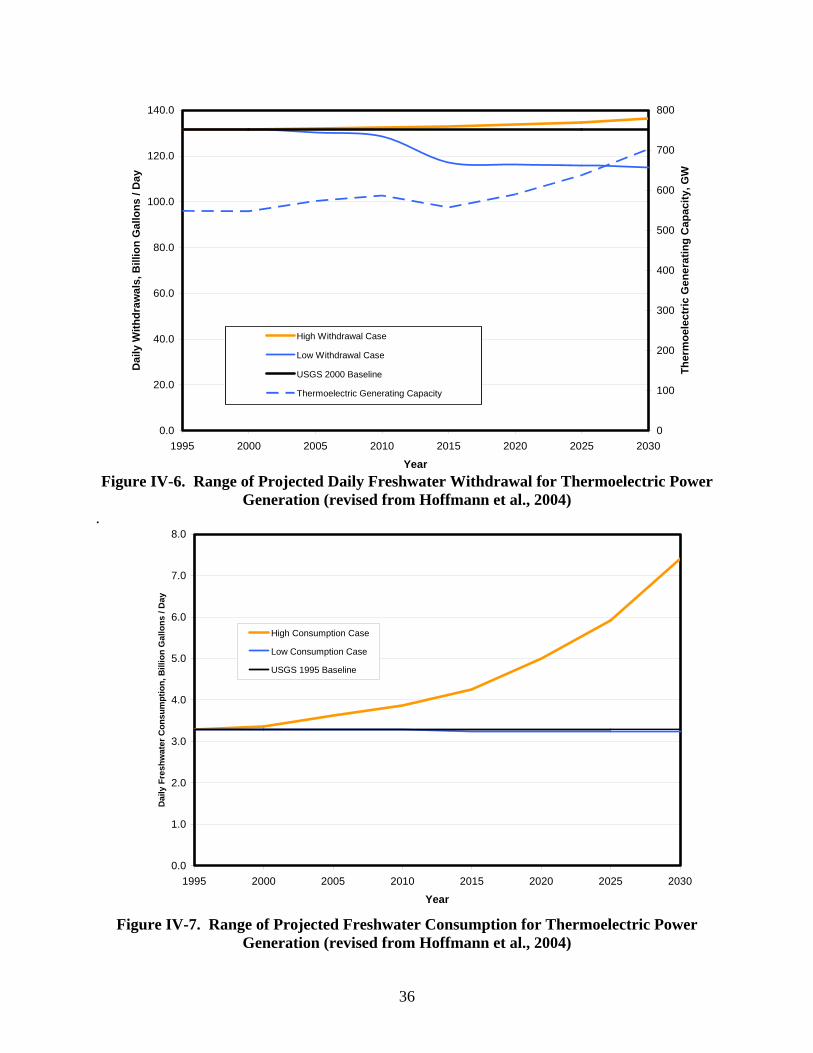
The results show the range of water with-drawal and consumption possible, depend-ing upon which plants are retired (e.g., sea-water or freshwater cooled) and whether open-loop cooling systems were reused in new plants or replaced with closed-loop cooling systems. As shown in Figure IV-6, not much change in water withdrawal rates is expected. Withdrawal requirements could increase slightly as additional plants are installed or could decline somewhat if plants using freshwater open-loop cooling are replaced by plants using other cooling systems. However, as shown in Figure IV-7, freshwater consumption by the power-
generation sector could more than double if evaporative closed-loop cooling is used for new and replacement generation capacity (the high-consumption case). Only in the case that capacity additions are installed in coastal areas and use seawater for open-loop cooling would consumption remain flat (the low-consumption case). The water required in the high-consumption case is equivalent to the daily domestic water consumption of about 50 million people. This would have a significant impact on the availability and value of water given competing uses, including agricultural and nonagricultural water consumption.
0
100
200
300
400
500
600
700
800
1995 2000 2005 2010 2015 2020 2025 2030
Year
Gen
erat
ing
Cap
acity
, GW
Nuclear PowerSteam Component of Combined CycleOther Fossil SteamCoal Steam
Figure IV-5. Projected Steam-Electric Generation Capacity by Type Projected from EIA
Reference Case (EIA, 2006)
36
0.0
20.0
40.0
60.0
80.0
100.0
120.0
140.0
1995 2000 2005 2010 2015 2020 2025 2030
Year
Dai
ly W
ithdr
awal
s, B
illio
n G
allo
ns /
Day
0
100
200
300
400
500
600
700
800
Ther
moe
lect
ric G
ener
atin
g C
apac
ity, G
W
High Withdrawal Case
Low Withdrawal Case
USGS 2000 Baseline
Thermoelectric Generating Capacity
Figure IV-6. Range of Projected Daily Freshwater Withdrawal for Thermoelectric Power
Generation (revised from Hoffmann et al., 2004) .
0.0
1.0
2.0
3.0
4.0
5.0
6.0
7.0
8.0
1995 2000 2005 2010 2015 2020 2025 2030
Year
Dai
ly F
resh
wat
er C
onsu
mpt
ion,
Bill
ion
Gal
lons
/ D
ay
High Consumption Case
Low Consumption Case
USGS 1995 Baseline
Figure IV-7. Range of Projected Freshwater Consumption for Thermoelectric Power Generation (revised from Hoffmann et al., 2004)

37
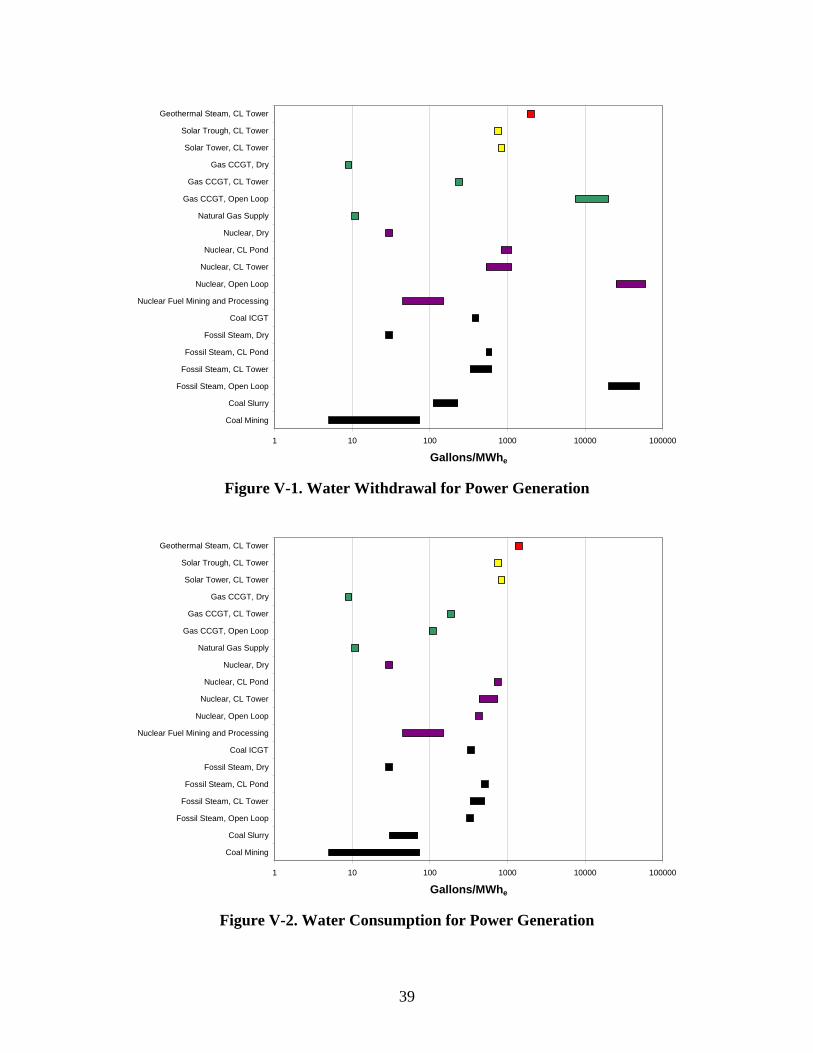
Chapter V. Opportunities to Secure America’s Energy and Water Future ADDRESSING FUTURE WATER NEEDS IN THE POWER SECTOR There are a number of technologies in various stages of development with the potential to reduce the use of water per unit energy (the water intensity) for power generation. These technologies will be deployed when they are economical, based on changes in water value and availability. Potential options for meeting future energy production and generation needs with reduced water use intensity are identified below. Table V-1 and Figures V-1 and V-2 show water use for a range of electric-generating technologies, including water use for fuel extraction and processing. Data supporting the table are found in Appendix A for energy extraction and in Appendix B for power generation. (Not included in the figures is the water required to manufacture and construct energy facilities, such as the water used in manufacturing the components of, or to construct, a power plant.) Advanced Cooling for Thermoelectric Power Plants Opportunity: Reduces water use. Gap: Cost, complexity, hot weather performance, scalability to large power plants
The amount of water used to condense steam from steam-driven turbine generators (per unit electricity output) depends on the type of cooling system and the efficiency of the turbine. Turbine efficiency increases as the difference between the steam tempera-ture and the condensing temperature increases. Plants with higher efficiencies require less cooling per unit energy produced. Coal plants operate at higher temperatures than today’s nuclear plants, as
shown in Table V-1, so coal plants require less water than today’s nuclear plants. Some renewable power plants also use steam turbines with closed-loop cooling. These include solar thermal troughs, solar power towers, and geothermal steam plants. Dry Cooling – One approach to reduce water use in thermoelectric plants is to replace the evaporative cooling towers in closed-loop systems (Figure II-3) with dry cooling towers cooled only by air, but there is an impact on plant efficiency. Evaporative closed-loop cooling provides cooling that approaches the dew point tem-perature. Dry cooling can approach only the ambient air temperature. Unless the relative humidity is 100 percent, the air temperature is always higher than the dew point, so the outlet temperature of a dry-cooling system will almost always be higher than for an evaporative system. As the cooling system outlet temperature increases, plant efficiency decreases. In other words, plant efficiency is higher for plants using evaporative cooling than for plants using dry cooling, especially in a hot, arid climate. Over the course of a year, the output of a plant with dry cooling will be about 2 percent less than that of a similar plant with evaporative closed-loop cooling, depending on the local climate. However, in the hottest weather, when power demands are highest, plant efficiency may decrease by up to 25 percent (USDOE, 2002a). Decreased plant efficiency means increased fuel use and increased emissions. This could provide greater incentives for other efficiency and emission control technology improvements. In addition, dry cooling systems must be larger than comparable evaporative closed-loop systems, and that increases the cost for

38
Table V-1. Water Intensity for Various Power Generation Technologies
(EPRI, 2002a; CEC, 2002; CEC, 2006; Grande, 2005; Leitner, 2002; Cohen et al., 1999) See Appendix A for Fuel References
Water intensity (gal/MWhe) Plant-type Process Steam Condensing Other Use
Steam Withdrawal Consumption Withdrawal Consumption Mining 5–74 Coal Slurry 110–230 30–70
OL Cooling 20,000–50,000 ~300
CL Tower 300–600 300–480 CL Pond 500–600 ~480
Fossil/ biomass/
waste Dry 0 0
~30**
Nuclear Mining and Processing 45–150
Nuclear OL Cooling 25,000–60,000 ~400
Nuclear CL Tower 500–1,100 400–720 Nuclear CL Pond 800–1,100 ~720 Nuclear Dry 0 0
~30**
Geothermal Steam CL Tower ~2000 ~1400 Not available
Solar trough CL Tower 760–920 760–920 8** Solar tower CL Tower ~750 ~750 8**
Other Natural Gas Supply ~11
OL Cooling 7,500–20,000 100
CL Tower ~230 ~180 Natural Gas
CC Dry 0 0
7–10**
Coal IGCC* CL Tower ~250 ~200 7–10 + 130 (process water)** Hydro-electric Evaporation 4500 (ave)
OL = Open loop cooling, CL = Closed Loop Cooling, CC = Combined Cycle *IGCC = Integrated Gasification Combined-Cycle, includes gasification process water Other Use includes water for other cooling loads such as gas turbines, equipment washing, emission treatment, restrooms, etc. **References did not specify whether values are for withdrawal or consumption.
Thermo-electric power
generation withdraws 136 billion
gallons per day
and consumes 3.3 billion
gallons per day
Mining of coal
consumes 0.07 to 0.26
billion gallons per day
39
1 10 100 1000 10000 100000
Coal Mining
Coal Slurry
Fossil Steam, Open Loop
Fossil Steam, CL Tower
Fossil Steam, CL Pond
Fossil Steam, Dry
Coal ICGT
Nuclear Fuel Mining and Processing
Nuclear, Open Loop
Nuclear, CL Tower
Nuclear, CL Pond
Nuclear, Dry
Natural Gas Supply
Gas CCGT, Open Loop
Gas CCGT, CL Tower
Gas CCGT, Dry
Solar Tower, CL Tower
Solar Trough, CL Tower
Geothermal Steam, CL Tower
Gallons/MWhe
Figure V-1. Water Withdrawal for Power Generation
1 10 100 1000 10000 100000
Coal Mining
Coal Slurry
Fossil Steam, Open Loop
Fossil Steam, CL Tower
Fossil Steam, CL Pond
Fossil Steam, Dry
Coal ICGT
Nuclear Fuel Mining and Processing
Nuclear, Open Loop
Nuclear, CL Tower
Nuclear, CL Pond
Nuclear, Dry
Natural Gas Supply
Gas CCGT, Open Loop
Gas CCGT, CL Tower
Gas CCGT, Dry
Solar Tower, CL Tower
Solar Trough, CL Tower
Geothermal Steam, CL Tower
Gallons/MWhe
Figure V-2. Water Consumption for Power Generation

40
construction, installation, operation maintenance, and land. The result is that, as the value of water increases, there is increased need and value for technologies that reduce water and energy use, especially to meet peak demand on hot days, when dry-cooled systems lose efficiency. In total, dry-cooled systems impose a cost penalty ranging from 2 to 5 percent (Maul-betsch, 2006a) to 6 to 16 percent (CEC, 2002) for the cost of energy compared to evaporative closed-loop cooling. These ranges reflect the fact that the cost penalty is highly dependent on the value placed on the energy that is not generated and must be re-placed when the weather is hot and demand is high. Dry cooling is best suited to wet, cool climates (not the dry, arid climates of the West where water is most scarce). As of 2002, dry cooling had been installed on only a fraction of 1 percent of U.S. generating capacity, mostly on smaller plants (CEC, 2002). Hybrid Cooling – Hybrid cooling systems combine dry cooling and wet cooling to re-duce water use relative to wet systems while improving hot-weather performance relative to dry systems. Hybrid cooling has also been used for plume abatement, reducing the vapor exhaust to avoid potential foggy or icy conditions on nearby roadways, but these systems do not emphasize water conserva-tion. Most hybrid systems have been installed for plume abatement, with a notable exception located at the Public Service Company of New Mexico (PNM) San Juan Generating Station (see sidebar) (CEC, 2002). One approach to hybrid cooling is spray cooling enhancement of air-cooled condens-ers (EPRI, 2003b). This approach is low
cost but uses a significant amount of water during operation and could lead to scaling or corrosion of the condenser. Thus, it is best suited for applications where enhanced cooling is needed only on the order of one hundred hours per year (Maulbetsch, 2006b). An alternative approach useful when ex-tended operation is needed (e.g., a thousand hours per year) is a parallel wet/dry system, which uses a dry tower and a conventional evaporative cooling tower to augment cool-ing in the hottest weather. These have been applied successfully to small power plants, but Micheletti and Burns caution that application of this approach to large (400 MW) plants might be difficult to control (Micheletti and Burns, 2002).
The Public Service Company of New Mexico operates a hybrid cooling tower at its coal-fired San Juan Generating Station. PNM reports that “Unit 3 at San Juan has a ‘hybrid’ cooling tower—one that can run in both wet and dry modes. Unfortunately, this unit has not performed as well as the wet cooling tower units. Engineering estimates indicate that converting the plant to dry cooling could add at least 10 percent to the cost of electricity production because of lower energy efficiency and increased construction and maintenance costs. Be-cause of the ‘energy penalty’ thus im-posed, the amount of emissions per megawatt produced will also increase with the use of dry cooling.” http://www.pnm.com/environment/sj_water.htm

41
Combined-Cycle Gas Turbines Opportunity: Reduce water use by half. Gap: High cost of fuel and increasing dependence on imports (gas). Technology validation (coal). Natural-gas-fired combined-cycle gas turbines use (withdraw and consume) about half as much water as coal-fired plants and have been deployed in large numbers in recent years. The gas turbines in these plants provide two-thirds of their power generation. The hot exhaust from the gas turbine is used to generate steam, which drives a steam turbine to provide the remaining generation. Water use is reduced because only the steam turbine requires condensate cooling. In recent years, simple-cycle and combined-cycle natural gas turbine plants have provided much of the new generating capacity installed in the U.S. But as natural gas prices have increased, the EIA forecasts fewer installations of these plants and increased installations and upgrades of conventional thermoelectric plants (EIA, 2000; EIA, 2006). Integrated Gasification Combined-Cycle power plants are being developed that combine coal gasification with a combined-cycle gas turbine. As with the natural-gas combined-cycle plants, water use is lower than for conventional thermoelectric plants, although, as shown in Table V-1, some water is consumed in converting coal to syngas (Feeley, 2005).
Renewable Electric Power Opportunity: Reduce water use, provide peak power needs, carbon-free. Gap: Cost, manufacturing/deployment capacity. For some technologies, intermittency/need for storage at high penetration. Some renewable energy technologies consume no freshwater during operation, so they are not included in Figures V-1 and V-2. These technologies include • Wind • Solar photovoltaics • Solar dish-engine • Geothermal hot water (binary) systems
that are air cooled • Run-of-river hydroelectric • Ocean energy systems In addition, existing reservoirs that do not currently have hydroelectric capacity are candidates for power generation. To reduce impacts on the aquatic environment, these plants could use fish-friendly turbines. Of these technologies, wind is currently being installed in the largest quantities, with more than 6300 MW of capacity installed in the United States (USDOE, 2005a). Solar photovoltaic systems installation is also expanding rapidly, with approximately 400 MW installed through 2004 (Margolis, 2006). Generation of electrical power by these low water use technologies can help offset power generation from more water-intensive technologies (Thresher, 2005; USDOE, 2006b; USDOE, 2006c).

42
A common concern is that while geother-mal, hydropower, solar thermal power with integrated storage, and biomass power can provide dispatchable power, other technolo-gies, such as wind and solar photovoltaic, are intermittent and must be backed up by other generating systems. However, demand for electricity also fluctuates throughout the day. Connecting modest amounts of intermittent renewable sources to the grid has not been shown to undermine grid stability. On the contrary, both solar and wind have the potential to improve grid
operation by providing power when it is most needed, during the hottest/windiest part of the day, as shown in Figure V-3 for solar generation. At some point, deployment of solar and wind technologies could increase the need for energy storage. In terms of technical capability, hydroelectric generation, includ-ing pumped storage, has the capacity to meet these potential needs. Grid support can also be provided with other peaking technologies or with other storage technologies.
Figure V-3. Peak Reduction from Combined Use of Solar Energy and Demand Management in a Residential Application (USDOE, 1999)
43
ADDRESSING WATER NEEDS IN THE EMERGING FUEL SECTOR Much of the country’s current transportation fuels are derived from imported petroleum. An approach being considered to reduce dependence on foreign sources of energy is to increase the development and use of domestic energy sources, and most energy extraction and processing activities require water. The water use per-unit-energy for fuel extraction and processing is summar-ized in Figure V-4. Some options to address these challenges are discussed below. Oil Shale Opportunity: Large domestic resource. Gap: Cost, potential water demand, technology to mitigate environmental impacts. The U.S. is estimated to have two trillion barrels of oil in the form of oil shale depos-its, which is more than triple the proven oil resources of Saudi Arabia. Due to histori-cally high costs for development, oil shale is not currently widely produced in the U.S., but is increasingly being considered as a major future source of domestic oil supplies (USDOE, 2004b). Initial recovery work focused on mining and above-ground processing (retorting) that consumed 2 to 5 gallons of water per gallon of refinery-ready oil (Bartis, 2005). Pro-viding 25 percent of U.S. oil demand would require 400 to 1000 million gallons of water per day. Because oil shale resources are predominantly located in areas where water availability is limited and has a high value, oil shale development may be constrained. In addition, runoff could wash salt from shale residue into surface waters.
More recently, an electrically-driven under-ground process is being prototyped that does not directly use water. However, generation of the required electricity would consume about one-third of the energy produced (Bartis, 2005). If combined-cycle gas turbines with evaporative closed-loop cooling systems were used to produce the electricity, consumptive requirements would be approximately 250 million gallons of water per day. In either case, the energy consumed to produce fuel from oil shale will increase U.S. emission of carbon dioxide by up to 50 percent per unit energy, unless carbon-free energy sources are used for mining and processing or unless a vigorous program of carbon sequestration is implemented. Renewable and Alternative Fuels Opportunity: Renewable, carbon-neutral domestic fuels and fuels from domestic coal and gas. Gap: Technology, cost. Water use for current biofuel production. As noted in Chapter II, biofuels currently provide about 3 percent of our transportation fuels. In the future, biofuels are being considered as a potential domestic source for producing significantly larger volumes of transportation fuel (USDOE, 2005d; Tyson et al., 2004; Perlack et al., 2005). Currently, the most water-intensive aspect of biofuel production is growing the feedstock. When that feedstock is corn or soy (used to make ethanol and biodiesel, respectively) and the feedstock is grown on irrigated land, the water consumption is quite high, as shown in Figure V-4.

44
On the other hand, biofuel feedstock pro-duced from crop residues in excess of those needed to maintain a healthy ecosystem, from feedstocks grown without irrigation, or from feedstocks grown with nontraditional water, will have minimal freshwater use intensity associated with production. This could provide significant volumes of bio-energy and biofuels in the future with low water use intensity (Perlak et al., 2005). In all cases, some water use is associated with processing, as shown in Figure V-4, but further technology development is likely to lower these values.
Production of alternative fuels, such as syn-fuels from coal or hydrogen from methane, also requires water, at up to triple the re-quirements for water consumption in petro-leum refining. Reforming hydrogen from methane is quite water intensive. Even production of hydrogen by electrolysis using a water-independent source of energy like wind requires water as feedstock to the electrolyzers. In summary, virtually every alternative will require as much water as refineries consume now, if not substantially more. To be able to increase domestic supplies of transportation fuels will require
1 10 100 1000 10000 100000
Coal Mining
Coal Washing
Coal Liquefaction
Coal Slurry
Coal Gasification
Natural Gas Extraction & Processing
Natural Gas Pipeline Operations
Gas Storage in Salt Cavern**
Petroleum Extraction
Enhanced Oil Recovery
Refining
Oil Shale Surface Retort
Oil Shale In-Situ*
Oil Sands
Oil Storage in Salt Cavern**
Uranium Mining
Uranium Processing
Hydrogen Reforming
Hydrogen Electrolysis
Corn Irrigation
Ethanol Processing
Soy Irrigation
Biodiesel Refining
Gal/MMBTU
Figure V-4. Water Consumption Per-Unit-Energy and Current Water Use for Fuel
Extraction and Processing See Appendix B for Data References
Petroleum Refining
Consumes 1-2 Billon
Gallons per Day

45
significant water resources using current approaches and options. ADDRESSING FUTURE U.S. WATER NEEDS Over the past century, the U.S. has had national programs to develop its vast water resources. Programs by the Bureau of Reclamation, the Army Corps of Engineers, and other federal and state agencies have enabled the U.S. to harness the vast surface water resources of the country’s river systems, control floods, store water for agri-cultural, industrial, and domestic uses, and generate hydroelectric power. In parallel, programs through agencies like the USGS have allowed states to exploit tremendous groundwater resources and monitor and manage surface water flows to achieve more efficient use of water. As noted in previous sections, the ability to easily expand freshwater availability may be limited. Some possible options to address the future needs are discussed below. Increasing and Stretching Water Supplies Opportunity: Improve water supply under-standing and utilization, stretch water supplies. Gap: Lack of water consumption data, water storage to address increased needs, climate variability, policy, coordination. The rate of water withdrawal grew as the economy grew through most of the last century but has leveled off and even declined in recent years. Changes in the rate of consumption are more difficult to assess. The last USGS report on water consumption was for 1995 (Solley et al., 1998), and the last detailed analysis was published in 1978 (U.S. Water Resources Council, 1978). Meanwhile, there are many signs that consumption, if not growing, may still be outpacing available supplies: aquifers are declining, stored water levels are low, and communities are seeking to improve their
access to water supplies, in part through desalination and re-use of water. However, best courses of action cannot be accurately determined without detailed water use and consumption data, which are lacking. Water Storage – Storage is an important part of any water infrastructure. Reservoirs capture runoff for release at a later time, making available freshwater that would otherwise have flowed downstream. Several factors have affected the availability and use of freshwater supplies: decreased water storage capacity because of reservoir sedimentation, requirements to limit water level fluctuations within the reservoir (for recreation or aesthetic reasons), or requirements to meet downstream flow targets for fish and wildlife needs. Another type of storage is the natural storage of moisture in snow pack. Recent climate trends suggest that snow packs are decreasing over time and annually are melting earlier (Mote, 2004). The decreased storage of water in snow packs will limit the reliable yield of river systems that derive much of their flow from the melting of snow pack. Thus, even without changes in the amount of man-made storage, reliable yields of some rivers are likely to decrease if these snow pack trends continue. Few surface-water storage projects have been built in recent years, and groundwater supplies in some parts of the Nation are in decline. There are promising means of increasing storage in order to increase reliable yields of water that involve the use of aquifers as part of the water management system (AwwaRF, 1996; AwwaRF, 2005a) . This includes “conjunctive use” (wherein groundwater and surface water are managed jointly, using surface water when it is abun-dant and groundwater during dry seasons and dry years). In addition, artificial recharge and aquifer storage and recovery

46
are approaches that can increase reliable supplies by purposefully augmenting recharge with excess surface water (or treated effluent) in times when it is readily available, and then withdrawing that water in times of shortage. There are, however, significant energy implications of these technologies in terms of the energy that is required to treat and inject water and then to pump it out when the water is needed. In addition, there are efficiency questions with these technologies. Not all of the water injected can ever be withdrawn. Also, there are a variety of geochemical problems that can arise from the mixing of surface water and groundwater in the aquifer. These problems can result in the long-term decline in the effectiveness of these storage systems (Hirsch, 2006). Desalination – Options to expand freshwa-ter supply include use of impaired water such as brackish groundwater or seawater. Saline groundwater underlies much of the
country, as shown in Figure V-5. These waters may be converted to potable water by using desalination. Desalination requires more energy than typical public water supplies, as shown in Figure V-6. Energy requirements for desalination are similar to the requirements for pumping water long distances via projects like the California State Water Project. Another source of brackish water is pro-duced water from oil and gas extraction. Produced water from conventional oil and gas production is usually saline, while produced water from coal bed natural gas production may be fresh or nearly fresh. Depending on their resultant quality, these produced waters may be used with minimal cleanup for nonpotable applications such as irrigation. If the water is more heavily contaminated, treatment and disposal following applicable laws and regulations may be the only alternative.
Figure V-5. Degraded Water Resources of the U.S.
(USGS, 2003)
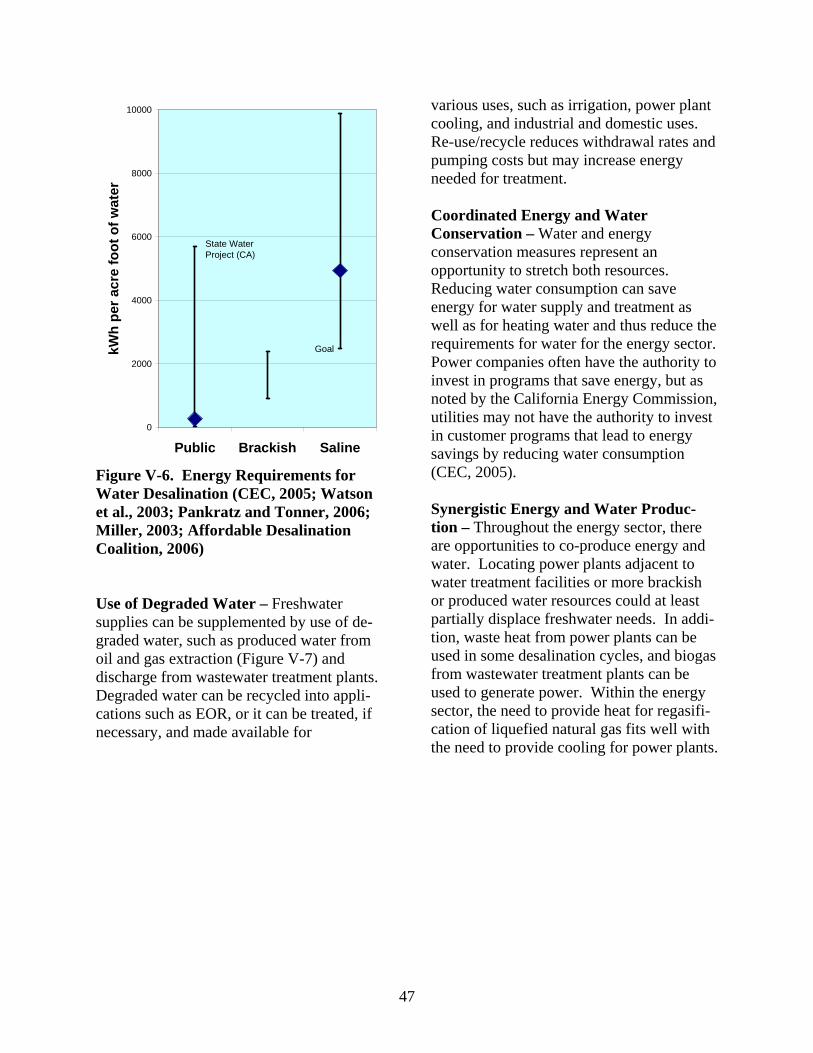
47
0
2000
4000
6000
8000
10000
Public Brackish Saline
kWh
per a
cre
foot
of w
ater
Goal
State Water Project (CA)
Figure V-6. Energy Requirements for Water Desalination (CEC, 2005; Watson et al., 2003; Pankratz and Tonner, 2006; Miller, 2003; Affordable Desalination Coalition, 2006) Use of Degraded Water – Freshwater supplies can be supplemented by use of de-graded water, such as produced water from oil and gas extraction (Figure V-7) and discharge from wastewater treatment plants. Degraded water can be recycled into appli-cations such as EOR, or it can be treated, if necessary, and made available for
various uses, such as irrigation, power plant cooling, and industrial and domestic uses. Re-use/recycle reduces withdrawal rates and pumping costs but may increase energy needed for treatment. Coordinated Energy and Water Conservation – Water and energy conservation measures represent an opportunity to stretch both resources. Reducing water consumption can save energy for water supply and treatment as well as for heating water and thus reduce the requirements for water for the energy sector. Power companies often have the authority to invest in programs that save energy, but as noted by the California Energy Commission, utilities may not have the authority to invest in customer programs that lead to energy savings by reducing water consumption (CEC, 2005). Synergistic Energy and Water Produc-tion – Throughout the energy sector, there are opportunities to co-produce energy and water. Locating power plants adjacent to water treatment facilities or more brackish or produced water resources could at least partially displace freshwater needs. In addi-tion, waste heat from power plants can be used in some desalination cycles, and biogas from wastewater treatment plants can be used to generate power. Within the energy sector, the need to provide heat for regasifi-cation of liquefied natural gas fits well with the need to provide cooling for power plants.

48
Figure V-7. U.S. Oil and Gas Resources (USGS, 2006)
Explanation Oil Production Mixed Production Gas Production Dry Wells

49
Chapter VI. Addressing Energy-Water Challenges: Bridging the Gaps
To sustain a reliable and secure energy future that is cost effective, environmentally sound, and supports economic growth and development, the energy and water challenges and gaps identified in the previous chapters must be effectively addressed. This includes consideration of the impact that water policies and regulations have on energy supplies and demands, and the impact energy policies and regulations have on water demands and availability. Properly quantifying and valuing energy and water resources will enable the public and private sectors to better balance the energy and water needs of all users and develop strategies and approaches to enhance future energy security and sustainability. Major considerations are described in the following sections. COLLABORATION ON RESOURCE PLANNING Collaboration on energy and water resource planning is needed among federal, regional, and state agencies as well as with industry and other stakeholders. In most regions, energy planning and water planning are done separately. The lack of integrated energy and water planning and management has already impacted energy production in many basins and regions across the country. For example, in three of the fastest growing regions in the country, the Southeast, Southwest, and the Northwest, new power plants have been opposed because of poten-tial negative impacts on water supplies. (Tucson Citizen, 2002; Reno-Gazette Jour-nal, 2005; U.S. Water News Online, 2002 and 2003; Curlee, 2003). Also, recent droughts and emerging limitations of water resources has many states, including Texas, South Dakota, Wisconsin, and Tennessee,
scrambling to develop water use priorities for different water use sectors (Clean Air Task Force, 2004a; Milwaukee Journal Sentinel, 2005; GAO, 2003; Curlee, 2003; Hoffman, 2004; U.S. Water News Online, 2003). Also see Chapter IV, Figure IV-2 for other examples. Mechanisms, such as regional natural resources planning groups, are needed to foster collaboration between stakeholders and regional and state water and energy planning, management, and regulatory groups and agencies. These types of collaborative efforts are needed to ensure proper evaluation and valuation of water resources for all needs, including energy development and generation. SCIENCE AND SYSTEM-BASED NATURAL RESOURCE POLICIES AND REGULATIONS Often, polices or regulations developed to support or enhance one area, such as increasing domestic energy supplies through EOR, could have unintended negative impacts on regional or national freshwater availability or water quality. System-level evaluations by stakeholders and government agencies can be used to assess the impact of current or proposed natural resource policies and regulations and improve future energy development and water availability. ENERGY-WATER INFRASTRUCTURE SYNERGIES When the energy infrastructure is evaluated in a system context, significant improve-ments in energy and water conservation can often be realized through implementation of innovative processes or technologies, co-location of energy and water facilities, or improvements to energy and water infra-structures. Past investments in the water

50
infrastructure by creating dams and surface-water reservoirs in the U.S. over the past 80 years have significantly improved the availability of water for some applications and decreased its availability for other applications. There will continue to be competition for water resources between different users, and ways to reduce these conflicts through coordinated infrastructure development would be beneficial. BRIDGING THE GAPS: DIRECTION AND IMPLEMENTATION Based on the emerging trends in energy and water natural resource availability and use, the U.S. will continue to face issues related to natural resource planning and manage-ment. Available surface water supplies have not increased in 20 years, and groundwater tables and supplies are decreasing. Ensuring ecosystem health could further constrain freshwater supplies. At the same time, populations continue to grow and move to areas with already limited water supplies. Based on current water markets and values, the growth in energy demand, along with stricter environmental regulations on cooling water withdrawals, could double water consumption for electric power generation over the next 25 years, consuming as much additional water per day as 50 million people or more. The increasing and interrelated value of water and energy production and electric-power generation has been documented in many river basins across the country as noted in Chapter IV. Additionally, changes in energy strategies in the electricity and transportation sectors could further increase water consumption and the value of fresh-water supplies.
Two major activities are under way that can help provide insight to these emerging criti-cal energy-water challenges. These two activities are independent but are closely related and should be considered as programs and approaches are developed to address emerging energy and water issues. Subcommittee on Water Availability and Quality – In August 2004, the Office of Science and Technology Policy and the Office of Management and Budget called for a “coordinated, multi-year plan to improve research to understand the processes that control water availability and quality, and to collect and make available the data needed to ensure an adequate water supply for the Nation’s future.” (SWAQ, 2004) That work is being carried out by the Sub-committee on Water Availability and Qual-ity (SWAQ), established under the National Science and Technology Council Committee on Environment and Natural Resources (SWAQ, 2004). The SWAQ includes repre-sentatives from the federal agencies associ-ated with water management, water moni-toring, water availability, and water quality. Many of the energy security and reliability issues and challenges identified in this report are impacted by water availability and qual-ity and the collection of water data. There-fore, many of the challenges identified are issues that will be considered by SWAQ in its broader review of water research and water data needs. The challenges identified in this report should be provided to the SWAQ for their review and integration as they find appropriate. This will provide a national-level screening by federal water agencies of appropriate priorities and implementation strategies.

51
Energy-Water Research Roadmap – As a next step in addressing emerging critical energy and water challenges, Congress provided funding in FY 2005 for DOE to initiate an Energy-Water Science and Technology Research Roadmap. The purpose of the Roadmap is to help DOE and the Nation assess current regional and national energy and water issues and con-cerns, and identify appropriate interactions and coordination approaches with federal and state energy and water agencies. As de-fined by Congress, these efforts must ensure that the following energy and water issues are addressed in the future: 1. Energy-related issues surrounding
adequate water supplies and optimal management and efficient use of water.
2. Water-related issues surrounding adequate supplies, optimal management, and efficient use of energy.
The Energy-Water Research Roadmap effort included a series of workshops with par-ticipation by representatives from a broad range of user communities, including envi-ronmental organizations, policy and regula-tory groups, economic development organi-zations, industry/supplier associations, government agencies (federal, state, tribal), nongovernmental organizations, science and technology providers (national laboratories, universities, research institutions), water and energy resource management and generation and production groups, and other knowl-edgeable stakeholders from across the country. The workshops were led by Sandia National Laboratories with support from the Utton Transboundary Resources Center of the University of New Mexico School of Law and Lawrence Berkley National Laboratory, and were facilitated by McNeil Technol-ogies. The workshops were developed under the guidance of Energy-Water Nexus
Executive Committee and the National Laboratory Energy-Water Nexus Committee. The Executive Committee includes eighteen representatives from the federal government, industry, and universities. The National Laboratory committee includes all of the twelve DOE national laboratories. Three regional workshops were held to identify critical regional issues and needs that could be combined to produce a broader framework of national issues. These workshops were held November 2005 in Kansas City (56 participants), December 2005 in Baltimore (94 participants), and January 2006 in Salt Lake City (121 participants). Each workshop identified a number of regional issues and concerns. As expected, many of the concerns identified are common throughout the country. Most regions and subregions, specifically in the West, Central, and Southeastern parts of the U.S., are trying to deal with growing water shortages and the impact of increasing water demands of several sectors on future growth, energy resource value, and future energy and water availability and costs. The regional needs-assessment workshops were followed by a technical evaluation workshop in March 2006 to identify gaps between current federal and state energy and water research and management programs and future needs and directions. This was followed by a national technology innova-tion workshop, held in May 2006, to identify major science and technology research and development steps needed to address these challenges and bridge these gaps. SUMMARY As identified in this report, the Nation has started to experience an increased need and value for technologies that allow energy production with reduced freshwater inten-sity. There are a variety of indicators that suggest that many regions of the country

52
may need to reassess the value of energy and water resources and consider new technolo-gies and approaches to optimize economic growth and support long-term energy and water supply reliability and sustainability. By the end of 2006, the combined efforts of the SWAQ and the Energy-Water Science
and Technology Research Roadmap should provide a much more detailed understanding of the major water issues and needs across the country. The information developed through the SWAQ and the Energy-Water Research Roadmap should provide a strong foundation to help address these emerging energy-water challenges.
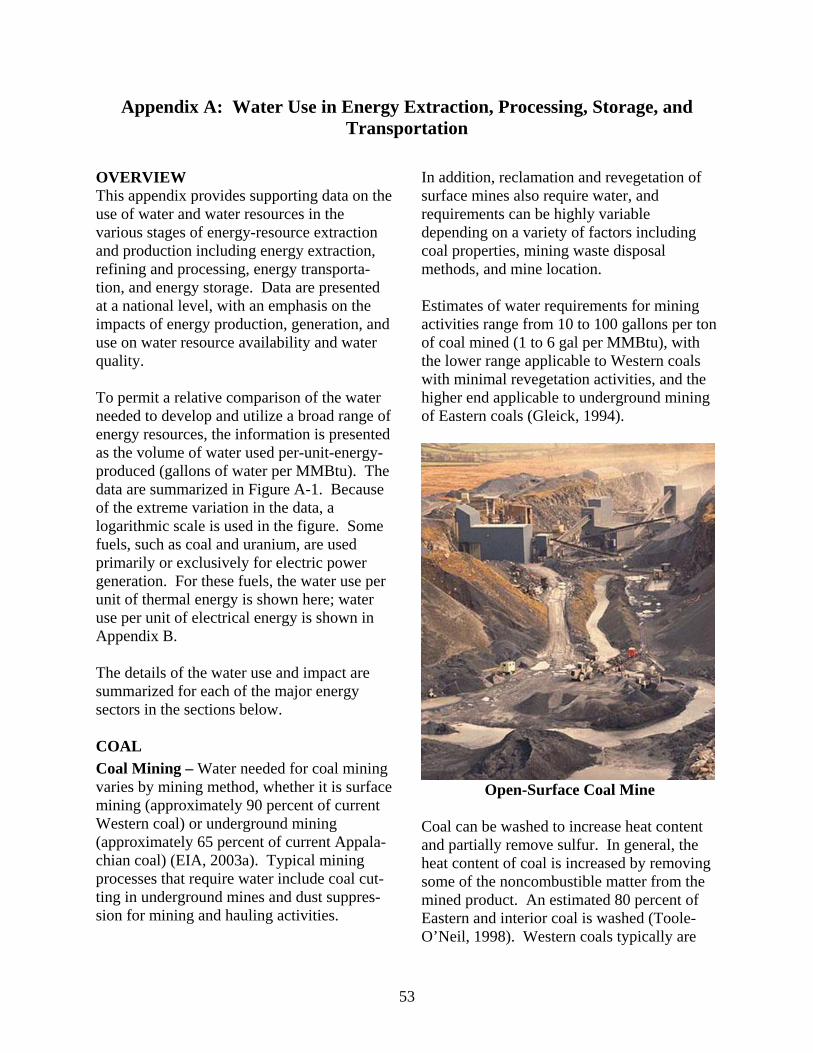
53
Appendix A: Water Use in Energy Extraction, Processing, Storage, and Transportation
OVERVIEW This appendix provides supporting data on the use of water and water resources in the various stages of energy-resource extraction and production including energy extraction, refining and processing, energy transporta-tion, and energy storage. Data are presented at a national level, with an emphasis on the impacts of energy production, generation, and use on water resource availability and water quality. To permit a relative comparison of the water needed to develop and utilize a broad range of energy resources, the information is presented as the volume of water used per-unit-energy-produced (gallons of water per MMBtu). The data are summarized in Figure A-1. Because of the extreme variation in the data, a logarithmic scale is used in the figure. Some fuels, such as coal and uranium, are used primarily or exclusively for electric power generation. For these fuels, the water use per unit of thermal energy is shown here; water use per unit of electrical energy is shown in Appendix B. The details of the water use and impact are summarized for each of the major energy sectors in the sections below. COAL Coal Mining – Water needed for coal mining varies by mining method, whether it is surface mining (approximately 90 percent of current Western coal) or underground mining (approximately 65 percent of current Appala-chian coal) (EIA, 2003a). Typical mining processes that require water include coal cut-ting in underground mines and dust suppres-sion for mining and hauling activities.
In addition, reclamation and revegetation of surface mines also require water, and requirements can be highly variable depending on a variety of factors including coal properties, mining waste disposal methods, and mine location. Estimates of water requirements for mining activities range from 10 to 100 gallons per ton of coal mined (1 to 6 gal per MMBtu), with the lower range applicable to Western coals with minimal revegetation activities, and the higher end applicable to underground mining of Eastern coals (Gleick, 1994).
Open-Surface Coal Mine
Coal can be washed to increase heat content and partially remove sulfur. In general, the heat content of coal is increased by removing some of the noncombustible matter from the mined product. An estimated 80 percent of Eastern and interior coal is washed (Toole-O’Neil, 1998). Western coals typically are

54
1 10 100 1000 10000 100000
Coal Mining
Coal Washing
Coal Liquefaction
Coal Slurry
Coal Gasification
Natural Gas Extraction &Processing
Natural Gas Pipeline Operations
Gas Storage in Salt Cavern**
Petroleum Extraction
Enhanced Oil Recovery
Refining
Oil Shale Surface Retort
Oil Shale In-Situ*
Oil Sands
Oil Storage in Salt Cavern**
Uranium Mining
Uranium Processing
Hydrogen Reforming
Hydrogen Electrolysis
Corn Irrigation
Ethanol Processing
Soy Irrigation
Biodiesel Refining
Gal/MMBTU
*Water Consumption for Electric Power from Evaporatively-Cooled Combined Cycle Gas Turbine **One-Time Use for Solution Mining of Salt Cavern
Figure A-1. Water Consumption for Energy Extraction, Processing, Storage, and
Transport
1 MMBtu = approximately 8 gallons of gasoline

55
found in homogeneous seams with low sulfur content and are rarely subjected to washing. Rather, western coals are usually only subjected to crushing and screening to facilitate handling and to remove some of the extraneous material introduced during the mining process. Water requirements for coal washing are quite variable, with estimates of roughly 20 to 40 gallons per ton of coal washed (1 to 2 gal per MMBtu) (Gleick, 1994; Lancet, 1993). In addition to water withdrawn to meet the needs described above, water might natu-rally accumulate in subsurface mines and be pumped to the surface. Western mines may also have coal seams that must be dewa-tered. This water, while incidental to min-ing activities, nevertheless represents with-drawal of groundwater. Water pumped from mines may be used to supply process needs, including cutting and washing. Excess mine water and discharged process water are contaminated and require treatment via settling ponds or other means. On occasion, water is spilled from mining operations; 300 million gallons of coal sludge spilled in an incident in Kentucky in October, 2000 (Clean Air Task Force, 2004a). Recycling of water in the under-ground mining process can dramatically reduce water consumption. By combining 2003 national coal production statistics (EIA, 2006) with the data above, a rough estimate of national water consump-tion required for coal extraction (mining and washing) is 70 to 260 million gallons per day, approximately 3 to 13 percent of fresh-water withdrawals for the mining water-use sector in 2000 (Hutson et al., 2004).
Coal Transport – Water is also important for the transport of coal. While more than 70 percent of coal consumed by power plants in 2003 was delivered by rail, approximately 10 percent of coal was transported on the Nation’s rivers (EIA, 2003b). Coal can also be transported by pipeline in the form of coal-water slurry. An example of such a system was the Black Mesa pro-ject, which delivered approximately 5.5 million tons of coal per year to the Mojave Power Plant in southern Nevada, until the power plant suspended operations on De-cember 31, 2005. More than 1 billion gal-lons of water per year were pumped from groundwater aquifers to supply water for the transport of coal to the plant. Coal slurry pipelines typically require water equal to the volume of coal or 11 to 24 gal per MMBtu (Gleick, 1994). About 70 percent of the water can be recycled at the power plant.
Coal Barges
Coal and other cargo transport through locks can present energy management challenges during low flows. Use of locks reduces upstream reservoir storage behind dams and can impact downstream power plants. A reservoir can lose about 2 to 10 million gallons of water for each lock operation.

56
Figure A-2. Expected Coal Production, 1970–2030 (million short tons) (EIA, 2006)
Expected continued reliance on domestic fossil energy sources will require ongoing mining of coal. To meet U.S. coal demand, the AEO2006 reference case projects continued growth in annual coal production, with the vast majority for use by the electric- generating sector. The increase in coal production is driven in large part by sulfur emission regulations, driving significant production increases in the western United States as shown in Figure A-2. This is an increase of up to12 billion gallons per year in water use, enough to support a city of 200,000 people. Water consumption for domestic and commercial needs averages 30 gal per day per capita nationwide, (Solley et al., 1998), but water consumption can be much higher in the arid West because of irrigated landscaping. URANIUM Uranium Mining – Gleick provides estimates of water consumption in mining and processing uranium (Gleick, 1994). Water required for uranium mining varies from less than 1 gal per MMBtu for underground mining to 6 gal per MMBtu for surface mines.
Uranium is primarily mined in three states: Wyoming, Texas, and Nebraska. With recent interest in energy needs and the need to reduce greenhouse gases, older mines in New Mexico and Utah are considering reopening. By doing so, these mines might generate from 3 to 5 million gallons of water a day that must be handled and disposed of (Hopp, 2005). In the past, this water has simply been disposed of by pumping into dry arroyos. However, under current regulations, the water must be treated to remove trace metals before disposal. This treatment might make the water usable for other applications. Uranium Processing – Water is also consumed in milling, enrichment, and fuel fabrication, with total consumption estimated at 7 to 8 gal per MMBtu (Gleick, 1994). About half of this estimated consumption is attributed to enrichment by gaseous diffusion; with enrichment by centrifuge, the consumption for milling, enrichment, and fuel fabrication would be 4 to 5 gal per MMBtu (Gleick, 1994).

57
OIL AND GAS Oil and Gas Extraction – Onshore oil and gas exploration and extraction have relatively minor water requirements. Water consumption for natural gas extraction is negligible, and oil extraction and production requires approximately 5 to 13 gallons per barrel of oil equivalent (boe) output (0.8 to 2.2 gal per MMBtu) (Gleick, 1994). The largest water use in onshore oil and gas extraction is for EOR. Enhanced recovery wells are used to inject water, steam, or other substances into a producing formation to displace and move oil and gas to nearby wells. The quantity of water for EOR can vary greatly, depending on the age of the field and the recovery method. The least water-intensive method for EOR (for-ward combustion/air injection) requires approx-imately 81 gal/boe (14 gal per MMBtu) and the most water-intensive method (micellar polymer) requires approximately 14,000 gal/boe (2500 gal per MMBtu). Depending on the degree of water recycle, the use of carbon dioxide for EOR can require more than 1000 gal/boe produced (Gleick, 1994). Water is typically a by-product of oil, gas, and coal-bed natural gas production. In 1995, the American Petroleum Institute estimated that oil and gas operations generated 18 billion barrels of produced water, compared to total annual petroleum production of 6.7 billion boe (both onshore and offshore, including crude oil, natural gas, and natural gas liquids production) (API, 2000). Such produced water varies in quality, and some is used for other purposes. API indicates that in 1995, approximately 71 percent of produced water was recycled and used for EOR. The amount of water produced per well varies greatly. For example, water produced by coal-bed
Drilling Rig
natural gas extraction can vary from 1.3 gal per MMBtu in the San Juan Basin (Colorado and New Mexico) to approximately 161 gal per MMBtu in the Powder River Basin (Wyoming and Montana) (Rice et al., 2000). EIA projects in the AEO2006 reference case that annual production of domestic crude oil will increase due to deepwater offshore resources and then decline through 2030, as shown in Figure A-3. However, as productivity at marginal wells declines, the use of water for EOR may increase. As shown in Figure A-4, natural gas production over the same time period is projected to increase, with substantial ramp-up of unconventional production from tight sands, shale, and coal-bed natural gas. The largest increase of onshore production is projected to occur in the Rocky Mountain production area. Oil Shale and Oil Sands – A recent report by the Rand Corporation prepared for the DOE reviewed the status of oil shale resource and development potential within the United States (Bartis, 2005), and it is the primary source of the information summarized in this section. The U.S. is

58
Figure A-3. Crude Oil Production of Contiguous States (million barrels per day) (EIA, 2006)
estimated to have 2 trillion barrels of oil in the form of oil shale deposits, which is more than triple the proven oil resources of Saudi Arabia. The world’s largest oil shale deposit is the Green River Formation, which covers parts of Colorado, Utah, and Wyoming. Initial work on oil shale processing focused on mining and above-ground processing/ retorting that consumed 2 to 5 gallons of water per gallon of refinery-ready oil (15 to 38 gal per MMBtu). Studies from that period indicated there were likely sufficient water resources in the region, but insuffi-
cient infrastructure for a production rate that would reduce U.S. oil imports (3 million bbl/day). However, growth in water demand since that time may invalidate those earlier results. Water quality issues were also identified, with the primary concern being that the post-processed shale residue has a high salt content that could migrate to surface waters. High salinity damage is currently estimated to be a $500 to 750 million per year problem in the Colorado River Basin in which the most shale re-sources reside.
Figure A-4. Natural Gas Production by Source, 1990-2030 (trillion cubic feet) (EIA, 2006)

59
A potentially lower-cost approach to shale oil production now in prototype testing is in situ (below ground) retorting. Electric heat-ers are used to heat the shale underground, and the products are collected from producer wells. About 250 to 300 kWh/boe of electricity is required to drive the process. Approximately two-thirds of the energy product is oil, and one-third is similar to natural gas. It would take the equivalent of all the produced gas to generate enough electricity for heating the shale. Water consumption with this method appears to be dominated by electricity production, but processing and decommissioning operations would also use water, although much of it might be recycled. If electricity were being provided by an evaporatively cooled Combined Cycle Gas Turbine power plant, about a gallon of water would be consumed for every gallon of refinery-ready oil produced (8 to 9 gal per MMBtu). Other electricity production options (e.g., using nearby coal resources) would change water use accordingly. Water quality issues are similar to those for surface retorting, except that the shale is left underground, which may reduce concerns when compared to above-ground processing. Plans are to use freeze barrier technology to eliminate migration of pollutants from the process to underground water supplies during operation. However, after decommissioning, leaching could still occur. Oil sands (tar sands) are a significant energy resource in Canada, but a relatively minor resource in the U.S. Water consumption at a commercial tar sand plant in Canada is approximately 8 tons of water per ton of product in the largest, most energy-efficient facilities (20 to 50 gal per MMBtu) (Gleick, 1994).
Oil and Gas Processing and Transport – Refineries are large industrial complexes, with the water withdrawal rate at a typical refinery ranging from 3 to 4 million gallons per day (CH2M HILL, 2003). Most of the water is lost to evaporation, with only about 30 to 40 percent discharged as wastewater. Since process water may contact the petro-leum product, wastewater may contain re-sidual product as well as the water-treatment chemicals and increased dissolved solids typical of blowdown from steam systems and cooling towers. Total water consump-tion is about 1 to 2.5 gallons of water for every gallon of product (7 to 18 gal per MMBtu) (Gleick, 1994).
Oil Refinery Natural gas requires minimal processing after extraction. Gleick reports that approximately 2 gal per MMBtu are consumed for gas processing, and another estimated 1 gal per MMBtu is associated with pipeline operation (Gleick, 1994).
60
Liquefied Natural Gas – Natural gas imported from overseas is shipped as liquefied natural gas (LNG). LNG requires water for regasification, which is often provided via an open-loop system. An open-loop system requires significant volumes of water, up to 200 MGD (Shaferi, 2005) for heating the LNG to a gas to pump into pipelines. The water-quality concerns for the open-loop systems are similar to the issues associated with open-loop power plant cooling: marine life can be drawn into intake structures or be subject to thermal stresses at the discharge. The final design and location of systems will determine whether seawater or freshwater is the thermal source for regasification. Oil and Gas Storage – Seasonal variations in demand require that natural gas be stored. Natural gas is most often stored in natural geologic formations such as depleted gas and oil fields and aquifers, but can also be stored in salt formations. In addition, the U.S. stores oil in the salt caverns of the Strategic Petroleum Reserve. Salt caverns are created by slurry mining of salt formations. Slurry mining requires seven gallons of water to create one gallon of storage capacity, and most of the resulting saline solution must then be discharged (Kaufman, 1960). Because of the high volumes of water required, nearby surface sources are typically used in slurry mining. Compared to the discharge, seawater is only mildly saline; thus seawater, if nearby, can be used as a water source. For mining a cavern for oil storage, a one-time use of about 50 gal per MMBtu of oil storage capacity is required. The water requirement for gas storage depends on the operating pressure of the cavern, which is limited by the depth of the cavern below ground. To create a salt cavern operating at 2,000 psi
would require a one-time use of 500 to 600 gal per MMBtu of gas storage capacity. ALTERNATIVE FUELS A variety of other fuels are candidates to replace or supplement petroleum products. These include corn-based ethanol, biodiesel, coal-based synfuel, and hydrogen. Synfuels – Gaseous and liquid fuels can be produced from coal. The conversion process from coal to liquid fuels consists of syngas production, Fischer-Tropsch conversion from gas to liquid, and then fuel refining and upgrading to desired specific fuels such as gasoline, diesel, and other distillates. Water required to produce one gallon of Fischer-Tropsch liquid product varies between 4.6 gallons to 6.8 gallons, depending on the coal used for the process (41 to 60 gal per MMBtu) (Marano and Ciferno, 2001). The higher water-use number is derived from bituminous coal ac-quired from the Illinois #6 surface and un-derground mine. The lower water use number is based upon sub-bituminous coal acquired from the Powder River Basin surface mine in Wyoming. Sub-bituminous coal generally has higher moisture content than bituminous coal and therefore requires less water for the conversion process. Coal can also be used to produce synthetic gas for use in combustion turbines and other applications. Gleick estimates 11 to 26 gal per MMBtu are required for coal gasifi-cation (Gleick, 1994). Hydrogen – Hydrogen is primarily used in various industrial processes, from food production and electronic manufacturing to metal processing and fertilizer production. Although hydrogen can be produced via electrolysis, photoelectrochemical, biologi-cal, and biomass and waste processing, almost all of the hydrogen (95 percent)

61
produced in the U.S. today is produced through steam reforming of natural gas. For the near term, this method of production will continue to dominate. Currently, hydrogen production is estimated at 9 million tons per year (USDOE, 2002b), with most of the use dominated by ammonia production facilities (40 percent), oil refineries (37 percent), and methanol production plants (10 percent) (Spath, 2001). Hydrogen production via natural gas steam reformation requires about 4.9 gal of water for every kilogram of hydrogen produced. Water is used in the reaction process as well as in plant operation; 95 percent (4.6 gal) is consumed. Approximately 1 gallon of water is consumed for the conversion of natural gas into 1 kg of hydrogen, and 3.5 gallons are lost in the production of steam (Spath, 2001). The energy content of a kilogram of hydrogen is about the same as that of a gallon of gasoline. Thus, 43 gallons of water are required to produce 1 MMBtu of hydrogen via natural gas reformation. Electrolysis, in which water is used only as feedstock, requires 21 gal per MMBtu. However, a typical evaporatively-cooled thermoelectric power plant will use 100 to 200 gal per MMBtu to power the electrolyzer. If renewable energy sources such as wind or photovoltaics were used to power the electrolyzer, little additional water would be needed. Biofuels – Feedstock for current biofuel production includes corn and soybeans, sources for ethanol and biodiesel respec-tively, which require large quantities of water when grown on irrigated farmland. Reduction of water use requires the ability to use plant material that does not require additional water, including crop and forestry waste and crops that do not require much irrigation, such as switchgrass. Research is
under way to develop the processes to produce ethanol from the lignocellulose in these materials. As of 2004, the Renewable Fuels Associa-tion (RFA) reported that 81 ethanol plants were in operation in the U.S., producing 3.4 billion gallons of ethanol, a 109 percent in-crease since 2000 (RFA, 2005). Water use for corn production is variable among the states, mostly depending on climate condi-tions and related annual rainfall. The 2003 national average of water used in irrigated corn production was 1.2 acre-feet per acre with a yield of 178 bushels per acre (USDA, 2004a). Based upon the USDA’s figures, the average water consumed is approximately 2,200 gallons of water per bushel. However, water use/yield can vary between 500 gal/bushel for Pennsylvania and 6,000 gal/bushel for Arizona.
Harvesting Corn
Most ethanol is produced via dry mills, with only 25 percent of ethanol produced in wet mill facilities (RFA, 2005). A dry mill averages 2.7 gallons of ethanol per bushel of corn, while water use in dry mills averages 4.7 gallons/gallon of ethanol (Shapouri and Gallegher, 2005). Taking into account the energy content of a gallon of ethanol, which is somewhat less than the energy content of a gallon of gasoline, water required for production of irrigated corn is 11,000 gal per

62
MMBtu of water, with a range of 2,500 to 29,000 gal per MMBtu. Water consumption during processing is comparable to water use in synfuel processing, averaging 62 gal per MMBtu, with a range of 13 to 145 gal per MMBtu. Continuing technology research and development could reduce these values. As of 2004, at least 45 biodiesel plants were in operation, producing approximately 25 million gallons of biodiesel with 54 more plants proposed or under construction (National Biodiesel Board, 2005). Water use for irrigated soy production in the U.S. varies from 0.2 acre-feet/acre for Pennsyl-vania to about 1.4 acre-feet/acre for Colo-rado, with a national average of 0.8 acre-feet of water (USDA, 2004a). The average output is estimated at 42 bushels per acre with a corresponding range from 40 to 51 bushels per acre. The average water use was 6,200 gallons of water per bushel of soy with a range of 1,600 to 9,000 gal/bushel. The conversion process from soy to bio-diesel requires 1 bushel per gallon of fuel. Water withdrawal for the conversion process is about one gallon of water for every gallon of biodiesel produced (Sheehan, 1998); water consumption is negligible. Water use for soy production averages 45,000 gal per MMBtu, with a range of 14,000 to 75,000 gal per MMBtu. Water use during processing is only 4.2 gal per MMBtu produced.
Bio-Diesel-Powered Bus
SUMMARY It is difficult to accurately predict future energy development directions and demands. Sustained natural gas prices and concerns over energy security and sustainability could increase demand for domestic fuel production and processing, with associated water needs. Alternatively, an increase in imports, especially of refined fuels, could lead to a decrease in domestic water needs for fuels. In examining the potential of domestic and sustainable fuel resources, the information provided in this appendix suggests that future decisions on energy sources and processes must take into consideration water use and water consumption.

63
Appendix B: Water Use in Electrical Power Generation
OVERVIEW This appendix provides supporting data on the use of water and water resources for electric power generation. Data are presented at a national level, with an emphasis on the impacts of power generation on water-resource availability and water quality. To permit a relative comparison of the water needed to develop and utilize a broad range of energy resources, the information is presented as the volume of water used per-unit-energy produced (gallons of water per Megawatt-hour). Not included in this analysis is the water required to manufacture and construct energy facilities, such as the water used in manufacturing the components of, or to construct, a power plant. Thermoelectric Generation – Fossil and nuclear power generation systems, which account for about 80 percent of electric power generating capacity, require cooling to condense the steam turbine exhaust. Power plants also use water for other purposes, including equipment washing and cooling, emissions treatment, and restrooms. Depending upon the technology used, the water withdrawn for steam condensing may be consumed by evaporation in cooling tow-ers or returned to the source, but at a higher temperature. Figures B-1 and B-2 show water withdrawal and consumption for various power plants in terms of gal/MWhe. Also included is the water used to provide fuel, assuming a nominal thermal-to-electric conversion efficiency for that fuel. Because of the extreme variation in the data, a logarithmic scale is used in the figure.
From a cost and efficiency perspective, the preferred method to condense the steam is the use of large quantities of cooling water. The amount of water required depends on the generating and cooling technologies, as well as the ambient meteorological conditions at the plant. The range of water withdrawal and consumption (including downstream evaporation of open-loop systems) is presented in Table B-1. Prior to 1970, most thermoelectric power plants were built adjacent to surface waters and withdrew water for cooling and discharged the heated water back to the source. Withdrawal requirements for open-loop cooling are very large: 20,000 to 50,000 gal/MWh for a typical coal-fired power plant having 35 percent efficiency. Today’s fleet of pressurized water and boiling water nuclear reactors operate at a lower temperature than coal plants, so the plants operate at somewhat lower turbine efficiency (approximately 30 percent) and require more cooling water: 25,000 to 60,000 gal/MWh (EPRI, 2002a). At plants using open-loop cooling, essentially all of the water withdrawn for cooling is returned to the source. However, the water discharged is warmer than the receiving water
Thermoelectric Power Plant

64
1 10 100 1000 10000 100000
Coal Mining
Coal Slurry
Fossil Steam, Open Loop
Fossil Steam, CL Tower
Fossil Steam, CL Pond
Fossil Steam, Dry
Coal ICGT
Nuclear Fuel Mining and Processing
Nuclear, Open Loop
Nuclear, CL Tower
Nuclear, CL Pond
Nuclear, Dry
Natural Gas Supply
Gas CCGT, Open Loop
Gas CCGT, CL Tower
Gas CCGT, Dry
Solar Tower, CL Tower
Solar Trough, CL Tower
Geothermal Steam, CL Tower
Gallons/MWhe
Figure B-1. Water Withdrawal for Power Generation
1 10 100 1000 10000 100000
Coal Mining
Coal Slurry
Fossil Steam, Open Loop
Fossil Steam, CL Tower
Fossil Steam, CL Pond
Fossil Steam, Dry
Coal ICGT
Nuclear Fuel Mining and Processing
Nuclear, Open Loop
Nuclear, CL Tower
Nuclear, CL Pond
Nuclear, Dry
Natural Gas Supply
Gas CCGT, Open Loop
Gas CCGT, CL Tower
Gas CCGT, Dry
Solar Tower, CL Tower
Solar Trough, CL Tower
Geothermal Steam, CL Tower
Gallons/MWhe
Figure B-2. Water Consumption for Power Generation

65
Table B-1. Water Use by Thermoelectric Power Plants (EPRI, 2002a; CEC, 2002; CEC, 2006; Grande, 2005; Leitner, 2002; Cohen, 1999)
Water intensity (gal/MWhe) Plant-type Process Steam Condensing Other Use
Steam Withdrawal Consumption Withdrawal Consumption
OL Cooling 20,000–50,000 ~300
CL Tower 300–600 300–480 CL Pond 500–600 ~480
Fossil/ biomass/
waste Dry 0 0
~30**
Nuclear OL Cooling 25,000–60,000 ~400
Nuclear CL Tower 500–1,100 400–720 Nuclear CL Pond 800–1,100 ~720 Nuclear Dry 0 0
~30**
Geothermal Steam CL Tower ~2000 ~1400 Not available
Solar trough CL Tower 760–920 760–920 8 Solar tower CL Tower ~750 ~750 8
Other
OL Cooling 7,500–20,000 100
CL Tower ~230 ~180 Natural Gas
CC Dry 0 0
7–10**
Coal IGCC* CL Tower ~250 ~200 7–10 + 130 (process water) OL = Open loop cooling, CL = Closed Loop Cooling, CC = Combined Cycle *IGCC = Integrated Gasification Combined-Cycle, includes gasification process water Other Use includes water for other cooling loads such as gas turbines, equipment washing, emission treatment, restrooms, etc. ** References did not specify whether values are for withdrawal or consumption.
body, which can result in increased evaporation downstream of the discharge point and the need for large volumes of water to dilute the effluent to meet discharge water quality standards. EPRI estimates water consumption for these plants at 300 to 400 gal/MWh (EPRI, 2002a). The large volumes of water used by these plants have associated environmental effects. Aquatic life can be adversely affected by impingement on intake screens, entrainment in the cooling water, or by the discharge of water that is significantly warmer than the source.
During drought conditions, plants can experience sedimentation and fouling of the intake system and water flows that are too low to meet thermal discharge permit requirements. In surface water systems with both hydropower and thermoelectric power plants, this complicates river management. During dry times, it is desirable to store water for hydro power and other needs, but sufficient water must be made available downstream to provide dilution water for open-loop power plants. This makes water and energy management especially difficult during droughts and dry seasons.
66
Closed-loop cooling systems withdraw much less water than open-loop plants, as shown in Table B-1, but a significant fraction of the water withdrawn is lost to the atmosphere by evaporation. Consumption of water in these plants ranges from 300 to 720 gal/MWh (EPRI, 2002a). Future electric power generation plants will most likely move to closed-loop cooling. Recent regulatory limits (commonly called EPA 316a and 316b) will limit the ability to permit new open-loop cooling systems. This may limit future water withdrawals, but could significantly increase water consumption, as described in Chapter IV. The highest-efficiency, fossil-based electricity-generating technologies employ combined-cycle technology. Natural Gas Combined Cycle (NGCC) plants burn methane and Integrated Gasification Combined Cycle (IGCC) units burn synthesis gas (syngas) from coal in combustion turbines and extract useful heat out of the exhaust gas in a heat recovery steam generator. The steam is then sent to a steam turbine where additional electricity is generated. Typically, combined cycle systems are configured as a 2-on-1 system, where one-half to two-thirds of the plant generating capacity is from dual combustion turbines and the balance is a result of the steam turbine. Because the steam cycle is responsible for only a fraction of the overall generating capacity, combined cycle systems are inherently less water intensive than steam-only generating units. However, compared to NGCC systems, IGCC systems have process water requirements beyond cooling water needs (see the section on synfuels above). Overall, IGCC and NGCC systems are much less water-intensive than state-of-the-art coal-based units using steam turbines with wet flue gas desulfurization. For all water-cooled
thermoelectric technologies, water for cooling represents the largest water requirement of the unit. Alternative Cooling Technologies – As discussed in Chapter V, dry and hybrid cooling technologies eliminate or reduce the use of water to condense steam. However, plant water use is not entirely eliminated, since water is required for other cooling loads, equipment washing, emission treatment, restrooms, etc. For example, the gas turbine portion of combined-cycle power plants uses water for turbine cooling and emissions control. Geothermal Electric Power – Geothermal power plants use the earth as their source of thermal energy. Some geothermal wells provide steam, while others provide hot water. Steam sources use steam Rankine-cycle turbines much like coal and nuclear plants, but on a smaller scale. Over time, geothermal steam sources may decline, not because the heat of the resource has been consumed, but because the water/steam resource is being withdrawn faster than it is being recharged. For that reason, it is desirable to recharge the resource. The Northern California Power Authority (NCPA) operates two geothermal power plants at the Geysers Known Geothermal Resource Area. Their turbines typically withdraw approximately 17.0 lb of steam/kWh (2000 gal/MWh) from the geothermal field (Grande, 2005). The condensate from the steam cycle is used in the cooling system. Approximately 70 percent of the water is evaporated by the cooling tower. In an innovative approach to replenishing the geothermal reservoir, the remaining 600 gal/MWh of condensate is augmented by a 28-mile long pipeline providing treated effluent from the City of Clearlake wastewater facility.

67
Geothermal systems using hot water sources typically employ an air-cooled binary cycle, where the geothermal heat is used to evaporate an organic working fluid that drives an organic Rankine-cycle turbine. The organic working fluid is condensed in air-cooled towers, although hybrid wet/dry cooling has been explored to improve performance in hot weather. In the dry-cooled systems, all of the geothermal water is returned to the geothermal resource, so consumption is limited to other site needs. Solar Thermoelectric Power – Nine parabolic-trough solar thermal power plants, totaling 354 MW, have been operating in the Mojave Desert for more than 15 years. These plants concentrate sunlight to heat a heat-transfer fluid, which in turn is used to make steam in an unfired boiler. Natural gas can be used to provide capacity when there is no sunlight or during times of peak demand. These plants use evaporative cooling systems. Water consumption is 770 to 920 gal/MWh (Leitner, 2002; Cohen, 1999).
Solar Troughs
Solar Power Tower
A higher temperature approach—the solar power tower—has been demonstrated at the 10 MW pilot-plant scale. Water consumption in a commercial-scale facility is estimated at 750 gal/MWh (Leitner, 2002). In addition, Stirling Energy Systems has announced their intent to deploy large numbers of 25 kW parabolic dish-engine systems. These systems are air-cooled and require no water except for mirror washing. Hydropower – Hydropower supplies a significant fraction of the total U.S. electricity generation, ranging from 5.8 percent to 10.2 percent between 1990 and 2003 (EIA, 2005). In 1995, the USGS estimated that hydro-power’s annual water usage was 3,160 billion gallons per day, or more than 20 times that used for thermoelectricity (Solley et al., 1998). The amount of water available for hydroelectric power varies greatly, depending upon weather patterns and local hydrology, as well as on competing water uses, such as flood control, water supply, recreation, and in-stream flow needs (e.g., navigation and the aquatic environment). In addition to being a major source of base load electricity in some regions of the U.S., hydropower plays an important role in stabilizing the electrical transmission grid and in meeting peak loads, reserve requirements, and other ancillary electrical energy needs. This is due in part to the fact that hydropower can provide an almost immediate response to electric energy demands. Hydropower project design and operation are highly diverse; projects vary from major projects with large, multi-purpose storage res-ervoirs to small run-of-river projects that have little or no active water storage. Approxi-mately half of the U.S. hydropower capacity is federally owned and operated; the other half consists of nonfederal projects that are regulated by the Federal Energy Regulatory

68
Commission. There are at least ten times more nonfederal hydropower projects in the U.S. than federal projects. Current estimates suggest that between 30,000 to 70,000 MW of additional hydroelectric generating capacity is available in the U.S., with suggested nominal values of about 40,000 MW. This includes both large and small hydroelectric opportuni-ties and could nearly double current hydro-electric capacity (Hall, 2005). As the cost of fossil fuels continues to increase, hydroelec-tric generation is becoming more economi-cally attractive.
Hoover Dam Water used in hydroelectric turbines is gener-ally not consumed, but the timing of water releases may be shifted in time relative to natural flows through reservoir storage and release. When hydropower projects involve
large storage reservoirs, evaporation of water from those reservoirs can be a significant consumptive use. Estimates suggest an average loss for U.S. hydroelectric reservoirs of 4,500 gal/MWh (Gleick, 1994) and with annual generation of about 300 million MWh (EIA, 2006), evaporative losses associated with hydropower may be as high as 13 million gallons per day. However, the water stored in hydropower reservoirs usually is for multiple purposes; thus, hydroelectric power is not the only cause of these evaporative losses. Other Renewables – Solar photovoltaics and wind require no water during normal operation. Ocean energy sources require the presence of sea water, but none is consumed in operation. Of course, water is used in manufacturing and construction of these facilities, just as is the case for construction of coal and nuclear power plants. Water consumption in equipment fabrication and plant construction is beyond the scope of this report.
Wind Turbines
Solar Photovoltaic Power Plant

69
SUMMARY It is difficult to accurately predict future electricity generation supply and water demand. Sustained natural gas prices could shift electricity generation technology choices, and substantial advancements in clean coal technologies could result in increased interest in new coal-fired capacity. Any measures to reduce the carbon dioxide intensity of the electric generation sector would also influence technology choices, and might spur technologies amenable to carbon capture and sequestration such as IGCC plants or possibly additional construction of carbon-neutral, nuclear-based technologies. It is even more difficult to gauge sufficient water availability to meet the needs of future electricity projections, in part because of the way basic water data are collected and electricity supply and demand are projected. Because water data are typically collected on the basis of watersheds or drainage basins, and electricity supply and demand
are usually projected on the basis of census divisions and power grid boundaries, the two are often incongruent. Because of the higher cost and lower efficiencies of dry- and hybrid-cooling tech-nologies, owner-operators of thermoelectric generators will continue to prefer wet cooling and will require access to sufficient quantities of water for cooling and process needs. As documented in this report, power plants still need water for other process needs, even for dry cooling. The quantity of water needed will vary, based on the final mix of renewable tech-nologies, thermoelectric technologies, and the ease of application of dry and hybrid cooling approaches. Of more importance is that, based on regional energy demands and water availability, it is possible that major changes in electric generation, transmission, and distribution approaches will need to be supported in different regions of the country to address water availability and value issues.

70

71
References and Bibliography
Affordable Desalination Collaboration (2006). Seawater Desalination: Freshwater from the Sea, (http://www.affordabledesal.com). Anderson, Mark T. and Lloyd H. Woosley, Jr. (2005). Water Availability for the Western United States—Key Scientific Challenges: U.S. Geological Survey Circular 1261. API, American Petroleum Institute (2000). Overview of Exploration and Production Waste Volumes and Waste Management Practices in the United States, ICF Consulting. AwwaRF, AWWA Research Foundation (1996). Aquifer Storage Recovery Treatment of Treated Drinking Water. AwwaRF, AWWA Research Foundation (2005a). Water Quality Improvements During Aquifer Storage and Recovery. AwwaRF, AWWA Research Foundation (2005b). The Value of Water: Concepts, Estimates, and Applications for Water Managers. AwwaRF, AWWA Research Foundation (2006). Decision Support System for Sustainable Water Supply Planning. Bartis, J.T. et al. (2005). Oil Shale Development in the United States: Prospects and Policy Issues, Rand Corporation. Bartolino, J.R. and W.L. Cunningham (2003). Ground-Water Depletion Across the Nation, U.S. Geological Survey. Bonneville Power Administration (2002). Guide to Tools and Principles for a Dry Year Strategy (Draft). Boberg, Jill (2005). Liquid Assets: How Demographic Changes and Water Management Policies Affect Freshwater Resources, Rand Corporation. Brown, T.C. (1999). Past and Future Freshwater Use in the United States: A Technical Document Supporting the 2000 USDA Forest Service RPA Assessment, U.S. Department of Agriculture, Forest Service. Campbell, P. (1997). Population Projections: States, 1995-2025, Current Population Reports, U.S. Department of Commerce, Economics and Statistics Administration. Carns, K. (2004). Bringing Energy Efficiency to the Water & Wastewater Industry: How Do We Get There? Global Energy Partners.

72
CEC, California Energy Commission (2002). Comparison of Alternate Cooling Technologies for California Power Plants: Economic, Environmental and Other Tradeoffs, Public Interest Energy Research, 500-02-079F, February 2002. CEC, California Energy Commission (2005). 2005 Integrated Energy Policy Report: Committee Draft Report CEC-100-2005-007-CTD. CEC, California Energy Commission (2006). Cost and Value of Water Use at Combined-Cycle Power Plants CEC-500-2006-034. CH2M HILL (2003). “Water Use in Industries of the Future” in Industrial Water Management: A Systems Approach, 2nd ed., prepared for the Center for Waste Reduction Technologies, American Institute of Chemical Engineers, July 2003. Cichanowicz, J. and W. Micheletti (2005). EPA’s Subcategorization for Subbituminous Coal-Fired Units in the Context of the New Source Performance Standards, Consultants to the Utility Air Regulatory Group. Clean Air Task Force (2004a). Wounded Waters: The Hidden Side of Power Plant Pollution, February 2004, Boston, Massachusetts. Clean Air Task Force (2004b). Fact Sheet: EPA's Decision to Exempt Older Power Plants from New Water Using Technology Requirements, February 16, 2004. Cohen, G. et al. (1999). Final Report on the Operation and Maintenance Improvement Program for Concentrating Solar Power Plants, Sandia National Laboratories. Cohen, R. et al. (2004). Energy Down the Drain: The Hidden Costs of California's Water Supply, National Resources Defense Council, Pacific Institute, Oakland, California, August 2004. Columbia Basin News (2006). “BPA Outlines Impacts of Summer Spill on Transmission System,” January 13, 2006. Commonwealth of Massachusetts (2002). Securing our Water Future: Ensuring a Water Rich Massachusetts, presented to the Community Preservation Institute, Alumni Class, September 30, 2002, Boston, Massachusetts. Curlee, T.R. and M.J. Sale (2003). “Water and Energy Security,” in proceedings Universities Council on Water Resources, 2003 UCOWR Annual Conference, Water Security in the 21st Century, Washington, DC. EIA, Energy Information Administration (1998). Manufacturing Energy Consumption Survey (http://www.eia.doe.gov/emeu/mecs/contents.html)

73
EIA, Energy Information Administration (2000). Annual Energy Outlook 2001: With Projections to 2020, Washington, DC. EIA, Energy Information Administration (2003a). Annual Coal Report, DOE/EIA-0584. EIA, Energy Information Administration (2003b). http://www.eia.doe.gov/cneaf/coal/page/coaldistrib/o_us2.html. EIA, Energy Information Administration (2003c). Electric Power Annual 2003, EIA-906, Washington, DC. EIA, Energy Information Administration (2004a). Coal Shipments from Coal Producing Sub-Regions to Coal Synfuel Plants, http://www.eia.doe.gov/cneaf/coal/page/special/fig7.html. EIA, Energy Information Administration (2004b). Steam Electric Plant Operation and Design Report, EIA-767, Washington, DC. EIA, Energy Information Administration (2004c). Annual Energy Outlook 2004: With Projections to 2025, Washington, DC. EIA, Energy Information Administration (2005). Annual Energy Review 2004, Energy Information Administration, Washington, DC. EIA, Energy Information Administration (2006). Annual Energy Outlook 2006: With Projections to 2030, Washington, DC. Energetics, Inc. (1998). Energy and Environmental Profile of the U.S. Petroleum Refining Industry, prepared for the U.S. Department of Energy, Office of Industrial Technologies. EPRI, Electric Power Research Institute (2002a). Water and Sustainability (Volume 3): U. S. Water Consumption for Power Production—The Next Half Century, No. 1006786, Palo Alto, California. EPRI, Electric Power Research Institute (2002b). Water and Sustainability (Volume 4): U. S. Electricity Consumption for Water Supply & Treatment—The Next Half Century, No. 1006787, Palo Alto, California. EPRI, Electric Power Research Institute (2002c). Water and Sustainability (Volume 1): Research Plan, No. 1006784, Palo Alto, California. EPRI, Electric Power Research Institute (2002d). Water and Sustainability (Volume 2): An Assessment of Water Demand, Supply, and Quality in the U.S.—The Next Half Century, No. 1006785, Palo Alto, California.

74
EPRI, Electric Power Research Institute (2003a). A Survey of Water Use and Sustainability in the United States With a Focus on Power Generation, No. 1005474, Palo Alto, California. EPRI, Electric Power Research Institute (2003b). Spray Cooling Enhancement of Air-Cooled Condensers, No. 1005360, Palo Alto, California. EPRI, Electric Power Research Institute (2003c). Electricity Technology Roadmap: Meeting the Critical Challenges of the 21st Century, 2003 Summary and Synthesis, No. 1010929, Palo Alto, California. EPRI, Electric Power Research Institute (2003d). Use of Degraded Water Sources as Cooling in Power Plants, No. 1005359, Palo Alto, California. EPRI, Electric Power Research Institute (2004a). Comparison of Alternate Cooling Technologies for U.S. Power Plants: Economic, Environmental, and Other Tradeoffs, No. 1005358, Palo Alto, California. EPRI, Electric Power Research Institute (2004). The Formation and Fate of Trihalomethanes in Power Plant Cooling Water Systems, No. 1009486, Palo Alto, California. EPRI, Electric Power Research Institute (2005). Framework to Evaluate Water Demands and Availability for Electrical Power Production within Watersheds Across the United States: Development and Applications, Palo Alto, California. Feeley, T.J. et al. (2002). An Investigation of Site Specific Factors for Retrofitting Recirculating Cooling Towers at Existing Power Plants, U.S. Department of Energy. Feeley, T.J. et al. (2005). Addressing the Critical Link Between Fossil Energy and Water, Department of Energy/Office of Fossil Energy’s Water-Related Research, Development, and Demonstration Programs, September 2005. Feeley, T.J. and M. Ramezan (2003). “Electric Utilities and Water: Emerging Issues and R&D Needs,” presented at Water Environment Federation, 9th Annual Industrial Wastes Technical and Regulatory Conference, April 13-16, 2003, San Antonio, Texas. Feldman, D. and A. Routhe (2003). A Baseline Assessment of Water Shortages and Merchant Power Plants in the South, A Report to the Southern States Energy Board, September 4, 2003. GAO, General Accounting Office (2003). Freshwater Supply: States’ Views of How Federal Agencies Could Help Them Meet the Challenges of Expected Shortages, July 2003, GAO-03-514. Gibson, S. (2006). Tennessee Valley Authority, personal communication.

75
Gleick, P.H. (1994). "Water and Energy" in Annual Reviews, Annu. Rev. Energy Environ., 1994, 19:267-99. Gleick, P.H. (2003). "Water Use," in Annual Reviews, Annu. Rev. Environ. Resour. 2003, 28:275-314. Grande, M. (2005). Northern California Power Authority, personal communication. Granneman, N.G. et al. (2000). The Importance of Ground Water in the Great Lakes Region: U.S. Geological Survey Water Resources Investigations Report 00-4008, 14 p. Hall, D. (2005). Hydropower Capacity Increase Opportunities", Renewable Energy Modeling Workshop on Hydroelectric Power, National Renewable Energy Laboratory, Washington, DC, May 10, 2005. Hirsch, R. (2006). United States Geological Survey, personal communication. Hoffman, A. (2004). The Connection: Water and Energy Security, prepared for the Institute for the Analysis of Global Security, Energy Security, August 13, 2004. Hoffmann, J. et al. (2004). Estimating Freshwater Needs to Meet 2025 Electricity Generating Capacity Forecasts, National Energy Technology Laboratory, June 2004. Hopp, J. (2005). Personal communication, consulting uranium geologist. Hutson, S. et al. (2004). Estimated Use of Water in the United States in 2000, Circular 1268, U.S. Geological Survey. Institute for Alternative Futures (2005). Six Strategic Issues Shaping the Global Future of Mechanical Engineering, prepared for the Strategic Issues, Opportunities and Knowledge Committee, Strategic Management Sector, ASME, June 2005. Kaufman, D. (1960). Sodium Chloride: The Production and Properties of Salt and Brine, American Chemical Society Monograph Series, Reinhold Publishing. Kruse, J.R. and A. Womack (2004). Implications of Alternative Missouri River Flows for Power Plants, Food and Agricultural Policy Research Institute, 04-04, April 23, 2004. Lancet, M.S. (1993). Distribution and Material Balances of Trace Elements During Coal Cleaning, International Coal Prep Conference. Leitner, A. (2002). Fuel from the Sky, National Renewable Energy Laboratory. Marano, J. J. and J. P. Ciferno (2001). Life-Cycle Greenhouse Gas Emissions Inventory for Fischer Tropsch Fuels, National Energy Technology Laboratory.

76
Margolis, R. (2006). National Renewable Energy Laboratory, personal communication. Maulbetsch, J. (2006a). “Water Conserving Cooling, Status and Needs,” Maulbetsch Consulting, Energy-Water Needs Western Region Workshop, Salt Lake City, January, 2006. Maulbetsch, J. (2006b). Maulbetsch Consulting, personal communication. Maupin, M.A. and N.L. Barber (2005). Estimated Withdrawals from Principal Aquifers in the United States, 2000, U.S. Geological Survey. Mavis, J. (2003). “Water Use in Industries of the Future: Mining Industry,” in Industrial Water Management: A Systems Approach, 2nd ed., prepared by CH2M HILL for the Center for Waste Reduction Technologies, American Institute of Chemical Engineers. Micheletti, W.C. and J.M. Burns (2002). Emerging Issues and Needs in Power Plant Cooling Systems. Michigan Land Use Institute (2003). Lake Michigan’s Wild West Coast: Looking for Water Laws and Order, Code Red in a Blue Water Basin. Miller, J. (2003). Review of Water Resources and Desalination Technologies, SAND 2003-0800, Sandia National Laboratories, Albuquerque, New Mexico, March 2003. Milwaukee Journal Sentinel (2005). February 18, 2005, Milwaukee, Wisconsin. Mote, P. (2004). The West’s Snow Resources in a Changing Climate, Testimony before the U.S. Senate Committee on commerce, Science, and Transportation, May 6, 2004, Joint Institute for the Study of the Atmosphere and Ocean, Climate Impacts Group, University of Washington. National Biodiesel Board (2005). Biodiesel Fact Sheet, http://www.biodiesel.org/resources/fuelfactsheets/default.shtm. National Drought Policy Commission (2000). Preparing for Drought in the 21st Century, May 2000. National Energy Policy: Reliable, Affordable, and Environmentally Sound Energy for America’s Future (2001). Office of the President of the United States, National Energy Policy Development Group. NRC, National Research Council (2004). Confronting the Nation’s Water Problems: The Role of Research, Committee on Assessment of Water Resources Research, National Academies Press.

77
Pankratz, T. and J. Tonn (2006). Desalination.com: an Environmental Primer, (http://www.desalination.com). Parsons Infrastructure and Technology Group Inc. (2002). An Investigation of Site-Specific Factors for Retrofitting Recirculating Cooling Towers at Existing Power Plants, prepared for the U.S. Department of Energy, National Energy Technology Center. Perlack, R. et al. (2005). Biomass as Feedstock for a Bioenergy and Bioproducts Industry: The Technical Feasibility of a Billion-Ton Annual Supply, ORNL/TM-2005-66, Oak Ridge National Laboratory, April 2005. Powicki, C. (2002). "The Water Imperative," Electric Power Research Institute, EPRI Journal, July 2002. Public Service Company of New Mexico (2005). Water Management: San Juan Generating Station, (http://www.pnm.com/environment/sj_water.htm). Quinn, F. et al. (2003). “Water Allocation, Diversion and Export,” Chapter 1, in Threats to Water Availability in Canada, National Water Research Institute. Reno-Gazette Journal (2005). February 22, 2005, Reno, Nevada. RFA, Renewable Fuels Association (2005). Ethanol Industry Outlook 2005. RFA, Renewable Fuels Association (2006). Ethanol Industry Outlook 2006. Rice, C.A. et al. (2000). Water Co-produced with Coalbed Methane in the Powder River Basin, Wyoming: Preliminary Compositional Data, U.S. Geological Survey. Roy, S.B. et al. (2005). "Evaluation of the Sustainability of Water Withdrawals in the United States, 1995 to 2025," Journal of the American Water Resources Association, October 2005, pp.1091-1108. Shaferi, M. (2005). Shell, personal communication. Shapouri, H. and P. Gallagher, (2005). USDA’s 2002 Ethanol Cost-of-Production Survey, U.S. Department of Agriculture. Sheehan et al. (1998). Life Cycle Inventory of Biodiesel and Petroleum Diesel, National Renewable Energy Laboratory. Solley, W. et al. (1998). Estimated Use of Water in the United States in 1995, Circular 1200, U.S. Geological Survey. Spath, P. and M. Mann, (2001). Life Cycle Assessment of Hydrogen Production via National Gas Steam Reforming, National Renewable Energy Laboratory.

78
Subcommittee on Water Availability and Quality (SWAQ) (2004). Science and Technology to Support Fresh Water Availability in the United States, Report of the National Science and Technology Council, Committee on Environmental Resources, Subcommittee on Water Availability and Quality. State of New Mexico (2003). New Mexico State Water Plan: Working Together Towards Our Water Future, Office of the State Engineer, Interstate Stream Commission. Stiegel, G. (2005). Power Plant Water Usage and Loss Study, U.S. Department of Energy. Thresher, R. (2005). “Wind Power Today,” E Journal: Global Issues, U.S. Department of State, June 2005. Toole-O’Neil, G. et al. (1998). Mercury Concentration in Coal—Unraveling the Puzzle, Fuel, Volume 78. Torcellini, P. et al. (2004). Consumptive Water Use for U.S. Power Production, presented at the ASHRAE Winter Meeting, Anaheim, California, January 24-28, 2004, National Renewable Energy Laboratory, CP-550-35190. Tucson Citizen (2002). January 31, 2002, Tucson, Arizona. TVA, Tennessee Valley Authority (2004). Programmatic Environmental Impact Statement, Reservoir Operations Study, Record of Decision, May 2004. Tyson, S. et al. (2004). Biomass Oil Analysis: Research Needs and Recommendations, NREL/TP-510-34796, National Renewable Energy Laboratory, June 2004. USDA, U.S. Department of Agriculture (2004a). Farm and Ranch Irrigation Survey, 2004. USDA, U.S. Department of Agriculture (2004b). Record Decreases in Western Snowpack Reported for March 2004, Natural Resources Conservation Service, Portland, Oregon. USDOE, U.S. Department of Energy (1999). Making the Most of Residential Photovoltaic Systems, DOE/GO 10099-918, September 1999. USDOE, U.S. Department of Energy (2002a). Energy Penalty Analysis of Possible Cooling Water Intake Structure Requirements on Existing Coal-Fired Power Plants, National Energy Technology Laboratory, Argonne National Laboratory, October 2002. USDOE, U.S. Department of Energy (2002b). A National Vision of America’s Transition to a Hydrogen Economy—to 2030 and Beyond.

79
USDOE, U.S. Department of Energy (2002c). Electric Utilities and Water: Emerging Issues and R&D Needs, Pittsburgh, Pennsylvania. USDOE, U.S. Department of Energy (2002d). Proceedings of the Workshop on “Electric Utilities and Water: Emerging Issues and R&D Needs,” Pittsburg, Pennsylvania, July 23-24, 2002, National Energy Technology Laboratory. USDOE, U.S. Department of Energy (2004a). Innovative Approaches and Technologies for Improved Power Plant Water Management, Office of Fossil Energy, National Energy Technology Laboratory, Program Facts. USDOE, U.S. Department of Energy (2004b). America’s Oil Shale—A Roadmap for Federal Decision Making, Office of Naval Petroleum and Oil Shale Reserves, December 2004. USDOE, U.S. Department of Energy (2005a). Installed U.S. Wind Capacity, Wind Powering America, (http://www.eere.energy.gov/windandhydro). USDOE, U.S. Department of Energy (2005b). Geothermal Program Web Site, http://www.eere.energy.gov/geothermal/. USDOE, U.S. Department of Energy (2005c). Power Plant Water Usage and Loss Study, National Energy Technology Laboratory, August 2005. USDOE, U.S. Department of Energy (2005d). Multiyear Program Plan, 2007-2012, Office of the Biomass Program, Energy Efficiency and Renewable Energy, August 31, 2005. USDOE, U.S. Department of Energy (2006a). The Department of Energy Strategic Plan, 2006. USDOE, U.S. Department of Energy (2006b). The Wind/Water Nexus, National Renewable Energy Laboratory, DOE/GO-102006-2218, April 2006. USDOE, U.S. Department of Energy (2006c). DOE Solar Energy Technologies Program—Overview and Highlights, National Renewable Energy Laboratory, DOE/GO-102006-2314, May 2006. USGS, U.S. Geological Survey (2002a). Coal Extraction—Environmental Prediction, USGS Fact Sheet FS-073-02, August 2002. USGS, U.S. Geological Survey (2003a). Desalination of Ground Water: Earth Science Perspectives, USGS Fact Sheet 075-03. USGS, U.S. Geological Survey (2002b). Concepts for National Assessment of Water Availability and Use: Report to Congress, Circular 1223.

80
USGS, U.S. Geological Survey (2006). Oil and Natural Gas Production in the United States, 2006, http://certmapper.cr.usgs.gov/data/noga95/natl/graphic/uscells1m.pdf . U.S. Water News Online (2002). Idaho Denies Water Rights Request for Power Plants, August 2002, http://www.uswaternews.com/archives/arcrights/2idaden8.html. U.S. Water News Online (2003). http://www.uswaternews.com/archives/arcpolicy/3soudak8.html. U.S. Water Resources Council (1978). “The Nation’s Water Resources 1975-2000,” Second National Water Assessment: Washington, DC, U.S. Government Printing Office. Veil, J.A. et al. (2003). “Beneficial Use of Mine Pool Water for Power Generation,” presented at the Ground Water Protection Council Annual Forum, Niagara Falls, New York, September 13-17, 2003. Wangnick, K. (2001). A Global Overview of Water Desalination Technology and the Perspectives, Proceedings, International Conference: Spanish Hydrologic Plan and Sustainable Water Management, Zaragoza, Spain. Washington State Hazard Mitigation Plan (2004). Washington Military Department, Emergency Management Division, July 2004. Watson, I.C. et al. (2003). Desalting Handbook for Planners, 3rd edition, Desalination and Water Purification Research and Development Program Report No. 72, U.S. Department of the Interior, Bureau of Reclamation, July 2003.