Embed Size (px)
Citation preview

Hydroelectricity: The Negative Ecological and Social Impact and the Policy
That Should Govern It
Energy Economics and Policy, ETH 2011
Term Paper
By: Mark Commerford

Contents Introduction: .................................................................................................................................................. 1
Population: ................................................................................................................................................ 1
Demand for Energy: .................................................................................................................................. 2
Scarcity of Fossil Fuels: ............................................................................................................................ 3
Overview of Hydroelectricity: ...................................................................................................................... 4
Policy Issues of Hydroelectricity: ................................................................................................................. 7
Relocation: ................................................................................................................................................ 8
Changes to Ecosystems: ............................................................................................................................ 9
Methane production: ................................................................................................................................. 9
Safety: ..................................................................................................................................................... 10
Economic analysis: ..................................................................................................................................... 11
Social Cost of Carbon Dioxide: .............................................................................................................. 14
Conclusion: ................................................................................................................................................. 21
References: .................................................................................................................................................. 23

1
Introduction:
On today's news, one cannot escape the various reports and commentary concerning energy
demands and the rising costs of electricity. Especially now in the aftermath of the 2011 nuclear disaster
in Japan, the question as to how to produce cheap electricity if we forego nuclear power plants looms
large. The industrialized world has become extremely dependent on electricity and expects and demands
supply at reasonable prices. Why can supply not meet demand anymore? First, the world's population is
exponentially increasing. Secondly, the demand for energy is constantly increasing in less developed or
developing countries. Thirdly, the scarcity of fossil fuels is fundamentally responsible for the increased
costs. With these three concerns in mind, hydroelectricity is a very tempting alternative especially given
easy use and apparent lack of carbon dioxide emissions. However, when the total environmental and
social impacts are included, hydroelectricity might not be an appropriate solution to meet the world's
future energy needs.
Population:
The current world population is approximately 6.9 billion people and is anticipated to grow by
leaps and bounds. Population growth means among other things more demand for electricity. Figure 1
shows compilations of multiple projections to show a prediction of world growth in the next ninety years.
Some estimates have the population of the world reaching up to 15 billon people by 2100 as opposed to
today's 6.9 billion inhabitants. This would represent a 120% increase in the world's population
subsequently increasing the demand for energy significantly. According to Wolfgang Lutz from the
International Institute for Applied Systems Analysis in Laxenburg, Austria, the world's growing
population will eventually stabilize. Lutz states "There is a 60 percent probability that the world's
population will not exceed 10 billion people before 2100 (Lutz, Sanderson and Scherbov)." If Lutz's
conjecture of a stabilized world population of 10 billion people is correct, the world's population will
increase roughly 45% in the next 90 years. With this staggering number in mind, electricity production is
of the utmost importance for the near future.

2
Figure 1: World Population (Lutz, Sanderson and Scherbov).
Demand for Energy:
As highly populated countries such as China and India [combined, approximately 38 percent of
world's population] are becoming more industrialized the resulting demand for energy rises as well, thus
the rate of increase in electricity production must be greater than that of the projected population increase.
As seen in Figure 2, the projected world energy uses will increase roughly 33% by 2035.
Figure 2: World energy use by Fuel Type (EIA 2010)

3
Scarcity of Fossil Fuels:
Currently, the primary fuel sources for the world's electrical generation are fossil fuels such as oil,
natural gas and coal. These sources are being depleted while the demand for electricity continues to rise.
The economic consequence of demand exceeding supply after peak oil is reached is a subsequent increase
in price. Peak oil is often stated as the point in which half of the global reserves for oil have been
depleted. This is also the point where a maximum production occurs. Many economists differ on the date
this situation will occur but many agree it will happen in the near future (Hirsch 2005). Figure 3 shows
the contrast between oil production and current reserves and projected future reserves. This raises
concerns for future generations as to the type of fuel or source to be used to produce the energy required
to sustain the electricity demands of the planet.
Figure 3: Growing gap in oil production and oil reserves.
An increasing population dependent on one type of fuel, oil, combined with a decreasing
availability of the fuel, makes hydroelectricity a very attractive source of energy. This is especially the
case if economic benefits alone are considered and ecological and social damages are ignored.
Beside general policy questions on where and to what extent hydroelectricity should be used, two
questions arise when considering the advantages and disadvantages of hydroelectricity:
What is the timeframe for the return on investment of the construction of a hydroelectric facility-
when the total cost includes:
1. Relocation of Population;

4
2. Destroying historical monuments;
3. Loss of labor;
4. Environmental impacts; and
5: Social impacts?
Is there an alternative solution other than building hydroelectric dams that is more economical,
more stable and that make more sense?
Overview of Hydroelectricity:
Water has been used as an energy source for generations, first in mills to grind flour and later,
after the invention of the electric generator, to produce electricity. After the industrial revolution, the
need for electricity became greater and the use of hydroelectricity increased. "By 1920, hydroelectric
plants accounted for 40 percent of the electric power produced in the United States (Atkins)." This
number has since been reduced to approximately 12% in the United State as the focus shifted to other
types of fuel that were able to meet electricity demands easier and cheaper. Figure 4 shows fuel shares of
hydroelectricity compared with the other types of primary energy supplies, while Figure 5 shows the
percentages each region contributes to the total hydroelectric power.

5
Figure 4: Shares of Total Primary Energy Supply (EIA 2007).
Figure 5: Regional shares of Hydroelectric Power Generation (EIA 2007).

6
Hydroelectricity works by using water to turn a turbine, which in turn generates electricity. This
can be done in various forms as shown in Table 1.
Table 1: Types of hydroelectric dams
Type How it functions:
Conventional Dam
Uses the difference of height (head)
and the potential energy of the water to turn a turbine.
Pumped-storage
Uses cheap electricity at low demand to pump water up higher.
This water is then released when there is a higher demand.
Run-of-the-river
Uses small or no reservoir and the water must be used to
generate electricity or bypass the dam.
Tide
Use the changes in height of the water associated
with the tide to produce electricity.
Due to the controllability in hydroelectricity and its ability as an on-demand energy source,
hydroelectricity is employed by many countries as an energy storage option. During a normal day,
electricity demand varies by time as seen in Figure 6. The electrical load curve of New England in the
United States is shown. As one can see there are two main shifts in demand of electricity throughout the
day. First the "morning ramp" in which people begin to use electricity again in the morning hours after
they wake up in preparation for work. Another big jump occurs later at night after people return home
from work and begin to cook dinner and in the course of regular evening activities, the use of many major
electrical appliances such as dishwashers, televisions, computers, washers, and dryers come into play. A
base load, such as nuclear energy is used to cover the part of the load curve that is not fluctuating as
shown in blue in Figure 6. The remaining output is produced by power plants where the electricity
produced can easily be adjusted to fit the load curve profile, such as hydroelectricity.

7
Figure 6: Electricity Load Curve. [IEA 2010]
One important benefit of hydroelectricity is the apparent lack of CO2 production as a byproduct
of power generation. Second, the elimination of extra fuel cost makes hydroelectricity a very economical
decision. Finally, the creation of large reservoirs if maintained and marketed well can accumulate
additional revenue due to water sports and tourism. These benefits however, when weighted against the
many disadvantages of hydroelectricity make it difficult to determine if hydroelectricity is truly the best
option.
Policy Issues of Hydroelectricity:
There are many drawbacks and concerns associated with hydroelectric dams: loss of land,
relocation of animals and humans, change in ecosystems, methane emissions, as well as safety. A sound
policy must to determine whether or not it would make sense to build hydroelectric dams and all possible
factors, not necessarily limited to the above mentioned examples must be considered.

8
Relocation:
Hydroelectric dams require large quantities of water which greatly reduce the livable land for
both humans and animals. These large reservoirs are required for each hydroelectric plant to meet the
electrical generation demands. The Merowe Dam in Sudan was built to supply the nearby city of Karima
with electrical power (NASA). "Once finished, its reservoir will contain 12.5 km3 (3.0 cu mi), or about
20% of the Nile's annual flow. The reservoir lake is planned to extend 174 km (108 mi) upstream
(NASA)" as shown in Figure 7.
Figure 7: The Merowe Dam (NASA).
The Merowe dam displaces so much water that many tribes in the area had to be relocated and
their sacred land and cultural landmarks were destroyed. This raises ethical questions.
"Beyond the issues of water rights, several local tribes will be displaced by the planned
170 kilometer (105 mile) reservoir, and the flooded region contains significant but little-
studied archeological sites. The Sudanese government has a resettlement program in
place for the tribes, and a variety of international institutions have been conducting
"salvage" or "rescue" archeological surveys since 1999 (NASA). "
An estimated 55,000 to 77,000 people had to be relocated once the dam was approved.
Merowe Dam
Reservoir

9
Changes to Ecosystems:
Hydroelectric dams can also change the ecosystem of flora and fauna upstream as well as
downstream of the plant. The once flowing water is suddenly blocked and a reservoir is formed; plant life
and animal life changes drastically following construction. For instance, salmon species are often affected
because of their need to spawn up river and since they are cut off from their spawning area there is the
fear of species endangerment as well as potential gaps in the overall food chain. Often fish ladders are
used to try to prevent this. A fish ladder is a structure used in a dam to artificially create a passage for the
fish to migrate through as shown in Figure 8. These however do not always work as intended such as for
example at the Marmot Dam on the Sandy River in Oregon.
"The dam included a fish ladder, but it was usually blocked to capture brood stock for
hatchery production. The ladder also suffered repeated flood damage and required regular
repair. Additional fish losses occurred when downstream migrating fish were swept into
the dam's diversion canal. Stream flow diversions also affected fish migration and
production below the dam for many years (Taylor)"
The dam was later taken down in 2007 and 2008 due to the severe changes in salmon populations.
Figure 8: Fish Ladder (Corps of Engineers).
Methane production:
Another severe consequence of hydroelectric plants is the byproduct of methane from
decomposing trees and other plant life in an anaerobic environment. Methane is created when reservoirs
are built without prior deforestation and removal of various other plant life, thus trapping plant material
underwater which in turn decomposes without oxygen. Methane, like carbon dioxide, is a very potent

10
greenhouse gas that can effectively change our climate. "Hydroelectric dams produce significant amounts
of carbon dioxide and methane, and in some cases produce more of these greenhouse gases than power
plants running on fossil fuels (Graham-Rowe)." Phillip Fearnside, a conservation biologist at the National
Institute of Research in the Amazon in Manaus says, "His latest results suggest a typical tropical
hydropower plant will, during the first ten years of its life, emit four times as much carbon as a
comparable fossil fuel station (Giles)." This is conflicting information when considering the media calling
hydroelectricity "clean" energy. There is a need for a uniform tax to offset the costs for social damages
caused by an increase of greenhouse gases. Currently this tax is either low or non-existent, thus favorably
influencing the decision to build a dam. If this tax levy is figured into the calculation of a hydro-power
plant the resulting increase in cost makes hydroelectricity neither "clean" nor "cheap".
Safety:
The last and most well known problem is that of safety. With vast amounts of water held back by
a dam, there is always the potential of terroristic acts, accidents and major flooding downstream caused
by faulty construction or natural catastrophes, evoking natural fear in the population living in the
surrounding and possibly affected areas. During times of war, dams are major targets for destruction
because they can not only disrupt power, but they also create a large number of casualties as water is
released from the damaged reservoir. During the Second World War, the British Royal Air Force used
specially designed "Bouncing Bombs" that would essentially skip across the water and sink at the edge of
the dams causing the most amount of damage to them (CWGC 2005). This tactic was used on the
Moehne and Edersee dams in Germany, releasing millions of tons of water into the Rhine valley as seen
in figure 9.

11
Figure 9: Moehne Dam destruction (Fray 1943).
Faulty construction such as that of the Banqiao Dam in the Henan province of China, killed an
estimated "26,000 people directly when it broke in 1975 and another 145,000 died of disease and famine.
Unofficial estimates put the total number of deaths as high as 230,000 people (Goldstein)." Here the dam
was constructed with an extra reservoir capacity to account for a 1 in 1000 year rain storm. On August 8,
1975 China experience a 1 in 2000 year rain storm in which there was "rainfall recorded at 1.060 meters
in 24 hours near the typhoon center (Xinhau)." 700 million cubic meters of water were released within the
first 6 hours of the breach. "Official statistics recorded 30 years after the dams burst show more than
26,000 people were killed in the floods [and] the life of more than 10 million people was affected
(Xinhau)."
Economic analysis:
As mentioned above, relocation of both animals and humans and the associated costs pose one of
the major problems not always looked into by developing countries. Often the need for more electricity
supersedes any other consideration. There should be a formula to assess what fiscal responsibility the
government should employ to reimburse for population relocation, including the loss of ancestral land,
impact from ethical and ethnical damages. Unfortunately, ethics are not always the guiding factor and
give way to greed.

12
"For example, dams have physically displaced 40-80 million people worldwide, and most
of these people have never regained their former livelihoods. In many cases, dams have
led to a significant and irreversible loss of species and ecosystems, and efforts to mitigate
these impacts have often not been successful (Bosshard)."
Table 2 shows relocation figures for some dams with major relocation before 1982 (Fearnside)
and the most controversial one in recent history, the Three Gorges Dam. The costs of methane emissions
as mentioned before, as well as costs for insurance have to be taken into consideration when the total cost
is to be determined.
Table 2: Relocation Figures
Dams Number of people relocated
Aswan 120,000 Bkakra 36,000 Brokopondo 5,000 Damodar 93,000 Gandhi Sagar 52,000 Kainji 42,000-50,000 Kariba 50,000-57,000 Keban 30,000 Kossou 75,000 Lam Pao 130,000 Nam Ngum 3,000 Nam Pong 25,000-30,000 nanela 90,000 netzhualcoyoti 3,000 Sanmenxia 870,000 Pa Mong 310,000-480,000 Tarbela 86,000 TVA 60,000 Uper Pampanga 14,000 Volta 80,000-84,000 Three Gorges Dam [17] 6,000,000

13
Looking at the Three Gorges Dam in the Hubei province of China, with a capacity of 18,200 MW
of electricity (Acker) how can we determine the breakeven point taking the cost of the dam plus the
relocation of the people into consideration?
First the total costs should be approximated using Equation 1.
(Eq. 1)
Where is the total cost of the dam, is the cost of operation, and maintenance, is the
cost associated with the methane production; is the cost for building the dam, and is the
cost for relocation of the people approximated by equation 2.
(Eq. 2)
Where is an estimated relocation cost to move a rural Chinese household to a new house,
is the annual salary the rural Chinese worker earns in a year, is the time in years, is
the estimated price to compensate the historical loss of land from generations of families living there and
is the number of households that have to be moved. The average household in rural China is limited by
law to only one child (BBC), creating an average person to household ratio of 3. This might be an under
estimation because of larger families living together for economic as well as cultural reasons (i.e.,
cohabitation of multi-generational families within one structure).
The calculation of the amount of households that are then affected by the relocation can be done
using Equation 3.
(Eq. 3)
where is the amount of people that are affected by the building of the dam, and is the
person to household ratio. With 6 million people being relocated due to the Three Gorges Dam as
mentioned above, the amount of households is approximated as 2 million. Additionally the yearly income
of a rural Chinese worker is roughly 4,140 Yuan a year. When converting this yearly salary to dollars, the
average Chinese worker in rural areas earns only $572.61 a year (Subler). Using an estimated $5,000 as
the relocation amount and a historical compensation price of $1,000 the relocation cost equation,
Equation 2 above turns into Equation 4, below where the relocation costs are only given for the first 15
years.
14
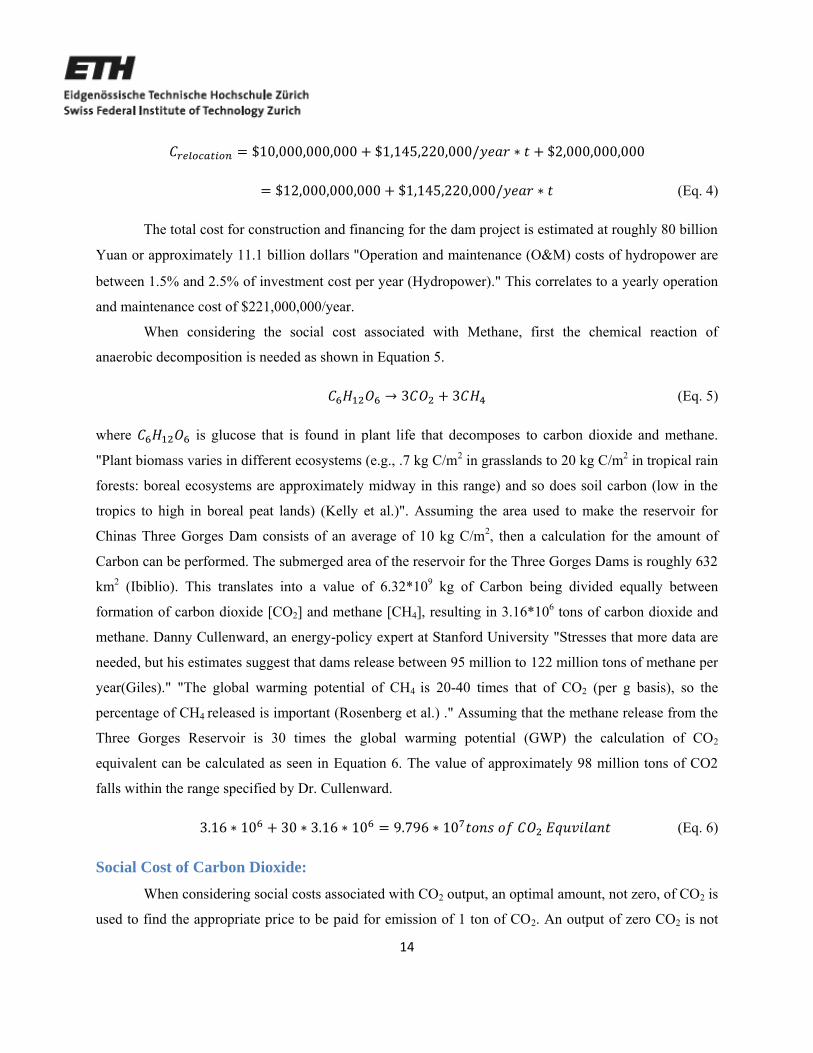
(Eq. 4)
The total cost for construction and financing for the dam project is estimated at roughly 80 billion
Yuan or approximately 11.1 billion dollars "Operation and maintenance (O&M) costs of hydropower are
between 1.5% and 2.5% of investment cost per year (Hydropower)." This correlates to a yearly operation
and maintenance cost of $221,000,000/year.
When considering the social cost associated with Methane, first the chemical reaction of
anaerobic decomposition is needed as shown in Equation 5.
(Eq. 5)
where is glucose that is found in plant life that decomposes to carbon dioxide and methane.
"Plant biomass varies in different ecosystems (e.g., .7 kg C/m2 in grasslands to 20 kg C/m2 in tropical rain
forests: boreal ecosystems are approximately midway in this range) and so does soil carbon (low in the
tropics to high in boreal peat lands) (Kelly et al.)". Assuming the area used to make the reservoir for
Chinas Three Gorges Dam consists of an average of 10 kg C/m2, then a calculation for the amount of
Carbon can be performed. The submerged area of the reservoir for the Three Gorges Dams is roughly 632
km2 (Ibiblio). This translates into a value of 6.32*109 kg of Carbon being divided equally between
formation of carbon dioxide [CO2] and methane [CH4], resulting in 3.16*106 tons of carbon dioxide and
methane. Danny Cullenward, an energy-policy expert at Stanford University "Stresses that more data are
needed, but his estimates suggest that dams release between 95 million to 122 million tons of methane per
year(Giles)." "The global warming potential of CH4 is 20-40 times that of CO2 (per g basis), so the
percentage of CH4 released is important (Rosenberg et al.) ." Assuming that the methane release from the
Three Gorges Reservoir is 30 times the global warming potential (GWP) the calculation of CO2
equivalent can be calculated as seen in Equation 6. The value of approximately 98 million tons of CO2
falls within the range specified by Dr. Cullenward.
(Eq. 6)
Social Cost of Carbon Dioxide:
When considering social costs associated with CO2 output, an optimal amount, not zero, of CO2 is
used to find the appropriate price to be paid for emission of 1 ton of CO2. An output of zero CO2 is not

15
considered optimal because there are costs associated with not producing any additional units. For
example people want cars or other products but if the CO2 output is zero these products would not be
made or sold and the opportunity cost associated with not producing any CO2 is not producing any cars.
As seen in Figure 10, the optimal price of output of CO2 is where the marginal control cost or benefits
equal that of the marginal damage costs (Kiel, Matheson and Golembiewski). This price has been
disputed and a wide range of prices have been suggested ranging from $1/ton to $1500/ton. In Europe it
has been suggested to use values of €4 to €30 per ton of CO2.(Kanter).
Figure 10: Optimal Price of CO2
According to Pearce (2003), total damages from the emissions of 1 ton of carbon dioxide or other
green house gas can be calculated through a string of complex equations. First the total damage function
is presented in Equation 7.
∑
( )
(Eq.7)
where is the total damages done by the emission on the greenhouse gas,
is all future incremental
damages, is time and is the social discount rate. In this instance, the social discount rate is estimated to
range from 1% to 5% and can be formulated using Equation 8.
(Eq. 8)
Where s is the social discount rate, is the rate at which wellbeing is discounted, is the
elasticity of the marginal utility of income and g is the expected growth rate per-capita consumption.

16
The annual damages, Dt can be approximated using the following Equation 9, proposed by
Fankhauser (1995).
(
) ( )
(Eq. 9)
Where is the amount of warming, in degrees Celsius associated with the doubling of carbon dioxide
from pre-industrial levels, is the year in which the doubling of CO2 is to occur, is a parameter that
makes the impacts greater if they occur before and lower if the occur after , is the damage done by
doubling the CO2 which is estimated to happen in 2050, and is the temperature increase on the upper
ocean layer.
Using numbers from Frankhauser (1995), shown in Table 3, the model for damages can be seen
for a .1 degree increase per decade.
Table 3: Parameters for Damage.
Parameter Value Units
ϒ 1.3 [-]
ᴧ 2.5 [degrees]
0.006 [-]
t* 2050 [year]
kt 270 billion [$]
Tt 2.6 [degrees]
t 2010 [year]
Using these values Equation 9 can be rewritten into Equation 10.
(
) ( ) (Eq. 10)
Using these values, calculations for the price per ton of CO2 can be formulated using the above
mentioned Equation 10. Multiple methods for calculation are shown in Figure 11, where MC stands for a
marginal cost approximation and CBA is the cost benefit analysis that is shown above.

17
Figure 11: Estimated cost per ton of Carbon

18
As seen from the graph, the social cost of CO2 emissions is increasing as the effects of global
warming become more noticeable. Looking at both approximations, an intermediate price of $25 per ton
of CO2 can be used, the price from methane and carbon dioxide can then be approximated using Equation
11.
(Eq. 11)
This amounts to a price of approximately 2.45 billion dollars. Equation 1 can now be reevaluated
as shown in Equation 12.
( ) ( ) ( )
(Eq. 12)
Approximating the amount of income the dam receives a year can be achieved by a rough cost
calculation of the residential use of electricity which is about.50 Yuan per kilowatt hour (Tang). This
corresponds to approximately $.07/kWh. Using the estimated output of 49 billion kWh per year a formula
for income is formulated in Equation 3.
[ ] [
] (Eq. 13)
To finally calculate the time required to pay off the dam, equation one must equal equation two,
where total costs have to equal total income as seen in Equation 14.
(Eq. 14)
Using this equation multiple scenarios can be performed to see the importance of each individual
cost on the overall costs of the plant and in turn the breakeven time. Four different scenarios are shown in
Table 4, where Scenario 1 represents a case when everything from relocation to historical costs are
considered. Scenarios 2 through 4 are using other considerations to evaluate the breakeven point for the
hydroelectric plant.

19
Table 4: Scenarios of Different Taxations.
Inputs
Scenario 1, Everything Considered
Scenario 2, No CO2 taxation and no
relocation costs
Scenario 3, Low cost of CO2
Scenario 4, High cost of CO2
Households 2,000,000 2,000,000 1,000,000 1,000,000 Yearly Income $572.61 $0.00 $572.61 $0.00
Duration of Yearly Income [Years] 15 15 15 15
Relocation Amount $1,000 $0 $1,000 $1,000
Capital Cost $25,000,000,000 $25,000,000,000 $25,000,000,000 $25,000,000,000 Historical
Compensation $2,000 $0 $2,000 $2,000 Operation and Maintenance Percentage 2.00% 2.00% 2.00% 2.00%
Operation and Maintenance Total $500,000,000 $500,000,000 $500,000,000 $500,000,000
Area of Land [m2] 632,000,000 632,000,000 632,000,000 632,000,000
Plant Biomass Density [.7-20 kg/m2] 10 10 10 20
Amount of Carbon 6,320,000,000 6,320,000,000 6,320,000,000 12,640,000,000
Cost of CO2 [$/ton CO2] $25 $0 $15 $100
Global warming Potential 30 0 30 20
Total Cost $2,480,000,000,000 $25,000,000,000 $1,497,400,000,000 $13,300,000,000,000
Varying cost initially [$/year] $1,645,220,000 $500,000,000 $1,072,610,000 $500,000,000
Varying Cost Finally [$/year] $500,000,000 $500,000,000 $500,000,000 $500,000,000
Inputs
Estimated Output [kWh] 49,000,000,000 49,000,000,000 49,000,000,000 49,000,000,000
Price per kilowatt 0.07 0.07 0.07 0.07
Total Income $3,430,000,000 $3,430,000,000 $3,430,000,000 $3,430,000,000
Breakeven
Point [years] 852.28 8.53 513.99 4539.25

20
Graphically this is represented in figure 12, where the cost is plotted versus the income to
determine, at the intersection, where the breakeven point is located. The total revenue earned is depicted
in green while the total amount spend is depicted in red.
Figure 12: Graphic Depiction of the Breakeven Point.
From these graphs, one can easily see that depending on the social importance for a taxation of
CO2 the time frame for when the hydroelectric dam will pay for itself drastically changes. For scenario 2,
for example, there is no cost associated with relocating the people, compensation for lost land, salary
loses or CO2 taxation. This brings the overall cost of the plant construction and operation drastically down
which makes the breakeven point a very desirable 8.5 years. On the other hand, in scenario 1 relocation
costs as well as CO2 taxation is considered and the breakeven period jumps to an astonishing 852.28
years. The other extreme case is that in which the CO2 is taxed greatly, at a value of $100 per ton of CO2.
Here the breakeven point is calculated at over 4000 years. These calculations of course use assumptions
of constant price and constant CO2 output. In reality the price of electricity will be increased to pay for
different taxations and the methane that is produced through the anaerobic decomposition will only be
affective for a limited time, where the peak output is release in the first 10 years.
0 100 200 300 400 500 600 700 800 900 10000
0.5
1
1.5
2
2.5
3
3.5x 10
12 Scenario 1, Relocation cost
plus CO2 taxation
Years
Do
llars
0 1 2 3 4 5 6 7 8 9 100
0.5
1
1.5
2
2.5
3
3.5x 10
10 Scenario 2, No relocation prices
and no CO2 taxation
Years
Do
llars
0 100 200 300 400 500 6000
0.5
1
1.5
2
2.5x 10
12 Scenario 3, Lower cost of
CO2 taxation
Years
Do
llars
0 500 1000 1500 2000 2500 3000 3500 4000 4500 50000
2
4
6
8
10
12
14
16
18x 10
12 Scenario 4, Very high cost
of CO2 taxation
Years
Do
llars

21
Conclusion:
Obviously, there are many factors to consider when determining if an area is suitable for
construction of a hydroelectricity plant. Great social impact caused by moving entire villages from one
place to another in order to make room for the vast reservoirs that are needed, create many facetted
problems, not only economical and religious but also environmental and historical. As presented above
the number of people forced to relocate due to the Three Gorges Dam created an immense cost that is
hard to ever pay off. When moving 6 million people the costs associated with the loss of work and the
loss of the ancestral land greatly impact the breakeven point of the entire project. With the growing need
for more electricity due to the increase in population and the increasing development of countries such as
China and India, a "clean" and "cheap" energy source is needed. The panacea was always believed to be
hydroelectricity. However, if governments only enforce a selective few policies and not consider all
factors and impacts, this can be very far from the truth and will greatly affect the overall socio-economic
and environmental well-being of the world. A policy that considers social well being more than economic
gain has to be enforced to eliminate this huge social cost. Weighting factors should be employed to
consider the importance of electricity vs. the damages that will be caused by relocating this amount of
people.
Other factors, such as the emission of methane and carbon dioxide produced as a side effect of the
anaerobic decomposition of bio mass, also play a giant role in the decision as to whether to invest in
hydroelectric dams. "Pearce estimated that CO2 emissions from reservoirs globally amount to 7% of total,
man-made emissions of CO2." A policy of determining methane and CO2 emissions from these potential
sites is a must. As mentioned above the density of the forest or plant life in the affected area used for the
reservoir greatly impacts the amount of CO2 and methane that will be produced. This density must be
examined and used for a cost benefit analysis to see whether the site for the dam makes economical and
ecological sense. Surveys sponsored from the state or independent research groups have to be performed
to find suitable locations for the hydroelectric dams and to map out the plant densities to create an overall
hydroelectric potential map for the specified land. Then either trees or plant life must be eliminated
through expensive deforestation plans before the dam is built, or the reservoir must be built in a place
with very low forest density. This would have to become a law to eliminate these very costly social
damages created by the methane.

22
CO2 accounting in countries pose the dilemma that local regulations only hurt the countries that
actually abide by these rules. These countries are considered free riders; the ones who do not conform to
these laws, are still able to output high levels in gases without having to abide by the restricting and costly
regulations of other countries. This brings up the classic point of "the race to the bottom" in which
countries notice that free riders are producing the same amount and are not having any of the negative
effects of the regulations and therefore lower or eliminate the regulations in order to be competitive. This
is of course a major issue when considering developing countries which require more electricity to
become competitive in the future but still need it at low cost.
When deciding on where and if construction of a dam is feasible a few measures must be taken
into account. First the number of people to be relocated and the overall cost associated with this move
have to be considered, where the importance of electricity has to be weighed against the damages
associated with the many people that have to relocate. It will also have to incorporate the population's
salary loss because of this relocation. Other social costs such as the price of having to abandon an area of
great historical meaning for past generations and the cost of losing historical artifacts must be
incorporated and a quantitative estimation of this cost has to be attempted and achieved. Cost associated
with the emission of methane and carbon dioxide as well as a quantitative estimation of the price
associated with real or perceived safety issues of the people. All this and more have to be factored into the
overall price of the dam to legitimize the economic benefit of building a dam.

23
References:
Acker, F. "Taming the Yangtze." Engineering and Technology Magazine. Volume 4. Issue 4. 2 March 2009. 13 April 2011. <http://eandt.theiet.org/magazine/2009/04/taming-the-yangtze.cfm>.
Atkins, W. "Hydroelectric Power." Water Encyclopedia. 4 April 2011 <http://www.water encyclopedia.com/Ge-Hy/Hydroelectric-Power.html>.
BBC. "China steps up 'one child' policy." BBC News. 25 September 2000. 16 April 2011. <http://news.bbc.co.uk/2/hi/asia-pacific/941511.stm>.
"Beyond Three Gorges in China." International Water Power and Dam Construction. 10 January 2007. 15 April 2011. <http://www.waterpowermagazine.com/story.asp?storyCode=2041318>.
Bosshard, P. "The World commission on Dams Framework-A Brief Introduction." International Rivers. 29 February 2008. 12 April 2011. <http://www.internationalrivers.org/en/way-forward/world-commission-dams/world-commission-dams-framework-brief-introduction>.
"China's Three Gorges Dam" Mtholyke. 12 April 2010. <http://www.mtholyoke.edu/~vanti20m/ classweb/website/current.html>.
"Demand for electricity changes through the day" EIA - 2010 International Energy Outlook. 2010. 6 April 2011. 7 April 2011 <http://www.eia.doe.gov/oiaf/ieo/world.html>.
EIA - 2010 International Energy Outlook. 2010. 4 April 2011 <http://www.eia.doe.gov/oiaf/ieo/ world.html>.
Eyre, N., et al. "Externe–Global Warming Damages." Final Report of the Global Warming Sub-Task of the Project JOS3-CT95-0002. Brussels (1997). Print.
Fearnside, P. "Greenhouse Gas Emissions from Hydroelectric Dams: Controversies Provide a Springboard for Rethinking a Supposedly 'Clean' Energy Source. ≪I≫an Editorial Comment≪/I&Gt." Climatic Change 66.1 (2004): 1-8. Print.
Giles, J. "Methane Quashes Green Credentials of Hydropower." Nature 444.7119 (2006): 524-25. Print. Fish Passage Technologies: Protection at Hydropower Facilities. OTA-ENV-641 (Washington, DC: U.S.
Government Printing Office, September 1995).
Fray, J. "Mohne Dam breached." Allied Phot Reconnaissance of World War II. Ed. Staeker, Chris. 17 May 1943. 10 April 2011.
Fankhauser, S. "Valuing Climate Change: The Economics of the Greenhouse." (1995). Print. Graham-Rowe, D. "Hydroelectric Power's Dirty Secret Revealed." new scientist 4 (2005). Print. Goldstein, L. "'Safe' power an oxymoron." Toronto Sun. 20 March 2011. 11 April 2011.
<http://www.torontosun.com/comment/columnists/lorrie_goldstein/2011/03/18/17675461.html>.
Hirsch, R. "PEAKING OF WORLD OIL PRODUCTION; How Do We Mitigate the Problem?" SAIC, July 2005. 4 April 2011 <https://secure.ametsoc.org/atmospolicy/documents/July252005 Dr.Hirsch.pdf>.
"Hydropower." Energy Technology Network. 15 April 2011. < http://www.etsap.org/E-techDS/PDF/E07-hydropower-GS-gct.pdf>.

24
Ibiblio. "Exploring Chinese History: The Three Gorges Dam Project." Ibiblio. 22 March 2011. 15 April 2011 <http://www.ibiblio.org/chinesehistory/contents/07spe/specrep01.html#Quick%20Facts>.
IEA. "Key World Energy Statistics." International Energy Agency. 2007. 4 April 2011 <http://www.iea.org/Textbase/nppdf/free/2007/key_stats_2007.pdf>.
John Day Dam and Lake Umatilla, photograph by the Corp of Engineers. April 7 2010. <http://www.nwd-wc.usace.army.mil/report/jda.htm>.
Kanter, J. "Europe Considers New Taxes to Promote 'Clean' Energy." The New York Times. 22 June 2010. Kelly, C., et al. "Turning Attention to Reservoir Surfaces, a Neglected Area in Greenhouse Studies." EOS
Transactions 75 (1994): 332-32. Print. Kiel, K.A., V.A. Matheson, and K. Golembiewski. "College of the Holy Cross, Department of Economics
Faculty Research Series, Paper No. 09-08." (2009). Print. Maddison, D. "Economics and the Environment: The Shadow Price of Greenhouse Gases and Aerosols."
Surrey Energy Economics Centre (SEEC), Department of Economics Discussion Papers (SEEDS) (1994). Print.
NASA. "Merowe Dam, Nile River, Republic of the Sudan: Image of the Day." NASA Earth Observatory. 25 October 2010. April 7 2011. <http://earthobservatory.nasa.gov/IOTD/view.php?id=46505 &src=eorss-iotd>.
Nordhaus, W.D. "Managing the Global Commons: The Economics of Climate Change." (1994). Print.
---. "To Slow or Not to Slow: The Economics of the Greenhouse Effect." The economic journal 101.407 (1991): 920-37. Print.
Pearce, D. "The Social Cost of Carbon and Its Policy Implications." Oxford Review of Economic Policy 19.3 (2003): 362-84. Print.
Pearce, F. "Trouble Bubbles for Hydropower." new scientist 150.28 (1996): 28-31. Print.
Peck, S.C., and T.J. Teisberg. "Global Warming Uncertainties and the Value of Information: An Analysis Using Ceta* 1." Resource and Energy Economics 15.1 (1993): 71-97. Print.
Plambeck, E.L., and C. Hope. "Page95:: An Updated Valuation of the Impacts of Global Warming." Energy Policy 24.9 (1996): 783-93. Print.
Lutz, W. Sanderson, W., and Scherbov S. "The End of World Population Growth." Nature 412.6846 (2001): 543-45. Print.
Rosenberg, D M, et al. "Large-Scale Impacts of Hydroelectric Development." Environmental Reviews 5.1 (1997): 27-54. Print.
Roughgarden, T., and S.H. Schneider. "Climate Change Policy: Quantifying Uncertainties for Damages and Optimal Carbon Taxes." Energy Policy 27.7 (1999): 415-29. Print.
Schauer, M.J. "Estimation of the Greenhouse Gas Externality with Uncertainty." Environmental and Resource Economics 5.1 (1995): 71-82. Print.
Subler, J. "China urban-rural income gap continues to widen" Reuters. 24 January 2008. 14 April 2011. <http://in.reuters.com/article/2008/01/24/china-economy-incomes-idINPEK171502008 0124>.

25
Tang, A. "China raises price of electricity for non-residential use." China View. 19 Novemeber 2009. April 14 2011. <http://news.xinhuanet.com/english/2009-11/19/content_12492364.htm>.
Taylor, B. "Salmon and Steelhead Runs and Related Events of the Sandy River Basin–a Historical Perspective." Prepared for Portland General Electric Company (1998). Print.
"The Dams Raid." Commonwealth War Graves Commission. 2005. 10 April 2011. <http://www.cwgc. org/admin/files/The%20Dams%20Raid.pdf>.
Tol, R.S.J. "The Marginal Costs of Greenhouse Gas Emissions." The Energy Journal 20.1 (1999): 61-82. Print.
Tol, R.S.J., T.E. Downing, and Vrije Universiteit te Amsterdam. Instituut voor Milieuvraagstukken. The Marginal Costs of Climate Changing Emissions. Institute for Environmental Studies, 2000. Print.
Xinhau. "After30 years, secrets, lessons of China's worst dams burst accident surface." Peaple's Daily Online. 1 October 2005. April 12 2011. <http://english.people.com.cn/200510/01/eng20051001 _211892.html>.