Embed Size (px)
Citation preview

ENERGY EFFICIENCY
ACTION PLAN FOR
TALLINN

2
INTRODUCTION
Tallinn's present Action Plan for Energy Efficiency, which has been developed for the
period 2010 to 2020, analyses energy-saving opportunities in Tallinn and sets out
guidelines for the development of Tallinn's energy economy by the year 2020.
The main objective of the Action Plan is to reduce energy consumption and greenhouse
gas emissions, and to increase the renewable energy share.
In February 2009, Tallinn joined the Covenant of Mayors, the international co-operation
of communities. Accordingly, the city has undertaken the duty to reduce its CO2
emissions by 20% by 2020 as a result of a 20% improvement in energy efficiency and a
20% share of renewable energy sources in the energy mix.
The estimates of energy consumption contain data for the period from 2007 until last
year, providing full details of energy consumption. The present Action Plan considers
energy consumption in Tallinn and the corresponding social and economic areas in 2007.
General energy consumption in Estonia (incl. Tallinn) is at an average level among the
European Union states.
In Tallinn 2007, the share of renewable energy sources in the fuel balance was 8.2%.
Wood fuels comprised the major part in individual heating and small boiler rooms.
Natural gas has been the most used among all kinds of power-generating fuel, and
comprised the main fuel in Tallinn’s central heating plants. Iru Power Station, which
produced more than half of Tallinn's central heating in 2007, has also used natural gas as
its fuel.
The share of fuel used in transport has been remarkable, - more than 50% of total fuel
consumption. In Tallinn 2007, electricity consumption amounted to 1996 Gwh, which
was mainly supplied by Eesti Energia AS. Less than 1% of the consumed electricity has
been produced by those of Tallinn's small power and heating stations based on gas power.
Though the main electricity users have been manufacturing plants and the general
population, a considerable amount of electricity has also been consumed by the city
facilities. The major share of electricity has gone on street lighting, which uses about 2%
of the total electricity consumed in Tallinn. AS Tallinna Vesi also uses a significant
amount of electricity.
Energy production and the consumption structure in Tallinn is to be substantially changed
by 2020. At the end of 2008, the new Tallinn Power Plant, based on renewable energy
and located in the Väo old limestone quarries, was put into operation. New plant supplies
Tallinn with central heating and electric energy.
In the coming years, significant changes are to take place in Tallinn's waste management
due to the improvement of waste sorting and utilization. Waste burning plant is likely to
be built, which would process some part of the household waste. These plants could also
produce some degree of heating and electricity in Tallinn.

3
In addition to the biofuel Tallinn Power Station (wood fuel and peat), which currently
supplies Tallinn with more than 22% of its central heating and 9% of its electricity
consumption, it is reasonable to reduce the proportion of natural gas used for the city's
heating supply (which nowadays amounts to more than 70%), and to increase the amount
of the energy in Tallinn energy balance produced from less expensive local fuels (wood
fuel and peat). For this purpose, the merging of the main districts' heat distribution
network will be completed; this will enable the maximum use of the current biofuel
production potential and run a system supplementing biofuel energy resource(s).
For instance, a supplementary 75MW station would enable the increase of the share of
biofuel heating in Tallinn's heating supply network up to 50%.
In 2010, construction of a new heating main between Tallinn's Western (Lasnamäe,
Kopli) and Eastern (Mustamäe, Õismäe, North Tallinn) districts was started, upon the
completion of which Tallinn's major heating supply districts and their networks will have
been merged. The named works are to be completed by autumn 2011. This
interconnection will improve the efficiency of the power and heat supply network, and
increase the share of heating energy produced from less expensive biofuel in Tallinn’s
Power Plant up to 25-30% in the city's heat power balance.
Furthermore, the construction of a heat pump system near the sewage treatment plant in
Paljassaare is being discussed, which would use the energy from sewage water; the
approximate capacity of such a system would be 20MW and it would cover 6-7% of the
city's heat consumption.
The higher electricity consumption caused by a rise in economic activity will be covered
by the savings made, and, in 2020, electricity consumption will presumably stay at the
same level as in 2007. Both power plants and society play significant roles in this
process: the use of energy-saving light bulbs and changing behavioural patterns with
regard to rational energy consumption are essential.
It is also essential to save energy in housing services. House insulation and the
construction of new energy-efficient houses will enable the saving of up to 30% of
consumed heat. Buildings' energy audits and the energy performance certificate system
will contribute to the achievement of this objective. The Action Plan aims to reduce heat
consumption by 2% annually. Thus, by 2020, heat consumption will have been reduced
by 23% in comparison to 2007.
As for the transport sector, it is vital that at least 10% of Tallinn's transport fuel
consumption be satisfied by biofuel, so it is necessary to introduce biofuel both to the
city's public and private transport.
In general, the development of guidelines for society and the encouragement of rational
energy consumption behaviour have a significant role in energy economy. Nowadays,
through changing behavioural patterns in regard to energy consumption, it is possible to
save 10-15% of electricity without the involvement of any technical equipment. This
holds true for both electricity and transport consumption as well other social sectors.
All opportunities are to be used within energy-saving investments: the city's monetary
funds, the state budget and private sectors, and the involvement of the whole population
in the use of energy-saving ways and means.

4
For the successful implementation of the energy-saving project it is necessary to carry out
a precise calculation in this respect and keep it under control. A structural unit must
operate in the city to co-ordinate and control the city's energy consumption. Besides,
possible barriers to the achievement of the targeted energy-saving level must be foreseen
and the appropriate preventive measures taken.
By applying the methods set out in the present Action Plan it is possible to save a
significant amount of energy. In the housing services sector, it is possible to save 20-25%
of the consumed heat and 10-15% of electricity. At least 50% of heat consumption in
Tallinn can be covered by renewable fuel, using which 16% of consumed electricity is
generated in Tallinn's power and heating plants. Considering the total amount of energy
consumption, including purchased electricity, it is possible to cover more than 28% by
using renewable energy.
In Tallinn, CO2 emissions into the atmosphere from burning fossil fuel can also be
reduced by 370 000 tones or 23%. Due to changes in the Estonian electricity production
structure, the amount of indirect CO2 emissions along with the amount of purchased
energy can be reduced by about a half.
With the application of measures set forth in the present Action Plan, Tallinn will fulfil
the duties undertaken by the Covenant of Mayors to reduce its CO2 emissions into the
atmosphere by 20%, as a result of 20% increase in energy efficiency and a 20% share of
renewable energy sources in the energy mix.
5
1 Plan objectives and procedure
1.1 Plan procedure
The Plan procedure is based on instruction materials and recommendations for the
preparation of energy efficiency strategic plans. The Action Plan preparation follows the
same principles as prescribed in the preparation of the energy efficiency strategic plans of
other European States. The Action Plan contains the following aspects:
analysis of the current situation in all industries and spheres of activities related to
the energy economy;
assessment of the previous development programmes for the energy economy and
the results achieved in other projects;
the state of Tallinn's energy economy and a comparison of development programmes
directions with other European States;
efficient energy economy planning;
recommendations for the development of the city's energy economy and
encouragement of rational energy consumption behaviour.
The Action Plan procedure follows the recommendations and requirements prescribed by
the regulations currently valid in Tallinn, in the Republic of Estonia, and in the European
Union, as well as other development programmes and proposals (see the List of
References), which have been worked out for the development of industries and spheres
of activities related to the energy economy.
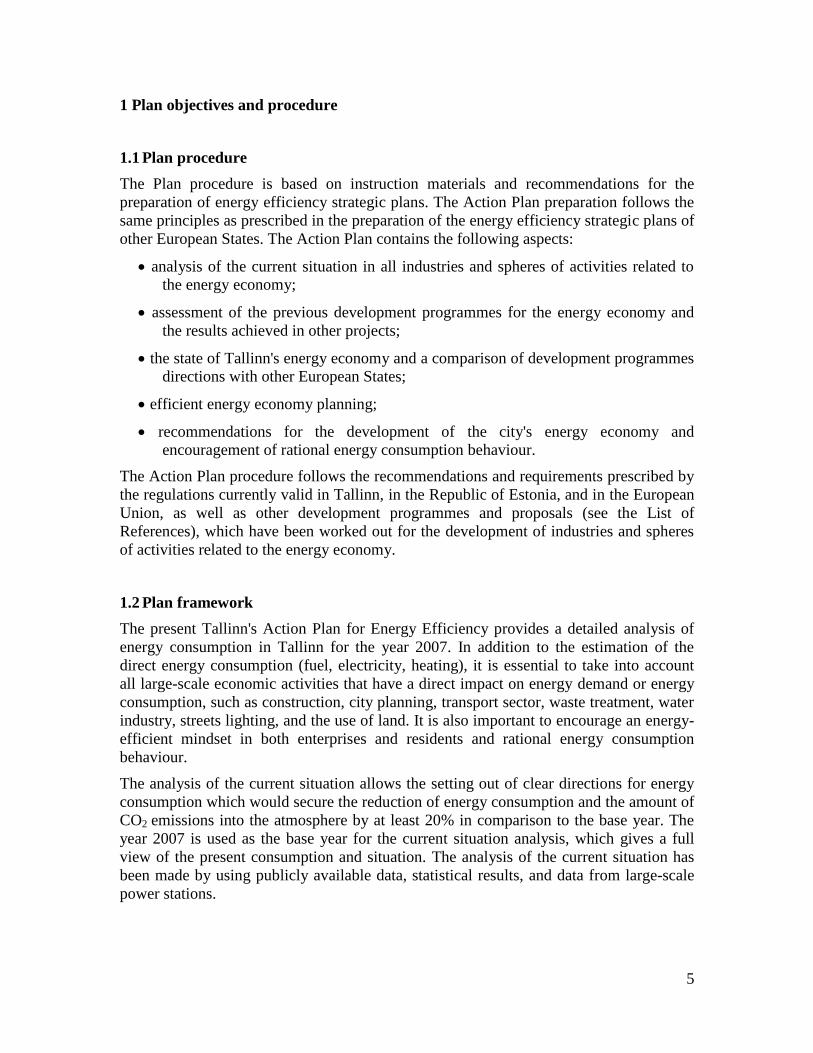
1.2 Plan framework
The present Tallinn's Action Plan for Energy Efficiency provides a detailed analysis of
energy consumption in Tallinn for the year 2007. In addition to the estimation of the
direct energy consumption (fuel, electricity, heating), it is essential to take into account
all large-scale economic activities that have a direct impact on energy demand or energy
consumption, such as construction, city planning, transport sector, waste treatment, water
industry, streets lighting, and the use of land. It is also important to encourage an energy-
efficient mindset in both enterprises and residents and rational energy consumption
behaviour.
The analysis of the current situation allows the setting out of clear directions for energy
consumption which would secure the reduction of energy consumption and the amount of
CO2 emissions into the atmosphere by at least 20% in comparison to the base year. The
year 2007 is used as the base year for the current situation analysis, which gives a full
view of the present consumption and situation. The analysis of the current situation has
been made by using publicly available data, statistical results, and data from large-scale
power stations.

6
To achieve the set targets, the development programme proposes the activity concept,
sets development objectives, and major essential strategic aspects in both direct energy
consumption and in economic activities that have a significant impact on this issue.
The Action Plan presents possible measures for the achievement of set targets and sets
precise timeframes for work performance. The Action Plan provides for the estimation of
possible expenses related to the fulfilment of the project, as well as the volume of
possible investments and potential sources of funds. The fulfilment of the Action Plan
will require the securing of state financing, private sector and the European Union funds.
The Action Plan presents precise, feasible, and monitored guidelines for efficient energy
use and works out specific opportunities to save energy as well as the total scope that can
be achieved. The Action Plan prescribes methods for the successful estimation and
principles of its disclosure. A classification system must be applied to all aspects of the
statistical data analysis, and available data analysis must be further advanced.
The Action Plan estimates possible barriers to the achievement of the targeted energy-
saving level and proposes appropriate preventive measures.
For the successful performance of the Action Plan, appropriate energy-saving measures
must be undertaken not only by the municipal government but also by business
enterprises and residents. It is essential to organize energy efficient days to encourage
people to change their consumption habits.
The Action Plan presents guidelines and prescribes accurate methods to achieve the
aimed-for energy-saving level and to reduce the amount of CO2 emissions in Tallinn by at
least 20% by 2020.
1.3 Covenant of Mayors
In February 2009, Tallinn joined the Covenant of Mayors, the international co-operation
of communities. Accordingly, the city has undertaken the duty to take steps to reduce the
impact on climate warming. Tallinn aims reduce its CO2 emissions by 20% by 2020 as a
result of a 20% improvement in energy efficiency and a 20% share of renewable energy
sources in the energy mix.
The Principles of the Covenant of Mayors were set out in 2006. The Covenant of Mayors
is the initiative of European Union's Energy Commissioner Andris Piebalgs, the
representative of the Republic of Latvia. The Covenant was signed at a special ceremony
in Brussels on the 10th
of February, 2009. In two weeks, in the course of the first
Technical Conference, the Covenant of Mayors has already been signed by more than one
hundred Mayors.
Nowadays, more than 1200 of both EU and non-EU members have joined the Covenant
of Mayors. Spain, one of the first signatories of the Covenant of Mayors, has been
particularly active, so more than 300 cities have joined the Covenant, and several districts
have joined its base framework. In general, Spain has achieved significant success in the

7
overall economy and, especially, in the development of the energy economy after it
joined the European Union in 1986.
In Estonia, three cities have joined the Covenant of Mayors: Tallinn, Rakvere, and
Kuressaare. These cities have significantly advanced in the development of the energy
economy.
With regard to the Covenant of Mayors, on 9 March 2007, the European Union adopted
the Energy package "Energy for a Changing World." According to this package, the cities
undertake the commitment to reduce their CO2 emissions by 20%, through the
implementation of the Sustainable Energy Action Plan, as a result of a 20% improvement
in energy efficiency and a 20% share of renewable energy sources in the energy mix.
By signing the Covenant, the mayors commit their cities to energy-efficient consumption.
Tallinn's Action Plan for Energy Efficiency provides guidelines on how to meet the
obligations in regard to the energy efficiency, the use of renewable energy, and the
reduction of CO2 emissions which Tallinn had undertaken by joining the Covenant
Union.
2 Situation Analysis
2.1 Energy generation and consumption
2.1.1. Consumption of power-generating fuel
Data on Tallinn's fuel consumption have been obtained from the Department of
Statistics[1]
, Information technology centre of the Ministry of Environment[2]
, collected
volume "Tallinn in numbers,"[3]
and from various enterprises. Unfortunately, these
sources provide different data due to the different principles used for the preparation of
reports.
The Department of Statistics' reports represent data on the energy consumption of those
enterprises having their main office in Tallinn. So, for instance, the heat consumption of
AS Eraküte Valga (whose main office is in Tallinn at Punane St. 36) and of other boiler-
houses located in Estonia is included in Tallinn's statistical consumption data. Data from
the Department of Statistics have also been used in the collected volume "Tallinn in
numbers," which may also contain systematic inaccuracies, as mentioned above. The
present Action Plan aims to represent a real view of Tallinn's fuel consumption by the use
of data obtained from enterprises and other sources.

8
Table 1. Consumption of power-generating fuels and purchased heat in Tallinn 2007
Table 1: “Consumption of power-generating fuels and purchased heat in Tallinn 2007“ represents all sorts of fuels consumed in
Tallinn in the course of energy generation, industrial works, service, and household activities. The table includes all kinds of fuel, such
as solid, liquid, and gas fuel. Transport fuel consumption is separately analysed in the chapter 3.3 (Transport and traffic).
Fuel Unit Energy
generation
Industry
and
construction
Business
and
service Household
Total
demand
Heating
value
Energy
(GWh)
Consumption
share (%)
Coal thousand
tons 1 7 8 7,5 60 1,4
Peat briquette thousand
tons 4 4 4,4 18 0,4
Wood fuel
thousand
cubic
meters 2 10 130 142 2,1 289 7,0
Wood chip and pellet
thousand
cubic
meters 50 6 100 156 1,7 268 6,2
Natural gas mln m³ 165 34 31 28 258 9,3 2407 56,3
Liquid gas thousand
tons 1 2 3 12,7 38 0,9
Biogas thousand
tons 3 3 5,3 16 0,4
Shale oil thousand
tons 1 1 1 3 10,9 33 0,8
Light fuel oil thousand
tons 2 6 1 4 13 11,8 153 3,6
Heat purchased from Iru Power
station GWh 89 167 730 986 986 23,1
Total energy consumption GWh 1660 515 523 1576 4274 4277 100,0
Consumption per capita MWh per capita 10,8

9
Figure 1. Fuel and purchased heat consumption in Tallinn 2007
[title above the diagram: Fuel and heat consumption in Tallinn 2007. From left to right: Liquid gas, Biogas, Shale oil, Light fuel oil, Purchased heat,
Coal, Peat Briquette, Wood fuel, Wood chips and pellet, Natural gas]
The consumed fuel analysis in the present Action Plan is limited to the administered territory of Tallinn. Heating fuel is also imported from outside
Tallinn. In 2007, Iru Power Station produced more than half of Tallinn's heating. Heat purchased from Iru Power Station is shown in the fuel and
energy balance as purchased energy.
In Tallinn 2007, natural gas consumption comprised the greatest part of all power-generating fuel and covered more than half of Tallinn's fuel balance.
A significant part of the fuel balance belongs to AS Tallinna Küte Boiler-houses, and to Iru Power Station, which belongs to AS Eesti Energia. The
share of other fuels in the energy balance is less significant in percentage terms.
If we analyse fuel consumption in terms of consumer groups, the biggest share belongs to energy production, or industrial heating. The share of
industry and other consumer groups has reduced over the years. The household sector is an important consumer group, as in the suburbs there are still
quite a few dwellings with individual heating systems.

10
The above table shows the data of fuel consumers only. In fact, such ultimate consumers as the general population, commercial and service enterprises
comprise a noticeable part of the consumption of power-generating fuel.
The Fuel consumption table shows that total fuel and purchased heat energy consumption amounts to 10.8 MWh for each of Tallinn's residents. These
data reflect fuel and heat consumption in Tallinn only. Actual fuel demand for energy generation is much bigger, as the said estimation does not
include the amount of actual fuel consumed by Iru Power Station, which would comprise more than the amount of energy produced for heating
networks.
2.1.2. Electricity consumption
Most of the electricity is supplied to Tallinn by Elering OÜ, the state-owned independent transmission system operator, so that the production and
transmission of electricity can be evaluated as a part of Estonia overall. The smallest share, or 2-3% of electricity, has been produced in Tallinn 2007 in
small-scale power stations (BLRT, Pääsküla, Kriistine centre). Iru Power Plant, located on the territory of the City of Maardu, has a significant role in
supplying Tallinn with energy. Tallinn's consumers use most of the heat produced in Iru Power Plant. Tallinn's atmosphere is also exposed to the
emissions of Iru Power Plant pollutants.
In Estonia, most of the electricity needed (93%) is produced at the Narva Power Plant. Tallinn is supplied with electricity by Elering OÜ’s main
network. In order to supply Tallinn with electricity, there are three central electric substations in Harju county which are directly connected to the
Narva Power Station: these comprise the reconstructed Harku and Kiisa 330 kV substations and the Aruküla 220 kV substation. Elering OÜ plans to
reconstruct the Arukula substation by 2013 and increase its power by up to 330 kV.
Elering OÜ has fourteen 110 kV substations to supply the city of Tallinn with electricity: Power Plant, Endla, Ida, Järve, Kadaka, Kivimäe, Kopli,
Lasnamäe, Paljassaare, Ranna, Tõnismäe, Veskimetsa, Volta, and Ülemiste substation. In addition, Tallinn is supplied with electricity by a number of
Elering OÜ substations which are located outside the territory of Tallinn, these being Iru, Loo, and Laagri.
Data on the amount of electricity supplied to Tallinn in 2007:
sale of electricity 1994 GWh
maximum load 442 MVA
minimum load 118 MVA
110 kV cable line length 12 km
110 kV aerial cable line length 175 km
110 kV substations 14

11
0,4–35 kV cable line length 3353 km
0,4–35 kV aerial cable line length 664 km
35 kV regional and distribution substations 167
medium/low-voltage substations 1764
Electricity consumption in Tallinn per capita in comparison with the whole of Estonia, average electricity consumption in the European Union, and
with the advanced and neighbouring countries:
Tallinn 5,0 MWh per capita
Estonia 5,1 MWh per capita
EU 27 (all EU states) 5,7 MWh per capita
EU 15 (old EU member states) 7,7 MWh per capita
France 6,7 MWh per capita
Germany 6,4 MWh per capita
Great Britain 5,6 MWh per capita
Finland 16,3 MWh per capita
Sweden 14,6 MWh per capita
Latvia 2,9 MWh per capita
Lithuania 2,6 MWh per capita
The above data for electricity consumption in various places show that electricity consumption in Tallinn is close to Estonia's average electricity
consumption level, and is slightly less than the average in the European Union. Electricity consumption in so-called old European Union member states
exceeds the average in the European Union by one third. Especially high electricity usage is observed in such northern countries as Finland and
Sweden. One possible reason is that electricity in these countries is mainly used for heating and the maintenance of heating systems. Our Western
neighbours, Latvia and Lithuania, consume half as much electricity as we do. Probably both Tallinn and all Estonia should use standby power supplies
efficiently.

12
2.1.3. General energy consumption
Considering total primary energy consumption is Estonia-wide: most electricity in Estonia is produced outside the territory of Tallinn, however, all
corresponding primary energy costs directly depend on Tallinn's consumption landscape. Though there are no data in regard to energy consumption in
Tallinn, the Department of Statistics provides the data of the energy and fuel consumption of those enterprises that have been registered in Tallinn
separately from those enterprises that are directly located in Tallinn. The same approach is used in other statistics collection documents, like "Tallinn in
numbers."
The review of energy consumption in both Tallinn and the rest of Estonia and its comparison with the neighbouring states is represented in the records
of annual energy, incl. electricity, consumption per capita (see table 2 "Energy, incl. electricity consumption").
Table 2. Energy, incl. electricity consumption
State, city, EU Population
(in thousand)
Total Energy
consumption
(MWh per
capita)
Electricity
consumption
(MWh per
capita)
EU 27 495305 41,1 5,7
EU 15 325196 52,3 7,7
Germany 82315 46,5 6,4
France 63626 47,9 6,7
Great Britain 60816 41,0 5,6
Sweden 9117 62,6 14,6
Finland 5277 80,4 16,3
Norway 4800 65,1 23,0
Lithuania 3385 30,5 2,6
Latvia 2231 23,6 2,9
Estonia 1342 50,6 5,1

13
Tallinn 397 5,0
Energy consumption in this context means total primary energy consumption, including both direct consumption of fuel and fuel used to produce other
sorts of energy (electricity and heat), as well as fuel used in the transport sector. It is impossible to represent the total demand for primary energy in
Tallinn, as the main part of the electricity used is supplied from outside the territory of Tallinn. Electricity production by modern technical solutions
requires three times as much primary energy as the amount of electricity required, so energy consumption in Tallinn is analysed according to the kinds
of energy involved: power-generating fuel, electricity, heat, and transport fuel.
The above table of energy demand demonstrates energy consumption in the whole of Europe as well as in Estonia and Tallinn. The table shows energy
data (including electricity) for consumption in the European Union (EU 27), in so-called old European Union member states (EU 15), in some large
European countries, in Estonia’s neighbouring countries, in Estonia, and in Tallinn as well, in comparison to the demand for electricity.
The table illustrates that in both Estonia and in Tallinn as such energy and electricity consumption is at the average level among European countries.
Energy consumption in the old European Union member states is higher due to their advanced economies. The northern countries have especially high
energy and electricity consumption per capita. The energy consumption in these countries is probably influenced by their cold climatic conditions. The
energy consumption of our western neighbours, Latvia and Lithuania, is significantly lower.
If we compare energy consumption indicators, we can accept that with the raising of technical levels, the demand for energy in Estonia, including
Tallinn, also has a tendency to rise. However, the rise of energy consumption must be limited by the rational application of technical energy-saving
devices. At the same time, the energy consumption indicators of Latvia and Lithuania demonstrate that it is possible to manage with an appreciably
lower energy consumption level.
2.2. Heat economy
Tallinn has more than 500 boiler-houses. The list includes both AS Tallinna Küte’s large-scale boiler-houses and other consumers' small-scale boiler-
houses. The production capacity of Mustamäe, Kadaka, and Ülemiste boiler-houses, all of which belong to AS Tallinna Küte, already exceeds 100
MW. Besides, a number of heat producers (AS Tallinna Küte boiler-house in Spordi St., Fortum Termest AS 100 boiler-houses in Mahla and Kopli St.,
Dekoil OÜ, AS Tallinna Vesi and Tallinn University of Technology boiler-houses, and BLRT Group AS power and heating plant) work at a
production capacity that exceeds 10 MW. More than a hundred boiler-houses work at a production capacity that exceeds 1 MW. The majority of
Tallinn's boiler-houses are small-scale ones with a production capacity of up to 1MW, supplying heat to enterprises and dwellings. In 2007, Tallinn's
major heat producers were AS Tallinna Küte[4]
, AS Eraküte,[5]
and Fortum Termest AS[6]
- these producers supply Tallinn with 70% of the produced
heat.

14
2.2.1. AS Tallinna Küte
AS Tallinna Küte (hereinafter referred to as Tallinna Küte) belongs to the Dalkia International SA concern and is the biggest heat producer in Estonia,
operating Tallinn's power-and-heat supply boiler-houses and managing Tallinn's urban heating network. In 2007, the number of buildings connected to
Tallinna Küte’s heating network amounted to 3617, and the number of contractual ultimate consumers amounted to 10 165. Tallinna Küte boiler-
houses transmit heat to more than half of Tallinn's heating networks (see table 3 "Tallinna Küte's boiler-houses").
In addition to heat produced in Tallinna Küte as such, the company purchases heat from Iru Power Station,[7]
and, since 2009, from the newly
established Tallinn Power Station, supplying it to Lasnamae district, Tallinn's City Centre, and the City of Maardu. In 2007, Tallinna Küte purchased
1 120 738 MWh of heat from Iru Power Station, of which 108 736 MWh were transmitted to the City of Maardu, and the rest supplied to Tallinn. In
addition, Tallinna Küte purchased 30 891 MWh of heat from other enterprises, mainly Fortum Termest AS boilerhouse (Mahla St. 87), and transmitted
it to consumers.
Those Tallinna Küte boiler-houses located in Mustamäe and Kadaka districts supply heat to Tallinn's Western area - Mustamäe, Haabersti, Kristiine,
and to northern Tallinn's heat consumers. Today, the Kadaka boiler-house is fully renovated and automated, and its boilers are equipped with modern
Low-Nox burners which comply with the European Union directive on environmental requirements for flue gas emissions. The same renovation works
are being made at the Mustamäe district boiler-house. The boiler-houses' main fuel is gas. The Mustamäe district boiler-house can use oil fuel as its
standby fuel (since 2010 it has been replaced with light fuel oil)
The boiler-house located in Ülemiste district (Masina St. 18) is considered to be a reserve boiler-house; it supplies heat to the City Centre and to
Lasnamäe district in case the Iru Power Station stands idle.
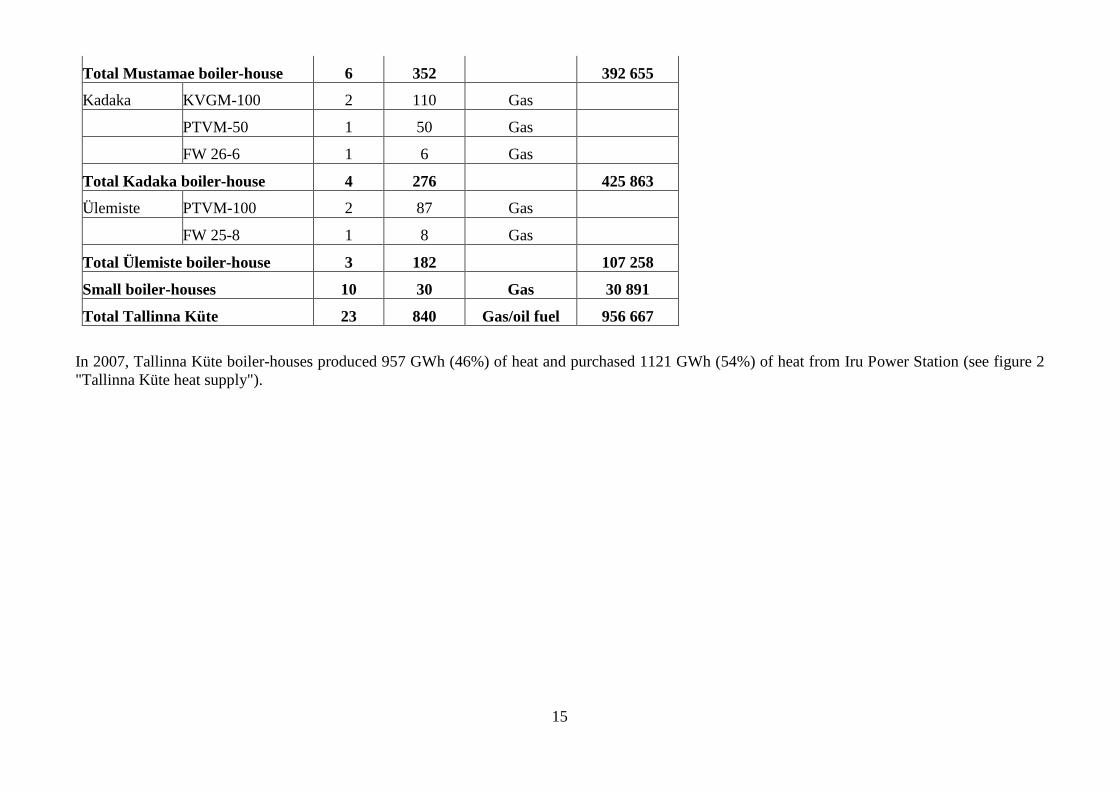
Table 3. Tallinna Küte's boiler-houses
Boiler-house
Boiler type
Amount
Actual
capacity
MW
Fuel
Energy
production
2007
MWh/y
Mustamäe PTVM-100 3 96 Gas/oil fuel
PTVM-50 1 50 Gas/oil fuel
FW 25-6 1 6 Gas
FV 25-8 1 8 Gas
15
Total Mustamae boiler-house 6 352 392 655
Kadaka KVGM-100 2 110 Gas
PTVM-50 1 50 Gas
FW 26-6 1 6 Gas
Total Kadaka boiler-house 4 276 425 863
Ülemiste PTVM-100 2 87 Gas
FW 25-8 1 8 Gas
Total Ülemiste boiler-house 3 182 107 258
Small boiler-houses 10 30 Gas 30 891
Total Tallinna Küte 23 840 Gas/oil fuel 956 667
In 2007, Tallinna Küte boiler-houses produced 957 GWh (46%) of heat and purchased 1121 GWh (54%) of heat from Iru Power Station (see figure 2
"Tallinna Küte heat supply").

16
Figure 2. Tallinna Küte heat supply
[Titles from left to right: Tallinn Kute boiler-houses, Iru Power Station]
In 2007, Tallinna Küte sold 1727 GWh of heat, of which 1645 GWh went to Tallinn's urban consumers, and 81 GWh were bought by Maardu city's
consumers. Among Tallinn's consumers, 74% of the transmitted heat was sold to residents and 26% to business customers. The use of energy-saving
equipment by consumers has reduced Tallinna Küte sales level by 2-5% in the last few years. The district heating network of Tallinna Küte is about
400 kilometres long.
In 2007, Tallinna Küte boiler-houses used 110 million m3
of natural gas for heat production.
2.2.2. AS Eraküte
AS Eraküte’s heating plant (hereinafter referred to as Eraküte) also belongs to the Dalkia International SA. concern, and its main office is situated in
Tallinn at Punane St. 36, but the majority of its boiler-houses operate outside the territory of Tallinn. Eraküte supplies heat to nine Estonian cities and
villages.

17
Table 4. Eraküte's boiler-houses 2007
Indicators Unit
Evaluations
Total incl. Tallinn the rest of
Estonia
Boiler-houses'
capacity MW 298 41 258
Produced heat MWh 450 794 63 291 387 503
Sold heat MWh 426 764 56898 369866
Fuel for heat generation
Natural gas th. m³ 22 985 7 580 15 405
Wood chips m³ 268 109 268 109
Shale oil Ton 8 019 8 019
Milled peat Ton 4 852 4 852
The biggest Eraküte boiler-houses are located in Tartu, Valga, Jõgeva, Keila, and Haapsalu. Since the main office of the enterprise is in Tallinn, the
Department of Statistics collects data on all Eraküte boiler-houses' output and fuel costs in Tallinn. The present Action Plan is based on data collected
from the Information technology centre of the Ministry of Environment and from enterprises, covering fuel consumption and heat production in Tallinn
only.
In Tallinn 2007, Eraküte owned 25 boiler-houses with a total capacity of 41 MW. Nowadays, the majority of Eraküte’s boiler-houses located in
Tallinn, are under Tallinna Küte’s management. Eraküte’s Tallinn boiler-houses use gas as fuel and supply heat to dwellings and some enterprises. The
production capacity of their boiler-houses is 0,1–5 MW.
2.2.3. Fortum Termest AS
Fortum Termest AS is that of Estonia's heating plants (hereinafter referred to as Fortum Termest) which belongs to the Finnish Fortum OY concern.
Like Eraküte, Fortum Termest's main office is situated in Tallinn, but although the majority of its boiler-houses operate outside the territory of Tallinn
(Pärnu, Põltsamaa, Vändra, and others), similarly the Department of Statistics collects data on Fortum Termest's output and fuel costs in Tallinn. The

18
present Action Plan is based on data collected from the Information technology centre of the Ministry of Environment and from enterprises, covering
fuel consumption and heat production in Tallinn only. (see table 5 "Fortum Termest's boiler-houses 2007").
Table 5. Fortum Termest's boiler-houses 2007
Indicators Unit
Evaluations
Total incl.
Tallinn
the rest of
Estonia
Number of boiler-
houses pcs 67
incl. natural gas pcs
63
light fuel oil pcs
3
boiler-houses'
capacity MW 132
incl. natural gas MW 127
light fuel oil MW 5
Fuel for heat generation
Natural gas th m³ 59103 19293 39810
Wood chips Ton 41109 41109
Shale oil Ton 4272 4272
Light fuel oil Ton 1541 380 1161
Peat Ton 10696 10696
Fortum Termest has 67 boiler-houses in Tallinn supplying heat to dwellings and several manufacturing plants (for instance, Tallinn Dairy plant). The
biggest boiler-house is located in Mahla Street and its production capacity amounts to 12 MW. The boiler-house uses mainly natural gas.

19
In the last few years, the number of Fortum Termest's boiler-houses in Tallinn has increased. Fortum Termest took under its control various enterprises'
boiler-houses and established new boiler-houses to supply heat to enterprises and dwellings, allowing to close old, less energy-efficient and
environmentally unfriendly boiler-houses.
2.2.4. Other heat producers
In addition to the above-mentioned three main heating supply companies, Tallinn is supplied with heat by a number of small-scale companies.
Moreover, many production plants and dwellings have their own boiler-houses. Dekoil OÜ, the company that provides transhipment of oil products,
and Tallinn University of Technology have their own boiler-houses with a production capacity of more than 10 MW; AS Tallinna Vesi boiler-house
and BLRT Group power and heating plants and boiler-houses also work at a total capacity of more than 10 MW.
Heat production in Tallinn is illustrated in the figure 3 "Heat production and purchase in Tallinn 2007." Overall, 3350 GWh of heat were produced in
boiler-houses and by private heating. More than 60% of the heat necessary for Tallinn's heating supply is transferred through Tallinna Küte’s own
heating network. This figure includes both heat produced in Tallinna Küte boiler-houses and that purchased from Iru Power Station.
Figure 3. Heat production and purchase in Tallinn 2007

20
[Title of the diagram: Heat production 2007. From left to right: Fortum Termest's boiler-houses, Eraküte's boiler-houses, Other boiler-houses, Heat
pumps, Private heating, Iru Power Plant, Tallinna Küte's boiler-houses].
Fortum Termest' share of the heating supply comprises 5%, and Eraküte boiler-houses’ share is 2%. Other enterprises and private boiler-houses
produce 7% of the heat. A quarter of the heat needed for Tallinn’s heating supply is produced by private heating: boiler-houses in private dwellings and
stove heating produce 23%, and the share of heat pumps' is 2%.
In 2007, the heating networks' capacity for electricity and heat generation at cogeneration stations were not fully used. Today, the cogeneration method
is used to supply the eastern districts of Tallinn and the City Centre (Tallinn Power Plant). Western Tallinn will use heat produced in central boiler-
houses until 2011, when the construction of a new joint heating main is to be completed.
In Tallinn, the cogeneration system has also been applied to separate small-scale energy producers and consumers. The cogeneration system is used in
Pääsküla, for bio-gas engines in the sewage treatment plant in Paljassaare, in the heating supply of the enterprise BLRT, in Merirahu district, WTC
area, and in Kristiine centre. All these enterprises use gas engines with a capacity of 0,5–2 MWe. Small-scale power and heating plants provide less
than 1% of all Tallinn's heat demand.
Small-scale boiler-houses with a capacity range from several tens of kilowatts to some megawatts have been built to supply heat to production plants,
residential areas, and separate dwellings. The main fuel used by these boiler-houses is natural gas.
Small boilers using natural gas supply heat to either whole buildings or to one flat in some newly built terraced and small houses. Old dwellings also
have their own private boiler-houses, which are based on light fuel oil or, in some cases, on solid fuel (wood, wood chips, coal). Over the last few
years, the use of heat pumps has been increasing: they comprise 2% of the heating supply to new buildings.
Heat consumption by households and enterprises is divided as follows:
household 2325 GWh 70%
enterprises 1025 GWh 30%
total 3350 GWh
The division of heat consumption between households and enterprises is based on several sources (statistical data, Tallinna Küte), but still remains a
rough estimate. Quite often a building may include offices, shops, and residential flats, so the division of heat consumption between different consumer
groups cannot be very accurate.
2.3. Transport and traffic
The major objective of the transport system is to provide all people and enterprises with the ability to reach the places they need. The main function of
public transport is to enable residents to travel by both urban and private transport.

21
Not only is Tallinn is a seaport city with high-density sea traffic, it is also a railway junction, used by the majority of Estonia's railway transports, and
has the airport. Air traffic must be considered Estonia-wide, and the volume of fuel consumed for air traffic is not reflected in Tallinn' fuel balance. All
types of transport together have a considerable influence on the city's energy balance and pollution level.
2.3.1. Motor vehicles
Over the last decades, the number of vehicles on Tallinn's streets has increased several times over. In Tallinn 2001, there were 175 000 vehicles
registered in the Estonian Motor Vehicle Registration Centre. By the end of 2007, the number of vehicles had increased to 251 000, that is, in 7 years
time the numberincreased by 76 000, which is 11 000 or 5-6% of vehicles per year on average. Over the last years, the growth in the number of
vehicles remained steady.
Probable reasons may include the amendment of calculation methods, the disposal of old vehicles, but also and particularly the general economic
situation and the satisfaction of people's needs, that is, nowadays, that each family has a car, and some more than one. Data on the number of vehicles
is shown in the table 6 “Number of motor vehicles in Tallinn.”
Table 6. Number of motor vehicles in Tallinn
1.1.2001 1.1.2002 1.1.2003 1.1.2004 1.1.2005 1.1.2006 1.1.2007 1.1.2008
Motor cars 159 366 134 263 132 874 145 692 156 997 170 133 190712 194136
Buses 1 739 1 747 754 1 760 1 772 1924 2 087 1 952
incl. privately
owned 158 160 147 134 134 63
Trucks 2 322 24 410 25 933 28 102 29 824 31 660 35 605 35 796
Motorcycles 1 230 1319 1 386 1 595 1 886 2 056 2 637 3 329
Trailers 10715 10 694 10 988 11 759 12 645 13 401 15 286 15 833
Total 175 372 172 433 172 935 188 908 203 124 219 174 246 327 251 046
Figure 4 “Number of motor vehicles in Tallinn“ shows the number of motor vehicles in Tallinn.

22
Figure4. Number of motor vehicles in Tallinn
Urban transportation is organised into 56 bus lines, 4 tram lines, and 8 trolley-bus lines, mainly through transport companies owned by the city. During
rush hours on working days, 316 buses, 65 trams, and 98 trolleys operate on these lines, or 479 public vehicles in total[8]
.
In May 2007, Tallinna Autobussikoondis (Tallinn Bus Company Ltd.) owned 213 Scania and 128 Volvo buses, of which 142 were articulated buses,
20 bus-trailers, and 179 ordinary buses.[9]
2.3.2. Railway transport
The total length of railway lines in Estonia is 1026 km, of which 968 km are currently in public use. The public railway network's density is 21,4
km / 1000 km2. So, among the European Union member states, Estonia is in that group of countries with the smallest railroad network density. The
railroad lines are electrified in Tallinn's neighbourhood only. The share of the electrified network comprises only 13,6% of the whole railway network.

23
Railway lines with 66 railway stations[10]
run and diverge from Tallinn's railway junction on three main rail routes. These railway routes are Tallinn-
Narva, Tallinn–Paldiski and Tallinn–Viljandi/Pärnu. There are three types of trains in Tallinn: electric and diesel-powered passenger trains and diesel
locomotive freight trains. According to the data of the Department of Statistics, in 2007 the number of trains running in Tallinn-Tapa direction
amounted to 23 886, of which 12 267 were freight trains and 11 619 were passenger trains. 26 940 trains ran in the Tallinna–Paldiski direction, of
which 1911 were freight trains and 25 029 were passenger trains.
2.3.3. Sea traffic
Tallinn Old City Harbour belongs to AS Tallinna Sadam (Port of Tallinn). Tallink, Eckerö Line and Viking Line boats and ferries depart from the Old
City Harbour for Helsinki, as well as the Tallink vessels which operate on the Tallinn-Stockholm route. The development plans of the Port of Tallinn
envisage the Old City Harbour being converted fully into a passenger port so cargo handling has been gradually moved out from the Old City Harbour
and relocated to the Muuga and Paldiski South harbours. TheOld City Harbour covers 52,9 ha, there are 23 berths with a total length of 4,2 km and 4
passenger terminals.
2.3.4. Fuel consumed in the transport sector
Transport fuel is considered to be all the different kinds of fuel used for vehicle engines. The review of fuels used in the transport sector is provided in
the table 7 "Fuel consumption in transport sector in Tallinn 2007." In 2007, the total consumption of motor fuel amounted to 301,9 thousand tons, the
majority of which comprised diesel fuel and (auto)petrol (see figure 5 "Fuel and purchased heat consumption in Tallinn 2007"), liquid gas was less in
use. The Department of Statistics also provides data on light fuel oil consumption in railroad and sea transport.
Table 7. Fuel consumption in transport sector in Tallinn 2007
Fuel
Consumption
(thousand
tons)
Calorific value
of fuel
(MWh/h)
Consumption
(GWh) %
Diesel fuel oil 155,6 11,8 1836 50,8
incl. urban transport 8,6 11,8 101 2,8
Petrol 125,8 12,2 1535 42,5
Light fuel oil 20,5 11,8 242 6,7
Liquid gas 0,03 12,7 0 0,0
Total 301,9 3613 100,0

24
Source: the Department of Statistics; Information technology centre of the Ministry of Environment; Estonian Greenhouse Gas Emissions Inventory
Report, 2009.
The share of the road transport sector, or city traffic, in fuel consumption is considerable; it comprises 92% of total fuel consumption in energy units.
In Tallinn's city traffic 2007, the amount of petrol consumption was 125 800 tons, and diesel fuel oil consumption was 151 700 tons.
Figure 5. Fuel consumption in Tallinn's transport sector
[From left to right: Petrol, Light Fuel oil, Liquid gas, Diesel fuel oil]
Accurate petrol consumption figures are based on the sales figures of petrol stations located in Tallinn; however it is impossible to obtain the same
accurate data for the sales of diesel fuel oil. That is why diesel fuel oil consumption has been estimated on the basis of data from the Department of
Statistics and Tallinn's Greenhouse Gas Emissions Inventory Report 2007. Diesel fuel oil consumption can be over-estimated to some degree, as the
data from the Department of Statistics on fuel consumption are based on the companies' place of registration. According to data from Tallinn City

25
Government, the amount of diesel fuel oil consumed by public bus services was 8630 t. The share of these fuel costs in the whole amount of fuel
consumed in the city's traffic (in energy measurement units) is 2,8% only.
Motor fuel apart, urban transport (trams, trolleys, and electric trains) also uses electric power. Tram and trolley traffic offers services within the
territory of Tallinn. According to data from AS Tallinna Trammi- ja Trollibussikoondis (Tallinn Tram and Trolley Bus Company Ltd.), in 2007, the
amount of electric power consumed on the lines was 25,5 GWh. Electric train traffic mainly operates within the territories of Tallinn and Harju County.
There are no data on the use of electricity of rolling stock within the territory of Tallinn. The share of urban transport's electricity consumption in total
fuel and energy consumption is small (1%).
The share of the known fuel and electricity costs of urban transport in the total transport sector's energy consumption (in energy measurement units) is
3,5% only.
2.4. Street lighting
Street lighting requirements are prescribed by Tallinn City Government's decree nr 26 of March 24, 2004 "Street lighting standards of the city of
Tallinn."[11]
Tallinn's street lighting situation is analysed by resolution nr 330 "Guidelines for the city of Tallinn’s outdoor lighting for the period from
2006 to 2015"[12]
adopted by Tallinn City Council of November 16, 2006. This resolution provides a review of Tallinn's outdoor lighting situation and
prescribes clear guidelines for its improvement in the coming years.
The streets of Tallinn started to be lit regularly since 1787, at first with gas lighting. A transition to electric lighting began in 1913, when the Tallinn
Electrical Central Station was put into operation. Over the course of years inefficient incandescent lamps used for street lighting were replaced with
energy saving sodium lamps.
Tallinn's street electrical network as of January 1, 2007.
Total outdoor sources of light 45 660
incl. street lighting 39 000
Total production capacity of outdoor sources of light 8500 kW
incl. street lighting 7500 kW
Energy demand of outdoor sources of light 34 000 MWh
incl. street lighting 30 000 MWh
Total length of illuminated streets and roads 1728 km
Total length of street lighting network cable lines 1496 km
26
incl. aerial lines with noninsulated wire 206 km
aerial cable lines 582 km
underground cables 708 km
The number of switching-distribution boards 516
The rapid development of energy-saving street lighting began in 1994, when the municipality installed high-pressure sodium lamps instead of old
mercury lamps. Prior to 1997, the increase in new sources of lighting was negligible. Beginning from 2001, 2000-3000 lamps were added annually. In
2009, the number of sources of lighting reached 51 000.
Upon the implementation of energy-saving sources of light, the electricity demand for street lighting has risen to a small extent. The majority of the old
sources of light were replaced with new ones in 2001, and there has been a remarkable improvement in the safety of sources of light, as well as in
lighting and technical performance.
The condition of street lighting is generally satisfactory, as, beginning from 1999, the municipality began to implement the recommendations of the
International Electro-technical Commission, and they are valid in the current EVS-EN 13201 standard. Problems occur in those areas of road lighting
where the lamps are located on the same lamp post as Eesti Energia Jaotusvõrk OÜ’s (Distribution Network) electric lines: lamp posts are located too
far away from each other and the lamps are hidden by high trees and bushes.
There are also problems related to a bad level of current aerial line insulation at the contact lines of electric transport. Contact lines are required to be
double insulated in order to avoid stray current crossover in the lighting network of the transport lines. Stray currents may cause the overall burnout of
lamps in some areas.
Over the last years, for the improvement of road safety, much attention has been paid to the installation of lighting at those pedestrian crossings that are
not regulated by traffic lights. In the period from 2005 to 2010, in Tallinn, 216 pedestrian crossings were fitted with 434 lights in total, which accounts
for more than half of the city's pedestrian crossings not regulated by traffic lights. These works are going to be carried on with in the following years.
The sources of light commonly used in the street lighting, are the following:
low pressure sodium lamps – energy-efficient, however, they are not completely suitable for road lighting in the city because they send out
monochrome yellow light, which militates against colour discrimination; the colour rendering index is 0, and these lamps are not used in
Tallinn;
high pressure sodium lamps – energy-efficient, average lifetime is four years, these lamps are commonly used for road lighting, colour rendering
index is 20, colour temperature is 2000 Kelvin degrees (with a yellow light);

27
high pressure mercury lamps – their light output is more than half that of high pressure sodium lamps, the average lifetime of mercury lamps is
three years, colour rendering index is 40-60, colour temperature is 4000 Kelvin degrees (with a cold white light);
metal halide lamps – their light output is 15% less than that of high pressure sodium lamps, the lifetime is three years, they have excellent colour
rendering index (80-90), colour temperature depending on the type of lamp varies from 2800 (warm white light) to 4500 Kelvin degrees (cold
white light). The price of metal halide lamps is much higher in comparison with the above-mentioned lamps, and the capacity of 2800 Kelvin
degrees lamps is relatively low.
High pressure sodium lamps are mostly used in Tallinn's street lighting. These sources of light in comparison with other alternatives are energy-
efficient, have a longer lifetime, sufficient light quality, and relatively low price.
2.5. Water industry
Tallinn's water supply enterprises are divided into ten areas. Tallinn's biggest water supply enterprise is AS Tallinna Vesi (Tallinn Water Ltd.,
hereinafter referred to as Tallinna Vesi) Moreover, Tallinn has three small-scale area water supply enterprises. Small-scale water supply enterprises
take wastewater to Tallinna Vesi’s disposal line. Tallinna Vesi also renders services to a number of Tallinn's neighbouring areas, such as Saku,
Maardu, and Viimsi. All data on Tallinna Vesi’s business activity and development programmes are presented in the annual reports. The present
Action Plan is based on this data for the year 2007.
Tallinna Vesi has two water treatment centres, Ülemiste water treatment plant and Paljassaare Sewage treatment plant. In addition there are a number
of groundwater wells and pumping stations supplying the city with water. Groundwater wells are mainly situated in the Nõmme and Pirita districts.
The main objective of the water industry is to provide qualitative preparation of water and wastewater treatment. Tallinna Vesi’s main activity is water
and wastewater treatment, the maintenance of networks, and the effective management of pumping stations. These activities require the use of the
biggest amount of energy in the water industry. Most of the energy goes on water and wastewater treatment, as well as on the maintenance of the
networks' pumps.
Total consumption of electric power has remained steady over a number of years. The electricity costs of the Ülemiste water treatment plant have
decreased, while the electricity costs of Paljassaare Sewage treatment plant have increased. Improved wastewater treatment technology has led to some
increase in energy consumption.
Consumed electric power (2007)
Water treatment plant 10 389 MWh
Sewage treatment plant 19 443 MWh
Networks' pumps 5589 MWh

28
Other equipment 995 MWh
Total 36 416 MWh
Most energy is spent on the production of ozone. Ozone water treatment is very efficient in the destruction and cleansing of the organic matters that are
contained in water. This equipment has to operate day and night in order to satisfy the necessary needs of consumers'.
The brand new purification technology which has increased energy demand for wastewater treatment has started to reduce and stabilise electricity
consumption per purified wastewater measurement unit. This demonstrates that the whole process contributes to the total improvement in the energy
conservation level.
Purified wastewater electricity consumption per thousand m3 0,42 kWh/m
3
Electricity consumption in water treatment plants' water production per
thousand m3
0,45 kWh/m3
Paljassaare sewage treatment plant's sludge-digestion chambers extracts biogas. Overall 2,5 mln m3
of biogas were produced in 2007. Biogas is used in
gas engines used start up the turbine to supply the aerotank with air and the boiler with fuel. The remaining biogas is burnt in so-called candles (the use
of biogas is illustrated in the figure 6 "The use of biogas in Tallinna Vesi sewage treatment plants"). Biogas that had been burnt in gas engine is
deemed to be electric power. In 2007, 1159 MWh of electricity were produced from biogas, which amounts to 6% of electricity consumption in the
sewage treatment plant and 3% of the electricity consumed by Tallinna Vesi in total.
At the same time, 19% of biogas has been burnt in the candles, so 452 thousand m3
of biogas remained unused. Supposing that the average calorific
value of biogas is 6 MWh / 1000 m3, then 2,7 million kWh of energy has remained unused. This amount could be used to produce the same quantity of
electricity as one gas engine. In November 2009 the gas engine was put under maintenance for at least two months, and the remaining biogas from the
boiler was burnt in the candle. In order to increase the efficiency of the use of biogas for electricity and heat production, a second gas engine must be
installed at the sewage treatment plant.

29
Figure 6. The use of biogas in Tallinna Vesi’s sewage treatment plants
[From left to right: in gas engines, in boilers, burnt]
Other energy costs also include transport. There are 140 vehicles used by employees as well as station wagons and private vehicles, that is why it is
quite difficult to find opportunities to reduce fuel consumption to any great extent. Attempts are being made to control car drivers' fuel consumption by
setting certain limits, however, increasing water consumption has caused the extension of the area serviced, so the extent of the maintenance works has
also risen, causing an in the need of moving from one place to another.
Consumed fuel (2007)
Petrol 135 251 litres
Diesel fuel oil 210 827 litres

30
Energy could also be saved by the elimination of any spillages. In 2007 the level of spillages had already fallen up to 19%; the target to be achieved is
up to 17-18%. The time spent on the elimination of spillages has also decreased: in 2006, it amounted to 2,2 days, in 2007 it amounted to 1,8 days.
2.6. Waste management
Waste management norms and standards are prescribed by four acts: the Waste Act[13]
, the Packaging Act[14]
, the Environmental Supervision[15]
Act,
and the Environment Charges[16]
Act.
Tallinn's waste management regulation stipulates the obligations of holders of waste and waste management officers in order to protect the
environment on the city's waste management territory. The regulation also prescribes that waste management shall be organised and supervised by
Tallinn's Ministry of Environment and by Tallinn's district governments. Thus, Tallinn's Ministry of Environment and Tallinn's district governments
play a significant role in the process of waste management in Tallinn, since their duties are the following: regulation of waste management
development in their respective territories, development of systems for collection and sorting of waste materials, support of development programmes
for waste energy consumption, waste stream management, and others.
Organised waste transportation is an important factor from the point of view of waste management.
The Waste Management officer is the primary link in the chain of statistical data collection on waste management; this officer submits waste
management reports to the Harju County Environmental Service of the Ministry of Environment. These reports are transferred to the Information
technology centre of the Ministry of Environment, which analyses the received data and makes the appropriate waste statistics. These reports reflect
data on all enterprises having a waste licence and on those that accumulate a considerable volume of waste.
Landfill[17]
for Tallinn was established on the 2nd
of June 2003 in the old Maardu quarries of Jõelähtme Parish, which fulfil all the environmental
requirements of the European Union. The landfill has three drainage areas (total area is 5,1 ha) and waste collection area (total area of the landfill is 67
ha). Nowadays, it is the largest landfill in Estonia, managing more than one third of the household waste in the country. Tallinn landfill's main areas of
activity include waste management and storage, composting of bio-decomposed waste, sorting, and alternative energy production.
Reusable waste materials are sorted into different classes, mainly metal and wood waste materials. At the beginning of 2008, Tallinna Prügila AS
(Tallinn Landfill Ltd) built the infrastructure along with a composting station and waste collection area on the territory of the landfill, which comprised
8,35 ha in total. In 2010, a waste sorting line and waste fuel production line were installed on the territory of the landfill, intended to take in 40,000
tons of waste per year.
Tallinn's landfill will manage the waste of Tallinn and its surroundings (which comprises up to 500 000 residents) for the next 40 years, by the end of
which the project will come to an end. The following 20 years will be used for the closing of the landfill, collection of the gas from the landfill, and
monitoring.
In Tallinn 2007, a total of 243 635 tons of waste was stored in the landfill, of which 206 146 were stored in Tallinn's landfill, 36 001 tons were
transferred to OÜ Slops construction waste landfill, and 1488 tons of waste were stored in Oru landfill. The total amount of stored mixed household
waste amounted to 192 600 tons, and the total amount of construction waste was 50 900 tons. Reusable packaging waste in Tallinn totalled 19 800
tons.

31
It is not reasonable to store bio-decomposed waste in the landfill, since it can be processed either by aerobic (composting) or anaerobic (methane
fermentation) waste treatment. Composting of separately collected bio-decomposed waste generates a good quality compost which can be successfully
used in the gardening and agriculture fields. Mixed waste stabilisation produces material which is quite suitable for landscaping and landfill covering.
In Tallinn's landfill, aerobic composting is being operated along with the membrane composting system. Compost piles are covered with a membrane
which insulates the piles from environmental influences (reduces the ingress of rainwater into the compost materials, the impact of temperature, as well
as eliminating bad smells, and prevents birds from spreading the composted waste). Control over the composting regime is automatically operated.
Compost piles undergo an aeration procedure which accelerates the whole composting process.
Anaerobic digestion is an alternative biological treatment of organic waste. The gas which is produced through biological digestion can be collected.
The solid product is similar to the composting material, but, depending on the type of raw material, the ultimate product may require secondary
treatment before being ready for use.
Paljassaare Sewage treatment plant's sludge-digestion chambers release biogas. Overall 2.5 millon m3
of biogas were produced in 2007. Biogas is used
in the gas engines which start up the turbine to supply the aerotank with air and the boiler with fuel.
A small proportion of mixed household waste, separated from the waste type that can be further recycled, suits anaerobic digestion perfectly. Besides,
sludge that remains from wastewater purification, - either separately or together with the above waste materials, - can be put through anaerobic
digestion to produce methane, which can then be used in energy generation. In Tallinn, anaerobic processing of wastewater sludge is used in the
wastewater purification procedure.
The profitability of waste anaerobic treatment depends on the opportunities to use the energy that remains after the whole treatment. If there is no
demand for biogas, the efficiency of anaerobic way of waste treatment cannot be justified since this procedure requires a lot of investment.
The Pääsküla landfill was closed in 2003. Nowadays, waste treatment plant has been opened next to the old landfill, sorting and storing various waste
materials. Biogas is being collected from the closed landfill, the production of which began in 1993. In the beginning, biogas had been used as a boiler
fuel only, but since 2001 it has also been used in gas engines for electricity generation. Nowadays, biogas is used in two gas engines at the Pääsküla
closed landfill, and the remaining gas, if any, goes to the boiler house. Over recent years the volume of biogas has decreased. In 2007, the landfill's gas
engines produced 12,4GWh of electricity and 9,6 GWh of heat from biogas.
Tallinn's Paljassaare Sewage treatment plant uses anaerobic sludge digestion, and the secondary treatment of materials is made in the compost area. In
the compost area, soil is generated from wastewater sludge, which is then used in the city's landscaping and sold to private consumers.
In order to fulfil commitments to the European Union in regard to waste treatment procedures and to develop environmentally friendly and optimised
waste treatment systems, which would be applicable over the whole territory of Estonia, the state has worked out projects for the period from 2008 to
2013 that prescribe waste treatment scenarios.

32
2.6.1. The composition of household waste
The state's waste treatment programme provides for the evaluation the composition of household wastes', based on data from the packaging and waste
registry as well as the evaluations of waste management officers. The average chemical composition of household waste in Estonia is shown in table 8
"Chemical composition of household waste and heating value"
Table 8. Chemical composition of household waste and heating value
Composition of waste fuel substance Mass percent
- Carbon (C) 26,4
- Hydrogen (H) 3,7
- Sulphur (S) 0,20
- Chlorine (Cl) 0,3
- Ash content (At) 21,1
- Water content (Wt) 30
The lowest heating value of waste
fuel:
- waste fuel consumption substance
(Qta),
10,5 MJ/kg
- waste fuel dry substance (Qk
a), 16,1 MJ/kg

33
The minimum and maximum variation of chemical substances' contents in wastes is relatively high. The heating value of wastes depends on the
composition and water content of wastes that are supposed to be used as fuel. The lowest heating value of household wastes is usually 8–12 MJ/kg,
depending on the content of combustible materials (mainly these are carbon and hydrogen).
According to the estimates of the Estonian Institute for Sustainable Development, the percentage of bio-decomposible waste in all household wastes is
65%, and the total of combustible wastes along with bio-decomposible waste in all household wastes is 80%. The development of waste recycling
makes it possible to change the composition of waste together with the heating value of those wastes that are intended for incineration.
The average composition of mixed household waste in Estonia is illustrated in the figure 1 "Fuel and purchased heat consumption in Tallinn 2007."

34
Figure 7. The average composition of mixed household waste in Estonia
[Titles inside the diagram from left to right: kitchen waste; garden waste; plastics; glass; paper and cardboard, paper wrapper, newspapers, and others.
Titles outside the diagram from left to right: hazardous wastes, electronic waste, other combustible waste (mixed), other inert (non-combustible)
wastes, steel and metal waste, bio-decomposed wastes (mixed)].
Nowadays most waste is stored in landfill. It makes sense to sort waste in advance, to compost bio-decomposible waste, to incinerate organic waste,
and to store only non-combustible waste.
2.7. House building

35
As of January 1, 2007, Tallinn's housing stock amounted to 10 285 000 m², of which approximately 2/3 comprised apartment dwellings and 1/3
belonged to small dwellings. The average age of big apartment blocks with load-bearing wall construction is 25-30 years, the average age of small
dwellings is more than 50 years. The average age of other apartment houses varies a lot: the age of wooden houses in old residential areas is up to 100
years.
The average lifetime of a dwelling is deemed to be 50-70 years, so a noteworthy share of our housing stock has reached this lifetime peak or is about to
reach it. The construction and technical systems of those dwellings that have already reached their lifetime peak are considered to be outdated both
physically and morally, so in addition to continuous maintenance work, these buildings require substantial reconstruction. The period of
industrialisation of the construction industry began in 1950-1960, and was followed by mass production and the use of concrete steel structures. The
quantity of buildings was considered more important than the quality of construction, and energy prices were low.
Those apartment dwellings and technical systems equipped with central control panels which had been constructed according to the City Council's
standards, and from the materials current at that time, spend an incredible amount of energy from the point of view of modern concepts. With reference
to the energy audit and marking which have been carried out in Tallinn's apartment dwellings, it can be stated that the range of the average energy costs
is 250–300 kWh/m² per year, which exceeds the average performance of the developed industrial countries with the same climatic conditions by a
third.
Reinforced concrete slabs comprise a remarkable share of Tallinn's building wall construction. These slabs have good heat insulation, which is,
however, insufficient and not evenly distributed. Besides, cold bridges may occur due to gaps in the thermal insulation barrier. According to the
estimates of scientists from Tallinn University of Technology, the thermal conductivity of reinforced concrete slabs is 0,5–0,6 W/m2K
[18]. If we add
heat losses as a result of cold bridges, then the thermal conductivity of walls in apartment houses with bearing-wall construction will amount to 1,0–1,2
W/m2K. The thermal resistance of new reinforced concrete slabs is not satisfactory either,- 0,3–0,4 W/m
2K. According to Estonian construction norms,
the thermal conductivity of a new building's walls can be a maximum of 0,25 W/m2K.
The energy demand for heating in buildings with reinforced concrete slabs is therefore high. These buildings require heat insulation to be 100-200 mm
thick, so the percentage of fully renovated and heat-insulated dwellings in Tallinn is quite small.
The common drawbacks of apartment blocks with reinforced concrete slabs are the following:
low thermal resistance and insufficient wind-loading rating of outside constructions (walls, doors, windows, roof, attic ceiling, roof-ceiling,
cellar walls, and ceiling);
cold bridges (a cold bridge occurs in the inner structure of buildings, when materials with high thermal conductivity (concrete or steel) create
pathways for heat loss that bypass the thermal insulation of adjacent materials either partly or fully);
some building still have heat supply stations equipped with poor automatic controls: in most cases there is no automatic control system of the
temperature of water heating; the hydraulic circuit of a heat supply station usually causes overheating in spring or autumn, when outside air

36
temperature is relatively high (in this case it is impossible to reduce the level of the heating water temperature in boiler houses, otherwise there
will be no guarantee that the household water reaches the necessary temperature);
poor automatisation of heating systems - generally, there is no regulation system, eg. in a heated room;
the heating system is mainly built as joint piping system, which means series connection of radiators to individual heating risers. This system is
poorly regulated: in most cases residents had rebuilt their heating system without permission (increased the radiators’ effective area), which
exacerbated existing problems with the regulation system;
often, heating systems cannot be balanced, which basically means that some apartments or areas are overheated, while the others get
insufficient amounts of heat. Both overheated and under-heated conditions often occur in different parts of the heating riser - apartments that
are located far from the building's heat supply station may get an insufficient amount of heat in comparison with those apartments that are
overheated due to their close proximity to the heat supply station (distribution pipes);
it is impossible to isolate heating from ventilation air with the use of current air circulation systems (in a kitchen or a bathroom) using either
natural or artificial ventilation.
Residents of these dwellings consume too much energy and accordingly pay a lot of money. If the price of energy systems keeps growing, then certain
measures have to be taken to change the energy demand of dwellings, their technical condition, and the living environment of residents, such as the
inside environment of buildings, which will contribute to extending the lifetime of buildings and to a significant improvement in their external
appearance.
So special attention must be paid to the preservation of existing buildings: energy-saving renovation measures, extension of the lifetime period, and
measures to increase the value buildings.
2.8. Elements of urban design
Elements of urban design include memorials, monuments, the Old town, parks, and promenades; energy demand is closely related to their lighting. It is
difficult to differentiate between street lighting and the lighting of elements of urban design, which anyway are supplied with electricity by one and the
same power unit and, in any case they supplement each other.
Over the last years, considerable development has indeed taken place in the field of lighting of elements of urban design. While in Tallinn 1997, there
were 28 400 in total of outside sources of light, of which 1400 were supposed to illuminate the elements of urban design, in 2007, their total amount
reached 45 600, of which 7000 illuminated the elements of urban design. At the same time, while the total number of outside sources of light has
increased 1.6 times, the number illuminating elements of urban design has increased fivefold.

37
The gross power of sources of light that illuminate elements of urban design can be estimated at 1,0 MW, and 4 Gwh of electricity is spent on this
lighting annually.
2.8.1. Park lighting
The most remarkable development has been observed in the field of park lighting in this century. If 10 years ago parks were poorly illuminated, then,
nowadays, Tallinn's parks are being illuminated at night hours more. Today, there are a lot of alternatives for park lighting. A number of solutions is
used to create a visual effect and achieve an appropriate level of lighting. Local architecture and the creation of plant growth conditions must be taken
into consideration. The main lighting alternatives include full illumination, contour illumination, lunar illumination, light reflection, and shadowing.
High pressure mercury lamps are commonly used in park lighting; these consume quite a lot of energy, however they provide pleasant light and good
colour discrimination. The high pressure sodium lamps which are common in street lighting are not suitable for park lighting due to their poor colour
discrimination, especially, of green.
2.8.2. Lighting of the Old town
The Old town is one of the most treasured districts in Tallinn, that is why the city's major task is to provide it with excellent lighting. The cable
network in the Old town is degraded in some areas and lots of lights are technically ineffective.
The Old town is illuminated mainly by 250W high pressure sodium lamps which have no reflectors and are therefore quite inefficient. According to
estimates, the overall illumination of the Old town is generally good since the quantity of illumination is relatively high and there are no poorly lit
streets.
There are problems with the lighting solutions of some buildings' front elevations, however most of these buildings are privately owned. Somewhere
buildings are either over- or under-illuminated, while in other places unsuitable lights are in abundance. It is necessary to co-ordinate ambient sources
of light with those of buildings' front elevations by each street in the Old town, and to continue the development of the existing illumination solutions.
2.8.3. Monuments and memorials
All important Tallinn memorials and monuments are separately illuminated in addition to the lighting coming from street lights, so it is impossible to
make calculations for the electricity demand of memorial lighting only. Memorials are separately illuminated by both lamp-post lights and by
floodlighting. The illumination is designed to emphasise the value of memorials.

38
2.8.4. Promenades and easy way roads
Promenades and pathways, as well as their lighting, have gone through rapid development over the last decade. Here, it is also difficult to differentiate
the lighting of streets and pathways. For example, pathways in the Nõmme and Haabersti districts have been built in a manner that does not require
separate illumination as they are perfectly lighted by the normal street lighting. Pathways in the Pirita district are tens of metres away from the roadway
and equipped with separate lights.
Promenades require special treatment. Nõmme[19]
and Pirita[20]
exercise- and skiing roads are the longest and the most advanced in the city. Nõmme
promenade along with the part of the Harku forest on the Harju County territory is 15 km long, and the electric power of its illumination is 50kW.
Tallinn supplies the whole pathway with the necessary amount of electricity and, therefore it has to be treated as Tallinn's facility.
The second longest exercise- and skiing road is the 7,2 km long Pirita district road. The energy demand of this pathway is not that great since its
lighting power is 20 kW. Basically, the pathway is equipped with 70W high pressure sodium lights that are located 20-30 metres from each other. The
pathway's lights operate in the evening hours from sunset until 11p.m. and in the morning hours from 6 a.m. until sunrise.
2.9. Use of land
The area of Tallinn is 159 km2
and is divided into eight administrative districts: Haabersti, Kesklinn, Kristiine, Lasnamäe, Mustamäe, Nõmme, Pirita,
and Põhja-Tallinn. The population density of Tallinn is 2510 residents per square kilometre, which is approximately 81 times as much as the average
population density in Estonia.
The residential area has the biggest share of the whole territory of Tallinn (27.8%), which is followed by the public area (20.2%). The proportion of the
transport area (13.3%) and industrial area (11.7%) is almost equal. Other areas occupy less than 10% of the whole territory.
Table 9 "The territory of Tallinn, the city's districts and the population" show the data on Tallinn's districts and population as of January 1, 2008. The
territory of Tallinn also includes Aegna island, Ülemiste lake, and Harku lake; the first two of these belong to the City Centre's territory, while the last
one is included in Haabersti district. This fact significantly distorts the comparison of the city's districts.

39
Table 9. The territory of Tallinn, the city's districts and the population
The city's
district
Population Area Population
density
(res/km2)
Number
of
residents
% km2 %
Haabersti 39 587 9,9 22,2 13,9 1786
Kesklinn 47 671 11,9 30,6 19,2 1557
Kristiine 29 478 7,3 7,9 4,9 3746
Lasnamäe 112 001 27,9 27,4 17,2 4086
Mustamäe 64 243 16,0 8,2 5,1 7883
Nõmme 38 725 9,6 29,2 18,3 1328
Pirita 14 039 3,5 18,7 11,7 751
Põhja-Tallinn 55 628 13,9 15,2 9,5 3669
Tallinn in total 401 372 100,0 159,2 100,0 2521
A rRelatively dense population is observed in Tallinn's largest residential areas, such as Mustamäe, Lasnamäe, and Kristiine, with a prevalent number
of multi-storey apartment houses of bearing-wall construction enabling the use of district heat supply systems. Besides, in the areas with dense
population, heat losses comprise an insignificant share of the whole.
The District Heating Act stipulates a clear specification of Tallinn's areas with district heat supply systems. Besides, areas with district heat supply
systems[21]
have been specified in accordance with the recommendations of scientists from Tallinn University of Technology, stating that it is
reasonable to install district heat supply in the areas with dense population. The projection of heat supply systems in the new residential areas has to be
based on the assumption that the consumers' load must be at least 2 kW/m of pipeline per one metre and the installed load must be at least 40 kW in
each supplementary heating network.
Tallinn's Nõmme and Pirita residential areas, where mainly private houses and small apartment houses are surrounded by green fields, have a lesser
population density. Dwellings in these districts are mostly heated individually. However dwellings with a higher population density are heated by local

40
heating, local boiler houses, and heating networks. These methods are common for those areas where natural gas can be used. Heat pumps and solar
heating panels have become widely used in private houses.
2.9.1. Green field areas
The green field area comprises 27.3% of the whole territory of Tallinn[22]
. The biggest share of this green field area is in Mustamäe district (43.7%), the
smallest share belongs to Kristiine district (9.0%). The share of green field area in such districts as Lasnamäe (12.7%), Haabersti (22.6%), and Põhja-
Tallinn (12.4%) is also below the city's average level.
Tallinn's forests cover 24.9 km2
of the territory and comprise 57.6% of the whole city's green field area. Timber stands comprise approximately the
same share as the whole biomass on the city's territory. The biggest timber stands are on Aegna island, in Nõmme district, in the neighbourhood of
Ülemiste lake, Pirita district (Kloostrimets (Monastery) forest), Pirita river valley, and in Haabersti district (Stroomi forest, Rocca al Mare).
Greenfield areas are actively used to create leisure areas for Tallinn's residents. Thus, for instance, a 15km long illuminated promenade has been built
on Mustamäe slope and in Harku park forest; the 8km long pathway in Pirita district must also be mentioned in this respect. In winter, there are
organised illuminated skiing pathways with artificial snow.
2.9.2. Use of transport area[23]
The total area of Tallinn's roads is 10 500 000 m2 and their length 956 km. The total area of the pedestrian paths is 2 278 000 m
2 and their length 852
km. In Tallinn, there are 892 roads and streets in total. In the course of the last decade, new roads have been built due to the construction of new
dwellings and the development of new projects, for instance, the widening of passages or highways. The total area used for car parking has
significantly increased, being related to the development of shopping centres or other recreational areas.
As of April 1, 2007, there were 8400 fee-paying parking spaces inside the designed parking areas and 5600 fee-paying parking spaces outside parking
areas. Car parking has significantly changed the use of space, eg. backyards and gardens in a number of houses have been fully or partly changed into
parking spaces, resulting in the reduction of open spaces and the quality of green field areas.
Some parts of the city, especially the territory of the City Centre and Põhja-Tallinn district, are occupied by harbours, railways, their storage areas, and
other transport facilities.

41
2.9.3. Absorption of CO2 emissions in Tallinn[24]
Green field areas comprises 27% of the whole territory of Tallinn, of which 24.9 km2
are covered with forests, comprising 57.6% of the whole city's
green field area. The estimation of pollution levels has been based on the assumption that the age of 40% of Tallinn's trees is less than 20 years and the
remaining are older, so trees of less than 20 years age cover an area of 996ha.
In 2007, absorption of CO2 emissions comprised 895.4 tons. Considering that the green field area covers a small part of the city' whole territory, the
absorption capacity is correspondingly low. The method of CO2 absorption and calculation steps are shown in the report "Tallinn's CO2 Gas Emissions
Inventory."
2.10. Consumption habits
Consumption habits play a significant role in the efficient use of energy. It is essential to keep the consumption of energy, heating, and electricity under
control. 20 years ago, only a few dwellings were equipped with heat flow meters, whereas nowadays they are common for the majority of heating
network consumers. Thermal expenses for dwellings' heating have decreased noticeably due to the implementation of measurement systems and
modern automatically regulated heat supply systems. The next stage consists of supplying apartment radiators with self-regulating thermostatic valves
and individual measurement devices. If energy consumption is controlled and self-regulated, the consumer gets into the habit of being involved in the
regulation of his or her energy consumption.
As for electric devices, it is also important to avoid unnecessary expenses by selecting more energy-saving devices and using them in a sensible
manner, meaning also that it is inefficient to leave electric devices in standby mode. Table 10 "Power consumption of home electrical devices" shows
measurement data on the power consumption of domestic electrical devices both in work and standby modes.
Measurements have been made in the average apartment of average consumption habits provided that all devices are indeed turned off when not in use,
however not fully, but left in standby mode in order to get quick operation when needed.
As can be seen from the table, domestic electrical devices consume only 55% of energy in operating mode and 45% in standby mode. Supposing that
the total power consumption in an apartment amounts to 300–400 kWh per month, it is possible to save 10-15% of the electricity just by changing
consumption habits.
Table 10. Power consumption of home electrical devices
Mode
Capacity
(W)
Average
(W)
Per 24 hours
(kWh)
Per one
month
Per one
year
Hours of operation

42
(kWh) (kWh)
1
Desktop computer operating mode 80–120 100 0,40 12 144
4 hours per twenty-
four hours
standby mode 13 13 0,26 7,8 93,6
Desktop computer's
monitor operating mode 36 36 0,14 4,32 51,8
4 hours per twenty-
four hours
standby mode 6 6 0,12 3,6 43,2
2
Laptop operating mode 20–36 28 0,22 4,70 56,45
8 hours per twenty-
four hours
standby mode 4–6 5 0,08 2,41 28,94 21 day per one week
3
LCD-television
Sharp
operating mode 76 76 0,30 10,64 127,68
4 hours per twenty-
four hours
standby mode 9 9 0,18 5,4 64,8
4
Digi-box Zuum operating mode 25 25 0,10 3 36
4 hours per twenty-
four hours
standby mode 18 18 0,36 10,8 129,6
5
Picture-tube
television
Sony
operating mode 100 100 0,40 12 144
4 hours per twenty-
four hours
standby mode 0 0 0 0 0
6
Music centre operating mode 25 25 0,2 6 72
8 hours per twenty-
four hours
standby mode 6 6 0,10 2,88 34,56
7
Tape recorder
Philips
operating mode 18–24 21 0,04 1,26 15,12
2 hours per twenty-
four hours
standby mode 6 6 0,13 3,96 47,52
8
Microwave oven operating mode 1200 1200 0,192 5,76 69,12
10 minutes per twenty-
four hours
standby mode 6 6 0,14 4,29 51,49
Total operating mode 1,8 55,0 659,8

43
standby mode 1,4 41,1 493,7
All in total 3,2 96,1 1153,5
An experiment carried out by Estonian Television some time ago proved that it is quite feasible for households to save electric power through changing
consumption habits and taking electricity consumption under control. The broadcaster asked the television audience to turn off all unnecessary, at that
point in time, electrical devices and switch off all needless lights, upon which electricity consumption in Estonia fell by 10-15%. Control over one's
own electricity consumption allows the saving of energy and the reduction of electric power bills.
3 The activity concept, strategic options, and necessary measures
3.1 Energy production and use
3.1.1. Power-generating fuel consumption
Table 11 “Consumption of power-generating fuels and purchased heat in Tallinn 2020” shows the probable scenario in regard to the consumption of
power-generating fuels and purchased heat in Tallinn 2020. Fuel costs and energy consumption in various branches of the economy are shown in
greater detail in the following chapters.
Table 11. Consumption of power-generating fuels and purchased heat in Tallinn 2020
Fuel Unit Energy
production Industry
and
construction
Business
and service
Household Total
demand Heating
value Energy
(GWh) Consumption
share (%)
Coal th t 1 1 1 3 7,5 23 0,6
Peat th t 30 30 2,5 75 1,8
Peat briquette th t 2 2 4,4 9 0,2
Wood fuel th tm 2 10 90 102 2,1 214 5,2
Wood chip th tm 850 6 40 896 1,7 1523 37,2
Waste th t 200 200 2,9 580 14,2

44
Natural gas mln m³ 50 26 24 20 120 9,3 1120 27,4
Liquid gas th t 1 2 3 12,7 38 0,9
Biogas th t 3 2 5 5,3 27 0,6
Shale oil th t 1 1 1 3 10,9 33 0,8
Light fuel oil th t 1 1 1 2 5 11,8 59 1,4
Purchased heat (Iru and
CCGT) GWh 36 68 296 400 400 9,8
Toal power-generating
fuel and heat GWh
2605 336 354 796 4100 4100 100,0
Consumption per capita MWh
per capita 10,4
Figure 8 “Fuel and heat consumption in Tallinn 2020” characterises prospective fuel consumption and the distribution of purchased heat in Tallinn
2020.
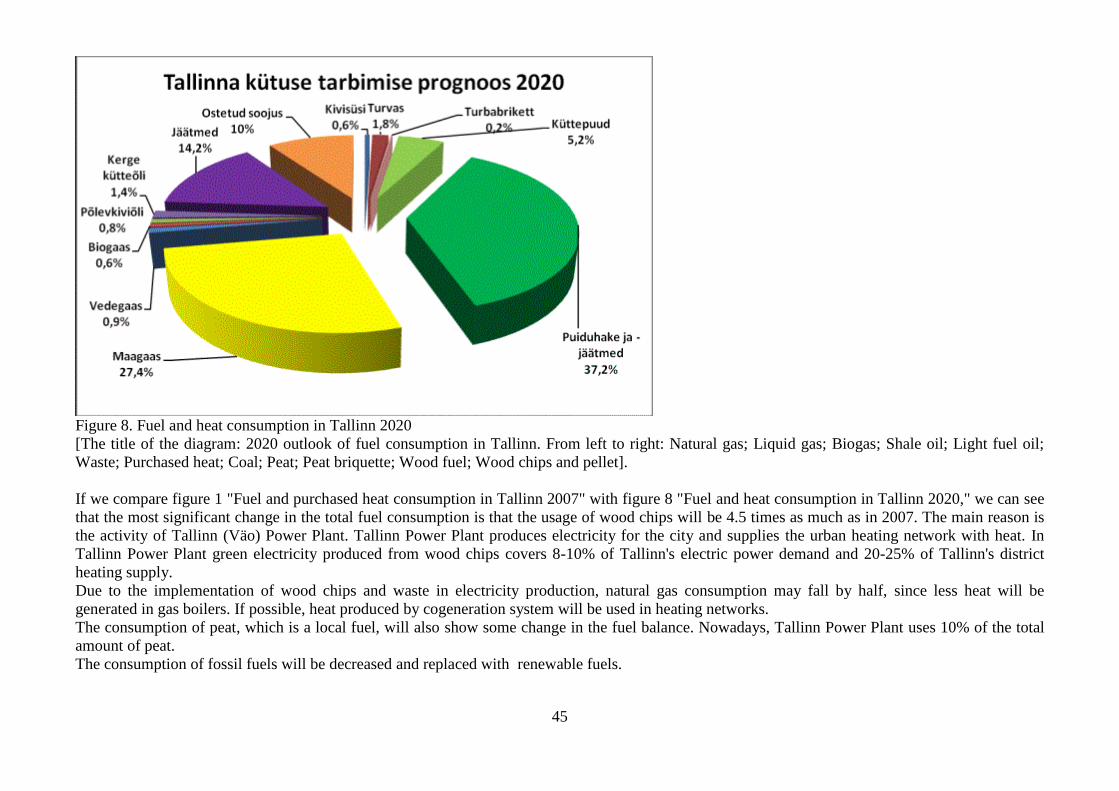
45
Figure 8. Fuel and heat consumption in Tallinn 2020
[The title of the diagram: 2020 outlook of fuel consumption in Tallinn. From left to right: Natural gas; Liquid gas; Biogas; Shale oil; Light fuel oil;
Waste; Purchased heat; Coal; Peat; Peat briquette; Wood fuel; Wood chips and pellet].
If we compare figure 1 "Fuel and purchased heat consumption in Tallinn 2007" with figure 8 "Fuel and heat consumption in Tallinn 2020," we can see
that the most significant change in the total fuel consumption is that the usage of wood chips will be 4.5 times as much as in 2007. The main reason is
the activity of Tallinn (Väo) Power Plant. Tallinn Power Plant produces electricity for the city and supplies the urban heating network with heat. In
Tallinn Power Plant green electricity produced from wood chips covers 8-10% of Tallinn's electric power demand and 20-25% of Tallinn's district
heating supply.
Due to the implementation of wood chips and waste in electricity production, natural gas consumption may fall by half, since less heat will be
generated in gas boilers. If possible, heat produced by cogeneration system will be used in heating networks.
The consumption of peat, which is a local fuel, will also show some change in the fuel balance. Nowadays, Tallinn Power Plant uses 10% of the total
amount of peat.
The consumption of fossil fuels will be decreased and replaced with renewable fuels.

46
Table 12 "Fuel and energy consumption in Tallinn 2007 and 2020" illustrates the comparison of power-generating fuel, purchased heat and electric
power consumed in Tallinn in 2007 with the corresponding forecasts for 2020.
Table 12. Fuel and energy consumption in Tallinn 2007 and 2020.
The table shows that the share of purchased heat and electric power in Tallinn's energy balance is going to fall. It will be replaced with heat and electric
power generated in Tallinn Power Plant (Väo), as well as in waste-to-energy plants by waste incineration system. The total decrease of power-
generating fuel and purchased energy consumption will amount to 8%. The share of waste as an additional source of fuel will increase by 10%. The
share of power-generating fossil fuels and purchased energy in Tallinn's energy supply will decrease by 40% in total, as it will be replaced with wood
chips and waste.
Table 12. Fuel and energy consumption in Tallinn 2007 and 2020
2007 2020 Difference
Fuel Unit Total
demand Energy
(GWh)
Share of
consumption (%)
Total
demand Energy
(GWh)
Share of
consumption (%)
th t th
cu.m. mln m³
GWh %
Coal th t 8 60 1,0 3 23 0,4 –5 –38 –62,5
Peat th t 0 0 0,0 30 75 1,3 30 75
Peat briquette th t 4 18 0,3 2 9 0,2 –2 –9 –50,0
Wood fuel th
cu.m. 142 298 4,8 102 214 3,7 –40 –84 –28,2
Wood chips th
cu.m. 156 268 4,3 896 1523 26,4 740 1255 467,7
Natural gas mln m³ 258 2407 38,4 120 1120 19,4 –138 –1288 –53,5
Liquid gas th t 3 38 0,6 3 38 0,7 0 0 0,0
Biogas mln m³ 3 16 0,3 5 27 0,5 2 11 66,7
Shale oil th t 3 33 0,5 3 33 0,6 0 0 0,0
Light fuel oil th t 13 153 2,4 5 59 1,0 –8 –94 –61,5
Waste th t 0 0 0,0 200 580 10,1 200 580
Purchased heat GWh 986 15,7 400 6,9 0 –586 –59,4 Purchased
electric power 1994 31,8 1670 28,9 –324 –16,2

47
Total energy GWh 6271 100,0 5770 100,0 –502 –8,0
The use of solar power, not widely spread in our area, is also very essential. Weather conditions in Estonia and the current technical level make it
unreasonable to start the active utilisation of sunlight for electricity generation. The latitude and longitude of Estonia allow of 1700 hours of sunlight
annually: this is quite diffuse, shines at an acute angle, and breaks through a thick layer of air. Estonian sunlight cannot be compared with such
countries as Spain, Italy, Greece, and South-Germany, which are the biggest solar energy consumers and where the amount of sunlight hours reaches
3500 with the sun shining from a very high angle at noon.
Estonian weather conditions and current technical solutions do allow the use of solar energy to heat water, especially in summer. Tallinn has a number
of successful examples in this respect. Solar panels and batteries may also be used to generate electric power, accumulate it and the later use it, for
instance, as the source of light of a single object or in a traffic light system, etc. The current technical level does not enable the use of solar energy on a
large scale, however technical development will definitely expand the range of opportunities for solar energy consumption.
3.1.2. Electric power generation, transmission, and consumption
3.1.2.1. Electric power supply in Tallinn
The major share of electricity is supplied to Tallinn by the main network of Elering OÜ, so that the production and transmission of electric power
should be evaluated with a view to Estonia. A part of Tallinn's electricity is produced in Tallinn (Väo) Power Plant, as well as in small-scale power and
heating plants, and, in the future, waste-to-energy plants will also be used in this respect. Iru Power Plant, located on the territory of the City of
Maardu, has a significant role in supplying Tallinn with energy. Tallinn's consumers use most of the heat produced in Iru Power Plant. Tallinn's
atmosphere is also exposed to the emissions of Iru Power Plant pollutants. In the future, the share of Iru Power Plant both in supplying Tallinn with
energy and pollution from fossil fuels will fall mainly due to a probable transition to the operation of waste-to-energy plants and the Tallinn Power
Plant based on biofuel.
According to the development plan of Estonian power engineering, in Estonia 2020, electic power is going to be produced by 900MW windmills. It
will also be necessary to establish wind parks’ balance control stations with the same production capacity, and, moreover, reserve and emergency
reserve stations in addition to peak load stations. It is most efficient to use CCGT-technology based on gas turbines in balance control stations, in peak
load stations, as well as in emergency reserve stations. It would be reasonable to establish some of these stations in the neighbourhood of Tallinn to
supply the city with heat and, through the power transmission lines, electricity.
The electricity production structure is going to be significantly changed, and air pollution from gas emissions will be reduced. According to one
possible scenario, in 2020 the city of Tallinn could produce 316 GWh or 16% of the required fully renewable electricity (see green sectors in figure 9
"Electricity supply in Tallinn 2020").

48
Figure 9. Electricity supply in Tallinn 2020
[From left to right: wind parks; balance control stations and peak load stations, Tallinn Power Plant; waste-to-energy plant; Tallinn's small-scale
cogeneration plants; EE Cogeneration plants; oil shale fired power plants]
The structure of electric power output in Tallinn 2020:
Tallinn Power Plant 180 GWh
Waste-to-energy plants 120 GWh
Small-scale power and heating plants 26 GWh
total 316 GWh

49
In 2020, in addition to its own electric power output, Tallinn will purchase 1670 MWh of electricity from Eesti Energia AS’s power transmission line
generated in electrical stations outside the territory of Tallinn (see blue sectors in figure 9). According to the development plan of Estonian power
engineering,[25]
the electricity production structure is going to be significantly changed and air pollution from gas emissions will be reduced. In Estonia
2020, in compliance with the development plans, the total amount of electricity produced from oil shale will comprise only 35-45%, while a significant
share will come from power and heating plants and wind parks as a renewable energy sources.
It is most sensible to establish gas turbine plants which would operate as wind park balance control stations and peak load stations, since its
contaminants are less harmful than that of shale oil. So Tallinn's indirect CO2 emissions will be reduced because of purchased electric power.
3.1.2.2. Electriс power transmission
Tallinn is supplied with electric power by Elering OÜ 110–330 kV high voltage distribution network. Eesti Energia Jaotusvõrk OÜ (Distribution
Network) further transmits electric power to consumers with low or medium voltage of 0,4–35 kV.
According to the estimatess of Elering OÜ, energy losses in main networks amount to 3%. A remarkable share of energy saving concerns modern
electricity supply systems balancing methods. Today, the centre of electricity production in Estonia is in Kirde-Eesti region, while one-third of the
produced electricity is consumed in Tallinn. Energy losses in general transmission lines can be reduced by an equal division of electric power
production in Estonia (power and heating plants, wind parks, balance control stations, reserve stations, peak load stations).
According to data from Elering OÜ, Estonian high voltage substations and transmission networks are mainly in good technical condition. Over the last
few years the Veskimetsa, Harku, and Kiisa substations which supply Tallinn with electric power have been reconstructed. Aruküla substation is going
to be reconstructed in the next decade, which will include its voltage transformation from 220 kV to 330 kV. A new 330 kV substation can be
established in the territory of Muuga harbour. Moreover, transmission lines at a voltage of 330 kV will be conducted through the Aruküla substation,
which will reduce electrical supply network losses.
During the next decade Tallinn plans to reconstruct Volta and Paljassaare substations which are currently in a bad technical condition, and to replace
high voltage overhead transmission lines between Veskimetsa, Endla, Järve, and Ülemiste substations with underground power transmission lines since
overhead power lines impede the city's development. In general, Elering OÜ plans to invest 200 million kroons in, the reconstruction of substations and
electrical supply networks annually.
As for Eesti Energia Jaotusvõrk OÜ (Distribution Network), the development of its electrical supply network is mostly connected with consumers'
needs. In Tallinn 2007, there were 1,930 medium- and low-voltage substations. Today, there are more than 2,000 substations and annually their
number increases by 100-200, depending on the number of new customers. Besides, old substations are being renovated and transformers are being
replaced with new ones. The energy losses of modern transformers are 2-3 times less than those of old ones.

50
It is essential to carry out the transition to standard voltages. Medium-voltage networks are being transformed from 6 kV voltage to 10 kV voltage, and
new lines are being installed in a manner that will enable their future transformation to a 20 kV voltage level. Nowadays, no developments are being
planned in regard to 35 kV voltage networks, however they still continue their operation.
As for low-voltage lines, in such districts as the City Centre and Põhja-Tallinn, there still remains the situation where electrical supply networks at the
voltages of 220V and 380V coexist in the nearest neighbourhood, which results in double energy losses. The whole low-voltage distribution network is
going to be transferred into 380V voltage, which, in many respects, depends on electricity consumers' options and opportunities.
Measurement systems that control electric power consumption are being further developed; there are both local and remote measuring devices. Local
electric power meters allow a consumer to keep his or her electricity consumption under control at any given time, which contributes to the more
efficient use of electric power.
The free market in electric power allows a consumer to choose the most suitable reseller of electricity. A kind of smart network is now being worked
out which will allow a consumer to purchase electricity from the nearest producer, so reducing corresponding losses in the power transmission line.
Besides, a consumer could limit his or her own consumption in peak hours, for instance by switching off electric heating. These actions will reduce
peak loads and losses in the power transmission lines and will allow an electric generator to remain in an optimal operation mode.
Today, according to the estimates of Eesti Energia Jaotusvõrk OÜ (Distribution Network), electric power transmission losses in the urban electrical
supply network amount to 7%. Eesti Energia Jaotusvõrk OÜ is looking for technical solutions to reduce these losses. All these measures will contribute
to the decrease in network losses and in the total electricity demand. Besides, a consumer will get the opportunity to reduce his or her own
consumption rate.
3.1.2.3. Electriс power consumption
According to data from the collected volume "Tallinn in numbers," electricity consumption in Tallinn 2007 amounted to 1996 GWh, and the maximum
load was 448 MW. Electricity consumption by enterprises and households has been divided as follows:
enterprises 1537 GWh 77%
household 459 GWh 23%
total 1996 GWh
The same level of consumption is forecasted in 2020. A certain level of electricity saving is being achieved by the present consumers, which is
balanced by additional new consumers.

51
Elering OÜ has investigated the outlook for electricity consumption in Tallinn for the next decade (see figure 10 "The maximum consumption of
electricity in Tallinn according to Elering OÜ forecasts"), and, in compliance with their estimates, electricity consumption is going to rise. In case of a
slow rise, the peak load of electricity consumption in Tallinn 2020 will amount to 498 MW, and if a faster rise it will be 625 MW. Tallinn must
organise its electricity consumption in such a manner that would secure a minimum increase in consumption levels and that the rise in the peak load
would not exceed 1% per year, corresponding to the slow upward tendency planned by Elering OÜ. In order to decrease the general demand for energy
in Tallinn, it is also essential to avoid an increase in the peak load in electric power consumption.
If the maximum load rises, it is not recommended to let the actual electricity consumption in Tallinn grow. For this reason, all energy-saving measures
must be implemented. A positive aspect is that a part of the electricity consumed in Tallinn is covered by the renewable fuel used in Tallinn (Väo)
Power Plant, in waste-to-energy plants, and in the windmill electric generating plant located on the territory of Tallinn (Paldiski, Vääna). Losses in the
electrical supply network significantly reduce due to the fact that the electricity is supplied to consumers from plants directly located in Tallinn.
Figure 10. The maximum consumption of electricity in Tallinn according to Elering OÜ forecasts
[Yellow line: Tallinn's load forecast-slow, Purple line: Tallinn's load forecast-fast]

52
Essential electricity-saving measures are the following:
reconstruction of main networks and high-voltage substations by Elering OÜ
reconstruction of distribution networks and medium-voltage substations by EE Jaotusvõrk OÜ
application of energy-saving technologies in the course of production activities by the private sector
application of more energy-efficient sources of light in street lighting by public utilities
application of energy-saving lamps in private households
changing of consumption behaviours by residents
Total costs related to the implementation of the above said electricity-saving measures amount to 300-400million kroons a year, which will be partly
incurred by Elering OÜ, Eesti Energia Jaotusvõrk OÜ, and the private sector. The duties of the City Government include promulgation of these
activities, the distribution of information, and application of the said measures in the economic sector that is in the sphere of its responsibility.
With the application of energy-saving measures it is possible to save 10-20% of electricity by 2020, which will be balanced by additional new
consumers. Considering the joint impact of both the existing consumers and the potential new ones, it is believed that the total demand for electricity in
Tallinn 2020 will stay at the same level as in 2007, i.e. 1996 MWh.
3.2. Heat economy
Tallinn's main heat supplier is AS Tallinna Küte, which owns more than 60% of the total heat supplied to the city. Therefore the development of urban
heat supply systems is closely connected with the operations of AS Tallinna Küte. The other biggest heat suppliers are Fortum Termest AS, AS
Eraküte, small-scale boiler houses, and individual heating.
In 2007, AS Tallinna Küte purchased 54% of its heat from the Iru Power Plant (which was passed on to consumers in Lasnamäe and the City Centre
districts), and produced 46% in its own boiler houses using natural gas (which was supplied to western-Tallinn districts).
Demand for heat in Tallinn has decreased over the years. The thermal load significantly reduced in the 1990s as well as at the beginning of this
century, following which matters have remained stable, however, a certain level of decrease in heat consumption has been observed in the last few
years. In the next decade, heat consumption is also forecast to reduce by 2% annually (see figure 11 "AS Tallinna Küte heat output and outlook").

53
Figure 11. AS Tallinna Küte heat output and outlook
[Blue line: Stable output; Red line: 1% reduction per year; Green line: 2% reduction per year]
AS Tallinna Küte heat output in 2007 and 2020 outlook
in 2007 2021 GWh
2020 outlook 1556 GWh
With an annual 2% decrease in heat consumption and the application of energy-saving measures, the overall heat output of AS Tallinna Küte will
decrease by 445 GWh or 23,1%.
The decrease in heat consumption can be achieved with the application of the following energy-saving measures:
renovation and insulation of existing dwellings;
construction of new dwellings equipped with advanced insulation;

54
renovation of heating networks and reduction of losses;
renovation and balancing of dwellings' heat supply systems.
Cogeneration-based district heating is environmentally friendly and the most preferable method of heating supply in Europe. In order to preserve
continuous and effective operation and the development of cogeneration-based district heating, the city's planning must secure connection with the
district heating of as many areas and dwellings with dense populations as possible.
Apart from the reduction of heat consumption, there is another quite important factor in heat production changes. The major part of heat supplied
through the heating networks had been produced in AS Tallinna Küte using natural gas. In 2007, AS Tallinna Küte boiler houses produced 46% of its
heat from natural gas and purchased 56% from the Iru Power Plant, which also used natural gas as its main fuel. During the cogeneration process, Iru
Power Plant uses classical steam generation and steam turbines of low output efficiency.
On the production of heat, it is vital to apply modern production processes and use fuels that cause less pollution to the environment.
According to the regulations[26]
stipulated by Euro Directive, it is necessary to develop heat production in the following directions:
use of renewable fuel for heat production;
use of waste in heat production instead of dumping it in landfill;
implementation of an effective cogeneration system;
if possible, the use of plants based on gas turbines (CCGT) with high output efficiency.
In order to follow the above-mentioned regulations, Tallinn's energy economy has to implement the following changes in heat production by 2020:
connect Eastern and Western Tallinn's district heating networks;
exploit production potential of Tallinn (Väo) Power Plant;
consider the opportunity of using Tallinn's waste as a fuel;
if possible, start using wastewater residual heat in AS Tallinna Vesi Sewage treatment plant for district heating;
implement the maximum use of biogas;
in order to compensate for the variable output of windmill electricity generating plant, establish gas turbine plant in the territory of Tallinn and
connect it with Tallinn's district heating network;

55
According to § 141
of the Estonian District Heating Act, if new production capacity is needed and several entrepreneurs have expressed their wish in
written form to conclude an agreement, a tender shall be arranged for all those network operators.
3.2.1. Tallinn (Väo) Power Plant
Tallinn Power Plant[27]
(initial name is Väo power plant), which is located on the outskirts of Tallinn in the old Väo quarries, was put into operation at
the end of 2008. The owner of the plant is AS Tallinna Küte, which belongs to the French concern Dalkia International SA.
Tallinn Power Plant has been developed to use local fuel in its operation: wood chips and peat. Using wood chips as a renewable fuel is very effective
from the point of view of the environment - its CO2 emissions into the atmosphere are not considered harmful.
The designed performance capabilities of Tallinn Power Plant are the following:
nominal electrical power 25 MWe
nominal thermal power 49 MWs
gaseous combustion product
generated by condenser up to 18 MWs
gross thermal power up to 67 MWs (along with a condenser generating gaseous
combustion product)
electric power output per year 160–180 GWh
heat output per year 400–500 GWh
plant building cost 1.1 billion kroons
plant founder OÜ Digismart
The present owner of Tallinn Power Plant is AS Tallinna Küte, which manages Tallinn's district heating network. The total amount of heat generated in
the Power Plant is transmitted to the heating network of AS Tallinna Küte Lasnamäe district, fully covering the demands of Eastern Tallinn (Lasnamäe
and the City Centre) for hot water in summer and providing it with the base load for heating in winter.
Heat output at the nominal load varies from 400 to 500 GWh per year. Production volume depends on both the consumption level and the operation of
the condenser generating gaseous combustion product. The maximum heat output rate at 500 GWh can be achieved provided that the condenser
56
generating gaseous combustion product operates with a full load, the whole heat is further fully used, and the Plant works all year round. Before
Tallinn Power Plant was put into operation, Lasnamäe heating network had been obtaining most of its heat from the Iru Power Plant. Tallinn Power
Plant uses wood chips as its main fuel, which is much cheaper than the use of natural gas. So it is obvious that in the future AS Tallinna Küte is going
to purchase from Tallinn Power Plant as much heat as possible, correspondingly reducing the amount of heat purchased from Iru Power Plant.
Tallinn Power Plant's operation is based on renewable fuel, which is rational from the point of view of both consumers and the environment. Heat
purchased from Tallinn Power Plant will stabilize heating prices and release the country from dependance on prices for natural gas purchased from the
Russian Federation. Besides, burning fossil fuel does not cause CO2 emissions into the atmosphere (?!).
3.2.2. Waste incineration
In Europe, half the household waste on average is being incinerated to generate energy. This method is mostly common for France and Sweden, where
waste has been turned into a subject of sale. In Estonia, the mass incineration of waste has not been implemented so far.
Nowadays, the Iru Power Plant is making arrangements for probable mass incineration of waste at the cogeneration plant. It is planned to establish
waste-to-energy plant on Tallinn's Western boundary near the Iru Power Plant, presumably incinerating waste from Tallinn and its neighbourhood.
Performance capability of the planned waste-to-energy plant:
amount of incinerated waste 120 000 – 220 000 tons per year
nominal electrical power 10–18 MWe
thermal capacity 25–50 MWs
electric power output per year 70–140 GWhe
heat output per year 200–310GWhs
plant building cost 1–1,5 billion kroons
plant founder issue is being negotiated
The performance capability of the waste-to-energy plant and its output depends on several factors, such as the intended waste volume to be incinerated,
or the principles of its co-operation with other plants and heating networks.
In fact, it is still unclear where Tallinn is going to direct household waste, who is going to be the owner of the waste-to-energy plant, and what are the
long-term contracts for heat transmission systems.
57
3.2.3 Increase in the share of a renewable fuel
It is reasonable to build production units based on biofuel which would supplement Tallinn Power Plant operating on wood fuel and peat, since, today,
there is everything needed in terms of wood industry and peat resources for the construction of supplementary plant(s) in Tallinn for the sake of
creating environmentally friendly conditions, price stabilisation, and the reduction of dependance on gas resources. It would be reasonable to establish
a plant based on wood fuel (peat) with a production capacity of 65-75MW which would supplement the existing Tallinn Power Plant with 67MW of
thermal power, and contribute to the increase in the use of local fuel in Tallinn by up to 50%.
nominal thermal power 65-75 MWs
gaseous combustion product
generated by a condenser up to 15 MWs
heat output per year 400–435 GWh
plant building cost 0,4 billion kroons
3.2.4. Use of wastewater residual heat
In Tallinn, after wastewater has been purified in the Paljassaare Sewage treatment plant, it is discharged into the sea. The temperature of this
wastewater amounts to 8–20 °C, depending on the season and air temperature. So a significant amount of heat which might have been used in urban
district heating systems with the use of heat pumps is being dumped into the sea. Besides, energy which has been generated by the use of heat pumps is
considered a renewable. Our neighbouring countries, Finland and Sweden, have been generating heat from wastewater with the use of heat pumps for
quite a long time already.
In Tallinn, a number of researches have been carried out on the use of wastewater residual heat, the results of which are also available in the
newspapers[28]
. The city of Tallinn and AS Tallinna Küte are seriously interested in and support this technical solution. According to these researches,
it is possible to generate 20MW of heat from wastewater with the use of heat pumps, while electricity costs will comprise only 30%.
Performance capability of the heating plant based on wastewater residual heat:
plant thermal power 20MW
consumed electrical power 7-8MW
58
heat output per year 100–125 GWh
electric power demand per year 30–40 GWh
plant building cost 120–150 million kroons
joint pipe cost 30–40 million kroons
It would be rational to transmit heat generated in sewage treatment plant to Western-Tallinn's district heating network. From the technical point of
view, it is not that complicated to carry out the transmission of heat generated in sewage treatmant plant to the district heating network. Pipelines of the
district heating network in Western Tallinn cover Põhja-Tallinn's Pelguranna and Karjamaa residential districts. Trunk pipelines of the district heating
network, which are 400 mm in diameter, extend on both Sõle-Sitsi and Kopli-Paavli from their street crossing. Those pipelines that are ВТ 300-400
mm in diameter and 2.5 km long would be enough to transmit heat generated in the Paljassaare Sewage treatmant plant to the district heating network's
trunk pipeline at this Sõle-Sitsi and Kopli-Paavli street crossing.
The electricity needed to operate of heat pumps can be fully or partly produced by gas engines based on biogas released in sludge-digestion chambers,
as well as on natural gas. It is also possible to reheat delivery water in boiler houses based on biofuel in order to provide heating networks with water
of the required temperature in winter periods.
The permanent co-operation of AS Tallinna Soojus, AS Tallinna Küte, and AS Tallinna Vesi is a primary condition for the establishment of a heat
pump that would use wastewater residual heat. According to research results heat produced in the sewage treatmant plant from wastewater residual
heat is much cheaper than that generated in gas boiler houses. If the planned housing construction on the territory of Paljassaare took place it would be
possible to provide those dwellings with heating and cooling systems. The establishment of new truck pipelines will enable the connection of the
heating networks of several Sõle-Kopli residential districts and to close the local small-scale boiler houses that release too many contaminants into the
atmosphere.
3.2.5. The maximum use of biogas
Biogas is released upon the digestion of organic waste. Depending on the surrounding environment, biogas contains 50–70% of methane and its
calorific value is 5–7 MWh / 1000 m3. In Tallinn, biogas is generated and used in the following places:
- Pääsküla landfill;
- Paljassaare Sewage treatment plant.
The Pääsküla landfill has been using biogas since 1993. In the beginning, biogas was used only as a boiler fuel, but since 2001 it has also been used in
the gas engine for electricity generation. After the closure of the landfill in the previous year, the maximum biogas output was up to 1000 m3/h, and the
annual output exceeded 5 million m3. This volume was enough to provide heat for 1000 apartments in Pääsküla. Today the total amount of gas has

59
decreased by up to 300 m3/h. All the biogas is used to generate heat and electricity. Heat is transferred to the AS Tallinna Küte heating network, and
the corresponding electricity is transmitted to Eesti Energia AS power network.
The sludge-digestion chambers in Paljassaare Sewage treatment plant release 2,5 million m3
of biogas annually, which is used in the gas engine as a
boiler fuel, and the remaining product is burnt in a so-called "candle." So biogas losses comprise 10–25% of the total amount.
There are several ways to maximise the use of biogas:
- installation of a second gas engine to generate electricity and heat;
- use biogas as a boiler fuel to produce heat and transfer it to the district heating network.
It would be rational to include the operation of heat pumps using the residual heat of wastewater.
These measures make it possible to get 2–3 GWh of energy per year. The investment needed for the installation of a supplementary gas engine would
be 8-12 million kroons. The use of biogas along with wastewater residual heat is included in the sewage pumping station price.
In addition, Tallinn's (Jõelähtme) landfill also plans to start exploitation of biogas in 2011. Preparations are being made to secure the transmission of
the electricity produced through the power network, as well as the direct use of heat in room heating. In theory, biogas can also be transferred to
Maardu, where a cogeneration unit based on biogas could be established; after that it would be possible to transfer heat through the Maardu-Iru-Tallinn
heating network, so reducing the use of fossil fuels in the energy generation process.
The investment in the construction of power and heating plant with a gas engine using biogas in Tallinn's landfill is 10-20 million kroons. An
additional 6-10 million kroons will go to the construction of a gas pipe to transfer gas to the city of Maardu, however, this process helps in the full
utilisation of heat produced by the cogeneration system.
The performance capabilities of power and heating plant using a gas engine based on biogas are as follows:
thermal power 1–2 MW
electrical power 1–2 MW
heat output per year 8–15 GWh
electric power output per year 8–15 GWh
plant building cost 10–20 million kroons
joint pipe cost 6–10 million kroons
plant founder Tallinna Prügila AS

60
3.2.6. Heat supply from the combined cycle gas turbine power plant
According to the Development plan of the Estonian Electricity sector, it is rational to supplement wind farms with quick starting power plant that
would balance the wind turbine generation system. From the technical point of view, gas turbine plants would be suitable for this purpose. Subject to
the technical requirements of Elering OÜ, those companies that have established wind farms must organise the construction of a balancing station to
connect the wind farms with power networks. This regulation is also prescribed by the Development plan of the Estonian Electricity sector until 2018.
The said target can be successfully achieved by the construction of a combined cycle gas turbine power plant (CCGT PP – Combined Cycle Gas
Turbine Power Plant). This type of power plant offers quick starting and prompt control in case of changes in airflow direction. If possible, it would
also be rational to use heat produced by the plant.
One of the possibilities includes the construction of a balancing gas turbine power plant in the Tallinn area; research is to be carried out to explore the
chances of transferring heat produced in the plant to the heating network.
The performance capabilities of a potential combined cycle gas turbine power plant intended to balance wind farms are as follows:
type of plant combined cycle gas turbine power plant
electrical power 100–200MW
thermal power 70–140MW
electric power output 500–1000GWh
heat output 300–600GWh
plant building cost 1–2 billion kroons
The capacity and electric power outputs of power and heating plant aimed to balance wind farms depends on the capacity and operating mode of the
balancing wind generators. Produced thermal capacity depends on both these factors and on the operating mode of the heating network.
The present Action Plan defines both a probable scenario for the power and heating plant intended to balance wind farms as stipulated by the
Development plan of the Estonian Electricity sector, and its installation in the outskirts of Tallinn by the company responsible for wind farms. The
whole project is still in the pre-appraisal stage as this possibility has not yet been fully investigated. AS Tallinna Küte has the opportunity to purchase
heat from the power and heating plant and transfer it to customers through its heating networks.
3.2.7. Connection of heating networks between Eastern and Western districts in Tallinn
Tallinn has two large district heating networks:
61
Eastern Tallinn's heating network – Lasnamäe and Kesklinn (the City Centre); most of this heat is supplied by the Iru Power Plant; nowadays
Tallinn Power Plant is also on the list of heat suppliers.
Western Tallinn's heating network – Mustamäe, Õismäe, Kristiine, and Põhja-Tallinn; heat is supplied by the Mustamäe and Kadaka boiler-house.
These two heating networks are not interconnected, and there has been no way to transfer heat from the western part of Tallinn to the eastern one and
vice versa. At the same time, two power and heating plants, i.e., the Iru and Tallinn Power Plant are located in the East of Tallinn and supply heat to
Lasnamäe and the City Centre district heating networks only. The Western part of Tallinn obtains heat from boiler-houses using natural gas.
AS Tallinna Küte has already been planning for a number of years to connect the heating networks between the eastern and the western districts in
Tallinn. The construction of the joint pipe began in 2010, and it is planned to put it into operation in 2011 during the heating season.
Performance capability of the joint pipe is as follows:
- length 3.2 km
- diameter 800 mm
- cost ca 240 million kroons
- owner Tallinna Küte
The connection of the heating networks will contribute to more effective planning of the urban heat supply system by applying the most rational heat
production solutions and installing an open-cycle heat pipe in the city. It would allow the production of the major part of heat in power and heating
plants, most likely in the plants based on renewable fuel, and to cover peak loads with the recently renovated AS Tallinna Küte Kadaka and Mustamäe
gas boiler-house(s) with a high power efficiency that complies with all environmental norms. These measures will also secure the full utilization of
heat produced by cogeneration technology based on renewable energy sources.
3.2.8. Other heat producers
The heat output of the other largest heat producers in Tallinn, Fortum Termest AS and Eraküte AS, serving the same number of consumers, is going to
fall by 23%. This reduction will be achieved by both the modernisation of boiler-houses, the construction of new boiler-houses and the application of
energy-saving measures by consumers. The gas consumption of the boiler-houses of these companies will stay at the same level.
The share of the heat produced by the local boiler-houses of enterprises and residential areas (which comprises 5-8% of the heat produced in total) will
not change: the reason is the economical use of heat by both local boiler-houses, heating networks' owners and by consumers.

62
It is essential to add some more local power and heating plants, such as power and heating plants with gas engines to the existing boiler-house and the
heating networks. Both Eesti Energia AS and Fortum Termest AS are carrying out research and preparations in this respect.
3.2.9. Heat pumps
The use of heat pumps in those areas with no district heating network is an essential trend in the heat supply issue. Single-family and small dwellings,
as well as detached buildings (warehouses, offices, etc) can be successfully supplied with heat through heat pumps. Heat pumps use solar energy,
which has been accumulated in the ground or air, and electric power is used only in the course of energy transmission into a building. The average
COP quality factor of a heat pump is 2-3, which means it uses 2-3 times less electric power than the equivalent amount of heat produced.
In Sweden, for instance, there are about half a million of these heat pumps in use, which is why this country is rightly considered a leader in this field.
Sweden exploits both air-to-air, air-to-water, and ground source heat pumps.
In Estonia, air-to-air and air-to-water heat pumps are commonly used. Ground source heat pumps are used to a lesser extent. Ground source heat pumps
are used with a horizontal ground pipeline. The use of a vertical borehole, which is more suitable for heat pumps, is an expensive choice, and it is not
that easy to start their implementation in Estonia.
In Estonia, the implementation of heat pumps began a decade ago, and since then has made a decisive breakthrough. In Estonia 2007, there were
10,000 heat pumps with a total capacity of 60MW, which produced 160GWh of heat, and the electric power consumption amounted to 53GWh. The
number of installed heat pumps is going to increase by up to 20,000 by 2020 for a total capacity of 120MW and 300GWh of heat output, which
comprises a significant amount of the heat consumed by Estonian residents. Considering that half of these pumps are going to be installed in Tallinn, it
will contribute to a considerable reduction in the amount of fuel consumed in Tallinn's households.
3.2.10. Potential heat supply in Tallinn
From the point of view of the environment the flexibility and effectiveness of heat supply in Tallinn would improve a great deal if all the
abovementioned proposals were put into practice. The first step in this direction has already been made. Beginning in 2008, Tallinn (Väo) Power Plant,
based on renewable fuel, was put into operation. Eesti Energia AS is working on the preparation of the project for the construction of the waste-to-
energy plant. A grounding has also been given to the construction of the joint heating pipe between the western and the eastern districts of Tallinn.
In order to modernise heat supply in the western part of Tallinn, it makes sense to install a new gas engine in the Paljassaare Sewage treatment plant
and establish a plant with a heat pump which would use wastewater residual heat. The succeeding steps depend on the construction of the power plant
intended to balance wind farms as well as on a potential opportunity to obtain its heat for the district heating network.

63
For the further development of the heat economy it makes sense to pay special attention to the implementation of the above-mentioned energy
production opportunities by 2020, which will contribute to the maximum use of renewable fuels and energy produced through the cogeneration
process.
Table 13 "Heat supply in Tallinn 2007 and 2020" illustrates heat supply in Tallinn 2007 and the corresponding outlook for 2020.

64
Table 13. Heat supply in Tallinn 2007 and 2020
Heat producers 2007 % 2020 %
Iru Power Plant 1,210 36.1
Väo Power Plant 500 18,7
Waste-to-energy plant or
plant based on renewable fuel 10 11.6
Wastewater resource heat
pump system 125 4.7
CCGT based on gas and/or
peak load boiler-houses 825 24.6 615 22.9
Fortum Termest AS 170 5.1 160 6.0
Eraküte (Tallinna Küte) 75 2.2 60 2.2
Other boiler-houses 220 6.6 230 8.6
Heat pumps 80 2.4 200 7.5
Individual heating 770 23,0 480 17.9
Heat consumers
Enterprises 1,028 30.7 823 30.7
Private consumers 2,322 69.3 1,857 69.3
Total 3,350 2,680 100.0
Figure 12 "Heat supply in Tallinn 2020" shows the probable heat supply in Tallinn 2020 provided that the above-mentioned proposals have been fully
implemented. As can be seen from the table these data differ significantly from those of figure 3 "Heat production and purchase in Tallinn 2007." By
2020 heat supply is going to change in different ways, including the implementation of renewable fuel and various technologies.
Provided the foreseeable development takes place half of the necessary heat will be produced from a renewable fuel, i.e., from wood chips, waste, and
with the use of a heat pump. Renewable energy is being used in large-scale power and heating plants, some boiler-houses, and in the private sector.
23% of the heat demanded is going to be produced by peak load power plants. Provided the connection of Tallinn's heating networks has been made,

65
this task may be undertaken by the renovated boiler-houses in both Mustamäe and Kadaka which belong to AS Tallinna Küte, and by the Iru Power
Plant in prospect (its boilers are not equipped with Low-Nox burners). An essential change is going to take place in the private sector: its share will still
comprise 25%, of which 7% of heat supply will belong to heat pumps and 18% to individual heating. Individual heating is based on both renewable
fuels and natural gas.
Soojuse tootmine 2020
Eraküte
2%
Teised katlamajad
9%
Soojuspumbad
7%
Individuaalküte
18%
Fortum Termest AS
6%
Tipukoormuse katlamajad
22%
Reovee soojuspump
5%
Jäätmeenergiajaam
12%
Tallinna EJ
19%
Figure 12. Heat supply in Tallinn 2020
[Title of the diagram: Heat production in 2020. From left to right: Fortum Termest AS, Eraküte, Other boiler-houses, Heat pumps, Individual heating,
Tallinn Power Plant, Waste-to-energy plant, Wastewater resource heat pump system, Peak load boiler-houses].
As for heat consumption in 2020, the private consumers-to-enterprises ratio will remain the same as it was in 2007, i.e., 70% of heat will be consumed
by private consumers while the share of enterprises will amount to 30%. The total consumption of heat is going to fall by 20% due to the
implementation of energy-saving measures in heat production and transmission as well as by dwellings.
3.3. Transport and traffic

66
The rapid development of the city and its suburbs has resulted in a remarkable deterioration of the efficiency of urban traffic in both Europe and
Estonia, since a large number of people who use their vehicles intensively are concentrated in a small area. At the same time, little room has been left
for the development of public transport infrastructure. Therefore transport planners have to accomplish a complicated task, i.e., how to minimise traffic
jams, and how to make traffic in the city and its suburbs more efficient, safe, fuel-saving and environmentally friendly, so that it improves the living
and working conditions of residents and enhances economic growth. [29]
In Tallinn 2007 there were 397,000 residents. Due to the city's bow-tie form - it is located between the Ülemiste lake and the Gulf of Finland (the
isthmus is 2.4 km long), and with a long shoreline - it is necessary to deal with transport issues that are comparable to the problems arising in cities
with much larger populations. For the creation of people-friendly traffic conditions it is essential to handle the transport system issue in terms of both
its planning and the use of land in Tallinn and its suburbs as a whole.
Recommendations from the European Commission for the transport system development:
- to increase the value of active modes of transportation (public transport, walking, journeys by bicycle ;
- to reduce the negative impact of urban transport on the environment by the use of an efficient transport system;
- to reduce growth in the traffic flow and the demand for vehicles;
- to provide all residents with access to the main transport services;
- to improve the interconnection of private sectors related to the operation of urban transport;
- to ensure the awareness of the target group connected with the field of urban transport in Europe in regard to the benefits of implementing energy-
saving measures in the transport sector.
3.3.1. Scenarios in the development of the transport system until 2035
Three probable scenarios in the development of the transport system in Tallinn and its neighbourhood have been worked out up until 2035[30]
, the
financial support of which depends on local governments and the state, as well as on enterprises and investment priorities.
1. “A random city” – proceeding with the continuation of present trends, i.e., chaotic use of land and non-integrated planning at each level, rapid
increase in the number of vehicles, chaotic urban development, and transport policy concentrating on the development of Tallinn's central roads and
highways.
2. “Suburb” – polycentric suburbs tending to the active use of urban transport along with multifunctional boroughs and parts of the city, integrated
planning at each level.

67
3. “A dense city” – small-scale commuting, growth of Tallinn's population density, transport policy concentrating on non-vehicular traffic and urban
transport.
Figure 13 “Changes in the frequency of vehicle use in Tallinn according to "A random city" scenario (as on a working day ” illustrates changes in the
use of various transportation modes in chaotic urban development conditions, as this is the most probable scenario, which is however at the same time
the most uncomfortable one.
Figure 13 “Changes in the frequency of vehicle use in Tallinn according to "A random city" scenario (as on a working day)“
[Black line: cars; Red line: public transport; Green line: non-motorized traffic].
If the development of both the city and the transport sector are not regulated, the city traffic develops in a random mode, resulting in a remarkable
increase in vehicle use and a decrease in the use of public transport, while non-motorised traffic remains at the same level. This kind of development is
not considered satisfactory.
It is essential to regulate the development of the organisation of urban traffic with the application of "a dense city" or "suburb" scenario, which would
contribute to an increase in both non-motorised traffic and the use of public transport, and limit the growth of the use of private vehicles. It would make
sense from the point of view of energy consumption and environmental conditions, as well as people's health, to encourage people to change their
consumption habits and increase the level of public transport and non-motorised traffic, i.e., journeys by bicycle and pedestrians.
3.3.2. Public transport

68
Tallinn has turned into a city in which private vehicles are frequently used. The development of infrastructure that would make public transport more
preferable over private vehicles is still at an early stage, which is why, at the present moment, public transport cannot satisfy all expectations, in other
words, an attractive alternative to a private car. In the case of traffic jams, the speed of travel of public transport does not significantly differ from that
of other vehicles, so it is considered to be too slow.
The development of public transport will allow the city to save long-term costs on the investment in traffic capacity (new wider roads, multilevel
crossroads, etc.), as well as on fuel consumption rates, and compensate for the consequences of traffic pollution.
State, nature, and the extent of public transport are related to the development of the urban environment, so corresponding development of Tallinn's
neighbourhood must also be kept in mind. Potential transportation requirements, including the needs of disabled people,[31]
must also be taken into
consideration when planning of the use of land in the city’s area.
It is logical to make a full-scale development of public transport in the city which would enable the saving of fuel and maintain the smooth operation of
the whole transport sector. For this purpose, Tallinn transport sector strategy has worked out corresponding measures and proposals.
Support of the public transport priority status
It is necessary to ensure the priority of public transport in Tallinn's traffic (traffic lanes, traffic lights that partly regulate public transport traffic,
bicycle paths and footpaths, if necessary, construction of pathways for both bicycles and public transport, etc.).
Pay special attention to the development of environmentally friendly electrical transport.
Traffic in the city centre shall be regulated in favour of public transport.
Enhancement of public transport efficiency
To implement integrated measures for the enhancement of the efficiency of public transport.
To improve service levels and public transport quality, including availability, environmental concerns, the availability of information for
passengers, sufficient travel speed, high customer service levels, tidiness, comfort, safety, reliability, and regularity.
Public transport is to be developed to meet the requirements of people with special needs (including disabled people and passengers with baby
buggies); and ensure reasonable prices and availability for all customers.
The objective of Tallinn's development plan for 2009–2027
Development of an integrated, comfortable, safe, resource- and energy-saving traffic environment which would provide Tallinn's residents with
good transportation to their homes, work, service and shopping centres, and to leisure areas.

69
Opportunities for achieving the objectives of Tallinn's development plan for 2009–2027:
Organisation of public transportation
Organisation of researches and projects related to public transportation
Expansion of the transport network within the city limits
Development of school bus service
Renewal of public transport fleets taking into account the needs of disabled people, elderly people, and passengers travelling with children
Development of the ticket-sale system, implementation of electronic ticket-sale system
Optimising of both public transport lines and schedules
Development of the public transport infrastructure
Construction of new highways and multilevel crossroads
Construction of non-motorised and bicycle pathway networks
Construction and renovation of street lighting system
Development of the "Park and go" system
In the development of urban transportation priorities must be set for the organisation of the transportation system. The order of priorities in the
development of the transport organisation will be as follows:
1) construction of non-motorised pathways and their active promotion;
2) development of public transport and the corresponding traffic organisation;
3) development of both vehicular and related street network.
3.3.3. Use of biofuel in the transport sector
In 2007 the use of biofuel in the transport sector was insignificant, i.e. 0.15% of the total consumption of transport fuel. According to the European
Union Directive[32]
and the above-mentioned development plan, in Estonia 2020 the share of biofuel in the total amount of fuel consumed in the
transport sector should comprise 10%. First of all, biofuel should be used by that urban transport which has the highest traffic load. The Tallinn City
Government has a significant role in the regulation and implementation of this trend.
70
Major problems in regard to biofuel production and consumption are the following:
there is no information about the efficiency and impact of biofuel consumption;
vehicle manufacturers are suspicious about the use of biofuel;
biofuel, or other fuels that contain biofuel, have poor competitiveness;
availability of biofuel requires additional investment to be made by merchandisers;
statistical data on biofuel needs to be modernised;
there are no European standards for biofuel;
biofuel producers find it difficult to obtain financial support;
there are no development programmes for second generation biofuel.
From the point of view of fuel economy, we need to open up biofuel for development: develop the petrol station network and encourage consumer
awareness on this point
3.3.4. Number of vehicles and fuel demand
In Tallinn at the end of 2007 the number of vehicles was 251,000, of which 194,000 or 77% were motorcars. It is believed that the number of vehicles
will grow by 1-3% yearly. This outlook can be reviewed in several of Tallinn's development plans [33]
.
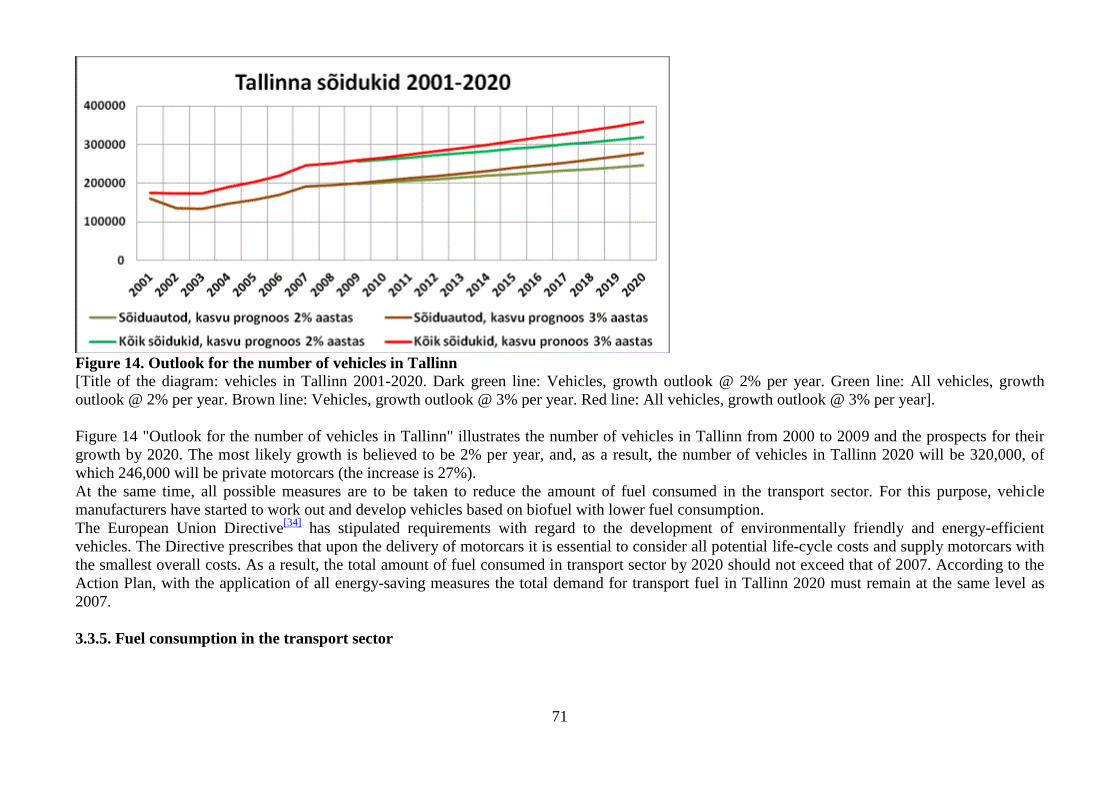
71
Figure 14. Outlook for the number of vehicles in Tallinn
[Title of the diagram: vehicles in Tallinn 2001-2020. Dark green line: Vehicles, growth outlook @ 2% per year. Green line: All vehicles, growth
outlook @ 2% per year. Brown line: Vehicles, growth outlook @ 3% per year. Red line: All vehicles, growth outlook @ 3% per year].
Figure 14 "Outlook for the number of vehicles in Tallinn" illustrates the number of vehicles in Tallinn from 2000 to 2009 and the prospects for their
growth by 2020. The most likely growth is believed to be 2% per year, and, as a result, the number of vehicles in Tallinn 2020 will be 320,000, of
which 246,000 will be private motorcars (the increase is 27%).
At the same time, all possible measures are to be taken to reduce the amount of fuel consumed in the transport sector. For this purpose, vehicle
manufacturers have started to work out and develop vehicles based on biofuel with lower fuel consumption.
The European Union Directive[34]
has stipulated requirements with regard to the development of environmentally friendly and energy-efficient
vehicles. The Directive prescribes that upon the delivery of motorcars it is essential to consider all potential life-cycle costs and supply motorcars with
the smallest overall costs. As a result, the total amount of fuel consumed in transport sector by 2020 should not exceed that of 2007. According to the
Action Plan, with the application of all energy-saving measures the total demand for transport fuel in Tallinn 2020 must remain at the same level as
2007.
3.3.5. Fuel consumption in the transport sector

72
Fuels consumed in the transport sector is being reviewed in compliance with the above-mentioned development scenario, provided that the fuel
consumption remains at the same level as in 2007: however, 10% of the fuel consumed in the transport sector will be biofuel. The share of public
transport in the fuel demand will also increase. The consumption of petrol and diesel fuel oil is going to decrease by 10%. Table 14 "Fuel consumption
in the transport sector in Tallinn 2007 and outlook for 2020" provides a review of fuel consumed in the transport sector in 2007 and the corresponding
2020 outlook. In 2020, the total consumption of motor fuel will be 307,000 tons or 3615 GWh.
Table 14. Fuel consumption in the transport sector in Tallinn 2007, and outlook for 2020
Consumption 2007 Consumption 2020
Fuel (th t) (GWh) (%) (th t) (GWh) (%)
Diesel fuel oil 156 1,838 50,8 141 1,664 46,0
incl. urban transport 9 101 2,8 10 118 3,3
Petrol 126 1,535 42,5 113 1,379 38,1
Light fuel oil 21 242 6,7 18 212 5,9
Biofuel 0 0 0 35 360 10,0
Total 302 3,615 100 307 3,615 100
Most transport fuel will still be diesel fuel oil and (auto-) petrol (see Figure 15 "Outlook for transport fuel consumption in Tallinn 2020"). The share of
biofuel in vehicular fuel consumption is set to increase by up to 10% by 2020, mainly in the field of urban transportation.

73
Figure 15. Outlook for transport fuel consumption in Tallinn 2020
[Diagram title: Transport fuel consumption in Tallinn 2020. From left to right: Petrol, Light fuel oil, Biofuel, Diesel fuel oil].
In addition to motor fuel, such transportation modes as trams, trolleys, and electrical trains consume electric power. Tram and trolley traffic offers
services in the Tallinn area. In the transport sector, the share of consumption of electric power as part of the total amount of fuel and energy consumed
is going to increase, due to the development of public transport generally and the construction of the tram line in Lasnamäe district.
The share of the known fuel and electricity costs of urban transport as part of the total amount of energy consumed by the transport sector (in energy
measurement units), which in 2007 comprised only 3.5%, is going to increase by up to 5%.
3.4. Street lighting
Tallinn's outside lighting, which consists mainly of street lighting, has seen considerable development over the last decade.
In the last decade, the total number of outside sources of light in Tallinn has increased 1.6 times (see figure 16 "Number of sources of light in Tallinn"),
while the electric power demand of street lighting has remained at the same level. The reason is the implementation of light sources with a higher

74
capacity. In 2007, the number of light sources in the streets reached 40,000. Tallinn's streets are well illuminated so there is no need to add a
considerable number of light sources in the coming years. The electric power demand of street lighting is not expected to increase either. Better
illumination performance is being achieved by more efficient allocation of light sources and the development of technical solutions.
Figure 16. Number of sources of light in Tallinn [Blue line: Streets lighting. Red line: Illumination of the elements of urban design].
The technical level of the control systems of Tallinn's street illumination has been thoroughly sorted out to ensure proper regulation. Outside lighting is
controlled by the electrical engineering company KH Energia-Konsult Ltd, located on Laki Street. We need to proceed with the development of local
control systems for outside lighting. Economic expediency is the main restraint on the implementation of the simplest solutions. If keeping such a
control system turns out to be more expensive than the total amount of electric power saved then the use of such a system does not make sense.
The other essential trend is the implementation of light sources with higher capacity. In modern Tallinn, all the old mercury lamps have been replaced
with more efficient high pressure sodium lamps. With the construction of new street lighting systems and the reconstruction of the existing streets, it is
vital to implement new technical solutions using more efficient light sources and systems that regulate the operation of street lighting.
Energy-saving opportunities for streets lighting.
Efficiency is being achieved through the reduction of the energy demand of light sources and the extension of their lifetime.

75
1. Usage time reduction – it is rational to limit the operation of outside lighting in the early morning with its low-density traffic flow. As to the
reduction in operating times, road lighting standards must be taken into consideration.
2. Regulation of light sources' capacity – it doesn’t make sense to keep lights operating at full capacity all night long. It is possible to reduce their
capacity by 50% at some times. This solution will still secure sufficient illumination for passers-by at night-time, and will enable the saving of
energy in a simple way without the need for big investments. To ensure safety it is possible to regulate the level of illumination at night-time in
accordance with the volume of traffic and weather conditions such as rain, fog, snow, and cloud cover. However, such a system capable of
automatically controlling the level of illumination takes a lot of investment. Besides, energy efficiency cannot be precisely proportional to the
reduction in illumination.
3. Reduction in the number of lights – advanced lights are being installed as part of the construction of new street lighting systems and the
reconstruction of the existing streets, enabling a reduction in the total number of light sources without a decrease in the density of light.
4. Replacement of inefficient lights – efficient lights allow energy costs to reduce without detriment to the quality of the density of light. This
includes replacement of old lights which are not equipped with reflectors with new light sources having better capacit.
The use of LED-lights could be one of the possible trends. This year several companies are installing LED-lights on Põhja-Tallinn's Stroomi territory
in order to control their efficiency and durability. The current technical level and durability of LED-lights is not enough for their further widespread
implementation.
Besides, a widespread implementation of LED-lights is still quite expensive. 50–150W lights cost from 5,000 to 10,000 kroons. Their price will fall
due to technical development and widespread implementation. LED-lights have to become of higher quality and more durable in order to promote their
active implementation for street lighting.
Tallinn's street lighting in 2007 and 2020 shows the following proportions:
2007 2020
number of outside lights 45,000 60,000
average unit capacity of each light 192W 156W
street lighting gross power 7,500MW 7,500MW
street lighting energy demand 30,000MWh 30,000MWh

76
The reduction of the average unit capacity can be achieved through the use of lights with much better illuminative power, mainly on new and
reconstructed roads. The amount of electricity consumed by street lighting can remain at the same level, or even decrease, despite the increase in the
number of lights, provided that lights are used in the economy mode using little electric power and high light efficiency.
3.5. Water resource management
AS Tallinna Vesi is the major enterprise in the management of Tallinn's water resources and is considered to be the biggest electric power consumer in
the city, using 2% of Tallinn consumers’ electricity. Therefore it is essential to seek out energy-saving opportunities for Tallinn's water-supply system.
The rate of electricity consumption in the water treatment system has decreased in recent years due to the implementation of pumps with higher power
efficiency and control systems equipped with frequency converters. This trend is to be proceeded with in the coming years.
The rate of electricity consumption in sewage treatment has increased to a some extent due to technological advances. In this field it is vital to use
biogas energy to the fullest extent and install new gas engines using biogas for heat generation. It is also necessary to study and minimise the electricity
consumption of separate devices and systems.
It is impossible to save a significant amount of electricity in the maintenance and improvement of the technical level of water purification and sewage
treatment systems. That is why it is necessary to pay special attention to the consumption of secondary energy. Energy-saving consumption requires
the following measures:
implementation of modern equipment (pumps with higher power efficiency, pump control systems, pump control systems equipped with
frequency converters);
the maximum use of biogas produced in the course of wastewater treatment, - installation of a new gas engine for the generation of electricity
and heat;
use of solid waste as a fuel.
From the energy point of view, it is most efficient to make use of wastewater residual heat by means of a heat pump, and further transfer the produced
heat to Tallinn's district heating network. The required investment in this project amounts to 150-180 million kroons, and the volume of heat that could
be produced annually is 100–120GWh; as for the cost of associated electric power, its one third of the energy produced. Performance capabilities of
heating plant based on wastewater residual heat are available in paragraph 3.2.4 "Use of wastewater residual heat."

77
3.6. Waste treatment
The Estonian National Waste Management Plan 2008 - 2013 was adopted by the Estonian Government in May 2008. It is targeted at the further
organisation of waste management in Estonia, enabling it to fulfil its obligations to the European Union in regard to the waste treatment issue, and to
develop an environmentally friendly and optimised waste treatment system that would be applicable across Estonia.
According to current estimates, household waste (together with packaging waste) contains 60-65% of biodegradable waste. At a rough estimate,
household waste going to landfills contains the same amount. The National Waste Management Plan and environmental impact assessments provide an
analysis of various waste treatment scenarios, in accordance with the requirement to decrease the proportion of biodegradable waste in household
waste deposited in landfills, (the percentage of biodegradable waste in the total amount by weight of household waste going to landfills must not
exceed 45% by 16 July 2010; 30% by 16 July 2013, and 20% by 16 July 2020, respectively (Waste Act RT I 2004, 9, 52)).
Composting of biodegradable waste can contribute to the reduction of its contribution to landfill. The collection of biodegradable waste is one of the
most expensive stages in the whole treatment process. The success of the composting process depends on the quality of the raw material. Composting
of biodegradable waste can be done in waste plants (In Estonia 2007, there were 29 such plants, while 100 was the number needed). Composting
technology depends on the raw material, its quantity, and the location of the waste plant.
In order to fulfil the biodegradable waste treatment requirements, one has to compost or digest waste which has gone through a preliminary separation
process, to implement the mechanical biologic treatment (MBT), or to incinerate household waste (mass incineration).
In the case of incineration, the investment necessary is 2.5 billion kroons, as calculated by the Estonian National Waste Management Plan. Waste
incineration contributes to the reduction of both the amount of waste in landfill and the emission of landfill gas (including greenhouse gases) into the
atmosphere. Waste incineration, instead of storage in landfill, reduces greenhouse gases emissions, the impact of which can be comparable with CO2
emission into the air. Waste incineration also reduces the rate of fossil fuel consumption and the amount of the corresponding contaminants released.
From the point of view of both environmental impact and economic costs, the most optimal waste management scenario would be one when a possibly
large quantity of household waste is recycled or incinerated with the aim of producing energy. An important benefit is that the above scenarios allow
the fulfilment of intentions set by the Waste Act in regard to both packaging waste and biodegradable waste[35]
. The city of Tallinn has worked out
Tallinn's Waste Management Plan, which sets goals for the development of waste management and stipulates guidelines for the period from 2006 to
2011. Today preparation of the waste management plan for the next period is being made.
Tallinn's Waste Management Plan 2006-2011 has been designed to provide analysis of the current waste management situation as well as to set
liabilities and objectives in compliance with legal acts, and work out general objectives and action plans for Tallinn's waste management system.
Tallinn's Waste Management Plan is based on both the Estonian National Waste Management Plan 2008 - 2013 and Harju County Waste Management
Plan, and also on the renewed provisions of the Waste Act adopted by the Republic of Estonia.

78
Tallinn's Waste Management Plan 2006-2011 aims to reduce the amount of waste going to landfill and to increase the amount of waste recovered by
way of recycling materials, including the target set to recycle 30-40% of household waste by 2009. The Waste Management Plan also stipulates the
development of waste fuel production, and the investigation of opportunities for waste fuel use as well as checking the possibilities of incinerating
waste and waste fuel.
The purposes of Tallinn's Waste Management Plan for the following period (10 years and further) include reduction of the total waste quantity in
Tallinn's landfill through the implementation of new waste treatment systems and the enhancement of waste recycling project development. Long-term
purposes of Tallinn's Waste Management Plan are as follows:
- sorting and recycling of waste materials and waste fuel preparation;
- implementation of waste and waste fuel incineration;
- reduction of waste quantity and an increase in the recycling process. The long-term purpose dictates that the percentage of the recycled waste
materials will be over 50%.
The Estonian Environmental Strategy until the year 2030 has set the following priorities in regard to the waste management organisation procedure:
1) waste prevention;
2) reduction of both waste generation and its degree of hazard;
3) waste sorting and recycling;
4) increase in the quantity of waste to be recovered;
- direct circulation (re-use);
- material circulation;
- biological process (composting);
- energy recovery (waste incineration to produce energy);
5) waste treatment in compliance with environmental requirements;
6) elimination of the environmental impact from waste disposal.
The above purposes are to be reflected in the new Tallinn waste management plan which is being prepared for the following period.
79
The main provision of the European Union Waste Directive in regard to waste recycling is that the appropriate measures are to be taken to secure the
recovery of both raw materials and energy in order to minimise the ultimate waste quantity going to landfill. Priorities related to waste recycling have
been set as follows: re-use, waste recycling as a material or raw material, energy recovery (incineration)[36]
.
SEI Tallinn Centre has investigated waste management[37]
in order to estimate and compare possible household waste treatment scenarios (waste
recycling, composting, incineration, deposit in landfills) both at the global and local levels, to inform the implementation of the waste treatment
hierarchy in Estonia. In addition, economic costs for selected waste treatment procedures have been estimated at a general level. The probable
establishment of waste incineration plant has to be handled both at the national and regional levels.
In Estonia, two waste incineration plants (in Tallinn and Tartu) are to be established in accordance with the waste incineration scenario research, and
the vast majority of household waste is to be incinerated. In order to achieve the recycling targets set by the legal acts, about 24% of household waste
materials has to be recovered by way of recycling. Provided that big cities use central waste collection and treatment systems to some extent, then at
least 10% of household waste could be recovered through biological recycling. Considering the intended capacity of waste incineration plants (in
Tallinn it will be 220,000 tons, in Tartu 100,000 respectively), most household waste could be transferred to the incineration plants. The remaining
household waste could be deposited in landfills.
The research results proved that the recycling of reusable materials contained in household waste (mostly metal and packaging waste), as well as
household waste incineration along with the production of heat and electric power are efficient waste treatment modes. Incineration has a positive
impact on the environment since it contributes to the reduction of the use of fossil fuels (primarily oil shale) and the contaminants that they
correspondingly release.
Apart from the fact that the above waste treatment modes become an additional source of energy, the value of which is continuously growing, they also
bring economic profit. The collection of waste and recycling of reusable materials has a positive impact on the environment. However, the economic
costs for waste recycling processes in many ways depend on the organisation and efficiency of the waste collection system[38]
.
OÜ Tallinna Biojäätmed is developing a project which aims to increase the energy potential and recycling of biowaste in the area of Tallinn and Harju
County. The project is being carried out on the area of the Jõelähtme Landfill. The aim of the intended pre-treatment facility is to remove unwanted
impurities from household organic waste and biowaste from industries, separately collected, in order to make it possible to use the material in biogas
stations.
The planned capacity of the whole facility is 15,000-20,000 tons of biowaste per year. The project is scheduled to be completed in 2011/2012, and the
initially estimated total cost ranges from 38-40 million kroons. In 2009 AS Tallinna Prügila put into operation process flow for the production of fuel
from waste on the Jõelähtme Landfill site. Accordingly 80,000 tons of waste are treated there annually producing 40,000 tons of waste fuel (RDF),
which are then used as boiler fuel. In spring 2011, Ragn-Sells AS, the waste handling company, is planning to set up a waste incineration plant in
Tallinn on Suur-Sõjamäe Street which will cost 200 million kroons. Currently an environmental impact assessment is being made in regard to this

80
project. The plant's working capacity is estimated at 80,000 tons of mixed household waste and 10,000 tons of industrial and construction waste per
year provided that the plant runs two shifts.
Moreover, Tallinna Prügila AS plans to establish power and heating plant on the site of the Jõelähtme landfill using biogas in the gas engine. The
electricity capacity of the intended plant amounts to 1.9MW, and the project is to be completed by 2010.
Table 15. Waste management challenges 2010–2020
Activity Quantity of treated
waste (th t)
Produced
energy (GWh)
Responsible
party
Investment
(million kroons)
Waste sorting
and waste fuel
preparation
40–100 Ragn Sells AS
AS Veolia
Environmental
Service
200–300
Waste-to-energy
plant
100–200 130–310 Eesti Energia
AS
1500
Waste
composting
15–20 Tallinna
Prügila AS
20–40
Use of landfill
gas
All waste deposited
in the landfill
15–30 Tallinna
Prügila AS
10–20
The realisation of the above opportunities will enable the intended waste treatment target to be achieved, and to use waste for energy production.
3.7. Housing construction
More than 80% of Tallinn's housing stock has been built since 1945. The calculation of a building envelope’s thermal resistance is based on the
standards of those years[39]
. Considering that the energy price at that period of time was much lower, building envelopes used to have low thermal
resistance, not to mention poor construction quality. Since fuel prices have a tendency to grow continuously on the world market, it is necessary to start
using construction with lower thermal conductivity.

81
The Estonian Construction Act[40]
is an important legal act which regulates construction activity and has to be followed in the construction and
renovation of buildings. The Construction Act stipulates principles for the energy audits of buildings and their organisational procedures, which are
especially important from the point of view of energy consumption.
3.7.1. Energy audit
An energy audit is very important in the assessment of a building’s energy state. An energy audit must be made prior to any renovation of the heat
source or the heating network, or prior to insulating a building, in order to find out the building's actual energy consumption.
In compliance with the Construction Act, anenergy audit is the analysis of measurements and collected data which show the rate of use of energy in a
building, provides a review of a building's technical state, the rate of energy consumption and possible energy-saving opportunities and measures for
improving a building's internal conditions. An energy audit contributes to the more efficient use of energy.
In addition to an analysis of heat and power consumption, an energy audit also assesses the efficiency of water use, indoor air ventilation, the state of
illumination, and, accordingly appropriate proposals are made for any energy-saving measures to be taken and the improvement of living conditions
(indoor air, illumination). The submission of energy-saving measures includes an estimate of both their cost and the resulting benefit. For the purposes
of an energy audit the Credit and Export Guarantee Fund KredEx can provide a loan of up to 10,000 kroons to an apartment or housing association or
an association of apartment owners.
In its attempts to accelerate activity relating to the implementation of energy end-use efficiency in the public sector, the Ministry of Economic Affairs
and Communications along with KredEx[41]
support the complex renovation of apartment buildings for improvement of energy efficiency (at least
20%), and the use of renewable energy in dwellings by making loan capital easily obtainable. For Estonia such an improvement in energy end-use
efficiency would reduce economic costs by approximately 6 billion kroons per year. In Tallinn, the value of heating energy that could be saved is
already estimated at 280 million kroons per year.
After an energy audit is successfully executed, a package of enhanced energy-efficient measures is proposed by which significant energy-savings can
be achieved. The renovation loan can be taken only if the corresponding renovation project has been planned on the basis of the auditor's
recommendations. The building company which is going to do renovation works has to be registered in the commercial register, and, prior to the
construction works, the owner of the dwelling has to appoint a person responsible for supervising the work. Energy-saving methods have a long
payback period due to their high building costs, however, a dwelling's renovation contributes to the economy of both the individual and the whole
state, and improves living conditions. Over the whole territory of Estonia such an improvement in the efficiency of energy end-use would reduce
economic costs by approximately 6 billion kroons per year. The only problem in the implementation of these measures is their long payback period and
high building costs.
It is more efficient to make a complete renovation: the most critical energy-saving measures are these -

82
- additional insulation of building envelopes (walls, doors, windows, roof, attic ceiling, roof-ceiling, cellar walls, and ceiling), which also eliminates
cold bridge problems;
- sealing or replacement of panel joints, windows, and doors, supplying windows with triple-glazing etc.;
- installation of automatically controlled heat supply stations, which enable the hydraulic isolation of the district heating network from a dwelling's
heating system: heat is transferred to a dwelling’s heating system by means of water circulating in a heat-exchange facility;
- regulation of a system that arranges household water heating (circulation arrangement, automatic control, replacement of an old sectional heat-
exchange facility with a modern one);
- renovation of heating and ventilation systems;
- reconstruction of a joint pipe system into a double-pipe system;
- supplying radiators with thermostat valve settings and their appropriate use;
- heating system balance;
- supplying apartments with heat meters (the device does not save energy as such, but contributes to the motivation to save energy provided that all
the above measures have been taken).
3.7.2. Energy passport
The energy passport is designed to show home-owners or tenants their actual energy consumption in kilowatt hours (kWh) per 1m2
of floor area per
year. The issuing of energy passports is stipulated by the legal act "Energy performance certificate and the procedure for issuance"[42]
.

83
Figure 17. Energy performance certificate [At the top of the diagram from left to right: weighted energy use; economical; class. At the bottom: uneconomical].
Since January 1, 2009, an energy passport (see Figure 17 "Energy performance certificate") has to be issued for all new buildings as well as all public
buildings with more than 1,000 m² of usable space, or during the sale or rental of a dwelling when requested by a buyer/tenant. An energy passport is a
document which provides data on energy consumption level in a dwelling in comparison with the average amount of energy consumed in other
dwellings of equal value.
An energy passport indicates the energy efficiency ratio of an existing or planned dwelling. The higher a dwelling's energy performance class is on the
scale of the Energy Efficiency Classes (from A to G), the lower is the use of power and heating. In order to encourage the owners of buildings to deal
with energy efficiency problems, Tallinn City Council has issued decree nr 9 "The regulation for grants to housing associations in accordance with the
issuance of energy performance certificates and training costs" as of March 19, 2009, which, beginning April 1, 2009, enables a housing association to
apply to the Tallinn City property department for a grant of 1,500 kroons for each dwelling in an association to cover eligible costs related to the
issuing of a corresponding energy passport.
It has to be said that the time when energy can be wasted is gone. The circle of energy efficiency measures to be implemented is continuously
expanding. Minerals and timber resources have to be used in a more efficient way and it is only sensible to build energy-efficient dwellings.

84
3.7.3. Requirements for heat supply in dwellings
The green book on energy efficiency[43]
proposes requirements for the energy supply of dwellings and makes recommendations for the more efficient
consumption of energy. The Directive on Energy Performance of Buildings,[44]
which has been put into effect since 2006, will allow Tallinn to save 15
million tons of oil equivalent [Mtoe] from now to the year 2020.
The European Commission aims to provide its Member States with all the necessary resources to use a harmonised method for calculating the energy
efficiency rate of dwellings (30 European (CEN) standards have already been worked out).
The resolution of the Estonian Government[45]
specifies and strengthens the minimum requirements for energy efficiency. This resolution allows for the
planning and construction of dwellings which have a significantly lower energy demand in comparison with those dwellings built to obsolete
standards. The energy performance value of newly built dwellings must not exceed the following values:
small dwellings 180kWh a/m2
apartment houses 150kWh a/m2
…and the energy performance value of reconstructed dwellings must not exceed the following numbers:
small dwellings 250kWh a/m2
apartment houses 200kWh a/m2
Thermal resistance in a dwelling is a critical factor. It is necessary to plan and construct dwellings and their heating, cooling and ventilation systems in
a manner that will minimise the amount of consumed energy, taking local climate conditions into account. The construction of dwellings that are
inefficient from the point of view of energy consumption is no longer allowed. There are also specifications in regard to requirements for building
envelopes.
In order to maintain the thermal comfort of buildings, generally heat conductivity must not exceed a value of 0.5 W / m2·K. In case a dwelling's
windows have high heat conductivity, thermal comfort must be secured with an appropriate level of heating.
The selection of a dwelling's thermal protection should secure a good level of energy efficiency. The selection of thermal protection and energy
calculations for small dwellings will be based on the following initial values:
heat conduction of external walls 0.2–0.25 W / m2·K
heat conduction of roofs and floor 0.15–0.2 W / m2·K
heat conduction of windows and doors 0.7–1.4 W / m2·K

85
At the meeting of the European Union (EU) Energy Council that took place on December 7, 2009 in Brussels, and where Estonia was represented by
the Minister of Economic Affairs and Communication, Juhan Parts, resolutions were approved which expand the requirements for the energy
efficiency of dwellings and specify all products that may influence energy consumption in the future.
The Directive on Energy Performance of Buildings has been amended as a result of the European Union aim to reduce the demand for primary energy
by 20%, and due to the great share of total energy consumption represented by dwellings.
Estonia is mainly influenced by those changes that concern the improvement of energy use in existing dwellings and the need to increase the number of
dwellings with a small rate of energy use. According to the approved amendments, the European Union Member States are to fulfil the corresponding
requirements for the reconstruction of existing dwellings to the full extent, i.e., changing buildings' envelopes or advancement of technical systems.
Moreover, Member States are to construct more dwellings with a small rate of energy use. The Energy efficiency of new dwellings will have been
gradually improved, since, beginning in 2021, all potential dwellings are to have a small rate of energy use.
3.7.4. Energy-saving opportunities in the residential sector
Half of Tallinn's housing facilities have been built in 1960–1990. Dwellings with reinforced concrete slabs having poor thermal resistance comprise the
major part of these facilities. The technical state of these dwellings, including thermal resistance, has been thoroughly investigated by scientists from
Tallinn University of Technology[46]
. In compliance with their estimates, the heat transfer ratio along with a cold bridge in an apartment house of
bearing-wall construction is 0.9–1.2 W/m2K. Dwellings have to be renovated and heat-insulated with 100–250 mm thick infilling. These works have
been started and are to be continued in order to advance the dwellings' heat resistance.
Over the last years, there have been quite a few discussions in regard to energy-saving houses, such as ecohouses, passive houses, zero-energy homes,
etc. The main common features of energy-saving houses are listed below.
Use of environmentally friendly construction materials:
- production of construction materials with the lowest energy costs;
- use of natural materials that are safe for one's health;
- use of re-usable materials to reduce load on the environment.
Efficient, money-saving:
The long-term use of a dwelling is efficient and money-saving in terms of maintenance expenditures, which are mainly heating expenses.
Primary investment in such a kind of dwelling is 30% higher than ordinary houses.

86
Possibility to stop using central networks:
- passive solar heating – energy use;
- use of rainwater – use of rainwater as household water;
- wastewater treatment – local waste purification and composting system;
- wind generator – use of wind energy.
Today, full implementation of such solutions would probably be too expensive, however, any of the above measures could perform a supplementary
function.
The main distinguishing features of these dwellings in comparison with ordinary ones include better heat-insulation: wall insulation is about 45 cm,
and roof insulation 50-60 cm thick. In ordinary houses, these values are half as great. These dwellings also have sufficient resistance to air permeability
which enables the saving of a considerable amount of heating.
In the future, energy-saving houses will certainly become very popular since energy costs are continuously growing, and an efficient house helps its
resident to save these costs. Today is the most favourable time to build an energy-efficient dwelling since building costs have fallen by 30% on
average, which comprises just that particular difference with the building costs of ordinary dwellings. So today is just the right time to implement a
project for the construction of an energy-efficient dwelling.
3.7.5. Renovation of facades
The project named “Let's renovate facades” is based on resolution nr. 38 of Tallinn City Council adopted as of October 15, 2009. The project “Let's
renovate facades” stipulates the procedure for supporting housing associations which intend to reduce energy consumption in their dwellings.
The project “Let's renovate facades” aims to regulate targeted support of housing associations upon the implementation of projects for energy-efficient
consumption. Today, the implementation of energy efficiency measures is becoming increasingly popular on account of a twofold increase in heat
energy prices since 2007, and a continuing growth in prices for heating, electric power, water, and gas. Many Tallinn's dwellings are not considered
energy-efficient, since the construction material used upon their construction does not meet modern quality standards; the majority of facades have lost
their weather resistance.
The project “Let's renovate facades” aims to support the renovation of dwellings and improve the energy-efficiency level of small dwellings (with
areas up to 2,000 m2) by at least 20%, and in big dwellings (more than 2,000 m
2) by at least 30% respectively.
The project aims to provide support for those dwellings built before 1993 in regard to the reconstruction of the main construction (supporting
structures) and renovation or replacement of heating and ventilation systems; moreover, the target of the project is to motivate housing associations to
install devices based on renewable energy. The city of Tallinn helps housing associations to cover the self-financing share upon the application for a
renovation loan.

87
The grant comprises up to 10% of the required renovation loan, but cannot exceed 300,000 kroons per year.
The general purpose of the support is to improve the energy efficiency of dwellings and reduce energy costs, which can be achieved through the
implementation of the following measures:
heat-insulation of facades;
improvement of door and windows’ heat resistance;
improvement of balconies' heat resistance;
improvement of heat resistance in the upper part of foundations and basement floor;
ventilation;
roofs;
heating systems;
other energy efficiency measures.
The expected benefit:
improvement of the energy efficiency level of dwellings;
improvement of the exteriors of dwellings;
preservation of dwellings that are valuable from the point of view of their cultural heritage;
enhancement of housing associations' own initiatives and co-operation;
strengthening of social relationships in dwellings.
A housing association has to be registered as a non-commercial organisation for at least six months prior to the submission of an application for
support. Applicants must not have any EBRD loan obligations to AS Tallinna Küte.
The application shall include supplementary papers, results of the energy audit, and the description of the corresponding planned renovation works, the
required budget, work program, etc. The application must be submitted to the relevant local government. Since the first Monday of February 2010,
subsidies are being allocated within the relevant budgetary monetary funds during the calendar year.

88
During the next decade, the required investment in the renovation of Tallinn's housing facilities and public buildings and the improvement of their heat
resistance amounts to 2-3 billion kroons. The activity requires the involvement of the city's facilities (buildings, schools, kindergartens), private sector
(enterprises), as well as residents. The implementation of the these measures could save 20% or 670GWh of the currently consumed heat per year.
3.8. Elements of urban design
The illumination of elements of urban design (farms, the Old town, monuments, non-motor pathways, and promenades) has seen a decisive
breakthrough over the last decade - the number of light sources has increased fivefold. Some growth in the number of light sources is expected to take
place in the coming years, however, not as rapidly as it has been. It is essential to seek out energy-saving opportunities in this respect.
3.8.1. Park lighting
Park lighting has its own special requirements for the quality of illumination - here, it is not allowed to use an inappropriate luminous spectrum.
Development is being concentrated on the following trends:
implementation of energy-saving lamps with the appropriate luminous spectrum - lamps of this kind are still being worked on, and there are no
specific values;
optimisation of lighting hours.
The optimisation of park lighting will enable a reduction in the amount of the electric power consumed, something which has greatly increased over the
last years. The process of optimisation of park lighting shall be based on the corresponding statistical data on crime rates, which will be obtained in co-
operation with the police.
3.8.2. Lighting of the Old town
The illumination of the Old town's streets belongs to the street lighting category. The Old town's lighting level is generally good. The Old town is
mostly lit by high pressure sodium lamps, which, however, have an inappropriate luminous spectrum. The facades of separate buildings are illuminated
by LED-lamps.
The growth of energy costs for the lighting of the Old town must be limited, and it is vital to find new and energy-saving technical solutions which
would enable the achievement of better illumination levels without an increase in electricity costs. These solutions could include the implementation of
new, energy-saving light sources and the further development of control systems.

89
3.8.3. Monuments and memorials
Existing technical solutions are to be further developed and new ones implemented in order to reduce the electricity demand of monument and
memorial illumination. Electric power can be saved by means of directional lighting, the implementation of energy-saving light sources, and further
development of control systems.
3.8.4. Promenades and easy way roads
Over the last years promenades and pathways have gone through a rapid development which is to be further continued. Many of Tallinn's non-motor
pathways, including the longest non-motor and skiing pathways in Nõmme and Pirita districts, have been worked out in co-operation with Eesti
Energia AS. The regulation of the lighting systems of these pathways did not cause particular difficulties: the most important task was their quick
preparation. Electricity bills are paid by the city of Tallinn, so it is necessary to proceed with the development of lighting control systems that would
enable the saving of electricity.
Nowadays, pathway lights operate in the evening from sunset until 11 p.m. and in the morning from 6 a.m. until sunrise. However, the question is
whether these operating hours suit all weather conditions. For instance, in case of rain there’s no sense to keep lights working when there are no
passers-by on a pathway.
It is also possible to regulate the operation of individual lights: on the pathways it is sensible to install lights that activate only in the presence of
passers-by and illuminate that part of a pathway which is necessary for safe walking. For example, when someone walks a pathway a special motion
sensor could activate the five lights in front and five behind and keep them on for a certain period.
This kind of solution would provide security for all passers-by and save some share of the energy used for lighting these pathways. However, relatively
frequent power-off-power-on of lights can shorten their life-span and increase maintenance costs. This problem could be solved with the
implementation of LED-lights which are quite durable in terms of power-on-off operation. In order to prevent lights from being activated by animals,
the system should be fully switched off for a certain period at night.
The development of lighting of Tallinn's elements of urban design for the period from 2007 to 2020 is characterised by the following values:
2007 2020
number of light sources for elements of urban design 6,600 12,000
incl. LED-lights 8,000
average unit capacity of each light 152W 85W
gross power of light sources for elements of urban design 1,000MW 1,000MW

90
energy demand for lighting of elements of urban design 4,000 MWh 4,000 MWh
Elements of urban design shall be illuminated by modern lights having small energy costs, but sufficient luminous efficacy, such as LED-lights;
control systems shall also operate in an energy-saving mode. The implementation of new solutions with regard to the illumination of elements of urban
design requires investments to be made amounting to 10-12 million kroons.
3.9. Use of land
3.9.1. General development trends in the use of land
Tallinn has a relatively high population density, since, as of 2007, there were 2,510 residents per square kilometre. Population density varies
significantly depending on the city district, i.e., in Mustamäe district, there are 7,883 residents per square kilometre, while Pirita district has only 751
residents per square kilometre.
In recent years the use of land in Tallinn has become more intensive, and the degree of population has become correspondingly more dense, which
must be considered in the development of energy-saving. The denser the population, the lesser area is needed for transmission, and the lesser and more
trifling are network losses (in the transmission of heating, electric power, water, as well as in wastewater facilities).
At the same time it is essential to pay due regard to living conditions and comfort. The distance between a park or green field area and a dwelling shall
not exceed 300m. An optimal solution is to be found taking these requirements. Into consideration.
Basically, in Tallinn, the use of land has become more intensive over the years: in the area of the city centre, free ground is being fully developed, and
the existing housing is being expanded. The only available green field areas in this part of the city include the bastion belt surrounding the Old town,
Kadriorg Park located on the boundary of the city centre, and the sea shore which lies along the whole territory of the city. From the point of view of
both recreational opportunities and the absorption of atmospheric pollution, it is essential to develop the coastal promenade as a leisure area for
Tallinn's residents.
As for the city's outskirts, it doesn’t make sense to build over these areas for the sake only of energy saving. The Pirita and Nõmme districts must keep
their abundant green fields, which makes housing construction there more expensive, however, the comfort is worth it. The technical supply of these
districts is to be carefully thought over. It is more logical to develop individual heating systems in these areas than the district heating supply network.
3.9.2 Use of transport area
To develope urban area and land useage, one has to to pay attention to the advancement of both the street network and the transport area related to it.
The document titled "Development Strategy for Tallinn’s mobility environment 2007-2035" defines the four most important strategic guidelines:
Land use planning;

91
Demand of residents for transport services and preferred transport modes;
Effective traffic management and infrastructure;
Road safety and environmental protection.
Guidelines for the use of land involve the arrangement of economic and social functions in a manner that secures good transportation of residents to
places such as work, school, service, shopping or cultural centres, etc.; it also aims to secure such efficient operation of the public transport as would
guarantee quick access to various destinations. The most preferable mode is a varied choice of saccess to goods and services in a polycentric urban
region. These regions should encourage the use of such mobility modes as walking and cycling, and secure the simple organisation of public
transportation. In this connection, integrated land use and transportation planning is the key to obtaining a sustainable transport system.
Land use principles are the following:
1. Multifunctional residential areas (to ensure quick access to everyday service activities):
1.1. The enhancement of walking, cycling, and the use of public transport as the primary means of access to goods and services;
1.2. Residential areas located within the area servicxed by public transport (mainly rail);
1.3. That the development of conurbations and the city area is automatically accompanied by the provision of public transport (including
financing its expansion) and facilities for non-motorised traffic.
2. Integrated planning of the transportation system and land use of in the conurbation, and the development of energy-saving and efficient projects in
respect of the whole society.
3. The quality of the area of the city is to become significantly adanced, safe, and healthy.
When planning urban transportation it is necessary to bear in mind two requirements that may on the face of it seem contradictory; and an optimal
solution is to be found in this respect.
1. Travelling within the city to the destination (for instance, to a place of work or home) is to be as comfortable and safe as possible. This requires
the organiation of a good road network.
2. The city must have enough room and green areas, and motorcars must not obstruct the free movement of passers-by.
An optimum solution of these two requirements could save both the time spent on travelling and the fuel consumed.
From the point of view of the city development and . optimum energy use, the planning of land use will enable the saving of a lot of energy and turn
the city into a people-friendly one.
92
Optimum land use and the economic planning of the city allows the reduction of the fuel consumption of the transport sector by 5–10%.
The rational planning of buildings – for instance, a rational improvement of high-rise residential buildings with district heating networks
enables the reduction heating network losses and saves heat.
When planning new residential areas the energy supply issue has to be thoroughly worked out.
3.10. Consumption habits
The formation of consumption habits plays a significant role in an efficient energy use. It includes both the implementation of technically advanced
appliances and their rational use.
Firstly, from the point of view of energy saving, it is sensible to switch off electrical appliances not in use, and not to leave them in a standby mode.
Consumers are used to leaving frequently used electrical home appliances in standby mode, rather than switch them off and disconnect from the
electric mains. As mentioned above (see the paragraph 2.10 "2.10. Consumption habits"), electric power demand of those appliances that are usually
left in standby mode comprises 10% of the whole electric power consumption of an average family. By switching off those appliances that are not in
use at any particular moment (computers, radios, televisions), it is possible to save up to 10% of electric power.
The use of energy-saving lamps is the second opportunity for the reduction of electric power demand in a dwelling. These lamps have the same
electrical capacity, but their light efficiency is 2-4 times higher than that of ordinary ones. At the same time, the production of incandescent lamps is
about to be discontinued in the coming years, and the change-over to energy-saving lamps is to take place.
In Europe, including Estonia, on average a resident uses 14% of his or her electric power on room lighting. The implementation of energy-saving
lamps will allow us to reduce total electric power consumption by 5-10%.
The use of appliances with low electric power demand is the third essential opportunity for electricity saving. When choosing new home appliances, it
is reasonable to prefer those having energy efficiency class "A" as the most efficient one.
The fourth measure to save electric power is the use of electric appliances in a power-saving operational mode. Many enterprises and private
consumers leave their computers in full operational mode for the whole night. The electric power demand of one desktop computer is 100–150W or
hundreds of kilowatts for the whole City Government's computers. Computer software companies must prevent this needless use of electric power.
Modern computer programmes allow an administrator to set them and take other actions to turn on computers for a short time only. This enables the
saving of hundreds of kilowatt-hours of electric power. At the same time, it is sensible if possible to use laptops, since their electric power demand is
five times less than that of an average desktop computer.

93
The insulation of buildings is one of the most important energy efficiency measures. As mentioned above, the renovation of a building enables an
energy saving of at least 30%. These measures definitely require technical calculations to be made, the preparation of a project, and its appropriate
execution.
Traffic habits are also significant from the point of view of energy consumption. Tallinn has a quite good non-motorised road network. In 2010, the
length of non-motorised roads comprised 167.4 km. These roads suit cycling and other sports well. It is important to encourage residents to use non-
motorised roads for their daily travelling, i.e., going to work or to shop. Cycling should turn into an everyday habit of Tallinn's residents. This will
contribute to both the reduction in the use of motor vehicles and the demand for fuel, mainly that of private vehicles. Definitely, the promotion of non-
motorised roads is to be further continued; it is necessary to make them safe for cyclists, especially in the region of highways and crossroads, to
provide parking for bicycles, and in other ways make cycling an attractive alternative to car transport.
Public transportation is to become more available and comfortable. For this purpose it is necessary to pay attention to the revision of routes and the
traffic density of public transport lines and make the changes needed to comply residents' needs. The purpose is to make public transport an attractive
alternative to the use of private cars.
These are the most important energy-saving opportunities to be applied daily. Besides, it is very important to raise the awareness of residents of these
measures and form appropriate consumption habits.
To this end it is necessary to implement the following measures:
To organise energy efficient days to clarify and explain to residents how they can consume less energy;
To start the promotion of energy-efficient living among schoolchildren;
To provide entrepreneurs with training for the development of energy efficiency measures in their enterprises;
To introduce new devices with a low rate of energy demand;
To introduce energy-saving opportunities via radio, television, and advertising;
To provide recognition and reward for achievements in the energy-saving field.
The City Government has a significant role in raising people's awareness and the formation of appropriate consumption habits. The changing of
consumption habits allows the saving of 15-20% of energy by using the simplest measures and lowest expenditures.

94
4. Action Plan for Energy Efficiency for the next three years
On the basis of the present Action Plan, the previous paragraphs provide an analysis of the actual energy consumption and outlook for the development
programmes. The Action Plan defines the further development of energy generation, energy consumption, the city economy, and formation of
appropriate consumption habits. The Action Plan is based on the task stipulated by the European Union Directive on the development of energy
economy, as well as on the objectives which have been set by the legal acts of the Republic of Estonia. The Action Plan for Energy Efficiency for the
next three years has to ensure the reduction of energy consumption in Tallinn by 20% by 2020 as compared to 2007, the increase of the share of
renewable fuel in energy production by 20%, and the reduction of CO2 emissions into the atmosphere by 20% respectively.
The Action Plan for Energy Efficiency for the next three years prescribes the following four development trends:
Organisational energy efficiency measures
- Organisation of energy efficient days
- Training for entrepreneurs
- Energy saving in every enterprise
- Indication of energy efficiency measures in every development programme
- Improvement of co-operation between departments
- Appointment of posts and officers responsible for the implementation of energy efficiency measures
Energy saving measures in the electricity sector
- Replacement of outdoor lights with new, energy-saving ones
- Use of energy-saving lamps by both private consumers and enterprises
- Further advancement of outdoor lighting control systems
- Renovation of Elering OÜ tie-stations and trunk lines
- Renovation and further development of the city's distribution networks
Heat supply to buildings
- Energy audits, thermographic investigations and the issuing of energy performance certificates
- Renovation and insulation of dwellings
- Construction of dwellings with higher thermal resistance

95
- Expansion of the use of heat pumps, especially in areas with a low population density
- Use of solar energy
- Renovation of district heating networks and replacement of pipelines with pre-insulated pipes
Technical development
- Connection of the heating networks between Eastern and Western districts in Tallinn
- The maximum use of electric power generated in Tallinn Power Plant from biofuel
- Organisation of waste management and the potential establishment of waste-to-energy plant
- Renovation of boiler-houses and construction of local power and heating plants
- The maximum use of biogas and wastewater residual heat in the sewage treatment plant
- Implementation of biofuel refuelling
- The further development of public transport and construction of the tram line in the Lasnamäe area
Basically, organisational and technical energy efficiency measures are closely related and supplement each other. The Action Plan for Energy
Efficiency for the next three years defines measures to be taken to fulfil Tallinn's obligations in regard to energy saving in the following decade. The
above four groups of measures and the potential energy-saving volume are thoroughly analysed below.
4.1. Organisational energy efficiency measures
Organisational energy efficiency measures are the first of the list of probable measures to be taken. Due to the current complicated economic climate
and investment opportunity limitations, it is possible to apply only those organisational measures which involve the smallest financial resources and
allow the achievement of a significant energy saving.
4.1.1. Organisation of energy efficient days
The main purpose of energy efficient days is to make residents aware of simple and efficient energy-saving opportunities. The switching off electrical
appliances rather than leaving them in standby mode allows the saving of 10-15% of electric power. The experiment which carried out by the Estonian
Television proved that it is feasible to save electric power in a very simple way. The broadcaster asked their television audience to turn off all

96
unnecessary electrical devices at that time and switch off all unneeded lights, resulting in the reduction of ther electrical load in Estonia by 15%. It is
necessary to ensure that each consumer realises how much energy can he or she save in everyday life.
The initiative to organise energy efficient days belongs to the City Government. The event involves the co-operation of both media (newspapers,
magasines, radio, and television) and other advertising. Each consumer must be aware of the information on energy-saving opportunities. Energy-
saving recommendations will be introduced in schools, enterprises and recreation centres as well as to elderly residents.
If each consumer cuts down on energy consumption and saves several tens of kroons monthly, then electricity consumption in Estonia will reduce by
10%, Estonian power plants will reduce their use of oil shale by a million tons per year, and the amount of CO2 emissions into the atmosphere will
reduce by up to one million tons correspondingly.
4.1.2. Training for entrepreneurs
The main purpose of this training is to advise entrepreneurs how to best use energy-saving opportunities in the course of production processes and
offices. Some consumers customarily, or are even obliged, to leave their computers in full operational mode overnight, leading to heavy expenses for
electric power, although it is not technically necessary in most cases.
Modern computer programmes allow an administrator to set them and take other actions to turn on computers for a short time only as necessary.
It is vitral to bring to the attention of entrepreneurs the problems arising with internal conditions which do not merely mean a warm room but fresh air
and comfort too. Much depends on the promotion of ventilation systems and the use of air heating controls.
The second important trend involves the implementation of energy-saving technologies and appliances. The replacement of old production equipment
and its engines having low power efficiency with new and advanced ones enables the saving of a lot amount of energy. It is very efficient to keep
continuous control over the equipment and frequency converters to regulate the speed of engines. All these well-known facts and opportunities are
introduced to entrepreneurs within the framework of training.
4.1.3. Energy saving in every enterprise
After entrepreneurs have been introduced to, and informed about energy-saving opportunities, it is essential to ensure that the said measures have been
successfully taken up enterprises. The City Government must be the first to give a lead in energy-efficient behaviour by using their computers in the
optimum operation mode, implementing energy-saving illumination, and finding better solutions to create a comfortable internal climate in the
building. Energy-saving activity must reach every enterprise, especially those that modernise their production processes. It is essential to implement
energy-saving technologies.

97
4.1.4. Indication of energy efficiency measures in every development programme
Tallinn has plenty of development programmes in regard to both the improvement of the city's districts and the city economy (see the List of
References), however, often these programmes suffer from a lack of due attention to the development of saving energy economies. Some of these
programmes do not even mention any aspects of energy economy.
Each and every development programme is to involve energy economy subjects, whether i concerns the development of the city's district or
reconstruction of park facilities. A development programme must not only indicate the energy supply subject, but also provide a comparison of energy
demand level prior to and after the implementation of the measures indicated indicated. The simple statement that a new solution is going to increase or
decrease energy consumption is not enough. A development programme must illustrate energy saving measures and technical opportunities.
4.1.5. Co-operation between departments
The city must co-ordinate co-operation between entrepreneurs and local governments within the framework of the promotion of energy saving
measures in order to avoid a situation where work on the implementation of one and the same energy saving measure is duplicated in several
departments, or follow totally opposite directions, which is even worse. The City Government has a significant role in setting the activity of both the
city's subordinated authorities and private enterprises and organisations.
4.1.6. Parties responsible for energy saving
The City Government shall appoint specialists for different departments who will be responsible for energy economy and energy saving issues. The
city is to have an Energy Department, or, at least a power engineering specialist who will co-ordinate and take control of the city's energy economy
performance.
The implementation of organisational energy saving measures requires that the lowest expenditures be incurred. An efficient and successful
implementation of the said organisational measures enables the saving of 2-3% of energy annually as soon as in the first three years, and secures the
fulfilment of the 20-20-20 commitment by 2020.
4.2. Energy saving measures in the electricity sector
As mentioned earlier, each consumer can do much to save electric power. A review of energy saving measures that can be taken by enterprises,
departments, and electricity consumers is shown below.

98
4.2.1. Replacement of outdoor lights with new and energy-saving ones
As mentioned earlier, Tallinn Municipal Services Department and the electrical engineering company KH Energia-Konsult Ltd have performed good
work on the modernisation of Tallinn’s outdoor lighting. In recent years, 2000-3000 lights have been replaced or newly installed annually. The
majority of outdoor lights have been replaced with high pressure sodium lamps. Today, there are only some hundreds of mercury discharge lamps left.
Old inefficient lights are to be replaced alongside the reconstruction of streets and junctions. Only energy-saving lights are to be used in outdoor
lighting.
4.2.2. Use of energy-saving lamps both by private consumers and entrepreneurs
Thew use of energy-saving lamps allows the reduction of electric power demand by 2-4 times without any deterioration in light efficiency. Besides,
this year, European Union Member States have discontinued the production of 100W incandescent lamps, and by 2020 their production is to be fully
closed. The implementation of energy-saving lamps will allow everyone to save a considerable amount of electricity in each house-hold. The
manufacturers and suppliers of bulbs also have to be directly involved in the use of energy saving light. It is impossible to achieve energy saving to the
fullest extent if energy saving bulbs are installed in out-dated fittings.
4.2.3. Further advancement of outdoor lighting control systems
Tallinn Municipal Services Department and the electrical engineering company KH Energia-Konsult Ltd have done good work on the modernisation of
the city's outdoor lighting control systems, and, today, Tallinn's outdoor lighting control systems are up to the latest world standards. The development
of outdoor lighting and both central and local control systems is to be proceeded with.
The majority of Tallinn's outdoor illumination operates in the evening hours after sunset and in the morning hours until sunrise, which amounts to more
than 4,000 hours a year. Sufficient street illumination is defintrely necessary in the evening and morning hours, however, night-time illumination
should run an optimum operational regime. Today, some street lighting is switched off in the early morning hours. It is essential to develop systems
which would secure optimum outdoor illumination with the lowest electric power consumption.
Tallinn Municipal Services Department bears responsibility for the quality of the city's outdoor lighting and its operation. Considering the limited
budgetary funds, in 2009, Tallinn saved 10% of actual electric power as compared to 2007, due to an energy-efficient operation mode of outdoor
lighting. The implementation of outdoor lighting optimum control systems allows the saving of a remarkable amount of electric power in the future.

99
4.2.4. Renovation of Elering OÜ tie-stations and trunk lines
Over the last years, Elering OÜ has renovated several important substations which supply heat to Tallinn, i.e., Harku, Veskimetsa, and Kiisa
substations. The replacement of several urban 110 kV overhead lines with cable lines, as well as the renovation of the Aruküla and Volta substations
are planned to be completed within the next three years. The renovation of substations and lines reduces power transmission losses and enhances the
electricity supply level. The organisation and financing of projects are performed by Elering OÜ, but the city may lend support to the planning and co-
ordination of works.
4.2.5. Renovation and modernisation of the city's distribution networks
Some old residential areas in Tallinn, such as the Old Town and Kopli districts, still face the situation where electric supply networks at voltages of
220V and 380V co-exist in the nearest neighbourhood. It is planned to transfer the whole city distribution network to a 380V voltage system which will
enable the reduction of network losses and enhance the electricity supply level. The project is to be performed by Eesti Energia Jaotusvõrk OÜ
(Distribution Network). Some buildings with 220V electricity supplies belong to the city; in this case, the city itself wil order the construction of a new
electricity supply system. As for the buildings that belong to private owners, the city will offer them due co-operation and support.
The implementation of the above energy saving measures in the electricity sector will allow a reduction in electric power losses and the city's general
electricity expenditures by 10-20%.
4.3. Heat supply to buildings
Heat supply to buildings is one of the most important opportunities for energy saving. This issue must be handled by all buildings' owners, as well as
upon the construction and renovation of buildings belonging to the city's property. The renovation and heat-insulation of the existing buildings enable
to save up to 30% of energy. New buildings are to be constructed in compliance with the requirements of the EU Directive. Heat supply to buildings
must be executed in accordance with the energy saving measures as provided below.
4.3.1. Energy audits, thermographiс investigations and energy performance certificate
An energy audit must be done prior to the renovation of a building. An energy audit assesses the actual energy consumption of a building, indicates its
problem areas, and proposes solutions for the most efficient energy savings. An energy audit is accompanied by thermographiс investigations which
can help to check the thermal resistance quality of a building envelope and indicate problem areas.

100
An energy performance certificate is designed to indicate the actual energy consumption of a building. An energy passport is obligatory for all new
buildings, necessary for those buildings being demolished, and recommended for all other buildings. The execution of the energy audit, thermographiс
investigation, and obtaining of the energy passport are the obligations of the building's owner. The corresponding investigation and financing of those
buildings that belong to the city shall be organised by the city. Energy audits and energy passports contribute to more efficient energy-saving
renovation works.
4.3.2. Renovation and insulation of dwellings
Renovation contributes to both the improvement of living conditions in a building and a reduction in heat losses. It is essential to perform the necessary
technical calculations and draw up the project prior to renovation works. Adherence to project conditions secures a better result of the works and the
maximum energy saving.. A building renovation along with all corresponding supplements must be handled by the building's owner, i.e., the city, an
enterprise, a housing association, or a private owner. The city may lend support in terms of execution and financing of these works.
4.3.3. Construction of dwellings with higher thermal resistance
The EU Directives and Estonian legal acts prescribe standards for thermal resistance in newly-built buildings, according to which the heat transfer rate
through a building's wall must not exceed 0,2–0,24 W/m2
ºC. It is necessary to ensure that all planned buildings meet this requirement. Unfortunately,
the concrete elements that are currently used in house building do not meet those requirements, and do not mention the other targets set by the other
European states, according to which the heat transfer rate through walls must not exceed 0,2 W/m2
ºC. Special attention must be paid to the
construction of dwellings that have minimal energy demands.
4.3.4. Expansion of the use of heat pumps
A heat pump enables the use of 2-4 times less energy. Today, Tallinn has put into operation about 10,000 heat pumps, and their number will increase
1.5 times in the coming three years. Heat supply through a heat pump system particularly suits private houses and small apartment houses. This system
enables the saving of about 50MW of energy annually.
4.3.5. Use of solar energy
The expansion of solar energy use is essential for those dwellings having low energy demand - solar panels will become the simplest solution for heat
supply to these buildings. It can be applied to both private houses and public facilities. Modern technical solutions and conditions allow the use of solar

101
panels in electricity generation as well, though electric power generated in this way is more expensive than that transmitted through the power
transmission line.
If currently the share of solar energy in thr power supply is insignificant and remains below 1% in the years to come, then, considering all technical
developments in the field of the use of solar energy, the its share should increase greatly in the near future.
4.3.6. Renovation of district heating networks
The renovation implies the replacement of old pipelines having poor thermal insulation with pre-insulated pipes. The district heating pipelines which
belong to AS Tallinna Küte are 420-kilometres long, of which only 106 km (25%) have pre-insulated pipes. Each year, 2-3 kilometres of heating
pipeline networks are replaced with new ones. In addition, new pipelines are being built. The average age of the district heating network is more than
23 years. In the following years, the scope of pipeline reconstruction is to be expanded. In order to maintain an appropriate technical state of the
heating network and decrease heating losses, at least 10-12 kilometres of pipelines are to be renovated annually, which is 3-4 times more than the
current average volume of work. Investment in the renovation of heating networks comprises about 120-140million kroons per year. Nowadays heat
supply to buildings as a trend in the Energy Efficiency Action Plan faces the problem of energy over-consumption, so implies the widest range of
opportunities for energy saving. This may be proved by the results of the urban heat supply system development that have been achieved over the last
decade. It is essential to proceed with the reduction of the energy demand of buildings.
4.4. Technical developments
Technical development requires a lot of investment to be made, and this issue is handled by those enterprises that have set a goal to develop their
energy economy. Since a number of these enterprises are directly related to Tallinn, the city has a vital role in this matter.
4.4.1. Tallinn Power Plant
Tallinn (Väo) Power Plant, which belongs to AS Tallinna Küte, started producing at the end of 2008, and is currently titled Tallinn Power Plant Ltd.
Being an environmentally friendly enterprise, the Plant uses local fuel, i.e., woodchips and peat. The Plant produces 8-10% of the electric power
consumed in Tallinn, as well as a quarter of thre heat supplied to the city's district heating networks. The establishment of the Plant has contributed to
the reduction in the use of fossil fuel within the process of energy supply to Tallinn.

102
4.4.2. Organisation of waste management and establishment of waste-to-energy plant
In Tallinn it is necessary to sort and recycle the waste generated. Works in this direction are being performed, however, this field requires an integrated
solution. For this purpose, it is necessary to organise waste sorting, further use of recycled waste, biowaste composting, and organic waste incineration.
Nowadays the Iru Power Plant, which belongs to Eesti Energia AS, is planning to build waste-to-energy plant.
4.4.3. The maximum use of biogas in the Sewage treatment plant
Biogas released upon solid waste digestion is being used in sewage treatment plant both in the gas engine and as a boiler fuel. A quarter of the biogas is
burnt in an open flame in so-called candles. It is planned to use all the biogas for energy generation, requiring the installation of a new gas engine that
would allow the production of both electric power and heat.
4.4.4. Renovation of boiler-houses and construction of local power and heating plants
Several boiler-houses have to be modernised in order to increase their power efficiency and enhance fuel consumption procedure. This includes both
the replacement of old boilers and renovation of the existing ones. Boiler-houses that belong to AS Tallinna Küte, Tallinn's largest heat supplier, have a
good technical state and high power efficiency, while small-scale boiler-houses require modernisation and improvement of their power efficiency rate.
It is also essential to find ways to transfer the heat which has been generated through the cogeneration system to Tallinn's district heating networks. It
is necessary to support the construction of power and heating plant which would substitute for the existing small-scale boiler-houses and transfer the
produced heat to Tallinn's central heating network. This will contribute to the development of an efficient cogeneration method which is widely used in
Europe.
4.4.5. Establishment of biofuel filling stations
Nowadays, Estonia generates more biofuel that is necessary to meet the requirement according to which the share of biofuel shall comprise 10% of all
transport fuel. Biofuel has less negative impact on the environment, and it is necessary to establish appropriate facilities at the filling stations. Such
facilities have been introduced and operated at AS Statoil petrol station for some time. It is vital to make joint efforts to run biofuel filling stations.
4.4.6. Public transport development and construction of the tram line in Lasnamäe district
The Tallinn Transport Department aims to develop urban transport. For this purpose, public transport routes will be optimised and new lines put into
operation, as required. The use of biofuel in the most intensive public-transportation lines would significantly reduce the air pollution level in the city.

103
The construction of the tram line in the Lasnamäe district is an important trend. Currently, a common interest agreement has been concluded with
Chinese investors for the construction of the tram line in the Lasnamäe district between 2011 and 2015 at a total cost of 3.8 billion kroons. This
solution will contribute to the reduction in the consumption of diesel fuel oil in thre public transport sector and the improvement of the general urban
atmosphere.
4.5. Conclusion
Energy saving requires the implementation of all the abovementioned measures within the next three years. As the result, we will be able to achieve the
intended reduction of environmental pollution and enhance energy saving by 2020.
5. Volume of expenditures and investments, and financial resources
Expenditures related to the fulfilment of the set target are very high, i.e., in the range of billions of kroons. The accomplishment of the set tasks
requires the involvement of the city's budgetary means, state funds, the co-operation of private investors, and European Union support programmes.
5.1. The role of the city
Within the framework of energy saving measures, the city is to organise, launch comprehensive investigations, prepare and execute organisational
measures, and keep control of the whole implementation process. The city will spend 20 million kroons on the execution of energy saving
organisational measures. The payback period of the investments in both promotional activities and energy efficiency measures will take a number of
years.
The second important and the most energy-efficient financial trend of the city in this respect is renovation of the city-owned buildings for the sake of
energy saving, and the support of energy audits for dwellings in the private sector (housing associations), as well as the issuing of the corresponding
energy performance certificates. As to the renovation of schools and kindergartens special attention is to be paid to the insulation of buildings and thre
improvement of their internal conditions. The construction of new buildings shall meet all revelent modern requirements.
Further development of Tallinn's outdoor lighting is an important trend. The technical performance and the development of Tallinn's outdoor lighting
are controlled by the electrical engineering company KH Energia-Konsult Ltd, however, the development trends of outdoor lighting are prescribed by
Tallinn Municipal Services Department, which also pays for the electricity consumed in outdoor lighting, or 40 million kroons per year. It is necessary
to spend at least 20% of the this amount annually on the further development of outdoor lighting systems which would enable the reduction of the
amount of electricity consumed by the city's illumination systems.
Public transport development will also contribute to the direct urban organisation. The city maintains the development and financing of several trends,
which are as follows:

104
the establishment of optimum public transport layout;
the use of biofuel in the public transport sector;
the construction of the tram line in the Lasnamäe district;
the use of fuel-efficient official cars.
The construction of the tram line in thre Lasnamäe district is definitely the most expensive project of all, the projected cost of which amounts to 3.8
billion kroons. The construction of the tram line aims not only to achieve a considerable energy saving but also enhance eastward traffic in Tallinn.
The city plays a more significant role in the promotion of an energy saving lifestyle, as well as in the fulfilment of organisational measures, than just in
the financing of the whole energy saving project.
Table 16. Financed energy-saving activities in Tallinn
Activity Energy saving per year
(GWh) Period
CO2 reduction
(t)
Costs (mln
kroons) Notes
1 . Organisation of energy efficient days
Contributes to changing of
consumption habits
2010–2020 5–8
2. Energy audit and energy passport issuing for
city-owned buildings
Contributes to heat-
insulation in buildings
2010–2020 8–10
3. Renovation and heat-insulation of city-
owned buildings
50–100 2010–2020 14350–28700 500–800
4. Further improvement of outdoor lighting
control systems
2–3 2010–2020 2500–3750 25–30
5. Use of energy-saving lamps in outdoor
lighting
4–5 2010–2020 5000–6000 150–200
6. Use of energy-saving lamps in the city's
organisations
5–10 2010–2015 6300–12600 3–5

105
7. Changing of energy consumption habits in
the city's organisations
4–5 2010–2020 5000–6000 1–2
8. Use of biofuel in the urban transport sector 10–20 2010–2020 2500–5000 10–20
9. Use of fuel-efficient official cars 2–3 2010–2020 600–1000
10. Construction of the tram line in Lasnamäe
district
5–10 2010–2020 1500–3000 3500–4000
Total 82–156 37750–66000 4200–5050
5.2. The role of the private sector and enterprises
Heating supply expenses will be incurred by the buildings' owners, but the financial support lent by the city is also essential. Today, the city subsidy
for the issuing of an energy performance certificate amounts to 1,500 kroons, and KredEx company lends support to the execution of energy audist and
the drawing-up of plans for renovation projects, as well as providing low-interest loans for the execution of renovation works. All these factors form
favourable terms for the renovation of buildings and enhancing an energy-saving environment.
Expenses for the implementation of new technical solutions, such as heat pumps and solar energy are mainly incurred by the owner of a system or a
building, i.e., a house owner (in case of a housing association) or the owner of an enterprise.
Elering OÜ and Eesti Energia Jaotusvõrk OÜ handle the major part of the development of electricity supply to the city. Elering OÜ and Eesti Energia
Jaotusvõrk OÜ finance this activity from their budget on account of the saved electric power. Today, it is planned to allocate 100-200 million kroons
annually for the renovation of electric power supply systems in the Tallinn area. Much depends on new consumers, i.e., new consumers are to finance
their housing associations from their own budgetary means.
Investment in large-scale technical developments, such as the construction of new power and heating plants, waste-to-energy plants and the renovation
of district heating networks amounts to billions of kroons, and will be borne by those enterprises that are connected with the corresponding field. The
city of Tallinn also has a significant share in this respect. The City Council members could advise AS Tallinna Küte and AS Tallinna Vesi of their
position in regard to passing the resolutions necessary to fulfill energy saving projects.

106
Tallinn Environmental Department is in charge of waste management. It is necessary to pass resolutions in regard to waste management development
within the Tallinn area and its neighbourhood, i.e., where shall Tallinn transfer the generated waste to in the future. It is necessary to resolve the issue
of the use of waste as soon as possible.
The implementation of energy saving measures in the transport sector concern three parties: the first is the fuel supplier, the second is the transport
vehicle manufacturer, and the third is the user of both the supplied fuel and the produced vehicle. Energy can be saved subject to the co-operation of all
three parties.
5.3. Other means
In addition to the budgetary means of the city and investors, energy saving measures are also carried out with the aid of financial support funds. For
instance, the European Regional Development Fund (ERDF) aims to redress regional imbalances and recessions of the European Union Member
States.
One of the measures proposed by the European Regional Development Fund is titled "The wider use of renewable sources of energy to generate
energy,"[47]
and aims to support projects on renewable energy use. Besides, the whole activity is supported by several European Union structural funds,
such as "Improvement of Environmental Infrastructure."
It is possible to apply to EAS for a grant for the implementation of energy saving measures, especially if it is aimed at the development of an enterprise
and the utilisation of new technologies.
6. Results and control of the fulfilment of the Action Plan
The Action Plan for Energy Efficiency cannot be a formal document which is followed by everyone without any further responsibilities. On the basis
of the present Action Plan, Tallinn Environmental Department is to work out the implementation plan for the fulfilment of specific tasks and indicate
the corresponding performers. It is necessary to appoint the relevant structures and officers of the city economy who will be in charge of and take
control of the execution of energy efficiency development programs in specific areas. Deadlines shall also be set for performers to submit reports on
the results achieved.
6.1. Energy consumption
The fulfilment of the Action Plan for Energy Efficiency aims to increase the energy efficiency rate by 20% by the use of current technologies and
enhancing saving consumption habits. It is also necessary to expand the use of environmentally-friendly energy sources. As a result, the share of
renewable energy sources in the energy mix is to comprise 20%, and CO2 emissions are to be reduced by 20% by 2020.

107
The Energy efficiency rate is to improve by 20%. This can be achieved by the implementation of the following vital measures which have also been
mentioned above:
1. the renovation of buildings and decrease in their demand for heating supply to buildings by 23%;
2. the implementation of energy saving electric appliances and lamps in both house-hold and outdoor lighting systems;
3. the renovation of power and district heating networks to reduce network losses;
4. the implementation of energy efficient technologies and new control and regulation systems;
5. raising energy efficiency awareness and the enhancement of energy saving consumption habits.
Tallinn's energy production and consumption is experiencing significant structural changes, as indicated in the third part of the present report. The most
noticeable changes are the following:
1. the introduction of Tallinn (Väo) Power Plant, which generates electric power and heat from renewable fuel;
2. the incineration of waste in waste-to-energy plant to generate electricity and heat that is further used in Tallinn;
3. the share of biofuel in the transport sector is to amount to 10%;
4. wider use of new energy sources, such as heat pumps and solar energy.
Tallinn has increased the share of renewable fuel in heat and power generation process, so reducing the volume of purchased energy. In addition,
energy is going to be produced in new energy enterprises such as Tallinn Power Plant and waste-to-energy plant. All these factors contribute to the
changes in Tallinn's energy consumption structure (see table 17 "Energy consumption (GWh);" and Annexes 1 and 2).
Table 17. Energy consumption (GWh)
2007 2020 Difference
GWh % GWh % GWh %
Fuel consumption 7118 70,5 7509 78,4 391 5,5
incl. renewable fuel 582 8,2 2704 36,0 2122 364
incl. fossil fuel 6535 91,8 4804 64,0 –1731 –26,5
Purchased heat 986 9,8 400 4,2 –586 –59,5

108
Purchased electricity 1994 19,7 1670 17,4 –324 –16,2
Total 10098 9579 –519 –5,1
In Tallinn 2020, general energy consumption is going to reduce by 519GWh or 5.1% as compared to the year 2007. The share of purchased heat and
electric power will also reduce, as Tallinn is to produce 16% of the required amount of electricity in its own power plant.
In Tallinn 2020, general fuel consumption is to increase by 391GWh or 5.5% as compared to the year 2007, which is related to the potential
establishment of new power plant and waste-to-energy plant based on renewable fuel. At the same time, the use of fossil fuel is to decrease by 12.7%.
It is very important that the use of renewable fuel is going to be increase 3 1/2 times. If in 2007 the share of renewable energy comprised only 8,2%,
then in 2020 it will amount to more than 36% of total fuel consumption.
6.2. CO2 emissions reduction
Expansion of the use of renewable energy contributes to the reduction in CO2 emissions which is released upon the combustion of fuel by 369 thousand
tons or 23.9% (see Annex 3). It is essential to reduce CO2 emissions in the power industry, while its share in the transport sector is to decrease by 10%.
Due to the reduction in indirect CO2 emissions which result from purchased electric power and heat, its total amount will decrease by 49.7%, which is
twice as much. In this respect it is important to expand the use of renewable energy in the production of electric power over all Estonia. In 2020, there
will be no more old pulverised firing boilers in Narva Power Plant blocks. In Narva, Electricity will be produced in new fluidised bed technology energy
blocks, by wind turbine generator systems, and in balancing and peak load power plants.
Indirect CO2 emissions can be dramatically reduced by the expansion of renewable energy use in the production of electricity in Estonia.
6.3. Control over the fulfilment of the Action Plan
According to the structure of the city government, the fulfilment of energy efficiency tasks has been divided between the city government, the district
governments, and six departments, i.e., the Environmental Department, the Municipal Services Department, the Enterprise Department, the City
Planning Department, the City Property Department, and the Transport Department, which makes it difficult to monitor the full execution of energy
efficiency development programmes.
In order to organise the energy policy and develop an efficient energy economy in the city of Tallinn, it is necessary to appoint energy departments that
would manage corresponding works and monitor whether the obligations undertaken have been performed. If the City Government follows the
economy regime strictly, it may put restraints on the formation of new departments. In this case, the city at least needs to appoint a specialist who

109
would co-ordinate activities directly connected with the whole urban energy economy. Such a specialist shall have both a good command of the subject
and the authority to monitor the fulfilment of the development programmes.
From time to time, it makes sense to involve unbiased specialists, such as consulting firms, who would assess the works done and set goals for
subsequent activities.
In order to keep the fulfilment of the Action Plan under control, it is necessary to establish a committee among the departments to monitor and control
the execution of the saving energy economy action plan. A committee shall consist of representatives of all concerned departments, as well as outside
specialists. Such a committee shall be accountable to one of the deputy mayors.
7. Risks related to the accomplishment of the set objectives
7.1. Financial risks
Financial risks may result from the changes in political or development priorities within the framework of drawing up a budget for each following year.
These risks could be reduced by the regular substantiation of costs and profit arising from the fulfilment of a development programme, a continuous
submission of data on energy consumption fluctuation, and the analysis of statistical reports on energy consumption, as well as by the disclosure and
explanation of the investigations' results.
From time to time, the Action Plan is to be reviewed in order to estimate the real volume of the work performed `in both natural and monetary value.
The financial support of further action plans shall be lent to those measures that have been recognised as the most energy efficient ones.
7.2. Administrative risks
Administrative risks may result from a failure to reach full co-operation between the network of the action plan performers, its administrative
management (the City Government officers, the Departments), and management bodies (i.e., actual work performers, such as urban facilities, private
enterprises, population), where, in other words, the co-operation between the responsible parties is insufficient or there is no co-operation at all.
Administrative risks may also include changes in the City Government structure and in the number of specialists responsible for a particular field.
Such risks could be reduced by the institution of a inter-local coalition of the City Government which would consist of the representatives of the City
Government and separate departments. This would significantly reduce the impact of both potential changes in the structural management and any
replacements of the relevant specialists.

110
7.3. Political risks
Political risks may result from any political wilful changes in the City Council and the City Government, or from a deterioration in the confidence of
society in the state which may put restraints on the development of democracy. Political wilful changes may arise from amendments in the priorities of
the City Government or the Council, changes in the City Government structure, or any re-organisations in the political parties. A slowdown in the
development of democracy may arise from a shift in the priorities of the Government of the Estonian Republic, which may lead to the growth of social
inequality in all spheres.
In order to reduce these risks those carrying out development programmes shall keep politicians regularly informed about the current process of works,
and maintain the attention and interest of the public in the whole programme. In case there are any changes in political leadership, those carrying out
development programmes shall inform the new leaders about the whole subject, the current work process, and about all corresponding difficulties they
have encountered so far.
7.4. Risks related to the communication means
Risks related to communication means may result from an insufficient and purposeless information flow. Information failure may also arise when a
person dealing with data disclosure is poorly informed about the subject or has a lack of the required qualifications.
These risks could be avoided by drawing up a specific communication strategy, and the establishment and maintenance of a permanent feedback
system. It is also essential to keep all relevant departments, specialists and society informed about the progress of the action plan.
7.5. Social risks
Social risks may result from any problems in relationships between those carrying out the action plan, i.e., between individuals, groups or
organisations. Social risks are further aggravated when team members do not have well-directed guidelines and tasks for the fulfilment of an energy
efficiency action plan. The distribution of work tasks must be based on a member's qualifications in a revelant subject.
In order to reduce social risks it makes sense to convene regular meetings, debates, roundtable discussions, and to involve all participants in decision
making procedure, listen to their reports and proposals, and consider their opinions. It is important to direct a team towards the achievement of a shared
objective, and to implement team work on a regular basis.
7.6. Risks coming from motivation
Risks related to motivation may result from low salary rates of those carrying out an action plan, poor estimation of achieved results or insufficient
managerial recognition for work performed. It has to be taken into consideration that those individuals who are responsible for the execution of the
specific tasks of a development programme have enough qualifications in the relevant sphere, and are materially motivated.

111
In order to reduce such risks, participants should be involved in the managerial process, sufficient recognition for work performed from the
departments, the City Government, and organisation supervisors ensured, and this system maintained on a regular basis.
7.7. Risks related to the qualification
The fulfilment of the Action Plan may face certain difficulties arising from poorly qualified workers. Those individuals who are responsible for the
execution of the specific tasks of a development programme must have a sufficient level of qualification to accomplish the set targets.
In order to reduce such risks, the required employees must be selected on a competitive basis in order to gauge the professional skills of a candidate,
and to establish and maintain advanced training system on a regular basis. Employees shall be provided with further vocational training in case some
more complicated work is added to their regular duties.
7.8. Economic crisis
There are some risks related to the economic crisis, however they belong to the category titled force majeure, and must be resolved with the
implementation of emergency measures. At the same time, it is necessary to find some positive aspects of the economic crisis. Indeed, severe economic
conditions lead to a budgetary shortfall, but this situation is just the right time in which to save all possible costs. The current financial crisis led to a
reduction of prices for construction materials and expenditure; labour power has also become cheaper as compared to previous years.
It is impossible to prevent general economic crisis at the local level, however, it is reasonable to maximise the use of all its ensuing consequences.
8. Recommendations for the achievement of the Action Plan
What can be done to accomplish the set 20-20-20 task, i.e., to increase energy efficiency by 20%, to ensure a 20% share of renewable energy sources in
the energy mix, and to reduce CO2 emissions by 20% by 2020? In addition to the large amount of investment to be made, it is also important to ensure
the changing of the consumption habits of residents, as well as the promotion and development of energy-efficient behaviour.
Recommendations for the fulfilment of the development programme of the energy-saving energy economy have been mentioned in the previous
chapters. It is essential to ensure the accomplishment of the aimed target, i.e., to increase energy efficiency by 20%, to ensure 20% share of renewable
energy sources in the energy mix, and to reduce CO2 emissions by 20% by 2020. All planned activities and the list of the appointed participants in
regard to the fulfilment of the present Action Plan are indicated in Annex 6.
The accomplishment of the set tasks is feasible. Amid the current financial crisis, which requires the implementation of energy saving measures in each
and every sphere, we have to start with small-scale tasks.

112
It is very important to establish the appropriate energy-efficient behaviour of the consumers, i.e., of individual consumers, housing associations and
enterprises, as well as of the whole city. Each consumer can save up to 10-20% of electricity by undertaking energy-saving and rational activities. The
renovation of apartment houses will ensure sufficient heat-insulation and reduce costs for those buildings heating by up to 30%. All these opportunities
are to be introduced to consumers through the organisation of energy efficient days and advertising campaigns.
The second important guideline involves the disclosure of information of those enterprises dealing with urban energy supply issues; it is also essential
to provide these enterprises with the support needed. Thus, Eesti Energia AS cannot operate the urban electric power supply without the co-operation
due of consumers, i.e., residents and enterprises. The City Government is to provide due guidance in the deliberate and energy-saving improvement of
the district heating network.
It is important to use all available energy sources. This is perfectly exemplified by the construction and commissioning of the Tallinn (Väo) Power
Plant based on renewable fuel. The plant produces 20-25% of the heat transmitted to Tallinn's district heating networks and 8-10% of the electricity
consumed in the city.
The implementation of all these small and large-scale measures allows Tallinn to fulfil the set 20-20-20 obligation by 2020.
9. Conclusions and proposals
1. Tallinn has joined the Covenant of Mayors and undertook the liability to reduce its CO2 emissions by 20%, as a result of 20% increase in
energy efficiency and a 20% share of renewable energy sources in the energy mix by 2020.
2. The preparation of the present Action Plan has been based on international regulatory documents, and on the legal acts of the Republic of
Estonia and the city of Tallinn which handle the production, consumption, and saving of energy.
3. The Action Plan provides a detailed analysis of energy production and consumption in Tallinn both by various industries and the city's
inhabitants.
4. The Action Plan provides a range of opportunities for the accomplishment of the set energy-saving task, i.e., how to enhance energy-efficient
consumption, increase the share of renewable fuel in energy supply process, and reduce the amount of CO2 emissions into the atmosphere.
5. It is important to change the urban energy consumption structure. It is necessary to involve new cogeneration technologies, the use of
renewable fuel, and waste and waste residual heat in the energy economy processes, especially in energy supply to the city.
6. To ensure a continuous improvement of the urban district heating and its networks as environmentally friendly modes of production.
7. The most significant energy-saving opportunity consists in the reduction of the demand for heating buildings. The insulation of buildings will
enable the reduction of costs for their heating by up to 30%.

113
8. As for the transport sector, special attention must be paid to the development of the urban transport systems, and an increase in the share of
biofuel by at least 10% in both public and private transport.
9. It is important to raise awareness of all residents in regard to energy-efficient opportunities through the organisation of energy efficient days
and advertising campaigns.
10. All entrepreneurs must be informed about the set energy-saving tasks, and it is necessary to ensure that each and every entrepreneur works
diligently at the implementation of energy-efficient measures in every enterprise.
11. The City Government and the city Departments have an essential role in the organisation of energy saving measures and the supervision of
works performance.
12. The implementation of all organisational and technical opportunities, as well as the co-operation between the City Government, private
enterprises, and other units will allow the accomplishment of the set energy-saving task by 2020, reduce the level of air pollution, as well as
reach and even exceed the set 20-20-20 target.
10. List of references
1. Tallinn in numbers. Statistics Annual Data Collection. Tallinn 2007.
2. Tallinn. 2007 Annual Report
3. Strategy „Tallinn 2025“
4. Development Plan of Tallinn 2009–2027
5. Development Plan of Tallinn outdoor lighting 2006–2015]
6. Road lighting standards of the city of Tallinn
7. Development Plan of Tallinn public water and sewerage 2004–2015
8. AS Tallinna Vesi Annual Records 2007
9. Transport Development Plan 2006-2013
10. Development trends of traffic in Tallinn 2005–2014
11. Development strategy for Tallinn's mobility environment 2007–2035
12. Development trends of Tallinn highway network 2005-2014
13. Annual Reports of the Estonian Motor Vehicle Registration Centre 2007

114
14. Tallinn waste management plan 2006–2011
15. Development Plan of outside environmental noise reduction in Tallinn
16. Tallinn Tree-Planting Development Programme (the City Council regulation nr 17 as of March 3, 2005)
17. Tallinn General Planning http://tlpa.tallinn.ee/?id=9
18. Long-term Energy Sector Development for Tallinn city (2002–2017); Tallinn University of Technology 2002.
19. National Development Plan of the Energy Sector until 2020
20. Estonian Development Plan of the Electricity Sector until 2018
21. Energy Conservation Target Programme 2007–2013
22. Estonian Energy Industry in numbers 2007
23. Covenant of Mayors, EU 2007
24. Action plan for energy efficiency 2007–2012
25. Directive 2002/91/EC on the Energy performance of buildings
26. Directive 2001/77/EC on the promotion of electricity produced from renewable energy sources in the internal electricity market
27. Directive 2003/30/EC on the promotion of the use of biofuels or other renewable fuels for transport
28. Directive 2004/8/EC on the promotion of co-generation based heat and electricity production
29. Directive 2006/32/EC on energy end-use efficiency
30. Directive 2009/33/EC on the promotion of clean and energy-efficient road transport vehicles
31. Electricity market law; adopted as of 11.02.2003; published as of RT I 2003, 25, 153
32. District heating network law; adopted as of 11. 02. 2003; published as of RT I 2003, 25, 154
33. Waste management Act; adopted as of 24.01.2004; published as of RT I 2004, 9, 52
34. Packaging Act; adopted as of 21.04.2004; published as of RT I 2004, 41, 287
35. The Environmental Supervision Act; adopted as of 06.06.2001; published as of RT I 2001, 56, 337
36. The Environment Charges Act; adopted as of 07.12.2005; published as of RT I 2002, 67, 512
115
37. The Building Act, adopted as of 15.05.2002; published as of RT I 2002, 47, 297
38. The National waste management plan 2008–2013
39. Requirements for efficient co-generation; MKM 03.05.2007, regulation nr 30
40. Energy performance certificate and the procedure for issuance; MKM 17.12.2008, regulation nr 107
41. The Energy Efficiency of Equipment Act
42. Minimum energy efficiency requirements; the regulation of the Government of the Republic of Estonia as of 20.12.2007
43. The wider use of renewable sources of energy to generate energy; the regulation nr 14 of the Ministry of Environment as of 24.03.2009
44. Sustainable Energy Scenarios; Energy Perspectives for the Baltic Sea Region
45. Statistical Department http://www.stat.ee/
46. Tallinna Küte AS http://www.soojus.ee/kyte/index.php
47. Eraküte AS http://www.erakyte.ee/www/
48. Fortum Termest AS http://www.fortumtermest.ee/
49. OÜ Iru Power Plant http://www.iruenergia.ee/
50. OÜ Tallinn Power Plant (Väo) http://www.elektrijaam.ee/
51. Tallinn Bus Company Ltd. http://www.tak.ee/
52. Tallinn Harbour Ltd. http://www.ts.ee/
53. Tallinna Prügila AS http://www.landfill.ee/
54. Nõmme-Harku pathway http://www.sportkeskus.ee/index.php?page=70
55. Pirita pathway http://www.piritaspordikeskus.ee/?page_id=17
56. Construction condition of large-panel apartment buildings in the housing stock of Estonia and their forecast lifespan, Tallinn University of
Technology, 2009
57. Renewable energy sources and their usage in Tallinn, Tallinn University of Technology, 2007
58. Internal condition inspection of the schools in Tallinn, Tallinn University of Technology, 2007
59. Transport infrastructure and land use planning, Tiit Metsvahi, Tallinn, Tallinn University of Technology

116
60. Tallinn district heating network areas; regulation nr 19 of Tallinn City Council as of May 27, 2004
61. Tallinn's CO2 Gas Emissions Inventory, ÅF-Estivo, Tallinn 2009
62. The green book on energy efficiency, or doing more with less. The European Commission 2005.
63. SNiP II-3-79 “Heat engineering.”
64. Fiscal incentives and other control instruments for creating a sustainable energy system on a local level
65. Summary Results of Interviews on energy efficiency in building. Ahto Oja 2008
66. Overcoming non-technical barriers in the building sector. Ahto Oja 2008
67. Smart energy-Europe; Catalogue of the best energy solutions.
68. Report on possibilities for more sustainable energy use in Tallinn
69. Survey of sustainable development 2006; City report; Union of the Baltic Cities
70. Sustainable energy partnerships and energy action plans; Tallinn, Dublin, Malmö
71. Sustainable Estonia 21; Estonian National Strategy on Sustainable Development.
11. Annexes
1. ANNEX 1. Fuel and energy consumption in Tallinn 2007.
2. ANNEX 2. Outlook for fuel and energy consumption in Tallinn 2020.
3. ANNEX 3. Fuel and energy consumption in Tallinn 2007 and outlook for 2020.
4. ANNEX 4. CO2 emissions in Tallinn 2007 and outlook for 2020.
5. ANNEX 5. Tallinn CO2 balance scheme for 2020.
6. ANNEX 6. Tallinn's Action Plan for Energy Efficiency 2010–2020

117
ANNEX 1. Fuel and energy consumption in Tallinn 2007
Fuel Unit Energy
generation
Industry
and
construction
Business
and
service
Household Transport Total
demand
Heating
value
Energy
(GWh)
Consumption
share (%)
Coal th t 1 7 8 7,5 60 0,6
Peat th t 0 2,5 0 0,0
Peat briquette th t 4 4 4,4 18 0,2
Wood fuel th solid
cubic meter 2 10 130 142 2,1 298 3,0
Wood chip and pellet th solid
cubic meter 50 6 100 156 1,7 268 2,7
Natural gas mln m³ 165 34 31 28 258 9,3 2407 23,8
Liquid gas th t 1 2 3 12,7 38 0,4
Biogas mln m³ 3 3 5,3 16 0,2
Shale oil th t 1 1 1 3 10,9 33 0,3
Light fuel oil th t 2 6 1 4 20 33 11,8 389 3,9
Diesel fuel oil th t 13 6 16 139 174 11,8 2053 20,3
Petrol th t 77 49 126 12,2 1537 15,2
Biofuel in transport
sector th t 0 10,3 0 0,0
Waste th t 0 2,9 0 0,0
Purchased electricity GWh 24 753 726 466 25 1994 1994 19,7
Purchased heat GWh 89 167 730 986 986 9,8
Total energy GWh 1684 1422 1320 3173 2499 10098 10098 100,0
Total purchased
energy GWh 24 842 893 1196 25 2980 2980 29,5
Total renewable fuels GWh 86 15 37 445 582 582 8,2
Total fossil fuels GWh 1574 565 390 1532 2474 6535 6535 91,8
Total fuels GWh 1660 580 427 1977 2474 7118 7118 70,5

118
ANNEX 2. Outlook for fuel and energy consumption in Tallinn 2020.
Fuel Unit Energy
generation
Industry
and
constructi
on
Business
and
service
Household Transport Total
demand
Heating
value
Energy
(GWh)
Consumption share
(%)
Coal th t 1 1 1 3 7,5 23 0,2
Peat th t 30 30 2,5 75 0,8
Peat briquette th t 2 2 4,4 9 0,1
Wood fuel th solid cubic
meter 2 10 90 102 2,1 214 2,2
Wood chip and pellet th solid cubic
meter 850 6
4
0 896 1,7 1523 15,9
Natural gas mln m³ 50 26 24 20 120 9,3 1120 11,7
Liquid gas th t 1 2 3 12,7 38 0,4
Biogas mln m³ 3 2 5 5,3 27 0,3
Shale oil th t 1 1 1 3 10,9 33 0,3
Light fuel oil th t 1 1 1 2 18 23 11,8 271 2,8
Diesel fuel oil th t 11 5 141 157 11,8 1853 19,3
Petrol th t 113 113 12,2 1383 14,4
Biofuel in transport
sector th t 35 35 10,3 361 3,8
Waste th t 200 200 2,9 580 6,1
Purchased electricity GWh 16 635 619 384 16 1670 1670 17,4
Purchased heat GWh 36 68 296 400 400 4,2
Total energy GWh 2621 1101 1032 1189 3636 9579 9579 100,0
Total purchased energy GWh 16 671 687 680 16 2070 2070 21,6
Total renewable fuels GWh 2041 14 32 257 361 2704 2704 36,0
Total fossil fuels GWh 564 415 313 252 3260 4804 4804 64,0
Total fuels GWh 2605 430 345 509 3620 7509 7509 78,3

119
ANNEX 3. Fuel and energy consumption in Tallinn 2007 and outlook for 2020.
Fuel Unit
2007 2020 Difference
Total
demand
Energy
(GWh) Consumption
share (%)
Total
demand
Energy
(GWh)
Consumption
share (%)
th t th
solid
mln m³
Energy
(GWh)
Change
(%)
Coal th t 8 60 0,6 3 23 0,2 –5 –38 –62,5
Peat th t 0 0 0,0 30 75 0,8 30 75
Peat briquette th t 4 18 0,2 2 9 0,1 –2 –9 –50,0
Wood fuel th solid cubic
meter 142 298 3,0 102 214 2,2 –40 –84 –28,2
Wood chip and pellet th solid cubic
meter 156 268 2,7 896 1523 15,9 740 1255 467,7
Natural gas mln m³ 258 2407 23,8 120 1120 11,7 –138 –1288 –53,5
Liquid gas th t 3 38 0,4 3 38 0,4 0 0 0,0
Biogas mln m³ 3 16 0,2 5 27 0,3 2 11 66,7
Shale oil th t 3 33 0,3 3 33 0,3 0 0 0,0
Light fuel oil th t 33 389 3,9 23 271 2,8 –10 –118 –30,3
Diesel fuel oil th t 174 2053 20,3 157 1853 19,3 –17 –201 –9,8
Petrol th t 126 1537 15,2 113 1383 14 –13 –154 –10,0
Biofuel in transport sector th t 0 0 0,0 35 361 3,8 35 361
Waste th t 0 0 0,0 200 580 6,1 200 580
Purchased electricity GWh 1994 1994 19,7 1670 1670 17,4 –324 –324 –16,2
Purchased heat GWh 986 986 9,8 400 400 4,2 –586 –586 –59,4
Total energy GWh 10098 10098 100,0 9579 9579 100,0 –519 –519 –5,1
Total purchased energy GWh 2980 2980 29,5 2070 2070 21,6 –910 –910 –30,5
Total renewable fuels GWh 582 582 8,2 2704 2704 36,0 2122 2122 364,3
Total fossil fuels GWh 6535 6535 91,8 4804 4804 64,0 –1731 –1731 –26,5
Total fuels GWh 7118 7118 70,5 7509 7509 78,3 391 391 5,5

120
ANNEX 4. CO2 emissions in Tallinn 2007 and outlook for 2020
Kütus Unit Energy
generation
Industry
and
construction
Business
and
service
H
ousehold Transport
Total
CO2 in
2020
Total
CO2 in
2007
Difference
(Gg)
Difference
(%)
Coal Gg 2,6 2,6 2,6 7,8 21,6 –13,8 –63,9
Peat Gg 28,8 28,8 28,8
Peat briquette Gg 3,4 3,4 6,8 –3,4 –50,0
Wood fuel Gg 1,6 8,1 73,1 82,8 115,3 –32,5 –28,2
Wood chip and pellet Gg 565,5 4,0 26,6 596,1 103,8 492,3 474,4
Natural gas Gg 93,8 48,8 45,0 37,5 225,1 484,4 –259,3 –53,5
Liquid gas Gg 2,8 5,7 8,5 8,5 0 0,0
Biogas Gg 3,2 2,2 5,4 3,2 2,16 66,7
Shale oil Gg 3,0 3,0 3,0 9,0 9,0 0 0,0
Light fuel oil Gg 3,1 3,1 3,1 6,2 56,1 71,6 102,3 –30,7 –30,0
Diesel fuel oil Gg 34,1 15,5 437 486,5 539,2 –52,7 –9,8
Petrol Gg 341,1 341,1 380,4 –39,3 –10,3
Biofuel in transport sector Gg 94,0 94,0 94,0
Waste Gg 235,2 235,2 235,2
Purchased electricity Gg 8,5 336,5 328,1 203,5 8,5 885,1 2512,4 –1627,3 –64,8
Purchased heat Gg 8,1 15,3 66,6 90,0 222,0 –132 –59,5
Total purchased energy Gg 8,5 344,6 343,4 270,1 8,5 975,1 2734,4 –1759,3 –64,3
Total renewable fuels* Gg 803,9 5,6 10,3 99,7 94,0 1013,5 222,3 791,2 355,9
Total fossil fuels Gg 128,7 94,4 69,2 55,4 834,1 1181,8 1552,2 –370,4 –23,9
Total purchased energy and fossil
fuels Gg 137,2 439,0 412,6 325,5 842,6 2156,9 4286,6 –2129,7 –49,7
*Total amount of CO2 emissions from renewable fuel has not been assessed.

121
ANNEX 5. Tallinn CO2 balance scheme for 2020.

122
ANNEX 6. Tallinn's Action Plan for Energy Efficiency 2010–2020
Activity
Annual production output
(GWh) Period Performer CO2 reduction [t] Notes
1.
Commissioning of
Tallinn Power Plant
based on using wood
chips for fuel
Energy produced from
wood chips will substitute
for heat generated from gas
fuel
2009 OÜ Digismart 492000
2.
Construction of waste-
to-energy plant for
waste incineration in
Tallinn
Up to 310GWh
Substitution of heat
generated from gas fuel
Eesti Energia AS
Iru Power Plant?
235000?
The Iru Power Plant is
located in Maardu; it uses
waste generated in Tallinn as
the main fuel, and transfers
heat to Tallinn's district
heating networks
3.
Use of waste water
residual heat in Tallinn
Paljassaare Sewage
treatment plant
100–120 2012–2015
AS Tallinna Vesi
AS Tallinna Küte
AS Tallinna Soojus
28700–43000
3.
The maximum use of
biogas from
Paljassaare Sewage
treatment plant
2–3 2010–2012 AS Tallinna Vesi 2540–3800
4.
Construction of power
and heating plant
based on landfill
biogas in Tallinn
landfill
15–25
2010–2012
Tallinna Prügila
AS
Tallinn Landfill is located in
Jõelähtme parish, but deposits
waste generated in Tallinn
5. Construction of waste
fuel production line in
Tallinn landfill
40–60 th tons 2010–2012 Tallinna Prügila
AS
Tallinn Landfill is located in
Jõelähtme parish, but deposits
waste generated in Tallinn
6. Construction of waste
fuel production line in
Lasnamäe district
40–60 th tons 2012–2015 Waste treatment
organizations
CO2 reduction is achieved by
waste fuel use

123
7.
Construction of gas
turbine power plant to
supply heat to Tallinn's
district heating
networks
Heat generated by
cogeneration process will
substitute heat generated in
Tallinn gas boiler houses
2015–2018 Private enterprises
AS Tallinna Küte
Wind turbine generation
systems
8.
Construction of local
power and heating
plants next to local
boiler houses and
heating networks
Heat and electricity
cogeneration system 2012–2020
Eesti Energia AS
Fortum Termest
AS
9. Renovation of district
heating network to
reduce heating losses
20–40
2010–2020
AS Tallinna Küte
Fortum Termest
AS
5000–10000
10.
Connection of the
heating networks
between Eastern and
Western districts in
Tallinn
Contributes to the efficient
performance of heat
producers
2012–2015 AS Tallinna Küte
11.
Energy audits,
thermographic
investigations, and
energy performance
certificates
Contributes to buildings
heat-insulation 2010–2020 Buildings' owners
12.
Buildings renovation
and heat-insulation 200–300 2010–2020 Buildings' owners
57400–86100
13. Construction of
buildings of high
thermal resistance
50–100 2010–2020
House builders
14350–28700
14. Wider use of heat
pumps in heat supply
to buildings
60–100
2010–2020
House builders and
owners
8600–14300
15. Use of solar energy in Buildings' owners

124
hot water and
electricity supply
2–5 2010–2020 2500–6300
16. Use of energy-efficient
technologies in
production process
50–100 2010–2020
Enterprises and
manufacturers 38700–77400
17.
Gas emissions
reduction upon
electricity generation
in Estonia and
reduction of Tallinn's
indirect gas emissions
2010–2020
Eesti Energia AS
and other
electricity
producers 1627000
With due account for
structural changes in
electricity production in
compliance with the
Development Plan of the
Electricity Sector
18.
Renovation of Elering
OÜ tie-stations and
power lines
20–30 2010–2020
Elering OÜ
10600–16000
19.
Renovation of
distribution networks
and medium voltage
substations
30–50 2010–2050
Eesti Energia
Jaotusvõrk OÜ and
customers 16000–26500
20. Use of energy-saving
lamps in outdoor
lighting
4–5 2010–2020
Tallinn Municipal
Services
Department
5000–6000
21. Further development
of outdoor lighting
control systems
2–3 2010–2050
Tallinn Municipal
Services
Department
2500–3750
22. Use of energy-saving
lamps in house holding
and enterprises
50–100 2010–2015 Consumer 63000–126000
23. Use of fuel-efficient
cars 200–300 2010–2015
Motorcar
companies and
owner-drivers
53000–80000
24 Use of biofuel as the 340 2010–2020 Petrol stations and 90000

125
main transport fuel owner-drivers
25. Use of biofuel in urban
transport
10–20 2010–2020
The city's public
transportation
enterprises
2500–5000
26.
Development of the
tram line in Lasnamäe
district
5–10 2010–2015 Tallinn Transport
Department 1500–3000
27.
Use of electric home
appliances and devices
of low energy demand
50–100
2010–2015
Consumers
63000–126000
28.
Formation of energy-
efficient consumption
habits
50–100 2010–2020 Consumers 40000–80000
29.
Organisation of
energy efficient days
Contributes to changing of
consumption habits 2010–2020
Tallinn City
Government
30.
Training for energy
consumers in regard to
the implementation of
energy-saving
manufacturing
Contributes to the
implementation of energy-
saving technologies
2010–2020
Tallinn City
Government,
several
departments
Total 1920–2500 GWh 2840–3220
th t
Notes
1. The intended measures ensure energy savings of 19–24.5%, securing the 20% increase in energy efficiency as stipulated by the Covenant of Mayors.
Part of the saved energy is further used in the development of industry and the city economy.
2. In Tallinn, the implementation of energy saving measures secures the reduction of CO2 emissions by at least 20%. The reduction of additional
indirect CO2 emissions is achieved by changing the electric power production structure in accordance with the Development Plan of the Estonian

126
Electricity Sector. The reduction of additional indirect CO2 emissions into the atmosphere will be achieved as a result of efficient electricity
consumption in Tallinn.
CONTENTS
INTRODUCTION ................................................................................................................................................................................................................. 2
1 Plan objectives and procedure ............................................................................................................................................................................................. 5
1.1 Plan procedure.............................................................................................................................................................................................................. 5
1.2 Plan framework ............................................................................................................................................................................................................ 5
1.3 Covenant of Mayors ..................................................................................................................................................................................................... 6
2 Situation Analysis ............................................................................................................................................................................................................... 7
2.1 Energy generation and consumption ............................................................................................................................................................................ 7
2.1.1. Consumption of power-generating fuel ............................................................................................................................................................... 7
2.1.2. Electricity consumption ..................................................................................................................................................................................... 10
2.1.3. General energy consumption ............................................................................................................................................................................. 12
2.2. Heat economy ........................................................................................................................................................................................................... 13
2.2.1. AS Tallinna Küte ............................................................................................................................................................................................... 14
2.2.2. AS Eraküte ......................................................................................................................................................................................................... 16
2.2.3. Fortum Termest AS ............................................................................................................................................................................................ 17
2.2.4. Other heat producers .......................................................................................................................................................................................... 19
2.3. Transport and traffic .................................................................................................................................................................................................. 20
2.3.1. Motor vehicles.................................................................................................................................................................................................... 21
2.3.2. Railway transport ............................................................................................................................................................................................... 22
2.3.3. Sea traffic ........................................................................................................................................................................................................... 23

127
2.3.4. Fuel consumed in the transport sector................................................................................................................................................................ 23
2.4. Street lighting ............................................................................................................................................................................................................ 25
2.5. Water industry ........................................................................................................................................................................................................... 27
2.6.1. The composition of household waste ................................................................................................................................................................. 32
2.8. Elements of urban design .......................................................................................................................................................................................... 36
2.8.1. Park lighting ....................................................................................................................................................................................................... 37
2.8.2. Lighting of the Old town .................................................................................................................................................................................... 37
2.8.4. Promenades and easy way roads ........................................................................................................................................................................ 38
2.9. Use of land ................................................................................................................................................................................................................ 38
2.9.1. Green field areas ................................................................................................................................................................................................ 40
2.9.2. Use of transport area .......................................................................................................................................................................................... 40
2.9.3. Absorption of CO2 emissions in Tallinn ............................................................................................................................................................. 41
2.10. Consumption habits................................................................................................................................................................................................. 41
3 The activity concept, strategic options, and necessary measures ............................................................................................................................... 43
3.1 Energy production and use ......................................................................................................................................................................................... 43
3.1.1. Power-generating fuel consumption .................................................................................................................................................................. 43
3.1.2. Electric power generation, transmission, and consumption ............................................................................................................................... 47
3.1.2.1. Electric power supply in Tallinn ..................................................................................................................................................................... 47
3.2.1. Tallinn (Väo) Power Plant ................................................................................................................................................................................. 55
3.2.4. Use of wastewater residual heat ......................................................................................................................................................................... 57
3.2.6. Heat supply from the combined cycle gas turbine power plant ......................................................................................................................... 60
3.2.8. Other heat producers .......................................................................................................................................................................................... 61
3.3.1. Scenarios in the development of the transport system until 2035 ...................................................................................................................... 66
3.7. Housing construction ................................................................................................................................................................................................ 80
3.7.1. Energy audit ....................................................................................................................................................................................................... 81

128
3.7.2. Energy passport .................................................................................................................................................................................................. 82
3.7.3. Requirements for heat supply in dwellings ........................................................................................................................................................ 84
3.7.4. Energy-saving opportunities in the residential sector ........................................................................................................................................ 85
3.7.5. Renovation of facades ........................................................................................................................................................................................ 86
3.8. Elements of urban design .......................................................................................................................................................................................... 88
3.8.1. Park lighting ....................................................................................................................................................................................................... 88
3.8.2. Lighting of the Old town .................................................................................................................................................................................... 88
3.8.3. Monuments and memorials ................................................................................................................................................................................ 89
3.8.4. Promenades and easy way roads ........................................................................................................................................................................ 89
3.9. Use of land ................................................................................................................................................................................................................ 90
3.9.1. General development trends in the use of land .................................................................................................................................................. 90
3.9.2 Use of transport area ........................................................................................................................................................................................... 90
4. Action Plan for Energy Efficiency for the next three years ....................................................................................................................................... 94
4.1. Organisational energy efficiency measures .............................................................................................................................................................. 95
4.1.1. Organisation of energy efficient days ................................................................................................................................................................ 95
4.1.2. Training for entrepreneurs ................................................................................................................................................................................. 96
4.1.3. Energy saving in every enterprise ...................................................................................................................................................................... 96
4.1.4. Indication of energy efficiency measures in every development programme ................................................................................................... 97
4.1.5. Co-operation between departments .................................................................................................................................................................... 97
4.1.6. Parties responsible for energy saving................................................................................................................................................................. 97
4.2. Energy saving measures in the electricity sector .................................................................................................................................................. 97
4.2.1. Replacement of outdoor lights with new and energy-saving ones ..................................................................................................................... 98
4.2.2. Use of energy-saving lamps both by private consumers and entrepreneurs ...................................................................................................... 98
4.2.3. Further advancement of outdoor lighting control systems................................................................................................................................. 98
4.2.4. Renovation of Elering OÜ tie-stations and trunk lines ...................................................................................................................................... 99

129
4.2.5. Renovation and modernisation of the city's distribution networks .................................................................................................................... 99
4.3. Heat supply to buildings ....................................................................................................................................................................................... 99
4.3.1. Energy audits, thermographiс investigations and energy performance certificate ............................................................................................ 99
4.3.2. Renovation and insulation of dwellings ........................................................................................................................................................... 100
4.3.3. Construction of dwellings with higher thermal resistance ............................................................................................................................... 100
4.3.4. Expansion of the use of heat pumps................................................................................................................................................................. 100
4.3.5. Use of solar energy .......................................................................................................................................................................................... 100
4.3.6. Renovation of district heating networks .......................................................................................................................................................... 101
4.4. Technical developments ...................................................................................................................................................................................... 101
4.4.1. Tallinn Power Plant .......................................................................................................................................................................................... 101
4.4.2. Organisation of waste management and establishment of waste-to-energy plant ........................................................................................... 102
4.4.3. The maximum use of biogas in the Sewage treatment plant ............................................................................................................................ 102
4.4.4. Renovation of boiler-houses and construction of local power and heating plants........................................................................................... 102
4.4.5. Establishment of biofuel filling stations .......................................................................................................................................................... 102
4.4.6. Public transport development and construction of the tram line in Lasnamäe district .................................................................................... 102
4.5. Conclusion .......................................................................................................................................................................................................... 103
5. Volume of expenditures and investments, and financial resources ....................................................................................................................... 103
5.1. The role of the city .............................................................................................................................................................................................. 103
6. Results and control of the fulfilment of the Action Plan ............................................................................................................................................... 106
6.1. Energy consumption ................................................................................................................................................................................................... 106
6.2. CO2 emissions reduction ......................................................................................................................................................................................... 108
6.3. Control over the fulfilment of the Action Plan ....................................................................................................................................................... 108
7. Risks related to the accomplishment of the set objectives ........................................................................................................................................ 109
7.1. Financial risks ........................................................................................................................................................................................................... 109
7.2. Administrative risks .................................................................................................................................................................................................. 109

130
7.3. Political risks ............................................................................................................................................................................................................. 110
7.4. Risks related to the communication means ............................................................................................................................................................ 110
7.5. Social risks ................................................................................................................................................................................................................. 110
7.6. Risks coming from motivation ................................................................................................................................................................................. 110
7.7. Risks related to the qualification ............................................................................................................................................................................. 111
7.8. Economic crisis .......................................................................................................................................................................................................... 111
8. Recommendations for the achievement of the Action Plan ...................................................................................................................................... 111
9. Conclusions and proposals .......................................................................................................................................................................................... 112
11. Annexes ....................................................................................................................................................................................................................... 116
ANNEX 2. Outlook for fuel and energy consumption in Tallinn 2020. ...................................................................................................................... 118
ANNEX 3. Fuel and energy consumption in Tallinn 2007 and outlook for 2020. ...................................................................................................... 119
ANNEX 4. CO2 emissions in Tallinn 2007 and outlook for 2020 ................................................................................................................................. 120