Embed Size (px)
Citation preview

15/10/2014
1
Energy Efficiency in BuildingActive Design Part II
Presented by: CK Tang
BSEEP Component 4 ManagerVeritas Enviornment Sdn Bhd
Air Conditioning System
System Sizing

15/10/2014
2
Current Industry Practice
• Use rule of thumb to size Air-Conditioning?
– 200 ~ 220 Watt/m2, 80 ~ 90 Btu/ft2
• Use manual spreadsheet?
– Compute solar gain, etc?
• Use a Computer Software
– Trane software
– Carrier E-20
– Etc.
EVAPORATOR
CONDENSER COOLING TOWER
CHW
PUMP
CCW
PUMP
COOLING
COIL
FAN
FILTER
O/A INTAKE
DAMPER
SPILL AIR
DAMPER
RECYCLE
AIR
DAMPER
COMPRESSOR
Space Load
Cooling Coil Load
Chiller Load Heat Rejection Load

15/10/2014
3
Space
Cooling
Load
Cooling
Coil Load
Chiller
Load
Heat
Rejection
Load
1. Internal
Gain
2. External
Gain
3. Fan Power
4. Fresh Air
Intake
5. Duct
Conduction
Heat Gain
6. Chilled Water
Pump Power
7. Pipe
Conduction
Heat Gain
8. Chiller Power
9. Condenser
Water Pump
Power
LOAD
HEAT
Space Cooling Load
Internal Heat Gain

15/10/2014
4
People Heat Gain
Degree of Activity Sensible Heat (W/person)
Latent Heat (W/person)
Seated at theater, night 70 35
Seated, very light work 70 45
Moderately active office work 75 55
Standing, light work; walking (Department store; retail store)
75 55
Bowling 170 255
Taken from Ashrae Fundamentals @ 24°C
Lighting Heat Gain
Type/space
Type of Usage
Max. lighting power
density
W/m2
Offices 15
Supermarkets/ Department
Stores/ Shops 25
Stores/ Warehouses/ Stairs/
Corridors/ Lavatories 10
MS 1525 (2007)
Actual Installed Lighting Power Density to be used!
9.8 W/m2
8.2 W/m2
5.0 W/m2

15/10/2014
5
Equipment Heat Gain
Load Density of
OfficeLoad Factor
W/m²
Descriptions
Light 5.4
Assumes 15.5 m²/workstation (6.5 workstations per 100m²) with
computer and monitor at each plus printer and fax. Computer monitor
and fax diversity 0.67, printer diversity 0.33.
Medium 10.8
Assumes 11.6 m²/workstation (8.5 workstations per 100m²) ²) with
computer and monitor at each plus printer and fax. Computer monitor
and fax diversity 0.75, printer diversity 0.50.
Medium/Heav
y16.1
Assumes 9.3 m²/workstation (11 workstations per 100m²) with
computer and monitor at each plus printer and fax. Computer monitor
and fax diversity 0.75, printer diversity 0.50.
Heavy 21.5
Assumes 7.8 m²/workstation (13 workstations per 100m²) with
computer and monitor at each plus printer and fax. Computer monitor
and fax diversity 1, printer diversity 0.50.
Ashrae Fundamentals
External Heat Gain
Space Cooling Load

15/10/2014
6
Space
Cooling
Load
Cooling
Coil Load
Chiller
Load
Heat
Rejection
Load
1. Internal
Gain
2. External
Gain
3. Fan Power
(blow through)
4. Fresh Air
Intake
5. Duct
Conduction
Heat Gain
6. Chilled Water
Pump Power
7. Pipe
Conduction
Heat Gain
8. Chiller Power
9. Condenser
Water Pump
Power
LOAD
HEAT
Computer Compute
• Solar Gain
• Conduction Gain
• Design Weather DataDescriptions Ashrae design
weather
database v4.0
for KL
MS 1525
Recomme
nded
Test Reference
Year @ peak dry
bulb temperature
Test Reference
Year @ peak
enthalpy
Dry Bulb Temperature (°C) 35.1 33.3 35.6 30.9
Wet Bulb Temperature
(°C)26.3 27.2 25.9 28.4

15/10/2014
7
Building Envelope Properties
• Used actual building properties!
• Ask for the Solar Heat Gain Coefficient of Glazing
• Ask for the U-value of wall and roof.
• Input the Thermal Capacity of material to model thermal mass
• Have faith in Science and in the 1st Law of Thermodynamic.
Infiltration heat gain
• A measured result of 10 government office buildings in 2010 by JKR indicates– Average total fresh air in building is ~ 1 ach. – Measured highest fresh air in building is ~ 2 ach.
• Based on occupant density of 10 m2/person and 4 m of height of office spaces. – ~ 0.5 ach.
• This indicates that on average buildings have an additional infiltration of 0.5 ach.

15/10/2014
8
Exfiltration ~ 0.5 ach
Cooling Coil Load

15/10/2014
9
Space
Cooling
Load
Cooling
Coil
Load
Chiller
Load
Heat
Rejection
Load
1. Internal
Gain
2. External
Gain
3. Fan Power
4. Fresh Air
Intake
5. Duct
Conduction
Heat Gain
6. Chilled Water
Pump Power
7. Pipe
Conduction
Heat Gain
8. Chiller Power
9. Condenser
Water Pump
Power
LOAD
HEAT

15/10/2014
10
Fan Power Heat Gain
• Where
• 𝑊𝑓 = 𝐹𝑎𝑛 𝑃𝑜𝑤𝑒𝑟 (𝑊𝑎𝑡𝑡)
• 𝑄 = 𝑉𝑜𝑙𝑢𝑚𝑒 𝑜𝑓 𝐴𝑖𝑟 𝐹𝑙𝑜𝑤 𝑅𝑎𝑡𝑒 (𝑚3/𝑠)
• ∆𝑃𝑡 = 𝑇𝑜𝑡𝑎𝑙 𝐹𝑎𝑛 𝑃𝑟𝑒𝑠𝑠𝑢𝑟𝑒, (𝑃𝑎)
• 𝜇𝑓 = 𝑇𝑜𝑡𝑎𝑙 𝐹𝑎𝑛 𝐸𝑓𝑓𝑖𝑐𝑖𝑒𝑛𝑐𝑦 (%)
𝑾𝒇 =𝑸 ∆𝑷𝒕𝝁𝒇

15/10/2014
11
Total Fan Pressure
𝛥𝑃𝑡 = 𝑆𝑃𝑑 + 𝑃𝐷𝑎𝑓 + 𝑃𝐷𝑐 + 𝐷𝑝
Where,
• 𝛥𝑃𝑡 = 𝐹𝑎𝑛 𝑇𝑜𝑡𝑎𝑙 𝑃𝑟𝑒𝑠𝑠𝑢𝑟𝑒 (𝑃𝑎)• 𝑆𝑃𝑑 = 𝐷𝑢𝑐𝑡 𝑇𝑜𝑡𝑎𝑙 𝑆𝑡𝑎𝑡𝑖𝑐 𝑃𝑟𝑒𝑠𝑠𝑢𝑟𝑒 (𝑃𝑎)• 𝑃𝐷𝑎𝑓 = 𝑃𝑟𝑒𝑠𝑠𝑢𝑟𝑒 𝐷𝑟𝑜𝑝 𝑖𝑛 𝐴𝑖𝑟 𝐹𝑖𝑙𝑡𝑒𝑟 (𝑃𝑎)
• 𝑃𝐷𝑐 = 𝑃𝑟𝑒𝑠𝑠𝑢𝑟𝑒 𝐷𝑟𝑜𝑝 𝑖𝑛 𝐶𝑜𝑜𝑙𝑖𝑛𝑔 𝐶𝑜𝑖𝑙 (𝑃𝑎)
• 𝐷𝑝 = 𝐷𝑦𝑛𝑎𝑚𝑖𝑐 𝐴𝑖𝑟 𝑃𝑟𝑒𝑠𝑠𝑢𝑟𝑒 =1
2𝜌𝑉2
• 𝜌 = 𝑎𝑖𝑟 𝑑𝑒𝑛𝑠𝑖𝑡𝑦 (1.2 𝑘𝑔/𝑚3)• 𝑉 = 𝑣𝑒𝑙𝑜𝑐𝑖𝑡𝑦 𝑜𝑓 𝑎𝑖𝑟 𝑎𝑡 𝑓𝑎𝑛 𝑒𝑥𝑖𝑡 (𝑚/𝑠)
Total Fan Efficiency
𝑭𝑬𝒕 = 𝑭𝒆𝒙𝑴𝒆𝒙𝑩𝒆
• Where,• 𝐹𝐸𝑡 = 𝐹𝑎𝑛 𝑇𝑜𝑡𝑎𝑙 𝐸𝑓𝑓𝑖𝑐𝑖𝑒𝑛𝑐𝑦 (%)• 𝐹𝑒 = 𝐹𝑎𝑛 𝐸𝑓𝑓𝑖𝑐𝑖𝑒𝑛𝑐𝑦 (%)• 𝑀𝑒 = 𝑀𝑜𝑡𝑜𝑟 𝐸𝑓𝑓𝑖𝑐𝑖𝑒𝑛𝑐𝑦 (%)• 𝐵𝑒 = 𝐹𝑎𝑛 𝐵𝑒𝑙𝑡 & 𝑃𝑢𝑙𝑙𝑒𝑦 𝐸𝑓𝑓𝑖𝑐𝑖𝑒𝑛𝑐𝑦 (%)• Where,• 𝐵𝑒 =100%, 𝑖𝑓 𝑓𝑎𝑛 𝑖𝑠 𝑑𝑖𝑟𝑒𝑐𝑡 𝑑𝑟𝑖𝑣𝑒𝑛 𝑏𝑦 𝑡ℎ𝑒 𝑚𝑜𝑡𝑜𝑟

15/10/2014
12
CONDUCTION HEAT GAIN FROM DUCT
Chiller Load

15/10/2014
13
Space
Cooling
Load
Cooling
Coil Load
Chiller
Load
Heat
Rejection
Load
1. Internal
Gain
2. External
Gain
3. Fan Power
(blow through)
4. Fresh Air
Intake
5. Duct
Conduction
Heat Gain
6. Chilled Water
Pump Power
7. Pipe
Conduction
Heat Gain
8. Chiller Power
9. Condenser
Water Pump
Power
LOAD
HEAT
Chilled Water Pump Power
http://activechilledbeam.com/chilled_beam_questions.asp
Where did the pump energy go to?
~90% of pump energy ends up in water

15/10/2014
14
Pump Power Input parameters
1. Design ΔT (temperature differences) of design supply and return chilled water temperature.
2. Total Pump Efficiency
3. Total Pump Head
H = Pump Head
• A factor of the followings
– Flow Rate (~ fixed by building cooling load & Design ΔT)
– Pipe Size (~ designed by consultants)
– Number and types of bends (~ proposed by contractor)
– Valves and Fittings (~ proposed by contractor/supplier)
– Chiller Heat Exchanger (~ chiller selection)

15/10/2014
15
Chilled Water Pipe Heat Gain
http://www.allredmechanical.com
To be of concern if chilled water pipe is running outdoor.
Heat Rejection Load

15/10/2014
16
Space
Cooling
Load
Cooling
Coil Load
Chiller
Load
Heat
Rejection
Load
1. Internal
Gain
2. External
Gain
3. Fan Power
(blow through)
4. Fresh Air
Intake
5. Duct
Conduction
Heat Gain
6. Chilled Water
Pump Power
7. Pipe
Conduction
Heat Gain
8. Chiller Power
9. Condenser
Water Pump
Power
LOAD
HEAT
Chiller Power consumption
http://engfac.cooper.edu/melody/411
Open Drive or Hermetic Drive.
Open drive has an electric motor that is air cooled by the ambient air.
A hermetic drive has an electric motor that is hermetically sealed and cooled with refrigerant.

15/10/2014
17
Chiller Efficiency
𝐶𝑂𝑃 =𝐶𝑜𝑜𝑙𝑖𝑛𝑔 𝑃𝑟𝑜𝑣𝑖𝑑𝑒𝑑 (𝑘𝑊𝑐𝑜𝑜𝑙𝑖𝑛𝑔)
𝐸𝑙𝑒𝑐𝑡𝑟𝑖𝑐𝑖𝑡𝑦 𝐶𝑜𝑛𝑠𝑢𝑚𝑒𝑑 𝑏𝑦 𝐶ℎ𝑖𝑙𝑙𝑒𝑟 (𝑘𝑊𝑒)
𝑘𝑤 𝑝𝑒𝑟 𝑡𝑜𝑛 =12
𝐶𝑂𝑃 𝑋 3.412
Condenser Pump Power
http://www.alabamapower.com/business/save-money-energy/energy-know-how/chillers/free-cooling.asp
Also take note of direct sunlight heating up the condenser pipe!

15/10/2014
18
Pump Power Input parameters
1. Design ΔT (temperature differences) of design supply and return chilled water temperature.
2. Total Pump Efficiency
3. Total Pump Head
Energy Efficiency 1st Estimates
Simulation Studies Based on an
Office Building Scenario
17 Floors

15/10/2014
19
AIR SIDE Optimization
Energy Efficiency Estimates
Air Side Optimization
6 Items to Optimize
1. AHU Flow Rate (CAV vs. VAV)
2. AHU Total Fan Efficiency
3. AHU Total Pressure Loss
4. Optimal Design Off-coil Temperature
5. Active control of Fresh Air Intake
6. Heat Recovery Wheel and Infiltration Rate
15/10/2014
20
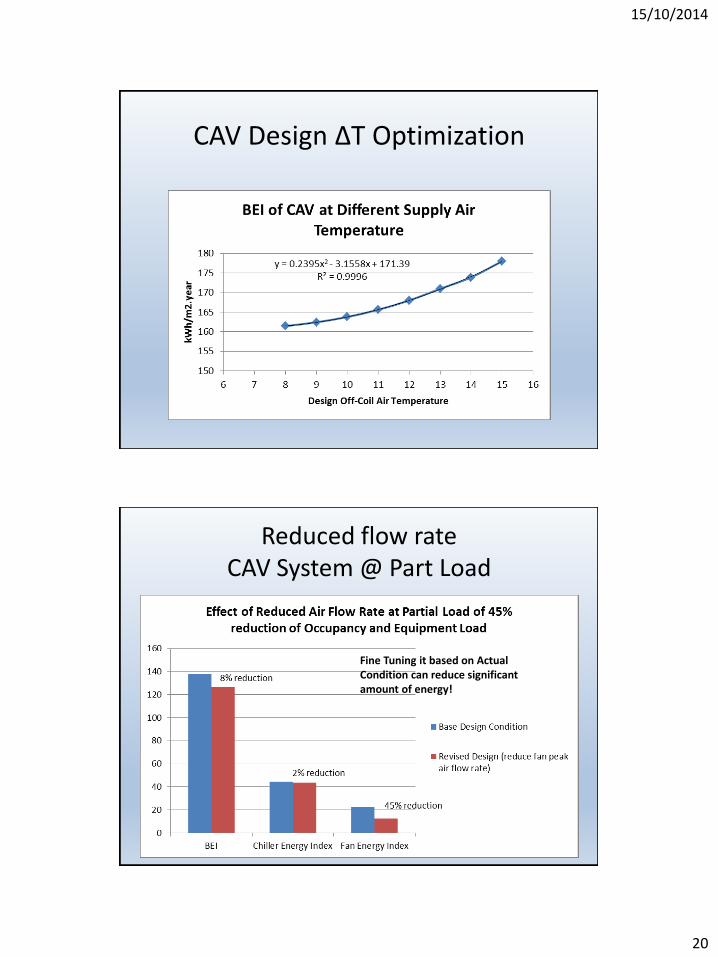
CAV Design ΔT Optimization
Reduced flow rate CAV System @ Part Load
Fine Tuning it based on Actual Condition can reduce significant amount of energy!

15/10/2014
21
VAV Design ΔT Optimization
CAV Vs. VAV @ Full Load
Descriptions BEI Units
CAV (at 11°C off-coil) 165.6 kWh/m².year
VAV (at 11°C off-coil) 158.6 kWh/m².year
BEI VAV improvement 7.1 kWh/m².year
% VAV improvement 4.3% Percentage

15/10/2014
22
CAV Vs. VAV @ Part Load
45% Reduction in Occupancy BEI Units
VAV at design flow rate 130.4 kWh/m².year
CAV at reduced flow rate 126.4 kWh/m².year
BEI CAV improvement 4.0 kWh/m².year
% CAV improvement 3.1% Percentage
Fan Pressure & Efficiency

15/10/2014
23
Fan Pressure & BEI
Options for Reduction of Fan Total Pressure
• Larger Ducts, Less Bends
• Selection of Fittings

15/10/2014
24
Air Filter Pressure drop
Camfil – Closed Pleat Pressure Drop Curve
Cooling Coil Pressure Drop
http://www.lytron.com/Tools-and-Technical-Reference/Application-Notes/Selecting-a-Heat-Exchanger

15/10/2014
25
Face Velocity Reduction
• 2.5 m/s down to 2.0 m/s (or lower)
Fan Efficiency & BEI

15/10/2014
26
http://www.ziehl-abegg.com/au/press-release-165.html
CO2 Sensor
Demand Controlled Fresh Air

15/10/2014
27
BEI & Actual Building Occupancy
CO2 Level Set Point

15/10/2014
28
Heat Recovery
toilets toilets

15/10/2014
29
Heat Recovery
Using toilet exhaust for fresh air intake

15/10/2014
30
WATER SIDE
Water-Side Optimization
4 Items to Optimize
1. Chilled Water Distribution Energy Efficiency
2. Chiller Energy Efficiency
3. Condenser Water Distribution Energy Efficiency
4. Cooling Tower Energy Efficiency

15/10/2014
31
Chilled Water Distribution
Options Studied
1. System Selection
• Primary Constant Flow
• Primary Constant/Secondary Variable Flow
• Primary Variable Flow
2. High ΔT Chilled Water Distribution
3. Low Pump Head
4. High Pump Efficiency
Base
-5.0
-3.7-3.3
-2.8-2.3
152
153
154
155
156
157
158
159
160
161
PrimaryConstant
Primary Variable PrimarySecondary
PrimarySecondary
(pump poweradd 10%)
PrimarySecondary
(pump poweradd 20%)
PrimarySecondary
(pump poweradd 30%)
BEI
(kW
h/m
2.y
ear)
Chilled Water Distribution System @ Specific Pump Power of 545 W per l/s

15/10/2014
32
High ΔT Chilled Water distribution
𝐻 = 1.16 𝑄 ∆𝑇Where,H = heat load (kW) (building cooling load)Q = water volume flow rate (m3/h)ΔT = temperature difference (oC)
Rewriting,
𝑄 =𝐻
1.16 ∆𝑇
Issues to consider for high ΔT Design option
• Pipe Sizes:– Reduction in sizes, reduces capital cost,
while maintaining the same pump head. Or, – Maintain pipe sizes, while reducing pump
head, increasing efficiency.
• Chilled Water Supply Temperature:– Reduced temperature, reduces chiller
efficiency, i.e. • 6.67°C to 5.56°C (44°F to 42°F)
• Chilled Water Return Temperature:– Increased ΔT, increases cooling coil sizes in
AHU, increasing capital cost.

15/10/2014
33
Base
-1.2
-2.0-2.7
-1.9
Base-0.4 -0.7 -0.9 -0.6
150
152
154
156
158
160
DT 12F (44/56F) DT 14F (44/58F) DT 16F (44/60F) DT 18F (44/62F) DT 16F (42/58F)
BEI
(kW
h/m
2/ye
ar)
Chilled Water Temperature Different
Pump Head Constant (~Pipe Size Reduced)
Primary Constant Primary Variable
Base-0.4 -0.7 -0.9 -0.6
Base
-1.1-1.7
-2.1-1.6
150
152
154
156
158
160
DT 12F(44/56F)
DT 14F(44/58F)
DT 16F(44/60F)
DT 18F(44/62F)
DT 16F(42/58F)
BEI
(kW
h/m
2.ye
ar)
Chilled Water Temperature Different
Primary Variable System
Pump Head Constant Pump Head Reduced
Pipe Sized Down, Maintaining Pressure
Pipe Size Maintained, Reducing Pressure

15/10/2014
34
Pump head and efficiency
Pump power Equation
𝑷𝒉 =𝒒 𝝆 𝒈 𝒉
𝟑. 𝟔𝒙𝟏𝟎𝟔 𝒙 𝝁
𝜌 = 𝑓𝑙𝑢𝑖𝑑 𝑑𝑒𝑛𝑠𝑖𝑡𝑦 (𝑊𝑎𝑡𝑒𝑟 = 1,000 𝑘𝑔/𝑚3)
𝑔 = 𝑔𝑟𝑎𝑣𝑖𝑡𝑦 (9.81 𝑚2/𝑠)
ℎ = 𝑃𝑢𝑚𝑝 𝑇𝑜𝑡𝑎𝑙 𝑃𝑟𝑒𝑠𝑠𝑢𝑟𝑒 (𝑚 𝑜𝑓 𝑤𝑎𝑡𝑒𝑟)
𝜇 = 𝑃𝑢𝑚𝑝 𝑇𝑜𝑡𝑎𝑙 𝐸𝑓𝑓𝑖𝑐𝑖𝑒𝑛𝑐𝑦 (%)
𝑃ℎ = 𝑃𝑢𝑚𝑝 𝑃𝑜𝑤𝑒𝑟 (𝑘𝑊)
𝑞 = 𝐹𝑙𝑜𝑤 𝐶𝑎𝑝𝑎𝑐𝑖𝑡𝑦 (𝑚3/ℎ)

15/10/2014
35
Specific pump power
Rewriting it… into
Specific Pump Power
𝑃 =𝜌 𝑔 ℎ
𝜇 𝑥 1000= 9.81 ℎ
𝜇
𝑃 = Specific Pump Power (W per l/s)
𝜌 = 𝑓𝑙𝑢𝑖𝑑 𝑑𝑒𝑛𝑠𝑖𝑡𝑦 (𝑊𝑎𝑡𝑒𝑟 = 1,000 𝑘𝑔/𝑚3)
𝑔 = 𝑔𝑟𝑎𝑣𝑖𝑡𝑦 (9.81 𝑚2/𝑠)
ℎ = 𝑃𝑢𝑚𝑝 𝑇𝑜𝑡𝑎𝑙 𝑃𝑟𝑒𝑠𝑠𝑢𝑟𝑒 (𝑚 𝑜𝑓 𝑤𝑎𝑡𝑒𝑟)
𝜇 = 𝑃𝑢𝑚𝑝 𝑇𝑜𝑡𝑎𝑙 𝐸𝑓𝑓𝑖𝑐𝑖𝑒𝑛𝑐𝑦 (%)

15/10/2014
36
y = 0.0059x + 151.93R² = 0.9998
152
153
154
155
156
157
158
100 200 300 400 500 600 700 800
BEI
(kW
h/m
2.y
er)
Specific Pump Power (W per l/s)
Chilled Water Pump Efficiency @ ΔT 6.67°C (44/56°F)Primary Variable System
Reducing Specific Pump Power by 100 W per l/s, reduces BEI by100 x 0.0059 = 0.6 kWh/m2.year
Pump Head Optimization
• A factor of the followings
– Flow Rate (~ fixed by building cooling load & Design ΔT)
– Pipe Size (~ designed by consultants)
– Number and types of bends (~ proposed by contractor)
– Valves and Fittings (~ proposed by contractor/supplier)
– Chiller Heat Exchanger (~ chiller selection)

15/10/2014
37
Priorities
1. Specific Pump Power Reduction
– Pump Head
– Pump Efficiency
2. Primary Variable Flow or Primary/Secondary Flow
3. High ΔT & Maintain pipe size.
Chiller Efficiency

15/10/2014
38
Chiller Efficiency
𝐶𝑂𝑃 =𝐶𝑜𝑜𝑙𝑖𝑛𝑔 𝑃𝑟𝑜𝑣𝑖𝑑𝑒𝑑 (𝑘𝑊𝑐𝑜𝑜𝑙𝑖𝑛𝑔)
𝐸𝑙𝑒𝑐𝑡𝑟𝑖𝑐𝑖𝑡𝑦 𝐶𝑜𝑛𝑠𝑢𝑚𝑒𝑑 𝑏𝑦 𝐶ℎ𝑖𝑙𝑙𝑒𝑟 (𝑘𝑊𝑒)
𝑘𝑤 𝑝𝑒𝑟 𝑡𝑜𝑛 =12
𝐶𝑂𝑃 𝑋 3.412

15/10/2014
39
Caution on chiller study
• DOE-2 Chillers Performance Curve-Fit– Centrifugal Chiller based on chillers manufactured
around 1975. • Newer centrifugal chiller can be significantly more
efficient at part load.
– Screw Chiller curve-fit was updated recently. • ~ 2006 updated
– VSD Chiller curve-fit is the latest introduction. • ~ 2006 introduced.
• Based on a frictionless centrifugal chiller.
Condenser Pump Efficiency

15/10/2014
40
High ΔT Condenser Flow Rate
• Typical Design: 95/85°F (35/29.44°C)– Flow Rate: 2.4 gpm/ton
• Higher Condenser Flow Rate– Chiller efficiency is better – But, Pump power increases
• Condition Tested:– 93/85°F (33.9/29.4°C) – 3.0 gpm/ton– 95/85°F (35/29.4°C) – 2.4 gpm/ton– 97/85°F (36.1/29.44°C) – 2.0 gpm/ton
@ 2.0 gpm/ton, a reduction of 100 W per l/s, reduces BEI by:100 x 0.0233 = 2.3 kWh/m2.year

15/10/2014
41
Cooling Tower Fan Efficiency
Reduction of 0.01 kWe/HRT = 0.01 x 146.92 = ~ 1.5 kWh/m2.year reduction
Variable Speed Fan Cooling Tower @ Different Set Point Water Leaving Temperature.

15/10/2014
42
Cooling Tower summary
Bridging Design and Actual Operation Performance

15/10/2014
43
Common Installation Issues
Install It Right!
Air Leakages
• Main Doors
• Missing Partition above false ceiling
– Porous walls
• Duct leakages
• Missing dampers in smoke ventilation ducts
• No seals between windows frame and wall

15/10/2014
44
Piping and Ducting Layout
What is wrong with this picture?
http://sustainability.csusb.edu/Projects/centralCoolingSystemUpgrades.html
Straight length of pipe before pump suction inlet
Note the Flat Top Eccentric Reducer used to avoid air pocket at suction inlet.

15/10/2014
45

15/10/2014
46
Appoint Building Energy Manager
• Need to appoint someone to take charge.
Commissioning vs. TAB
• TAB = Testing, Adjusting and Balancing• Commissioning = Professional Service for Energy
Efficiency in Building– Owner’s Project Requirement– Design Intent Commissioning Plan– Basis of Design– Commissioning Specifications– Contract Review– Submittal Review– TAB before handing over– Handing Over– Periodic Testing Plan– Training of Facility Manager

15/10/2014
47
Fine-Tuning
• Match building to actual occupants’ requirements while optimizing efficiency. – Lighting schedule
– Air-Conditioning schedule
– Sensors Calibration
– Temperature Set-Point
– Air Rebalancing
– Computer & Equipment Settings
– Occupant’s Awareness Campaign
Continuous Monitoring
1. Sub-meters
2. Energy Management System

15/10/2014
48
Energy Management System
• Line Charts
• Bar Charts
• Daily• Weekly• Monthly• Yearly
The End