Embed Size (px)
Citation preview

Omar Siddiqui
Senior Technical Executive
RFF – EPRI Webinar
November 4, 2014
Energy Efficiency in EPA's Clean Power Plan:
Using Building Block #4 to Set and Meet
Emissions Goals
2© 2014 Electric Power Research Institute, Inc. All rights reserved.
Together…Shaping the Future of Electricity
EPRI Mission
Advancing safe, reliable, affordable and environmentally
responsible electricity for society through global collaboration, thought leadership and science & technology innovation
EPRI Strategic Direction
Innovative solutions that enable the transformation to more flexible, resilient and connected power systems
• Public benefit R&D
• Independent
• Not-for-profit
3© 2014 Electric Power Research Institute, Inc. All rights reserved.
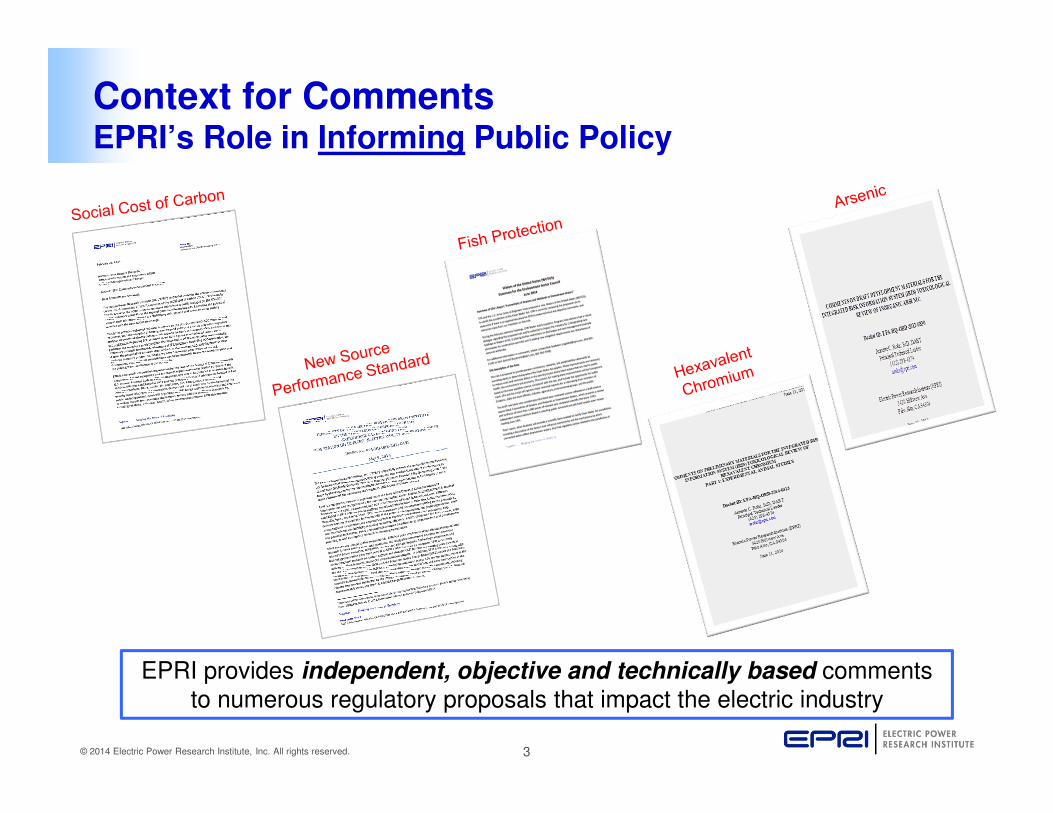
Context for CommentsEPRI’s Role in Informing Public Policy
EPRI provides independent, objective and technically based comments to numerous regulatory proposals that impact the electric industry
4© 2014 Electric Power Research Institute, Inc. All rights reserved.
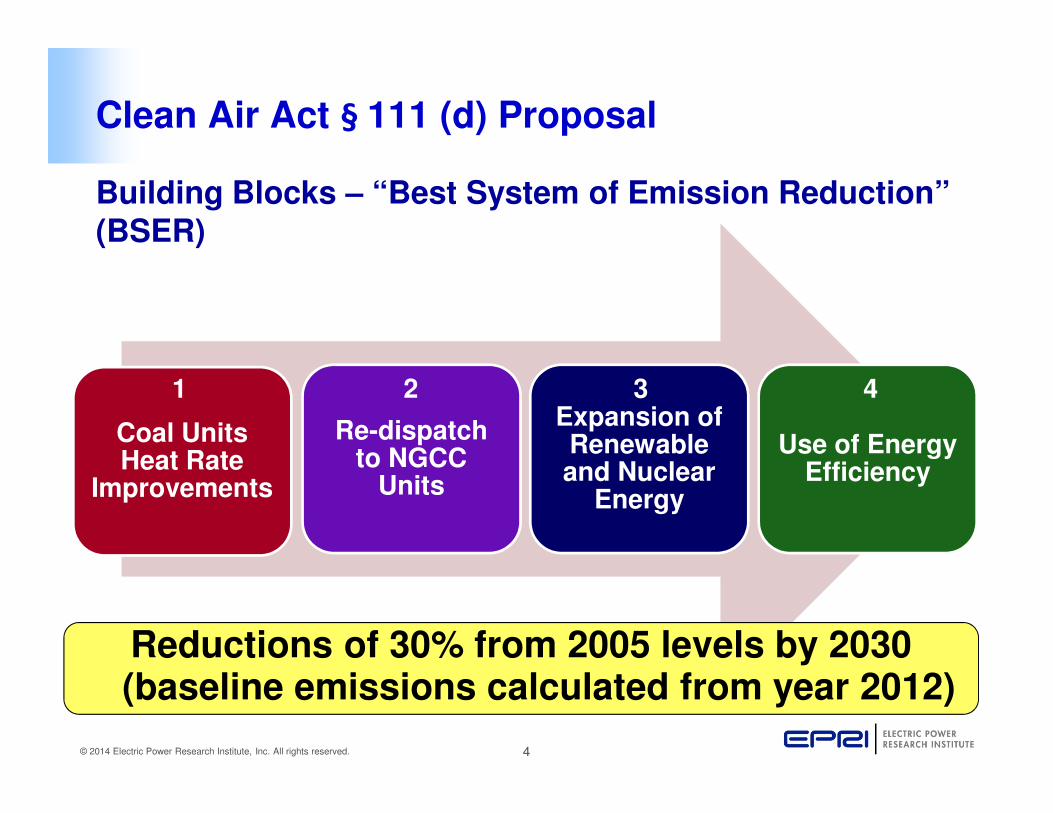
Coal Units Heat Rate
Improvements
Re-dispatch to NGCC
Units
Expansion of Renewable and Nuclear
Energy
Use of Energy Efficiency
Clean Air Act § 111 (d) Proposal
Reductions of 30% from 2005 levels by 2030 (baseline emissions calculated from year 2012)
Building Blocks – “Best System of Emission Reduction” (BSER)
1 2 3 4
5© 2014 Electric Power Research Institute, Inc. All rights reserved.
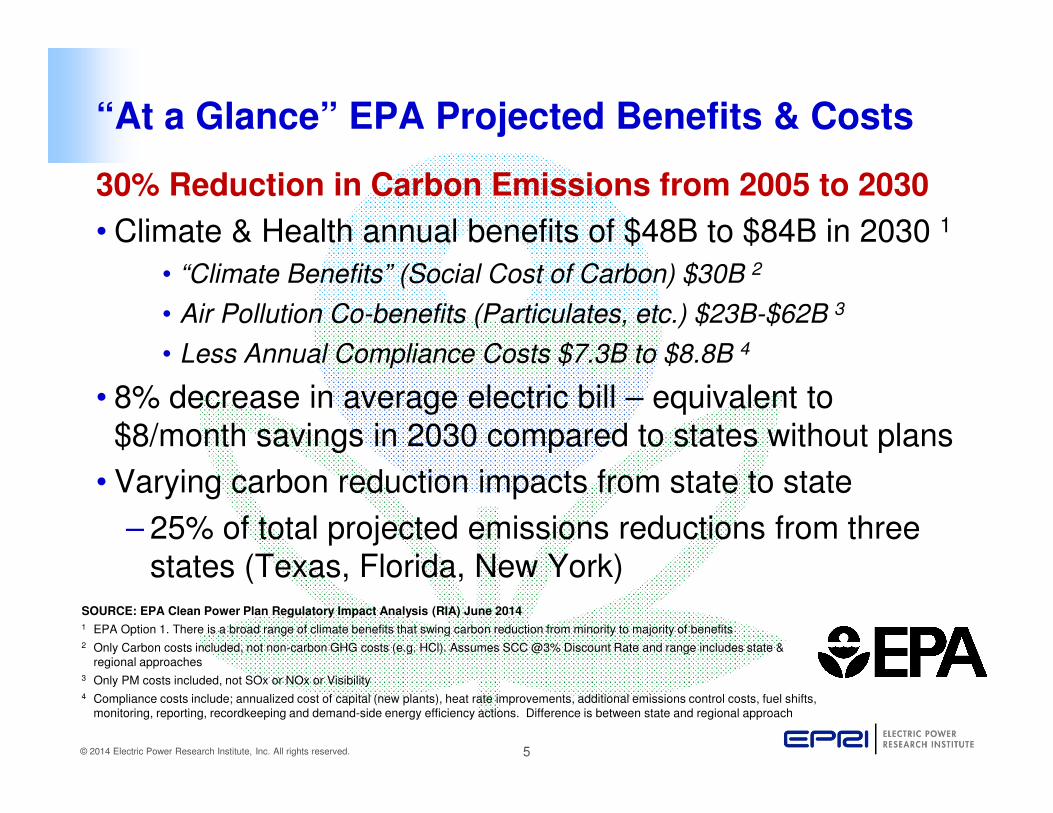
“At a Glance” EPA Projected Benefits & Costs
30% Reduction in Carbon Emissions from 2005 to 2030
• Climate & Health annual benefits of $48B to $84B in 2030 1
• “Climate Benefits” (Social Cost of Carbon) $30B 2
• Air Pollution Co-benefits (Particulates, etc.) $23B-$62B 3
• Less Annual Compliance Costs $7.3B to $8.8B 4
• 8% decrease in average electric bill – equivalent to $8/month savings in 2030 compared to states without plans
• Varying carbon reduction impacts from state to state
– 25% of total projected emissions reductions from three states (Texas, Florida, New York)
SOURCE: EPA Clean Power Plan Regulatory Impact Analysis (RIA) June 2014
1 EPA Option 1. There is a broad range of climate benefits that swing carbon reduction from minority to majority of benefits2 Only Carbon costs included, not non-carbon GHG costs (e.g. HCl). Assumes SCC @3% Discount Rate and range includes state &
regional approaches3 Only PM costs included, not SOx or NOx or Visibility4 Compliance costs include; annualized cost of capital (new plants), heat rate improvements, additional emissions control costs, fuel shifts,
monitoring, reporting, recordkeeping and demand-side energy efficiency actions. Difference is between state and regional approach
6© 2014 Electric Power Research Institute, Inc. All rights reserved.
West
South
MidwestNortheast
WA
OR
CA
NV
ID
MT
WY
UT CO
NMAZ
ND
SD
NE
KS MO
IA
MN
WI
IL IN OH
MI
PA
NY
ME
VT
NH
MA
CT
NJ
OK
TX
AR
KY
TN
MS
LAAL GA
FL
SC
NC
VAWV
MD
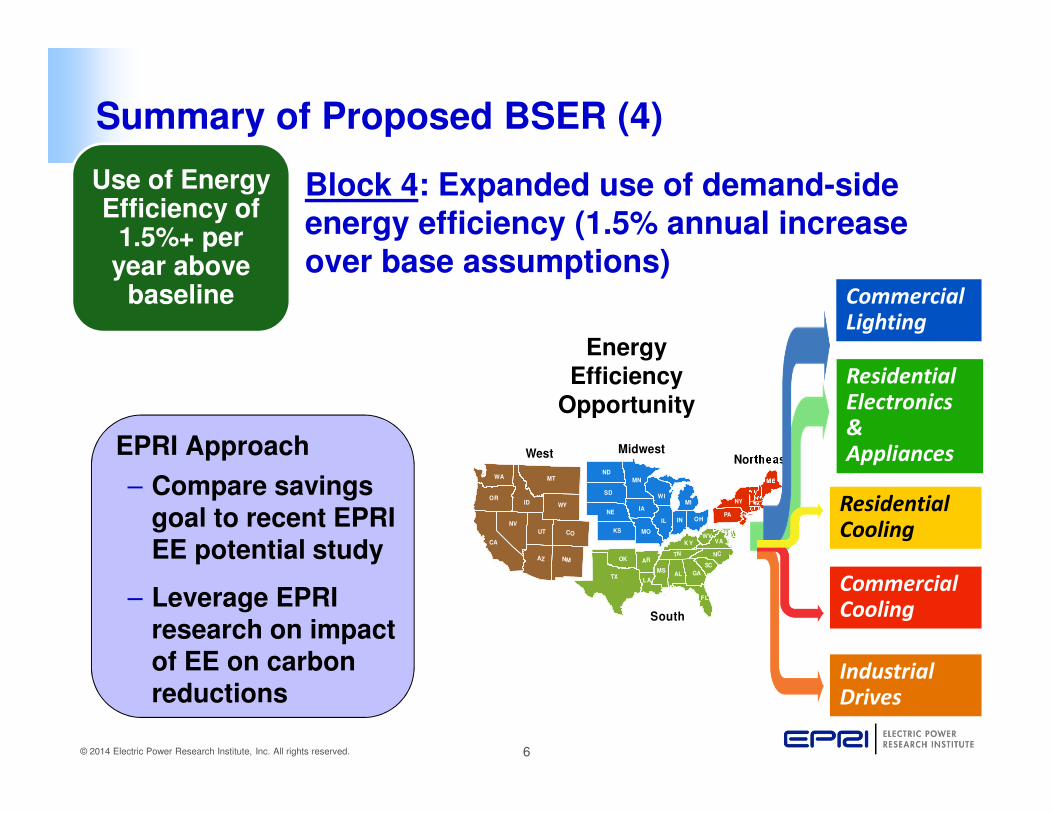
Summary of Proposed BSER (4)
Block 4: Expanded use of demand-side
energy efficiency (1.5% annual increase over base assumptions)
Use of Energy Efficiency of
1.5%+ per year above
baseline
EPRI Approach
– Compare savings goal to recent EPRI EE potential study
– Leverage EPRI research on impact of EE on carbon reductions
Residential
Cooling
Commercial
Lighting
Residential
Electronics
&
Appliances
Commercial
Cooling
Industrial
Drives
Energy
Efficiency
Opportunity
7© 2014 Electric Power Research Institute, Inc. All rights reserved.
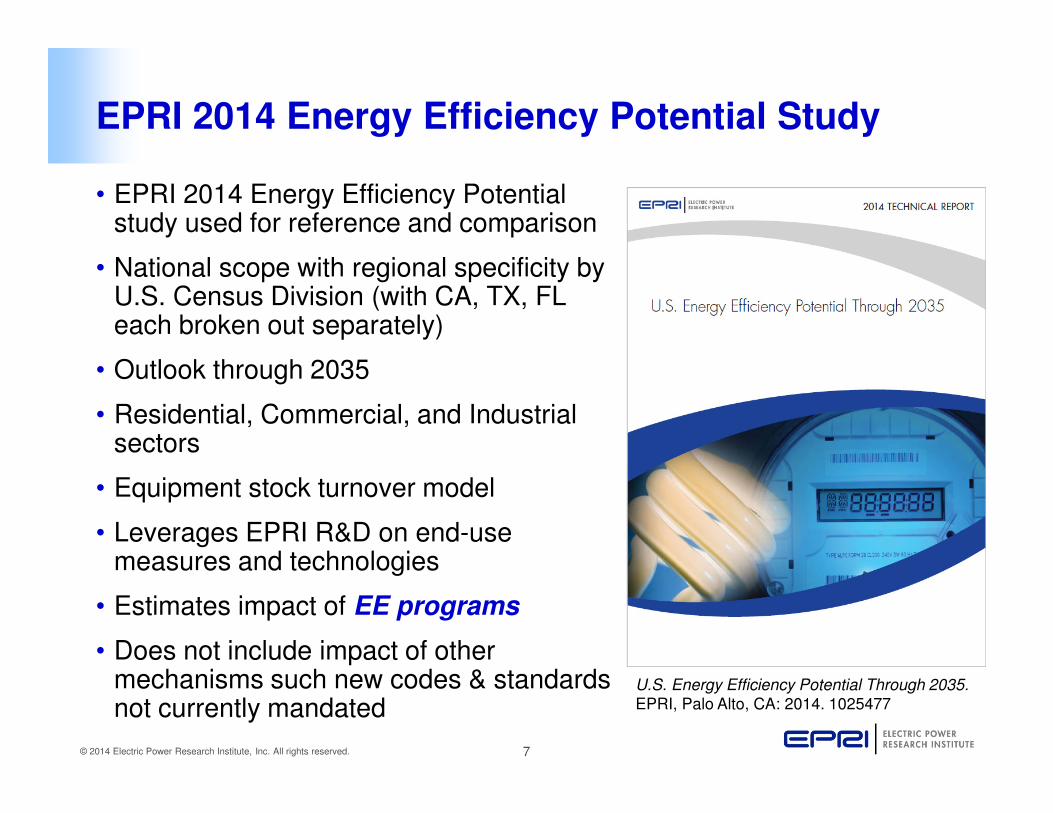
EPRI 2014 Energy Efficiency Potential Study
• EPRI 2014 Energy Efficiency Potential study used for reference and comparison
• National scope with regional specificity by U.S. Census Division (with CA, TX, FL each broken out separately)
• Outlook through 2035
• Residential, Commercial, and Industrial sectors
• Equipment stock turnover model
• Leverages EPRI R&D on end-use measures and technologies
• Estimates impact of EE programs
• Does not include impact of other mechanisms such new codes & standards not currently mandated
U.S. Energy Efficiency Potential Through 2035. EPRI, Palo Alto, CA: 2014. 1025477
8© 2014 Electric Power Research Institute, Inc. All rights reserved.
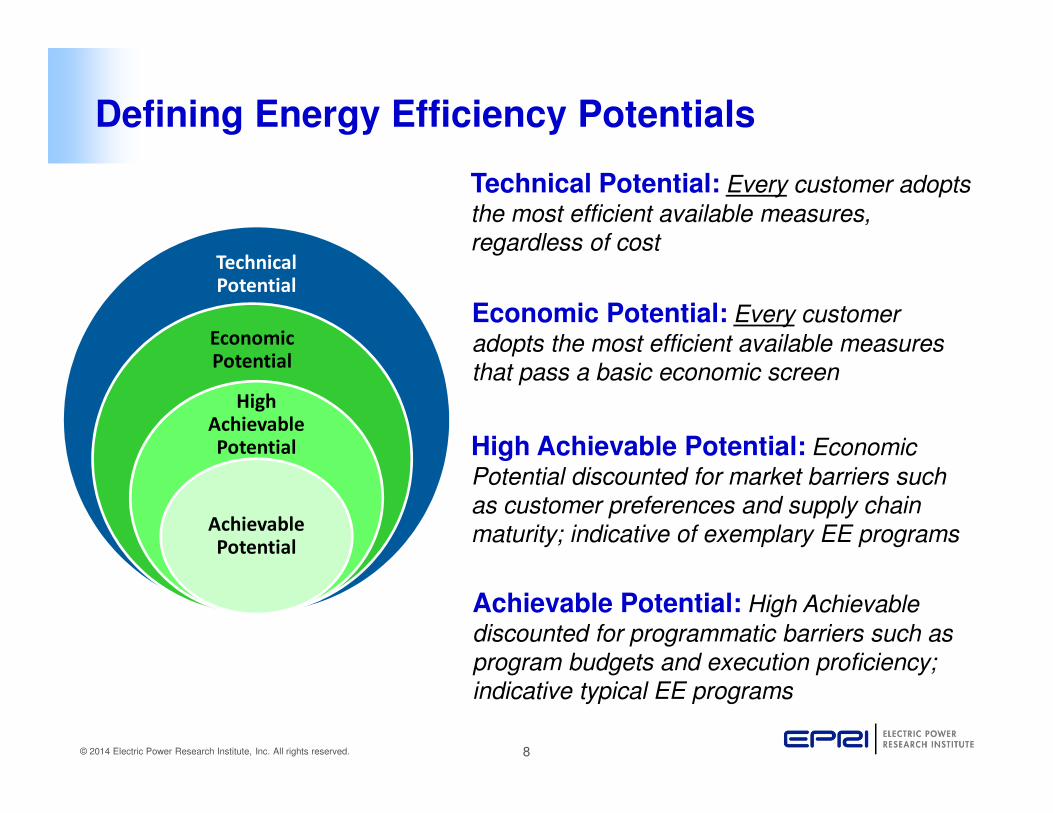
Defining Energy Efficiency Potentials
Technical Potential
Economic Potential
High Achievable Potential
Achievable Potential
Technical Potential: Every customer adopts the most efficient available measures, regardless of cost
Economic Potential: Every customer adopts the most efficient available measures that pass a basic economic screen
High Achievable Potential: Economic Potential discounted for market barriers such as customer preferences and supply chain maturity; indicative of exemplary EE programs
Achievable Potential: High Achievable discounted for programmatic barriers such as program budgets and execution proficiency; indicative typical EE programs
9© 2014 Electric Power Research Institute, Inc. All rights reserved.
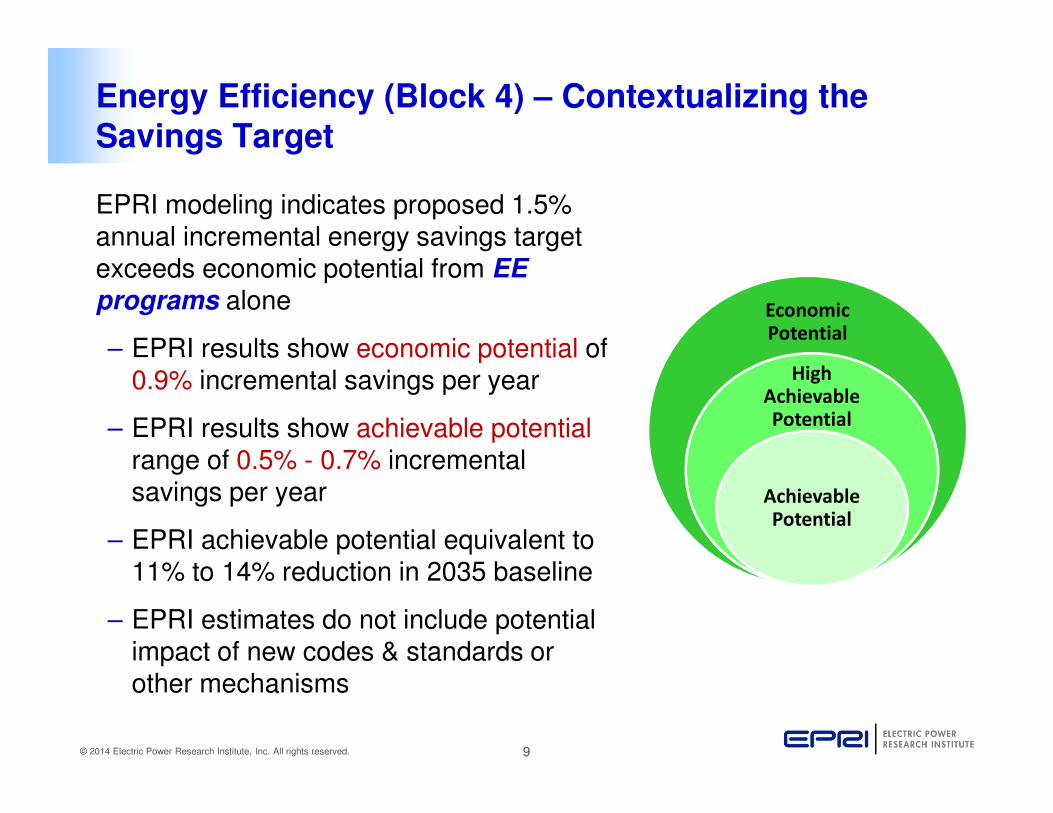
Energy Efficiency (Block 4) – Contextualizing the
Savings Target
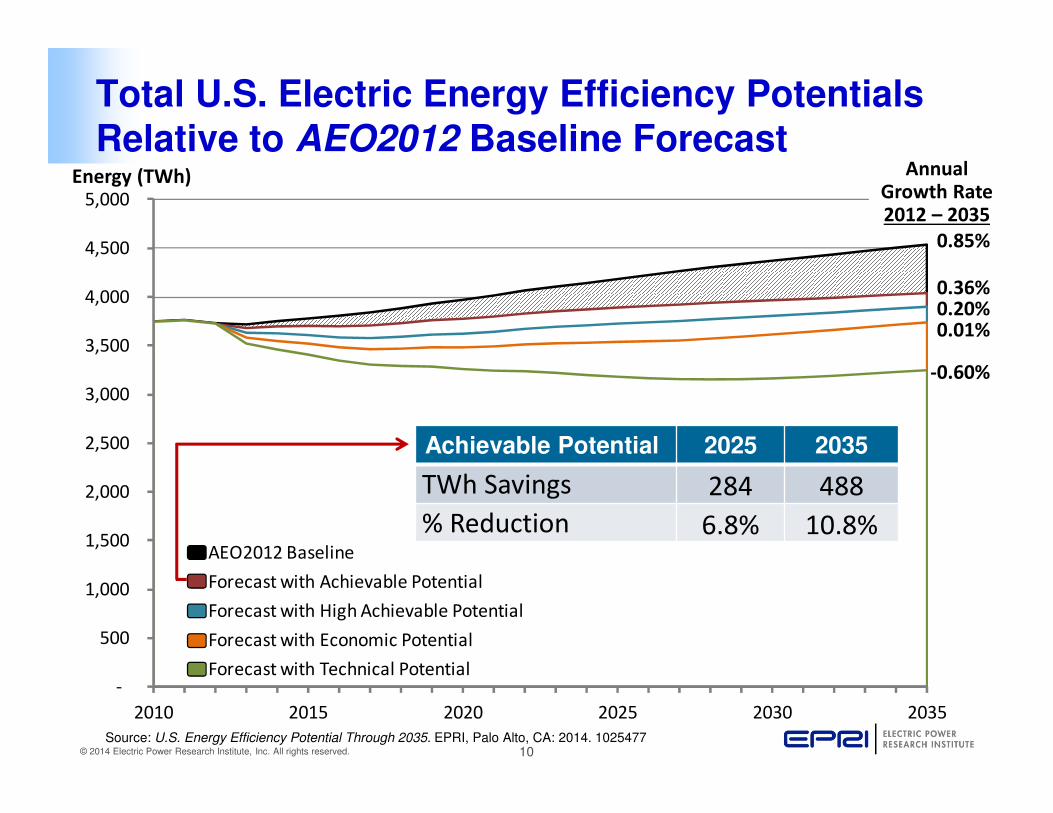
EPRI modeling indicates proposed 1.5% annual incremental energy savings target exceeds economic potential from EE programs alone
– EPRI results show economic potential of 0.9% incremental savings per year
– EPRI results show achievable potential range of 0.5% - 0.7% incremental savings per year
– EPRI achievable potential equivalent to 11% to 14% reduction in 2035 baseline
– EPRI estimates do not include potential impact of new codes & standards or other mechanisms
Economic Potential
High Achievable Potential
Achievable Potential
10© 2014 Electric Power Research Institute, Inc. All rights reserved.
-
500
1,000
1,500
2,000
2,500
3,000
3,500
4,000
4,500
5,000
2010 2015 2020 2025 2030 2035
AEO2012 Baseline
Forecast with Achievable Potential
Forecast with High Achievable Potential
Forecast with Economic Potential
Forecast with Technical Potential
Total U.S. Electric Energy Efficiency Potentials
Relative to AEO2012 Baseline Forecast Energy (TWh)
0.85%
Annual Growth Rate2012 – 2035
0.36%0.20%0.01%
-0.60%
Source: U.S. Energy Efficiency Potential Through 2035. EPRI, Palo Alto, CA: 2014. 1025477
Achievable Potential 2025 2035
TWh Savings 284 488
% Reduction 6.8% 10.8%
11© 2014 Electric Power Research Institute, Inc. All rights reserved.
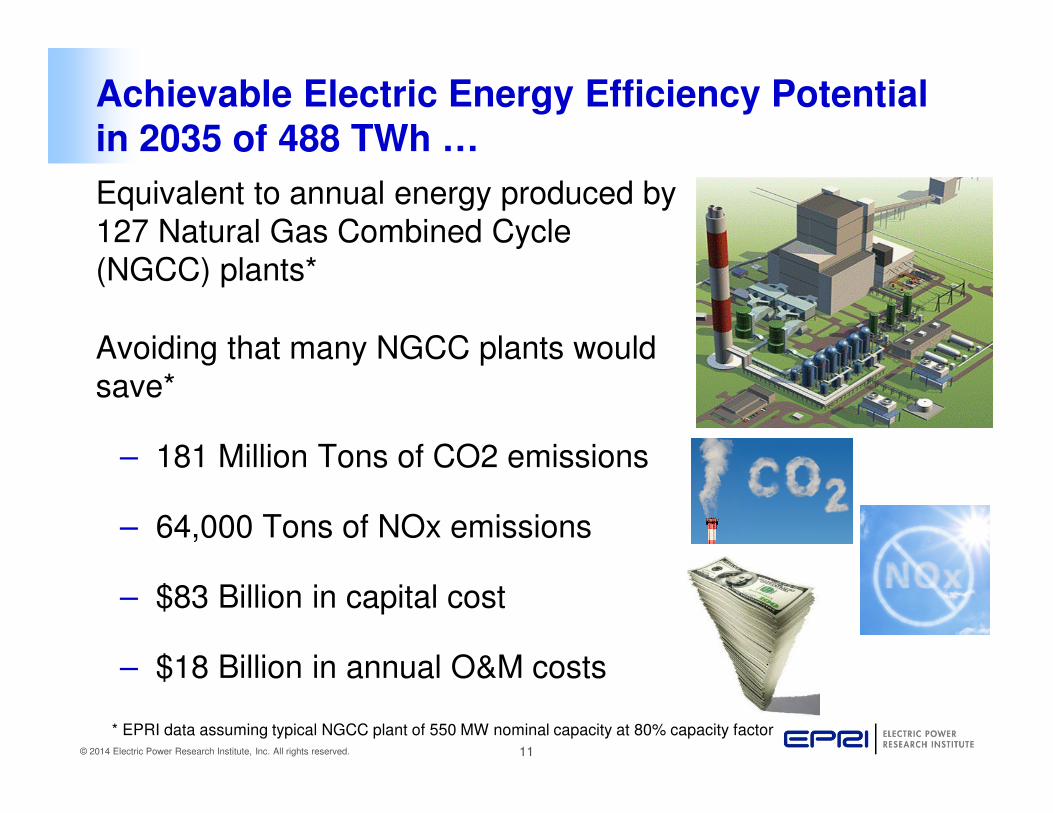
Achievable Electric Energy Efficiency Potential
in 2035 of 488 TWh …
Equivalent to annual energy produced by 127 Natural Gas Combined Cycle (NGCC) plants*
Avoiding that many NGCC plants would save*
– 181 Million Tons of CO2 emissions
– 64,000 Tons of NOx emissions
– $83 Billion in capital cost
– $18 Billion in annual O&M costs
* EPRI data assuming typical NGCC plant of 550 MW nominal capacity at 80% capacity factor
12© 2014 Electric Power Research Institute, Inc. All rights reserved.
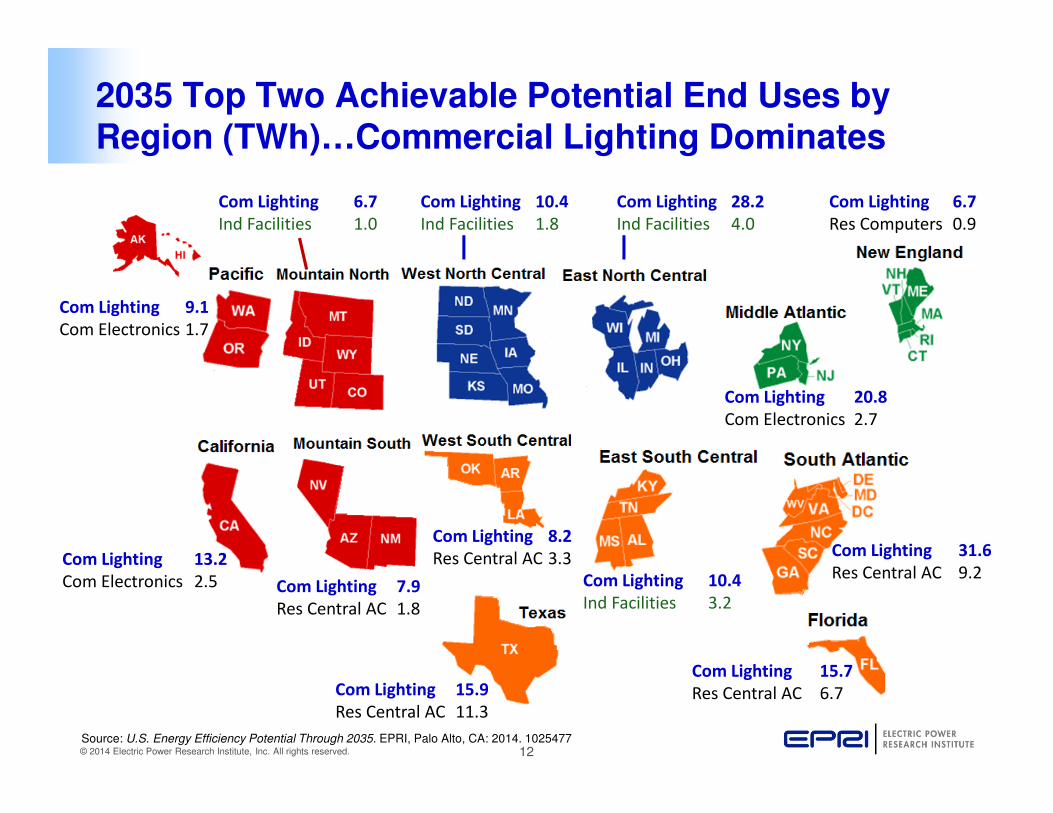
2035 Top Two Achievable Potential End Uses by Region (TWh)…Commercial Lighting Dominates
Com Lighting 9.1
Com Electronics 1.7
Com Lighting 6.7
Ind Facilities 1.0
Com Lighting 13.2
Com Electronics 2.5 Com Lighting 7.9
Res Central AC 1.8
Com Lighting 10.4
Ind Facilities 1.8
Com Lighting 28.2
Ind Facilities 4.0
Com Lighting 6.7
Res Computers 0.9
Com Lighting 8.2
Res Central AC 3.3
Com Lighting 10.4
Ind Facilities 3.2
Com Lighting 15.7
Res Central AC 6.7
Com Lighting 31.6
Res Central AC 9.2
Com Lighting 20.8
Com Electronics 2.7
Com Lighting 15.9
Res Central AC 11.3
Source: U.S. Energy Efficiency Potential Through 2035. EPRI, Palo Alto, CA: 2014. 1025477
13© 2014 Electric Power Research Institute, Inc. All rights reserved.
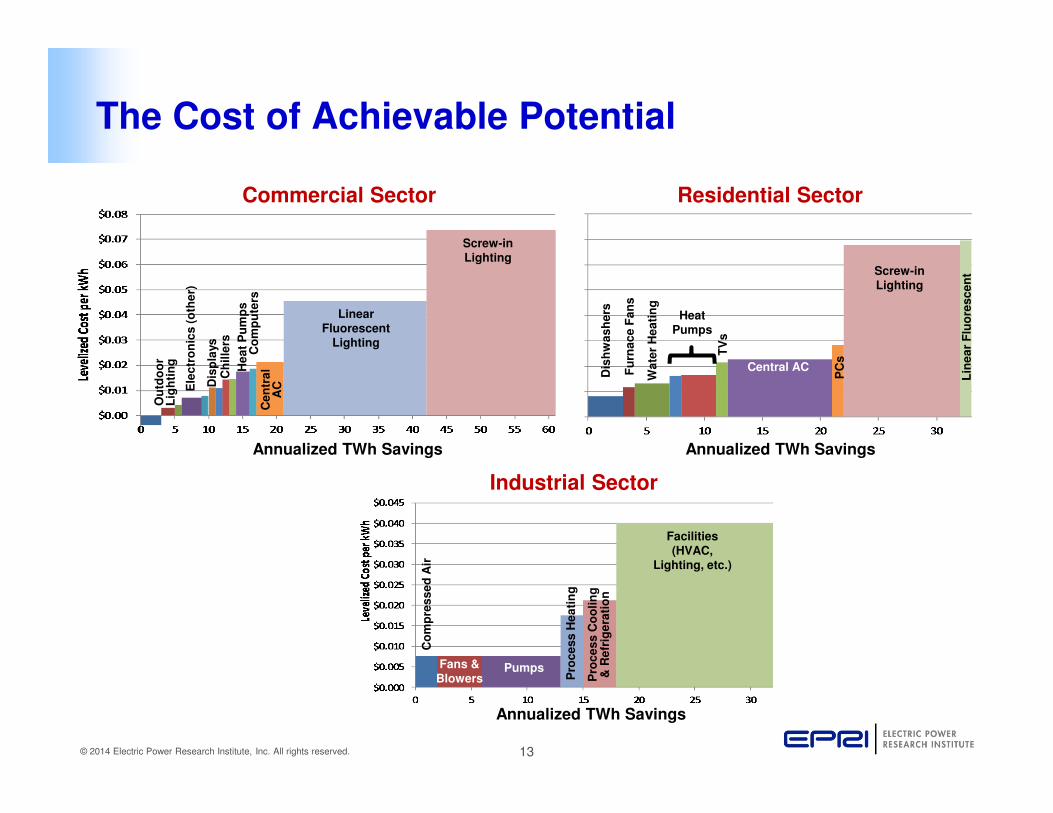
The Cost of Achievable Potential
Commercial Sector Residential Sector
Screw-in Lighting
Linear Fluorescent
Lighting
Ce
ntr
al
AC
Co
mp
ute
rsH
ea
t P
um
ps
Ch
ille
rsD
isp
lays
Ele
ctr
on
ics
(o
the
r)
Ou
tdo
or
Lig
hti
ng
Annualized TWh Savings
Screw-in
Lighting
Central AC
Lin
ea
r F
luo
res
ce
nt
PC
s
TV
s
Heat
Pumps
Wa
ter
He
ati
ng
Fu
rna
ce
Fa
ns
Dis
hw
as
he
rs
Annualized TWh Savings
Facilities (HVAC,
Lighting, etc.)
Pro
ce
ss
Co
oli
ng
& R
efr
ige
rati
on
Pro
ce
ss
He
ati
ng
PumpsFans &Blowers
Co
mp
res
se
d A
ir
Annualized TWh Savings
Industrial Sector
14© 2014 Electric Power Research Institute, Inc. All rights reserved.
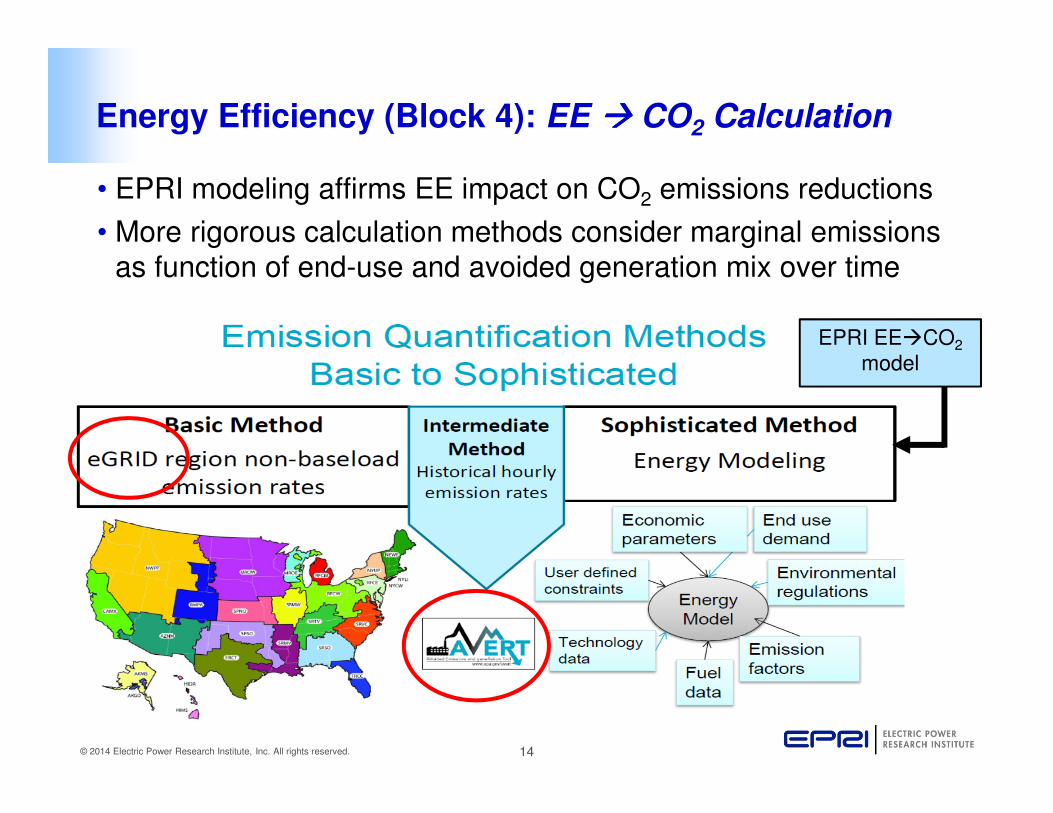
Energy Efficiency (Block 4): EE ���� CO2 Calculation
• EPRI modeling affirms EE impact on CO2 emissions reductions
• More rigorous calculation methods consider marginal emissions as function of end-use and avoided generation mix over time
EPRI EE�CO2
model
15© 2014 Electric Power Research Institute, Inc. All rights reserved.
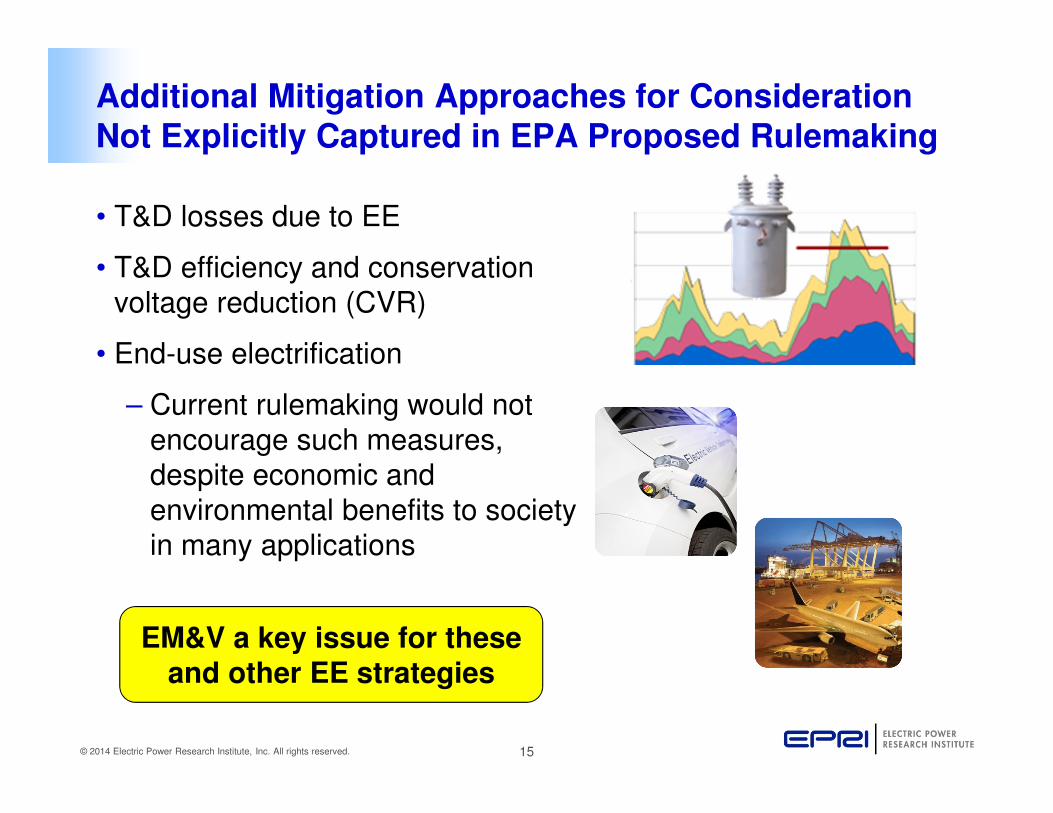
Additional Mitigation Approaches for Consideration
Not Explicitly Captured in EPA Proposed Rulemaking
• T&D losses due to EE
• T&D efficiency and conservation voltage reduction (CVR)
• End-use electrification
– Current rulemaking would not encourage such measures, despite economic and environmental benefits to society in many applications
EM&V a key issue for these
and other EE strategies
16© 2014 Electric Power Research Institute, Inc. All rights reserved.
Together…Shaping the Future of Electricity
Read complete EPRI Comments on 111(d) at
http://epri.co/3002004658