Embed Size (px)
Citation preview

UNIVERSITY OF KWAZULU-NATAL
COLLEGE OF AGRICULTURE, ENGINEERING AND SCIENCE
DISCIPLINE OF MECHANICAL ENGINEERING
ENERGY EFFICIENCY IN MOTOR VEHICLE
ASSEMBLY PLANT
A CASE STUDY OF A VEHICLE ASSEMBLY PLANT IN KENYA
_____________________________________________________________
By
Grace Wanjiru Kiarie
Dissertation submited in fulfillment of the academic requirements for the degree of Masters of Science in
Mechanical Engineering
Supervisor: Dr. Freddie Inambao
25 November 2014

As the candidate’s supervisor, I agree to the submission of this dissertation.
Dr.Freddie L. Inambao ………………………………………….
NAME AND SIGNATURE OF THE SUPERVISOR

iii
DECLARATION 1 – PLAGIARISM
I, Grace W. Kiarie declare that:
1. The research reported in this dissertation, except where otherwise indicated, is my original
research.
2. This dissertation has not been submitted for any degree or examination at any other university.
3. This dissertation does not contain other person’s data, pictures, graphs or other information,
unless specifically acknowledged as being sourced from other persons.
4. This dissertation does not contain other persons’ writing unless specifically acknowledge as
being sourced from other researchers. Where other written sources have been quoted, then:
a. Their words been re-written but the general information attributed to them has been
referenced.
b. Where their exact words have been used, then their writing has been placed in italics and
inside quotations marks, and referenced.
The dissertation does not contain text, graphics or tables copied and pasted from the internet, unless
specifically acknowledged, and the source being detailed in the dissertation and in the reference sections.
Signed
…………………………………..

iv
DECLARATION 2 – PUBLICATIONS
Publication 1: Kiarie, G. and Inambao, F. 2013. Improvements of energy efficiency in
automobile industries C13-121. Proceedings of the 13th BIE Biennial
Conference Gaborone, Botswana, 15th
-18th October. pp. 43-48.

v
ACKNOWLEDGEMENTS
First I would like to thank the almighty GOD for his blessings upon my life may your name be glorified.
I would also like to thank my supervisor Dr. Inambao for his continued support may God bless you
abundantly.
I am also grateful to the Technical University of Kenya for giving me this opportunity to study. I am most
grateful to the Faculty of Engineering Technical University of Kenya for their support.
I would like to acknowledge the financial, academic and technical support of the University of KwaZulu-
Natal.
I cannot express enough thanks to the Kenya Vehicle Manufacturing Ltd. and General Motors Kenya for
their assistance in data collection.
My sincere gratitude goes to my dear parents Mr and Mrs Kiarie for their continued support – you are
such wonderful parents God bless you so much.
I also want to express my acknowledgement to Centre for Engineering Postgraduate Studies for their
financial support.
My completion of this work could not have been accomplished without the support of my sisters and
brothers who always prayed for me.
I would like to thank all my friends who have supported me and my fellow postgraduate students for their
assistance.
Last but not least would like to thank my dear husband, Mr Simon Munyaka for his encouragement and
support stay blessed.

vi
ABSTRACT
Energy is defined as the capacity to do work and comes in various forms such as motion, heat, light,
electrical, chemical, nuclear, and gravitational. There are two forms of energy: primary energy which is
extracted or captured directly from the environment and secondary energy which is converted from
primary energy in the form of electricity. Energy efficiency means a physical ratio of output and input of a
system. Efficiency refers to valuable work obtained from a process or system when related to the total
energy input; it is, therefore, an indication of the performance of a device in energy use terms.
The industrial sector is the largest consumer of energy globally and this is the case too in Kenya. The
major forms of energy used in Kenyan industries are electricity, diesel oil, compressed air, steam and solar
energy. Energy in industries is used for various activities such as heating and cooling, lighting, processing,
manufacturing, air conditioning and assembly; a lot of energy is lost during these operations due to poor
maintenance of machines, poor management, misuse and mishandling of equipment, bad attitude and lack
of knowledge among workers.
In vehicle assembly plants energy is used in heating, welding, assembly, lighting, painting and office
work. The major types of energy used in vehicle assembly plant are compressed air, electricity, industrial
oil and diesel. These industry sectors face a lot of challenges because many cars used in Kenya are
imported from Japan because the locally assembled cars are more expensive although they are durable.
Among the factors which make them expensive includes raw material, payment of salaries and wages,
process of assembly, and heavy payment of bills. The major bills in many industries after payment of
salaries are energy bills for electricity, diesel and industrial oil. The cost of electricity and diesel in Kenya
is escalating due to high demand and low supply, thus making locally made items more expensive than
imported ones. Industries in Kenya are struggling to adopt new manufacturing processes and designs to
cut down operating costs and improve the quality of products to meet the competitive demand. The same
case applies to the automobile assembly industry; they are trying to come up with new designs and models
to increase sales, but are forgetting to pay attention to methods of reducing energy costs.
Energy efficiency in many industries remains silent and this is because the issue of balancing the operation
costs and investing in energy efficiency is only remembered when the bills climb high. Many researches
have concentrated on improving the design of assembly lines, changeover of machines and equipment to
improve the system, but little has been researched regarding the energy used during the assembly of the
vehicles. As manufacturers face an increasingly competitive environment, energy efficiency management
can provide a means to create a good reputation for the company, hence increase its sales, but also a
method for reducing energy costs.

vii
The aim of the present study is to contribute to improvement in energy efficiency in automotive industries
by estimating the amount of energy used and lost by various equipment, identifying the barriers to energy
efficiency and the driving forces inhibiting or preventing implementation of energy efficiency measures,
and providing recommendations on useful energy efficiency opportunities and maintenance measures.
The study was carried out in one of the four major automotive assembly plants in Kenya. Questionnaires,
observation, measurements, oral interviews and audits were used to collect data. From the analysis,
welding machines and fans are the major consumers of electrical energy with an approximate of 45 % and
17 % respectively. Burners and generators are the major consumers of oil with 73 % and 15 %
respectively.
From observation, the use of aged equipment, lack of training and ignorance among employees are the
major causes of energy loss. Idling of machines, leaks, dust and faulty lamps are the major source of
energy loss in the plant. It is recommended to clean, switch off, train workers and do proper maintenance.
The research study was able to estimate the amount of energy used and lost in various machines and
equipment and various recommendations were given. It was concluded that, to improve on energy
management in this motor vehicle assembly plant, energy management should be treated equally in
importance with production and sales.
Key words: Energy management, Energy saving opportunities, Energy use and loss

viii
TABLE OF CONTENTS
DECLARATION 1 – PLAGIARISM .......................................................................................................... iii
DECLARATION 2 – PUBLICATIONS ..................................................................................................... iv
ACKNOWLEDGEMENTS .......................................................................................................................... v
ABSTRACT ................................................................................................................................................ vi
TABLE OF CONTENTS ........................................................................................................................... viii
LIST OF FIGURES ................................................................................................................................... xiv
LIST OF TABLES ...................................................................................................................................... xv
LIST OF APPENDIXES .......................................................................................................................... xvii
ACRONYMS, ABBREVIATIONS AND SYMBOLS ........................................................................... xviii
CHAPTER 1: INTRODUCTION ................................................................................................................. 1
1.1 Background of study ........................................................................................................................... 1
1.1.1 Overview of energy efficiency ..................................................................................................... 2
1.1.2 Industry and manufacturing sector in Kenya................................................................................ 3
1.2 Aims and Objectives ........................................................................................................................... 4
1.3 Problem statement ............................................................................................................................... 4
1.4 Significance of the study ..................................................................................................................... 5
1.5 Research questions .............................................................................................................................. 5
1.6 Limitations .......................................................................................................................................... 6
1.7 Layout of thesis ................................................................................................................................... 6
CHAPTER 2: ENERGY USAGE AND OTHER RELATED RESEARCH ................................................ 7
2.1 Types of energy .................................................................................................................................. 7
2.2 Energy overview in Kenya .................................................................................................................. 7
2.2.1 Electricity ..................................................................................................................................... 8
2.2.2 Petroleum ..................................................................................................................................... 9
2.2.3 Biomass ........................................................................................................................................ 9
2.2.4 Solar ............................................................................................................................................. 9
2.2.5 Wind ........................................................................................................................................... 10
2.3 Energy use in Kenya industries ......................................................................................................... 10
2.4 Energy consuming equipment in industries ...................................................................................... 13
2.4.1 Electric motors ........................................................................................................................... 13
2.4.2 Pumps ......................................................................................................................................... 15

ix
2.4.3 Compressed air systems ............................................................................................................. 15
2.4.4 Heating, ventilation and air conditioning ................................................................................... 16
2.4.5 Fans ............................................................................................................................................ 17
2.4.6 Boilers ........................................................................................................................................ 18
2.4.7 Lighting ...................................................................................................................................... 18
2.5 Sources of energy losses ................................................................................................................... 18
2.6 Energy use in vehicle assembly plants .............................................................................................. 20
2.7 Other related research on improving energy in automobile industry ................................................ 21
CHAPTER 3: BARRIERS AND OPPORTUNITIES FOR ENERGY EFFICIENCY IN INDUSTRIES . 24
3.1 Barriers to industrial energy efficiency ............................................................................................. 24
3.1.1 Limited capital ........................................................................................................................... 24
3.1.2 Lack of information and data ..................................................................................................... 25
3.1.3 Cost ............................................................................................................................................ 26
3.1.4 Lack of management staff awareness ......................................................................................... 27
3.1.5 Outdated equipment ................................................................................................................... 28
3.1.6 Lack of skilled personnel ........................................................................................................... 28
3.1.7 Lack of cooperation among departments ................................................................................... 29
3.1.8 Split motivations ........................................................................................................................ 29
3.1.9 Heterogeneity ............................................................................................................................. 29
3.1.10 Culture and power .................................................................................................................... 30
3.1.11 Principal relationship ............................................................................................................... 30
3.1.12 Results not sustained ................................................................................................................ 30
3.1.13 Bounded rationality .................................................................................................................. 30
3.2 Energy saving opportunities in management .................................................................................... 30
3.2.1 Commitment ............................................................................................................................... 32
3.2.2 Setting goals ............................................................................................................................... 32
3.2.3 Monitoring and tracking ............................................................................................................. 32
3.2.4 Housekeeping ............................................................................................................................. 33
3.2.5 Training programmes ................................................................................................................. 34
3.2.6 Benchmarking ............................................................................................................................ 34

x
3.2.7 Records of energy data ............................................................................................................... 35
3.2.8 Resource allocation .................................................................................................................... 35
3.2.9 Policy ......................................................................................................................................... 35
3.2.10 Energy manager and teams ...................................................................................................... 36
3.2.11 Energy efficiency programmes ................................................................................................ 37
3.2.12 Energy audit ............................................................................................................................. 37
3.2.13 Equipment labelling and upgrading. ........................................................................................ 37
3.3 Energy savings through support process of industrial energy systems ............................................. 38
3.3.1 Electric motors ........................................................................................................................... 38
3.3.2 Compressed air ........................................................................................................................... 39
3.3.3 Fans ............................................................................................................................................ 40
3.3.4 Pumps ......................................................................................................................................... 41
3.3.5 Heating, ventilation and air-conditioning ................................................................................... 41
3.3.6 Lighting ...................................................................................................................................... 42
3.3.7 Boilers ........................................................................................................................................ 43
3.3.8 Building envelope ...................................................................................................................... 44
CHAPTER 4: RESEARCH METHODOLOGY ........................................................................................ 45
4.1 Research design ................................................................................................................................ 45
4.1.1 Case study .................................................................................................................................. 45
4.1.2 Qualitative and quantitative ....................................................................................................... 45
4.2 Methods and tools ............................................................................................................................. 46
4.2.1 Questionnaires ............................................................................................................................ 46
4.2.2 Observations ............................................................................................................................... 46
4.2.3 Interviews ................................................................................................................................... 47
4.2.4 Sampling .................................................................................................................................... 47
4.2.5 Energy audit ............................................................................................................................... 48
4.3 Equipment used ................................................................................................................................. 49
4.3.1 Tachometer ................................................................................................................................. 49
4.3.2 Clamp meter ............................................................................................................................... 51
4.3.3 Infrared thermometer ................................................................................................................. 52

xi
4.3.4 Summary .................................................................................................................................... 52
CHAPTER 5: DATA ANALYSIS AND DISCUSSION ........................................................................... 53
5.1 Company background ....................................................................................................................... 53
5.2 Vehicles assembly process ................................................................................................................ 54
5.2.1 Parts manufacture ....................................................................................................................... 54
5.2.2 Body production ......................................................................................................................... 54
5.2.3 Chassis production ..................................................................................................................... 54
5.2.4 Painting ...................................................................................................................................... 55
5.2.5 Assembly .................................................................................................................................... 55
5.3 Energy usage analysis ....................................................................................................................... 55
5.3.1 Electricity bills ........................................................................................................................... 56
5.3.2 Power factor ............................................................................................................................... 57
5.3.3 Peak and off-peak ....................................................................................................................... 58
5.3.4 Load factor ................................................................................................................................. 58
5.3.5 Water usage ................................................................................................................................ 59
5.3.6 Industrial oil (IDO) usage .......................................................................................................... 60
5.3.7 Analysis of gas usage for the year 2013 ..................................................................................... 60
5.4. Energy usage analysis in body-in-white section .............................................................................. 61
5.4.1. Body-in-white welding machine energy analysis ...................................................................... 62
5.4.2 Kilovolts ampere analysis (KVA) .............................................................................................. 63
5.4.3 Energy use and lost in body-in-white welding machines (kWh) ................................................ 64
5.4.4 Electrical motor driven equipment, energy use and loss analysis .............................................. 65
5.4.5 Lighting analysing in body-in-white .......................................................................................... 67
5.4.6 Energy use and loss in body-in-white section major appliances ................................................ 68
5.5 Energy usage in body building section ............................................................................................. 71
5.5.1 Kilovolts amperes analysis in body building section ................................................................. 72
5.5.2 Energy analysis in arc welding machines in body building ....................................................... 72
5.5.3 Electric motor driven machines energy analysis in body building section................................. 73
5.5.4 Lighting in body building section .............................................................................................. 74
5.6 Energy usage in the paint shop section ............................................................................................. 77

xii
5.6.1 Industrial oil usage ..................................................................................................................... 78
5.6.2 Electrical energy usage analysis in the paint shop ..................................................................... 79
5.6.3 Lighting analysis in paint shop ................................................................................................... 80
5.6.4 Heat leakage analysis in ovens ................................................................................................... 81
5.7 Energy usage in the assembly line .................................................................................................... 82
5.7.1 Lighting analysis in assembly line ............................................................................................. 82
5.7.2 Electrical energy analysis ........................................................................................................... 83
5.8 Energy usage in compressors ............................................................................................................ 84
5.8.1 Leakage measurement of various orifice diameters ................................................................... 85
5.9 Energy use in the stand-by generator ................................................................................................ 86
5.10 Energy use in transport ................................................................................................................... 87
5.11 Total energy analysis ...................................................................................................................... 87
5.11.1 Summary .................................................................................................................................. 91
5.12 Energy savings by technologies ...................................................................................................... 91
5.12.1 Use of high efficiency motors .................................................................................................. 92
5.12.2 Use of variable speed drives ..................................................................................................... 94
5.12.3 Switching off machines ............................................................................................................ 96
5.13 Energy savings by management ...................................................................................................... 96
5.13.1 Training programmes ............................................................................................................... 96
5.13.2 Housekeeping ........................................................................................................................... 97
5.13.3 Cleaning ................................................................................................................................... 97
5.13.4 Energy audit ............................................................................................................................. 97
CHAPTER 6: CONCLUSIONS AND RECOMMENDATIONS .............................................................. 98
6.1 Conclusions ....................................................................................................................................... 98
6.2 Recommendations ............................................................................................................................. 98
6.2.1 Energy saving opportunities in welding machines ..................................................................... 99
6.2.2 Energy saving opportunities for compressed air ........................................................................ 99
6.2.3 Energy savings opportunities in motors ................................................................................... 100
6.2.4 Energy saving opportunities in lighting ................................................................................... 101
6.2.5 Energy saving opportunities in transport .................................................................................. 101
6.2.6 Energy saving opportunities in burners and ovens ................................................................... 102

xiii
6.2.7 Energy saving opportunities in the stand-by generator ............................................................ 102
REFERENCES ......................................................................................................................................... 103
APPENDIXES .......................................................................................................................................... 111
xiv
LIST OF FIGURES
Figure 2-1: Consumption of energy in Kenyan industries by 2010 ............................................................ 11
Figure 2-2: Electricity generation by source ............................................................................................... 12
Figure 2-3: Electricity consumption in Kenya ........................................................................................... 13
Figure 2-4: Power consumption ration of electric motor driven systems .................................................. 15
Figure 2-5: Energy flow and losses ........................................................................................................... 19
Figure 4-1: Tachometer .............................................................................................................................. 50
Figure 4-2: Clamp meter ............................................................................................................................. 51
Figure 4-3: Infrared thermometer ............................................................................................................... 52
Figure 5-1: Major sections of vehicle assembly plant ................................................................................ 53
Figure 5-2: Usage of electricity in kWh of year the 2013 in the assembly plant ........................................ 57
Figure 5-3: Power factor from January-November ..................................................................................... 58
Figure 5-4: Peak and off-peak hour energy consumption in the plant ........................................................ 58
Figure 5-5: Cost of water from January to June 20 ..................................................................................... 59
Figure 5-6: Industrial oil usage in litres for the year 2013 .......................................................................... 60
Figure 5-7: Front view of body-in-white .................................................................................................... 62
Figure 5-8: Percentages of unused (KVA) in body-in-white ...................................................................... 64
Figure 5-9: Percentage of energy used in different appliances in body-in-white ........................................ 69
Figure 5-10: Percentage of energy lost in different appliances in body-in-white ....................................... 70
Figure 5-11: Side view section of body building section ............................................................................ 71
Figure 5-12: Energy used in different appliances in body building section in kWh ................................... 75
Figure 5- 13: Energy lost in different appliances in body building section ................................................ 76
Figure 5-14: Front view of paint shop spraying booths .............................................................................. 77
Figure 5-15: Painting processes .................................................................................................................. 78
Figure 5-16: Energy consumed by working and defective lamps in paint shop ......................................... 81
Figure 5-17: Energy consumed by working and non-working lamps ......................................................... 83
Figure 5-18: Side view of assembly lines ................................................................................................... 83
Figure 5-19: Leaking valve in the plant ...................................................................................................... 86
Figure 5-20: Energy consumed by electrical machines in the motor vehicle assembly plant ..................... 90
Figure 5-21: Energy lost by electrical machines in the vehicle assembly plant .......................................... 90
Figure 5-22: Energy consumed by oil equipment in a vehicle assembly plant ........................................... 91
Figure 5 23: Comparison of standard and high efficiency motors .............................................................. 94

xv
LIST OF TABLES
Table 2-1: Generation of electricity by sources by 2013 ............................................................................. 8
Table 2-2: Consumption of oil in Kenya by 2010 ........................................................................................ 9
Table 2-3: Types and area of energy applications in various industries ..................................................... 11
Table 4-1: Sampling categories .................................................................................................................. 48
Table 5-1: Electricity consumption ............................................................................................................. 56
Table 5-2: Amount of welding gas used in the year 2013 .......................................................................... 61
Table 5-3: Kilo volts ampere analysis in body-in-white ............................................................................. 63
Table 5-4: Energy use and loss in arc welding ........................................................................................... 65
Table 5-5: Energy use of different motor driven equipment ....................................................................... 66
Table 5-6: Energy loss in different motor driven equipment ...................................................................... 67
Table 5-7: Energy consumed in body-in-white lighting ............................................................................. 68
Table 5-8: Energy use and lost in different appliances in body-in-white.................................................... 69
Table 5-9: Causes of motor failure (Saidur, 2010) ..................................................................................... 71
Table 5-10: Kilovolts amperes in body building section welding machine ................................................ 72
Table 5-11: Energy used and lost in body building section welding machines .......................................... 73
Table 5-12: Energy use in electrical motor driven machines in body building section .............................. 73
Table 5-13: Energy lost in motor driven machines in body building section ............................................. 74
Table 5-14: Energy consumed per month in body building lightings ......................................................... 74
Table 5-15: Energy used and lost different appliances in body building section ........................................ 75
Table 5-16: Industrial oil consumed per month in paint shop ..................................................................... 78
Table 5-17: Energy use and loss in fans and pumps in paint shop .............................................................. 80
Table 5-18: Energy used and lost in paint shop lighting ............................................................................. 80
Table 5-19: Leakage measurement for ovens ............................................................................................. 81
Table 5-20: Energy consumed by lightings in assembly line ...................................................................... 82
Table 5-21: Electrical energy consumed on the assembly line ................................................................... 84
Table 5-22: Energy used and lost in compressed air systems ..................................................................... 84
Table 5-23: Leakage measurement ............................................................................................................. 85
Table 5-24: Energy consumed in a generator in the year 2013 ................................................................... 86
Table 5-25: Diesel consumed in transport .................................................................................................. 87
Table 5-26: Cost of energy used and lost in different sections ................................................................... 88
Table 5- 27: Cost of energy consumed by different equipment .................................................................. 89
Table 5-28: Energy saving using high efficiency motors .......................................................................... 93

xvi
Table 5-29: Energy savings of electric motors by using VSDs .................................................................. 95
Table 5-30: Cost of saving in (KSh) for different speed reductions ........................................................... 96

xvii
LIST OF APPENDIXES
Appendix 1: General information ............................................................................................................. 111
Appendix 2: Operations and management ................................................................................................ 112
Appendix 3: Summary of electricity energy and cost ............................................................................... 113
Appendix 4: Other sources of fuel ............................................................................................................ 114
Appendix 5: Motor parameters ................................................................................................................. 116
Appendix 6: Lighting questionnaires for body–in–white section ............................................................. 118
Appendix 7: Building envelope for body building section ....................................................................... 119
Appendix 8: Equipment list ...................................................................................................................... 120
Appendix 9: Energy efficiency questionnaires ......................................................................................... 121

xviii
ACRONYMS, ABBREVIATIONS AND SYMBOLS
AC Alternating Current
ASD Adjustable Speed Drives
CADDET Centre for Dissemination of Demonstrated Energy Technologies
CO2 Carbon Dioxide
CO Carbon Monoxide
CFM Cubic Feet Meter
DC Direct Current
EER Energy Efficiency Ratings
EI Environmental Index
EU Energy Use
ES Energy savings
GDP Gross Domestic Product
IDO Industrial Oil
IEA International Energy Agency
IR Infrared
HVAC Heating Ventilation and Air conditioning
H P Horse Power
KM Kilometres
KWH Kilo Watt Hours
KPLC Kenya Power and Lighting Company
KSH Kenya Shilling
KW Kilowatt
KVA Kilovolts Ampere
L Litres
M Metre
M/C Machine

xix
MAG Metal Active Gas
MEU Monthly Energy Use
MES Monthly Energy Savings
MEL Monthly Energy Loss
MIG Metal Inert Gas
MTOE Million Tons of Oil Equivalents
MW Megawatt
NAM National Association of Manufacturers
OECD Organization for Economic Co-operation and Development
PSI Pressure Square Inch Gauge
TOE Tonnes of Oil Equivalents
MVAP Motor Vehicle Assembly Plant
VAV Variable Air Volume
VAT Value Added Tax
VSD Variable Speed Drive
GREEK SYMBOLS
𝑊 Watts
𝐽 Joules
∅ Diameter
t Time

1 | P a g e
CHAPTER 1: INTRODUCTION
1.1 Background of study
Energy is defined as the capacity to do work which comes in various forms such as heat, light, electrical,
chemical, gravity and nuclear. Demirel (2012) stated that there are two forms of energy: Primary energy
which is extracted or captured directly from the environment and secondary energy which is converted
from primary energy in the form of electricity or fuel. Final energy is often electrical energy and fuel,
which is referred to as useful energy. Energy efficiency is the ratio of output and input and is an indication
of the device performance in energy terms (Lovins, 2004). The measure of energy efficiency depends
upon how ‘useful’ is defined and how inputs and outputs are measured. Theoretically, an energy efficient
machine would change all the energy input (100 %) into useful work, but while converting one form of
energy to another it will always lose energy in form of heat. Energy efficiency relates the output from a
system to the energy input to it. Blume (2011) stated that energy efficiency reduces production costs and
increases environmental benefits by reducing greenhouse gases emissions and local air pollution.
According to Lovins (2004) energy efficiency is the largest, least expensive, least visible, least
understood, and most neglected way to provide energy services in many organizations. The potential of
energy efficiency is increasing fast through innovative technologies, policies and marketing methods.
The industrial sector is the major consumer of energy in many countries and the same applies to Kenya.
Electricity and oil are the major types of energy used to drive systems, lighting, heating and cooling. The
automotive and auto parts industry in Kenya is of great benefit to the economy. Vehicles are used to
transport goods and people from one destination to the other. According to the Kenya National Bureau of
Statistics (KNBS) (2012) by the year 2011 there were 205,841 vehicles registered by the Kenya revenue
authority and the number is expected to increase as the population increases. In Kenya there are four major
vehicle assembly plants located in the major cities. Although they assemble vehicles, many cars which are
used in the Kenyan market are imported from Japan because they are cheaper in price compared to the
locally assembled ones. Locally assembled vehicles are more durable than imported, although they are
expensive. Some of the factors which makes the locally assembled cars expensive are: energy bills, lack of
raw materials and wages of the work force. In motor vehicle assembly plants, energy is used throughout
the manufacturing process. The total energy consumed during the life cycle of vehicle assembly can be
summarized by four major stages:
a) Material handling;
b) Body building;
c) Painting; and
2 | P a g e
d) Assembly.
The energy types commonly used are electricity, diesel, and compressed air as stated by Galitsky and
Worrell (2008). Many industries in Kenya use electric motor driven systems in their operations such as
compressors, fans, pumps, and heating, ventilation and air conditioning (HVAC). Electricity is used in
lighting systems and for driving electric motor appliances, compressed air is used in hand tools, cleaning
and painting while oil/diesel is used in transport equipment, burners and in stand-by generators. Improving
energy efficiency in industries can minimise operation costs and increase company reputation. The prices
of energy increase everyday due to inflation and high demand. Yuko (2004) stated that the high cost of
energy and lack of reliable energy supply in Kenya has resulted in high prices for goods and services and
suppliers end up in importing. To curb these problems industries should manage available energy well
without much waste, through good energy management programmes. For effective energy management
there must be a commitment from top level management to lower level management; in many
organizations the energy subject is only known by the maintenance people and the accountants who pay
the bills. Companies should employ an energy manager who will then form an energy team. They should
know how and why energy is being used within the company and research the most cost effective method
of using energy as outlined by Smith (2000). Sources of energy loss should also be identified and
improvement measures employed; this can be accomplished by conducting energy audits, surveys and
doing measurements. Long term and short plans can be made to minimise energy use and loss. Long term
plans may include changing machines and buildings. Short term plans include switching off the
lights/equipment, insulation and sealing. Due to the rapid change of technology regarding energy use,
equipment and buildings the process of energy management should be continuous to cope with the new
technologies, and this means allocating funds to manage energy. Investing in energy efficient programmes
may be insignificant to many organizations and few will invest in it so the industrial sectors should be
informed regarding the importance of investing in energy management (Schleich and Gruber, 2008).
1.1.1 Overview of energy efficiency
Energy efficiency is the optimal utilization of input energy to produce useful energy. It refers to using less
energy to produce the same amount of goods. ‘Efficiency’ describes the difference between the actual
energy use and the lowest energy use achievable. The achievable energy is influenced by operating
conditions and best practices which vary from one plant to the other (Blume, 2011).
Ideally the aim of energy efficiency is to utilize all energy input into useful work. But how precisely to
define energy input and output needs a lot of consideration. In many cases not all input energy is
transformed into useful work; a lot of energy loss occurs in the process of transformation, distribution and
conversion to useful work. The major principles to minimise these loses include: avoid, reduce, manage

3 | P a g e
and monitor (Murray, 1996; Apostolos et al., 2013). In an industrial set up energy efficiency can be
improved by:
a) Energy savings by management;
b) Energy savings by use of technologies; and
c) Energy savings by implementing policies, rules and regulation (Abdelaziz et al., 2011).
According to Trianni and Cagno (2012) implementing energy efficiency measures is not easy due to the
barriers associated with them, these barriers can be categorized broadly as:
a) Economic barriers, which can be as a result of lack of capital, lack of information and data, and
cost associated with energy efficiency.
b) Behavioural barriers, these are barriers due to lack of credibility and trust of the information, lack
of value, and inertia towards energy efficiency.
c) Organizational barriers; these are as a result of power, values and culture in the organization
1.1.2 Industry and manufacturing sector in Kenya
Kenya is the most industrialized country in East Africa and accounts for 14 % of gross domestic product
(GDP) of the region. The sector has been faced with challenges since 1980 due to shortage of
hydroelectric power, high energy costs, imports of cheap products and poor infrastructure. Many
industries are concentrated in the major cities such as Nairobi, Kisumu and Mombasa. The major
industries which dominate the economy are food and beverage processing, grain milling and fabrication.
Kenya has an oil refinery that processes imported crude petroleum to petroleum products (Country Profile,
2007). The commercial sector uses petroleum and electricity as major sources of energy, consuming about
25 % of petroleum products in Kenya. By 2010 the consumption of electricity by industry was 0.312
mTOE and consumption of oil in industries was 0.77 mTOE (IEA, 2012). Major government policies
concerning industries are: promotion of industrial growth, increased domestic earnings and enhanced
export earnings. According to Country Profile (2007) the following policies should be pursued:
a) Provision of incentives to help exploit opportunities regarding equipment like motors, boilers,
heat energy transfer systems and energy conservation.
b) Provision of technical assistance to industries to conserve energy.
c) Assistance to industry in the establishment of energy management programmes with the
objectives of achieving high levels of energy efficiency.
d) Undertaking demonstration projects to show the benefits of investing and energy efficiency
programmes and conservation.

4 | P a g e
1.2 Aims and Objectives
The aim of the present research is to improve energy efficiency in a motor vehicle assembly plant, and the
specific objectives are:
a) To estimate the amount of energy used and lost in various machines and equipment in a
motor vehicle assembly plant.
b) To identify sources of energy loss in various machines/sections of a motor vehicle assembly
plant.
c) To provide a physical understanding of the barriers to energy efficiency in the industry.
d) To recommend energy efficiency opportunities and maintenance measures to the vehicle
assembly plant management.
1.3 Problem statement
The role of energy in many industries is to transform raw materials into final products. These products
pass through a number of intermediate stages before reaching the final stage. During these intermediate
stages a lot of energy is consumed and lost at the same time. In Kenya many industries use diesel,
electricity and compressed air for their production activities, while solar energy and steam are used for
heating activities. Of late the diesel price is increasing fast due to high demand and low supply, and
electricity prices have also gone up due to the generation process which depends on water. During summer
the price for electricity tends to go higher because it relies on hydro power and sometimes rationing of
electricity is employed. Energy bills in every industry are a major threat because these have to be paid first
before everything else has been paid, otherwise if not paid in time the supply will be disconnected and no
operation can take place. If the bills are too high other operations will be affected and this is what many
workers don’t understand; they use and waste energy aimlessly thinking it is the company’s responsibility
little do they know that the more money spent on bills the less will be available for wages, salaries and
benefits. Due to the huge amount of money spent on energy bills Kenyan industries end up making items
that are more expensive than the imported equivalent. Many suppliers tend to import goods rather than
manufacture. The same applies to the motor vehicle industry; many people buy imported second hand cars
from Japan because they are cheaper than locally assembled vehicles. Due to inadequate monitoring and
management systems in each industry energy is lost during transmission, manufacturing, assembly,
packaging production, lighting, and office work. The energy lost is in the form of heat, gases, liquids and
light.
Use of fossil fuels emits carbon dioxide into the air, thus degrading the environment by promoting
greenhouse gases which can lead to global warming. Burned fuel and oil also make the workplace

5 | P a g e
uncomfortable which can reduce the productivity of workers, hence lead to poor quality of goods and
services.
Poor energy management not only increases energy costs, but also shortens the lifetime of machines and
equipment, prolongs maintenance downtime and delays production thus reducing production levels.
1.4 Significance of the study
With Kenya being a developing country more industries are expected to arise, so the demand for energy
will keep going higher. Available energy should be managed well to cater for the incoming industries so
as to improve the economy of the country.
Motor vehicle assembly plants are very few in Kenya due to the heavy investment in capital for machines
and equipment installation, and also due to the allowance from government to suppliers to import vehicles
in Kenya. This has caused the industry to lag behind in terms of technology and management. In this
sector there is intensive use of electricity, compressed air and diesel. Due to the use of aged equipment and
outdated energy saving technology there is a lot of energy wastage in the process of vehicle production.
This research study helps to trace the sources of energy loss and proposed means of improving energy
management, hence reduction of operational costs. If the energy bills are reduced the extra money can be
allocated to other expenses. The study also emphasizes the need for training programmes in the
organization to make employees aware of how to save energy and the importance of saving energy.
Good management of energy reduces emissions to the environment, thus making it conducive. It also
helps the managers to make good decisions while purchasing equipment because they will be able match
the power factor requirements. Many times there are power surges in Kenya which destroy equipment,
thus increasing the work load of maintenance and prolonging maintenance downtime. This study suggests
methods for improving maintenance measures in vehicle assembly plants which can reduce the downtime
and prolong the lifetime of machines and equipment.
1.5 Research questions
1. What are the types of energy used in motor vehicle assembly plant?
2. How much energy (approximately) does each assembly section consume?
3. What are the sources of energy loss in vehicle assembly plant?
4. What are the barriers to energy efficiency in the assembly plant?
5. Which equipment or sections is the major consumer of power?
6. What are the possible opportunities for improved energy efficiency and maintenance in the
assembly plant?

6 | P a g e
1.6 Limitations
Since the study was carried out in a company it was not easy to get a place to collect the data which took a
lot of time due to companies’ policies and regulations. Many companies do not give out all their data due
to piracy and so some data was not given out and in some area pictures were prohibited. Some of the data
cannot be published and for the little that can be published the name of the company cannot be revealed
according to their policies. In this dissertation the name of the company remains silent and only a generic
name is used.
Materials concerning energy usage in motor vehicle assembly plants are scarce since very few studies
have been conducted in this area.
1.7 Layout of thesis
Chapter 1 outlines the introduction of the study, statement of the problem, significance of the study,
research questions and limitations.
Chapter 2 reviews literature on energy, types of energy, energy consuming equipment, sources of energy
loss, energy use in vehicle assembly plants and other related research.
Chapter 3 summarizes the barriers and opportunities for energy efficiency in industries.
Chapter 4 presents the research methods and methodology used in the case study.
Chapter 5 presents the results and discussion of the case study.
Chapter 6 presents the conclusions and recommendations of the study.

7 | P a g e
CHAPTER 2: ENERGY USAGE AND OTHER RELATED
RESEARCH
The following section outlines the types of energy, energy usage, energy losses and other related research.
2.1 Types of energy
There are two major types of energy primary energy and secondary energy. Primary energy is captured
directly from the environment while secondary energy is a result of conversion of primary energy in form
of fuel or electric energy. Primary energy is classified into three major groups:
a) Non-renewable energy: nuclear fuel, coal, natural gas, crude oil;
b) Renewable: wind, ocean, solar, hydropower, biomass; and
c) Cogeneration/waste
Primary energy accounts for 85 % of energy consumed in the world and it is projected that primary energy
will still dominate energy sources in 2035. Non-renewable sources such as petroleum, coal and natural gas
will diminish with time and their prices will increase, but renewable sources such as wind and solar will
become economical to exploit. Primary energy is transformed into secondary energy in the form of fuel or
electric energy which is referred to as useful energy (Demirel, 2012). Most industries in the world depend
on non-renewable sources for their processes.
2.2 Energy overview in Kenya
Kenya relies mostly on electricity, petroleum and biomass as major forms of energy. KENGEN is the
largest power generating company in Kenya, accounting for 75 % of installed capacity. There are other
independent power plants which include: Iberafrica, Kipevu, and Thika power plant. Total installed
capacity is 1593 MW with hydropower accounting to 763 MW, geothermal 198 MW, thermal 601 MW,
co-generation 26 MW and wind 5 MW (KPLC, 2012; Country Profile, 2007). Kenya currently relies on
imported petroleum based fuels, biofuels, electricity which is generated through hydropower, geothermal
and thermo (Rabah, 2005). Electricity is widely used in commercial and industrial sectors as shown in
Figure 2-1. Most of this energy is generated from fossil fuels, which are not sustainable and they continue
to diminish as the population increases.
The major subsector industries in Kenya include food and beverage processing, pharmaceuticals, paper
production, plastics, construction and mining industries. The majority of these industries uses diesel oil,
solar energy and electricity for their production. The energy sector in Kenya is straining to meet demand

8 | P a g e
due to the population increase. The demand for electricity in the commercial sector rose by 7.6 % since
2008. Kenya does not have oil deposits and relies on imported products either refined or in crude form. In
2010 the imported coal was 0.10mTOE and oil was 4.18 mTOE (IEA, 2012). Petroleum accounts for 75 %
of energy use in the commercial sector and hydro power contributes 64.9 %.
Many industries in Kenya are concentrated around urban areas such as Nairobi, Kisumu and Mombasa
(Onuonga et al., 2011).The connectivity to electricity varies from province to province; in central province
it is 42.4 % while in Nairobi it is 53.4 %. Kenya experiences shortage of electricity supply caused by
system losses and reliance on hydropower which means that when the level of water in dams goes down
during summer electricity needs to be rationed.
There is an energy policy in Kenya with a mission of facilitating and providing reliable, clean and secure
energy services such as cost and environment. The challenges facing the industrial sector in Kenya is the
high cost of energy and increased demand of electricity the demand is higher than the ability to energy
generation capacity. The country has not been able to acquire modern energy, thus leading to high
pressure on biomass. Some of the energy sources are described below.
2.2.1 Electricity
Electricity in Kenya is mainly produced by hydro, geothermal, thermo oil, cogeneration and winds. The
various sources of generation have being increasing linearly from 2010 as shown in Figure 2-1. Kenya is
currently the biggest producer of electricity by geothermal in East Africa.
Table 2-1: Generation of electricity by sources by 2013 (KNBS, 2013
Source Capacity generated
(GWh)
Capacity generated
(%)
Hydro 4435.01 52
Geothermal 1780 21
Thermal oil 2161.7 25
Cogeneration 55.6 1
Imports 49 1
Winds 14.7 0.01
Table 2-1 shows the generation of electricity by various sources. Hydro power generation dominates the
generation of electricity in Kenya; by 2013 it accounted for 52% of total installed capacity. This is because
it is cheaper to generate. Hydro generation depends on water, so during dry seasons generation is reduced
due to shortage of water in the catchment areas, thus causing many organizations use alternative means of
energy which are costly. Generation of electricity by geothermal and oil accounts for 21 % and 25 %
respectively, while cogeneration and imports account for 1 % each respectively.

9 | P a g e
2.2.2 Petroleum
Kenya does not have any oil deposits and relies on imported petroleum products, although there is
exploration in the North Eastern and Coast region of the country. Petroleum fuels are the most commonly
used source of energy in Kenya. They are mainly used in the transport, industrial and commercial sectors
as shown in Table 2-2. The major products of petroleum products are diesel, liquefied petroleum gas
(LPG), fuel oil, petroleum gasoline, kerosene, grease, jet oil, and lubricating oil.
Table 2-2: Consumption of oil in Kenya by 2010 (IEA, 2012)
Oil consumption Consumption rate
(mTOE)
Industries 0.77
Transport 1.57
Other consumption 0.52
Final consumption 2.88
Kenya imports petroleum in both crude and refined forms. By 2010 it has imported 4.18 mTOE of oil.
Kenya has a large crude oil refinery which refines the petroleum products. By 2013, Kenya imported
crude oil worth Ksh 41,037 and petroleum products worth Ksh 252,673 (KNBS, 2013).
2.2.3 Biomass
Biomass is derived from forests such as farmlands, woodlands, grasslands, bush lands and from industrial
and agricultural residues. Biomass resources include charcoal, firewood, and agricultural residues.
Firewood and charcoal account for 68 % of primary energy consumed in Kenya. Charcoal is used in urban
and rural households and firewood is currently used in some industries such as tea factories to fire the
boilers. Approximately 2 % of Kenyan land is covered by forests which produce 45 % of biomass energy
resources. Currently, biomass energy development is becoming the focus of attention in Kenya due to
diminishing global resources of fossil fuels and rising prices, although this is exerting pressure on
vegetation stocks and forests, therefore degrading the land (NEP, 2004; Kiplagat et al., 2011).
2.2.4 Solar
Solar energy is harnessed from the sun. Applications of solar energy include: solar thermal used for
heating and drying and solar photovoltaic (PV) for lighting, telecommunications, water pumping and
refrigeration. Solar energy has less than 1 % of energy contribution in the country. Solar electrical systems
are being sold to customers through the free market, from imports and manufacturing companies, and
through vendors who provide installation and after sale service. Some of the challenges affecting the solar
energy include:

10 | P a g e
a) High initial cost of buying and installing solar.
b) Lack of adherence to standards by suppliers.
c) Lack of awareness of the potential opportunities by solar technologies.
2.2.5 Wind
Wind energy has not been adopted much in Kenya because the location of the country is not favoured by
strong winds and thus wind is not persistent. Wind energy is used in water pumping although this
application is being overtaken by the oil fired internal combustion engine, which is more convenient and
flexible to use. KenGen a power generating company has installed 5.1 MW wind capacity at the Ngong
site. Some of the barriers affecting adoption of wind in the country are (Country Profile, 2007):
a) Little experience and lack of awareness about opportunities offered by the technology;
b) Lack of persistent wind and data concerning wind;
c) High initial cost such as cost of transmission lines;
d) Lack of financing mechanism; and
e) Lack of sales service and system standards.
2.3 Energy use in Kenya industries
Kenya industries mainly use electricity, oil, solar, coal and steam in their productions. Electricity is used
in lighting and driving electric powered systems such as motors, compressors, fans and HVAC. Electricity
powers most of the equipment in a manufacturing set up and controls many operations. The major
problems with electricity supply in Kenya is that nowadays it is becoming unreliable due to shortage of
water in the catchment areas. Most companies have stand-by-generators in case of power rationing or
black out the operations won’t stop.
Oil is the cleanest burning fuel compared to coal, it is mainly used in the transport sector and in generators
(Becker and Wayne, 1996). Oil prices in Kenya fluctuate every day causing goods and services prices to
go higher and higher. This is due to high demand and low supply since the country does not produce oil.
Compressed air is mostly used in pneumatic hand tools, air tools and spray guns. Despite being expensive
to generate, compressed air is safer and more convenient for some application compared to electricity.
Solar energy and steam are used in heating.
Energy uses differs from one industry to the other, depending on the operation of the company and the
output level. Each system or piece of equipment use a variety of energy in order to convert raw materials
into useful products. Some uses of energy in various industries are shown in Table 2-3. It is evidence that

11 | P a g e
almost every industry uses electricity and oil in their processes because of their availability in many
markets, and suitability for many types of equipment.
Table 2-3: Types and area of energy applications in various industries
Type of industry
Type of energy use
Equipment used
Vehicle industry Electricity, gas, oil Welding, Transport, lightings
compressors
Metal works Electricity, gas Lathe machines, welding, lighting
Construction industry Electricity, oil Mixers, lighting, transport
Grain milling Electricity, oil Motors, HVAC
Transport industry Oil Engines
Grain milling Electricity, oil Motors, lightings
Paint manufacture Electricity Mixers, HVAC, lightings
Agriculture Oil, electricity Pumps
Food and beverage Electricity, compressed air,
steam, oil Pumps, HVAC, lightings
Figure 2-1 presents the consumption of energy in Kenyan industries showing that electricity is the most
widely used form of energy in Kenya with 49 %, oil is next with 27 % and coal accounts for 16 %. Others
source of energy include: solar, steam and wind (IEA, 2012).
Figure 2-1: Consumption of energy in Kenyan industries by 2010 (IEA, 2012)
Figure 2-2 shows the generation of electricity from various sources. Generation by hydropower has the
highest amount which increases linearly from 2010 to 2013. This is because of water availability and
cheapness in generation. In future, hydro generation may face challenges due to shortage of water in the
catchment areas and high demand for water from industries such as agriculture and horticulture. Water
16%
27% 49%
8%
Coal
Oil
Electricty
Others

12 | P a g e
supply relies on weather conditions which sometimes is unpredictable and uncontrollable. Geothermal has
been one of the least cost effective methods of generating electricity. The government of Kenya has put a
lot effort into supporting geothermal development. Wind energy has not been an active source of energy in
Kenya due to its low capacity since the country is based in the equatorial region which does not
experience heavy winds. Therefore wind is not strong and persistent enough to drive turbines. Solar
energy on the other hand has not been adopted by many consumers, since most of the areas which
experience high intensity of the sun are in arid areas and desert. Also the initial cost of solar panels
installation is high. But due to the challenges with hydropower, in future consumers may turn to solar and
wind energy (Kiplagat et al., 2011).
Figure 2-2: Electricity generation by source (KNBS, 2013)
Figure 2-3 shows the consumption of electricity in various sectors in Kenya. It is clear that the commercial
and industrial sectors are the major consumers of electricity in Kenya followed by domestic and small
businesses. This is because of the various activities which are carried out in the commercial and industrial
sectors which consume a lot of power. The consumption ratio of electricity increases every year in almost
every sector, due to high demand for products and the increase in population.
0
500
1000
1500
2000
2500
3000
3500
4000
4500
5000
2010 2011 2012 2013
GW
h
Years
Hydro Thermol oil Geothermal Cogeneration Winds Imports

13 | P a g e
Figure 2-3: Electricity consumption in Kenya (KNBS, 2013)
2.4 Energy consuming equipment in industries
Energy consuming facilities vary from one industry to the other depending on the activities carried out.
According to Wang and Chen (2012) electricity is the most commonly used form of energy in both small
and large organizations. Lighting, electric motors, compressed air and HVAC systems are the most
intensive energy consuming equipment in many industrial setup.
2.4.1 Electric motors
Electric motors are devices which convert electrical energy into kinetic energy. They account for
approximately 60 % of manufacturing final electricity used (IEA, 2007). According to Worrel et al.,
(2010) motors are the major consumer of electricity in industries, they are used to drive systems such as
cutting, HVAC, compacting, mixing compressed air, grinding materials, conveying, refrigeration and
cooling systems. They account for approximate half of industrial electricity use. Overheating and
malfunctioning of motors and generators indicate mechanical or electrical failures that can lead to
unnecessary energy use, or even breakdown of equipment. In fan cooled motors if the air does not flow
freely this can cause overheating in the buildings. When there is electrical imbalance in joints and
junctions they tend to have high resistance, thus resulting in high energy loss. When connections have
corroded they increase resistance; heat losses due to high resistance means that energy is being given off
as heat instead being used for useful work. Bearings work well when they are lubricated, but when excess
lubrication is applied it can cause overheating which is another source of energy loss (Fluke Corporation,
2009). Overheating can also be caused by:
0
500
1000
1500
2000
2500
3000
3500
4000
2010 2011 2012 2013
Gw
h
Years
Domestic & small commercials commercial & industrial
Off peak Street light

14 | P a g e
a) High load changes such as frequent stops, starts, and high starting loads;
b) Overloading for a long time;
c) Failure to cool down, especially in high temperatures; and
d) Dirt clogging motors.
Hasanbeigi and Price (2010) summarised the four basic types of losses in a squirrel-cage induction motor
as:
a) Stator and rotor losses;
b) Core (Magnetic) losses – the sum of the eddy and hysteresis current losses of the laminated stator
and rotor core;
c) Friction and windage losses – the loss due to fans and the bearing friction; and
d) Stray losses – the total sum of all losses in the motor which cannot be attributed to one of the
other four major components. It is mainly due to electrical harmonics and stray currents in the
motor.
AC induction motors are commonly used in industry and commerce and are categorised into squirrel cage
and wound motors. The major parts of motors are the motor stator which is stationary and the rotor which
rotates. Mechanical power ratings of motors are either expressed by horsepower or kilowatts while power
output is determined by torque and speed (Keyes, 2007).
𝐻. 𝑃 𝑅𝑎𝑡𝑖𝑛𝑔 = 𝑘𝑊 𝑅𝑎𝑡𝑖𝑛𝑔
0.746 (2.1)
Figure 2-4 illustrates the power consumption ration of electric motor driven systems in industry. It shows
that air compressors, fans and pumps account for 55 % of total motor electricity consumption in industries.
They are the most important loads in the industrial sector. Other motors include, grinders, mixers, cutters,
hoists and cranes etc.

15 | P a g e
Figure 2-4: Power consumption ratio of electric motor driven systems (Almeida et al., 2003)
2.4.2 Pumps
Pumps are particularly important pieces of motor driven equipment in small and medium sized plants.
Pumps are categorized into positive displacement and centrifugal. Centrifugal pumps impacts motion
energy to a liquid by means of the spinning motion of an impeller. Positive displacement traps the
impacted liquid in various forms of pump cavities and displacing it to the pump discharge. Twenty one
percent of energy is used to drive equipment in many small and large plants as shown in Figure 2-4. They
are used to pressurize and transport water via pumping systems to the end users, such as kitchen,
washrooms, storage tanks, cleaning and wastewater handling operations. Pumps are also used for
transporting liquid streams such as oil and circulating it within processes. The basic components in a
pump system include: piping networks, pumps, drive motors, valves, and system controls. The efficiency
of pumps is affected by several factors including: change of inlet and outlets flow condition, wrong
configuration of the pumps, application of pumps to the wrong requirements, inefficiency of pumps
(Department of Energy, 2003). The main types of losses which occur in pumps include (McNicol 2010).
a) Mechanical losses which occur as a result of the friction of the bearings and impeller; and
b) Hydraulic losses which occur as a result of flow rate being affected by the shape of pump
impeller, viscosity of the fluid pumped and roughness of the pump body.
2.4.3 Compressed air systems
Compressed air is one of the most widely used power sources in industry. This is because it is safe and
free from pollution. The power used for compressed air is about 10-30 % of overall power consumption
(Wang and Chen, 2012). According to Shanghai and Mckane (2008) compressed air is estimated to be the
21%
16%
18% 7%
2%
36% Pumps
Fans
Air compressor
Cooling compressor
Conveyor
Other motors

16 | P a g e
most expensive form of energy available in many plants, because only approximately 19 % of the power
used by a compressor can be converted to useable work with the other 81 % being lost as waste heat.
Compressed air is stored in a tank which acts as a reservoir or in a supply network of piping that is
maintained above atmospheric pressure and to which the tools are connected (Tadhg et al., 2010). About
65 % to 75 % of manufacturing industries use compressed air to power pneumatic tools, packaging and
automation (McNicol, 2010).
Compressed air accounts for 10 % of total industrial energy use. The most common factor which affects
the working condition of compressors is the type of compressor and size. Oversized compressors operate
inefficiently (Saidur et al., 2010). Leaks can waste about 20-50 % of a compressor’s output (Abdelaziz et
al., 2011). They symbolize a significant source of lost energy in industrial compressed-air systems. Leaks
are the single highest source of energy loss in manufacturing industries. Leaks in compressed air systems
can: lower pressure in the system, increase energy consumption, make air tools less efficient, shorten the
life of equipment, lead to extra maintenance requirements and increased unscheduled downtime hence
affecting production, cause an increase in compressor energy and maintenance costs (Saidur et al., 2010).
The cost of compressed air leaks is the cost of the energy required to compress the volume of last air from
atmospheric pressure to the compressor operating pressure. Air leaks occur in joints and in connections
mostly. Most industries have compressed air in their plants, some of the common sources of energy loss in
compressors according to (Beyene, 2005) include:
a) Use of big compressors.
b) Wrong applications of compressors.
c) Air leaks.
d) Running compressors unnecessarily.
2.4.4 Heating, ventilation and air conditioning
Heating, ventilation and air conditioning are used to provide fresh air, heating, cooling and humidity
control in a building. The major purpose of HVAC is to provide comfort to the occupants which means
supply of acceptable air and removal of unacceptable air (Aduda, 2009). HVAC systems are also heavy
consumers of energy within an industry. The various sources of energy loss in HVAC include: worn out
seals, overheating of generators and motors, loose and corroded electrical connections, malfunctioning of
compressor coils and cooling fin blockages (Fluke Corporation, 2009). Sources of energy loss in HVAC
include:
a) Leak losses;
b) Lack of insulation;
c) Waste gases from boiler furnace vents and flares; and

17 | P a g e
d) Leaving the air conditioners and coolers on even when no operations are happening (Burton,
2001).
Air conditioning units or systems, when left on, can be a source of energy loss. Turning on heat generating
equipment and lighting when not needed can also increase energy loss; they should be turned off when not
in use either manually or using controls. Air leaks in ducts can reduce the cooling and heating capacity of
the system and increases energy use, leaks also allow contaminants such as dust and pollen to be drawn
directly into the system and distributed through the workplace. Sometimes air-conditioners are operated
when they are not required, especially during the night, thereby losing a lot of energy. Timers can be used
to turn off heating and cooling systems to ensure they are off when the building or room is not in use.
Operate air conditioners only when needed. HVAC system consists of thousands of field assembled joints
that are susceptible to leakage based on the quality of the material and the installation. About 30 % of the
air that moves through the duct system is lost due to leaks, holes, and poorly connected ducts. The result is
higher utility bills and higher discomfort, no matter how the thermostat is set. In any industry there are
areas in the building which are supplied with conditioned air and remain unused, which is another form of
energy loss. Blockages and obstructions also contribute to energy loss. Worn out seals in ducts and
unfastened and corroded connections can be sources of energy loss (Galitisky and Worrell, 2008). If
compressors and coils are clogged with dirt they can block and inhibit exchange of heat, therefore the
system will be inefficient thus reducing component lifespan hence increasing energy costs. HVAC
accounts for about 40-60% of the energy used in commercial sectors (Gilbride and Hollomon, 2003).
2.4.5 Fans
Fans are used in industries for various purposes such as ventilation, material handling and boiler
applications (Department of Energy, 2003). Fans are used to circulate air, ventilation, drying and blowing.
They consist of an electric motor, pipes and ducts, filter and diffusers, controllers and heat exchanger
(McNicol, 2010). Fans are divided into centrifugal and axial. Rotating impeller and housing are the fans
major components used to collect and direct air flow. Centrifugal fan uses centrifugal force to move air,
the force is produced by moving air between the rotating impeller blades and by inertial generated by the
velocity of the air leaving the impeller. Axial fans deliver air by the change of direction in velocity of the
air passing over the impeller blades. Energy loss in fans can occur due to leakage, dirt, noise belt wear and
rupture. Efficiency of fans can be affected by poor configuration of fans, wrong application of fans,
altering inlet and outlet flow conditions (Department of Energy, 2003)

18 | P a g e
2.4.6 Boilers
A boiler is a heat generator/vessel which boils water to produce steam. It is capable of converting
chemical energy into fuel and heat energy as defined by. Boilers can be classified by; the type of fuel
used, construction,draft, type of firing, operating pressure and end use (Kumar, 2009). Boilers use water,
air and chemicals as the major inputs it drains, and steam, gas, ash and blow downs as the major outputs.
According to McNicol (2010) boilers are used to generate steam, which is used for heating and to drive
mechanical systems. Losses associated with boilers include: stack losses, unburned combustibles, soot
blowing, losses in casing, loss through radiation and convection, and cost associated with fuels used in the
boilers. Excess flue gas quantities in boilers can result from leaks in the boilers. These leaks can minimize
the heat delivered by the steam and maximize pumping requirements (Brush et al., 2011).
2.4.7 Lighting
Lighting is important because it provides illumination in the work place and offices. The major types of
lighting used are fluorescent tubes and incandescent lamps (Worrell et al., 2010). Light output from a
lamp is measured by lumen, while illumination (the distribution of light on horizontal surfaces) is
measured by foot-candles or lux. In many cases only a small portion of light is used in the fixtures, the
remainder is lost as heat. The objective of lighting should be to get the highest lighting at least power
usage. Lighting in a normal building can account for about 40 % of electrical energy use. The major parts
of lighting fixtures are chokes, starters and tubes. Energy loss in lighting occurs mainly from lamps being
left on and not being utilized, from faulty fixtures and installation of more fixtures than required (Krarti
2011). Lighting can be either over illuminated or under illuminated. Over illumination occurs due to poor
lighting systems design, while under illuminations occurs due to dust in bulbs, poor quality lighting
systems, and lamp shades (Wang and Chen, 2012).
2.5 Sources of energy losses
Losses in facilities occur in various stages such as: transformation, transmission, distribution and with the
final end user as shown in Figure 2-5. Energy loss may occur due to technical and non-technical losses
along distribution lines. Technical losses are as a result of current flowing in the networks and they
include: copper resistance losses, iron losses of transformer being both hysteresis and eddy current losses.
These losses can be reduced by using thin laminations and high silicon contents. Non-technical losses
occur due to poor meter readings, unauthorized line tapping, equipment vandalism, and can lead to
inaccurate billings (Musa and Ellams, 2011). Losses in the end user process can be can be reduced by
change or upgrading of equipment, change of people’s behaviour, training and control (Morvaj and
Bukarica, 2010). Malfunctioning equipment can lead to increased energy consumption in industries

19 | P a g e
(Rafael, 2011). Poorly maintained machines and equipment do not work properly and also contribute to
operator fatigue. They can lead to significant use of energy as well as increasing operating costs and
application broader terms increase the national demand for energy, hence increasing greenhouse gas
emissions (McNicol, 2010).
Figure 2-5: Energy flow and losses (Musa and Ellams, 2011)
Energy efficiency should be a continuous process which involves: measurement, control, managing and
monitoring. For effective energy efficiency, the following principles should be considered: use energy
when it is necessary and avoid excessive use; formulate rules, regulations and policies to change people’s
behaviour towards energy, implement new technologies to measure energy; monitor energy use by
metering to know areas of improvement; and manage energy by means of proper maintenance practices. In
order to improve energy efficiency, energy management is the key factor and means meeting the energy
demand when and where needed. The objective of energy management is to minimize the energy lost,
hence reduce operations costs without affecting the quality of production, and to minimise environmental
pollutions. Some form of energy savings by management include:
a) Energy audit;
Primary energy
•Transformation lossses
Secondary energy
•Transimission and
distribution loseses
Final energy
•Loses from inefficent equipment's,process
and behavior
Useful energy

20 | P a g e
b) Energy efficiency training and programmes;
c) Good organization and housekeeping;
d) Purchasing high efficiency equipment; and
e) Allocation of funds.
Energy management must have a structure to follow in order to coordinate the activities. Some of the key
factors to consider in organizing effective management programmes as discussed by Becker and Wayne
(1996) include:
a) Set goals and objectives;
b) Formulate energy teams;
c) Obtain top level management energy commitment;
d) Bottom level commitment;
e) Communication channels;
f) Evaluation, monitoring and control systems.
2.6 Energy use in vehicle assembly plants
The overall energy consumption during the manufacturing of cars rotates in four stages: car raw material
processing, manufacturing, use and recovery. In motor vehicle assembly plants, energy is used throughout
the process. The energy types commonly used are electricity, steam, and compressed air. A huge portion
of the budget is spent on paying electricity bills compared to other expenses. About 60 % of expenditure is
spent on electricity bills. Energy is used in various sections in vehicle assembly plants, fuels are mainly
used for generating hot water and steam for paint booths and heat for ovens. Fuel is also used in space
heating, drying and conditioning the air. Steam is used in the curing ovens of the painting lines. Electricity
is used throughout the process for compressed air, metal forming, lighting, ventilation, air conditioning,
painting, operating fans, infrared curing material handling as well as welding. Motors are the main
electricity consumer in the vehicle manufacturing industry because they are used to drive many systems
such as HVAC, compressed air, cooling and stamping. Estimates of the distribution of energy use in the
vehicle assembly processes are rare and may vary from plant to plant. Not many plants have separate
metering of energy use at different locations and processes. Lighting is also another consumer of energy in
vehicle assembly plants because light is used throughout the manufacturing process for good vision. High
intensity discharge lamps are used for manufacturing and storage areas, while fluorescent and compact
lamps are used for lighting in offices and any other place needed (Galitisky and Worrell, 2008).

21 | P a g e
2.7 Other related research on improving energy in automobile industry
Neeraj et al., (2014) researched an ideal vehicle assembly sequence based on links and preference graphs.
By use of the available connections, multiple precedence graphs can be formed regarding assembly
sequence and different assembly times. From these sequences an improved sequence can be formed so
achieving minimum assembly time. They stated that it is important to have a viable sequence of assembly
to minimize the factors affecting cost such as number of employees required to finish certain jobs,
assembly time required, tools and equipment required. They used liaisons and precedence graph
techniques to measure the assembly sequences and the time taken with different sequences. The paper
focused on minimizing the time required to finish assembly to reduce operating costs, but it did not
consider energy as a way of reducing cost.
Galitisky and Worrell (2008) presented research on energy use in vehicle assembly plants and summarised
the cost saving opportunities. The research was conducted in the United States which is a more developed
country than Africa, especially Kenya, where the current study was conducted. They used a case study and
literature review to conduct research. They found out that, vehicle assembly plants in the United State
although they have energy management teams and programmes, there are still opportunities to minimise
cost in various process, utilities and systems.
Claudia et al., (2011) presented a case study on how to reduce energy usage in automotive paint shops
through production design, carefully selection of the repair capacity, reducing the number of repainted
jobs hence reducing the amount of energy and materials utilized. Using modelling and problem
formulation, they stated that, it is possible to reduce the capacity of jobs going through the painting
process thus saving energy of up to 12 %. They concluded that redesigning spot repair to control
unnecessary repainting can save energy up to 4 %. They argued that although increasing repairs may lead
to increased costs and work force it reduces the amount of energy used.
Grobler and Dalgleish (2004) summarized a case study of a glass manufacturing company in Nairobi,
Kenya on usage of energy, and performed analysis of saving opportunities available. A walk through
energy audit was conducted on the auxiliary equipment such as furnaces, compressed air and lighting.
Energy bills for 25 months and fuel bills for 9 months were analyzed in the research. It was found that 36
% of electricity is consumed by the booster electrodes in the furnace and the other major portion goes to
compressors. They recommended that lighting to be switched off during daytime, separation of lighting
switching, replacement of lamps and fuses which are drawing unnecessary power and cleaning of light
fittings to increase illumination.

22 | P a g e
Muller et al., (2007) in their case study of the food processing industry presented methods of saving and
tracking energy using top-down and bottom-up models. The top-down model identifies the consumption
rate between different users in the factory and main energy drivers. Multiple regressions were used to
define dependent and independent variables such as production volumes and energy consumption. Top-
down was based on utility bills, while the bottom up model uses thermodynamic modelling of the energy
consumption at different stages of operation. Hence the models are used to determine the global energy
consumption. In this case a study top-down model was used to determine fuel and electricity consumption.
They found that the coefficient of determination of fuel and electricity was 0.954 and 0.872 respectively.
They concluded that energy savings could be achieved by using good housekeeping which has limited
investment.
Fysikopoulos et al., (2012) presented various scenarios and demand profiles of energy consumption in
automotive assembly lines. They used simulation methods to investigate energy aspects and performance
measures. The under body of a car was modelled and simulated because it is the one that holds and
connects major components like engine suspension and transmission. Energy use both in idle and busy
status were the key factors for modelling and calculations presented. The results indicate that the energy
consumption level is proportional to the work input because the higher the workload the more the energy
input. The energy used during the idle phase is minimal compared with the energy consumed during a
busy phase, but this idle time can be eliminated by planning and balancing of work. This case study only
considered one phase, which consume power in vehicle assembly plants, out of many processes of car
assembly which consume power.
Oyedepo and Oladele (2013) analyzed sources of energy and level of energy consumption in two
companies. They highlighted the gaps in energy use and identified areas to improve energy in food
processing industries and distillation and bottling companies in Nigeria. They used energy audits, on site
study and oral interviews as data collection tools. The study showed that among the equipment that uses
electricity, electric motors were the major consumer of energy accounting for 40-47 % of electrical energy
consumed. It was observed that none of the companies utilize the energy sufficiently due to factors such
as: switching on the light during daytime, use of weak electrical motors which have been rewound twice
thus they generate excessive noise and much heat, poor housekeeping of HVAC and poor insulation of
boilers.
Saidur and Mekhilef (2010) presented methods of energy use and conservation in Malaysian rubber
producing industries. By use of walk through audits and questionnaires energy consuming equipment data,
power factor and power ratings were collected. Estimation of annual energy use, savings and payback
period of motors, boilers and compressed air was calculated using mathematical formulas. They found that
electric motors are the major consumer of electricity followed by pumps, heaters, lighting and cooling

23 | P a g e
systems. They concluded that a significant amount of energy can be saved by use of high efficiency
motors and variable speed drives.
Bhaskar (2009) presented an energy management case in car paint and assembly shops. They stated that
during manufacturing of car, paint and car assembly shops consumes an energy estimate of 500 to 700
kW/h per vehicle. The energy cost consumed in these shops is roughly about 9 % to 12 % of the
manufacturing cost. If energy cost can be reduced to 20 % it can lead to about 2 % to 2.4 % reduction in
total manufacturing costs. To overcome the energy challenge the car industry must have energy vision,
install management systems with continuous monitoring and report analysis, have dedicated and
empowered teams to initiate and train all stake holders, create awareness on energy efficiency, set and
allocate financial budgets to control energy and consult with external experts on energy efficiency. They
stated that effective management of electrical energy requires monitoring, accounting, analysis, decision
making and implementation. They concluded that to achieve energy efficiency the organization has to
have dedicated energy management staff and be committed.

24 | P a g e
CHAPTER 3: BARRIERS AND OPPORTUNITIES FOR ENERGY
EFFICIENCY IN INDUSTRIES
3.1 Barriers to industrial energy efficiency
A barrier is a postulated mechanism that inhibits investment in technologies that are both energy efficient
and economically efficient. Energy efficiency is invisible to many companies that become one of the
greatest barrier in industries (Chai and Catrina, 2012). The forms of industrial energy efficiency barriers
are discussed below.
3.1.1 Limited capital
If an organization is constrained to obtain capital through internal funds, and has limited access to
additional funds through borrowing or share issues, investing in energy efficiency investments may not be
a priority. Only investments resulting in an expected return will be recognized. In some organizations
budgeting laws may hinder organizations from borrowing capital. When access to the capital market is
constrained, the distribution of funds within an organization becomes even more important. The doubts
associated with the returns from investments from energy efficiency still remain a barrier to many
organizations. If investments in energy efficiency are implemented well this can lead to lower energy bills
and thus reduce the financial risks associated with the energy price (Sorrell et al., 2011).
Investing in a more energy-efficient technology may turn out to be unprofitable if energy prices of fuel fall
after the new technology has been implemented, thus fewer managers will invest heavily on it (Fleiter et
al., 2011). Access to capital, both internal and external is also a barrier to many managers. The priority of
projects in an organization matters a lot, major projects are considered more than minor projects. Energy
as any other project requires financial attention for its implementation. Resources are required to cover the
costs of control, energy management projects as well as for training programmes. In most organizations
capital resources are reserved for core business elements such as production and neglect secondary
functions such as energy management. This means that not only are there no funds for energy projects, but
the resources to manage energy are also not there. To effectively manage energy, it is recommended for an
organization to make energy a core function by employing personnel skills, allocate capital, implement
and control energy programmes. The non-availability of sufficient credit facilities and difficulties in
obtaining required finances for energy saving projects are strong deterrents to investment in energy
efficiency (Brown, 2000).

25 | P a g e
Capital access has been the greatest barrier to energy efficiency; organizations with above average
earnings are more likely to participate in energy programmes than smaller organizations with less earnings
(Sardianou, 2008). Lack of capital is the major barrier related to energy policies (Backlund et al., 2012).
Often controls are considered late when a building has already been put up, when all the money has been
exhausted and so they cannot be implemented (Roth et al., 2006).
3.1.2 Lack of information and data
Lack of reliable information, data and user dilemmas are also barriers to energy efficiency which have
significant effects, although they vary across sub sectors (Schleich and Gruber, 2008). Wrong information
means that the knowledge of energy efficient techniques, its costs, saving potential and the actual
consumption of the equipment are not clearly known by many organizations (Fleiter et al., 2011).
Information which is not credible and high cost of obtaining the information is also a barrier to energy
efficiency (Worrel and Prince, 2001). Due to the time consumed in collecting data and analyzing it
becomes very difficult for small companies to have enough information. Many users have minimal
knowledge on how to make their product energy efficient nor do the suppliers have enough knowledge
(Trianni and Cagno, 2012).
Decision making about energy is being based on rule of thumb and not perfect information. Information
should be specific and simple to understand, credible and build trust in order to succeed in delivering.
Very few organizations have a continuous program of monitoring and recording of energy data, such as
rate of fuel consumption, therefore they end up not having data at all concerning energy (Beyene, 2005).
Due to lack of financial allocation, no proper equipment are widely known to measure energy so no proper
data are known regarding consumption, loss and energy cost. To achieve proper management, data on
usage, demand utility rate, average price, and energy consumption per unit of output must be available and
used to influence organizational decisions. Personnel are also not there to collect, analyze and report
energy cost consumption and efficiency information. The form of information delivered to recipients also
is a barrier, so receives little attention from the recipient. People are selective for information; they only
receive and understand the information which they want, for example information which is specific in
nature, stunning and presented in good manner is likely to be adopted quickly (Brown, 2000).
Firms may lack information about the savings potential because of technological reasons that they cannot
measure energy consumption regularly. If the rate of energy consumption is to be measured regularly,
mostly it may not reach at the level of individual buildings, rooms, or end-use equipment. If organizations
lack significant data on energy-efficient practices or information on how to use available energy, the
savings potential for employing energy-efficient technologies remains a mystery and investments in it
cannot be properly implemented (Schleich and Gruber, 2008).

26 | P a g e
3.1.3 Cost
The costs of collecting and analyzing data are insignificant for many companies (Trianni and Cagno,
2012). Mostly, managers overlook energy waste because it is a small percent of production costs.
Employers are not willing to spend money on energy investments such as on education, training, and
consultancy which can give solutions to energy efficiency. A major energy challenge is to identify
manufacturers’ fixed energy costs. Managers at each stage of manufacture may overlook energy as waste
because energy is only 2-5 % of production costs, but the prices of final products must absorb these layers
of energy inputs. For example:
The direct energy cost of assembling an appliance might be only a few dollars and a very
small fraction of its retail cost. But in the big picture, there was energy consumed in mining
the appliance’s iron ore, copper, bauxite, metal treating, in rubber and glass manufacture, in
powerhouse fuels for the facilities that make plastics, paints and dyes, and in energy
feedstocks, which are energy commodities consumed directly as product ingredients (NAM,
2005).
The costs associated with searching and acquiring information on the energy performance of technologies
is still not considered in many organizations (Sorrel, 2000).
3.1.3.1 Transaction cost
If the costs for a particular practice are expensive, the investment in it may not be profitable, such as costs
of gathering information about energy-efficient equipment or the cost of energy performance of particular
technologies, organizations may lack information about strategies to save energy. Transaction cost also
include the cost of establishing and maintaining an energy efficiency programme. Cost of investing in
energy efficient technologies include broader investment, such as cost of investing in high efficiency
motors (Sorrell et al., 2011).
3.1.3.2 Hidden costs
Hidden costs are another barrier which is not visible by many organizations which can result in poor
quality of energy efficient equipment. When the hidden costs are eliminated, they can lead to reduction of
waste, materials and maintenance costs. Managers face the barrier of high cost of implementation and low
rate of return. The cost of gathering, evaluating and applying information about energy savings and
measures plus the cost of negotiating with contractors, cost related to reaching, monitoring and enforcing
agreements may be high and the investment may not be profitable to the organization (Fleiter et al., 2011).
Hidden cost may also include the following (Thollander et al., 2010; Sorrell et al., 2011):
a) Cost of inconvenience, overhead costs and cost of production disruption;

27 | P a g e
b) Cost of training staff, replacement costs, cost of employing specialist people (e.g. energy
manager);
c) Costs associated with collecting, gathering, analyzing and applying information; and
d) Cost of energy auditing.
3.1.4 Organizational and human barriers
If organizations have low status of energy management, it may lead to lower priority within the
organizations. Management may not experience environmental repercussions regarding misuse of energy
therefore give a lower priority to energy efficiency improvements. Management may also resist change
and give greater weight to certain outcomes such as production compared to energy efficiency (Trianni
and Cagno, 2012). Large organizations have a wide variety of staff, financial resources, time and
technicality for energy efficiency investment. They also enjoy a wide international network with other
multinational companies. Due to their financial capability, they are in a position to acquire and adopt new
technologies faster than small companies which have no financial resources. In small companies energy
efficiency programmes are not implemented due to fear of loss of production; production tends to take a
bigger percent of company investment than energy review (Chai and Catrina, 2012).
Decision making on how to invest in energy efficiency depend on the behaviour of managers mostly; it is
overlooked in many organizations because it is not a core business. Management attention is mostly
focused on crucial areas which keep the company going. Some managers are hesitant to initiate energy
efficiency projects if the repercussions of failure are perceived to be large. Others are resistant to
technological changes because they do not know how to executive an energy conservation project or how
to measure energy savings. Shortage of trained personnel leads to difficulties of implementing energy
efficient equipment, shortages of labs and apparatus are also obstacles to achieving energy efficiency.
Government bureaucracy and procedures to follow regarding financial capital is also another barrier. The
main challenge to promote energy efficiency is to overcome barriers of energy efficient technologies
(Sardianou, 2008).
3.1.4 Lack of management staff awareness
The majority of managerial staff have no idea of energy management that is why they do not allocate
funds for energy because they think it is a small portion of production. They normally consider the output
in terms of units of production They ignore small issues such as air leaks from a hose pipe – they consider
it to be just air but they do not realise it is being compressed with energy. A little air loss can result in a
large energy loss. Plant operators who assume that scrap rates are of no importance because scrap can be
melted down and used again, do not consider the excess energy consumption that this practice requires.

28 | P a g e
Collecting information about energy efficiency or about the energy performance of certain technologies is
costly. Organizations may not have adequate information about the ways to save energy, they may not be
aware of the savings potential (NAM, 2005). Energy efficiency can only succeed if there is a person in top
management who knows the value of improving it (Thollander et al., 2010). Other unpublished research
has shown that many workers waste energy by leaving machines and equipment on, leaving the lights on,
continuing the use of an air conditioner even if it is not necessary and also leaving doors and windows
open. Managers are more concerned about initial costs rather than annual savings when planning to invest
in energy efficiency (Chai and Catrina, 2012).
3.1.5 Outdated equipment
The decisions made on energy investment are often not based on the actual information because of time
constrains and lack of proper equipment (Backlund et al., 2012). Many industries have only one utility
metre to measure energy consumption for the entire plant. Improper allocations of energy costs may
distort financial decisions such as product pricing, income tax, declarations productions mix,
compensation and bonuses, and capital investment allocations. But today advanced energy metering
technologies can monitor actual consumption by substations within a facility, hence improving a
department’s manager’s oversight abilities. The slow rate of progress in achieving higher standards of
energy consumption in equipment and appliances can also affect the adoption of energy saving measures.
There is often a long life time of industrial energy efficiency equipment such as kilns and furnaces. Due to
poor technology changeover to energy efficient devices and measures, especially in small and medium
sized organization may lead to poor results on energy measurements (NAM, 2005). Selection of the wrong
equipment or device for the wrong job is another barrier (Almeida et al., 2003). High initial cost of buying
equipment, which in turn does not deliver the expected results can make an organization lack trust from
the suppliers because of the bad past experience on energy saving equipment (Beyene, 2005).
Malfunctioned equipment can lead to greater use of energy consumption in industries. Poorly maintained
machines and equipment normally do not work properly, and they can make the operator feel bored and
fatigued (Rodriguez, 2011).
3.1.6 Lack of skilled personnel
Lack of skilled personnel can lead to difficulties in selecting and installing new energy efficient equipment
compared to the simplicity of buying them. Many industries lack trained technical personnel and the ones
who are there are busy maintaining production rates. The position of energy or environmental managers
within the company hierarchy may lead to less attention to energy efficiency and reduced availability of
human resources to evaluate and implement new measures. Lack of skilled personnel may lead to lack of
technical knowledge, shortages of labs, inspection apparatus which are obstacles to achieving energy

29 | P a g e
efficiency targets (NAM, 2005). Hiring of unqualified or inexperienced contractors can also be a barrier to
energy efficiency (Beyene, 2005).
3.1.7 Lack of cooperation among departments
Each manufacturer’s priority is to make products and sell them at a good price. All job descriptions and
accountabilities are tied to make production. Departments within a company often compete against each
other in the budget process. Energy efficiency is most likely costed from the maintenance budget, but a lot
of savings go to the production budget. When departments do not cooperate, waste is allowed to continue,
unless top management takes action, energy efficiency is a duty that occupies the blank space in
personnel’s mind (NAM, 2005). Barriers exist at various points in the decision making process,
implementation and management measure to improve energy take different forms depending on the nature
of the organization (Worrell and Prince, 2001).
3.1.8 Split motivations
Split motivations constitute a third form of distorted information, and these occur when the possible
adopter of an investment is not the party who pays the energy bill. If this is the case, materials about
available cost-effective energy efficiency measures in the hands of the potential adopter may not lead to
adoption of the measures. Instead, the measures will only be assessed if the adopter can recover the
investment cost from the party benefitting from the energy savings. A manager in an industrial company,
who pays the energy bills for his or her territory based on workers or per square metre, may have less
interest in the organization’s overall in-house energy management program. This is because investments
leading to lower energy costs, including investments in energy-efficiency technologies, have less effect on
the division manager’s own track record, but instead create a heavier financial burden for his or her
division (Thollander and Palm, 2013). If an organization cannot gain benefits from energy efficiency
investment, then less implementation will be accomplished (Thollander et al., 2010).
3.1.9 Heterogeneity
Heterogeneity is related to the fact that even if a given technology is cost effective, it may likely not suit
all industrial companies, especially companies dealing with a single type of product, or technologies with
limited application due to heat, contamination, or other specific conditions. For example, a heat exchanger
may not function on an exhaust ventilation flow that contains too much process related to particular matter
(Thollander and Palm, 2013).

30 | P a g e
3.1.10 Culture and power
Less power possessed by the energy supervisor of an industrial organization may pose a barrier to
improving energy efficiency. Energy management practices often do not receive sufficient attention, even
in energy-intensive industries, constraining the implementation of energy efficiency measures.
Organizational culture is related to the values of the individuals establishing an industrial organization,
and may inhibit the adoption of energy-efficiency technologies (Thollander and Palm, 2013). Management
people who resist change can often overlook effective measures which are cost effective. Energy issues
are normally looked down on in the management, and low importance of energy in an organization leads
to less implementation of energy measure (Thollander et al., 2010).
3.1.11 Principal relationship
Principal or agent relationship arises due to lack of confidence between two parties at different levels of
management in organizations. The top managers may not be well informed on energy efficient
investments and thus they may neglect it (Thollander and Palm, 2013).
3.1.12 Results not sustained
Sustaining the effort in energy management faces the same concerns as shifting priorities. Energy
problems are handled with crisis approach, after the perceived crisis passes or is superceded by other
concerns, the effort devoted to managing energy is removed and placed elsewhere (Fleiter et al., 2011).
Poor understanding of energy expenses has led energy issues to be considered only when there is an
energy crisis in the organization (Beyene, 2005).
3.1.13 Bounded rationality
Due to bounded rationality, when a company is faced with a complex decision structure, managers may
not be able to adjust because of lack of time, attention, or the capability to adequately process information.
Instead, bounded rationality may result in using routines or rules of thumb (Schleich and Gruber, 2008).
3.2 Energy saving opportunities in management
The following sections outline some of the opportunities for energy efficiency.
Energy management is efficient use of energy to maximize profit and minimize waste (Capehart et al.,
2003). It involves optimization of energy usage at different stages in the process of production, in the
plant, in the most efficient method. It should aim at minimizing the energy use, waste and the
environmental effects without affecting the quality and production of products (Backlund et al., 2012).
This can be achieved by using systems and procedures to reduce requirements per unit of the output, while

31 | P a g e
minimizing total cost of producing the output. The most important step in the energy management process
is the identification of energy conservation opportunities. Energy management involves metering energy
consumption, collecting data, finding opportunities to save energy and taking actions to save energy
(Blume, 2011). Effective energy management involves: monitoring, recording, analyzing, and controlling
energy flows through systems so that energy is utilized well. The purpose of energy management include:
a) Reducing the total amount of energy required to produce goods and services.
b) Reducing cost by minimising energy use, hence improving energy efficiency.
c) Improving the quality of the environment by reducing greenhouse gases, thus increasing the
reputation of the company.
d) Reduce maintenance downtime hence increase production.
Energy management and efficiency is the most cost effective way to eliminate carbon dioxide emission
and also to control climate change (Chai and Catrina, 2012). Energy management mechanism plays an
important role in the energy savings in any organization. Energy saving can help the industries to decrease
the amount of the energy bill (up to 30 %), prolong the lifetime of equipment and machines and reduce the
down time of maintenance. By saving energy, the industry can improve its reputation by demonstrating
good responsibility to the environment by reducing greenhouse gas emissions (Backlund et al., 2012). The
wider benefits of saving energy include: reduced national demand for energy, less need for investment in
energy infrastructure, and reduced greenhouse gas emissions (McNicol, 2010). Other benefits of energy
efficiency investments include: reduced energy costs, better working environments, higher staff
motivation, improved quality and productivity, savings on raw material, emissions reduction, extended
equipment life and reduced maintenance cost (Sardianou, 2008). Energy efficiency avoids direct economic
costs, minimizes direct environmental threats and delivers better services (Lovins, 2004). Key concept
indicators of energy efficiency include: reduce, avoid, monitor and manage. To understand the above
concepts of energy efficiency, energy flow from primary input to energy carriers up to useful energy
consumed must be understood first.
Useful energy = Primary energy – Energy loss
Losses mostly occur in energy distribution, transformation, transmission and in final use. Energy wastage
can be avoided by better organization, better energy management and change of consumers’ behaviour
and lifestyle (Thollander et al., 2010). Energy conservation methodologies involve:
a) Good housekeeping measures;
b) Commitment;
c) Setting goals;
d) Allocation of funds;
e) Training and energy efficiency programmes;

32 | P a g e
f) Monitoring and control;
g) Record of data;
h) Forming of energy teams;
i) Formulation of policies;
j) Benchmarking; and
k) Energy audits;
Some of the energy conservation methodologies are detailed below.
3.2.1 Commitment
No matter the size of the company energy management needs the commitment of employees at all levels.
Without good leadership in energy management it is insignificant. Without good commitment from top
management level little can be done on the lower level (Douglas and Laura, 2001). Management must
formulate, communicate and embrace the organization’s energy management policy. The policy should set
the tone for the entire organization and establishes a firm commitment to energy efficiency. The
management should be committed to energy management by conducting regular management reviews,
these should be determined by energy indicators, and projects completed resources needs and future
planning (Brown, 2000).
3.2.2 Setting goals
Clear goals should be well defined and written such as how to reduce energy use per year or per month.
These goals should allow communication in the company. They should be communicated to all levels.
Communication can be in the form of brochures, meetings and seminars. Brochures containing the mission
and vision of energy management can be distributed to everybody in the company. Meetings are
important; in the meetings past experience is shared and amendment of the future is strategized (Douglas
and Laura, 2001).
3.2.3 Monitoring and tracking
A company with the mission of controlling energy, monitors and tracks its usage. This can be done by
checking the energy bills and reading the meters. If an energy usage savings potential area is identified, a
submeter can be installed. Once the record of energy is captured it can help to control energy use by
identifying sources of energy loss and the available opportunities to save energy, it can also help to
monitor the energy goals set and to revise them. A clear monitoring and recording system is essential, it
increases the reliability of the process for all partners and the public. The progress of a well-operated
monitoring system project should be evaluated in a way that can be used to fine-tune policies if necessary.

33 | P a g e
This minor adjustment of policies helps partners to achieve agreed goals without the disruption of the core
business process and to build trust by all parties in the process (Douglas and Laura, 2001).
Monitoring facilities and keeping track of energy consumption if well managed can give an indication of
failure or success of the measures. It can also help in identifying other alternatives, and coming up with
new technologies. Monitoring can be done weekly, or monthly according to the agreement between the
manager and his/her energy team. Introducing regular scheduled maintenance program can save up 180
mW/h (Gordic et al., 2010). Energy monitoring systems are key tools that play an important role in energy
management. These may include energy sub-metering at the equipment, component, or process level. It
can also be used to track various end uses of energy for a period of time for energy efficiency
improvement analysis. Energy monitoring and metering can play a key role in alerting energy teams to
problem areas and in assigning accountability for energy use within a facility. Energy monitoring and
metering systems can provide useful data for corporate greenhouse gas accounting initiatives, and can also
help companies participate in emergency demand response (Brush et al., 2011).
3.2.4 Housekeeping
Housekeeping involves arranging every point of industrial operations. It means having all the items in
their proper place and removing the unnecessary items. Good housekeeping avoids accidents such as slips,
trips and falls. It also reduces harmful materials from entering the rooms such as dust, pollen and vapours
which can accumulate in the wall, making them less reflective, hence increasing energy use in a room
(Abdelaziz et al., 2011). Housekeeping is more than ordinary cleanliness of the floors walls and furniture.
It requires tidy surroundings such as the avoidance of congestion, layout of the whole workplace, the
marking of gangways, adequate storage arrangements, suitable provision for cleaning and maintenance.
Good housekeeping reflects a well-managed organization and it can impress all who enter there, hence
increasing product sales. Some of the good practice for housekeeping include:
a) Well distributed lighting which should be maintained. Lighting efficiency may be improved by
20-30 % by simply cleaning the lamps and reflectors.
b) Daily waste, to prevent congestion and odour scraps, should be disposed of and spillage be
avoided. If there is a lot of sticky spillage a lot of time and energy will be spent on cleaning.
Provision for containers to put waste should be provided and workers encouraged to use them.
c) Well painted wall which reflects light.
d) Regular maintenance of the machines such as lubrication, inspections and repairs (Abdelaziz et
al., 2011)..

34 | P a g e
3.2.5 Training programmes
Training on energy management should be conducted to create awareness amongst new and old
employees. The message can be communicated directly through: email, presentations, trainings, posters,
staff newsletters, walk around, stickers, word of mouth, displays, competitions, internal communication
via pays slips, energy literature and suggestion schemes. When communicating, use the appropriate
language do not use technical languages keep it simple and to the point. Use of technical terms in the
message may not understood by the majority; also, select the communication channel wisely. Monitoring
of energy awareness and review is important throughout. Staff can be trained on simple skills to be
practiced daily such as the benefit of switching off the light when not in use, which, if done continuously
for a longer period of time can save more energy (Abdelaziz et al., 2011).
Technology change in equipment, changes in staff behavior and attitude can have a great impact in energy
conservation. Energy efficiency training programmes can help staff incorporate energy management
practices into their work. Every staff member should be aware of the company objectives for energy
efficiency improvements. Mostly energy management information is mostly known to people of lower
level and never passed to the higher level management. Energy efficiency programmes with regular
feedback on workers behavior, such as motivation systems, have had the best results. Though changes in
workers behavior such as switching off lights when not in use or closing windows and doors often save
only small amounts of energy at one time, taken continuously over longer periods, they can have a much
greater effect and end up saving more in the long run. Energy management programmes can include
metering, monitoring and control systems. Forming energy teams have been the way to successful
programmes in many organizations, which consist of people from different departments who have
different knowledge and skills (Galitsky and Worrell, 2008).
Awareness should be created in the organization both for the new and old employees. The organization
new employees should be informed about energy issues through training as part of induction, tools such as
posters, emails, brochures and pamphlets should be used to communicate the message. To maintain the
message, action should be put in place, communication of the same message should continue, and
assessing what is working and what is not working. For new equipment, people should be trained to use
them and to do simple maintenance in case of failure (McNicol, 2010).
3.2.6 Benchmarking
Benchmarking is important in relation to energy management activities. It enables organizations to decide
whether improved energy performance should be calculated for a facility, procedure or piece of equipment
and assists them in achieving their energy reduction objectives. Benchmarking helps organizations to set

35 | P a g e
and implement methods to evaluate the practicality of objectives and goals. The incorporation of a
management plan and benchmarks can enable an organization to advance its level of energy performance,
hence save money and reduce greenhouse gas emissions (Boyd et al., 2008). Benchmarking is an effective
means of raising management awareness of internal energy consumption. It provides a means to compare
the energy use of one company or plant to another which produces the same products (Worrell and Prince,
2008). Benchmarking helps individuals to understand where they are and where they need to go. Some of
the objectives of benchmarking in energy efficiency includes: improving energy efficiency, financial
savings, economic benefits, emission reduction and reduction of global warming (Birchfield, 2001).
3.2.7 Records of energy data
Data recording is very important in energy monitoring, without data the industry cannot be aware of how
much energy is consumed and the percentage which is lost. All data collected should be kept as a source
of reference. The data can be collected using well calibrated and maintained equipment; for higher
efficiency energy software can be used. Data can be tracked on a monthly basis, seasons and years, then
comparisons can be made and the root source of energy loss can be investigated quickly (Brown, 2000).
3.2.8 Resource allocation
At the end of the financial year a portion of funds should be allocated to energy management. This money
should assist in employing experts on energy, implementing energy programmes, collecting data,
maintaining equipment and for continuous control and monitoring. The money should be given directly to
the energy department (Brown, 2000).
3.2.9 Policy
Policy is the manner by which government chooses to address issues of energy regarding production,
consumption and distribution. This may include legislation, agreements, rules and regulations. Some of
these policies and programmes include:
a) Regulations and standards: these are obligatory policies for improving energy efficiency. They
are usually applied to specific pieces of equipment such as motors and boilers. They can entail
that industrial facilities have an energy manager to conduct energy audits, or adopt an energy
management system.
b) Fiscal policies: These include imposition of taxes, tax returns and investment tax for energy
efficiency promotion where taxation policies are mandatory. Agreements are between
government and industries and are encouraged by government to be undertaken by the industries
to help in managing energy efficiency.

36 | P a g e
c) Agreements and targets: An agreement is a contract between the government or any other
regulating body and a company. Agreements to meet specific energy use or energy efficiency
targets can be widely used in industry. These agreements can be between the government and a
company to improve energy. The company may promise to attain certain energy efficiency
improvements like emission reduction, the government on the other hand may promise to
financially support the company as stated by Abdelaziz et al., (2011).
Realizing full industrial energy efficiency potential requires improvements to public policy intended to
overcome market-related barriers (Blume, 2011). For effective energy management a company should
have a well-defined policy. Energy efficiency has to be part of a company’s overall plan to be effective.
The energy policy should have a purpose which is contributing towards achieving the company goals and
it should be motivating. The energy policy should contain the following (Kini and Bansal, 2011):
a) Energy policy and the purpose.
b) Objectives of the energy policy.
c) Commitment and involvement of employees.
d) Action plans with targets for every process and system.
e) Budget allocation for various activities.
f) Responsibility and accountability at all levels.
Energy policies in the manufacturing industry must be accompanied by raising energy awareness amongst
employees. Workers should be involved fully to make sure that energy efficiency improvements are put in
place, because they are the ones who consume energy and perform the daily activities, so their attitude to
energy and their daily activities influence energy consumption considerably. The workers aims must be
aligned with the company’s energy goals and these goals should be achievable. Without a performance
measurement system, the energy strategies or policies cannot be evaluated so performance measures
should be put in place (Blume, 2011).
3.2.10 Energy manager and teams
Forming an energy management team is a sign of commitment to energy efficiency. The team should be
responsible for planning, implementing, benchmarking, monitoring and evaluating the energy
management programmes. It can also train, conduct research, communicate results, providing employee
recognition and come up with the way forward for energy management (Brush et al., 2011). Team
members should be allocated duties, and they should have roles and responsibilities with clear aims and
objectives. The energy team should include members from each department of the company and should
participate fully both in meetings and training. The energy team should also conduct audits and come up
with best practices to be implemented in the industry and identify key opportunities for energy efficiency

37 | P a g e
improvements. The progress should be communicated to the line managers and employees and recognition
and rewards program should be put in place. They should also come up with a mechanism and equipment
for tracking and communicating the progress across the organization (Worrell et al., 2010). Energy teams
should review energy data and do benchmarking (Galitsky and Worrell, 2008). They are also responsible
for advanced educational and promotional actions to change an employee’s behaviour and attitude towards
energy use in the work place (Thollander et al., 2010).
3.2.11 Energy efficiency programmes
Energy efficiency courses and training programmes are very important in an organization which aims to
reduce energy because they increase the awareness of people who are involved in the industrial sector
about energy savings. A stable energy management program is required to provide proper guidance in
managing energy in an organization. It should not be a one day task, but should be implemented
continuously to enhance improvement. A successful program requires commitment to energy efficiency,
which involves establishing energy policies and energy teams. From good programmes a company can be
able to set a baseline and set a target for future improvement. A company can have programmes in which
utility companies provide financial incentives to customers who reduce their energy loads during peak
demand times (Galitsky and Worrell, 2008).
3.2.12 Energy audit
Energy audits are the best way to know the energy consumption rate (Rodriguez, 2011). Energy auditing
of buildings or facility can range from a short walk-through to a detailed analysis. There are generally four
types of energy audits: walk through audit, utility cost analysis, standard energy audit and detailed energy
audit. An energy audit helps to determine where a building or plant uses energy, and identifies
opportunities to reduce energy use (Hasanbeigi and Price, 2010). Industrial energy audit is detailed in
Chapter 4.
3.2.13 Equipment labelling and upgrading.
Product labelling provides information about equipment performance and characteristics such as energy
consumption and operating costs which are easily available. Labels assist equipment purchasers in making
informed decisions, while increasing the attention paid to energy use. Labels are especially useful for
small items which are often purchased without much study such as pumps, fans, compressors and small
boilers. Labelling also helps the end user of the equipment to supply it with the required power and thus
can prolong the life span of the equipment. When buying any equipment, it is recommended to define its
need and read the energy efficiency rating (EER). This enables one to compare operating costs and
determine which equipment is correct. In most cases more energy efficient equipment costs more than less

38 | P a g e
efficient equipment, but the savings are significant over the life of the equipment. Modern equipment and
processes are known to be more energy efficient than old aged equipment (U.S. Congress, 1993). If
successful energy management practices are put in place improved technology and upgrading of
equipment can be more efficient (Backlund et al., 2012).
3.3 Energy savings through support process of industrial energy systems
This section provides an overview of improving energy efficiency through support systems for the
machines and equipment used in various industries. The major equipment which can save energy if well
maintained are:
a) Electric motors;
b) Compressors;
c) Fans and pumps;
d) HVAC;
e) Lightings; and
f) Boilers.
3.3.1 Electric motors
Electric motors consume a lot of power in industry since major processes and activities depend on motors
as prime movers, such as air compressors, HVAC, fans, robotics and material handling. It is estimated that
68 % of electricity is used in these motorized systems (Galitsky and Worrell, 2008). Motors often run for
many hours and they may last for a couple of years, therefore, when buying, high efficiency motors can be
specified in order to minimize electricity consumption. To improve motor efficiency, improvements such
as using improved steel properties, using thinner laminations, increasing conductor volume, modifying
slot design, narrowing the air gap, improved rotor insulation and using more efficient fan design can be
included when designing a motor (Tadhg et al., 2010). Using adjustable speed drives (ASD) which
matches speed to load ensures that motor energy is used well in any given application. Computer controls
can be used with ASDs to control the adjustment of power to match demand (Kramer et al., 2010). Motor
losses produce heat; in order to have more efficient motors these losses have to be reduced to save energy.
Some strategies to reduce energy loss in motors include (Saidur, 2010):
a) Enforcing rules that require certain levels of minimum performance to be achieved across the
board.
b) Switching the motor off when it is not required.
c) Cleaning a motor to allow easy heat transfer. When dirt build up in a motor fan it reduces the
flow of air and increases the motor operating temperature. Dirt reduces heat transfer by
convection and reduction.

39 | P a g e
Other energy efficiency measures which are possible in electric motor systems include: improved
pumping, improved compressed air and improved ventilation systems (Waide and Brunner, 2011).
Continuous maintenance of motors allows potential failures to be identified and so reduce downtime.
Properly sized motors can reduce unnecessary energy losses; large motors are more effcicient than small
motors (Worrell et al., 2010). The potential efficiency improvements in motors which are well known
include (IEA, 2007):
a) Choosing the right the scale of the motor service to match the work demand.
b) Providing effective control strategies to respond to variations in load as well as speed control
devices such as adjustable speed drives (ASDs).
c) Substituting for energy services where possible.
d) Using high efficiency motors and transmission systems.
To maintain good performance of motors proper maintenance is required. Good maintenance practices
include: inspecting motors regularly, checking motors loads so as not to be overloaded or under loaded,
lubricating motors according to recommendation by the manufacturer, checking for alignment of motors
and proper ventilation.
3.3.2 Compressed air
Compressed air systems are widely used in industries and thus it is the third largest energy savings
opportunity in industry (Thollander, 2005). Energy saving in compressed air can be saved using: high
efficiency motors, use of variable speed drive (VSD), through prevention of leaks, use of high efficiency
nozzles and keeping the compressor clean. Variable speed drive provides steady control matching motor
speed to the required demand of work been performed, allowing the operator to fine tune work, thus
reducing costs of energy and maintenance downtime. Leaks should be repaired as they are detected, they
can easily be detected by hissing sounds when the operations are idle, or through use of an ultrasonic
detector which can recognize high frequency sounds (Saidur, 2010). Compressed air leaks are easily
ignored because they do not make a mess like oil leaks, and they are harmless. The continuous hiss sounds
of leaks are usually regarded as part of the general background and are often drowned by the higher noise
levels from machinery and engines.
Leaks frequently increase generation capacity needlessly, when simply fixing the leaks would have
restored system efficiency. Although it may be costly, it is advisable to establish a planned maintenance
routine that is intolerant of leaks. Leakage is the major source of energy loss in compressed air systems. A
typical plant may lose up to 30 % of its compressed air through poorly maintained pipe joints, fittings,
couplings and equipment. It is advisable to close compressed air valves of machines when there is no
production (Galitisky and Worrell, 2003). It is advisable not to keep the whole unit pressurised during

40 | P a g e
non-productive hours just because there are a few machines that require a constant supply of compressed
air. Isolate the parts which require air at different hours; this can be done by using manual or automatic
isolation valves (U.S Department of Energy, 2003).
3.3.3 Fans
Fan modification such as changing the size or shape of the sheaves of a fan can save energy by controlling
the airflow and running at the design speed. Resetting thermostat set points by a few degrees can have
significant savings (Galitsky and Worrell, 2003). Better insulation of the ducts and repair of duct leaks has
been found to save significant energy for buildings. Establishing a fan’s efficiency is a combination of
many variables such as fan type, airflow and speed and impeller size. Attaining energy reduction in
heating ventilation air-conditioning can be achieved in different steps, first on designing systems as one
way of minimizing pressure flow, then selection of high efficiency fans that can operate at peak efficiency
(Bredel, 2011). The energy to the fan is driven from the motor shaft. The inlet and outlet of the fan are
used to determine the energy driven into the fan. The energy in the fan has basically two elements, the
dynamic one and the static one, that means that the total amount of dynamic and static energy is the
amount transported by the fan into the air. This ratio of energy received to the energy delivered by the
motor is the fan energy efficiency. Fan efficiency is determined by the flow rate. At very low speeds flow
rate efficiency is low; if the flow rates increases the efficiency rate also increases. When this flow rate
reaches a maximum it is referred to as peak efficiency. The HVAC designers and manufacturers have a
big task of considering energy efficiency systems in their production, while the system designers and the
end users are responsible for energy use of responsibility. For the fans to acquire the minimum energy use
for a given load, the efficiency of fans has to be high and the operation should be near the peak energy
efficiency. According to the IEA (2007) fan efficiency measures include:
a) Balance the airflow for both inlets and outlets of the fan.
b) Maintain the belt drives by adjusting them regularly to maintain sheave alignment, improper
alignment of fan can cause excessive power requirements and damage the belts.
c) Check for leaks and seals.
d) Minimize use of oversized fans.
e) Use high efficiency fan drive motors.
f) Use variable speed drives.
g) Reduce airflow resistance in the ductwork or piping.
Good housekeeping opportunities which can save energy as outlined by the U. S. Department of Energy
(2003) include: lubricating fans according to manufacture instructions, correcting excess noise and
vibration to ensure smooth and efficient operations, shutting down fans when not in use and cleaning of
fans regularly to maintain efficiency.

41 | P a g e
3.3.4 Pumps
Proper monitoring of pumps can detect pump system problems before they emerge into bigger issues. It
can also help to detect system blockages, clogs and damage. Proper maintenance of pumps can help to:
reduce pump problems, increase pumping system efficiency, prevent premature wearing out of pumps,
reduce pumping energy costs and keep pumps running well, reduce throttle losses. Pumps demand should
be matched by the end use loads. Controls can be used to switch pumps off when the demand is reduced
and switch them on when the demand increases. Pumps which are more oversized can consume more
energy. They should be properly sized to reduce energy consumption. Diameter of pipe should not be too
small as this can increase the amount of energy required for pumping (Brush et al., 2011).
3.3.5 Heating, ventilation and air-conditioning
Heating, ventilation and air-conditioning losses can be as a result of transportation, generation and
ventilation losses. Reducing these losses can reduce energy consumption and improve energy efficiency
(Lombard-Perez et al., 2008). It is important to clean the HVAC system to remove the soot and dirt which
accumulates and hinders the smooth running of the system. Soot accumulation can lead to higher
consumption of energy than required, hence increasing the bills of energy. Good design of HVAC can
reduce energy loss in industry. A proper choice, installation and design of HVAC system should provide
comfort in a room, distribute quality air, and remove odours and contaminant through pressure. This
should apply to residential houses and industries. Proper design should encompass: charging the unit with
proper amount of controls, designing the layout of the ductwork or piping to maximize energy efficiency,
insulating and sealing all ductwork (Burton, 2001). The easiest method to improve energy efficiency in
heating, ventilation and air conditioning is to reduce the pressure flow over the filters. When considering
the filters, it is important to note that the cost of energy used by the filters outweighs the filters
themselves, switching to a filter with a lower airflow resistance is one of the ways to reduce heating,
ventilation and air conditioning energy cost. It is recommended to:
a) Install time clocks.
b) Install thermostat and microprocessor to monitor HVAC system.
c) Adjust workplace schedules to reduce energy consumption when the demand for energy is low.
d) Use sensors to turn off the lighting system and change the temperature of the room if unoccupied.
e) Maintain the cooling equipment by cleaning condenser coils, changing belts and filters and fixing
duct leaks.
f) Addition of controls to the exhaust fan and installing timers and switches to shut them off when
they are not in use
g) Use HVAC system setback for heating temperature during unoccupied periods (Krarti, 2011).

42 | P a g e
Maintenance of a HVAC system is significant because it can lengthen the life of the system and can
prevent the failure of the system by diagnosing and detecting the signs before breakdown, thus reducing
costs and enhancing continuous supply of air. Service should be done by a certified technician. Filters
should be upgraded and regular service maintenance should also be conducted. Cleaning the filters is not
recommended because researchers argue that this reduces dirt holding capacity by 20-40 %, and there is
risk of dirt reaching the clean side of the filter while cleaning. Filters can be damaged by high pressure
water or compressed air during cleaning. Damaged filters should not be cleaned or reused; if filters are
damaged, should be investigated and corrected. Each time the air intake system is serviced, it is exposed to
the possibility of contamination. Never attempt to clean a safety filter; replace it after three primary filter
change outs. Ducts should be well designed and well-sealed to make the room more comfortable, to save
energy and to make it safer (Aduda, 2009). Galitisky and Worrell (2003) described the following energy
opportunities in HVAC systems:
a) Electronic controls: can be as simple as on and off switches to be switched off during non-
working hours and on during working hours. By using a simple on and off control Volvo’s
manufacturing plant in Torslanda (Sweden) reduced the energy used in ventilation in the paint
shop by 50 %, or 8.25 million kWh per year. Programmable thermostats can also be employed to
regulate indoor air temperature, they could be set to automatically adjust themselves for the time
of day or even seasons, they can be used with both heating and cooling systems which can reduce
energy loss.
b) Weekend setback temperatures: Another option for HVAC system energy opportunities, is
setting building temperatures lower during the winter, or higher during the summer, over the
weekend and during non-production times can save energy by reducing heating or cooling needs.
c) Cooling system design improvements: the significant opportunities for energy efficiency in
industrial system for HVAC system are at the design stage. Designing the equipment for a new
facility can minimize the energy use and cost of HVAC systems from the start. Installing energy
efficient HVAC during construction of the building saves money in the long run compared to
upgrading the HVAC in the existing building because upgrades can lead to downtime (Worrell et
al., 2010).
d) Repair leaking ducts: due to high likelihood of leakage in HVAC duct insulation regular
inspection can be a remedy. Repairing of ducts can save up to 30 % energy, but duct tape should
not be used, aerosol sealant should be used (Worrell et al., 2010).
3.3.6 Lighting
It is more likely that human beings will switch on the lights when required than switch them off when not
in use. It is advisable to install occupancy sensors which automatically turns off the lights when the

43 | P a g e
building is not occupied. Lights should be turned off when not in use which can be done manually or by
use of sensors. Putting stickers adjacent to switches to remind occupants to switch off the lights is
recommended. Natural light if used during the day can reduce energy load by up to 70 % (CADDET,
2001; Worrell et al., 2008). Due to dust in workstations, lamps should be cleaned perhaps after 3000 h
(Smith, 2000). Keeping bulbs clean and free of light blockage, reducing decorative lighting, using bright
colors on ceilings, walls, floors and on furniture are all ways of saving energy because they will increase
reflection. All defective tubes and starters should be replaced because they draw energy which is not used.
Separate switches should be installed where possible because not all work lamps which are on are utilized.
According to Krarti (2011) switches should be installed in areas that are feasible and accessible to
everyone. Sometimes a whole section will be switched on to illuminate a single lamp job. Some fixtures
can be reduced because many places have more than the number of required fixtures. Energy efficiency in
lighting can be achieved by using high-efficiency fluorescent lamps, compact fluorescent lamps, compact
halogen lamps and electronic ballasts.
3.3.7 Boilers
Boilers can save energy through: process control, heat loss reduction and proper improved heat recovery.
By monitoring oxygen intake in the boiler and airflow it is possible to detect small leaks. Presence of high
carbon monoxide (CO) or smoke present in exhaust gas is a sign of too little air to complete fuel burning.
Some energy saving tips of boiler include (Brush et al., 2011):
a) Leaks are the major source of energy loss in boilers, if they can be reduced they can save 2 % - 5
% of the energy formerly used.
b) Excess air should be reduced in the boilers, if too much air is used, it can lead to energy waste
because excessive heat is delivered to the air rather than to the steam.
c) Boilers should be well sized, well designed boiler systems can reduce stack temperature, reduce
radiation losses in piping and reduce leaks in steam traps.
d) Boiler maintenance should be conducted periodically to ensure that all components are operating
well. Improved maintenance can lead to great savings.
Overall energy efficiency in boilers can be improved by (McNicol, 2010):
a) Improving combustion efficiency by use of economizer’s, flue gas analysis, oxygen control
and combustion air preheaters.
b) Improving blow down heat recovery by use of deaerators.
c) Reducing radiation and convection losses by use of boiler reset control and boiler sequence
control.

44 | P a g e
3.3.8 Building envelope
Keeping windows closed when the heaters are on is recommended in a building to retain heat. Having the
heaters on and windows open at the same time is a waste of heat. Close blinds after the sun goes down to
keep more heat in the building during the winter, and also keep the blinds down in the summer to keep the
heat from coming in through the windows. Keep the doors insulated and well-sealed to prevent leakage
through or around them. Installing insulated storm doors and replacing windows with energy efficient
ones can prevent air leakage and save on energy (Brush et al., 2011). Adding thermal insulation, replacing
windows and use of more energy efficient windows can save energy (Krarti, 2011).
Most heat enters and escapes from rooms through openings in that room such as walls, windows, doors
and holes in the ceiling. Proper and adequate insulation is important because this reduces heat loss and air
penetration. Keeping windows and doors closed when systems are operating can significantly reduce the
energy loss.

45 | P a g e
CHAPTER 4: RESEARCH METHODOLOGY
This chapter explains various methods and tools used in analysing and collecting data and reasons of
choosing them
4.1 Research design
The research study was carried out in May 2014 for a period of one month in a Kenya motor vehicle
assembly plant. The assembly plant chosen is the oldest and the first out of four major companies to
assemble vehicles in Kenya. Many studies concerning motor vehicle concentrate on fuel consumption, but
very few, if any, especially in Kenya, have researched on energy usage during the vehicle assembly
processes. Motor vehicle assembly industries have lagged behind in terms of technology, since many
people prefer to buy second hand imported vehicles from Japan than buy locally assembled vehicles. This
is due to the high cost of locally assembled vehicles. During the study the plant was in operation 8 hrs per
day 6 days per week. The following methods, tools and equipment were used during data collections.
4.1.1 Case study
Case study is defined as study of instant action; it provides a unique and real situation, enabling readers to
understand ideas more clearly and simply. Case study involves looking at the situation in its real life
(Cohen et al., 2011). A case study was introduced because it allowed the researcher to use various
methods of collecting data. It is descriptive and detailed with scaled down focus in both subjective and
objective. It was also the most applicable in this research because the research was conducted in an
industrial working environment.
4.1.2 Qualitative and quantitative
The data entails both qualitative and quantitative data collection. Qualitative data presents the case in
words, it deals with the situations which are difficult to quantify mathematically such as beliefs. It
emphasises observation of variables in the natural settings in which they are found. It involves collecting
data by use of various methods such as open ended questions, case studies, interviews and observations. It
gives a wider understanding of the population under study because it is more narrative. Sometimes the
sample may be too small and therefore the findings may not generalize to the larger population. It was
applied to this study because the researcher wanted to know the history of various processes in the plant.
The quantitative method, on the other hand, explains the case using numbers and statistics including
theories to provide explanations. Data is collected using standardized methods such as questionnaires and

46 | P a g e
structured interviews. The main disadvantage is that if the participants are too many, the answers they give
may not have much depth. The researcher may be overwhelmed by categorizing information which cannot
be analysed (McNeill and Chapman, 2005; Vanderstoep and Johnston, 2009). The quantitative method
was applicable in this study due to the measurements carried out.
4.2 Methods and tools
This section explains the tools and methods used to collect data. Davies (2007) explains various methods
and tools for analyzing data, but in this case questionnaires, interviews, observation and survey were used.
The reason for the combination is for reliability and validity. McNeill and Chapman (2005) explained
reliability as a method of collecting evidence that means that anybody else using the same method another
time would come up with the same results; if the research could be repeated the same result could be
found. Validity gives a true picture of what is being studied.
4.2.1 Questionnaires
Questionnaires are usually used to assist communication, they are a tool for conducting research (Davies,
2007). Questionnaires, both open-ended and closed-ended, were administered to various respondents.
Questionnaires give the respondent time to think about questions unlike an interview in which the
respondent responds instantaneously. Questionnaires also provide an opportunity for the respondent to
reveal things which he/she feels are right, but due to fear cannot answer directly in an interview. They are
also convenient for respondents who are busy because they can fill them at their own convenience.
Questionnaires have many forms, for example, dichotomous questions, multiple choice questions, rating
scales, open-ended questions and closed ended question (Cohen et al., 2011). In our study open-ended,
closed and multiple choice questions were used. Close-ended questions are quicker to code and they are
direct to the point and more focused. Open-ended questionnaires are useful where the answers are
unknown or where there are many categories of answers and closed ended will provide a long list of
options. They also allow the respondent to express their opinions without fear of recognition.
4.2.2 Observations
In this scenario the researcher become part of the community or group under investigation; observation is
more than just looking (Cohen et al., 2011). During the time of research, the researcher noted and recorded
the behaviour of the respondents (Vanderstoep and Johnston, 2009). This method is more reliable than
reported survey, but it is quite expensive in terms of time because the researcher has to be present at the
scene. It gives the researcher an opportunity to gather live data and observe directly what is taking place.
Observation enables the researcher to gather data on the physical setting, human interaction and

47 | P a g e
programme setting (Cohen et al., 2011). In this study, observation was used to see how the workers use
energy and how they handle machines during work.
4.2.3 Interviews
Interviews are a flexible tool for collecting data and involves talking to respondents directly as explained
by Vanderstoep and Johnston (2009). Interviews were applicable in this study because the respondents
were in the same place, it is also applicable to both qualitative and quantitative data collection. Various
forms of interviews include: individual face to face interviews, group face to face interviews and semi-
structured interviews. Individual face-to-face interviews were mostly used in this study due to it’s
convenience and for reasons of privacy so that the respondent is free to reveal more information without
fear of recognition from others. Cohen et al. (2011) outlined the following types of interviews: informal
conversational interview, interview guide approach, standardized and closed quantitative interviews
4.2.4 Sampling
Sampling includes selection of a part of the whole population under study and a census is the study of the
whole population. In this study only a few workers who were working on the plant were selected to
answer questionnaires and some of the management staff. In general, there are two ways to select
members under study: a random sample / probabilistic sample and a non-random sample / non-
probabilistic. In random sampling every member of the sampling frame has an equal chance of being
selected. In non-random sampling each member of the sampling frame does not have an equal chance of
being selected as a participant. The major and minor categories of sampling are shown in Table 4-1.

48 | P a g e
Table 4-1: Sampling categories
4.2.5 Energy audit
Industrial energy audit is a process of inspection, survey and analysis of energy flows and usage. Energy
audit is the key element informing decision-making regarding management of energy efficiency. It is a
reliable and orderly approach in the industrial sector. It helps any organization to analyze its energy usage
and discover areas where waste can occur and where energy use can be reduced. Industrial energy audit
can assist in reducing energy consumption and environmental emission and pollution, reduce operating
costs, improve the overall performance and improve the life time of the equipment. The type of industrial
energy audit conducted depends on the function, size, and type of industry, the depth to which the audit is
needed, the potential and magnitude of energy savings and cost reduction desired. Types of audit can be
classified in as follows:
Preliminary audit (walk-through audit): This is the simplest audit to conduct. It requires less
time because it uses data which is readily available. It does not require a lot of measurement, data
collection, or detailed interviews, and focuses on major energy supplies and demands of the
industries. The result of this audit is general, providing common opportunities for energy
efficiency. During the preliminary audit, the researcher familiarised herself/himself with the
plant, various sections and people working in different sections.
Major
category Minor category Description
Random
sampling
Simple random
sampling
Selection is made by chance such as drawing number from
section and it is costly.
Stratified sampling
Large populations divided into sub groups. It reflects the
target population and reduces sampling variations but it can
sometime be time consuming. In this study stratified
sampling was used in the selection of respondent to
questionnaires because its effective
Systematic sampling It uses the n
th case, it is convenient but not suitable where
there is repetition in the list.
Non-random
sampling
Cluster sampling It is convenient because it uses existing groups and
particularly with larger sampling units.
Snowball sampling
Members of the group are requested to identify other
members of the target group. It is used where it is difficult
to identify the target group or no list is available
Convenience sampling It uses the group or individual that are readily available and
are willing to be surveyed.
Quota sampling It entails dividing the target population into subgroups
Purposive sampling It is selected depending on the knowledge and population
and purpose of the study

49 | P a g e
General and detailed audit (diagnostic audit): For this audit more detailed information is
required including an inventory of every system available in the organization. The time required
for this audit is longer, hence the results of these audits are more comprehensive and useful since
they give more detail about the energy use of specific systems and improvement opportunities for
each system. During a general audit the following data is collected:
a) History of company;
b) Bills on energy;
c) Types of energy used in various sections;
d) Data on machines in use; and
e) Measurement of various variables.
The energy audit process involves verification, monitoring and analysis of the use of energy, submission
of a technical report containing recommendations for improving energy efficiency with cost-benefit
analysis and an action plan to reduce energy consumption (Hasanbeigi and Price, 2010). An energy audit
is conducted to understand how energy is used within the organization and to find opportunities for
improvement and energy saving. It can also be conducted to evaluate the effectiveness of an energy
efficiency project or programme. Energy audits provide the best way to identify air leaks in the industry.
While some utilities and local governments offer free energy audits, it may be worth the expense of hiring
a professional energy auditor to do a comprehensive assessment. When done by a certified auditor, the
comprehensive energy audit goes beyond identifying obvious energy upgrades. Auditing helps to
determine the efficiency of heating and cooling systems. The auditor will create a roadmap of where and
how best to make improvements in the industry. It is recommended that the organization collect some
information in advance to share with the auditor, typically including the last twelve months of utility bills
(Rodriguez, 2011)..
4.3 Equipment used
The major equipment used to collect data include: tachometer, clamp meter, tape measure and infrared
thermometer.
4.3.1 Tachometer
A tachometer is used to measure revolutions per minute (RPM) of a rotating shaft. The tachometer used
both contact and non-contact methods to measure readings. The contact method uses different types of tips
according to the type of contact they will have with the rotating body. The non-contact method uses light
which senses the rotations. The speed is displayed on the display panel. Both contact and non-contact
methods were used in this research.

50 | P a g e
Due to dust and grease on the shaft, when using the non-contact method a silver disc was attached to the
rotating shaft to increase reflection. In many industries the speeds of rotating machines range from 1500-
8000 RPM. To get a rough estimate of speed, a piece of colored tape is attached to the shaft and the
number of rotations is counted. The accuracy depends on the ability to focus on the moving objects which
decreases as speed decreases. Figure 4-1 shows the tachometer that was used.
Measuring ranges are:
a) 2.5 to 99999 RPM for photo tachometer.
b) 0.5 to 19999 RPM for contact tachometer.
c) 0.05to 1999.9 M/MIN for surface speed.
Figure 4-1: Tachometer
Procedure for Photo RPM measurements is as follows:
a) Apply a reflective mark to the objects being measured.
b) Slide the function switch to “RPM” position.
c) Depress the measurement button and align the visible light beam with the applied target. Verify
that the monitor indication lights when the target aligns with the beam.

51 | P a g e
Procedure for contact measurements:
a) Slide the function switch to “RPM” position.
b) Install the proper adapter on the shaft.
c) Depress the measurement button and lightly pressing the adapter against the center of hole of
rotating shaft.
d) Release the measuring button when the display reading stabilizes.
Procedure for surface speed measurement:
a) Slide the function switch to “M/Min”.
b) Install the surface speed wheel to the detector.
c) Release the measuring button when the display reading stabilizes.
4.3.2 Clamp meter
The clamp meter is a non-contact current transducer which is clamped over the wire carrying the current
to be measured. In this research a clamp meter was used to measure the current of various machines when
on load and when idling. Figure 4-2 shows the clamp meter that was used.
Figure 4-2: Clamp meter
Procedure for taking AC/DC current measurements is given as follows:
a) Set the Function switch to the ampere range.
b) Press the function key to select AC or DC.
c) Open the jaw and enclose fully the conductor to be measured.
d) Read the current flow on the clamp meter display.
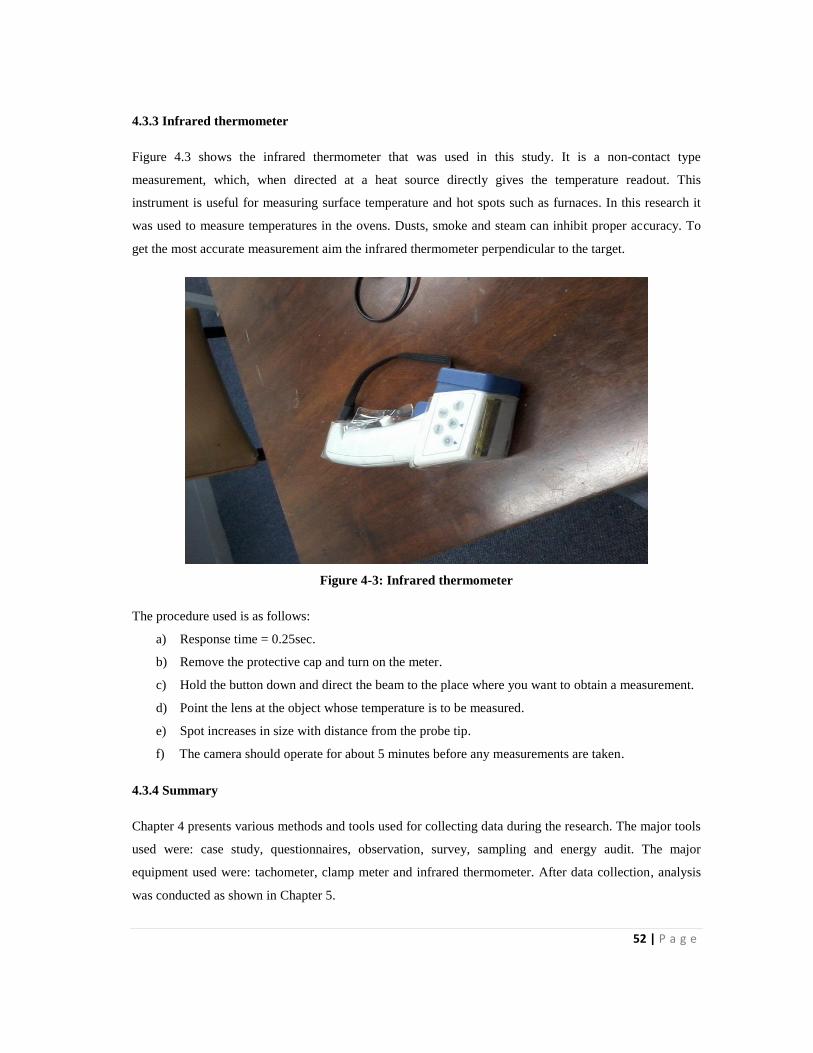
52 | P a g e
4.3.3 Infrared thermometer
Figure 4.3 shows the infrared thermometer that was used in this study. It is a non-contact type
measurement, which, when directed at a heat source directly gives the temperature readout. This
instrument is useful for measuring surface temperature and hot spots such as furnaces. In this research it
was used to measure temperatures in the ovens. Dusts, smoke and steam can inhibit proper accuracy. To
get the most accurate measurement aim the infrared thermometer perpendicular to the target.
Figure 4-3: Infrared thermometer
The procedure used is as follows:
a) Response time = 0.25sec.
b) Remove the protective cap and turn on the meter.
c) Hold the button down and direct the beam to the place where you want to obtain a measurement.
d) Point the lens at the object whose temperature is to be measured.
e) Spot increases in size with distance from the probe tip.
f) The camera should operate for about 5 minutes before any measurements are taken.
4.3.4 Summary
Chapter 4 presents various methods and tools used for collecting data during the research. The major tools
used were: case study, questionnaires, observation, survey, sampling and energy audit. The major
equipment used were: tachometer, clamp meter and infrared thermometer. After data collection, analysis
was conducted as shown in Chapter 5.

53 | P a g e
CHAPTER 5: DATA ANALYSIS AND DISCUSSION
This chapter presents the company background, the vehicle manufacturing process, analysis of data
collected in the motor vehicle assembly plant and discussion of the results. The main objective of this
study is to demonstrate possible improvements in energy efficiency in a motor car assembly plant. This
chapter answers the following research questions:
a) What are the types of energy used?
b) What is the approximate amount of energy used and lost in various sections and equipment?
c) What are the major sources of energy loss in the plant?
d) What are the opportunities for energy efficiency in the plant?
5.1 Company background
The plant under study is one of the oldest motor vehicle assembly plants in Kenya out of the four major
companies. It is one of the few companies in Kenya undertaking assembly of motor vehicles from
completely knocked down kits. It has about 300 employees, both casual and permanent. During peak times
it produces 13 vehicles per day both buses and trucks and during off peak it produces four to five vehicles
per day. Taking the normal five working days per week, per year the company can produce 3120 vehicles
during high demand and 1200 on low demand. The company runs on one shift under normal
circumstances that is from 08.00 hrs to 17.00 hrs, five days per week, but when the demand is high it
operates from 08.00 hrs to 18.00 hrs six days per week. The electricity is supplied at 11 KV at B2 tariff.
The main power supply indicates that the plant was either very big in operation or was anticipating
phenomenal growth. The company mostly uses electricity, compressed air and industrial oil for their
operations, in contrast to many industries which use steam as stated by Galitsky and Worrell (2008).
Figure 5-1: Major sections of vehicle assembly plant
Material handling
Store Body-in-
white Body
building Paint shop
Assembly lines
Inspecton Road test Sales

54 | P a g e
Figure 5-1 shows the major sections of a vehicle assembly plant. The whole process starts with ordering
and receiving of materials. Seventy percent of materials are imported from Japan and 30 % are local as per
policy of Kenya. All these materials come in the form of kits. After receiving they are kept in store for
inventory and dispatch. Each section presented as a block in Figure 5-1 performs different types of work.
In material handling section kits are received and kept in store for supply to various sections. Bodies of
minibuses are joined in body-in-white section where they also do sheet cutting, drilling, riveting and
joining of truck chassis. Body building deals with welding and joining of chassis and bus bodies. Paint
shop is where paint is coated on vehicle bodies and cured. Assembly lines involve assembly of the engine
and cabin accessories. After joining the major parts it goes for road test and inspection before sales. The
major sections of this assembly plant which consume a lot of power are body building, body-in-white,
paint shop and assembly lines. The following are the major vehicle assembly processes.
5.2 Vehicles assembly process
The main stages of car manufacturing can be summarised in four stages: part manufacture or purchasing,
body production, chassis production, painting and vehicle production and assembly (Galitsky and Worrell,
2008; U.S Department of Energy, 2008).
5.2.1 Parts manufacture
Some vehicle industries produces their own parts, while other parts are sourced from other industries, in or
outside the country. Engines, axles and transmissions are cast from aluminium or iron. Metal casting is an
energy intensive production process and consumes a lot of energy. Engine parts must be assembled to
produce the finished engine (Galitisky and Worrell, 2008). But for this case study, the plant under
consideration purchases all the parts they do not manufacture.
5.2.2 Body production
The body parts of vehicles are normally formed using steel, plastics, aluminium, fibre and glass. Steel
alloys are used because of their market availability and low cost. Plastic is cheap and requires less time to
deform than for steel components and can also be changed at low cost. Despite its cost per pound their low
weight contributes to higher fuel efficiency in cars (Galitisky and Worrell, 2008).
5.2.3 Chassis production
The chassis of the vehicle is the core structure of the vehicle.
In most designs, a pressed-steel frame forms a skeleton on which the engine, wheels, axle assemblies,
transmission, steering mechanism, brakes, and suspension members are mounted. In modern small car

55 | P a g e
designs, there has been a tendency to combine the chassis frame and the body into a single structural
element, the steel body shell is strengthened with braces that makes it stiff enough to repel the forces that
are applied to it. Distinct frames are used for some cars to achieve a better noise-separation features
(Galitisky and Worrell, 2008). In this case study most of the frames are joined through welding.
5.2.4 Painting
Painting is used to protect the body from corrosion and enhancement of texture. In vehicles, special
priming and painting process are used, then the whole body is dipped in cleaning baths to remove oil and
any other substances. They then undergo painting cycles which help to maintain the visual quality of the
paint and give good hardness. Enamel and acrylic lacquer is used to dye the paint, which consumes a lot of
energy. Electrostatic painting ensures that even coating is applied over the whole vehicle body. Use of
infrared for curing saves energy and production time and decreases the size of the dryer. After painting the
vehicle body is checked for any inaccuracies in paint coverage and any other repair needed (Galitisky and
Worrell, 2008). In this case study painting undergoes various stages as shown in Figure 5-15.
5.2.5 Assembly
There are two major assembly lines in automotive industries: body and chassis lines. On the body
assembly line the body panels are welded together, the windows and doors are installed and the body is
trimmed. On the chassis assembly line, the frame, springs, wheels, steering, gear, power train, engine,
transmission, drive, shafts, brakes and exhaust system are installed. The two lines merge at the point
where the body and frame are assembled as one unit. In today’s world due to technological advancement
computers manage the assembly process, thus opening opportunities to build different versions of the
same model and even various car models on one assembly line (Galitisky and Worrell, 2008). In this case
study, there are two major lines, namely, cabin and engine assembly. Within each line there are six
subsections of assembly line.
5.3 Energy usage analysis
The major sources of energy used in this plant are electricity, diesel, industrial oil, compressed air and
industrial gases. Electricity is used to drive systems, lighting and in office use. Diesel is used for transport
and in the stand-by generator, industrial oil is used in burners, compressed air is used to drive hand tools
and pneumatic tools while industrial gases are used in welding. Common input data for this research are:
a) 1 kWh = Ksh 4.73, 1 KVA = Ksh 50
b) 1 U.S dollar = Ksh 89.09, 1 Rand = Ksh 8.50
c) Load factor = 0.13

56 | P a g e
d) Working hours per month = 160
5.3.1 Electricity bills
The major rates charged for electricity in this company depends on kilowatt-hour (kWh) for the amount
consumed at peak and off-peak hours, kilovolts ampere (KVA) maximum reached that month and welding
nameplate KVA demand. Other charges includes: fixed charges, fuel cost charges and value added tax
(VAT).
Table 5-1: Electricity consumption
Months Days in
billing
period
Electricity
usage (KVA)
Electricity
consumption
(kW)
Peak time
(kWh)
Off-peak
(kWh)
Load
factors
Jan 24 292 284 18422 8670 0.97
Feb 24 373 362 46966 8710 0.97
Mar 23 353 333 29470 7832 0.94
April 23 374 355 28070 8598 0.95
May 24 346 320 27430 8572 0.92
June 23 332 319 29306 8324 0.96
July 24 366 350 32974 8092 0.96
Aug 23 295 286 23538 8480 0.97
Sep 24 202 195 21604 8432 0.97
Oct 24 209 203 21272 8602 0.97
Nov 24 235 231 25724 13152 0.98
Totals 260 3377 3238 304776 97464 -
Table 5-1 shows the electricity consumption in the plant for the year 2013 from January to November.
December bills were not available since they are usually combined with January bills. The highest KVA
recorded was 374 and the highest kW was 362. The month of February has the highest consumption rate
during peak time which indicates there was high production, while the month of November has the highest
consumption rate during off-peak.
Figure 5-2 shows the electricity consumption in kWh in the year 2013 at the motor vehicle assembly plant
in this case study. The base line shows that energy usage lies between 27000 kWh to 41000 kWh.
December usage was not available because it is normally combined with January bills since most
companies close for holidays in December. The base line is the energy system which consumes the same
amount of power throughout the year. Base loads are the portion of the load or cost below the base line as
stated by Thumann and Younger (2007). The systems which have normal base loads are lighting, HVAC
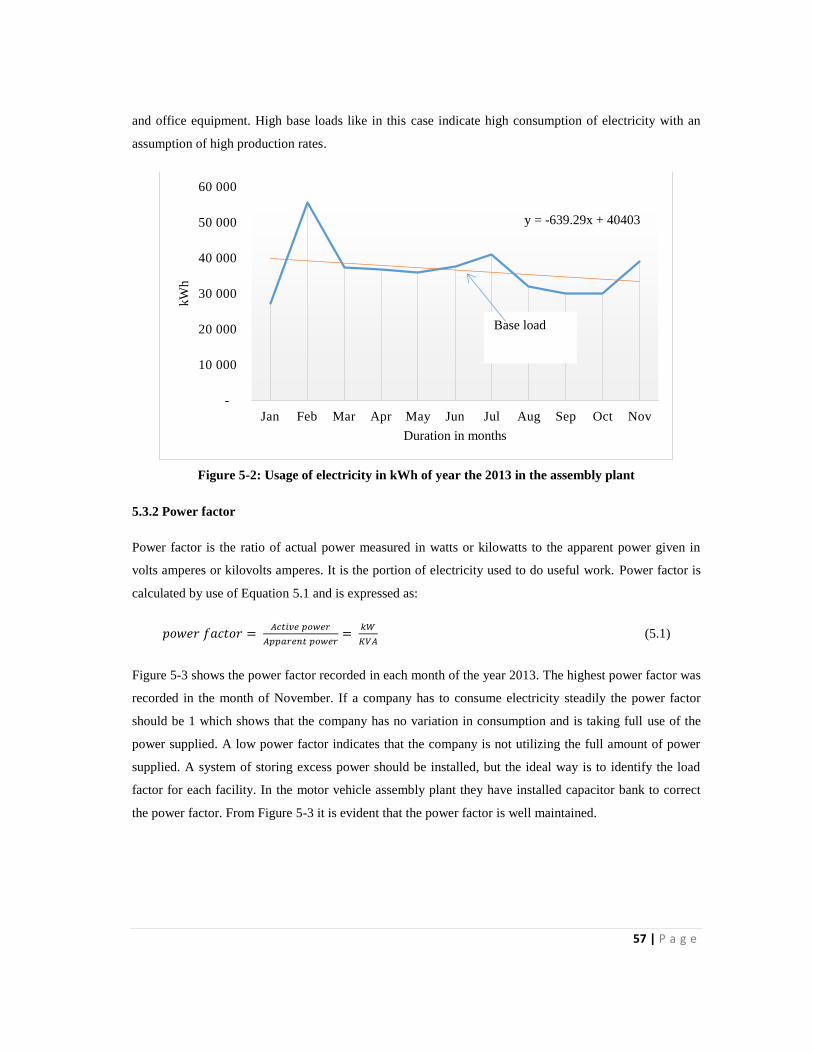
57 | P a g e
and office equipment. High base loads like in this case indicate high consumption of electricity with an
assumption of high production rates.
Figure 5-2: Usage of electricity in kWh of year the 2013 in the assembly plant
5.3.2 Power factor
Power factor is the ratio of actual power measured in watts or kilowatts to the apparent power given in
volts amperes or kilovolts amperes. It is the portion of electricity used to do useful work. Power factor is
calculated by use of Equation 5.1 and is expressed as:
𝑝𝑜𝑤𝑒𝑟 𝑓𝑎𝑐𝑡𝑜𝑟 = 𝐴𝑐𝑡𝑖𝑣𝑒 𝑝𝑜𝑤𝑒𝑟
𝐴𝑝𝑝𝑎𝑟𝑒𝑛𝑡 𝑝𝑜𝑤𝑒𝑟=
𝑘𝑊
𝐾𝑉𝐴 (5.1)
Figure 5-3 shows the power factor recorded in each month of the year 2013. The highest power factor was
recorded in the month of November. If a company has to consume electricity steadily the power factor
should be 1 which shows that the company has no variation in consumption and is taking full use of the
power supplied. A low power factor indicates that the company is not utilizing the full amount of power
supplied. A system of storing excess power should be installed, but the ideal way is to identify the load
factor for each facility. In the motor vehicle assembly plant they have installed capacitor bank to correct
the power factor. From Figure 5-3 it is evident that the power factor is well maintained.
y = -639.29x + 40403
-
10 000
20 000
30 000
40 000
50 000
60 000
Jan Feb Mar Apr May Jun Jul Aug Sep Oct Nov
kW
h
Duration in months
Base load

58 | P a g e
Figure 5-3: Power factor from January-November
5.3.3 Peak and off-peak
Peak hours are the time while the company is busy, while off-peak is when there is minimal operation.
Figure 5-4 shows the percentages of energy consumed in kWh during peak hour and off-peak hours in the
motor vehicle assembly plant in the year 2013. It shows that 76 % of energy is consumed during peak
hours that are from 08.30 hrs to 16.30 hrs, while 24 % is consumed during off-peak. This is mainly
because many operations end at 16.30 hrs and therefore less electricity is consumed. Furthermore, many
machines and lights are switched off.
Figure 5-4: Peak and off-peak hour energy consumption in the plant
5.3.4 Load factor
Load factor is the ratio of power consumed during a given time to the power which would have consumed
if the maximum demand had been maintained as stated by Gupta (2011). It is the relationship between
0.97 0.97
0.94 0.95
0.92
0.96 0.96
0.97 0.97
0.97
0.98
0.89
0.90
0.91
0.92
0.93
0.94
0.95
0.96
0.97
0.98
0.99
Jan Feb Mar Apr May Jun Jul Aug Sep Oct Nov
P.F
Duration in months
76%
24%
Peak hours
Off-peak hours
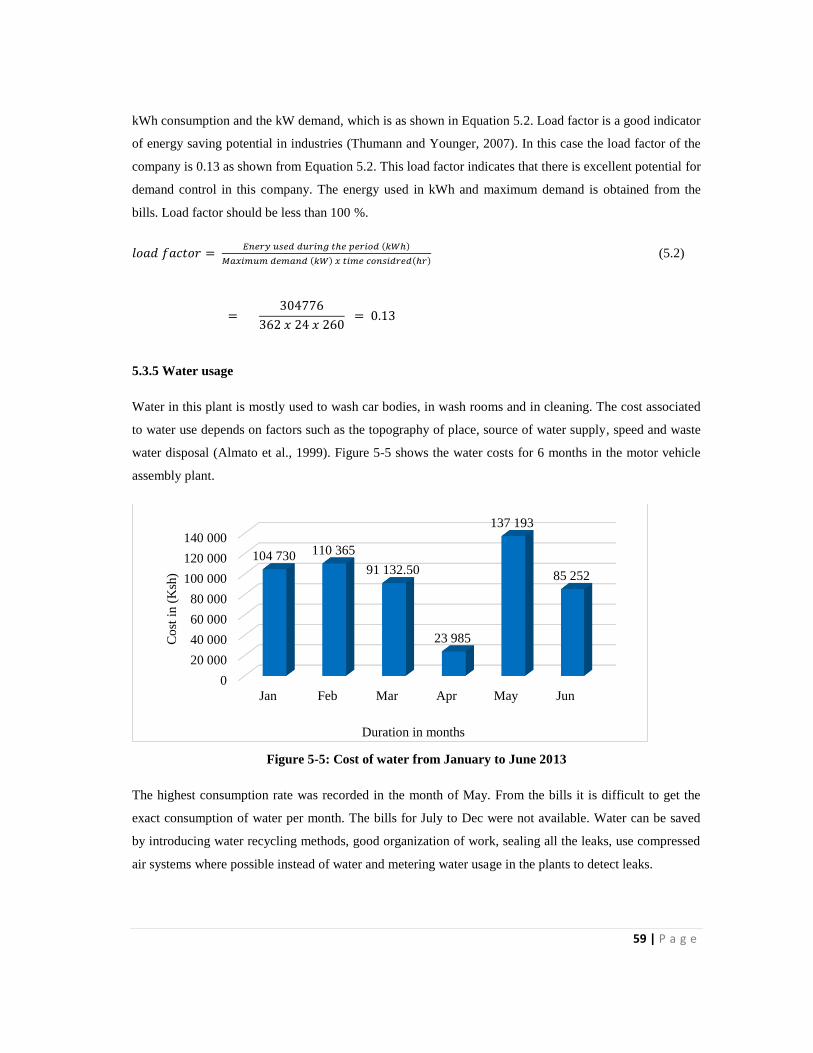
59 | P a g e
kWh consumption and the kW demand, which is as shown in Equation 5.2. Load factor is a good indicator
of energy saving potential in industries (Thumann and Younger, 2007). In this case the load factor of the
company is 0.13 as shown from Equation 5.2. This load factor indicates that there is excellent potential for
demand control in this company. The energy used in kWh and maximum demand is obtained from the
bills. Load factor should be less than 100 %.
𝑙𝑜𝑎𝑑 𝑓𝑎𝑐𝑡𝑜𝑟 = 𝐸𝑛𝑒𝑟𝑦 𝑢𝑠𝑒𝑑 𝑑𝑢𝑟𝑖𝑛𝑔 𝑡ℎ𝑒 𝑝𝑒𝑟𝑖𝑜𝑑 (𝑘𝑊ℎ)
𝑀𝑎𝑥𝑖𝑚𝑢𝑚 𝑑𝑒𝑚𝑎𝑛𝑑 (𝑘𝑊) 𝑥 𝑡𝑖𝑚𝑒 𝑐𝑜𝑛𝑠𝑖𝑑𝑟𝑒𝑑(ℎ𝑟) (5.2)
= 304776
362 𝑥 24 𝑥 260 = 0.13
5.3.5 Water usage
Water in this plant is mostly used to wash car bodies, in wash rooms and in cleaning. The cost associated
to water use depends on factors such as the topography of place, source of water supply, speed and waste
water disposal (Almato et al., 1999). Figure 5-5 shows the water costs for 6 months in the motor vehicle
assembly plant.
Figure 5-5: Cost of water from January to June 2013
The highest consumption rate was recorded in the month of May. From the bills it is difficult to get the
exact consumption of water per month. The bills for July to Dec were not available. Water can be saved
by introducing water recycling methods, good organization of work, sealing all the leaks, use compressed
air systems where possible instead of water and metering water usage in the plants to detect leaks.
0
20 000
40 000
60 000
80 000
100 000
120 000
140 000
Jan Feb Mar Apr May Jun
104 730 110 365
91 132.50
23 985
137 193
85 252
Co
st i
n (
Ksh
)
Duration in months

60 | P a g e
5.3.6 Industrial oil (IDO) usage
Industrial diesel oil (IDO) is used to heat burners which supply temperatures in the ovens to dry and cure
the paint. It is a form of oil which is thicker than diesel. Figure 5-6 shows the amount of industrial oil in
litres bought in different months in the year 2013. The assumption made was that the litres bought at the
beginning of month will be consumed within the same month, and the left over will be carried forward to
next month, while the amount bought at the end month will be consumed next month. There are some
months with no delivery, which suggest that there was a lot of IDO left over from the previous months.
October has the largest amount purchased which means a lot was used in that month or in November, an
indication that the production was high. In December the usage of IDO was low which indicates that
production was low, probably due to less working days in that month because of the holidays.
Figure 5-6: Industrial oil usage in litres for the year 2013
5.3.7 Analysis of gas usage for the year 2013
In motor vehicle assembly plant gas is used mainly for welding. The major types of gas used are heavy
shield, Argo shield, dissolved acetylene and industrial oxygen. The main purpose of argon is to protect hot
metal from oxidizing. It is used in metal inert gas machines because it allows spray transfer on all welded
materials and it can tolerate extreme conditions. Acetylene is an explosive gas which is used in the form of
oxy-acetylene for welding. It is used in small proportion because is combined with oxygen to raise
temperatures. A blowtorch is often used because it has a high melting point. Although it is used in small
-
2 000
4 000
6 000
8 000
10 000
12 000
Feb March April April May May July Aug Oct Dec
7 000
10 000
3 000
5 000
2 000
8 000
10 000 10 000
10 929
3 000
Lit
res
Duration in months

61 | P a g e
portions it is expensive per cylinder. Oxygen is the cheapest and although it is not used often, it support
combustion by increasing flame temperatures (Haelsig and Mayr, 2011).
Table 5-2: Amount of welding gas used in the year 2013
Type of gas No of
cylinders
Amount in 1
cylinder
(m3)
Amount in
1 cylinder
(Kg)
Cost /
cylinder
(Ksh)
Cost / gas
(Ksh)
Heavy shield argon 167 8.5 - 2,594.80 433,331.60
Dissolved acetylene 9 6.3 - 5,034.00 45,306.00
Industrial oxygen 14 - 11.5 1,137.90 15,930.60
Pure Argo shield 82 - 14.5 9,068 743,579
Totals 272 - - - 1,238,147.2
From Table 5-2 it is evident that Argon is the mostly widely used gas in this plant. Although there was no
exact data on how much was used an approximation is of three cylinders per three days during peak days
and two cylinders per two days during off-peak. A lot of gas is lost in welding because there is no proper
way of determining the fusion rate of materials and the time taken to fuse one joint. The welders use trial
and error by listening to the sound produced by the machine or the type of burn they experience with rod,
such as when the rod is sticking there is no fusion taking place. A proper record of how much gas is used
should be kept by installing measuring gauges on each cylinder. These gauges should be tightly fitted to
prevent leakages. Nozzle guns should be cleaned regularly.
5.4. Energy usage analysis in body-in-white section
This is the section where the joining of kits is accomplished through riveting and fabrication. Metal
cutting, spot welding, grinding, normal welding, and the body assembly of mini buses happen in this
section. The major type of energy used here is compressed air and electrical power. It covers an area of
60.96 m by 21.03 m. The major equipment in this section are: spot welders, sand blasting, disk cutters,
welding machines, grinders, riveting machines and cutters
Figure 5-7 shows the front view of the body-in-white section and the visible machines are spot welding
machines. Spot welding is a technique used in the automotive industry to join parts together.
Sand blasting machines are used to clean and prepare surfaces for next or second stage such as painting
and coating. In the automotive industry these machines are used to clean and prepare sheet metal and steel
rods for secondary stages such as painting and welding. Cleaning occurs by directing an abrasive against
the surface; the method of applying abrasive can be either dry or wet. There are six major phases involved
namely: delivery, recovery and clean, dust collection, movement, support and controls.

62 | P a g e
Figure 5-7: Front view of body-in-white
The major sources of energy loss detected in sand blasting machines are air leakage in the hose pipe and
dirt in the controls especially the motor. Although the sand blasting machine is not normally used, dust
can clog fans and motors therefore reducing efficiency. It is recommended to seal leaking joints, wipe the
dust and cover the machines when not in use.
The major source of energy used in this section is compressed air and electric energy. The major consumer
of electricity in this section are electrical motor driven equipment and the major consumers of compressed
air are the spot welding machines. Energy usage of welding machines, electrical motor driven machines
and lighting is analyzed below.
5.4.1. Body-in-white welding machine energy analysis
Welding machines are used in this section for fusion and joining the parts together. They use energy when
welding (arc-on) and when idling. There are 13 welding machines in this section. Following observation
and interviews with supervisors it is evident that 60 % of machines are left on during breaks such as tea
break and some lunch hours. Ideally the machines are supposed to work for 8 hrs a day, but according to
the observation actual work is 5 hrs only, with the rest of hours being lost to the changeover of work,

63 | P a g e
while doing paper work, receiving calls, attending to customers, cutting and grinding metal etc. That
means there is energy lost during the idling time. Welding gas is lost through leakage and in the process of
welding. This section is supplied by 415 V but the voltage that goes to the machines is stepped down by
transformers to suit the welding machines. The voltage is normally stepped down to a voltage of 80 V to
100 V. Transformer on full load has an efficiency of 97 %.
5.4.2 Kilovolts ampere analysis (KVA)
Kilovolts ampere is the volts ampere paid to the utilities in the company. The numbers of machines and
their kilovolts ampere have to be registered by the corresponding body, in this case it is registered by
Kenya Power and Lighting Company. Table 5-3 shows the number of registered machines and their KVA
in body-in-white. The KVA registered is paid every month, according to the industrial tariff. Table 5-3
shows the registered KVA of arc welding machines and spot welding machines.
Table 5-3: Kilo volts ampere analysis in body-in-white
Out of 211.62 KVA registered for welding machines, only 81.4 KVA is used and the rest (130.22 KVA)
are being paid for but are not utilized. Spot welding machines have 1,100 KVA registered but only 450 are
utilized per month, the rest (650 KVA) are paid for but not utilized. It is recommended that the non-
operational arc and spot welding machines should be deregistered.
Figure 5-8 shows the unused KVA in arc welding machines and spot welding machines in the body-in-
white section. Spot welding has the highest unused with 83 %, this is because they have high rated value
ranging from 50KVA of 75 KVA. Arc welding machines have 17 % of unused KVA ranging from 44.4
KVA to 1 KVA. This is because they are few in number in this section.
Appliances
Cost /
(KVA)
No. of
registered
m /c
Power
registered
(KVA)
Amount
paid /
month
(Ksh)
No. of
m / c in
operation
Power
used /
month
(KVA)
Amount to
be paid /
month
(Ksh)
Arc welding
machines 50 13 211.62 10,581 5 81.4 4,070
Spot welding
machines 50 14 1,100 55,000 6 450 22,500
Total - 27 1,311.62 65,581 11 531.4 26,570
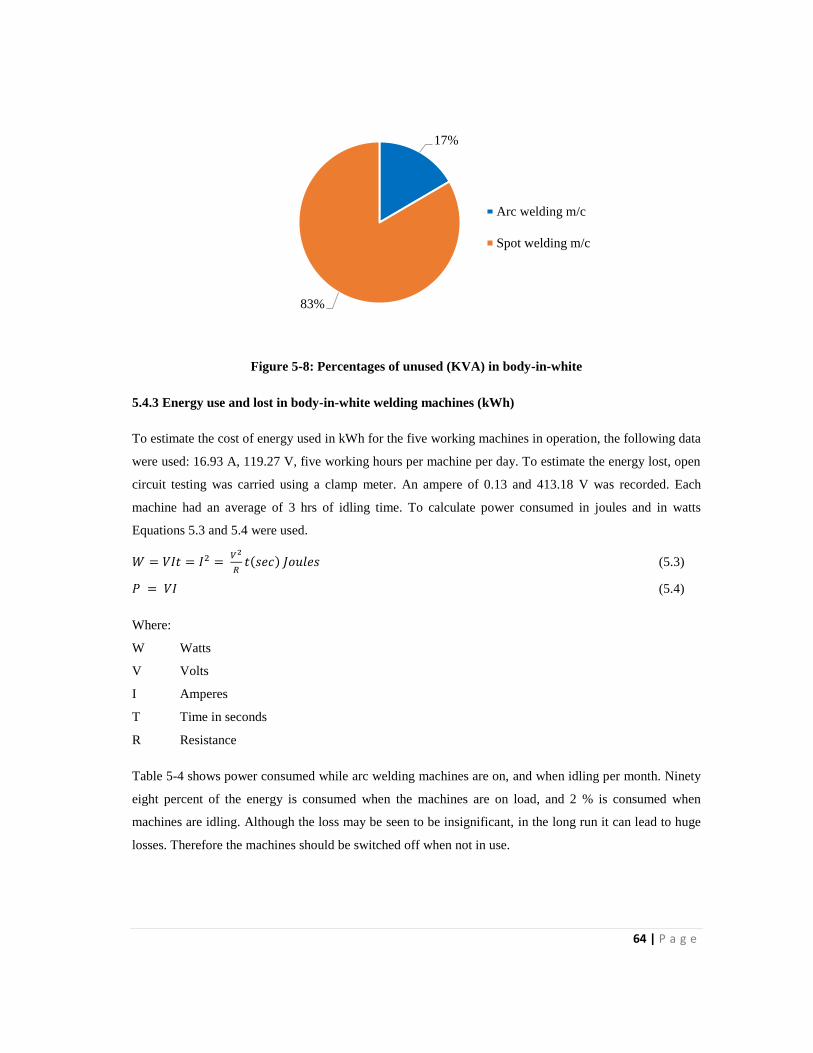
64 | P a g e
Figure 5-8: Percentages of unused (KVA) in body-in-white
5.4.3 Energy use and lost in body-in-white welding machines (kWh)
To estimate the cost of energy used in kWh for the five working machines in operation, the following data
were used: 16.93 A, 119.27 V, five working hours per machine per day. To estimate the energy lost, open
circuit testing was carried using a clamp meter. An ampere of 0.13 and 413.18 V was recorded. Each
machine had an average of 3 hrs of idling time. To calculate power consumed in joules and in watts
Equations 5.3 and 5.4 were used.
𝑊 = 𝑉𝐼𝑡 = 𝐼2 = 𝑉2
𝑅𝑡(𝑠𝑒𝑐) 𝐽𝑜𝑢𝑙𝑒𝑠 (5.3)
𝑃 = 𝑉𝐼 (5.4)
Where:
W Watts
V Volts
I Amperes
T Time in seconds
R Resistance
Table 5-4 shows power consumed while arc welding machines are on, and when idling per month. Ninety
eight percent of the energy is consumed when the machines are on load, and 2 % is consumed when
machines are idling. Although the loss may be seen to be insignificant, in the long run it can lead to huge
losses. Therefore the machines should be switched off when not in use.
17%
83%
Arc welding m/c
Spot welding m/c

65 | P a g e
Table 5-4: Energy use and loss in arc welding
Arc welding
machine
operation
mode
Power
consumed /
m /c / hr.
(kW)
Duration
/month
(Hrs)
No. of
m/c
Power
consumed
/ month
(kWh)
Power
consumed
/ month
(%)
Cost of
energy/
month
(Ksh)
On load 2.02 100 5 1,009.62 98 4,775.51
Idling 0.05 60 5 16.11 2 76.2
5.4.4 Electrical motor driven equipment, energy use and loss analysis
The motor driven equipment which consume the most power include: sand blasting machines, disk
cutters, drilling machines, riveting machines, grinders, sheet cutters and band saws. Energy used by
electric motors in the body-in-white can be estimated using Equation 5.4. The load factor was calculated
using Equation 5.2. According to Saidur (2010) monthly energy use can be estimated using Equation 5.5.
The rated H. P is given on the name plate, while hours were estimated through observation and
questionnaires.
𝑀. 𝐸. 𝑈 = 𝐻. 𝑃 𝑥 𝐿. 𝐹 𝑥 0.746 𝑥 ℎ𝑟𝑠. (5.5)
𝑀. 𝐸. 𝑈 = 𝐻. 𝑃 𝑥 0.13 𝑥 0.746 𝑥 100
Where:
M. E. U Monthly energy use
H. P Horsepower
L. F Load factor
0.746 Conversion ratios from H. P. to kW
All the electrical motor driven machines have been in operation since the company started and the motors
have never been changed or rewound. Since the whole area is dusty due to the type of work done here the
most likely cause of energy loss is overheating due to dust, chips and grease. Saidur (2010) stated that dust
and chips cause up to 5 % of failures as shown in Table 5-9. On average the operating hours for sand
blasting was estimated to be 3 hrs, 5 hrs for disk cutters and drilling, riveting machine 7 hrs and band saw
clack 5 hrs and grinders 5 hrs per day. The load factor was 0.13. Using Equation 5.5 monthly energy use
was calculated, and cost of energy use per month was tabulated in Table 5-5.

66 | P a g e
Table 5-5: Energy use of different motor driven equipment
Equipment
H. P.
Operation
hr. / Month
Energy use /
month
(kWh)
Energy use
/ month
(%)
Cost of
energy use
/month
(kWh)
Sand blasting 40 60 232.75 25 1,100.91
Disk cutters 3 x 3 9 100 87.28 10 412.83
Drilling machine 22 100 213.36 23 1,009.19
Riveting machine (a) 4 140 54.31 6 256.89
Riveting machine (b) 4 140 54.31 6 256.89
Sheet cutter 25 100 242.45 27 1,146.79
Band saw clack 1 100 9.7 1 45.88
Grinders 1 x 2 2 100 19.40 2 91.74
Total - - 913.56 100 4,321.12
Table 5-5 shows the estimated monthly use and cost of energy of the major machines used in the body-in-
white section. The sheet cutter has the highest energy usage of 242.45 kWh per month while sandblasting
accounts for 232.75 kWh. This is because the sheet cutter works for long hours and has high rated power.
The band saw uses the least power due to less working hours. The total cost of energy consumed by
electric motor driven equipment is approximately Ksh 4,321.12. It is recommended to use high efficiency
motors to reduce energy consumption. In most cases there must be idling time between operations. Dirt
and grease can increase overheating hence lose more energy. During cutting the motors operates at 50-80
% of their rated power and during idling at 25 % of their rated power. The overall energy consumed when
motors are idling is 42 % (Saidur, 2010). The estimated idling time for sand blasting was 30 min, disk
cutter 1.5 hrs, riveting 2 hrs, band saw 1.5 hrs and 1.5 hrs for grinders per day. Using Equation 5.6
monthly energy loss and cost of energy lost was calculated and is tabulated in Table 5-6.
𝑀. 𝐸 . 𝐿 = 𝐻. 𝑃. 𝑥 𝐿. 𝐹. 𝑥 0.746 𝑥 ℎ𝑟𝑠. (5.6)
𝑀. 𝐸. 𝐿 = 𝐻. 𝑃. 𝑥 0.13 𝑥 0.746 𝑥 ℎ𝑟𝑠
Where:
M. E. L. Monthly energy use
H. P. Horsepower
L. F. Load factor
0.746 Conversion ratios from H. P. to kW

67 | P a g e
Table 5-6 shows the energy loss in different electrical driven machines in the body-in-white section. The
sheet cutter has the highest energy loss of 96.98 kWh due their long working hours, while drilling
machines account for 64.01 kWh. Although sandblasting has higher energy use, it does not lose more
energy due to fewer working hours. Besides considering H.P. and working hours, other factors which were
observed, which can increase energy loss, were clogged dirt and grease in the motor shafts. It is
recommended to switch off machines when not in use and clean them regularly. Use of high efficiency
motors is recommended these type of motors can save a lot as shown in Table 5-28.
Table 5-6: Energy loss in different motor driven equipment
Equipment
H. P. Idling hrs.
/ Month
Energy lost /
month
(kWh)
Energy lost
/ month
(%)
Cost of energy lost
/ month (Ksh)
Sand blasting 40 10 38.79 14 183.49
Disk cutter 3x 3 9 40 34.91 13 165.14
Drilling machine 22 30 64.01 23
302.75
Riveting
machines 4 40 15.52 5 73.39
Riveting
machines 4 40 15.52 5 73.39
Sheet cutter 25 40 96.98 35 458.72
Band saw clack 1 30 2.91 1 13.76
Grinders 1x 2 2 40 7.76 3 36.70
Total - - 276.4 100 1,307.34
5.4.5 Lighting analysing in body-in-white
The major type of lamps installed here are florescent lamps. There are approximately 79 installed lamps in
this section. Out of 79 lamps only 56 are working the rest 23 are faulty. Many lamps are switched off
during the day in this section. They operate for approximately 4 hrs per day, mostly early in the morning
and late in the evening. Poor lighting can be caused by dust accumulation in lamps and lamps operating
below rated voltage. To estimate the energy use and loss of lighting in body-in-white section Equations
5.7 and 5.9 were used, the results are shown in Table 5-7.

68 | P a g e
Table 5-7: Energy consumed in body-in-white lighting
Description
No. of
fixtures
Power
consumed/
fixture
(kW)
Operating
hrs. /
month
Power
Consumed
/ month
(kWh)
Power
consumed
(%)
Cost /
month
(Ksh)
Working lamps 56 0.065 80 291.20 71 1,377.38
Faulty lamps 23 0.065 80 119.60 29 565.71
Total 79 0.065 80 410.80 100 1,943.08
Table 5-7 shows the amount of energy consumed in body-in-white lighting. It shows that 29 % of the
lamps are not functioning, however, they are drawing unnecessary current. The faulty lamps consume
approximately 119.6 kWh per month. It is recommended that they should be replaced to avoid energy loss.
Other factors which can affect lighting is poorly reflective walls, floors, surfaces and machines. Smith
(2000) states that ceiling and side walls painted in light colors have shown to increase the lighting by 35
%, while changing the old luminaires with new efficient luminaires increases the lighting by 42 %.
𝐸𝑛𝑒𝑟𝑔𝑦 𝑐𝑜𝑛𝑠𝑢𝑚𝑒𝑑 𝑖𝑛 𝑙𝑖𝑔ℎ𝑡𝑖𝑛𝑔 = 𝐸𝑥𝑖𝑠𝑡𝑖𝑛𝑔 𝑘𝑊 𝑥 𝑜𝑝𝑒𝑟𝑎𝑡𝑖𝑜𝑛𝑎𝑙 ℎ𝑟𝑠. (5.7)
𝐶𝑜𝑠𝑡 𝑜𝑓 𝑒𝑛𝑒𝑟𝑔𝑦 𝑐𝑜𝑛𝑠𝑢𝑚𝑒𝑑 𝑖𝑛 𝑙𝑖𝑔ℎ𝑡𝑖𝑛𝑔 = 𝐸𝑥𝑖𝑠𝑡𝑖𝑛𝑔 𝑘𝑊 𝑥 ℎ𝑟𝑠 𝑥 𝐾𝑠ℎ/ 𝑘𝑤ℎ (5.8)
𝐸𝑛𝑒𝑟𝑔𝑦 𝑙𝑜𝑠𝑡 𝑖𝑛 𝑙𝑖𝑔ℎ𝑡𝑖𝑛𝑔 = 𝑘𝑊 𝑜𝑓 𝑓𝑎𝑢𝑙𝑡𝑦 𝑙𝑎𝑚𝑝𝑠 𝑥 𝑜𝑝𝑒𝑟𝑎𝑡𝑖𝑜𝑛𝑎𝑙 ℎ𝑟𝑠. (5.9)
𝐶𝑜𝑠𝑡 𝑜𝑓 𝑒𝑛𝑒𝑟𝑔𝑦 𝑙𝑜𝑠𝑡 𝑖𝑛 𝑙𝑖𝑔ℎ𝑡𝑖𝑛𝑔 = 𝑘𝑊 𝑜𝑓 𝑓𝑎𝑢𝑙𝑡𝑦 𝑙𝑎𝑚𝑝𝑠 𝑥 ℎ𝑟𝑠 𝑥 𝐾𝑠ℎ / 𝑘𝑊ℎ (5.10)
Although many lamps are switched off during the day there are some which are defective, therefore when
the lights are on they draw power which is not utilized. The defective lamps consume approximately 29 %
of the power consumed in body-in-white. They should be replaced or removed. Since all lamps are not
utilized at the same time separate switches should be employed. Other factors which were observed, which
can lead to energy loss in lighting was dirt in the fixtures and the distance in height between work bench
and the lamps. The fixtures should be cleaned regularly to increase the luminance efficiency.
Accumulation of dust can lead to poor lighting in the work place. Although skylights are installed, they
are clogged with dirt so light does not penetrate well; they should be cleaned to enhance maximum
utilization of daylight. Since this is a dusty place walls should be cleaned to increase the reflection of light.
5.4.6 Energy use and loss in body-in-white section major appliances
In this section the major consumer of electrical power are welding machines, motor driven electrical
machines and lighting. Figure 5-9 shows the percentage of energy consumed by different appliances in the
body-in-white section. Welding machines consume 46 % of energy used, although they are fewer in
number. This is because they use high current and they operate for long hours. Electric motor driven

69 | P a g e
machines consume 41 % of power because of their long working hours and they are many in number.
Lighting accounts for 13 % of energy consumed in this section because they are normally switched off
during the day.
Figure 5-9: Percentage of energy used in different appliances in body-in-white
Table 5-8 shows the energy consumed and lost in kWh in different appliances in the body-in-white
sections. It also shows the cost of energy lost and consumed per month in Ksh. The approximate cost of
energy use and lost is Ksh 10,475.76 and Ksh 1,949.251respectively. While the total of energy use and lost
is 2,214.26 kWh and 412.11 kWh respectively.
Table 5-8: Energy use and lost in different appliances in body-in-white
Appliances
Energy used /
month
(kWh)
Cost of energy
use /month
(Ksh)
Energy lost
(kWh)
Cost of energy
lost / month
(Ksh)
Welding machines 1,009.5 4,777.3 16.11 76.2
Lightings 291.20 1,377.34 119.6 565.71
Electric motor driven 913.56 4,321.12 276.4 1,307.34
Total 2,214.26 10,475.76 412.11 1,949.25
Figure 5-10 shows the energy lost in different appliances in the body-in-white section. Electrical motor
driven machines account for 67 % of energy lost while lighting and welding machines account for 29 %,
and 4 % respectively. This is because electrical motor driven machines are many in number and they
1 1 U.S dollar = Ksh 89.09 1 Rand = Ksh 8.50
46%
13%
41%
Welding machines
Lightings
Electrical motor driven

70 | P a g e
operate for long hours. Other causes of energy loss in motors are dirt clogs due to dust, and overheating
because of old age. The machines should be cleaned regularly and a plan to install high efficiency motors
should be considered. Welding machines waste less power because they are few in number and the energy
lost calculated was during idling time. Other factors which can increase energy loss in welding machines
are misuse, mishandling and accumulation of dirt. Welding machines should be handled with care and be
switched off when not in use.
Figure 5-10: Percentage of energy lost in different appliances in body-in-white
The energy lost by lighting is due to faulty tubes which draw energy which is not utilized. Other factors
which can increase light loss are excess lamps, dust and illuminating unnecessary areas. All the faulty
lamps should be replaced or removed completely. The skylights should be cleaned to allow penetration of
light and the walls cleaned to increase illumination.
Table 5-9 shows the causes of motor failure according to Saidur (2010). Overheating and overloading
accounts for 25 %, contamination of moisture, oil and grease for 17 % and 2 % respectively, while single
phasing and normal insulation accounts for 10 % and 12 % respectively. Dust and deterioration accounts
for 5 % each.
4%
29%
67%
Welding m/c
Lightings
Electrical m/c

71 | P a g e
Table 5-9: Causes of motor failure (Saidur, 2010)
Causes % of failure
Overheating and overloading 25
Contamination of moisture 17
Contamination of oil and grease 2
Contamination of chemical 1
Chips and dust 5
Single phasing 10
Normal insulation 12
Deterioration 5
Other 5
5.5 Energy usage in body building section
This is where all fabrication and welding of car bodies and chassis is accomplished. The major machines
which dominate this section are welding machines, which are 31 in number although only 26 were in
operation. It is one of largest consumers of electricity and the busiest section in the plant. The major form
of energy used here is electrical energy. From observation, lighting and welding machines are the major
sources of energy loss in this section. According to Galitsky and Worrell (2008) the average electricity
consumed in vehicle assembly plant in welding is about 80 kWh / car. This section covers an area of 28 m
by 60.96 m.
Figure 5-11: Side view section of body building section

72 | P a g e
Figure 5-11 shows the side view section of body building. From the photo it is evident that all the lights
are on because the place is so congested and there is no direct opening to allow daylight. Although the
section is fitted with skylights they are clogged with dirt therefore blocking penetration of light. Energy
usage of welding machines, electric motor driven machines and lighting is analyzed below.
5.5.1 Kilovolts amperes analysis in body building section
This body building section has 31 registered machines with Kenya Power and Lighting Company, but
only 26 are operational. The total kilovolts amperes of registered welding machines is 793.61 KVA. Out
of 31 welding machines only 26 machines with a capacity of 665.6 KVA are in operation as shown in
Table 5-10.
Table 5-10: Kilovolts amperes in body building section welding machine
From Table 5-10 it is evident that about Ksh 6,4002 is lost per month from the payment of registered KVA
which are not utilized. These welding machines should be deregistered, and if they are faulty they should
be repaired.
5.5.2 Energy analysis in arc welding machines in body building
Body building section as stated earlier has 31 arc welding machines, but only 26 are in operation. The
non-operational machines are either faulty or under maintenance. Ideally the machines are switched on for
8 hrs, which are the working hours of the company under normal circumstances. Due to other subtasks in-
between welding the welding machines actually work on an average of 5 hrs per day, and are left idling
for 3 hrs. On average the voltage and ampere calculated when arc welding machines are on load is 16.93
V and 119.24 A. Since not all 31 machines are in operation the energy usage was calculated for 26
welding machines which were in operation at the time of data collection. Using a clamp meter the voltage
and amperes measured when arc welding machines were idling was 413.18 V and 0.13 in total, based on 3
hrs idling time per machine. Using Equation 5.4 power consumed was calculated and the results for ‘on
load’ and ‘idling’ are shown in Table 5-11. It was observed that a lot of energy was used when machines
2 1U.S dollar = Ksh 89.09 1Rand = Ksh 8.50
Welding machines No. KVA
Cost / KVA
(Ksh)
Cost of KVA / month
(Ksh)
Registered arc welding 31 793.61 50 39,680.5
Operating arc welding 26 665.6 50 33,280
Difference 5 128.01 50 6,400.5

73 | P a g e
are on load and less energy is used when they are idling. The total kWh used during arc on and idling is
approximately 5,332.51 kWh per month for 26 machines in the body building section. It is advisable to
switch off machines when not in use.
Other factors which were observed, which can lead to energy loss in welding machines include
mishandling and misuse of machines such as leaving the electrode grounded to the earth which can draw
excess current. Also, dust can lead to overheating which can increase resistance, therefore reducing
efficiency. When relocating machines from one point to the other they should be handled with care;
mishandling can cause misalignment which can lead to machine failure.
Table 5-11: Energy used and lost in body building section welding machines
5.5.3 Electric motor driven machines energy analysis in body building section
This section does not have a lot of motor driven machines. It has only disk cutters, grinders and band
saws. On average they operate for 100 hrs per month. Using Equation 5.5 the monthly energy use was
calculated and is tabulated in Table 5-12. The total energy consumed by electrical machines in the body
building section is approximately 203.66 kWh per month.
Table 5-12: Energy use in electrical motor driven machines in body building section
Disk cutters have the highest rate of 29.09 kWh per disk cutter. Band saw and grinders have 9.7 kWh and
19.40 kWh respectively. The idling time of the disk cutters, grinders, and the band saw mostly occurs in
Welding
machine
operation mode
Power
consumed / m/c
(kW)
Duration /
month
(Hrs)
No. of
m/c
Power consumed
/ month
(kWh)
Cost of
energy /
month
(Ksh)
On load 2.02 100 26 5,248.72 24,832.63
Idling 0.05 60 26 83.79 396.21
Total - - - 5,332.51 25,228.84
Equipment
H. P. Operation
hrs./month
Power consumed
/ month
(kWh)
Cost of
energy/ kWh
(Ksh)
Cost of energy /
month
(Ksh)
Disk cutter 1 3 100 29.09 4.73 137.61
Disk cutter 2 3 100 29.09 4.73 137.61
Band saw 1 100 9.7 4.73 45.88
Grinders 2 100 19.40 4.73 91.71
Total - - 87.28 - 412.81

74 | P a g e
between the operations. Most of the time motor driven machines in the body building section are switched
off when not in use. Using Equation 5.6 monthly energy loss was calculated as shown in Table 5-13. The
estimated idling time was 1.5 hrs per day. The total energy loss for these machines is approximately 26.19
kWh per month. Disk cutters have the highest energy loss of 8.73 kWh per machine due to their high rated
wattage while grinders and the band saw account for 5.82 kWh and 2.91 kWh respectively.
Table 5-13: Energy lost in motor driven machines in body building section
5.5.4 Lighting in body building section
In the body building section there are approximately 67 fluorescents lamps. Out of these 67 lamps 13 are
defective; either the tubes are not replaced or the choke or starter is faulty. Lighting is not normally
switched off because this work place is congested as shown in Figure 5-11, when they are switched off the
operators cannot see clearly. Lights mostly operate for 8 hrs per day. Also, the lightings are placed very
high from the work benches. Using Equation 5.7 and 5.9 energy consumed and lost in lighting in the body
building section was calculated as shown in Table 5-14. From the calculations it is evident that energy use
of the working lamps accounts for 81 % which is as a result of not switching them off during day time.
Energy loss from faulty lamps accounts for 19 %. Other sources of light loss in this section is an
accumulation of dust in the lamps and high distance of lamps from working areas. It is advisable to clean
the lamps.
Table 5-14: Energy consumed per month in body building lightings
Mode of
lamps
Appx.
No. of
fixture
Number
of watts
Total
kW
Operating
hours /
day
Power
consumed /
month
(kWh)
Power
consumed
/ month
(%)
Cost of
energy /
month
(Ksh)
Working 54 0.065 3.51 160 561.6 81 2,656.37
Defective 13 0.065 0.845 160 135.2 19 639.50
Total 67 - 4.355 - 696.8 100 3,295.86
Equipment H. P.
Idling hr.
/month
Power lost /
Month (kWh)
Cost / kWh
(Ksh)
Cost of energy lost /
month (Ksh)
Disk cutter 1 3 30 8.73 4.73 41.29
Disk cutter 2 3 30 8.73 4.73 41.29
Band saw 1 30 2.91 4.73 13.76
Grinders 2 30 5.82 4.73 27.52
Totals - - 26.19 - 123.86

75 | P a g e
Table 5-15 shows the energy consumed and lost in different appliances in the body building section and
the cost of energy use and lost in Ksh. The total energy consumed is approximately 5,897.6 kWh and
energy loss accounts for 280.08 kWh per month. The total cost energy use and lost accounts for Ksh
27,901.183 and Ksh 1,159.57 respectively.
Table 5-15: Energy used and lost different appliances in body building section
Figure 5-12 shows the percentage kWh consumed by different appliances in body building section per
month. Welding machines are the major consumer of energy in this section with approximately 89 % of
energy usage, while electrical machines and lighting accounts for 1 % and 10 % respectively. Welding
machines are many in number and they work for long hours. Electric motor driven machines are fewer in
number, although their workload is high, therefore they use and lose least energy in the body building
section.
Figure 5-12: Energy used in different appliances in body building section in kWh
31 U.S dollar = Ksh 89.09 1 Rand = Ksh 8.50
89%
1%
10%
Welding m/c
Motor driven equipments
Lightings
Appliances
Energy used
/ month
(kWh)
Energy
consumed /
month
(%)
Cost of
Energy use
(Ksh)
Energy
lost /
month
(kWh)
Energy
lost /
month
(%)
Cost of
Energy
lost (Ksh)
Welding m/c 5,248.72 89 24,832.00 83.79 34 396.21
Electrical 87.28 1 412.81 26.19 11 123.86
Lightings 561.6 10 2,656.37 135.20 55 639.50
Total 5,897.6 100 27,901.18 280.08 100 1,159.57

76 | P a g e
Figure 5-13 shows the percentage of energy lost from different appliances in body building per month in
kWh. Lighting is the major source of energy loss accounting for 55 %, while welding machines and
electric motor driven accounts for 34 % and 11 % respectively. Lights are not usually switched off during
the day so they operate for 8 hours per day. The work place is congested and when the lights are switched
off the workers may not see clearly and this may result in accidents while working. Table 5-14 shows that
19 % of the lamps are not working thus increasing the energy loss. Other sources of energy loss observed
were dirt and grease in the machines. Due to the large volume of air drawn by fans to keep the welding
machines cool, dust and other materials are also drawn in which can cling to the commutators and brushes.
Greasy dirt clogs air passages between coils causing them to overheat, since the resistance of the coil is
raised and the conductivity lowered by heat thus reducing the efficiency of the machines. Overheating
makes the insulation between coils, dry and brittle as stated by Smith (2000).
Figure 5- 13: Energy lost in different appliances in body building section
It is recommended that lighting fixtures be cleaned regularly and fitted not too high from working areas.
The walls and skylights should be cleaned to increase reflection and allow penetration of light.
Smith (2000) recommends that airways should be cleared because blockage will interrupt the proper flow
of air. Covers of the machine should not be removed because this interrupts the proper path of air flow.
Workers should be trained to switch off welding machines when not in use. The machines should not be
abused which means the electrodes should never be left grounded to the work because this creates a ‘dead’
short circuit forcing the machine to generate much higher currents than it was designed for.
Training should start when the workers are hired and continue throughout. When one is new she or he
tends to observe rules strictly. In this section the majority of the workers seems not to understand why
they should save energy because if they save or not there is no difference in their wages. They should
34%
11%
55%
Welding m /c
Electrical m /c
Lightings

77 | P a g e
understand the benefit of saving energy and how loss of energy can affect them. Another aspect which was
observed is that since they work on piece rate they work hastily to produce as many pieces as they can, so
they consider switching the machine on and off to be a waste of time. In future, buying of high efficiency
welding machines or installation of welding robots should be considered. Though expensive to install, in
the long run they will save energy, save labour costs, and the output is excellent.
5.6 Energy usage in the paint shop section
This is where the painting of body cars is carried out. Painting is a process of applying colour on vehicle
bodies to protect them and to enhance appearance. The paint shop consists of: washing bay, spray booths,
mixing area, burners and ovens. The area is totally enclosed to prevent any contamination. The paint shop
covers an area of 21 m by 152.4 m. Painting is accomplished in various stages as shown in Figure 5-15.
Figure 5-14 shows the front view of a spraying booth in the paint shop. From the picture it is evident that
the area is completely covered to prevent paint contamination with other aerosols. It has only one exit and
entry. The major energy consuming equipment in the paint shop are: pumps, fans, spray guns and lighting.
Electrical energy, compressed air and industrial oil are the major form of energy used here. Electrical
energy is used to drive motors and in lighting, while industrial oil is used in burners and compressed air is
used in spray guns.
Figure 5-14: Front view of paint shop spraying booths
Figure 5-15 shows the painting process of the vehicle. It starts by cleaning the vehicle bodies to remove
dirt, oil and other particles. Different types of coats are applied in the main colour booth such as the

78 | P a g e
primecoat, the basecoat, and the clearcoat. The vehicle bodies are then immersed in the prime coating,
then to the curing oven. Sanding is done, sealers are applied, repainted and cured then finally rectifications
are made and the final coat is applied, then cured (Nicole et al., 1995). Industrial oil, electrical energy
usage and heat usage in the paint shop is analyzed below.
Figure 5-15: Painting processes
5.6.1 Industrial oil usage
Industrial oil is used to fuel burners to raise the temperature in ovens. During peak hours the ovens run
from approximately 08.30 hrs to 16.30 hrs and consume approximately 500 l of industrial oil per day,
which is approximately 62.5 l/hour. During off-peak the ovens run for 2 hrs to 4 hrs per day. If one litre
cost Ksh100 taking 2 hrs of operation per day, the ovens will consume 125 l, which cost Ksh12, 500 as
shown in Table 5-16. To fully utilize the ovens two cars should be dried at the same time.
Table 5-16 shows the amount of industrial oil consumed during peak and off-peak hours in the burners per
day in paint shop. It shows that if one oven runs for 8 hrs per day it will consume 500 l per day, but if it
runs for 2 hrs per day it will consume 125 l per day. It is recommended to have a good maintenance plan
and to have plans for replacing old machines with new ones to avoid ignition problems which consume a
lot of electrical energy and industrial oil.
Table 5-16: Industrial oil consumed per month in paint shop
Operation
Hrs.
Operation
Hrs. / day
No of litres
used / day
Cost /
litres
(Ksh.)
Total cost /
day
(Ksh.)
Total cost / month
(Ksh.)
Peak 8 500 100 50,000 1,000,000
Off peak 2 125 100 12,500 250,000
Idling time 0.5 31.25 100 3,125 62,500
Pre-cleaning Phosphate Under body
priming 2rd primer
Primer drying
Sanding Sealing Sealer drying 1st painting Paint curing
Rectification 2rd painting Paint curing

79 | P a g e
5.6.2 Electrical energy usage analysis in the paint shop
The major energy consumers of electrical energy in the paint shop are fans and pumps. Fans are used to
supply fresh air and remove effluents in booths and burners, while pumps are used to pump industrial oil
from the station to the burner tank and to pump waste water from the spray booth and the washing area to
the sewer lines. Each oven has two fans, one pump and two eliminator motors for burners, while each
spray booth has one pump and two fans. From observation and interviews it is evident that if two ovens
are started at the same time the KVA goes high and the highest recorded KVA is the one which
determines the payment of electricity bills. To calculate the monthly electrical energy used and lost in
paint shop the operating hours of different machines were estimated as follows: catcher machine 3 hrs,
pump stations 8 hrs, booths and ovens 6 hrs per day. The estimated idling time was 30 min for catcher
machine, 1 hr for fans and 3 hrs for pumps. Using Equations 5.5 and 5.6 monthly energy use and loss were
calculated and the results are shown in Table 5-17.
Table 5-17 shows the monthly energy use and loss in fans and pumps in the paint shop section. Fans
consume 84 % of electric power while pumps consume 16 %. This is because fans have high rated value
and they carry heavy loads. Whenever there is an operation in the paint shop fans have to be switched on
throughout unlike the pumps. Some pumps are only operated when required like waste water pumps,
while others are operated throughout the painting process such as industrial oil pumps. From the
interviews with supervisors, those fans have not been cleaned for the last five years, due to inaccessibility,
therefore they are most likely clogged with dirt from the surroundings and from paint aerosols. Due to this
dirt the motors are forced to use a lot of energy. The fans should be cleaned regularly to remove soot.
When the motors are starting they draw a lot of current from the mains which makes the KVA shoot up,
therefore motors should be started one at a time. Since the machines are very old they encounter ignition
problems when starting which consumes a lot of power with no operation taking place. Proper
maintenance should be done to avoid ignition problems. If adjustable variable speeds are used they can
save a lot of energy as shown in Table 5-29 and Table 5-30.

80 | P a g e
Table 5-17: Energy use and loss in fans and pumps in paint shop
Equipment
Energy
consumption /
month (kWh)
Energy
consumption /
month
(%)
Energy
loss /
month
(kWh)
Cost of
energy used /
month (Ksh)
Cost of energy
lost / month
(Ksh)
Fans 2,397.35 84 399.55 11,339.47 1,889.87
Pumps 466.47 16 77.10 2,206.40 364.68
Total 2,863.82 100 476.65 13,545.87 2,254.55
5.6.3 Lighting analysis in paint shop
The paint shop section has approximately 163 fluorescent lamps with 65 watts per lamp. There are double
and single lamp fixtures. Out of 163 installed lamps, 27 of them were not working at the time of data
collection. Lights in this section are switched on and off at different times of the day. In spray booths
lights are on for longer hours, especially when spraying is taking place because it is relatively dark inside.
In ovens, lights are switched on during the intake and exit of the vehicle. During the sanding process the
lights are also switched on throughout. On average the lights are on for 5 hrs per day in the paint shop.
Using Equations 5.7 and 5.9, energy consumed by working and defective lamps was calculated and the
results are shown in Table 5-18. It shows that the total electrical energy consumed by both working and
non-working lamps is approximately 1,059.5 kWh per month.
Table 5-18: Energy used and lost in paint shop lighting
Description No of
fixture
Lamp
wattage
(kW)
Operation
hrs.
/month
Energy
consumed
/ month
(kWh)
Cost /
kWh (Ksh)
Cost of energy /
month (Ksh)
Working lamps 136 0.065 100 884 4.73 4,181.32
Defective lamps 27 0.065 100 175.5 4.73 830.115
Total 163 - - 1,059.5 - 5,011.435
Figure 5-16 shows the percentage of energy consumed by working and defective lamps in the paint shop.
Seventeen percent of energy is consumed by defective lamps which draws energy which is not utilized,
while 83 % is consumed by the working lamps. It is recommended to repair and replace faulty lamps.
Lamps in the paint shop are more exposed to paint fumes than any other sector, it is advisable to clean
them regularly. Due to different phases of the painting process separate light switches should be installed
for different subsections of the paint shop.

81 | P a g e
Figure 5-16: Energy consumed by working and defective lamps in paint shop
5.6.4 Heat leakage analysis in ovens
Ovens are used to cure and dry paint using heat. The temperature of burner’s ranges from 80 oC to 200
oC
in one oven, but the temperatures commonly used to dry paint ranges from 110 oC to 130
oC. Energy
leakage per drying session in the two ovens was monitored for five days during the research period. Using
Equation 5.11 actual leakage was estimated and the results are shown in Table 5-19. One session to dry a
vehicle takes approximately 30-40 minutes.
Table 5-19 shows the leakage measured in degrees celsius for the ovens. The leakage may be minimal, but
in the long run the oven will have lost a lot of heat. Mostly the leaks occur in the doors due to wearing out
of sealing bond in the doors. It is recommended to replace the sealing bond to avoid heat loss. Continuous
loss of heat means more running hours of burners hence more consumption of industrial oil and electricity.
Sometimes the ovens are being run without the car inside. Multitasking of jobs should be employed to
avoid heat loss in the ovens and a proper record of the industrial oil used per car should be investigated.
𝐴𝑐𝑡𝑢𝑎𝑙 𝑙𝑒𝑎𝑘𝑎𝑔𝑒 = 𝑚𝑒𝑎𝑠𝑢𝑟𝑒𝑑 𝑙𝑒𝑎𝑘𝑎𝑔𝑒 − 𝑠𝑜𝑟𝑟𝑜𝑢𝑛𝑑𝑖𝑛𝑔 𝑡𝑒𝑚𝑝𝑒𝑟𝑎𝑡𝑢𝑟𝑒 (5.11)
Table 5-19: Leakage measurement for ovens
Days
Actual temp in
oven
(O
C)
Measured
leakages
(O
C)
Surroundings
(O
C)
Actual leakages
(O
C)
Mon 120 39 25 14
Tue 124 42 23 19
Wed 121 40 22 18
Thu 123 41 22 19
Fri 121 41 24 17
Total - - - 87
83%
17%
Working lamps
Defective lamps

82 | P a g e
5.7 Energy usage in the assembly line
This is where the assembly of the cabin and engines takes place. There are six installed lines in the
company, but at the time of data collection only two lines were in operation. They usually use pneumatic
tools to tighten and fasten nuts and bolts and each line has three pneumatic tools. They also have hoist
machines for lifting and mounting cabins and engines. Every workstation has three hoists. The major
sources of energy used in this area are compressed air and electrical energy. A lot of work is done
manually in this section with the use of human energy. In the assembly line there are stations which are
supplied with compressed air even though they are not in operation. It covers an area of 53 m by 120 m.
The major source of energy loss in this section is compressed air. It is one of the best-arranged sections in
the vehicle assembly plant. Energy usage in lighting and electrical machines is analyzed below.
5.7.1 Lighting analysis in assembly line
There are 142 lighting lamps in this section, with 123 working lamps and 19 faulty lamps. Most lamps are
switched off during the day. The area is well organised and the skylights are clearer than elsewhere which
makes the visibility good. On average the lights are on for 2 hrs per day. Using Equations 5.6 and 5.8,
energy consumed by lighting was calculated and the results are shown in Table 5-20. The results show that
the total energy used per month by working and defective lamps is approximately 369.2 kWh.
Table 5-20: Energy consumed by lightings in assembly line
Description No of
fixture
Kw/
lamp
Operation
hrs /day
Operation
hrs /month
Energy use
/ month
(kWh)
Cost of
energy/month
(Ksh)
Working lamps 123 0.065 2 40 319.8 1,512.65
Defective lamps 19 0.065 2 40 49.4 233.66
Total 142 - - - 369.2 1,746.31
Fig 5-17 shows the percentage of energy consumed in assembly line by lighting. Working lamps account
for 87 %, while defective lamps accounts for 13 %. As shown from Figure 5-18 the skylights in this place
are clear, thus increasing the use of daylight. Since there are assembly lines which are not in use but the
lamps are in use, it is advisable to employ separate switches to different sections to control and save
energy.

83 | P a g e
Figure 5-17: Energy consumed by working and non-working lamps
Figure 5-18: Side view of assembly lines
5.7.2 Electrical energy analysis
Hoists and cranes are the major electrical machines in this section. They are used to lift the heavy loads
either for mounting or for storage. There are three cranes in every line and each has 20 H.P. At the time of
data collection only two lines were in operation. To calculate the energy consumed by hoists, their
working hours were estimated to be 4 hrs per day. Using Equations 5.5 and 5.6 monthly energy use and
loss was calculated and the results were tabulated in Table 5-21. It shows that hoists and cranes account
for 49 %, while lightings accounts for 51 %.
87%
13%
Working lamps
Defective lamps
Skylight
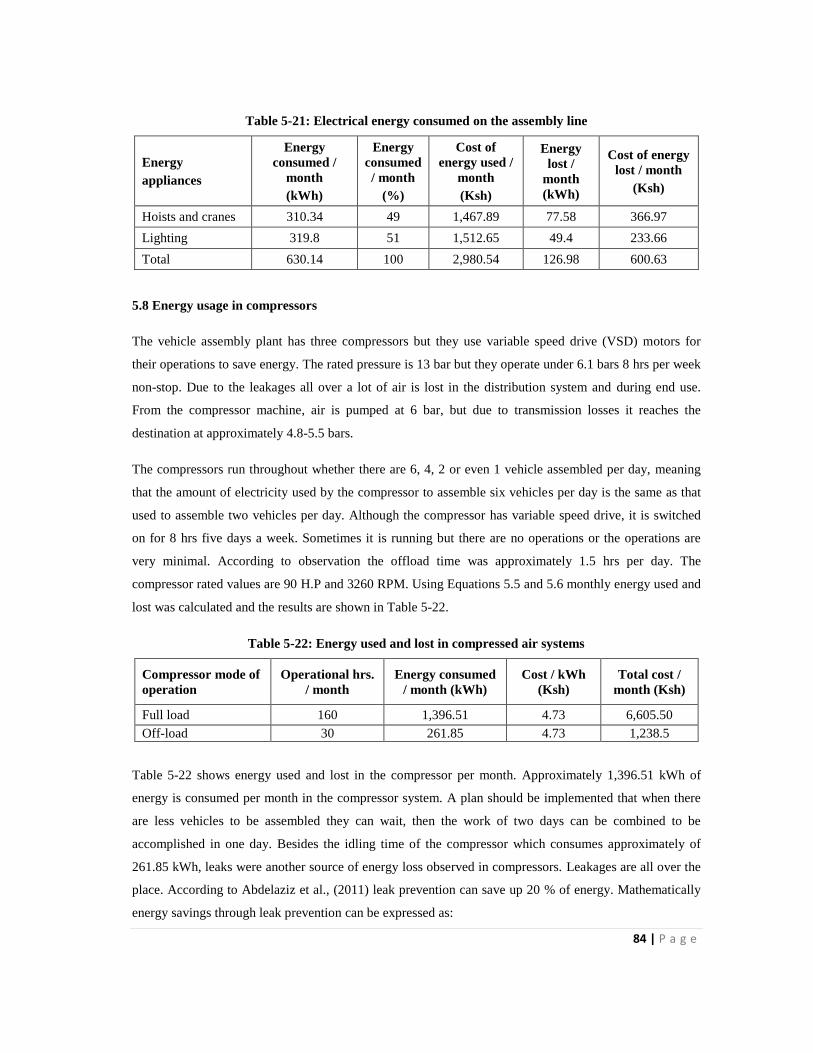
84 | P a g e
Table 5-21: Electrical energy consumed on the assembly line
Energy
appliances
Energy
consumed /
month
(kWh)
Energy
consumed
/ month
(%)
Cost of
energy used /
month
(Ksh)
Energy
lost /
month
(kWh)
Cost of energy
lost / month
(Ksh)
Hoists and cranes 310.34 49 1,467.89 77.58 366.97
Lighting 319.8 51 1,512.65 49.4 233.66
Total 630.14 100 2,980.54 126.98 600.63
5.8 Energy usage in compressors
The vehicle assembly plant has three compressors but they use variable speed drive (VSD) motors for
their operations to save energy. The rated pressure is 13 bar but they operate under 6.1 bars 8 hrs per week
non-stop. Due to the leakages all over a lot of air is lost in the distribution system and during end use.
From the compressor machine, air is pumped at 6 bar, but due to transmission losses it reaches the
destination at approximately 4.8-5.5 bars.
The compressors run throughout whether there are 6, 4, 2 or even 1 vehicle assembled per day, meaning
that the amount of electricity used by the compressor to assemble six vehicles per day is the same as that
used to assemble two vehicles per day. Although the compressor has variable speed drive, it is switched
on for 8 hrs five days a week. Sometimes it is running but there are no operations or the operations are
very minimal. According to observation the offload time was approximately 1.5 hrs per day. The
compressor rated values are 90 H.P and 3260 RPM. Using Equations 5.5 and 5.6 monthly energy used and
lost was calculated and the results are shown in Table 5-22.
Table 5-22: Energy used and lost in compressed air systems
Compressor mode of
operation
Operational hrs.
/ month
Energy consumed
/ month (kWh)
Cost / kWh
(Ksh)
Total cost /
month (Ksh)
Full load 160 1,396.51 4.73 6,605.50
Off-load 30 261.85 4.73 1,238.5
Table 5-22 shows energy used and lost in the compressor per month. Approximately 1,396.51 kWh of
energy is consumed per month in the compressor system. A plan should be implemented that when there
are less vehicles to be assembled they can wait, then the work of two days can be combined to be
accomplished in one day. Besides the idling time of the compressor which consumes approximately of
261.85 kWh, leaks were another source of energy loss observed in compressors. Leakages are all over the
place. According to Abdelaziz et al., (2011) leak prevention can save up 20 % of energy. Mathematically
energy savings through leak prevention can be expressed as:

85 | P a g e
𝐸. 𝑆 = 𝐸. 𝑈 𝑥 𝐸. 𝑆 % (5.11)
𝐸. 𝑆 = 1,396.51 𝑥 0.2 = 279.30 kWh
Where:
E. S Energy savings
E. U Energy use
In this case, monthly energy saving of 279.30 kWh can be achieved through leak prevention. If leaks are
prevented the company can save up to 1,321.1 Ksh4 per month. All these leakage should be sealed to
minimize loss.
5.8.1 Leakage measurement of various orifice diameters
According to the US Department of Energy (2004) various orifice diameters and their rate of leakages was
used to calculate leakages for different diameters. Taking measurements of 80 psi which is the pressure at
many destinations at 8 hrs per day, per month (160 hrs per month), the monthly rate of leakages was
estimated as shown in Table 5-23. Taking 1 CFM = 60 CF /Hr. Where C. F. M = cubic feet per metre.
Table 5-23: Leakage measurement
Orifice ∅ (inches)
𝟏
𝟔𝟒
𝟏
𝟑𝟐
𝟏
𝟏𝟔
𝟏
𝟖
𝟏
𝟒
𝟑
𝟖
Leakage rates (CFM) 0.335 1.34 5.4 21.4 85.7 193
CF. / hr. 60 60 60 60 60 60
Operation hours / month 160 160 160 160 160 160
Total leakage / month (CFM /Hr) 3,216 12,864 51,840 205,440 822,720 1,852,800
It is evident that the larger the diameter of the orifice the higher the leakage per C. F. M. and vice versa.
The leak rate increases as the diameter of the orifice increases. Leaks can lead to an increase in power
consumption, make the pneumatic tools less efficiency hence affect production. Leaks occur in joints,
valve connections, and in the process of transmission. It is recommended to repair all these leaks to avoid
wastage and increase the life span of tools.
4 1 U.S dollar = Ksh 89.09 1 Rand = Ksh 8.50

86 | P a g e
Figure 5-19: Leaking valve in the plant
5.9 Energy use in the stand-by generator
The stand-by generator is used when there is a power failure in the company. It uses diesel as a major
source of energy. When the generator is running and all facilities in the company are on load, it consumes
approximately 66 l per hour and one litre cost Ksh 107. If it runs for 8 hrs, in one day it will consume 528
l which costs Ksh 56,496. Running time for generator in different months was recorded and the energy
consumed and the cost is shown in Table 5-24.
Table 5-24: Energy consumed in a generator in the year 2013
Months Operation hours per
month
Litres consumed /
month
Total cost of diesel used/
month
(Ksh)
Jan 4.59 302.94 32,414.58
Feb 1.9 125.4 13,417.80
March 0.19 12.54 1,341.78
April 4.50 297.0 31,779.00
May 4.32 285.12 30,507.84
June 7.36 485.76 51,976.32
July 7.21 475.86 50,917.02
Aug 6.25 412.5 44,137.50
Sep 0 - -
Oct 0 - -
Nov 1.2 79.2 8,474.40
Total 37.52 2,476.32 264,966.24
Leaking valve

87 | P a g e
Table 5-24 shows the amount of diesel consumed in a generator in the year 2013. The month of June and
July encountered the highest running hours which means the company experienced a power failure for
many days or hours. The generator used 2,476.32l in the year 2013 which costed Ksh 264, 966.24.5
Alternative means of generating power should be installed such as solar energy and steam. The generator
should be run only when required; if there is not much operation taking place it should not be switched on.
5.10 Energy use in transport
The transport sector entails the company vehicles and the forklifts. The company has five forklifts but
only two are in use. Most of the vehicles use diesel, but there were no records of how much fuel they
consume per kilometer. The company also has three big trucks which use super petrol, one pickup and
staff vehicles which use diesel. The quantity of diesel in litres consumed for one month was recorded as
shown in Table 5-25.
Table 5-25: Diesel consumed in transport
Duration
(Weeks)
Diesel consumed
(L)
Cost per
(L)
Total cost
(Ksh)
1st 525 100.11 52,557.75
2rd 679 100.11 67,974.69
3rd 600 100.11 60,066
4th
300 100.11 30,033
Total 2,104 - 210,631.44
Table 5-25 shows the amount of diesel consumed in the transport sector for one month. The total of diesel
consumed for one month is approximately 2,104 l. Many factors will decide which method of transport is
best such as weight of luggage and routes to follow. If vehicles are required in the company it is possible
to buy hire, lease or even subcontract. But most companies own their vehicles. Since vehicles are driven
by different drivers, use different routes and different loads it is advisable to make comparisons and hence
be able to make reasonable targets in terms of fuel consumption per Km.
5.11 Total energy analysis
Total energy cost and use of the various sections and equipment was analysed as shown in Table 5-26,
Table 5-27, and Figures 5-20, 5-21, and 5-22.
5 1 U.S dollar = Ksh 89.09 1 Rand = Ksh 8.50
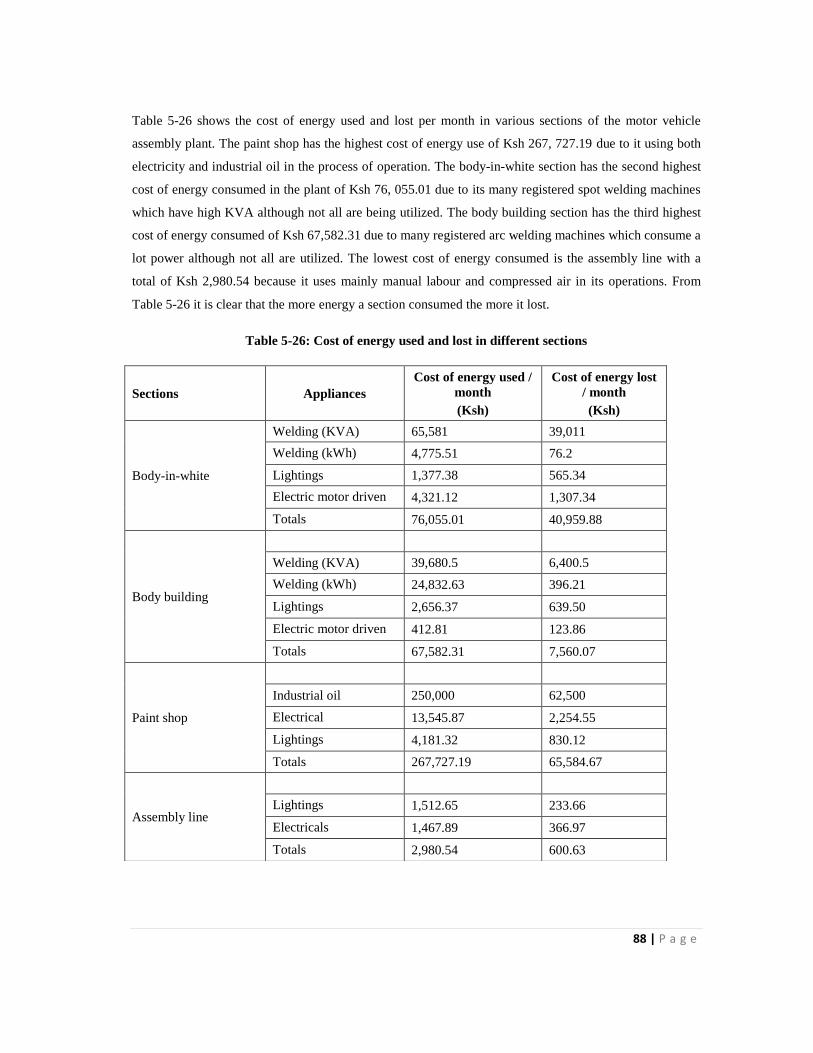
88 | P a g e
Table 5-26 shows the cost of energy used and lost per month in various sections of the motor vehicle
assembly plant. The paint shop has the highest cost of energy use of Ksh 267, 727.19 due to it using both
electricity and industrial oil in the process of operation. The body-in-white section has the second highest
cost of energy consumed in the plant of Ksh 76, 055.01 due to its many registered spot welding machines
which have high KVA although not all are being utilized. The body building section has the third highest
cost of energy consumed of Ksh 67,582.31 due to many registered arc welding machines which consume a
lot power although not all are utilized. The lowest cost of energy consumed is the assembly line with a
total of Ksh 2,980.54 because it uses mainly manual labour and compressed air in its operations. From
Table 5-26 it is clear that the more energy a section consumed the more it lost.
Table 5-26: Cost of energy used and lost in different sections
Sections Appliances
Cost of energy used /
month
(Ksh)
Cost of energy lost
/ month
(Ksh)
Body-in-white
Welding (KVA) 65,581 39,011
Welding (kWh) 4,775.51 76.2
Lightings 1,377.38 565.34
Electric motor driven 4,321.12 1,307.34
Totals 76,055.01 40,959.88
Body building
Welding (KVA) 39,680.5 6,400.5
Welding (kWh) 24,832.63 396.21
Lightings 2,656.37 639.50
Electric motor driven 412.81 123.86
Totals 67,582.31 7,560.07
Paint shop
Industrial oil 250,000 62,500
Electrical 13,545.87 2,254.55
Lightings 4,181.32 830.12
Totals 267,727.19 65,584.67
Assembly line
Lightings 1,512.65 233.66
Electricals 1,467.89 366.97
Totals 2,980.54 600.63

89 | P a g e
Table 5-27 show the cost of energy consumed by major machines and equipment in a vehicle motor
vehicle assembly plant per month. Equipment which uses oil has the highest cost of energy, the stand-by-
generator and burners being the highest consumer consumers. Equipment which uses electrical energy
such as arc welding machines and spot welding machines accounts for the highest cost.
Table 5- 27: Cost of energy consumed by different equipment
Equipment Cost of energy used / month
(Ksh)
Cost of energy lost / month
(Ksh)
Arc welding m/c 79,869.64 13,383.91
Spot welding m/c 55,000 32,500
Lighting 9,727.68 2,268.99
Compressors 6,605.50 2,559.6
Transport equipment 210,631.44 42,126.29
Burners and ovens 250,000 62,500
Fans 11,339.47 1,889.87
Pumps 2,206.40 364.68
Hoists and cranes 1,467.89 366.97
Stand-by generator 264,966.24 52,993.25
Other electricals 5,284.37 1,596.32
Figure 5-20 shows the energy consumed by electrical machines in the motor vehicle assembly plant in
kWh. Other electrical machines include grinders, saws, etc. Out of 12,603.33 kWh consumed in the plant
per month arc welding machines has the highest of proportion of 45 %, fans and lighting account for 17 %
and 15 % respectively. The least consumer of energy are hoists and cranes which account for 2 % while
rivetting and drilling machines also accounts for 2 %.

90 | P a g e
Figure 5-20: Energy consumed by electrical machines in the motor vehicle assembly plant
Figure 5-21 shows the energy lost by electrical machines in the car assembly plant in kWh. Other
electrical machines include grinders, band saws, etc. Out of 1,733.7 kWh lost per month by various
machines, lighting has the highest energy loss of 28 %, fans account for 23 % while compressors account
for 16 %. Machines consuming the least energy are hoists and cranes which account for 5 %.
Figure 5-21: Energy lost by electrical machines in the vehicle assembly plant
Figure 5-22 shows the amount of oil consumed in the motor vehicle assembly plant for one month in
litres. Out of 17,080.32 l consumed per month, burners and ovens accounts for 73 %, stand-by generator
45%
2% 3%
15%
17%
4%
10%
2% 2%
Arc welding
Drilling and Rivetting
Cutters
Lightings
Fans
Pumps
Compressors
Hoist and cranes
Others
6% 6%
9%
28%
23%
5%
15%
5% 3%
Arc welding
Drilling and Rivetting
Cutters
Lightings
Fans
Pumps
Compressors
Hoist and cranes
Others

91 | P a g e
accounts for 15 % while transport equipment accounts for 12 %. This is because burners and ovens
operate almost daily and they consume industrial oil as a major source of energy.
Figure 5-22: Energy consumed by oil equipment in a vehicle assembly plant
5.11.1 Summary
After analysing the data the following observations were made.
The major forms of energy used in the plant are electrical energy, compressed air, diesel and industrial oil.
Electrical energy is used to drive all electric systems and in lights, compressed air is used in pneumatic
tools and spray guns, diesel is used in the transport sector and in generators while industrial oil is used in
burners. Electrical energy and industrial oil are the most common forms of energy used in the plant. The
major forms of energy loss in the plant are leaks, use of aged equipment, dust and poor maintenance.
Leaks of compressed air occur all over the plant and they can be detected audibly by their hissing sounds.
The major equipment in the plant are too old, having been in operation since the company started more
than 50 years ago. Their efficiency may have gone down with time, thus increasing energy loss. Due to the
type of work done in the plant, some sections are too dusty thus making machines to be dirty too. Dirt can
increase energy loss in machines.
Some of the short term and long term opportunities to save energy recommended are energy savings by
technologies and energy savings by management as explained below.
5.12 Energy savings by technologies
Some of the techniques which can be employed to save energy include: use of high efficiency motors, use
of variable speed drives, switching off lights and equipment.
73%
15%
12%
Burners and ovens
Stand by generators
Transport equipments

92 | P a g e
5.12.1 Use of high efficiency motors
Energy-efficient motors are designed to operate with minimal losses in efficiency at loads of between 75
% and 100 % of rated capacity. This can be beneficial to varying load applications. Energy efficient
motors have lower noise levels and lower temperatures. They are less likely to be affected by supply
voltage fluctuations. According to Saidur and Mekhilef (2010) monthly energy savings can be estimated
using Equation 5.12. Monthly energy savings of replacing one standard motor with one high efficiency
motor to different power rating was calculated and is tabulated in Table 5-29. The operating hours for
motors in this plant was estimated to be 5 hrs per day.
𝐸𝑆 = ℎ𝑝 𝑥 𝐿 𝑥 0.746 𝑥 ℎ𝑟 [1
𝐸𝑠𝑡𝑑−
1
𝐸𝑒𝑒] 𝑥 100 (5.12)
𝑀𝐸𝑆 = ℎ𝑝 𝑥 0.13 𝑥 0.746 𝑥 100 [1
𝐸𝑠𝑡𝑑
− 1
𝐸𝑒𝑒
] 𝑥 100
Where:
M. E. S Monthly energy savings
E.S Energy savings
H. P Horsepower
Estd Standard motor efficiency rating %
Eee Energy-efficient motors rating %
Table 5-28 present the amount of energy saved per month when standard motors are replaced with high
efficiency motors. This shows that the greater the H.P the greater the energy savings which can be
achieved.

93 | P a g e
Table 5-28: Energy saving using high efficiency motors (Akbaba, 1999; Bureau of energy efficiency,
2004; Krarti, 2011)
H. P Standard
motors
(%)
High efficiency
motors
(%)
Energy saved
/ month
(kWh)
Cost / kWh
(Ksh)
Cost of energy
saved / month
(Ksh)
1 73 85.5 1.94 4.73 9.19
1.5 75 86.5 2.58 4.73 12.20
2 77 86.5 2.77 4.73 13.09
3 80 89.5 3.86 4.73 18.26
5 82 89.5 4.96 4.73 23.44
7.5 84 91.7 7.27 4.73 34.39
10 85 91.7 8.34 4.73 39.43
15 86 92.4 11.72 4.73 55.42
20 87.5 93 13.11 4.73 62.01
25 88 93.6 16.48 4.73 77.97
30 88.5 93.6 17.91 4.73 84.73
40 89.5 94.1 21.19 4.73 100.22
50 90 94.5 25.66 4.73 121.35
60 90.5 95 30.46 4.73 144.06
75 91 95.4 36.86 4.73 174.37
100 91.5 95.4 43.33 4.73 204.95
Figure 5-23 shows the comparison of using standard motor with high efficiency motors; high efficiency
motor produce greater savings than standard motors.

94 | P a g e
Figure 5-23: Comparison of standard and high efficiency motors
5.12.2 Use of variable speed drives
Variable speed drives (VSD) can be either constant speed drive or adjustable speed drive. Constant drives
are used where there is no need to operate the motors at full speed. Adjustable speed drive operates motors
at levels which matches the particular task thus saving energy. According to Saidur and Mekhilef (2010)
75 % of energy used by plants is consumed by electric motors and 60 % of that energy is consumed by
pumps and fans which do not need constant motor speeds. Replacing conventional motors with adjustable
speed drives can result in 41 % energy savings. According to Saidur and Mekhilef (2010) energy savings
using VSD can be estimated using Equation 5.13
𝐸. 𝑆𝑉𝑆𝐷 = 𝑁 𝑥 𝑃 𝑥 ℎ𝑟 𝑥 𝑆𝑆𝑅 (5-13)
Where:
E. S VSD Energy savings with use of VSD, kWh
N Number of motors
P Motor power kW
Hr. Operating hours (in this case 100 hrs was used, i.e monthly operating hours of
machines)
S SR Percentage energy savings associated with a certain percentage of speed reduction
0
20
40
60
80
100
120
1 1.5 2 3 5 7.5 10 15 20 25 30 40 50 60 75 100 125 150 200
Mo
tor
effi
cien
cies
H.P
Standard motor High efficient motor

95 | P a g e
Table 5-29 shows percentage reduction of speed applied to different rated power for 100 hrs, and Table 5-
30 presents the cost saving of different levels of speed reduction. Adjustable speed motors can save a lot
in both cost and energy. It is evident that a lot of energy can be saved by varying load speeds. Most energy
can be saved at the highest speed reduction of 50 %.
Table 5-29: Energy savings of electric motors by using VSDs
Energy savings (kWh)
H.P
10%
Speed
reduction
20%
Speed
reduction
30%
Speed
reduction
40%
Speed
reduction
50%
Speed
reduction
1 7.46 14.91 22.37 29.83 37.29
1.5 11.19 22.37 33.56 44.74 55.93
2 14.91 29.83 44.74 59.66 74.57
3 22.37 44.74 67.11 89.49 111.86
4 29.83 59.66 89.49 119.31 149.14
7 52.20 104.40 156.60 208.80 261.00
9 67.11 134.23 201.34 268.46 335.57
15 111.86 223.71 335.57 447.43 559.28
20 149.14 298.28 447.43 596.57 745.71
22 164.06 328.11 492.17 656.23 820.28
25 186.43 372.86 559.28 745.71 932.14
40 298.28 596.57 894.85 1193.14 1491.42
90 671.14 1342.28 2013.42 2684.56 3355.70

96 | P a g e
Table 5-30: Cost of saving in (KSh) for different speed reductions
Cost saving (KSH) for different speed reduction
H.P 10%
Speed reduction
20%
Speed
reduction
30%
Speed
reduction
40%
Speed
reduction
50%
Speed
reduction
1 35.27 70.54 105.82 141.09 176.36
1.5 52.91 105.82 158.72 211.63 264.54
2 70.54 141.09 211.63 282.18 352.72
3 105.82 211.63 317.45 423.27 529.08
4 141.09 282.18 423.27 564.35 705.44
7 246.91 493.81 740.72 987.62 1234.53
9 317.45 634.90 952.35 1269.80 1587.25
15 529.08 1058.17 1587.25 2116.33 2645.41
20 705.44 1410.89 2116.33 2821.77 3527.22
22 775.99 1551.98 2327.96 3103.95 3879.94
25 881.80 1763.61 2645.41 3527.22 4409.02
40 1410.89 2821.77 4232.66 5643.55 7054.44
90 3174.50 6348.99 9523.49 12697.99 15872.48
5.12.3 Switching off machines
Many machines should be switched off when not in use, this can be done manually or by use of sensors.
Sensors are set to switch machines or equipment on and off automatically while manually involves
engaging people to switch off. From the questionnaires 82 % of the respondents said that they switch off
the machines when not in use while 13 % said they do not switch off and 5 % said they switch off but not
always. Fifty four percent of respondents think that switching off machines when not in use is the cheapest
and simplest method of saving energy.
5.13 Energy savings by management
5.13.1 Training programmes
Training programmes will increase the awareness of energy amongst people working in the plant. From
the questionnaires administered 68 % of the respondents are aware of energy, but they have not been
trained; only 30 % are trained and the majority of them are at management level. Fifty five percent of
respondents think that training can help to save energy in the company. Training can be conducted through
seminars, meetings and publications.

97 | P a g e
5.13.2 Housekeeping
Housekeeping involves good organization and arrangement of the workplace to avoid congestion. Good
housekeeping can eliminate hazards and get the job done efficiently and safely. Good housekeeping
involves appropriate distribution of light, painting of walls, good maintenance and well-marked gangways.
5.13.3 Cleaning
Cleaning prevents build-up of dirt and allows heat transfer to surfaces by radiation and convection and
allows the flow of air. Cleaning can be done by compressed air, vacuum cleaning, rags and brushes.
5.13.4 Energy audit
Energy audit entails monitoring, surveying and analysing the flow of energy in the plant hence detecting
areas of improvement. An energy audit can be conducted in three phases: preliminary, general and
detailed audit. A good energy can reduce energy consumption, reduce operating cost and avert equipment
failure.

98 | P a g e
CHAPTER 6: CONCLUSIONS AND RECOMMENDATIONS
6.1 Conclusions
This research study investigated energy use in a car assembly plant in Kenya, by estimating the amount
and cost of energy used in various sections and pieces of equipment. The study was able to estimate the
energy used and lost from specific machines, although not all parameters were captured. This study
considered various types of energy in contrast to other studies which concentrate on electrical energy only.
Welding machines and fans are the major consumers of electrical energy while burners and the stand-by
generator are the major consumers of fuel. The major sources of energy used in many machines are
electrical energy, compressed air and fuel. Since the paint shop is the largest consumer of energy further
research on how to cure and dry paint in mass production should be carried out. From this study it has
been identified that using energy audit and detailed measurement is an effective way of collecting the data
required to estimate energy use and loss. To utilize energy effectively in the plant under study the
following factors should be considered:
a) Cleaning of machines and equipment;
b) Continuous training of workers on energy management;
c) Improve production planning;
d) Improve maintenance;
e) Buy energy efficient machines; and
f) Proper records of energy usage.
With the global increase of energy prices and the demand for energy by industries, industries should be
encouraged to save energy and use alternative means of energy. Energy savings do not necessarily need to
start with heavy investments, but through changes of procedure and workers behavior. Energy
management should be treated the same way the company treats production and sales. The company
should have a well-defined energy policy which is motivating to the employees and contributes to the
achievements of organizational goals.
6.2 Recommendations
In this plant most machines and equipment are very old thus making them inefficient. New and advanced
technologies should be considered such as robots to replace the older technologies. Many workers seem
not to understand the importance of saving energy; training should be done continuously on the
importance of saving energy. From the questionnaires it is evident that 68 % of workers are not trained in
energy management. From the interviews it is evident that many workers are paid on piece rate and
therefore they seem not to take care of equipment because they want to produce as many pieces as

99 | P a g e
possible per day to earn more. As a result, simple techniques like switching off machines when not in use
are considered as a waste of time. Better methods of payment should be considered which will motivate
workers. Some recommendations on specific equipment are presented below.
6.2.1 Energy saving opportunities in welding machines
Welding machines are the major consumers of electrical energy in the plant as shown in Figure 5-20. The
machines should be switched off when not in use. They should be kept clean and cool all the time. Dust
should be blown at least once per week with dry compressed air of less than 30 psi (high pressure damages
the windings). Greasy dirt can clog air passages between coils and cause them to overheat and thus can
reduce the efficiency of machines. Overheating makes the insulation between the coils dry and brittle. The
cover of the machines should not be removed without a good reason; machines should be covered at all
times. Air intake and exhaust should not be blocked because by doing so it will interrupt the proper flow
of air through the machine.
The machines should not be abused; the electrodes should never be left grounded to the work because this
condition creates a short circuit and the machines are forced to generate much higher currents than they
were designed for which can result in a burned out machine. The machines should not work above the
rated capacity; operating above capacity causes overheating which can destroy the insulation. The
machines should be handled with extreme care. A welder is a well aligned and balanced machine;
mechanical abuse, rough handling or severe shock may lead to misalignment which can cause bearing
failure, bracket failure, unbalanced air gap and unbalanced armature.
Design for welding components should minimize the amount of filler required, since the electricity
consumed is directly proportional to the amount of filler used. In future the company should consider
installing robots for welding and painting. The use of robots in the car industry for spot welding, painting
and general assembly can result in increased speed of production and less overall costs with reduced
fatigue for operators
6.2.2 Energy saving opportunities for compressed air
A lot of leakages were detected in the plants, According to Saidur et al., (2010) a poorly maintained plant
will likely have a leak rate of about 20 % of total compressed air production capacity. If the leaks in this
plant are reduced the company can save approximately Ksh1,321.1 per month as shown in Equation 5.11.
All leaking valves and connection gauges should be repaired. Leaks can cause pressure in the systems,
causing the pneumatic and air tools to work less efficiently, shorten the life of equipment, and affect
production level. Total elimination of leaks may be impractical, but reducing by 15 % can reduce energy
consumption in the plant. Although the compressor is variable speed drive, they run for 8 hrs per day,

100 | P a g e
whether peak time and off-peak. When there is less production the work load can be combined and be
done in one day and sometimes the compressor can be switched off. The compressor should run
throughout the day if there is a large work load. In addition:
a) Repair should be done promptly.
b) Pressure gauges should be installed at various end points to meet the required reliability of
operation.
c) Switch off the compressor when not in use.
d) Eliminate all unnecessary use of compressed air.
e) The compressor filters should be cleaned regularly.
f) Avoid or eliminate excess distribution pipe-work.
g) Regular maintenance of compressors.
6.2.3 Energy savings opportunities in motors
a) Use of high efficiency motors.
b) Adjustable speed drives (ASD): many motor drive applications require control of motor speed,
startup, and torque (rotational force) to match the power load motor with the drive power. ADS
and VSD offer great opportunities for saving energy in motor systems.
c) Motor sizing and energy management.
d) Cleaning of motors.
6.2.3.1 Energy saving opportunities in fans
Fans consume energy depending on usage. Out of 1,733.7 kWh consumed by electrical systems fans
account for 17 % as shown in Figure 5-20. Fans should be selected to deliver the required capacity; an
increase in operating pressure of a fan reduces its capacity. The frictional resistance which occurs mainly
in the outside air intake, coils, filters and ducts, due to dirt or any other restriction, can reduce the air
quantity. Any reduction in operating pressure may overload the motor causing the fan to handle more than
its rated capacity. Operating any system with filters out, door open or outlets removed may overload the
motor thus reducing efficiency.
Correct excess noise and vibration to ensure smooth and efficient operation, good alignment of fans can
reduce power requirement and prolong the lifetime of belts. Fans should be shut down when not in use.
Many fans in the plant are located in inaccessible places, thus, they have never been cleaned according to
operators. Since this is a dusty place fine dust and particles may have accumulated on the fans clinging to
the blades. Dust increases operating costs by lowering efficiency. The fans should be cleaned and checked
at least once in a year.

101 | P a g e
6.2.3.2 Pumps
Pumps are used to pump water and oil, shutting down the pumps when not required can save on energy
and maintenance costs.
6.2.4 Energy saving opportunities in lighting
Lighting plays a major role in ensuring efficient work in both offices and workshops in the plant. Lighting
accounts for 15 % of energy use, according to Figure 5-20. Although lights are normally switched off
when not in use in many sections, there are some sections which are congested and the lights have to be on
for a longer time. The place should be well arranged. Many lamps are placed very high from the working
areas, thus decreasing the illumination level. They should be installed close to the working bench. In many
sections all the lights operate under one switch even though the whole area does not need to be illuminated
all the time: installation of different switches at different locations can save energy by illuminating only
the required areas. According to Krarti (2012) switches should be installed at feasible and accessible areas
for everyone. Stickers should be put adjacent to switches to remind the occupants to switch off the lights.
In the vehicle assembly plant there are many more installed lamps than required; excess lamps should be
removed to save energy. Since this is a dusty place, most of the tubes are dirty. Accumulation of dirt can
cause glare so the fixtures should be cleaned regularly. Bulbs should be kept clean and free of light
blocking and reduce decorative lighting; instead use bright colors on ceilings, walls, floors and on
furnishings as alternative ways of saving energy because they will increase reflection. Although skylights
have been installed in the plant many of them are clogged with dirt which prevents penetration of light.
They should be cleaned or replaced. Lights should be turned off when not in use, this can be done
manually or by use of sensors Most of the fluorescent tubes installed are of 65 W, but recently 28 W tubes
have been introduced to the market, and the 65 W should be replaced to 28 W which can save a lot of
energy.
6.2.5 Energy saving opportunities in transport
The following are some energy savings opportunities in transport sector.
a) Plan routes well to avoid problems such as traffic jams.
b) Use telephone calls in some cases instead of personal visits.
c) Use diesel vehicles rather than petrol vehicles because they are more economical.
d) Service vehicles regularly.
e) Avoiding unnecessary movement.
f) Whenever possible, move the material in a straight path.

102 | P a g e
6.2.6 Energy saving opportunities in burners and ovens
Proper job organization should be planned such that once the burners are on the ovens are utilized fully. If
two burners are utilized at the same time, they should be switched on at different times. Doors should be
well closed and seals replaced to minimize heat loss. In some cases paint booths require more time to heat
up to a certain temperature, but remain at that temp for sometime before a car enters, this time should be
minimized if possible. When choosing a new oven, factors such as the following should be considered:
production rate, cost of maintenance, coat quality, varied paints or one paint, health, safety and
environmental issues. The oven should always be kept clean and free of debris.
6.2.7 Energy saving opportunities in the stand-by generator
The company should think of alternative sources of energy such as solar energy and steam and consider
getting a smaller generator for use during load shedding. Diesel generators are expensive. Gas generators
should be considered in the future because gas is cheaper, cleaner and less polluting than diesel.

103 | P a g e
REFERENCES
[1] Abdelaziz, E. A., Saidur, R. and Mekhilef, S. A. 2011. Review on energy saving
strategies in industrial sector. Renewable and sustainable energy reviews, 15(1): 150-168.
[2] Aduda, O. A. 2009. Optimisation of HVAC systems for energy efficiency in public
buildings. MSc dissertation, University of Witwatersrand. pp. 22-133.
[3] Akbaba, M., 1999. Energy conservation by using energy efficient electric motors.
Applied energy, 64(1-4): 149-158.
[4] Almato, M., Espun, A. and Puigjaner, L. 1999. Optimisation of water use in batch
process industries. Computers and chemical engineering, 23(10): 1427-1437.
[5] Almeida, A. T., Paula, F. and Poala, B. 2003. Energy-efficient motors systems in the
industrial and in the services sectors in the European union: characterisation potential, barriers
and policies. Energy, 28(7): 673-690.
[6] Apostolos, F., Papacharalampopoulos, A., Pastras, G., Stavpoulos, P. and George, C.
2013. Energy efficiency of manufacturing process: A critical review. Procedia CIRP conference
on manufacturing sytems, 7: 628-633.
[7] Backlund, S., Thollander, P., Palm, J. and Ottosson, M. 2012. Extending the energy
efficiency gap. Energy policy, 51(C): 8-42.
[8] Becker, C. E., Wayne, L. S. 1996. Organizing for energy management. 739-1995 –
Energy management in industrial and commercial facilities. IEEE recommended Practice for
energy management in industrial and commercial Facilities. pp. 21-298.
[9] Beyene, A. 2005. Energy efficiency and industrial classification. Energy engineering,
102(2): 59-80.
[10] Bhaskar, M. 2009. Energy management in automotive, energy management group
[Online].http://india.amsconferences.com/admin/attachments/document/AMS_India_2009_MBh
askar.pdf. [Accessed 15 October 2013].
[11] Birchfield, S. 2001. Issues and challenges in energy benchmarking. Energy engineering,
98(2): 88-52.
[12] Blume, A. P. 2011. Workplace specific set of energy related indicators considering
recent challenges in the automotive and semiconductor industry. Energy engineering, pp. 9-11.

104 | P a g e
[13] Boyd, G., Dutrow, E. and Tunnessen, W. 2008. The evolution of the energy star,energy
perfomance indicator for bencmarking industrial plant,manufacturing energy use. Journal of
cleaner production, 16(6): 709-715.
[14] Bredel, M. 2011. Fan efficiency standards for commercial and industrial building,
energy efficiency classifications for fans [Online]. Available at: http://www.AMCA.org
[Accessed 21 January 2014]
[15] Brown, M. 2000. Overcoming barriers to effective management in industrial settings.
Atlanta: Georgia Tech Energy and Environmental Management Center.
[16] Brush, A., Masanet, E. and Worrell, E. 2011. Energy efficiency improvements and cost
savings for the dairy processing industries: An ENERGY STAR® Guide for Energy and Plant
Managers. Lawrence Berkely National Laboratory, Berkely, CA. pp. 28-91.
[17] Bureau of Energy Efficiency. 2004. Energy efficiency guide in electrical utilities,
electrical energy equipments, electric motors. [Online] Available at:
http://www.energyefficiencyasia.org [Accessed 14 May 2014].
[18] Burton, D. J. 2001. IQA and HVAC workbook. In: P. Kivel, ed. General ventilation of
non-industrial occupancies Salt Lake City, UT: IVE Incorporated, pp. 1-23.
[19] CADDET. 2001. Saving energy with daylighting systems. Centre for the Analysis and
Dissemination of Demonstrated Energy Technologies. Maxi Brochure 14.
[20] Capehart, L., Turner, C. and Kennedy, J. 2003. Guide to energy management. 4th ed.
Lilburn, Ga: Fairmount Press.
[21] Chai, K. and Catrina, Y. 2012. Overcoming energy efficiency barriers through systems
approach A conceptual framework. Energy policy, 46: 460-472.
[22] Claudia, A. G., Junwen, W. J. L., Jorge, A., Biller, S., Ningjian, H., and Guoxian, X.
2011. Production system design to achieve energy in an automotive paint shop. International
journal of production, 49(22): 6769-6785.
[23] Cohen, L. Manion, L. and Morrison, K. 2011. Research methods in education. 7th
ed.
New York: Routledge.
[24] Country Profile. 2007. Library of Congress – Federal division. [Online] Available at
http://www.wikipedia.org/ economy of kenya [Accessed 10 October 2014].

105 | P a g e
[25] Davies, B. M. 2007. Doing a successful research project, using qualitative or
quantitative methods. New York: Palgrave Macmillian.
[26] Demirel, Y. 2012. Energy, green energy and technology. Energy production,
conversion, storage, conservation and coupling. London: Springer-Verlag, pp. 27-45.
[27] Department of Energy, 2003. Fans and pumps. Energy management manual. 13 ed.
Canada: pp. 5-63.
[28] Douglas, L. N. and Laura, L. 2001. Corporate energy management, A survey of large
manufacturing companies. Energy engineering, 98(2): 53-72.
[29] Fleiter, T., Worrell, E. and Elchhamer, W. 2011. Barriers to energy efficiency in
industrial bottom-up energy demands model, A review. Renewable and sustainable energy
reviews, 15: 3099-3111.
[30] Fluke Corporation. 2009. Top five places to look for energy losses in commercial
buildings. [Online] Available at: http://www.fluke.com\library [Accessed 10 September 2013].
[31] Fysikopoulos, Α., Anagnostakisa D., Salonitisa, K.., Chryssolourisa, G. 2012. An
empirical study of the energy consumption in automotive assembly. Assembly Procedia, CIRP
(3): 477-482.
[32] Galitisky, C. and Worrell, E. 2003. Energy efficiency improvement and cost savings
opportunities for vehicle assembly industry, An ENERGY STAR® Guide for Energy and Plant
Managers. Lawrence Berkely National Laboratory, Berkely, CA., pp. 2-47.
[33] Galitsky, C. and Worrell, E., 2008. Energy efficiency improvement and cost saving
opportunities for the vehicle assembly industry. An ENERGY STAR® Guide for Energy and
Plant Managers. Lawrence Berkely National Laboratory, Berkely, CA., pp. 9-87.
[34] Gilbride, T. and Hollomon, B. 2003. High-Efficiency rooftop air conditioners: Small
commercial ACs could add up to big energy saving. Energy Engineering, 100(3): 53-65.
[35] Gordic, D., Babic, M., Jovick, N., Sustersic, V., Koncalovic, D. and Telic, D. 2010.
Development of energy management system, case study of Serbian car manufacturer. Energy
conversion, 51(22): 2783-2790.
[36] Grobler, L. J. and Dalgleish, A. 2004. Energy and cost savings opportunities in glass
manufacturing facility. Energy engineering, 101(6): 12-31.

106 | P a g e
[37] Gupta, J. 2011. Electrical energy audit of induction motors in a textile Plant. Electrical
and electronics, pp. 32-42.
[38] Haelsig, A. and Mayr, P. 2011. Energy balances study of gas-shield arc welding process.
International institute of welding, pp. 1-8.
[39] Hasanbeigi, A., and Price L. 2010. Industrial energy audit guidebook: Guidelines for
conducting an energy audit in industrial facilities Environmental Energy Technologies Division,
Ernest Orlando Lawrence Berkeley National Laboratory, pp.12-70.
[40] IEA. 2007. Tracking industrial energy efficiency and carbon dioxide emissions.
International Energy Agency [Online] Available at: http://ww.iea.org [Accessed 18 June 2013].
[41] IEA. 2012. Energy balances of Non- OECD countries. International Energy Agency
[Online]. Available at: http://ww.iea.org [Accessed 18 June 2013].
[42] Keyes, C. 2007. Handbook of electric motors. Motors energy efficiency. CEA:
Technologist CEATI, pp. 7- 125.
[43] Kini, P. G. and Bansal, C. R. 2011. Energy management systems. In: G. Kiini, ed.
Energy efficiency in industrial utilities. Europe, China: In Tech, pp. 1-13.
[44] Kiplagat, J. K., Wang, R.. Z. and Li, T. X. 2011. Renewable energy in Kenya: resources
potential and status of exploitation. Renewable and sustainable energy reviews, 15: 2960-2973.
[45] KNBS. 2012. Kenya fact and figures. Kenya National Bureau of Statistics. [Online]
Available at: http://www.knbs.co ke [Accessed 12 March 2013].
[46] KNBS. 2013. Kenya fact and figures. Kenya National Bureau of Statistics. [Online]
Available at: http://www.knbs.co ke [Accessed 12 March 2013].
[47] KPLC. 2012. Energy efficiency programmes. [Online] Available at:
http:www.kplc.co.ke [Accessed 5 August 2014].
[48] Kramer, K., Masanet, E. and Worrell, E. 2010. Energy efficiency opportunities in the
U.S pulp and paper industry. Energy engineering, 107(1): 21-50.
[49] Krarti, M. 2011. Energy audit for building systems. 2nd
ed. Boca Raton FL: CRC Press.
[50] Kumar, R. 2009. Boilers for power and process. Boca Raton FL: CRC Press.

107 | P a g e
[51] Lovins, A. 2004. Energy efficiency taxonomic overview. San Diego and Oxford (UK).
Encyclopedia of energy, 6(2): 383-401.
[52] Lombard-Perez, L., Jose, O. and Christine, P. 2008 A review on buildings energy
consumption information. Energy and buildings, 40: 394-398.
[53] McNeill, L. P. and Chapman, S. 2005. Research methods. 3rd
ed. London: Taylor and
Francis
[54] McNicol, I. 2010. Equipment energy efficiency, Improving the energy efficiency of
industrial equipments. [Online] Available at: http://www.energyrating.gov.au [Accessed 20
September 2013].
[55] Morvaj, Z. and Bukarica, V. 2010. Energy efficiency policy. In: J. Palm, ed. Energy
efficiency. Croatia: Sciyo, pp. 9-188.
[56] Muller, D. L., Marechal, F., Wolewinski, T. and Roux, P. J. 2007. An energy
management method for the food industry. Applied thermal engineering, 27: 2677-2686.
[57] Murray, G. P. 1996. What is energy efficiency? Concepts, indicators and
methodological issues. Energy policy, 24(5): 377-390.
[58] Musa, S. and Ellams, A. G. 2011. Loss minimisation in transmission and distribution
networks. JORIND, 9(2): 1596-8308.
[59] NAM, 2005. Efficiency and innovation in U.S manufacturing energy use. National
Association of Manufacturers. Washington DC U.S.A.
[60] Neeraj, P., Ratnadeep, P. and Anand, S. 2014. Optimization of automobile assembly
process to reduce assembly time. Computer-aided design and application, 11(1): 554-560.
[61] NEP. 2004. Sessional paper on energy. National Energy Policy. Nairobi: Nyayo House.
[62] Nicole, C., Davis, C., Grasman, S. and West, C. 1995. Paint spray booth cleaning
practices in the automotive industry, American Automobile Manufactures Association: National
Pollution Prevention Center.
[63] Onuonga, S. M., Etyang, M. and Mwabu, G. 2011. The demand for energy in the
Kenyan manufacturing sector. Journal of energy and development, 34(2): 1-13.

108 | P a g e
[64] Oyedepo, S. O. and Oladele, A. T. 2013. Energy audit of manufacturing and processing
industries in Nigeria: A case study of food processing industry and distillation and bottling
company. American journal of energy research, 1(3): 36-44.
[65] Rabah, K. V. O. 2005. Integrated solar energy systems for rural electrification in Kenya.
Renewable energy, Issue 30, pp. 23-42.
[66] Rodriguez, R. 2011. Report on detected energy inefficient and energy intensive
equipment. CAMT GROUP.
[67] Roth, W., Llana, D., Louis, Q. and Michael, Y. 2006. Advanced control for commercial
buildings: barriers and energy savings potential. Energy engineering, 103(6), pp. 6-36.
[68] Saidur, R., 2010. A review on electrical motors energy use and energy savings.
Renewable and sustainable energy reviews, 14: 877-898.
[69] Saidur, R., Rahim, N. and Hasanuzzaman, M. 2010. A review on compressed-air energy
use and energy savings. Renewable and sustainable energy reviews, 14: 1135-1153.
[70] Saidur, S. and Mekhilef, M. 2010. Energy use, energy savings and emission analysis in
the Malaysian rubber producing industries. Applied energy, 87: 2746-2758.
[71] Sardianou, E. 2008. Barriers to industrial energy efficiency investments in Greece.
Journal of cleaner production, 16: 1416-1423.
[72] Schleich, J. and Gruber, E. 2008. Beyond case studies, Barries to energy efficiency in
commerce and the service sector. Energy economics, 30(22): 449-464.
[73] Shanghai, H. and Mckane, A. 2008. Improving energy efficiency of compressed air
systems based on system audit. Lawrence Berkeley National Laboratory, pp. 9-10.
[74] Smith, H. E. ed. 2000. Mechanical Engineers Reference book. In: Maitenance of
electrical equipments. Bath: Great Britain.
[75] Sorrell, S. 2000. Barriers to energy efficiency in the UK higher education sector. DG
Research under the JOULE project 'Barriers to energy efficiency in public and private
organisations', SPRU..
[76] Sorrell, S., Mallett, A. and Nye, S. 2011. Barriers to industrial energy efficiency, A
literature review, Vienna: UNIDO

109 | P a g e
[77] Tadhg, C. Noel, D. Sebastian, F. Johannes, F. Jos, H. Hannes, K. Christina, K. 2010.
Energy efficiency in industries, student handbook. 1st ed. Europe: IUSES.
[78] Thollander, P., Jenny, P. and Patrick, R. 2010. Categorizing barriers to energy
efficiency, An interdisciplinary perspective. In: J. Palm, ed. Energy efficiency. India:, pp. 49-60.
[79] Thollander, P. and Palm, J., 2013. Improving energy efficiency in industrial energy
systems. In: An interdisciplinary perspective on barriers, energy audits,energy
management,policies and programmes. London: pp. 35-56.
[80] Thumann, A. and Younger, J. 2007. Handbook of energy audit. 7th
ed. Indian Trail:
Fairmount Press , Inc.
[81] Trianni, A. and Cagno, E. 2012. Dealing with barriers to energy efficiency and SMEs,
some empirical evidences. Energy, Issue 37: 494-504.
[82] US Department of Energy 2004. Energy Efficiency and Renewable Energy, Industrial
Technologies Program. Energy Tips – Compressed Air Tip Sheet 3. [Online] Available at:
www.eere.energy.gov/industry/bestpractices.
[83] U.S Department of Energy. 2003. Improving compressed air systems. 31-51 [Online]
Available at: www.eere.energy.gov/industry_air Washinton D.C: Lawrence berkely national
laboratory.
[84] U.S Department of energy, 2008. Technology roadmap for energy reduction in
automotive manufacturing, U.S: Michigan U.S. Congress, Office of Technology Assessment,
Industrial Energy Efficiency.
[85] U.S. Congress. 1993. Industrial energy efficiency, OTA-E-560. Office of technology
assessment. Washington, DC: U.S. Government Printing Office.
[86] Vanderstoep, S. and Johnston, D. 2009. Research methods for every day life, blending
qualitative and quantitative approaches. San Francisco: Jossey-Bass.
[87] Waide, P. and Brunner, C. U. 2011. Energy efficiency policy opportunities for electric
motor driven system. Energy efficiency series, 1: 46-70.
[88] Wang, F. and Chen, G. 2012. Energy management handbook [Online]. Available at:
http://www.bsr.org [Accessed 23 July 2014].

110 | P a g e
[89] Worrell, E. and Prince, L, 2001. Barriers and opportunities, A review of selected
successful energy efficiency. Lawrence Berkeley National Laborotary, pp. 3-11.
[90] Worrell, E., Angelni, T. and Masanet, E. 2010. Managing your energy, An energy star
guide for identifying energy savings in manufacturing plants. Lawrence Berkeley National
Laborotary, pp. 9-48.
[91] Yuko, D. 2004. A study into the status and potential of power generation from biomass
waste in Kenya. Energy and development, pp. 20-30.

111 | P a g e
APPENDIXES
Appendix 1: General information
Name of the company and address N/A
Type of organization
Main products Assembly of vehicles
Production capacity per month:
Tonnes/pieces
260 pieces
Capacity utilization per month N/A
National or multinational National
Company operating hours 8 Hours

112 | P a g e
Appendix 2: Operations and management
1. Does the organization have energy manager? _______________No____________________
2. Does the organization have energy efficiency policy? ________No____________________
2 a. If yes does the organization review these policies on an annual basis and establish reduction
targets? _______________________________________N/A______________________________
3. What energy efficiency efforts have been completed, started, or plan?
____None____________________________________________________________________

113 | P a g e
Appendix 3: Summary of electricity energy and cost
Tariff description ______________________________11 KV, B2 tariff__________________________
Months
for year
(2013)
Days in
billing
period
Electricity
usage (KVA)
Electricity
consumption
(kW)
Peak
time
(kWh)
Off-
peak
(kWh)
Load
factors
Cost /
Month
Ksh
Jan 24 292 284 18422 8670 0.97 611,250.30
Feb 24 373 362 46966 8710 0.97 1,018,682.70
Mar 23 353 333 29470 7832 0.94 831,029.50
April 23 374 355 28070 8598 0.95 820,820.00
May 24 346 320 27430 8572 0.92 742,592.50
June 23 332 319 29306 8324 0.96 746,813.90
July 24 366 350 32974 8092 0.96 772,782.20
Aug 23 295 286 23538 8480 0.97 675,836.50
Sep 24 202 195 21604 8432 0.97 642,092
Oct 24 209 203 21272 8602 0.97 636,830.20
Nov 24 235 231 25724 13152 0.98 868,320
Totals 260 3377 3238 304776 97464 - 8,367,049.8

114 | P a g e
Appendix 4: Other sources of fuel
Appendix 4a: Amount of industrial oil used in Burners
Months of
2013
Amount
(L)
Cost
Ksh
Feb 7,000 697,586.40
March 10,000 996,552
April 3,000 295,269.50
April 5,000 492,116
May 2,000 195,009.60
May 8,000 780,038.40
July 10,000 969,112
Aug 10,000 939,544
Oct 10,929 996,960.87
Dec 3,000 330,112.80
Apendix 4b: Amount of gas consumed in welding machines
Type of gas No of
cylinders
Amount in 1
cylinder
(m3)
Amount in
1 cylinder
(Kg)
Cost /
cylinder
(Ksh)
Cost / gas
(Ksh)
Heavy shield argon 167 8.5 - 2,594.80 433,331.60
Dissolved acetylene 9 6.3 - 5,034.00 45,306.00
Industrial oxygen 14 - 11.5 1,137.90 15,930.60
Pure Argo shield 82 - 14.5 9,068 743,579
Totals 272 - - - 1,238,147.2

115 | P a g e
Appendix 4b: Amount of diesel consumed in stand – by- generator
Months of 2013 Operation hours per
month
Litres consumed /
month
Total cost of diesel used/
month
(Ksh)
Jan 4.59 302.94 32,414.58
Feb 1.9 125.4 13,417.80
March 0.19 12.54 1,341.78
April 4.50 297.0 31,779.00
May 4.32 285.12 30,507.84
June 7.36 485.76 51,976.32
July 7.21 475.86 50,917.02
Aug 6.25 412.5 44,137.50
Sep 0 - -
Oct 0 - -
Nov 1.2 79.2 8,474.40
Total 37.52 2,476.32 264,966.24

116 | P a g e
Appendix 5: Motor parameters
Motor application____ Driving mechanism___________________________
Type of equipment use by motor drives_____Sand blasting_____
Motor type (Design A, B ,C, D _____________
AC, DC,___________ABB_____________________
Motor Purchase Date / Age ____1967______________
Rewound Yes _ No
Motor Nameplate Data
1) Manufacturer ____________N/A_______________
2) Motor ID Number ___________N/A_____________
3) Model _________________________________
4) Serial Number __________N/A_________________
5) Design Type ________3 phase induction motor___
6) Size (hp) ___40____________________________
7) Full-load speed (RPM) ________1470____________
8) Voltage rating _______380____________________
9) Full-load amperage _________58______________
10) Full-load power factor (%) ______0.97___________
11) Full-load efficiency (%) ________80%___________
12) kVA Code ____________30kw_________________
Motor operating profile for compressor
Days /year days /year /Month Weekdays /Weekend/Holiday
Hours 1st Shift ___8hrs_____ ____N/A____
Per 2nd Shift __N/A______ __N/A______
Day 3rd Shift ____N/A____ ___N/A_____
N.B Motors work under one shift
Measured Data
Supply voltage
By Voltmeter
Line to line
Voltage ab ___ 415_____
Voltage bc __ 415_____ Voltage average __415____
Voltage ca ____415____
Input Amps
By Ampmeter
Aa ______ 40____ Ab _____ 58_____ Ampere average ____54__
Ac ____ 64______
Power Factor (PF) ___0.9______________________
Input Power (kW) ______90hp____________________

117 | P a g e
By Tachometer
Driven Equipment Operating Speed _3260_________
Annual Operating Time _8hrs per day _____ hours/year

118 | P a g e
Appendix 6: Lighting questionnaires for body –in –white section
s/No. Description Yes No NOs Type Wattage
1. Whether meters are installed to measure
lighting consumption
N/A
2. Type and wattage of lamps mainly used Florescent 65
3. Wattage and number of bulbs 1 60
4. Type of lighting fixtures used Double
5. Type of ballasts (copper or electronic)
used
6. Total lighting load (kw)/month 4875
7. Wattage and number of fluorescent tube
light
79 65
8. Wattage and number of CFLs - -
9. Type of control (occupancy
sensor, dimming
None
10. Operating hours per day 4
11. If there are several light switches, can
they be labelled to make it more obvious
which switches relate to which
appliances?
- -
12. Can lights be switched off to make use of
daylight? (e.g. lights parallel to windows
or in corridors
13. Are any external lights on during daylight
hours?
14. Do any light fittings need cleaning?
15. Do windows and skylights need cleaning
to allow in more natural light?
16. Is lighting only used when
needed?
17. Is lighting on after hours and
weekend used only when
needed?
18. Total number of lamps in place? 80
19. Location of the lighting fixtures 9m
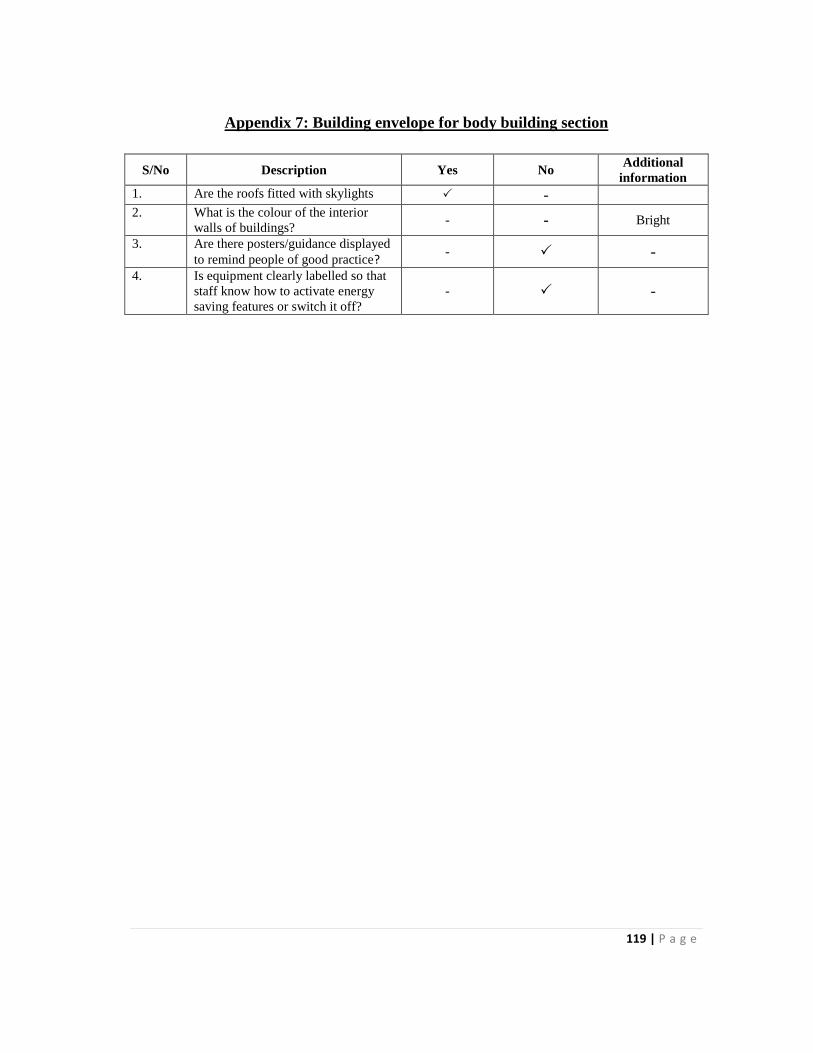
119 | P a g e
Appendix 7: Building envelope for body building section
S/No Description Yes No Additional
information
1. Are the roofs fitted with skylights - 2. What is the colour of the interior
walls of buildings? - - Bright
3. Are there posters/guidance displayed
to remind people of good practice? - -
4. Is equipment clearly labelled so that
staff know how to activate energy
saving features or switch it off?
- -

120 | P a g e
Appendix 8: Equipment list
Appendix 8a: Major energy consuming equipment in the motor vehicle assembly plant
S/no Equipment
1. Burners
2. Welding machines
3. Stand-by-generator
4. Compressor
5.
Appendix 8b: Descriptions of all machines equipment and other system in the plang

121 | P a g e
Appendix 9: Energy efficiency questionnaires
Introduction
The purpose of this questionnaire is to determine the energy efficiency of the organization. Please help me
to complete this form as accurate as possible where a question does not apply or cannot be answered,
please respond with not applicable or unknown. You will not be individually identified and your responses
will be used for statistical and educational purpose only. It will only take less than 10 min.
Your time taken to fill the questionnaire will be highly appreciated
Name :Optional
s/no Equipment
type
Model
or
size
Appx
Total
number
Wattage
KW per
m/C
Hours
of use
per
day
Total
Kwh
per
day
How is the
system
controlled
Any other
additional
informati
on
1. Arc
welding
m/c
Boc,
miller
Ador
44 2,02 5 Manually
2. Spot
welding
m/c
- 40 5 Manually
3. Sand
blasting
m/c
- 1 30 3 Manually
4. Disk cutter Catco
UK 5 2-3hP 5
5. Drilling
machines - 1 22 5
Manually
6. Rivettin
M/C
Hi-
Tachi 2 3.7kw/40hp 7
Manually
7. Sheet cutter 1 25hp 5 manual
8. Band saw
clack - 2 1hp 5
Manual
9. Grinders - 4 1-2hp 5 Manual
10 Fans - 29 3-15hp 8 Manual
11 pumps - 10 1-3hp 6 Manual
12. Hoist and
cranes - 18 20hp 4
Manual
13 Compressor Atlas
copco 1 90hp 8
Manual /
automatic
14. Stand by
generator _ 1 26V
Avg
3hrs
per
day
Automatic

122 | P a g e
Email Address
Cell phones
Position /designation in company
Permanent /Contract
1) Employee’s questionnaires on energy savings (please tick one)
s/ no. Descriptions Yes No
1 Are you aware of energy efficiency/management?
2 Do you think you waste energy in your company?
3 Do you practice any energy saving techniques at work?
4 Have you ever attended energy trainings?
5 Would you like to attend energy training programmes?
6 At the moment, do you think management are fully
committed to energy management and energy awareness in
your company?
7 At the moment do you think the general staff are fully
committed to energy management and awareness in your
company?
8 Would you be interested in participating as part of the energy
awareness team?
2). Which machines/equipment’s/sections do you think consumes a lot of power in youy company?
__Paint shop and bus body building________________________________________
3). What do you think can be done to that sections/equipment/machines to save energy? Please specify
______Raise awareness among operatprs to switch off machines when not in use.Keep doors
closedin paintshop especially ovens_____________________________________________
4). Do you switch off your machines/ equipment’s/lights computer when not in use? e.g break time, lunch
time please tick one
Yes No
4a). If NO in 4 above give reasons __________________________________________________
5). Whom do you think is responsible for energy management in your company? Please tick one and give
reasons
a) Managers
b) Supervisors
c) Staffs
____They hold the mot responsibility as they are the ones who directly handle tools and
equipments_____________________________________________________________________

123 | P a g e
6). What do you think are the sources of energy loss in your company?
_____________________________________________________________________________
7). In your opinion, what do you think can be done to save energy in your company? Please specify
______raise awareness on conservation___________________________________________
8). Do you have any energy data? please tick one Yes No
8a). If yes above, can you provide or share? Please tick one Yes No
9). Please add any other information or opinion you would like to share about energy efficiency
_________________________________________________________________________________
_________________________________________________________________________________
_________________________________________________________________________________
_______________________________________________________________________________
Thank you for your time taken to complete the questionnaires.

124 | P a g e
Introduction
The purpose of this questionnaire is to determine the energy efficiency of the organization. Please help me
to complete this form as accurate as possible where a question does not apply or cannot be answered,
please respond with not applicable or unknown. You will not be individually identified and your responses
will be used for statistical and educational purpose only. It will only take less than 10 min.
Your time taken to fill the questionnaire will be highly appreciated
Name :Optional
Email Address
Cell phones
Position /designation in company
Permanent /Contract
1). Employee’s questionnaires on energy savings (please tick one)
s/ no. Descriptions Yes No
1 Are you aware of energy efficiency/management?
2 Do you think you waste energy in your company?
3 Do you practice any energy saving techniques at work?
4 Have you ever attended energy trainings?
5 Would you like to attend energy training programmes?
6 At the moment, do you think management are fully
committed to energy management and energy awareness in
your company?
7 At the moment do you think the general staff are fully
committed to energy management and awareness in your
company?
8 Would you be interested in participating as part of the energy
awareness team?
2). Which machines/equipment’s/sections do you think consumes a lot of power in youy company?
__Paint plant,all electrical motors , bus body building, all welding machines______________
3).What do you think can be done to that sections/equipment/machines to save energy? Please specify
__In paint plant electric motor to switch on only when in need, in bus body building all welding
machines to be switched off when they are not needed_______________________________

125 | P a g e
4). Do you switch off your machines/ equipment’s/lights computer when not in use? e.g break time, lunch
time please tick one
Yes No
4a). If NO in 4 above give reasons
____________________________N/A_____________________________________
5). Whom do you think is responsible for energy management in your company? Please tick one and give
reasons
d) Managers
e) Supervisors
f) Staffs
Because managers is the person who is in a position to evaluate howmuch energy is produced nd
how much is used and how much is wasted and be able to take actions where necessary.
All company employess should be eganed in energy because they are more involved utilization
6). What do you think are the sources of energy loss in your company?
_____________________________________________________________________________________
_____________________________________________
7). In your opinion, what do you think can be done to save energy in your company? Please specify
Let there be one person in each section who will be responsible for energy utilization and who
will be reporting to energy manager_________________________________________
8). Do you have any energy data? please tick one Yes No
8b).If yes above, can you provide or share? Please tick one Yes No
9).Please add any other information or opinion you would like to share about energy efficiency
Energy can only be efficiency and effective if thre are records showing how much was generared and
how much was used and steps taken to prevent its wastage____________________________
Thank you for your time taken to complete the questionnaires.