Embed Size (px)
Citation preview
Energy Efficiency Resource Standards for IOUs, Municipal, and Cooperative Utilities:
Can One Size Fit All?
ACEEE 5th National Conference on Energy Efficiency as a Resource
Laura Agapay, Randy GunnSeptember 28, 2009
2
Agenda
• Introduction• Benchmarking Results of DSM
Programs for – IOUs and Agencies– Municipal and Cooperative Utilities– Overall, Best Practice, and by State
• Conclusions & Recommendations
3
Energy Efficiency Resource Standard (EERS)
• Energy savings targets for utilities, achieved by end-user energy efficiency improvements
• Typically implemented at the state level• May include market-based trading
system• Analogous to a Renewable Portfolio
StandardNadel, Steve. ACEEE. (March 2006). Energy Efficiency Resource Standards: Experience and Recommendations
4
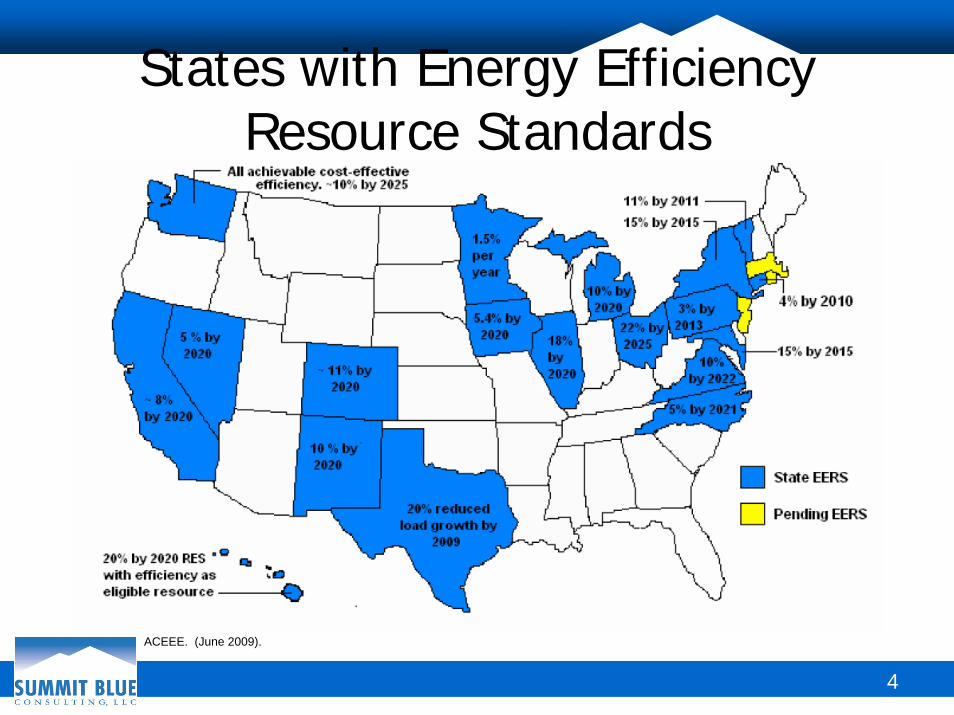
States with Energy Efficiency Resource Standards
ACEEE. (June 2009).

5
EERS for Munis & Coops v. EERS for IOUs
• Fewer than 20 PUCs have jurisdiction over Munis & Coops.
• Munis & Coops are subject to state EE goals in ~13 states.
• EERS for IOUs generally include specific savings mandates and sometimes include failure penalties.
• Mandates for Munis & Coops are generally looser than those governing IOUs, often requiring only self-established savings goals with no failure penalties.
Zimmerman, Emily. ASE. (September 2009). Via personal correspondence.American Public Power Association. (January 2009). Energy Efficiency Provisions.
6
What are current DSM programs actually achieving?
• What are typical savings?• What are best practice savings?• For IOUs?• For municipal and cooperative
utilities?
7
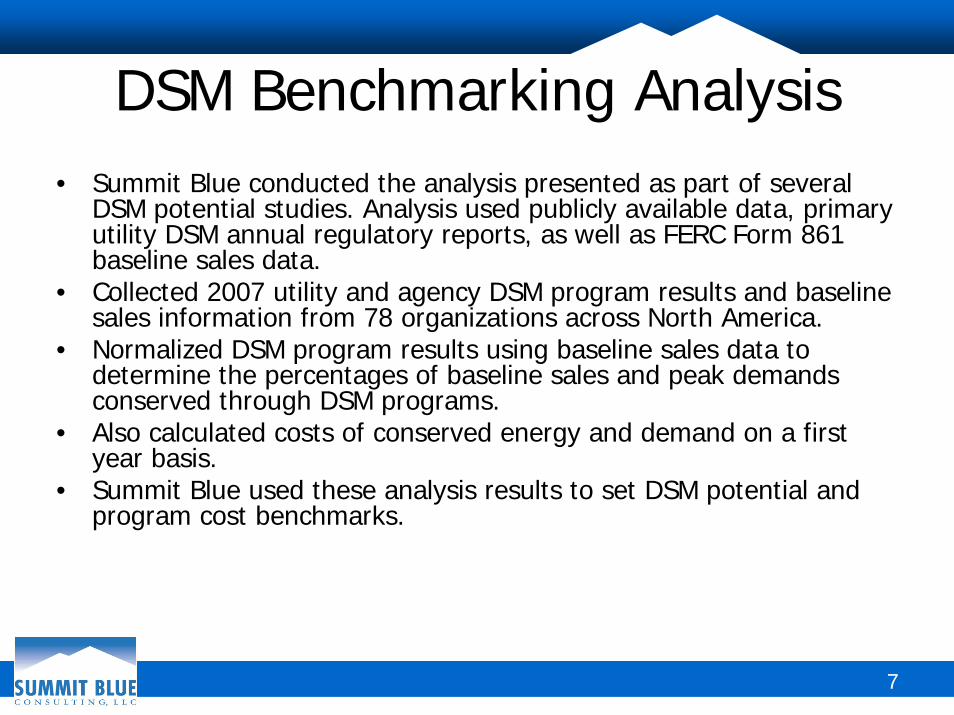
DSM Benchmarking Analysis• Summit Blue conducted the analysis presented as part of several
DSM potential studies. Analysis used publicly available data, primary utility DSM annual regulatory reports, as well as FERC Form 861 baseline sales data.
• Collected 2007 utility and agency DSM program results and baseline sales information from 78 organizations across North America.
• Normalized DSM program results using baseline sales data to determine the percentages of baseline sales and peak demands conserved through DSM programs.
• Also calculated costs of conserved energy and demand on a first year basis.
• Summit Blue used these analysis results to set DSM potential andprogram cost benchmarks.
8
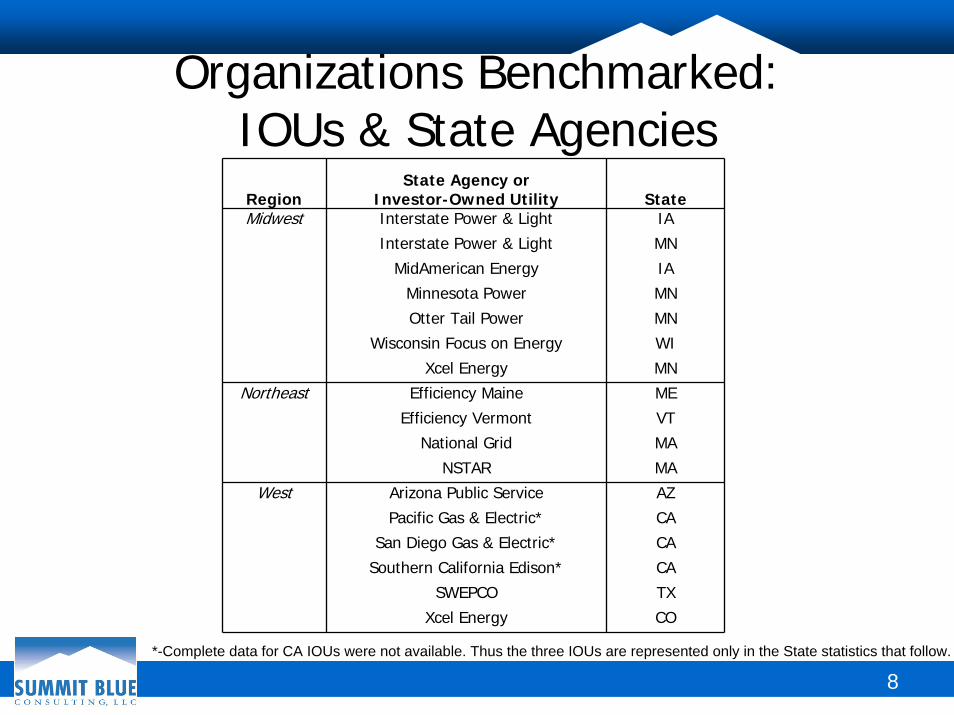
Organizations Benchmarked: IOUs & State AgenciesRegion
State Agency or Investor-Owned Utility State
Midwest Interstate Power & Light IA
Interstate Power & Light MN
MidAmerican Energy IA
Minnesota Power MN
Otter Tail Power MN
Wisconsin Focus on Energy WI
Xcel Energy MN
Northeast Efficiency Maine ME
Efficiency Vermont VT
National Grid MA
NSTAR MA
West Arizona Public Service AZ
Pacific Gas & Electric* CA
San Diego Gas & Electric* CA
Southern California Edison* CA
SWEPCO TX
Xcel Energy CO
*-Complete data for CA IOUs were not available. Thus the three IOUs are represented only in the State statistics that follow.
9
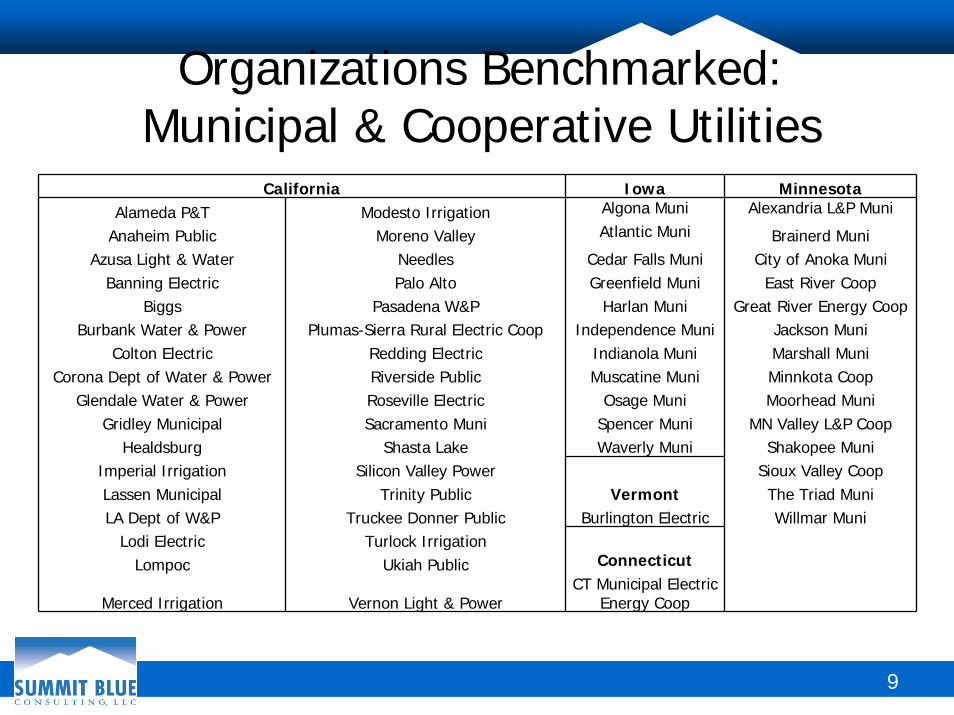
Organizations Benchmarked: Municipal & Cooperative Utilities
California Iowa MinnesotaAlameda P&T Modesto Irrigation Algona Muni Alexandria L&P Muni
Anaheim Public Moreno Valley Atlantic Muni Brainerd Muni Azusa Light & Water Needles Cedar Falls Muni City of Anoka Muni
Banning Electric Palo Alto Greenfield Muni East River CoopBiggs Pasadena W&P Harlan Muni Great River Energy Coop
Burbank Water & Power Plumas-Sierra Rural Electric Coop Independence Muni Jackson MuniColton Electric Redding Electric Indianola Muni Marshall Muni
Corona Dept of Water & Power Riverside Public Muscatine Muni Minnkota Coop Glendale Water & Power Roseville Electric Osage Muni Moorhead Muni
Gridley Municipal Sacramento Muni Spencer Muni MN Valley L&P CoopHealdsburg Shasta Lake Waverly Muni Shakopee Muni
Imperial Irrigation Silicon Valley Power Sioux Valley CoopLassen Municipal Trinity Public Vermont The Triad MuniLA Dept of W&P Truckee Donner Public Burlington Electric Willmar Muni
Lodi Electric Turlock IrrigationLompoc Ukiah Public Connecticut
Merced Irrigation Vernon Light & Power CT Municipal Electric
Energy Coop

10
DSM Benchmarking Context• DSM requirements and regulatory treatment have
significant influences on overall program results.
• In 2007 in Minnesota, electric utilities were required to spend 1.5%-2% of their revenues on EE/DR. Program cost recovery was guaranteed, and performance-based EE/DR financial incentives could be up to 30% of program costs.
• Given the variation in organizations’ portfolio composition and evaluation and reporting practices, results cannot be considered a strictly “apples-and-apples” comparison.
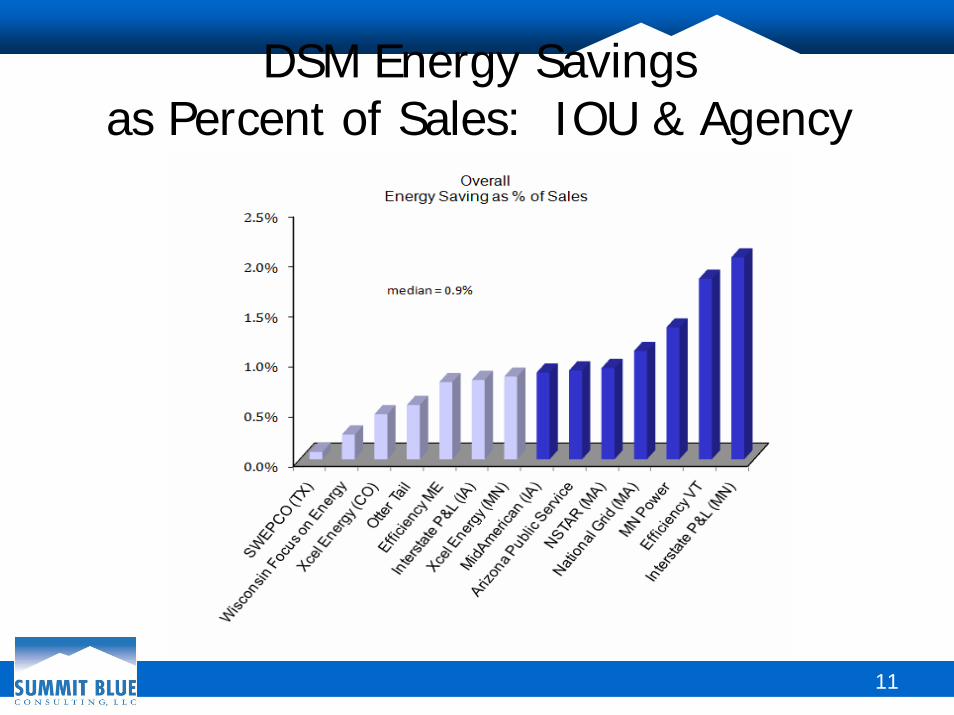
11
DSM Energy Savings as Percent of Sales: IOU & Agency

12
Costs of Conserved Energy$/kWh First Year: IOU & Agency
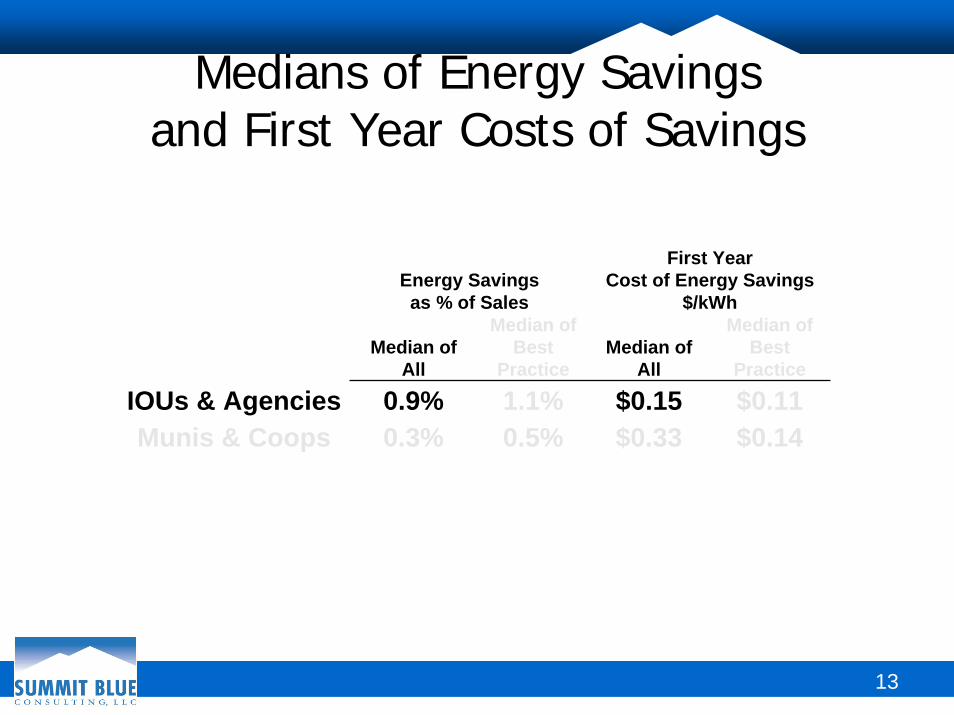
Medians of Energy Savings and First Year Costs of Savings
13
Energy Savings as % of Sales
First Year Cost of Energy Savings
$/kWh
Median of All
Median of Best
PracticeMedian of
All
Median of Best
Practice
IOUs & Agencies 0.9% 1.1% $0.15 $0.11Munis & Coops 0.3% 0.5% $0.33 $0.14
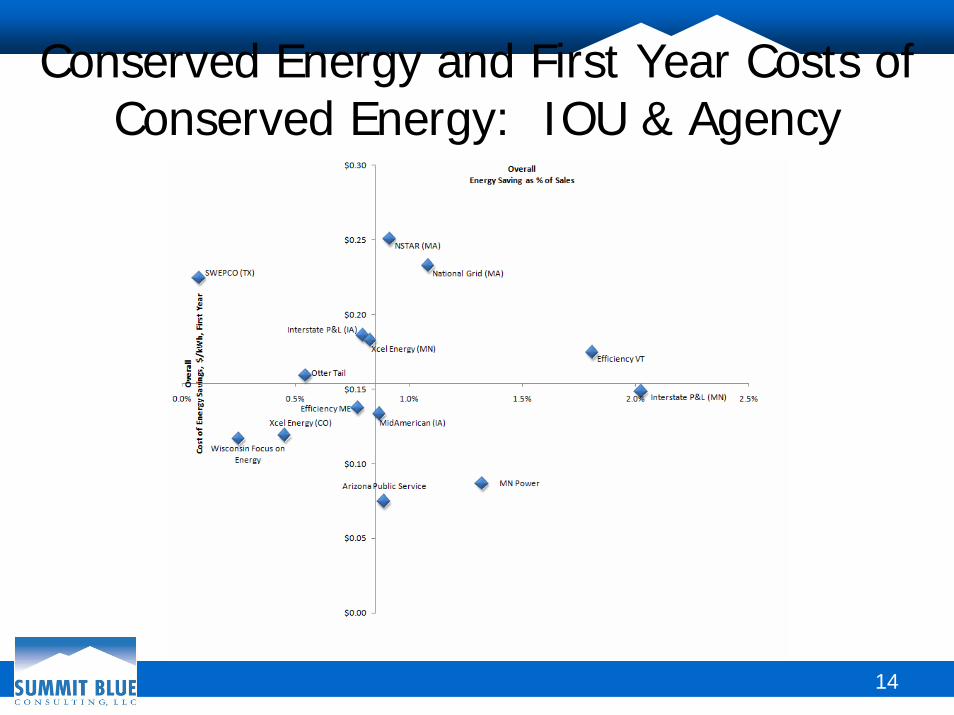
Conserved Energy and First Year Costs of Conserved Energy: IOU & Agency
14
15
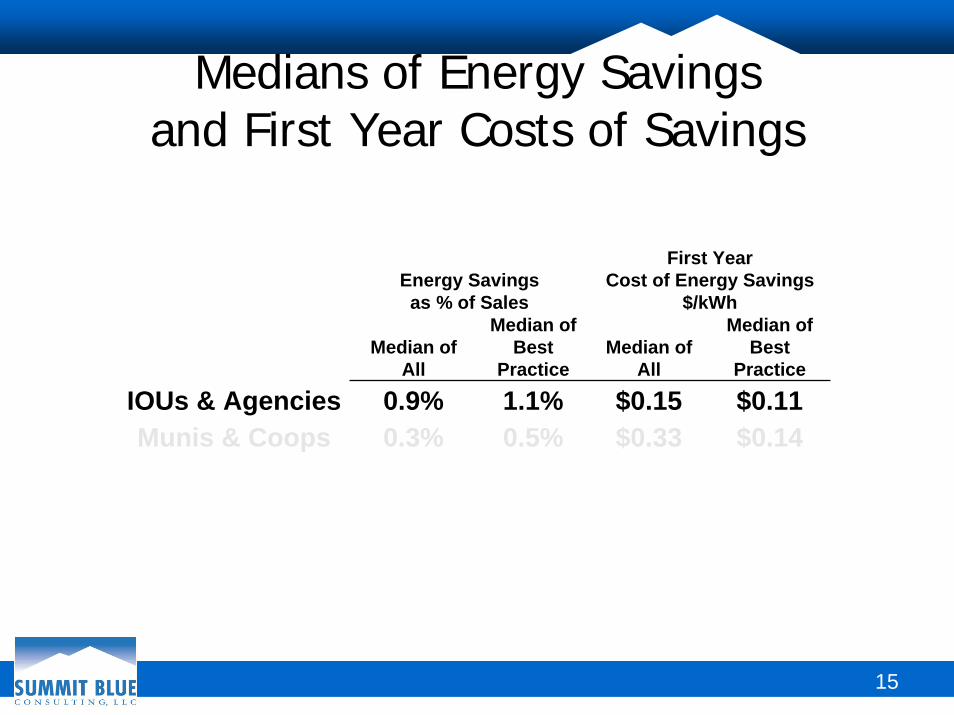
Medians of Energy Savings and First Year Costs of Savings
Energy Savings as % of Sales
First Year Cost of Energy Savings
$/kWh
Median of All
Median of Best
PracticeMedian of
All
Median of Best
Practice
IOUs & Agencies 0.9% 1.1% $0.15 $0.11Munis & Coops 0.3% 0.5% $0.33 $0.14
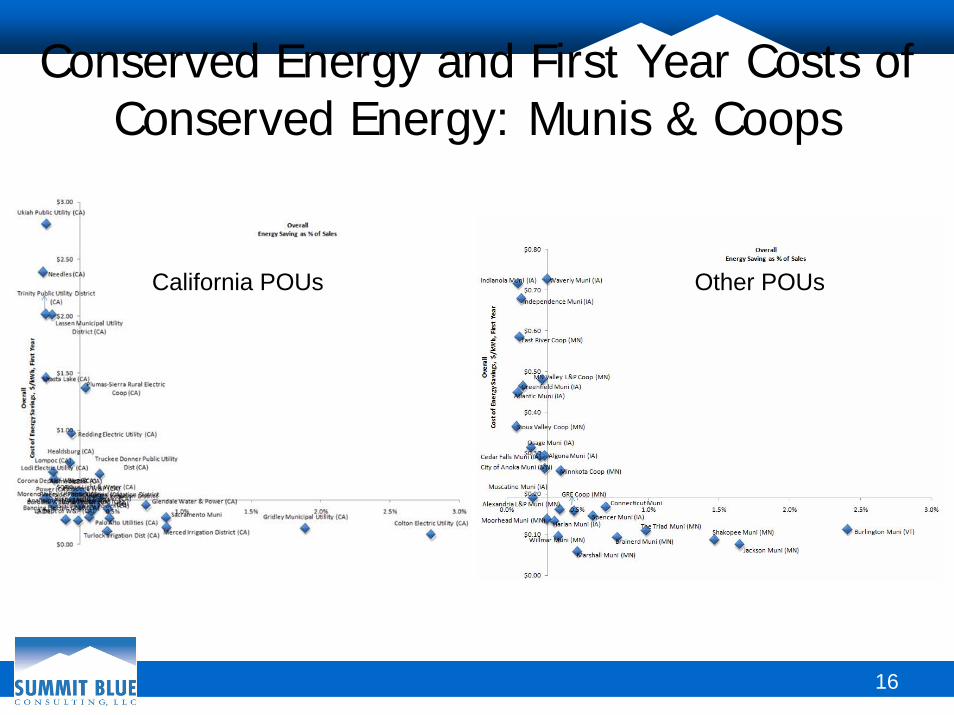
Conserved Energy and First Year Costs of Conserved Energy: Munis & Coops
16
Other POUsCalifornia POUs

17
Energy Savings as % of Sales
First Year Cost of Energy Savings
$/kWh
Median of All
Median of Best
PracticeMedian of
All
Median of Best
Practice
IOUs & Agencies 0.9% 1.1% $0.15 $0.11Munis & Coops 0.3% 0.5% $0.33 $0.14
Medians of Energy Savings and First Year Costs of Savings

Medians of Energy Savings of All and of Best Practice:
IOUs & Agencies and Munis & Coops
18
19
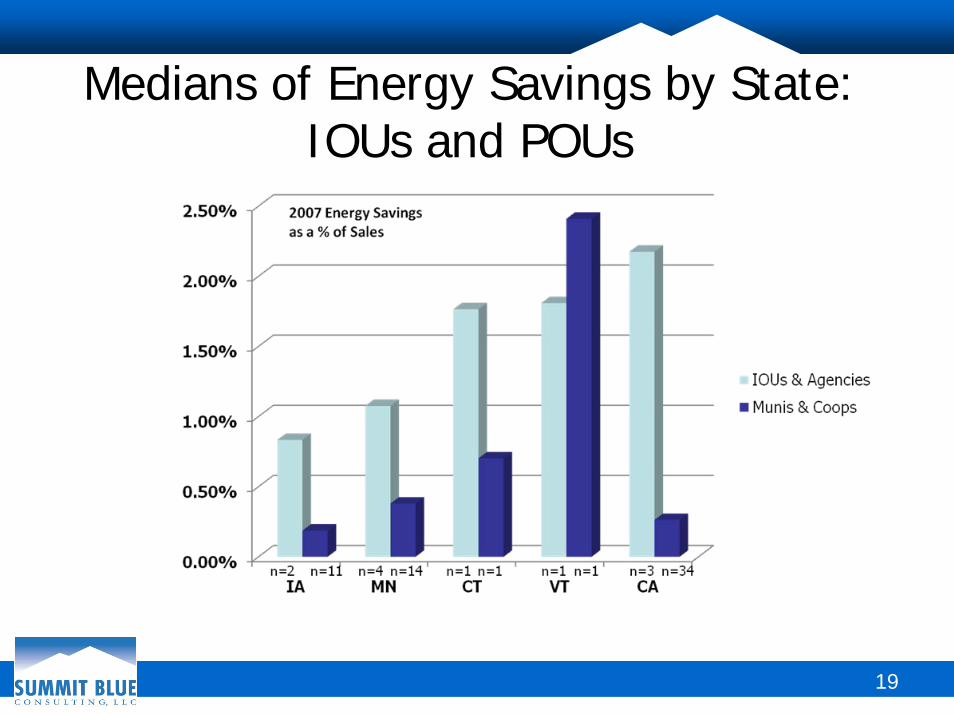
Medians of Energy Savings by State: IOUs and POUs
Summary
20
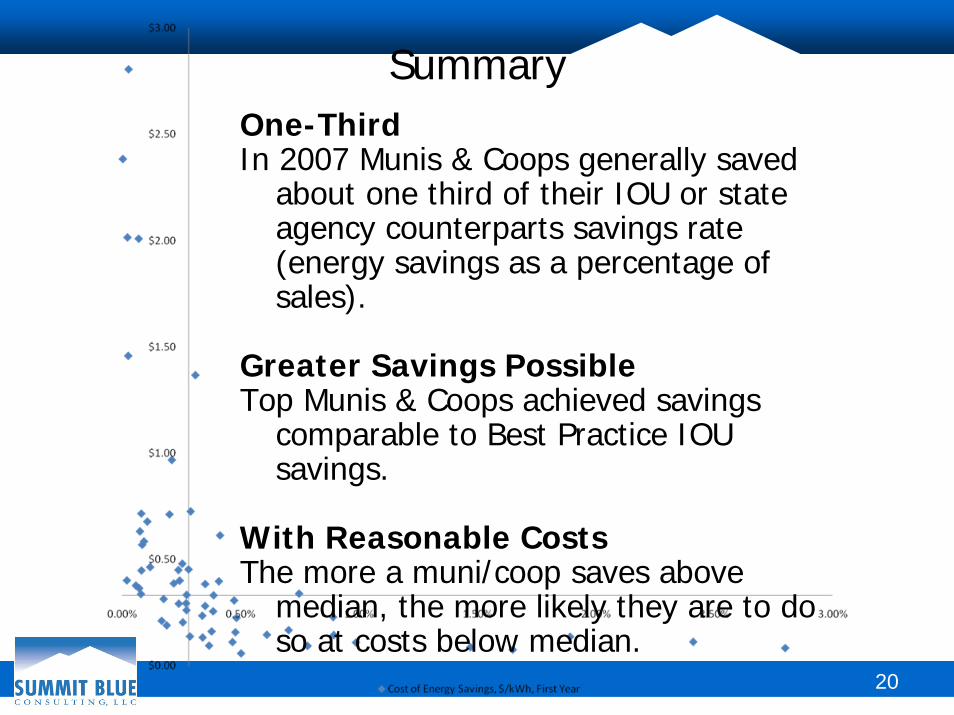
One-ThirdIn 2007 Munis & Coops generally saved
about one third of their IOU or state agency counterparts savings rate (energy savings as a percentage of sales).
Greater Savings PossibleTop Munis & Coops achieved savings
comparable to Best Practice IOU savings.
With Reasonable CostsThe more a muni/coop saves above
median, the more likely they are to do so at costs below median.
21
Recommendations & ConclusionCollaboration Yields Greater Cost-Effective
Savings Munis & Coops can achieve greater savings at lower
costs by collaborating with IOUs or state agencies in state-wide programs.
Especially on Upstream EffortsVermontEfficiency VT and BED jointly subsidized $0.99 CFL
program at wholesale distribution level.
CaliforniaThree IOUs contributed to the statewide Upstream-
Motors and HVAC program. Single, simplified infrastructure boosted distributor participation and kept costs down.

Energy Efficiency Resource Standards for IOUs, Municipal, and Cooperative Utilities:
Can One Size Fit All?
Laura Agapay Randy [email protected] [email protected] 312.938.4242
Summit Blue Consulting, LLCChicago