Embed Size (px)
Citation preview

NREL is a national laboratory of the U.S. Department of Energy, Office of Energy Efficiency & Renewable Energy, operated by the Alliance for Sustainable Energy, LLC.
Contract No. DE-AC36-08GO28308
Energy Efficiency Strategies for Municipal Wastewater Treatment Facilities J. Daw and K. Hallett National Renewable Energy Laboratory
J. DeWolfe and I. Venner Malcolm Pirnie, the Water Division of ARCADIS
Technical Report NREL/TP-7A30-53341 January 2012

NREL is a national laboratory of the U.S. Department of Energy, Office of Energy Efficiency & Renewable Energy, operated by the Alliance for Sustainable Energy, LLC.
National Renewable Energy Laboratory 1617 Cole Boulevard Golden, Colorado 80401 303-275-3000 • www.nrel.gov
Contract No. DE-AC36-08GO28308
Energy Efficiency Strategies for Municipal Wastewater Treatment Facilities J. Daw and K. Hallett National Renewable Energy Laboratory
J. DeWolfe and I. Venner Malcolm Pirnie, the Water Division of ARCADIS
Prepared under Task No. IGST.1104
Technical Report NREL/TP-7A30-53341 January 2012

NOTICE
This report was prepared as an account of work sponsored by an agency of the United States government. Neither the United States government nor any agency thereof, nor any of their employees, makes any warranty, express or implied, or assumes any legal liability or responsibility for the accuracy, completeness, or usefulness of any information, apparatus, product, or process disclosed, or represents that its use would not infringe privately owned rights. Reference herein to any specific commercial product, process, or service by trade name, trademark, manufacturer, or otherwise does not necessarily constitute or imply its endorsement, recommendation, or favoring by the United States government or any agency thereof. The views and opinions of authors expressed herein do not necessarily state or reflect those of the United States government or any agency thereof.
Available electronically at http://www.osti.gov/bridge
Available for a processing fee to U.S. Department of Energy and its contractors, in paper, from:
U.S. Department of Energy Office of Scientific and Technical Information P.O. Box 62 Oak Ridge, TN 37831-0062 phone: 865.576.8401 fax: 865.576.5728 email: mailto:[email protected]
Available for sale to the public, in paper, from:
U.S. Department of Commerce National Technical Information Service 5285 Port Royal Road Springfield, VA 22161 phone: 800.553.6847 fax: 703.605.6900 email: [email protected] online ordering: http://www.ntis.gov/help/ordermethods.aspx
Cover Photos: (left to right) PIX 16416, PIX 17423, PIX 16560, PIX 17613, PIX 17436, PIX 17721
Printed on paper containing at least 50% wastepaper, including 10% post consumer waste.

iii
Contacts
National Renewable Energy Laboratory Jennifer Daw, PE, CEM, LEED AP Sustainability Project Manager 1617 Cole Boulevard Golden, CO 80401 Phone: 303-275-4678 E-mail: [email protected] Kathleen Hallett Energy Information Analyst 1617 Cole Boulevard Golden, CO 80401 Phone: 303-275-3725 E-mail: [email protected] Malcolm Pirnie, the Water Division of ARCADIS James DeWolfe, PE, BCEE, CWO Principal Environmental Engineer 1951 Pine Hall Road, Suite 125 State College, PA 16801 Phone: 814-867-1477 Email: [email protected] Ifetayo Venner, PE Senior Environmental Engineer 14025 Riveredge Drive, Suite 600 Tampa, FL 33637 Phone: 813-353-5751 Email: [email protected]

iv
Acknowledgements
The National Renewable Energy Laboratory (NREL) would like to acknowledge the contributions of the U.S. Department of Energy’s Technical Assistance Program, the Office of Resource Efficiency, the town of Crested Butte, and Mt. Crested Butte Water and Sanitation District in the funding of this effort and Malcolm Pirnie, the Water Division of ARCADIS and Gunnison County Electric Association for their expertise in performing the energy audit.
v
List of Acronyms and Abbreviations
ASHRAE American Society for Heating, Refrigerating and Air-Conditioning Engineers
ATAD Autothermal Thermophilic Aerobic Digestion BOD Biological Oxygen Demand DO dissolved oxygen EPA U.S. Environmental Protection Agency GCEA Gunnison County Electric Association HP horsepower I&I infiltration and inflow MGD million gallons per day NREL National Renewable Energy Laboratory O&M operations and maintenance OpenEI Open Energy Information Initiative SCADA supervisory control and data acquisition TSS Total Suspended Solids UV ultraviolet VFD Variable Frequency Drive WWTP wastewater treatment plant
vi
Executive Summary
Water and wastewater systems are significant energy consumers with an estimated 3%-4% of total U.S. electricity consumption used for the movement and treatment of water and wastewater [1,2]. Water-energy issues are of growing importance in the context of water shortages, higher energy and material costs, and a changing climate. In this economic environment, it is in the best interest for utilities to find efficiencies, both in water and energy use. Performing energy audits at water and wastewater treatment facilities is one way community energy managers can identify opportunities to save money, energy, and water.
In this paper the importance of energy use in wastewater facilities is illustrated by a case study of a process energy audit performed for Crested Butte, Colorado’s wastewater treatment plant1. The energy audit identified opportunities for significant energy savings by looking at power intensive unit processes such as influent pumping, aeration, ultraviolet disinfection, and solids handling. This case study presents best practices that can be readily adopted by facility managers in their pursuit of energy and financial savings in water and wastewater treatment. This paper is intended to improve community energy managers’ understanding of the role that the water and wastewater sector plays in a community’s total energy consumption. The energy efficiency strategies described provide information on energy savings opportunities, which can be used as a basis for discussing energy management goals with water and wastewater treatment facility managers.
1 Wastewater Division of the Public Works Department: http://tinyurl.com/889an5h
vii
Table of Contents 1 Introduction ......................................................................................................................................... 1
Energy Use in the Water and Wastewater Sector ....................................................................1
EPA Region 8 Partnership .......................................................................................................1 2 Case Study: Crested Butte ................................................................................................................ 2
Background ..............................................................................................................................2
Crested Butte’s WWTP ............................................................................................................3
Energy Audit ............................................................................................................................3
Collecting Data ........................................................................................................................4
Existing Process Performance ..................................................................................................5
Influent Pumping/Headworks ............................................................................................5
Aeration/Oxidation Ditch ...................................................................................................6
Clarification .......................................................................................................................6
Ultraviolet Disinfection .....................................................................................................6
Solids Handling ..................................................................................................................6
Plant Walkthrough ...................................................................................................................6
Primary Opportunities for Energy Savings ..............................................................................8
Influent Pumping/Headworks ............................................................................................8
Aeration/Oxidation Ditch ...................................................................................................8
Ultraviolet Disinfection .....................................................................................................9
Solids Handling ..................................................................................................................9
Reducing Influent Flow ...................................................................................................10
Community Support .........................................................................................................10
Next Steps for Crested Butte..................................................................................................11 3 Strategies To Consider .................................................................................................................... 11
Process Energy .......................................................................................................................11
Operational Controls ..............................................................................................................12
Repair and Replacement ........................................................................................................12
Biosolids ................................................................................................................................12
Infiltration, Inflow and Leaks ................................................................................................13
On-Site Renewable Energy ....................................................................................................13
Conservation ..........................................................................................................................13 4 Resources ......................................................................................................................................... 14
5 Conclusion ........................................................................................................................................ 14
6 References ........................................................................................................................................ 15

viii
List of Figures Figure 1. Crested Butte, Colorado .................................................................................................. 2Figure 2. Crested Butte WWTP process flow diagram ................................................................... 3Figure 3. Energy audit levels .......................................................................................................... 4Figure 4. Collecting UV system power draw data .......................................................................... 7Figure 5. Measuring DO profile ...................................................................................................... 7Figure 6. Mechanical aerator in oxidation ditch ............................................................................. 9Figure 7. Typical WWTP energy consumers ................................................................................ 11Figure 8 Quality versus energy ..................................................................................................... 12 List of Tables
Table 1. Crested Butte WWTP: Major Energy Consumers ............................................................ 5Table 2. Energy Savings Recommendations ................................................................................ 10Table 3. Energy Efficiency Strategies for Municipal WWTPs ..................................................... 13

1
1 Introduction
Energy Use in the Water and Wastewater Sector Water and wastewater systems are significant energy consumers. An estimated 3%-4% of U.S. electricity consumption is used for the movement and treatment of water and wastewater [1,2]. The exact cost of energy use can vary widely from one utility to the next, with estimates ranging from 2%–60% of total operating costs [3,4]. Energy represents a substantial cost to wastewater utilities, as it is typically required for all stages in the treatment process, from the collection of raw sewage to the discharge of treated effluent. Given that water and wastewater treatment plants are not primarily designed and operated with energy efficiency as a chief concern, these systems can be overlooked when communities fund energy improvement projects.
However, substantial energy and financial savings can be uncovered through operational changes and capital improvements at water and wastewater utilities.
Operators and managers of water and wastewater facilities have a wide range of priorities, of which energy consumption is just one [5]. Some of their primary duties include:
• Complying with regulatory requirements to meet customer, public health, and ecological demands
• Providing reliable service at reasonable and predictable rates
• Balancing repair and replacement needs with long-term debt, equipment condition, ongoing operations and maintenance costs, and revenue
• Optimizing operations and maintenance to reduce costs and ensure longevity of assets.
Allocating time to conduct an energy audit and make the necessary physical and operational changes can produce substantial benefits. Energy audits help identify the greatest energy-consumers at a facility, reveal opportunities for operational improvements, and detect issues with aging and underperforming equipment. The results of an audit can help to improve energy efficiency, which represents an opportunity for municipalities to reduce operating costs as well as impacts on both the environment and the surrounding community.
EPA Region 8 Partnership The U.S. Environmental Protection Agency (EPA) Region 8 office serves the Intermountain West: Colorado, Montana, North Dakota, South Dakota, Utah and Wyoming. In October 2010, EPA Region 8 initiated the EPA Region 8 Utilities Partnership Energy Management Initiative for Public Wastewater and Drinking Water Utilities program with a focus on helping municipal water and wastewater utilities reduce energy consumption, improve reliability and performance, and minimize environmental impacts. In this program, the Region 8 office partnered with 10 – 15 community water and wastewater facilities to complete the following tasks:
• Benchmark current and future energy use in the EPA Portfolio Manager tool [6]
• Perform process energy audits

2
• Develop an Energy Management Plan using EPA’s Ensuring a Sustainable Future: An Energy Management Guidebook for Wastewater and Water Utilities2
• Commit to implementing energy efficiency improvements and sharing results with the EPA Region 8.
To increase the breadth of this program and provide value to municipalities that did not participate, EPA Region 8 plans to create a set of case studies to share with other water and wastewater utilities across the Intermountain West that profile some of the participating utilities and illustrate the process, benefits and challenges of optimizing energy performance.
Figure 1. Crested Butte, Colorado
Source: NREL/PIX 19943
2 Case Study: Crested Butte
Background In support of their participation in the program, the town of Crested Butte was required to perform a process energy audit of its wastewater treatment plant (WWTP). The energy audit focused on readily implementable opportunities for energy reduction through process modification and operational improvements. The audit considered optimization of existing processes to realize improved control, monitoring, and WWTP effluent quality. The audit also helped the town begin tracking and benchmarking its WWTP energy use.
The Department of Energy’s National Renewable Energy Laboratory (NREL) partnered with the town of Crested Butte, Malcolm Pirnie, the Water Division of ARCADIS, the Office of Resource Efficiency, and Gunnison County Electric Association (GCEA) (who served as the assessment team) in performing the energy audit. This partnership created an opportunity for these organizations to support local capacity development, working to educate communities and water/wastewater utilities on how to analyze and achieve energy efficiency savings. The intent of this paper is to share energy efficiency strategies learned from the Crested Butte process energy audit with other communities in order to help them achieve their energy reduction and environmental goals. 2 http://www.epa.gov/owm/waterinfrastructure/pdfs/guidebook_si_energymanagement.pdf

3
Crested Butte’s WWTP Crested Butte is a small town located on the Western Slope of Colorado and is a major tourist destination for outdoor sports. The WWTP, constructed in 1997, serves the town, which has a permanent population of 1,500 people. The WWTP treats wastewater from residential and commercial customers, with no major industrial discharges to the plant. The plant also accepts solids from the Mt. Crested Butte Water and Sanitation District.
The town has an oxidation ditch WWTP, with a permitted capacity of 0.6 million gallons per day (MGD) for a 30-day average daily flow. The plant consists of grit removal, influent pumping, aeration, clarification, ultraviolet (UV) disinfection, and solids handling processes. Treated effluent from the plant discharges to the Slate River. Sludge is thickened and dewatered on-site and hauled to a local landfill for disposal. A simplified process flow diagram for the plant is shown in Figure 2.
Figure 2. Crested Butte WWTP process flow diagram
Source: NREL
Energy Audit As part of the town’s participation in the EPA program, an energy audit of the treatment process was required. While not included in this study, building energy audits, which evaluate lighting, heating, cooling, and ventilation systems, can also yield substantial financial and energy savings in treatment facilities.
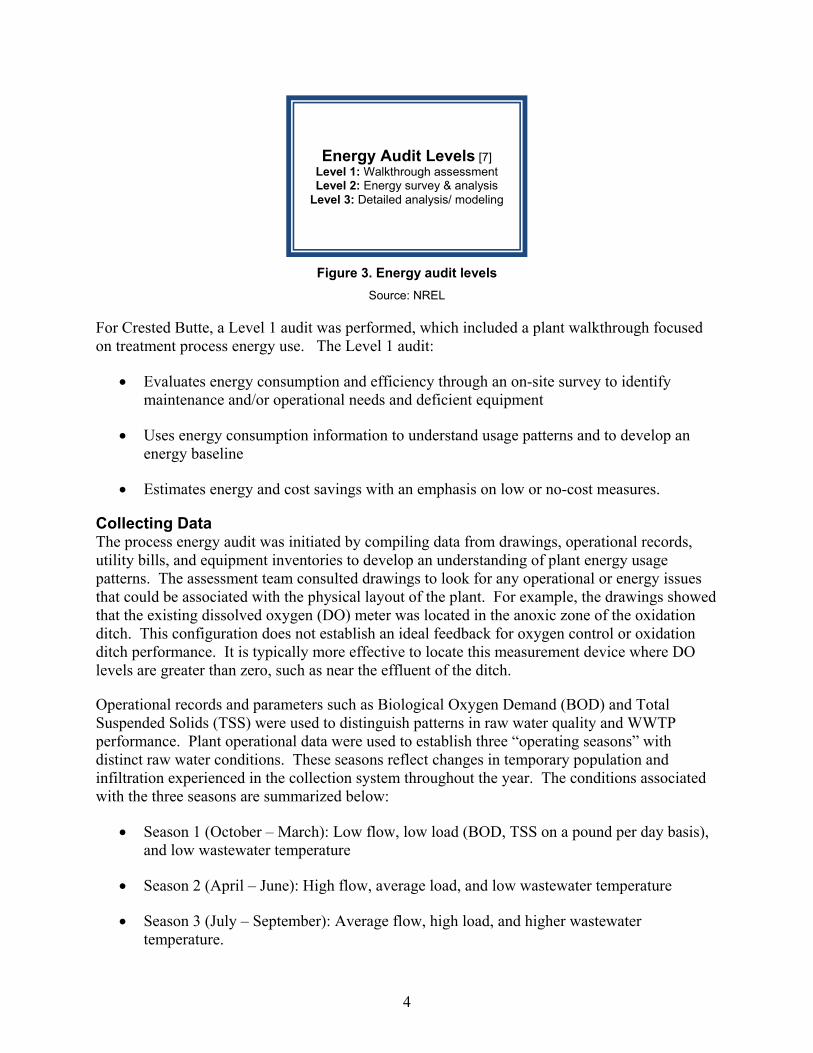
There are three levels of energy audits outlined by the American Society for Heating, Refrigerating and Air-Conditioning Engineers (ASHRAE). These audit levels differ with respect to level of complexity, depth of analyses, and the degree of detail the audit can provide. Audits range from Level 1 (a walkthrough) to Level 3 (computer modeling).
4
Figure 3. Energy audit levels
Source: NREL
For Crested Butte, a Level 1 audit was performed, which included a plant walkthrough focused on treatment process energy use. The Level 1 audit:
• Evaluates energy consumption and efficiency through an on-site survey to identify maintenance and/or operational needs and deficient equipment
• Uses energy consumption information to understand usage patterns and to develop an energy baseline
• Estimates energy and cost savings with an emphasis on low or no-cost measures.
Collecting Data The process energy audit was initiated by compiling data from drawings, operational records, utility bills, and equipment inventories to develop an understanding of plant energy usage patterns. The assessment team consulted drawings to look for any operational or energy issues that could be associated with the physical layout of the plant. For example, the drawings showed that the existing dissolved oxygen (DO) meter was located in the anoxic zone of the oxidation ditch. This configuration does not establish an ideal feedback for oxygen control or oxidation ditch performance. It is typically more effective to locate this measurement device where DO levels are greater than zero, such as near the effluent of the ditch.
Operational records and parameters such as Biological Oxygen Demand (BOD) and Total Suspended Solids (TSS) were used to distinguish patterns in raw water quality and WWTP performance. Plant operational data were used to establish three “operating seasons” with distinct raw water conditions. These seasons reflect changes in temporary population and infiltration experienced in the collection system throughout the year. The conditions associated with the three seasons are summarized below:
• Season 1 (October – March): Low flow, low load (BOD, TSS on a pound per day basis), and low wastewater temperature
• Season 2 (April – June): High flow, average load, and low wastewater temperature
• Season 3 (July – September): Average flow, high load, and higher wastewater temperature.
Energy Audit Levels [7] Level 1: Walkthrough assessment Level 2: Energy survey & analysis
Level 3: Detailed analysis/ modeling

5
The assessment team reviewed equipment inventories to determine the age and horsepower of plant equipment and to identify major energy consumers within the facility. An abbreviated list of major energy consumers in the town’s WWTP, along with their typical operations and controls, are summarized in Table 1. This information was used to focus audit efforts on major energy consuming processes within the plant to maximize energy savings opportunities.
Table 1. Crested Butte WWTP: Major Energy Consumers
Existing Process Performance Each process was discussed in detail with plant operations staff to understand performance trends and concerns. General observations on the WWTP’s process performance and operational strategies are described in the following paragraphs.
Influent Pumping/Headworks The influent system consists of three pumps:
• one 4.7 horsepower (HP) pump (Pump No. 1)
• two 17.5 HP pumps (Pumps No. 2 and No. 3).
Pump No. 2 runs continuously based on level detection in the wet well. All pumps have Variable Frequency Drives (VFDs).
Equipment Quantity Horsepower Operations Controls
Mechanical Aerator
1 75 Continuous Variable Frequency Drive (VFD), manual
adjustment
Centrifuge 1 40 10-20 hrs/week VFD, fixed speed
Influent Pump (No. 1)
1 4.7 Continuous VFD, speed based on flow
Influent Pumps (No. 2 & 3)
2 17.5 Pump No. 2 continuous
Pump No. 3 back-up
VFD, speed based on flow
VFD, speed based on flow
Blowers 3 15 Intermittent Fixed speed
Mixers 3 4 Continuous Fixed speed
UV System 2 banks 7.3 (kW) Continuous Fixed, 2 banks

6
Aeration/Oxidation Ditch The town’s WWTP has one oxidation ditch that provides aerobic removal of BOD and ammonia. There is an anoxic portion of the ditch that provides denitrification, recovers alkalinity, and reduces oxygen demand. The ditch has one 75 HP aerator running on a VFD that is operated based on manual adjustment from a daily DO concentration reading. Typically, energy savings from VFDs come from adjustments that are made automatically to adapt to system conditions, not manual adjustments. The ditch also has two continuously operated mixers in the anoxic zone. The existing DO meter located in the anoxic zone is not operational.
Clarification The WWTP has two clarifiers, one that operates continuously and a supplemental clarifier for high flow events.
Ultraviolet Disinfection The UV system was designed for a plant flow rate of 1.3 MGD (double the permitted capacity of the facility). The system currently operates with both banks on-line. Plant staff change UV system lamps once a year for preventative maintenance.
Since 2008, the average effluent fecal coliform concentration has been 8.3 counts/100 milliliters (mL) with a 7-day average of 214.3 counts/100 mL. The permitted effluent Escherichia Coli (a part of the group fecal coliform) concentration is 1372 counts/100 mL (30-day average) and 2,744 counts/100 mL (7-day average). The current operational approach results in effluent fecal coliform levels that are significantly below permit requirements.
Solids Handling The WWTP has an Autothermal Thermophilic Aerobic Digestion (ATAD) system, which is not operational due to odor problems. Therefore, sludge is currently thickened in the raw sludge storage tank and transferred to the thickened sludge storage tank for holding. Due to existing plant piping configurations, sludge must be pumped from the thickened sludge storage tank to the ATAD holding tank to reach the centrifuge for dewatering. Although this allows for additional storage, and therefore potentially less frequent trips to the landfill, it also requires that the 15 HP blower associated with the ATAD storage tank remain operational.
The 40 HP centrifuge is controlled by VFD, but typically runs at a constant speed. The centrifuge fills a 20 cubic yard dumpster once a week. Centrate from the centrifuge is piped to the oxidation ditch, which may affect performance of the oxidation process.
Plant Walkthrough Using this operational insight, the assessment team visited the WWTP to perform a Level 1 plant walkthrough. This effort consisted of visual inspections to identify operational or maintenance issues and the collection of energy data from major plant equipment. These data will be used by the town to develop estimated cost savings associated with operations and maintenance (O&M) and to prioritize capital improvements to the facility.
GCEA assisted the assessment team during the audit by measuring actual power draw for major equipment, including sludge transfer pumps and blowers, which were rotated into operation for 15-minute increments to record actual power use. Using a consistent time interval to measure

7
power draw allows sufficient time for power consumption associated with equipment start-up to level out. These data will be considered by the town to help make prioritizations for improvement.
Figure 4. Collecting UV system power draw data
Source: NREL/PIX 19941
During the audit, DO concentrations were measured in the oxidation ditch to determine aeration effectiveness. These concentrations created a DO profile that was used to better understand plant operations.
Figure 5. Measuring DO profile
Source: NREL/PIX 19942

8
A BioWin model3 was developed for the plant using influent characteristics, temperature, historical DO concentrations, typical aerator speeds, and the measured DO profile. Using this process model, the assessment team determined that the existing aerator, which is approximately 15 years old, had poor transfer efficiency relative to newer aerators – meaning more energy is used to drive the aerator than would be expected for the resulting DO levels.
Primary Opportunities for Energy Savings Based on plant operational information and data collected during the audit, the assessment team developed energy savings recommendations for the WWTP.
Influent Pumping/Headworks Flow data provided for the WWTP indicates that infiltration and inflow (I&I) is problematic during Season 2 (April – June). To mitigate these issues, it is helpful to identify critical I&I areas in the collection system caused by leaks and breaks. This information will help to prioritize efforts to repair or replace system piping.
Another best practice for Crested Butte’s WWTP is to tailor the operational strategy for the headworks to meet the three distinct seasons mentioned above. Using smaller horsepower equipment, such as Pump No. 1, to the extent possible, can reduce ongoing energy consumption. Based on typical daily flow patterns, Pump No. 1 could address nightly and mid-day low flow periods in Season 1 (October – March) and nightly low flow periods in Season 3 (July – September). As Pump No. 1 ages, the town may consider replacing it with a slightly higher capacity pump controlled by VFD to address wet well fluctuations. This increased capacity and improved controls would extend the pump’s operations during lower flow periods and minimize usage of the higher horsepower pumps.
Aeration/Oxidation Ditch The DO levels measured in the oxidation ditch, in concert with other operational data, indicated that the aerator was not performing efficiently. Given that this is the largest horsepower motor at the WWTP, and that the aerator is nearing the end of its useful life, the assessment team recommends replacing it with a more energy-efficient model. The WWTP may also consider installing a new DO meter and/or ammonia sensor near the ditch outfall to provide more useful feedback on ditch performance. Connecting this meter to the plant supervisory control and data acquisition (SCADA) system will allow for continuous monitoring and control of DO levels. Additional energy savings can be achieved if these DO readings are used to automatically control the speed of the aerator. As a best practice, the mixers are recommended to only be used when the aerator is not operating, which will further reduce the energy use of this process.
3 BioWin is a Microsoft Windows-based simulator used in the analysis and design of wastewater treatment plants. http://www.envirosim.com/products/bw32/bw32intro.php

9
Figure 6. Mechanical aerator in oxidation ditch
Source: NREL/PIX 19944
Ultraviolet Disinfection Current operations of the UV system are consistent with the ultimate design flow rate, 1.3 MGD. With a current maximum operating flow rate of 0.6 MGD (less than half of the design flow rate of the UV system), the WWTP is surpassing permit requirements. Accordingly, the assessment team recommends that the WWTP operate only one bank of the UV system instead of both banks. Since the system was designed to treat significantly more wastewater than the WWTP currently receives, the facility could also work with the manufacturer to potentially modify the system to save energy by removing bulbs and retrofitting or de-energizing some of the ballasts. Connecting the UV system to SCADA would also improve control of performance.
The WWTP may also consider replacing UV system lamps less frequently – the manufacturer recommends that bulbs be replaced after 13,500 hours of operation or every 1.5 years. Current operational practices are to replace bulbs as part of scheduled annual maintenance, regardless of running hours. Increasing the bulb replacement interval will save material costs and waste associated with operation of the plant.
Solids Handling The current solids handling process is operating inefficiently due to the use of existing ATAD system piping to reach the centrifuge for dewatering. When the ATAD system becomes operational again, this inefficiency will improve. However, the WWTP may also consider making piping retrofits to allow sludge to move directly from the thickened sludge tank to the centrifuge, bypassing the ATAD system. This change would eliminate transfer pumping within the solids handling system.
One of the principal products of a WWTP is sewage sludge or biosolids [8]. Until two or three decades ago, the typical practice for WWTPs in Region 8 was to dispose of biosolids via landfill or incineration. These days, however, more facilities put biosolids to beneficial reuse and 85% of the biosolids generated in Region 8 are now recycled [9]. Most commonly, biosolids are used as a soil amendment to fertilize agricultural land or to restore soils on reclaimed land.
Crested Butte’s WWTP may also want to consider studying the energy requirements that are needed to treat its biosolids in order to divert them from the landfill for beneficial uses such as fertilizer for agriculture. While more energy is required to treat solids to a Class A or B standard4, it could also reduce vehicle miles to haul the material to the landfill, alleviate some of
4 EPA Sewage Sludge (Biosolids): http://water.epa.gov/polwaste/wastewater/treatment/biosolids/genqa.cfm

10
the long-term environmental burden of landfill disposal, and reduce greenhouse gas emissions associated with landfilled sludge.
Reducing Influent Flow Pinpointing areas in the collection system with I&I problems can help the WWTP to focus repair and replacement efforts. Infiltration of groundwater can be a major contributor to the WWTP influent flow. Regular cleaning, inspection, and slip lining of collection system piping can greatly mitigate infiltration and reduce the quantity of wastewater being treated.
Community Support An active community-wide conservation program is another essential factor in reducing WWTP plant inflow. Working with the community to promote conservation awareness and to take actions such as installing water efficient fixtures, can significantly reduce flows at the WWTP and save energy.
Recommendations and estimated energy and annual financial savings are shown in Table 2. These recommendations have been divided into short-term opportunities, which are lower cost and more readily implementable, and long-term opportunities, which would require more planning and capital expenditure. As presented in the table below, the aeration process offers the largest opportunities for energy and financial savings for the town of Crested Butte.
Table 2. Energy Savings Recommendations
Process Recommendations Savings (kWh - % energy - $/year)
Influent Pumping/Headworks
Use Pump No.1 during low flow (ST)
Conduct I&I study (LT)
Replace Pump No.1 (LT)
4,300 - 10% - $150
14,000 - 35% - $550
8,700 - 20% - $350
Aeration/Oxidation Ditch
Turn mixers off when aerator operates (ST)
Replace DO meter (ST)
Connect new DO meter to SCADA/ Replace aerator (LT)
45,900 - 90% - $1,750
19,800 - 10% - $750
123,000 - 40% - $4,700
UV Disinfection Remove one UV bank from service/ Determine if bulbs can be removed (ST)
32,000 - 50% - $1,200
Solids Handling Retrofit piping to feed sludge directly from thickened sludge tank to centrifuge (LT)
23,500 100% - $1,000
ST = short-term, LT- long-term

11
Next Steps for Crested Butte As a next step, the town will further quantify energy savings associated with the recommended improvements and begin work on their Energy Management Plan. The Energy Management Plan will establish the objectives and targets to be used to measure the town’s progress in energy reduction and will guide the town’s capital improvement efforts as well as plant O&M activities. Further information on how this information will be used can be found in the EPA’s Guidebook [10].
Crested Butte’s WWTP will also use its energy data to benchmark operational performance against other WWTPs, with the EPA Portfolio Manager. Portfolio Manager is a tool that can help the town identify further opportunities for performance improvement and prioritize investments.
3 Strategies To Consider
The Crested Butte case study is an excellent demonstration of how conducting an energy audit can improve a facility or community energy manager’s understanding of energy savings opportunities at water and wastewater facilities. The following sections provide a brief overview of several general energy savings strategies. Facility and community energy managers alike may want to consider how these energy savings strategies (summarized in Table 3) could be adopted at their community’s water and wastewater treatment facilities. Operators or managers who are ready to develop and implement a comprehensive energy management plan, and readers who are interested in step-by-step guidance, can get started with EPA’s Ensuring a Sustainable Future: An Energy Management Guidebook for Wastewater and Water Utilities [10].
Process Energy When conducting an energy audit, focus efforts on the biggest energy consumers at the facility. This can be determined by reviewing drawings, nameplate data, or by measuring power draw of equipment. The aeration process is the largest energy consumer for most WWTPs as demonstrated by the typical WWTP energy usage patterns in Figure 7 [11].
Figure 7. Typical WWTP energy consumers
Source: Malcolm Pirnie, the Water Division of ARCADIS

12
Quality
Energy
Operational Controls Running a WWTP is not a “one size fits all” operation. Regularly evaluating influent and effluent trends can help utilities to tailor operational strategies accordingly. These parameters may vary by season, time of day, and/or have other unique characteristics. System controls that use SCADA feedback and VFDs can be used to optimize effluent quality and energy consumption. This balancing act is a continuous process that facility managers must consider, knowing that higher effluent quality is often at the expense of increased energy use. Achieving an optimal balance between quality and energy is the ultimate goal.
Figure 8. Quality versus energy Source: NREL
Repair and Replacement As part of capital planning efforts, a best practice for facilities is to regularly evaluate the condition, performance and remaining useful life of process equipment. Aging equipment is more inefficient, can be costly to repair, and typically requires more energy than newer models. When doing an energy audit, equipment age and operational efficiency are major considerations. Evaluating preventative maintenance practices also helps to ensure that equipment is receiving appropriate maintenance for the level of use [12].
Biosolids There are significant environmental and financial tradeoffs between providing higher quality biosolids and the subsequent energy demands. When evaluating biosolids treatment and disposal options, the following factors are important for facilities to consider [13]:
• Transportation – distance from the WWTP to the landfill affects cost to haul biosolids for disposal
• Additional costs – tipping fees and additional treatment for land application may incur additional costs for biosolids
• Revenue – WWTPs may receive payment for their biosolids as a soil amendment
• Carbon emissions – landfilling of biosolids can result in greater emissions than land application
• Sustainability – using biosolids reduces demand for landfills and synthetic fertilizers, and can help the reclamation and re-vegetation process for brownfield sites.

13
Infiltration, Inflow and Leaks The wastewater collection system is another area of opportunity for utilities. A considerable amount of energy is wasted treating groundwater that infiltrates systems through pipes that are broken or out of alignment. Similarly, breaks and leaks in the collection system increase the energy required to pump sewage to the treatment plant. Focusing efforts on identifying areas with I&I, breaks, and leaks can enable utilities to direct repair and replacement efforts to areas that will provide greater energy and financial savings.
On-Site Renewable Energy A best practice for all communities is to look for opportunities to incorporate on-site renewable energy at their facilities. After energy efficiency, renewable energy is another effective way to save money by reducing energy purchases. All renewable resources available within the community, including wind, solar, water, and wastes generated on-site, may be considered as potential energy sources. These renewable systems are selected and installed to maximize energy production [14]. WWTPs with anaerobic digestion provide a unique opportunity to create on-site heat and power, by capturing biogas emissions as fuel for on-site energy generation [15].
Conservation Effective outreach within the community can yield substantial reductions in water use and wastewater generation. Programs can be implemented that incentivize community members, businesses, and/or industries to reduce their water usage. By providing low-flow fixtures at a discounted fee, conducting water audits, and/or using inverted block rate structures, utilities can substantially reduce the amount of effluent to be treated and dramatically lower energy use within the community. Creating behavioral change through public education programs is another essential element in promoting conservation. As allowed by local water rights, maximizing the use of “fit for purpose” or reuse water may be considered as another conservation strategy.
Table 3, below, summarizes the strategies that may be adopted by municipal wastewater treatment facilities to improve energy efficiency.
Table 3. Energy Efficiency Strategies for Municipal WWTPs
Focus Efforts for Energy Savings Process Energy Focus on biggest energy consumers at WWTP Operational Controls Tailor operations to meet seasonal and diurnal changes Quality vs. Energy Balance water quality goals with energy needs Repair and Replacement Consider equipment life and energy usage to guide repair and
replacement Biosolids Consider tradeoffs between treatment energy and improved biosolids
quality Infiltration/Inflow Address I&I to reduce treatment energy Leaks and Breaks Address leaks and breaks to reduce pumping energy On-Site Renewable
Energy Consider opportunities for on-site generation to reduce energy purchases
Conservation Educate the community: Less water reduces WWTP loads and energy needs

14
4 Resources
NREL provides access to hundreds of entries with helpful tools, as part of the Open Energy Information Initiative (OpenEI). OpenEI is a wiki that allows users to enter information directly into its database, in order to share resources on renewable energy and energy efficiency: http://en.openei.org/wiki/Main_Page.
NREL provides limited technical assistance through various federal programs. Under these programs, agencies may apply to receive technical assistance from NREL for understanding and deploying energy efficiency and renewable energy technologies: www.nrel.gov/applying_technologies/state_local_activities/technical_assistance.html.
5 Conclusion
The Crested Butte case study demonstrates the importance of energy audits in providing community energy managers with the ability to recognize and implement energy saving opportunities at their facilities. Working to improve the understanding of energy patterns and efficiency opportunities is a best practice that all communities can adopt. By tracking energy usage, benchmarking, and making operational improvements, all communities can begin their efforts to reduce energy use and realize financial savings.

15
6 References
1. Electric Power Research Institute (EPRI). Water & Sustainability (Volume 4): U.S. Electricity Consumption for the Water Supply & Treatment–The Next Half Century. Topical Report1006787. Palo Alto, CA: EPRI, March 2002.
2. Galbraith, Kate. “How Energy Drains Water Supplies.” New York Times, September 18, 2011. Accessed September 22, 2011. http://www.nytimes.com/2011/09/19/business/global/19iht-green19.html?_r=1
3. Carlson, S.; Walburger, A. Energy Index Development for Benchmarking Water Utilities and Wastewater Utilities. Denver, CO: AWWA Research Foundation, 2007.
4. Elliott, T.; Zeier, B., Xagoraraki, I.; Harrington, G. W. Energy Use at Wisconsin’s Drinking Water Facilities. Report 222-1. Madison, WI: Energy Center of Wisconsin, July 2003.
5. Utility Advisory Group. Effective Utility Management: A Primer for Water and Wastewater Utilities. Utility Advisory Group, June 2008.
6. ENERGY STAR®. Portfolio Manager Overview. Accessed October 27, 2011. http://www.energystar.gov/index.cfm?c=evaluate_performance.bus_portfoliomanager
7. American Society for Heating, Refrigerating and Air-Conditioning Engineers (ASHRAE). “Energy Use and Management,” Chapter 36 in ASHRAE Handbook - HVAC Applications. (Atlanta: 2011).
8. U.S. Environmental Protection Agency (EPA). Biosolids: Targeted National Sewage Sludge Survey Report – Overview. EPA 822-R-08-014. January 2009.
9. U.S. Environmental Protection Agency (EPA). Biosolids. Accessed September 22, 2011. http://www.epa.gov/region8/water/biosolids
10. U.S. Environmental Protection Agency (EPA) and Global Environment and Technology Foundation. Ensuring a Sustainable Future: An Energy Management Guidebook for Wastewater and Water Utilities. January 2008.
11. Malcolm Pirnie, the Water Division of ARCADIS (2011). “Typical Energy Usage Patterns in U.S. Wastewater Treatment Plants.”
12. National Asset Management Strategy Group. International Infrastructure Management Manual, 2011.
13. Raucher, R.S.; Garver, D.; Hallett, K.; Henderson, J.; Wagner, C. An Economic Framework for Evaluating the Benefits and Costs of Biosolids Management Options. Alexandria, VA: Water Environment Research Foundation, 2007.

16
14. Federal Energy Management Program, Renewable Energy Resources and Technologies. Accessed December 2, 2011. http://www1.eere.energy.gov/femp/technologies/renewable_technologies.html
15. U.S. Environmental Protection Agency (EPA). Combined Heat and Power Partnership. Accessed December 2, 2011. http://www.epa.gov/chp/markets/wastewater.html