Embed Size (px)
Citation preview

Energy efficient food processing: focus on refrigeration
Food Manufacturing Industry
Jeff Mackey
Energy Advisor
Franklin Energy
Agenda
• Agenda review and introductions• Food Industry Energy Efficiency
• A look at energy consumption • Opportunities for energy savings• Case studies for energy efficiency• Process load reduction
• Industrial refrigeration systems and technologies
• Opportunities through operation changes• Variable frequency drives• Implementation strategy
• Question and answer

IntroductionsEnergy efficient food processing: focus on refrigeration
Getting to Know You
• Name
• Company
• Role
• Concerns coming into this course?

Learning Objectives
• Recognize and prioritize opportunities for energy savings.
• Recognize energy saving options as it relates to refrigeration equipment.
• Identify specific strategies for improving performance of industrial refrigeration systems.
• Discuss specific improvement implementation strategies and their challenges.
A look at energy consumption by sector and processEnergy efficient food processing: focus on refrigeration

Energy Consumption Agenda
Look at the Food Manufacturing Industry’s energy consumption
1. Energy data benchmarks
2. General Mills energy management case study
3. Audience participation exercise (energy allocation)
Energy Consumption
Food Industry in Wisconsin
From MNI.net September 21, 2016 regarding Wisconsin Manufacturers• Wisconsin’s 10,694 manufacturers employ 572,981 in the state
• Since May of 2010, Wisconsin has added 21,000 jobs, or 3.8%; job gains for fifth straight year
• Tom Dubin, President of MNI publishing company, states• “Wisconsin’s stronghold in the food processing sector combined with a skilled labor pool, and growing focus on technology and innovation, have all contributed to the state’s success.”
• Food processing industry was the star of this year’s survey• Adding over 2,000 jobs, or 3.4%
• Food processing ranks as the state’s second‐largest sector by employment with 72,049 jobs.
Source: https://mni.net/news/story/wisconsin‐manufacturers‐add‐jobs‐for‐a‐fifth‐straight‐year
Energy Consumption
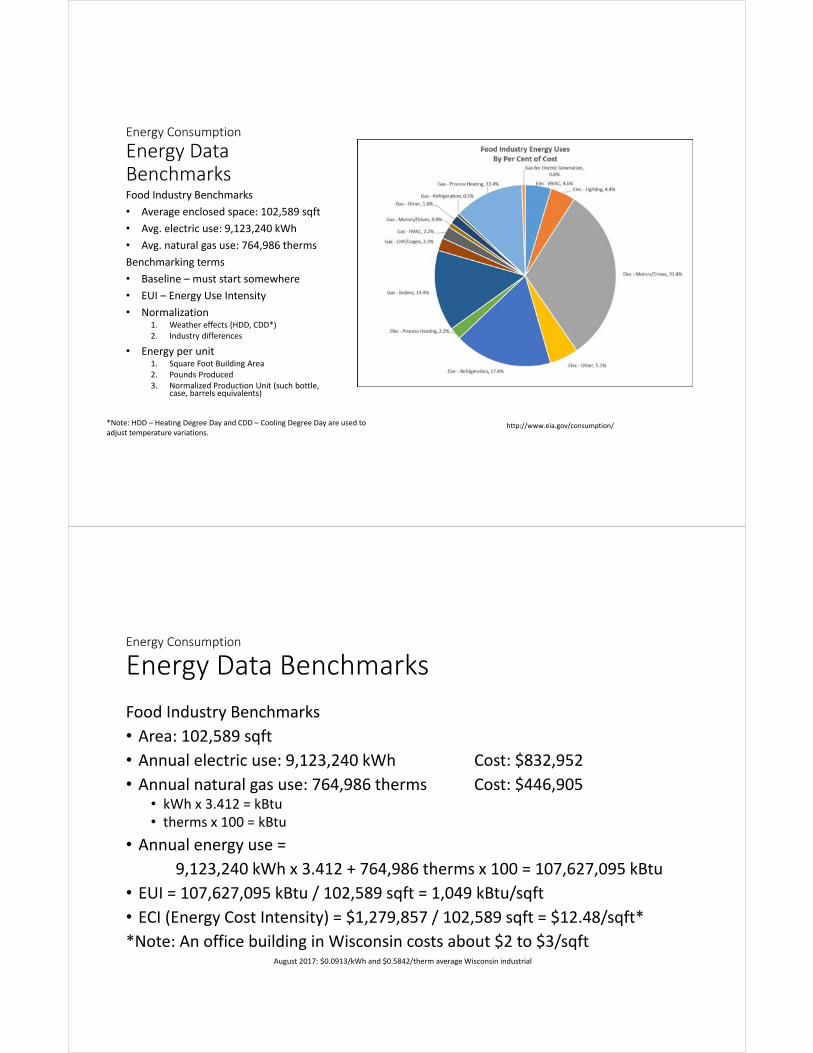
Energy Data BenchmarksFood Industry Benchmarks
• Average enclosed space: 102,589 sqft
• Avg. electric use: 9,123,240 kWh
• Avg. natural gas use: 764,986 therms
Benchmarking terms
• Baseline – must start somewhere
• EUI – Energy Use Intensity
• Normalization1. Weather effects (HDD, CDD*)2. Industry differences
• Energy per unit1. Square Foot Building Area2. Pounds Produced3. Normalized Production Unit (such bottle,
case, barrels equivalents)
http://www.eia.gov/consumption/*Note: HDD – Heating Degree Day and CDD – Cooling Degree Day are used to adjust temperature variations.
Energy Consumption
Energy Data Benchmarks
Food Industry Benchmarks
• Area: 102,589 sqft
• Annual electric use: 9,123,240 kWh Cost: $832,952
• Annual natural gas use: 764,986 therms Cost: $446,905• kWh x 3.412 = kBtu• therms x 100 = kBtu
• Annual energy use =
9,123,240 kWh x 3.412 + 764,986 therms x 100 = 107,627,095 kBtu
• EUI = 107,627,095 kBtu / 102,589 sqft = 1,049 kBtu/sqft
• ECI (Energy Cost Intensity) = $1,279,857 / 102,589 sqft = $12.48/sqft*
*Note: An office building in Wisconsin costs about $2 to $3/sqftAugust 2017: $0.0913/kWh and $0.5842/therm average Wisconsin industrial

Energy Consumption
Energy Data Benchmarks
• Sectors of Food Manufacturing• Natural, Processed & Imitation Cheese
• Flour and Other Grain Mill Products
• Fluid Milk
• Bread and Other Bakery Products
• Meat Packing
• Prepared Feed and Feed Ingredients
• Sausage and Other Prepared Meats
• Poultry Processing
• Benchmarks• Cost of energy as per cent of sales
• Energy use per square foot
August 2017: $0.0913/kWh and $0.5842/therm average Wisconsin industrialhttp://www.stateenergyoffice.wi.gov/section.asp?linkid=1451&locid=160http://www.eia.gov/consumption/
Energy Consumption
Top 10 Food Manufacturing Energy Uses
12
Source: Energy Information Agency (EIA) 2010 Manufacturer Energy Consumption Survey (MECS)
Energy Consumption
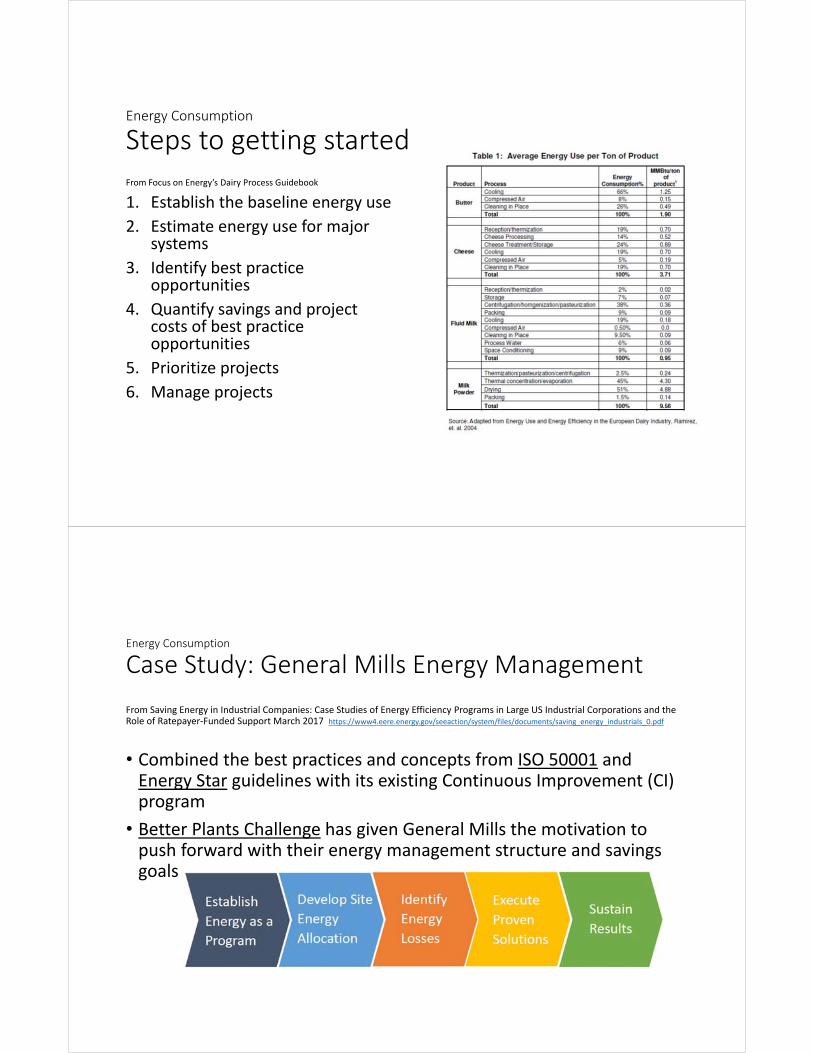
Steps to getting started From Focus on Energy’s Dairy Process Guidebook
1. Establish the baseline energy use
2. Estimate energy use for major systems
3. Identify best practice opportunities
4. Quantify savings and project costs of best practice opportunities
5. Prioritize projects
6. Manage projects
Energy Consumption
Case Study: General Mills Energy Management
From Saving Energy in Industrial Companies: Case Studies of Energy Efficiency Programs in Large US Industrial Corporations and the Role of Ratepayer‐Funded Support March 2017 https://www4.eere.energy.gov/seeaction/system/files/documents/saving_energy_industrials_0.pdf
• Combined the best practices and concepts from ISO 50001 and Energy Star guidelines with its existing Continuous Improvement (CI) program
• Better Plants Challenge has given General Mills the motivation to push forward with their energy management structure and savings goals

Energy Consumption
Case Study: General Mills Energy Management
From Saving Energy in Industrial Companies: Case Studies of Energy Efficiency Programs in Large US Industrial Corporations and the Role of Ratepayer‐Funded Support March 2017 https://www4.eere.energy.gov/seeaction/system/files/documents/saving_energy_industrials_0.pdf
1. Establish energy as a program• “Manage energy as an ingredient”
2. Develop site energy allocation• Standard tools
3. Identify energy losses• Sub‐meter to identify overuse
4. Execute proven solutions• Share results internally• Better Plants Challenge
5. Sustain results• “Manage energy as an ingredient”
Energy Consumption
Case Study
General Mills Energy AllocationFrom https://www4.eere.energy.gov/seeaction/system/files/documents/saving_energy_industrials_0.pdf
Standardized tools that allow energy engineers to deliver savings quickly.
• Account for every BTU being consumed in different systems.
• Electrical side energy usage• Lighting, compressed air, refrigeration, pumps and fans,
processing motors broken out by line, and HVAC.
• Thermal side, natural gas usage • HVAC, hot water, and each processing unit’s steam or gas
usage.
• Energy allocation exercise identifies the areas of high energy consumption.

Energy Consumption
Your Facility’s Energy Allocation
Objective: Establish framework to identify cost of key energy uses/processes simple energy model of the facility.
Premise: Equipment that uses no/little energy ignored.
Process: Start with Food Industry Benchmark1. Enter plant area square feet, energy use and cost.
2. Add/remove uses as appropriate
3. Adjust kWh/sqft and therms/sqft for total usage• Compare EUI and ECI to benchmark
4. Refine as data is improved energy use breakdown
Energy Consumption
Your Facility’s Energy Allocation
Process: Start with Food Industry Benchmark – 14 uses1. Adjust for plant area
102,589 1,274,014$
9,123,240 832,952$
754,986 441,063$
Application
Electric Use
(kWh) kWh/sqft
Natural Gas Use
(therms) therms/sqft kBtu/sqft % of Energy Annual $ $/sqft % of Cost
Elec ‐ HVAC 649,388 6.33 ‐ 21.60 2.1% 59,289$ 0.58$ 4.6%
Elec ‐ Lighting 618,612 6.03 ‐ 20.57 2.0% 56,479$ 0.55$ 4.4%
Elec ‐ Motors/Drives 4,396,965 42.86 ‐ 146.24 13.9% 401,443$ 3.91$ 31.4%
Elec ‐ Other 717,097 6.99 ‐ 23.85 2.3% 65,471$ 0.64$ 5.1%
Elec ‐ Refrigeration 2,437,515 23.76 ‐ 81.07 7.7% 222,545$ 2.17$ 17.4%
Elec ‐ Process Heating 303,663 2.96 ‐ 10.10 1.0% 27,724$ 0.27$ 2.2%
Gas ‐ Boilers ‐ 315,554 3.08 307.59 29.3% 184,346$ 1.80$ 14.4%
Gas ‐ CHP/Cogen ‐ 50,546 0.49 49.27 4.7% 29,529$ 0.29$ 2.3%
Gas ‐ HVAC ‐ 49,181 0.48 47.94 4.6% 28,732$ 0.28$ 2.2%
Gas ‐ Motors/Drives ‐ 17,758 0.17 17.31 1.6% 10,374$ 0.10$ 0.8%
Gas ‐ Other ‐ 35,516 0.35 34.62 3.3% 20,749$ 0.20$ 1.6%
Gas ‐ Refrigeration ‐ 10,926 0.11 10.65 1.0% 6,383$ 0.06$ 0.5%
Gas ‐ Process Heating ‐ 271,840 2.65 264.98 25.3% 158,809$ 1.55$ 12.4%
Gas for Electric Generation ‐ 13,665 0.13 13.32 1.3% 7,983$ 0.08$ 0.6%
9,123,240 88.93 764,986 7.46 1,049.11 100.0% 1,279,856$ 12.48$ 100.0%
Annual Natural Gas Usage (therms) Annual Cost of Natural Gas ($/therm)
Facility NameSquare Feet Annual Cost of Energy, Calculated
Annual Electricity Usage (kWh) Annual Cost of Electricity ($/kWh)
Energy Consumption
Your Facility’s Energy Use Breakdown
Objective: Derive accurate use data for key energy consumers.Premise: Start with information at hand, then add sub‐metering.Process: Start with your facility’s energy allocation
1. Identify key (i.e. big) energy users—each belongs on the allocation.2. Use combination of graphical approximations, equipment specifications, direct
measurement, and sub‐metering as available• Graphical method for space heat – see Graphical Energy Use Breakdown slide.• Motors and drives – develop machine inventory with motor sizes and estimated loads.
• Compressors, refrigeration, material handling are likely sub‐sets of Motors.• Use multimeter or motor sizes with estimated loads to calculate kW and annual kWh.• See Basis Relationship slide in Resource section.
• Lighting – see lighting Example slide.3. Revise energy allocation with calculated kWh/sqft or therms/sqft.4. Use Annual $ to help prioritize project ideas.
Energy Consumption
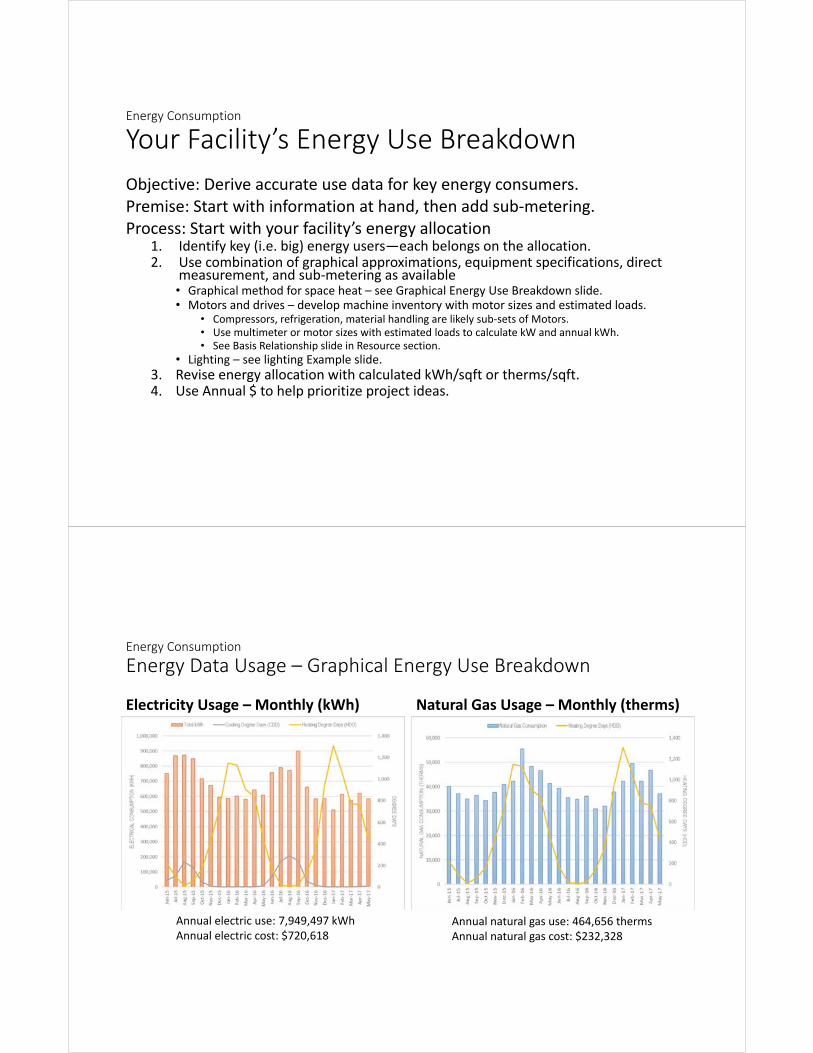
Energy Data Usage – Graphical Energy Use Breakdown
Electricity Usage – Monthly (kWh) Natural Gas Usage – Monthly (therms)
Annual electric use: 7,949,497 kWhAnnual electric cost: $720,618
Annual natural gas use: 464,656 thermsAnnual natural gas cost: $232,328

Energy Consumption
Energy Data Usage – Graphical Energy Use Breakdown
Electricity Usage – Monthly (kWh) Natural Gas Usage – Monthly (therms)
Monthly baseload electric: 550,000 kWhAnnual baseload electric: 6,600,000 kWhAnnual seasonal electric: 1,349,497 kWhAnnual seasonal cost: $122,331
Monthly baseload natural gas: 30,000 thermsAnnual baseload natural gas: 360,000 thermsAnnual seasonal natural gas: 104,656 thermsAnnual seasonal cost: $52,328
Opportunities for energy savingsEnergy efficient food processing: focus on refrigeration

Opportunities for Energy Savings Agenda
• Project ideas for energy efficiency (what’s popular now)
• Non‐energy savings considerations
Opportunities for energy savings
Top 10 uses account for 96.4% of energy cost
Source: Energy Information Agency (EIA) 2010 Manufacturer Energy Consumption Survey (MECS)
Prioritize Projects by Energy Cost?• Electric Motors and Drives (31.4%)
• Process Cooking (17.4%)
• Gas Boilers and Process Heating (26.8%)
• Electricity – Other (5.1%)
• HVAC – electric and gas (6.8%)
• Lighting (4.4%)
• Combined Heat & Power and Cogeneration (2.3%)
• Electric Process Heating (2.2%)
Most Common

Opportunities for energy savings
Why are lighting projects most common?
Source: https://www.amazon.com/VaporTight-High-Fluorescent-Fixture-6-Lamp/dp/B005713OVO
Project criteria1. Excellent payback – often < 2 years
• Easy to determine cost savings
• Supported by incentive programs
• Refrigeration savings!
2. Highly visible projects – pun intended
• Yes we ARE going green
3. Enhanced productivity due to improved lighting
• Over or under lit
• Improved color rendering
4. Maintenance and other Non‐Energy Improvements
• Reduce cost and time spent replacing lamps and ballasts
• Wash down issues
• Mercury elimination
• Glass versus polymer materials
Opportunities for energy savings
Project ideas for energy efficiency
Image Courtesy foodprocessing.com
What’s Popular Now1. Lighting
2. Process Heating
3. Compressed Air (sub‐set of motors)
4. Refrigeration (sub‐set of motors)
5. HVAC Heating and Cooling
6. Motors and Controls

Opportunities for energy savings
Project ideas for energy efficiency
• Lighting LED
• Refrigeration Tune‐up & fine tune
• Compressed Air Reduce, eliminate losses, add storage, optimize controls, replace.
• Heat recovery EE first, then look for large Delta T adjacent to need for heat (boilers, compressors)
• Motors & Drives VFDs, motor efficiency (ECM)
• Ventilation Optimize intake and exhaust (Demand Control)
• Others1. Free cooling
2. Direct‐fired water heating
3. Electric‐to‐Gas fuel switch
4. Employee involvement
Opportunities for energy savings
Project ideas: Savings potential by sub‐sector
Food Manufacturing Sub‐sector Facilities Total Use(therms)
Potential Savings (therms)
Estimated Savings
(%)
Total Use(kWh)
Potential Savings(kWh)
Estimated Savings
(%)
Cheese and Butter Processing 22 11,348,282 1,017,200 9.00% 76,246,307 10,510,200 13.80%
Poultry Processing 24 10,903,658 903,200 8.30% 108,000,000 16,200,000 15.00%
Rendering 4 10,766,071 1,155,300 10.70% 24,948,375 1,532,800 6.10%
Dried Foods 10 9,506,837 110,000 1.20% 6,357,072 833,700 13.10%
Fruit and Vegetable Canning 14 7,126,977 372,500 5.20% 26,910,996 2,703,900 10.00%
Soybean Processing 2 3,304,160 450,000 13.60% 21,509,620 1,112,100 5.20%
Meat Processing (not poultry) 19 1,437,624 26,200 1.80% 83,622,144 8,942,000 10.70%
Margarine Manufacturing 1 422,316 65,700 15.60% 10,182,948 441,800 4.30%
Bakeries 31 341,488 64,400 18.90% 51,000,000 7,650,000 15.00%
Food Processors w/ Water Heating 44 330,416 42,200 12.80%‐ ‐ ‐
Source: Minnesota Technical Assistance Program by the Minnesota Department of Commerce’s Office of Energy Security Nov. 2010.http://www.mntap.umn.edu/resources/reports/DOC/MnTAP_IndustrialE2Analysis.pdf

Opportunities for energy savings
Project ideas for Natural Gas
Food Manufacturing Energy Efficiency Opportunities
SavingsRange B
akeries
Fruit and Vegetable
Can
ning
Rendering
Dried Foods
Meat Processing
(not poultry)
Soyb
ean
Processing
Poultry Processing
Margarine
Man
ufacturing
Cheese and Butter
Processing
Boiler improvements / best practices 1 to 8 %
Direct fired improvements / best practices 0.1 to 1%
Process equipment heat recovery 0.5 to 13%
Facility HVAC improvements 1 to 8 %
Improved process equipment 0.5 to 4 %
Product wash improvements 1%
Steam best practices and improvements 0.5 to 11 %
Water heating improvements 2 to 10%
Source: Minnesota Technical Assistance Program by the Minnesota Department of Commerce’s Office of Energy Security Nov. 2010.http://www.mntap.umn.edu/resources/reports/DOC/MnTAP_IndustrialE2Analysis.pdf
Best opportunity for sub‐sector Recommended
Opportunities for energy savings
Project ideas for Electricity
Food Manufacturing Energy Efficiency Opportunities
SavingsRange B
akeries
Fruit and Vegetable
Can
ning
Rendering
Dried Foods
Meat Processing
(not poultry)
Soyb
ean
Processing
Poultry Processing
Margarine
Man
ufacturing
Cheese and Butter
Processing
Compressed air improvements 0.5 to 3 %
Facility HVAC improvements 0.5 to 2%
Improved process equipment 9.7%
Lighting improvements 0.5 to 2 %
Motor improvements including pumps and fans 1 to 1.5 %
Process design improvements 2 to 4%
Refrigeration improvements 2 to 10 %
Source: Minnesota Technical Assistance Program by the Minnesota Department of Commerce’s Office of Energy Security Nov. 2010.http://www.mntap.umn.edu/resources/reports/DOC/MnTAP_IndustrialE2Analysis.pdf
Best opportunity for sub‐sector Recommended
LightingEnergy efficient food processing: focus on refrigeration
Opportunities for energy savings ‐ Lighting
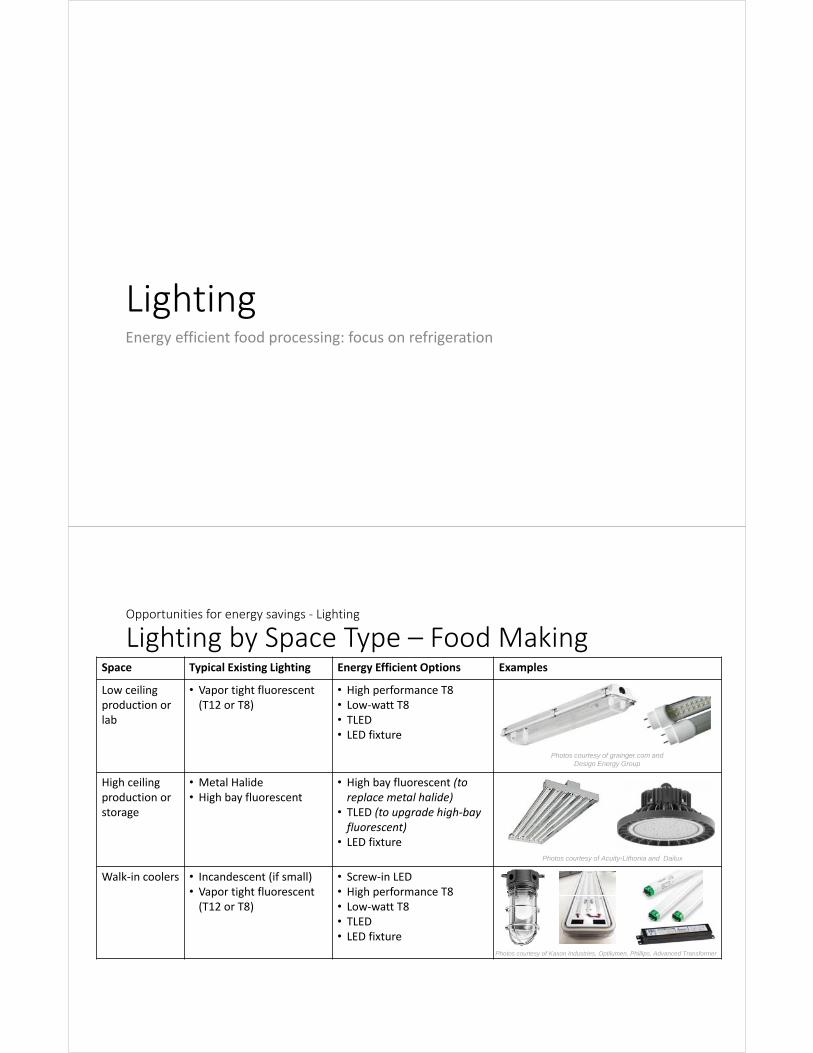
Lighting by Space Type – Food MakingSpace Typical Existing Lighting Energy Efficient Options Examples
Low ceiling production or lab
• Vapor tight fluorescent (T12 or T8)
• High performance T8• Low‐watt T8• TLED• LED fixture
High ceiling production or storage
• Metal Halide• High bay fluorescent
• High bay fluorescent (to replace metal halide)
• TLED (to upgrade high‐bay fluorescent)
• LED fixture
Walk‐in coolers • Incandescent (if small)• Vapor tight fluorescent (T12 or T8)
• Screw‐in LED• High performance T8• Low‐watt T8• TLED• LED fixture
Photos courtesy of grainger.com and Design Energy Group
Photos courtesy of Acuity-Lithonia and Dailux
Photos courtesy of Kason Industries, Optilumen, Phillips, Advanced Transformer

Opportunities for energy savings ‐ Lighting
Lighting by Space TypeSpace Typical Existing Lighting Energy Efficient Options Examples
Office / Sales / Support areas
• 4’ or u‐tube T12 or T8• CFL downlights• Incandescent track/spot lighting
• High performance T8• Low‐watt T8• TLED• LED fixture • LED retrofit kit• LED downlights
Exterior • Metal Halide or High Pressure Sodium• pole mount• wall‐pack• Flood
• LED fixtures
Photos courtesy of Mississippi Power and Improved Illumination
Photos courtesy of CREE, Sylvania, and GE
Opportunities for energy savings ‐ Lighting
Maximize Task Lighting
• When upgrading lighting, maximize task lighting and minimize ambient or overhead lighting
• Put light where needed
• Look into adding surface reflectivity
Image Courtesy foodprocessing.com

Opportunities for energy savings ‐ Lighting
ExampleWhat is the cost to run a 400 W Metal Halide fixture for 1 year?
(455 input watts) / 1,000 = 0.455 kW
0.455 kW x 3,000 hours/year = 1,365 kWh/year 3,000 hrs/year = ~11.5 hrs/day x 5 days/wk or~8.25 hrs/day x 7 days/wk
$0.11/kWh x 1,365 kWh = $150.15/year
What is the cost to run a 6 lamp T8 high bay fixture for 1 year?
(224 input watts) / 1,000 = 0.224 kW
0.224 kW x 3,000 hours/year = 672 kWh/year
$0.11/kWh x 672 kWh = $73.92/year
Savings: 693 kWh $76.23
Opportunities for energy savings ‐ Lighting
LED Lighting• Light Emitting Diode (LED) also known as Solid State Lighting (SSL)
•Average rated life of anywhere between 15,000 and 100,000 hours.
•Multiple point source directional lighting
•No IR or UV
•Most are dimmable
•Wide variety of control options
•Most other lighting technologies have matured and have minimal opportunities to improve efficiency…LED continuing to improve
Image courtesy of CREE Lighting

Opportunities for energy savings ‐ Lighting
LED Best Practices
• LEDs work best when the luminaire is designed around the LED instead of a more traditional lighting technology.
• Using LED products for most ambient lighting applications is possible however it is not yet always economical when compared with other lighting technologies
Images Courtesy of Cree, GE, Phillips and Sylvania Lighting
Opportunities for energy savings ‐ Lighting LED Fixture
LED lamp optionsHigh Bay LED Options
• Relamp with TLED if have high bay fluorescent (fast, low cost)
• New LED high bay fixture• Many form factors available
• Vapor tight versions available
Vapor Tight Fixture LED Options
• Relamp with TLED (fast, low cost)
• LED retrofit kit (better efficiency, all new parts, mid‐level cost)
• New vapor tight linear LED fixture (best efficiency and lighting distribution, most costly)
Opportunities for energy savings ‐ Lighting
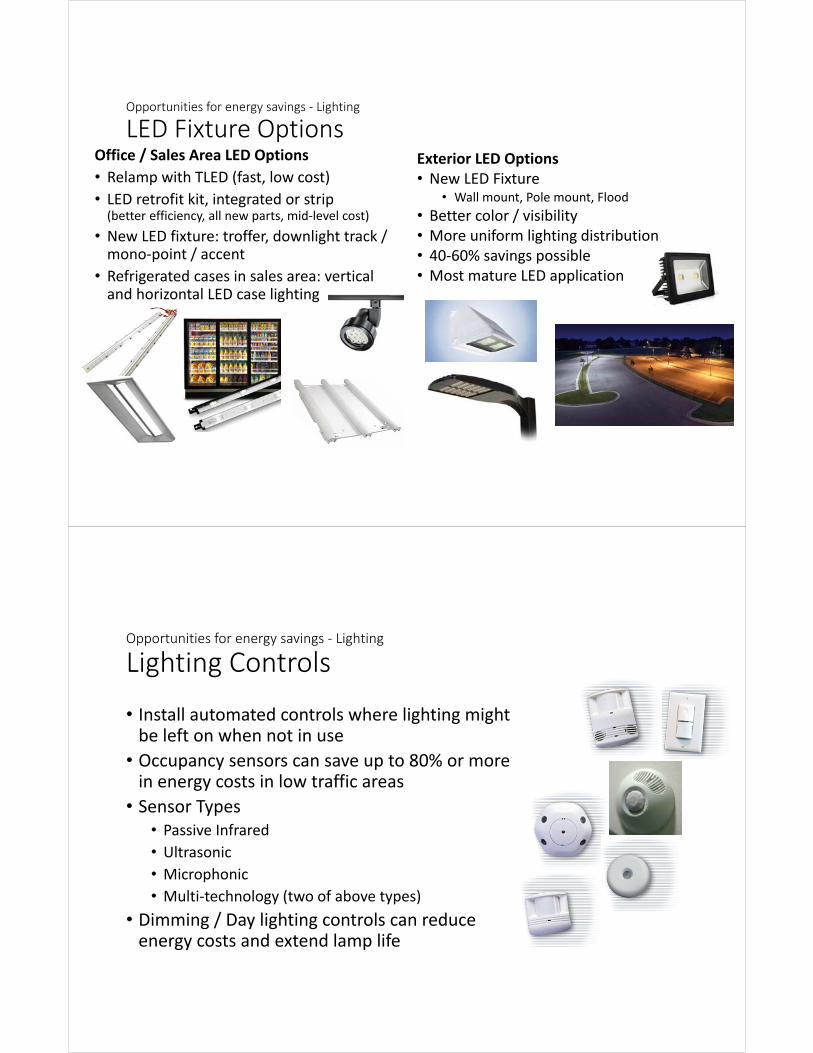
LED Fixture OptionsExterior LED Options• New LED Fixture
• Wall mount, Pole mount, Flood
• Better color / visibility• More uniform lighting distribution• 40‐60% savings possible• Most mature LED application
Office / Sales Area LED Options
• Relamp with TLED (fast, low cost)
• LED retrofit kit, integrated or strip (better efficiency, all new parts, mid‐level cost)
• New LED fixture: troffer, downlight track / mono‐point / accent
• Refrigerated cases in sales area: vertical and horizontal LED case lighting
Opportunities for energy savings ‐ Lighting
Lighting Controls
• Install automated controls where lighting might be left on when not in use
• Occupancy sensors can save up to 80% or more in energy costs in low traffic areas
• Sensor Types• Passive Infrared
• Ultrasonic
• Microphonic
• Multi‐technology (two of above types)
• Dimming / Day lighting controls can reduce energy costs and extend lamp life

Opportunities for energy savings – Lighting
Likely Opportunities
• Energy Efficiency• Fixture replacement to LED
• Refrigerated space lighting to LED
• Lighting controls
• Process heat recovery• None
Compressed AirEnergy efficient food processing: focus on refrigeration

Opportunities for energy savings – Compressed Air
How is Compressed Air Used
Photo, http://thekingsshilling.io/a-question-of-culture/Photo courtesy of Flexlink
Opportunities for energy savings – Compressed Air
Computing Full Load Energy Costs
Annual electricity cost (simple formula)
bhp x 0.746 x hours x rateMotor efficiency
Where:bhp = motor full‐load horsepower (brake horsepower)0.746 = kW/hpHours = annual hours of operation at full loadRate = electricity cost in $/kWhMotor efficiency = motor nameplate full‐load efficiency

Computing Full Load Energy Costs
Example:
100 bhp compressor, 95% efficient motor, 8,760 hours per year of operation, and $0.08/kWh electricity rate
100 bhp x 0.746 x 8,760 hours x $0.08/kWh
0.95
Annual electricity costs = $55,031 per year
Opportunities for energy savings – Compressed Air
Compressed Air Best Practice
Reduce Leaks
Lower Pressure
Low Loss Drains
Pressure Controller
New VSD Air Compressor
Heat Recovery
Proper Air Use

Opportunities for energy savings – Compressed Air
Compressed Air Best Practice
New VSD Air Compressor
Courtesy of Atlas Copco
0%
20%
40%
60%
80%
100%
120%
0% 20% 40% 60% 80% 100% 120%
% Full load
kW
% Full load CFM
Series1
Series2
Series3
Series4
Opportunities for energy savings – Compressed Air
Compressor Performance

Opportunities for energy savings – Compressed Air
Eliminating Misuse of Air
Opportunities for energy savings – Compressed Air
Rules of Thumb• Every 2 psig of pressure increases or decreases the power draw of a air compressor 1%.
• Size of control‐air receiver located after the compressor for about 1 gallon capacity per cfm of compressor capacity.
• Total compressed air drop across all components, including piping, should not exceed 15psi.
• For every 10 degree drop in intake air, reduce energy cost by 2% (Min. of 40 degrees) compressor becomes MUA unit.
• Compressor element (airend) performance can vary 20% depending on size/style; drive motor efficiency at 100 hp only varies 2%; compressor controls can result in savings of 45% (doing right way vs doing bad way).

Opportunities for energy savings – Compressed Air
Likely Opportunities
• Energy Efficiency• Leak repair
• Flow controllers with storage
• Distribution optimization
• Replace inappropriate air use with alternatives such as blowers
• Variable Speed Drives: variable loads, eliminate other forms of modulation.
• System controllers: Multiple compressor optimization.
• Process heat recovery• Space heating
Process HeatingEnergy efficient food processing: focus on refrigeration

Opportunities for energy savings – Process Heating
Why heat recovery?
• Any process that adds or removes energy from the product.
• Energy Heat
• Heat moves from hotter temperature to cooler temperature.
• Option 1 – Reduce energy in
• Option 2 – Recovery heat out
Opportunities for energy savings – Process Heating
Where’s the heat?
• Lighting• Incandescent 10 lumens/Watt• LED 50 lumens/Watt
• Compressed Air• 8:1 heat energy to air energy
• Boilers• 20% heat energy up the stack• Total heat losses in the system
• Refrigeration• How much heat is being moved compared to electric input?
• Temperature differences• From pasteurizer to refrigerator
• From steam condensate to waste water treatment
• From well water to process cooling
• From wash down to the drain
• From well water to process heating

Opportunities for energy savings – Process Heating
Where’s the heat?Food and Beverage Industrial Processes Temperature (⁰F)
Drying (food processing, breweries, dairy) 85‐435
Yogurt maturation (dairy) 105‐115
Heat treating (food processing) 105‐140
Clean‐in‐place washing, washing bottles, clothes etc. 105‐195
Solvent extraction and distillation of vegetable oil (food processing) 140‐230
Pasteurizing (food processing, breweries, dairy) 160‐250
Boiling (food processing) 200‐220
Distilling (breweries) 205‐215
Evaporating (dairy) 140‐300
Sterilizing (food processing) 285‐300
Frying (food processing) 175‐430
http://aceee.org/files/proceedings/2007/data/papers/05_2_048.pdf
Opportunities for energy savings – Process Heating
Assessing the opportunity
• Heat recovery potential is 30% to 90% of the waste heat
• Look for presence and nature of contaminants in exhaust streams
• Where will the heat be used?
• Is it physically possible to install the recovery system?
• Is the waste heat available when needed?
• Are there maintenance costs?
http://www.cleaverbrooks.com/Reference‐Center/Resource‐Library/Presentations/Index.aspx

Opportunities for energy savings – Process Heating
Likely Opportunities
• Energy Efficiency• Steam systems
• Compressed air systems
• Fans and pumps
• System enclosures
• Combustion burners
• Refrigeration systems
• Process heat recovery• Combustion air preheating
• Liquid heating
• Space heating
HVAC Heating and CoolingEnergy efficient food processing: focus on refrigeration

Opportunities for energy savings – HVAC
HVAC Heating and Cooling
Heating – boiler and heated air systems (rooftop, unit heat & air makeup)
• Efficiency gains of 10 to 15%
Cooling – chiller and direct expansion (dx) units (rooftop, split systems)
• Efficiency gains of 10 to 30%
Ventilation/exhaust/air makeup –Controls improvements (drives, sensors and damper controls)
Photo courtesy of Trane
Opportunities for energy savings – HVAC
Ventilation Concerns
• Airborne Contamination
• Negative Air Pressure• Air Turns necessary• Equipment Needed
• Air Filtration• Temperature Range
Photo courtesy of Trane
Opportunities for energy savings – HVAC
General Ventilation Requirements
• RTE (Ready to Eat) product air requirements• 20 to 25 air turns per hour.
• Air traveling from one process to the next should be 300 feet/min.
• Actual number of air movement must be designed by a competent HVAC engineer to fit the facility and the process
• The air turns per hour are important to remove:• Off odors
• Steam
• Airborne contaminants
Opportunities for energy savings – HVAC
General Ventilation Requirements
Air intake units, RTU/AHU or MUA• Intake needs to be filtered to degree needed for your operation
Exhaust Stacks• Intake openings should have noncorrosive insect screen with a half‐inch mesh cover.
• Should have hood to keep out snow, rain and prevent downdrafts
• Should not be positioned close to intake ventilation or extend higher to prevent contamination.

Opportunities for energy savings – HVAC
Ventilation Best Practice
• Air flow to start from cheese packaging area and flow to other areas
• Areas to have positive pressure to prevent drawing in any contaminates
• Airflow must be filtered
Photo Courtesy of FDA
Opportunities for energy savings – HVAC
Ventilation Equipment
• Types of ventilation you could have in your operation:1. Roof Top Units (RTU)
2. Air Handling Units (AHU)
3. Make‐up Air (MUA)
It is important to remember what purpose this equipment has and how it is maintained.

Opportunities for energy savings – HVAC
Ventilation – RTU
• Energy efficiency steps• Variable frequency drives on fan motors
• Economizers – must be maintained.
• Energy recovery ventilators (ERV)• Demand control ventilation (DCV)
• Programmable thermostats or building automation system (BAS)
Photo Courtesy of Carrier
Opportunities for energy savings – HVAC
Ventilation – AHU
• Variable frequency drives
• Outside air requirements ‐ (minimize)
• Only use necessary filter MERV levels
Photo Courtesy of FDA

Opportunities for energy savings – HVAC
Ventilation – MUA
• Only run with exhaust fans• MUA unit should be interlocked with exhaust fans.
• Filter to necessary level for your operation
• 100% OA unit or mixing box % of OAPhoto Courtesy of Trane
Opportunities for energy savings – HVAC
Likely Opportunities
• Energy Efficiency• Distribution optimization
• Duct leak repair, pipe insulation.
• Isolate heating and cooling sources (e.g. avoid placing an air compressor in a refrigerated space).
• Building envelope air sealing and fast overhead doors.
• Flow optimization• Variable pumps, variable blowers.• Exhaust filtration, demand ventilation controls.
• Efficient boilers, chillers, and other heat/cooling equipment.
• Process heat recovery• Space heating / cooling?
• Ceiling fans, 3‐way exhaust fans
• Load reduction such as free cooling / dry coolers / economizers
• Boiler makeup water preheat, combustion air preheat.

Non‐energy savings considerationsEnergy efficient food processing: focus on refrigeration
Opportunities for energy savings
Non‐energy savings considerations
Source: https://www.amazon.com/VaporTight-High-Fluorescent-Fixture-6-Lamp/dp/B005713OVO
Project criteria1. Excellent payback – often < 2 years
• Easy to determine cost savings
• Supported by incentive programs
• Refrigeration savings!
2. Highly visible projects – pun intended
• Yes we ARE going green
3. Enhanced productivity due to improved lighting
• Over or under lit
• Improved color rendering
4. Maintenance and other Non‐Energy Improvements
• Reduce cost and time spent replacing lamps and ballasts
• Wash down issues
• Mercury elimination
• Glass versus polymer materials
Non‐energy savings

Opportunities for energy savings
Non‐energy savings considerations
Source: https://trcs.wikispaces.com/ are licensed under aCreative Commons Attribution Share‐Alike Non‐Commercial 2.5 License
Other paths to project approval1. Sustainability Initiatives
2. Process Improvements
• Waste reduction
• Safety enhancement
• Productivity enhancement
3. Maintenance Improvements
• Longer equipment life
4. Improved Customer Satisfaction and Customer Ratings
Opportunities for energy savings
Non‐energy savings considerations
Source: https://focusonenergy.com/business
Have you considered…1. Confirming the cost components of your
energy bills (TOU*, Demand, Taxes)?
2. Wisconsin sales tax‐exemption for energy purchased to manufacture goods.• https://www.revenue.wi.gov/Pages/FAQS/ise‐exemptn.aspx
3. Savings by managing energy services.• Electricity demand reduction
• Power factor improvement
• Natural gas purchases from brokerage firms
4. Treating energy costs not as overhead, but as a service (i.e. measure instead of allocate).
5. Incentives from utilities and government.• http://www.dsireusa.org/
*Note: TOU = Time of Use, may include Peak/Off‐Peak costs.Also includes Seasonal, Load Factor and other costs.

For the next 5 years, would you rather commit to:
or
Example is based upon a 5% sales margin.
Opportunities for energy savings
Non‐energy savings considerations
Do one project that saves $6,400 in energy costs/year
Sell an additional $128,000 of product/year?
Case StudiesEnergy efficient food processing: focus on refrigeration

Case Studies Agenda
Heat recovery
Compressed air
Burner efficiency
Case Study
Heat Recovery – Gilman Cheese
Energy Efficiency Improvements:1. Boiler Stack Economizer2. Boiler Blow Down Heat Recovery3. Repair or Replace Steam Traps4. Insulate Steam Piping and Boiler Make‐Up
Tank5. Reduce System Steam Pressure6. Eliminate Air Exhausts7. Replace Unit Heaters with Direct‐Fired
Make‐Up‐Air in Cheese Making Area8. Install Air Compressor Heat Recovery
Source: Focus on Energy’s Jeff Danielson and Gilman Cheese

Case Study
Heat Recovery – Gilman Cheese
Other Energy Efficiency Improvements:
Compressed Air:• Reduce Compressed Air Pressure
• Repair Compressed Air Leaks
• Install VFD Air Compressor
• Replace Inappropriate Compressed Air Usage with Blowers
• Install Air Compressor Heat Recovery
Lighting:• Upgrade T12 Lighting in Facility
Photo courtesy of Gilman Cheese
Case Study
Heat Recovery – Gilman Cheese
Gilman Cheese makes a variety of products including flavored, smoked, low‐fat, and no‐fat cheeses for private label, direct sale, and the gift pack industry.
Processes include melting and blending, flavoring and smoking, and a full line of cutting and packaging lines.
Project Results:• Overall ongoing energy reduction is ~20%!• Overall simple payback on projects is 2.5 years.• Water cooled to air cooled refrigeration changeover reduced water usage 50%.
• Integrated with energy and water savings projects was a reduction of product waste of 8%.
• Award Winner WMC Business Friend of the Environment Photo courtesy of Gilman Cheese

Case Study
Compressed Air – Mead‐Johnson NutritionalsEnergy Efficiency Improvements:
1. Optimized use of three 300‐hp lubricant‐free rotary screw compressors, producing up to 3,000 scfm with discharge pressures between 95 and 105 psig.
2. Installed centralized compressor control system to allow the compressors to work together.
3. Increase air storage from 1000‐gallon receiver to compensate for intermittent retort purge process.
4. Resolved 10 to 15 psig pressure drop due to constricted flow through air filtration system.
5. Repaired air leaks due to old piping and loose fittings that consumed one‐third of air systems’ peak output (1000 scfm).
Mead‐Johnson Nutritionals, a subsidiary of Bristol‐Myers Squibb. Project at Evansville, IN plant that produces infant formulas and adult nutritional supplements. Compressed air supports packing machines, actuators, and sterilizer retort purges.
Project Results:
• Overall ongoing savings of 2,542,000 kWh annually
• Project cost of $412,000 ($264,000 after rebate)
• Annual energy savings of $102,000
• Overall simple payback is 2.6 years.
• Avoided alternative of purchasing more compressed air capacity. Source: https://www.nrel.gov/docs/fy01osti/30231.pdf
Case Study
Burner Upgrade – JR SimplotEnergy Efficiency Improvements:
1. Evaluated steam system with DOE’s Steam System Assessment Tool (SSAT)
2. Replaced burners with high‐efficiency units.
3. Reduced excess combustion air from 50% to 10% by adding oxygen trim equipment to optimize air‐to‐fuel ratio.
4. Increased condensate recovery rate to 50% while taking five condensate pumps off‐line.
JR Simplot is a $3 Billion food and agribusiness corporation. Project at Caldwell, ID, plant that produces 270 million pounds of frozen French fries per year. Steam supports potato peeling, blanching and frying processes.
Project Results:• Overall ongoing savings of 520,000 therms and 526,000 kWh annually• Project cost of $373,000• Annual energy and maintenance savings of $329,000• Overall simple payback is 1.1 years.
Source: https://energy.gov/sites/prod/files/2014/05/f16/simplotburnercasestudy.

Process Load Reduction Agenda
•Doorway infiltration basics and door technologies
•Regeneration effectiveness in high temperature/short time pasteurization
Industrial refrigeration system and technologiesEnergy efficient food processing: focus on refrigeration

Question and answerEnergy efficient food processing: focus on refrigeration
Resources
• Focus on Energy’s Dairy Process Guidebook https://focusonenergy.com/sites/default/files/dairyprocess_guidebook.pdf
• Travis, Rob. “Industrial refrigeration energy‐saving best practices” video series, Seventhwave.org 2016
• Industrial Refrigeration Consortium (IRC) Industrial Refrigeration Energy Efficiency Guidebook www.irc.wisc.edu/

Resources
• Compressed Air and Gas Institute
www.cagi.org
• Compressed Air Challenge
www.compressedairchallenge.org
• U.S. Department of Energy Industrial Technologies Programwww1.eere.energy.gov/industry/bestpractices
• Food and Drug Administration Center for Food Safety and Applied Nutritional Division of Cooperative Programs Milk Safety Branch. 1986. Dairy Products Initiatives Preliminary Status Report. Washington, DC.
• Don Graham, president of Graham Sanitary Design Consulting, LLC. [email protected] or 517‐796‐1733
Resources
Basic Relationships
• POWER
• Watts (single phase) = Volts * Amps * PF
• Watts (3 phase) = Volts * Amps * 1.732 * PF
• PF – Power Factor; real vs. apparent power
• HP to kW conversion
• 1 HP = 0.7456 kW

Resources
Typical Motor Loading
• Most motors are sized to run at 80% of full load for safety
• At 80% load the current ≈ 80%, voltage is constant so power ≈ 80%
• An overloaded motor will not be able to manage the heat and will fail prematurely
• Some motors have a service factor which is a multiplier for maximum safe load vs. rated hp (10 hp motor w/ SF 1.2)
Energy efficient food processing: focus on refrigeration
Food Manufacturing Industry