Embed Size (px)
Citation preview
Energy-E�icient Mobile Network I/O Optimizationat the Application Layer
Kemal Guner*, MD S Q Zulkar Nine*, Tev�k Kosar*, M. Fatih Bulut‡
* University at Bu�alo (SUNY)‡IBM Thomas J. Watson Research Center
{kemalgne, mdsqzulk, tkosar}@bu�alo.edu, [email protected]
ABSTRACTMobile data tra�c (cellular + WiFi) will exceed PC Internettra�c by 2020. As the number of smartphone users and theamount of data transferred per smartphone grow exponen-tially, limited battery power is becoming an increasinglycritical problem for mobile devices which depend on thenetwork I/O. Despite the growing body of research in powermanagement techniques for the mobile devices at the hard-ware layer as well as the lower layers of the networking stack,there has been little work focusing on saving energy at theapplication layer for the mobile systems during network I/O.In this paper, to the best of our knowledge, we are �rst to pro-vide an in-depth analysis of the e�ects of application-layerdata transfer protocol parameters on the energy consump-tion of mobile phones. We propose a novel model, calledFastHLA, that can achieve signi�cant energy savings at theapplication layer during mobile network I/O without sacri-�cing the performance. In many cases, our model achievesperformance increase and energy saving simultaneously.
KEYWORDSMobile computing; energy e�ciency; application-layer pro-tocol tuning; throughput optimization.
1 INTRODUCTIONIt is estimated that smartphone mobile data tra�c (cellular +WiFi) will reach 370 Exabytes per year by 2020, exceedingPC Internet tra�c the �rst time in the history [57]. An av-erage smartphone consumes between 300 – 1200 milliwattspower [14] depending on the type of applications it is run-ning, and most of the energy in smartphone applicationsis spent for networked I/O. During an active data transfer,the cellular (i.e., GSM) and WiFi components of a smart-phone consume more power than its CPU, RAM, and evenLCD+graphics card at the highest brightness level [14, 48].Although the mobile data tra�c and the amount of energyspent for it increase at a very fast pace, the battery capacitiesof smartphones do not increase at the same rate.
Limited battery power is becoming an increasingly crit-ical problem for smartphones and mobile computing, andmany techniques have been proposed in the literature toovercome this at di�erent layers. At the physical layer, tech-niques were proposed to choose appropriate modulation,coding, and transmission power control schemes to improveenergy e�ciency of the mobile device [17, 19, 52, 54, 58]. Atthe media access control (MAC) layer, several new energy-e�cient MAC protocol designs were proposed [13, 39, 39,46, 63, 64, 67]. At the network layer, low-power and scal-able routing algorithms were developed [16, 53, 55, 59, 66].At the transport layer, tra�c shaping techniques [5] andnew transport protocols [5, 15, 24, 40, 77] were proposed toexploit application-speci�c information and reduce powerutilization.
Despite the growing body of research in power manage-ment techniques for the lower layers of the mobile network-ing stack, there has been little work focusing on saving net-work I/O (data transfer) energy at the application layer. Themost notable work in this area are: tuning the client play-back bu�er size during media streaming in order to minimizethe total energy spent [11]; using lossless compression tech-niques to minimize the amount of data transferred as wellas the energy consumed on wireless devices [65]; and jointoptimization of the application layer, data link layer, andphysical layer of the protocol stack using an application-oriented objective function in order to improve multimediaquality and power consumption at the same time [29]. Weclaim that signi�cant amount of network I/O energy sav-ings can be obtained at the application layer with no orminimal performance penalty. Although lower-layer net-work stack approaches are an important part of the solution,application-layer power management is another key to opti-mizing network I/O energy e�ciency in mobile computing,as a complementary approach to the optimizations at thelower layers of the networking stack.
In this paper, we analyze the e�ects of di�erent application-layer data transfer protocol parameters (such as the numberof parallel data streams per �le, the level of concurrent �letransfers to �ll the mobile network pipes, and the I/O request
arX
iv:1
805.
0861
6v1
[cs
.NI]
19
May
201
8
size) on mobile data transfer throughput and energy con-sumption. Then, we propose a novel model that can achievesigni�cant energy savings at the application layer duringmobile network I/O without sacri�cing the performance.
In summary, our contributions within this paper are thefollowing:
• To the best of our knowledge, we are �rst to providean in depth analysis of the e�ects of application-layer data transfer protocol parameters on the energyconsumption of mobile phones.• We propose a novel historical-data analysis based
model, called FastHLA, that can achieve signi�cantenergy savings at the application layer during mobilenetwork I/O without sacri�cing the performance.• We show that our FastHLA model can achieve sig-
ni�cant energy savings using only application-layersolutions at the mobile systems during data transferwith no or minimal performance penalty.• We also show that, in many cases, our FastHLA
model can increase the performance and save en-ergy simultaneously.
The rest of this paper is organized as follows: Section IIpresents background information on energy-aware tuningof application-layer data transfer protocol parameters anddiscusses the related work in this area; Section III providesthe methodology of our analysis; Section IV presents an in-depth experimental analysis of the application-layer param-eter e�ects on mobile data transfer performance and energyconsumption; Section V introduces our novel FastHLA modeland compares it to the competing approaches; and SectionVI concludes the paper.
2 BACKGROUNDThe majority of work on mobile device energy savings mostlyfocuses putting the devices to sleep during idle times [39,51, 60, 61]. A recent study by Dogar et al. [22] takes thisapproach to another step, and puts the device into sleep evenduring data transfer by exploiting the high-bandwidth wire-less interface. They combine small gaps between packetsinto meaningful sleep intervals, thereby allowing the NIC aswell as the device to doze o�. Another track of study in thisarea focuses on switching among multiple radio interfaces inan attempt to reduce the overall power consumption of themobile device [10, 18, 47, 49]. These techniques are orthogo-nal to our application-layer protocol tuning approach andcould be used together to achieve higher energy e�ciencyin the mobile systems.
The closest work to ours in the literature is the work byBertozzi et al. [12], in which they investigate the energytrade-o� in mobile networking as a function of the TCP
receive bu�er size and show that the TCP bu�ering mech-anisms can be exploited to signi�cantly increase energy ef-�ciency of the transport layer with minimum performanceoverheads.
In this work, we focus on the tuning of three di�erentprotocol parameters: concurrency (the level of concurrent�le transfers to �ll the mobile network pipes), parallelism(the number of parallel data streams per �le), and I/O requestsize.Concurrency refers to sending multiple �les simultane-
ously through the network using di�erent data channels atthe same time. Most studies in this area do not take the datasize and the network characteristics into consideration whensetting the concurrency level [33, 36, 38, 72]. Liu et al. [42]adapt the concurrency level based on the changes in the net-work tra�c, but do not take into account other bottlenecksthat can occur on the end systems.Parallelism sends di�erent chunks of the same �le using
di�erent data channels (i.e., TCP streams) at the same timeand achieves high throughput by mimicking the behavior ofindividual streams and getting a higher share of the avail-able bandwidth [9, 23, 26, 27, 41, 43, 56, 69, 71, 74]. On theother hand, using too many simultaneous connections con-gests the network and the throughput starts dropping down.Predicting the optimal parallel stream number for a speci�csetting is a very challenging problem due to the dynamicnature of the interfering background tra�c. Hacker et al.claimed that the total number of streams behaves like onegiant stream that transfers in total capacity of each streams’achievable throughput [25]. However, this model only worksfor uncongested networks, since it accepts that packet lossratio is stable and does not increase as the number of streamsincreases. Dinda et al. modeled the bandwidth of multiplestreams as a partial second order polynomial which needstwo di�erent real-time throughput measurements to provideaccurate predictions [44].
I/O request size is the size of request that application usesto perform I/O operation on storage device. The I/O requestsize may have a big impact on the storage performance, andalso on the end-to-end data transfer performance if the endsystem storage throughput is the main bottleneck.
When used wisely, these parameters have a potential toimprove the end-to-end data transfer performance at a greatextent, but improper use of these parameters can also hurtthe performance of the data transfers due to increased load atthe end-systems and congested links in the network [70, 73].For this reason, it is crucial to �nd the best combination forthese parameters with the least intrusion and overhead tothe system resource utilization and power consumption.
In the literature, several highly-accurate predictive mod-els [30, 31, 75, 76] were developed which would require as fewas three sampling points to provide very accurate predictions
2
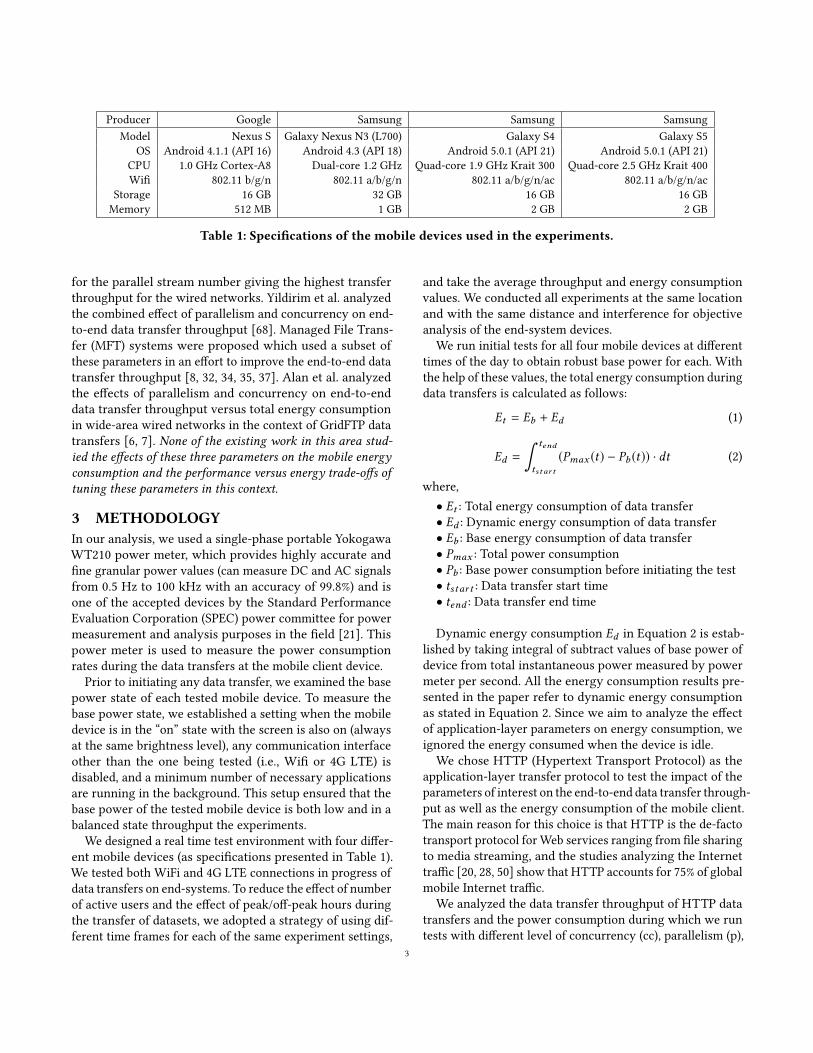
Producer Google Samsung Samsung SamsungModel Nexus S Galaxy Nexus N3 (L700) Galaxy S4 Galaxy S5
OS Android 4.1.1 (API 16) Android 4.3 (API 18) Android 5.0.1 (API 21) Android 5.0.1 (API 21)CPU 1.0 GHz Cortex-A8 Dual-core 1.2 GHz Quad-core 1.9 GHz Krait 300 Quad-core 2.5 GHz Krait 400Wi� 802.11 b/g/n 802.11 a/b/g/n 802.11 a/b/g/n/ac 802.11 a/b/g/n/ac
Storage 16 GB 32 GB 16 GB 16 GBMemory 512 MB 1 GB 2 GB 2 GB
Table 1: Speci�cations of the mobile devices used in the experiments.
for the parallel stream number giving the highest transferthroughput for the wired networks. Yildirim et al. analyzedthe combined e�ect of parallelism and concurrency on end-to-end data transfer throughput [68]. Managed File Trans-fer (MFT) systems were proposed which used a subset ofthese parameters in an e�ort to improve the end-to-end datatransfer throughput [8, 32, 34, 35, 37]. Alan et al. analyzedthe e�ects of parallelism and concurrency on end-to-enddata transfer throughput versus total energy consumptionin wide-area wired networks in the context of GridFTP datatransfers [6, 7]. None of the existing work in this area stud-ied the e�ects of these three parameters on the mobile energyconsumption and the performance versus energy trade-o�s oftuning these parameters in this context.
3 METHODOLOGYIn our analysis, we used a single-phase portable YokogawaWT210 power meter, which provides highly accurate and�ne granular power values (can measure DC and AC signalsfrom 0.5 Hz to 100 kHz with an accuracy of 99.8%) and isone of the accepted devices by the Standard PerformanceEvaluation Corporation (SPEC) power committee for powermeasurement and analysis purposes in the �eld [21]. Thispower meter is used to measure the power consumptionrates during the data transfers at the mobile client device.
Prior to initiating any data transfer, we examined the basepower state of each tested mobile device. To measure thebase power state, we established a setting when the mobiledevice is in the “on” state with the screen is also on (alwaysat the same brightness level), any communication interfaceother than the one being tested (i.e., Wi� or 4G LTE) isdisabled, and a minimum number of necessary applicationsare running in the background. This setup ensured that thebase power of the tested mobile device is both low and in abalanced state throughput the experiments.
We designed a real time test environment with four di�er-ent mobile devices (as speci�cations presented in Table 1).We tested both WiFi and 4G LTE connections in progress ofdata transfers on end-systems. To reduce the e�ect of numberof active users and the e�ect of peak/o�-peak hours duringthe transfer of datasets, we adopted a strategy of using dif-ferent time frames for each of the same experiment settings,
and take the average throughput and energy consumptionvalues. We conducted all experiments at the same locationand with the same distance and interference for objectiveanalysis of the end-system devices.
We run initial tests for all four mobile devices at di�erenttimes of the day to obtain robust base power for each. Withthe help of these values, the total energy consumption duringdata transfers is calculated as follows:
Et = Eb + Ed (1)
Ed =
∫ tend
tstar t(Pmax (t) − Pb (t)) · dt (2)
where,• Et : Total energy consumption of data transfer• Ed : Dynamic energy consumption of data transfer• Eb : Base energy consumption of data transfer• Pmax : Total power consumption• Pb : Base power consumption before initiating the test• tstar t : Data transfer start time• tend : Data transfer end time
Dynamic energy consumption Ed in Equation 2 is estab-lished by taking integral of subtract values of base power ofdevice from total instantaneous power measured by powermeter per second. All the energy consumption results pre-sented in the paper refer to dynamic energy consumptionas stated in Equation 2. Since we aim to analyze the e�ectof application-layer parameters on energy consumption, weignored the energy consumed when the device is idle.
We chose HTTP (Hypertext Transport Protocol) as theapplication-layer transfer protocol to test the impact of theparameters of interest on the end-to-end data transfer through-put as well as the energy consumption of the mobile client.The main reason for this choice is that HTTP is the de-factotransport protocol for Web services ranging from �le sharingto media streaming, and the studies analyzing the Internettra�c [20, 28, 50] show that HTTP accounts for 75% of globalmobile Internet tra�c.
We analyzed the data transfer throughput of HTTP datatransfers and the power consumption during which we runtests with di�erent level of concurrency (cc), parallelism (p),
3
Dataset Name Ave. File Size Min-MaxHTML 112 KB 56 KB - 155 KB
IMAGE 2.7 MB 2 MB - 3.2 MBVIDEO-small 152 MB 140 MB - 167 MB
VIDEO-medium 3 GB 2.86 GB - 3.1 GBVIDEO-large 10GB 9.7 GB - 10.2 GB
Table 2: Characteristics of the dataset used in the experiments.
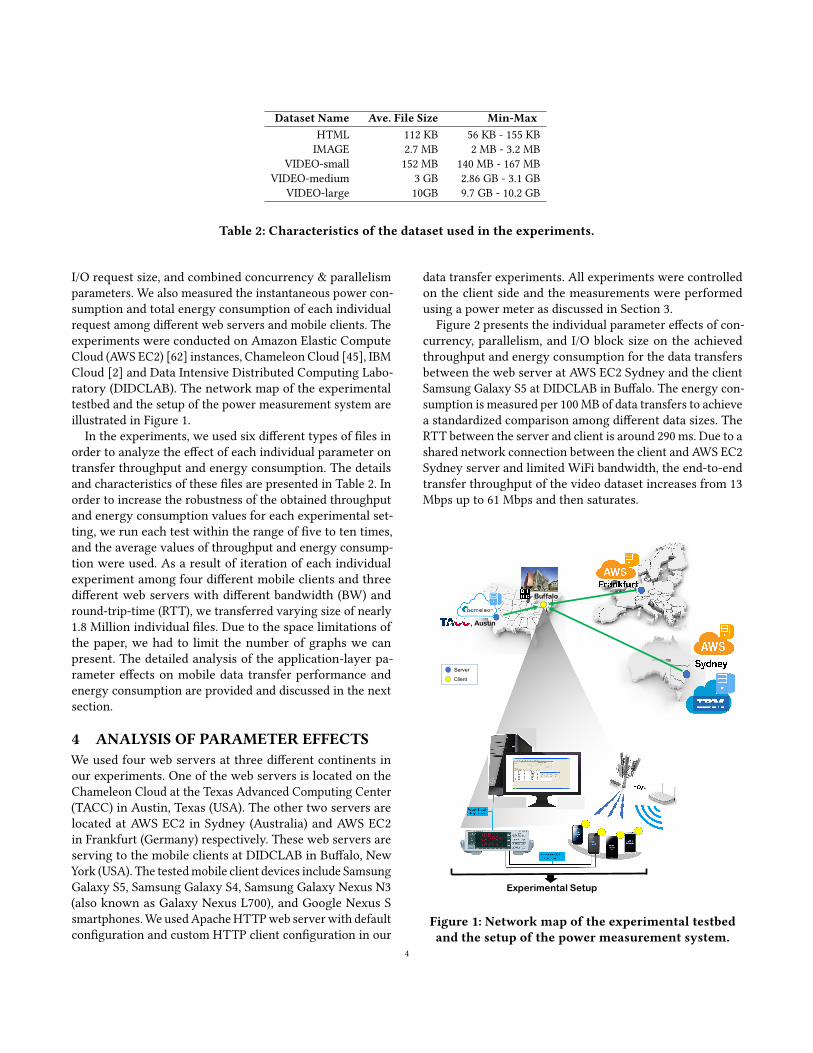
I/O request size, and combined concurrency & parallelismparameters. We also measured the instantaneous power con-sumption and total energy consumption of each individualrequest among di�erent web servers and mobile clients. Theexperiments were conducted on Amazon Elastic ComputeCloud (AWS EC2) [62] instances, Chameleon Cloud [45], IBMCloud [2] and Data Intensive Distributed Computing Labo-ratory (DIDCLAB). The network map of the experimentaltestbed and the setup of the power measurement system areillustrated in Figure 1.
In the experiments, we used six di�erent types of �les inorder to analyze the e�ect of each individual parameter ontransfer throughput and energy consumption. The detailsand characteristics of these �les are presented in Table 2. Inorder to increase the robustness of the obtained throughputand energy consumption values for each experimental set-ting, we run each test within the range of �ve to ten times,and the average values of throughput and energy consump-tion were used. As a result of iteration of each individualexperiment among four di�erent mobile clients and threedi�erent web servers with di�erent bandwidth (BW) andround-trip-time (RTT), we transferred varying size of nearly1.8 Million individual �les. Due to the space limitations ofthe paper, we had to limit the number of graphs we canpresent. The detailed analysis of the application-layer pa-rameter e�ects on mobile data transfer performance andenergy consumption are provided and discussed in the nextsection.
4 ANALYSIS OF PARAMETER EFFECTSWe used four web servers at three di�erent continents inour experiments. One of the web servers is located on theChameleon Cloud at the Texas Advanced Computing Center(TACC) in Austin, Texas (USA). The other two servers arelocated at AWS EC2 in Sydney (Australia) and AWS EC2in Frankfurt (Germany) respectively. These web servers areserving to the mobile clients at DIDCLAB in Bu�alo, NewYork (USA). The tested mobile client devices include SamsungGalaxy S5, Samsung Galaxy S4, Samsung Galaxy Nexus N3(also known as Galaxy Nexus L700), and Google Nexus Ssmartphones. We used Apache HTTP web server with defaultcon�guration and custom HTTP client con�guration in our
data transfer experiments. All experiments were controlledon the client side and the measurements were performedusing a power meter as discussed in Section 3.
Figure 2 presents the individual parameter e�ects of con-currency, parallelism, and I/O block size on the achievedthroughput and energy consumption for the data transfersbetween the web server at AWS EC2 Sydney and the clientSamsung Galaxy S5 at DIDCLAB in Bu�alo. The energy con-sumption is measured per 100 MB of data transfers to achievea standardized comparison among di�erent data sizes. TheRTT between the server and client is around 290 ms. Due to ashared network connection between the client and AWS EC2Sydney server and limited WiFi bandwidth, the end-to-endtransfer throughput of the video dataset increases from 13Mbps up to 61 Mbps and then saturates.
Server
Client
, Austin
Experimental Setup
Buffalo
Figure 1: Network map of the experimental testbedand the setup of the power measurement system.
4
0
10
20
30
40
50
60
70
80
0 5 10 15 20 25 30 35
Thro
ughput (M
bps)
cc-level
a) Concurrency (Throughput)
htmlimagevideo
0
5
10
15
20
25
0 5 10 15 20 25 30 35
Thro
ughput (M
bps)
p-level
c) Parallelism (Throughput)
htmlimagevideo
2 4 6 8
10 12 14 16 18 20
1KB2KB
4KB8KB
16KB
32KB
64KB
Thro
ughput (M
bps)
I/O size
e) I/O size vs Throughput
htmlimagevideo
30 40 50 60 70 80 90
100 110 120
0 5 10 15 20 25 30 35
Energ
y (
Joule
) per
100 M
B
cc-level
b) Concurrency (Energy Consumption)
htmlimagevideo
0
100
200
300
400
500
600
0 5 10 15 20 25 30 35
Energ
y (
Joule
) per
100 M
B
p-level
d) Parallelism (Energy Consumption)
htmlimagevideo
50
60
70
80
90
100
110
120
1KB2KB
4KB8KB
16KB
32KB
64KB
Energ
y (
Joule
) per
100 M
B
I/O size
f) I/O size vs Energy Consumption
htmlimagevideo
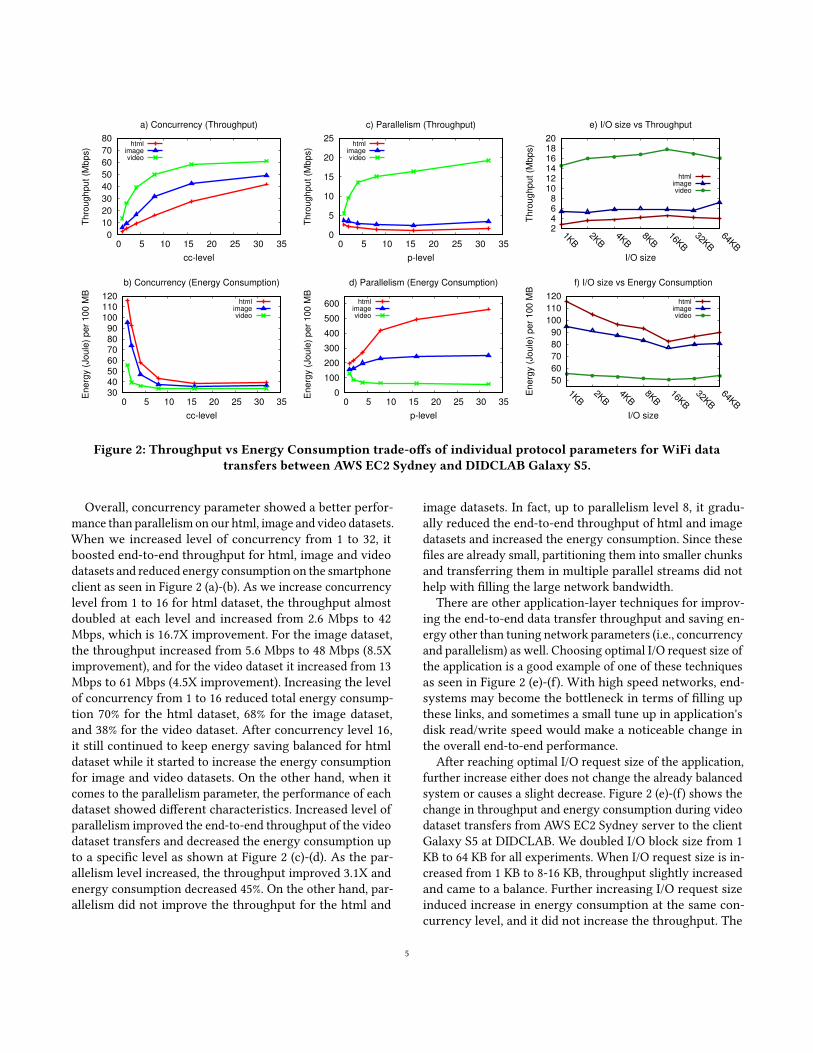
Figure 2: Throughput vs Energy Consumption trade-o�s of individual protocol parameters for WiFi datatransfers between AWS EC2 Sydney and DIDCLAB Galaxy S5.
Overall, concurrency parameter showed a better perfor-mance than parallelism on our html, image and video datasets.When we increased level of concurrency from 1 to 32, itboosted end-to-end throughput for html, image and videodatasets and reduced energy consumption on the smartphoneclient as seen in Figure 2 (a)-(b). As we increase concurrencylevel from 1 to 16 for html dataset, the throughput almostdoubled at each level and increased from 2.6 Mbps to 42Mbps, which is 16.7X improvement. For the image dataset,the throughput increased from 5.6 Mbps to 48 Mbps (8.5Ximprovement), and for the video dataset it increased from 13Mbps to 61 Mbps (4.5X improvement). Increasing the levelof concurrency from 1 to 16 reduced total energy consump-tion 70% for the html dataset, 68% for the image dataset,and 38% for the video dataset. After concurrency level 16,it still continued to keep energy saving balanced for htmldataset while it started to increase the energy consumptionfor image and video datasets. On the other hand, when itcomes to the parallelism parameter, the performance of eachdataset showed di�erent characteristics. Increased level ofparallelism improved the end-to-end throughput of the videodataset transfers and decreased the energy consumption upto a speci�c level as shown at Figure 2 (c)-(d). As the par-allelism level increased, the throughput improved 3.1X andenergy consumption decreased 45%. On the other hand, par-allelism did not improve the throughput for the html and
image datasets. In fact, up to parallelism level 8, it gradu-ally reduced the end-to-end throughput of html and imagedatasets and increased the energy consumption. Since these�les are already small, partitioning them into smaller chunksand transferring them in multiple parallel streams did nothelp with �lling the large network bandwidth.
There are other application-layer techniques for improv-ing the end-to-end data transfer throughput and saving en-ergy other than tuning network parameters (i.e., concurrencyand parallelism) as well. Choosing optimal I/O request size ofthe application is a good example of one of these techniquesas seen in Figure 2 (e)-(f). With high speed networks, end-systems may become the bottleneck in terms of �lling upthese links, and sometimes a small tune up in application'sdisk read/write speed would make a noticeable change inthe overall end-to-end performance.
After reaching optimal I/O request size of the application,further increase either does not change the already balancedsystem or causes a slight decrease. Figure 2 (e)-(f) shows thechange in throughput and energy consumption during videodataset transfers from AWS EC2 Sydney server to the clientGalaxy S5 at DIDCLAB. We doubled I/O block size from 1KB to 64 KB for all experiments. When I/O request size is in-creased from 1 KB to 8-16 KB, throughput slightly increasedand came to a balance. Further increasing I/O request sizeinduced increase in energy consumption at the same con-currency level, and it did not increase the throughput. The
5
0
10
20
30
40
50
0 5 10 15 20 25 30 35
Th
rou
gh
pu
t (M
bp
s)
cc-level
a) Concurrency (Throughput)
htmlimagevideo
50
100
150
200
250
300
350
400
450
0 5 10 15 20 25 30 35
En
erg
y (
Jo
ule
) p
er
10
0 M
B
cc-level
b) Concurrency (Energy Consumption)
htmlimagevideo
0
5
10
15
20
0 5 10 15 20 25 30 35
Th
rou
gh
pu
t (M
bp
s)
p-level
c) Parallelism (Throughput)
htmlimagevideo
100
200
300
400
500
600
700
800
900
0 5 10 15 20 25 30 35E
ne
rgy (
Jo
ule
) p
er
10
0 M
B
p-level
d) Parallelism (Energy Consumption)
htmlimagevideo
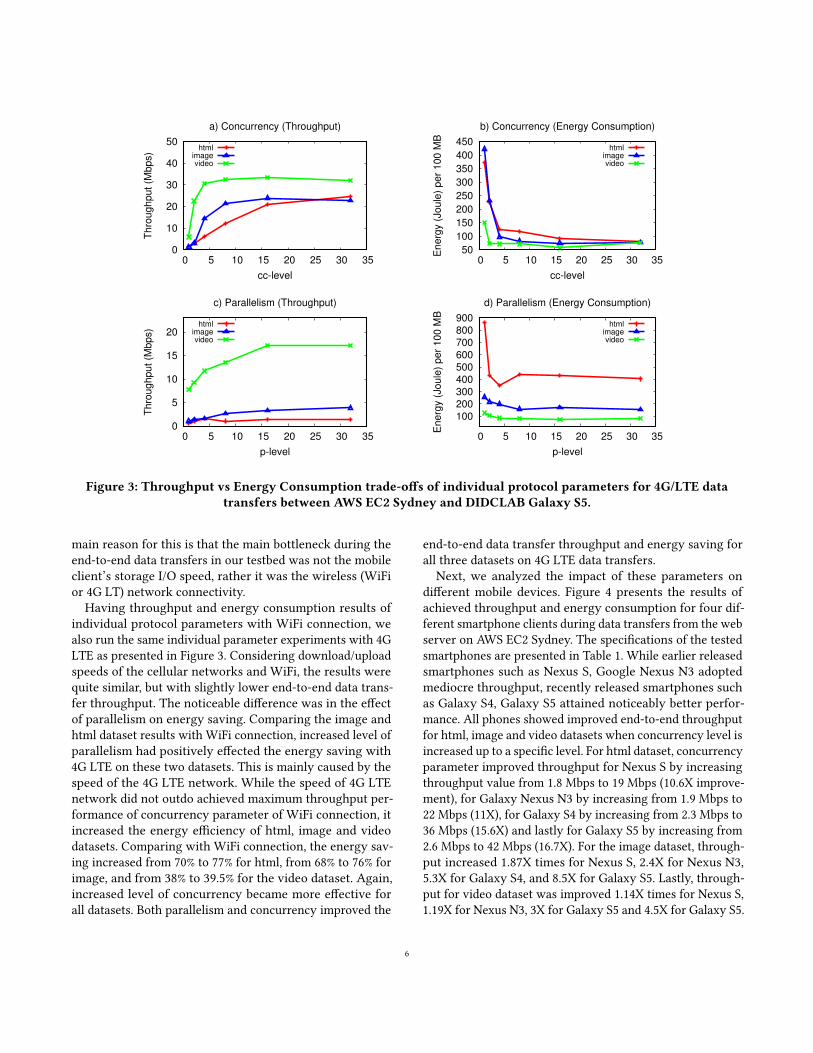
Figure 3: Throughput vs Energy Consumption trade-o�s of individual protocol parameters for 4G/LTE datatransfers between AWS EC2 Sydney and DIDCLAB Galaxy S5.
main reason for this is that the main bottleneck during theend-to-end data transfers in our testbed was not the mobileclient’s storage I/O speed, rather it was the wireless (WiFior 4G LT) network connectivity.
Having throughput and energy consumption results ofindividual protocol parameters with WiFi connection, wealso run the same individual parameter experiments with 4GLTE as presented in Figure 3. Considering download/uploadspeeds of the cellular networks and WiFi, the results werequite similar, but with slightly lower end-to-end data trans-fer throughput. The noticeable di�erence was in the e�ectof parallelism on energy saving. Comparing the image andhtml dataset results with WiFi connection, increased level ofparallelism had positively e�ected the energy saving with4G LTE on these two datasets. This is mainly caused by thespeed of the 4G LTE network. While the speed of 4G LTEnetwork did not outdo achieved maximum throughput per-formance of concurrency parameter of WiFi connection, itincreased the energy e�ciency of html, image and videodatasets. Comparing with WiFi connection, the energy sav-ing increased from 70% to 77% for html, from 68% to 76% forimage, and from 38% to 39.5% for the video dataset. Again,increased level of concurrency became more e�ective forall datasets. Both parallelism and concurrency improved the
end-to-end data transfer throughput and energy saving forall three datasets on 4G LTE data transfers.
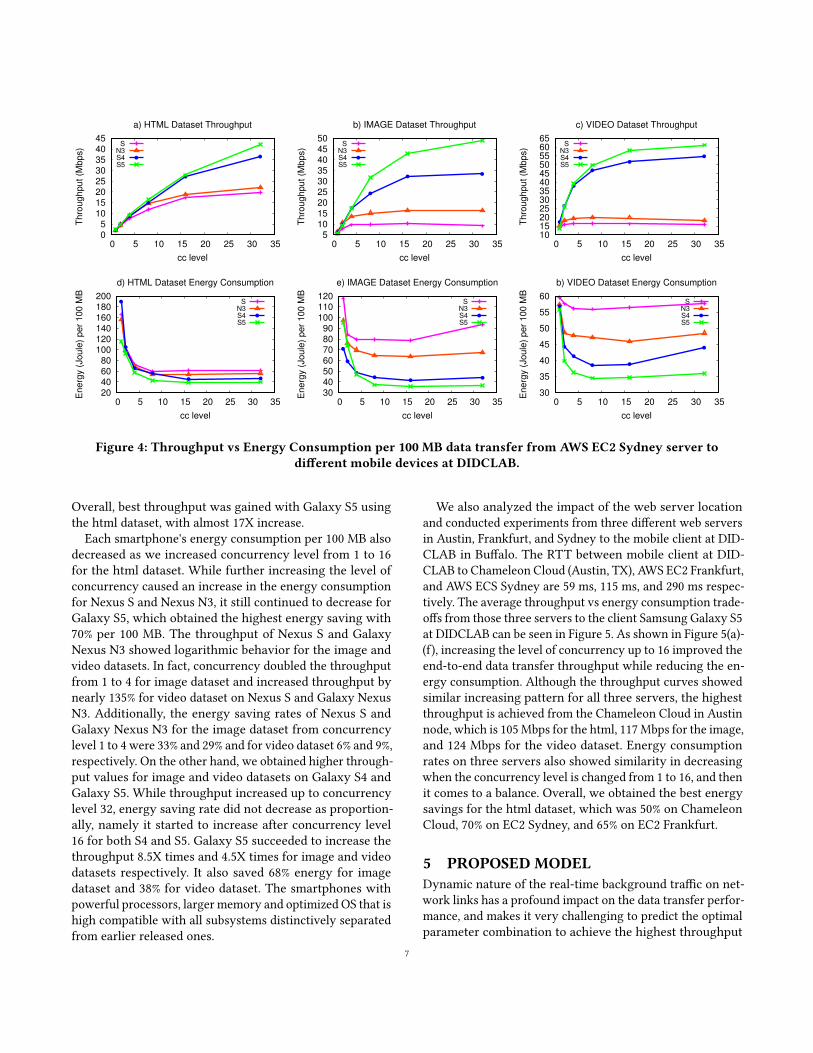
Next, we analyzed the impact of these parameters ondi�erent mobile devices. Figure 4 presents the results ofachieved throughput and energy consumption for four dif-ferent smartphone clients during data transfers from the webserver on AWS EC2 Sydney. The speci�cations of the testedsmartphones are presented in Table 1. While earlier releasedsmartphones such as Nexus S, Google Nexus N3 adoptedmediocre throughput, recently released smartphones suchas Galaxy S4, Galaxy S5 attained noticeably better perfor-mance. All phones showed improved end-to-end throughputfor html, image and video datasets when concurrency level isincreased up to a speci�c level. For html dataset, concurrencyparameter improved throughput for Nexus S by increasingthroughput value from 1.8 Mbps to 19 Mbps (10.6X improve-ment), for Galaxy Nexus N3 by increasing from 1.9 Mbps to22 Mbps (11X), for Galaxy S4 by increasing from 2.3 Mbps to36 Mbps (15.6X) and lastly for Galaxy S5 by increasing from2.6 Mbps to 42 Mbps (16.7X). For the image dataset, through-put increased 1.87X times for Nexus S, 2.4X for Nexus N3,5.3X for Galaxy S4, and 8.5X for Galaxy S5. Lastly, through-put for video dataset was improved 1.14X times for Nexus S,1.19X for Nexus N3, 3X for Galaxy S5 and 4.5X for Galaxy S5.
6
0 5
10 15 20 25 30 35 40 45
0 5 10 15 20 25 30 35
Thro
ughput (M
bps)
cc level
a) HTML Dataset Throughput
SN3S4S5
5 10 15 20 25 30 35 40 45 50
0 5 10 15 20 25 30 35
Thro
ughput (M
bps)
cc level
b) IMAGE Dataset Throughput
SN3S4S5
10 15 20 25 30 35 40 45 50 55 60 65
0 5 10 15 20 25 30 35
Thro
ughput (M
bps)
cc level
c) VIDEO Dataset Throughput
SN3S4S5
20 40 60 80
100 120 140 160 180 200
0 5 10 15 20 25 30 35
Energ
y (
Joule
) per
100 M
B
cc level
d) HTML Dataset Energy Consumption
SN3S4S5
30 40 50 60 70 80 90
100 110 120
0 5 10 15 20 25 30 35
Energ
y (
Joule
) per
100 M
B
cc level
e) IMAGE Dataset Energy Consumption
SN3S4S5
30
35
40
45
50
55
60
0 5 10 15 20 25 30 35
Energ
y (
Joule
) per
100 M
B
cc level
b) VIDEO Dataset Energy Consumption
SN3S4S5
Figure 4: Throughput vs Energy Consumption per 100 MB data transfer from AWS EC2 Sydney server todi�erent mobile devices at DIDCLAB.
Overall, best throughput was gained with Galaxy S5 usingthe html dataset, with almost 17X increase.
Each smartphone's energy consumption per 100 MB alsodecreased as we increased concurrency level from 1 to 16for the html dataset. While further increasing the level ofconcurrency caused an increase in the energy consumptionfor Nexus S and Nexus N3, it still continued to decrease forGalaxy S5, which obtained the highest energy saving with70% per 100 MB. The throughput of Nexus S and GalaxyNexus N3 showed logarithmic behavior for the image andvideo datasets. In fact, concurrency doubled the throughputfrom 1 to 4 for image dataset and increased throughput bynearly 135% for video dataset on Nexus S and Galaxy NexusN3. Additionally, the energy saving rates of Nexus S andGalaxy Nexus N3 for the image dataset from concurrencylevel 1 to 4 were 33% and 29% and for video dataset 6% and 9%,respectively. On the other hand, we obtained higher through-put values for image and video datasets on Galaxy S4 andGalaxy S5. While throughput increased up to concurrencylevel 32, energy saving rate did not decrease as proportion-ally, namely it started to increase after concurrency level16 for both S4 and S5. Galaxy S5 succeeded to increase thethroughput 8.5X times and 4.5X times for image and videodatasets respectively. It also saved 68% energy for imagedataset and 38% for video dataset. The smartphones withpowerful processors, larger memory and optimized OS that ishigh compatible with all subsystems distinctively separatedfrom earlier released ones.
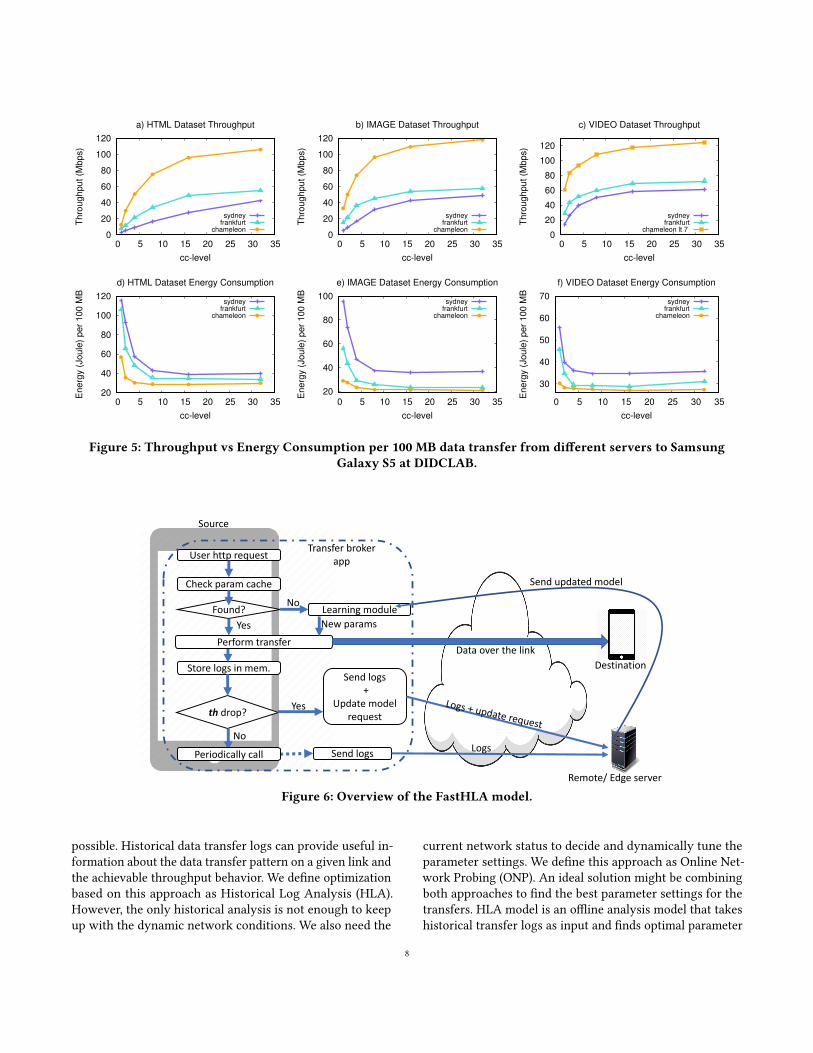
We also analyzed the impact of the web server locationand conducted experiments from three di�erent web serversin Austin, Frankfurt, and Sydney to the mobile client at DID-CLAB in Bu�alo. The RTT between mobile client at DID-CLAB to Chameleon Cloud (Austin, TX), AWS EC2 Frankfurt,and AWS ECS Sydney are 59 ms, 115 ms, and 290 ms respec-tively. The average throughput vs energy consumption trade-o�s from those three servers to the client Samsung Galaxy S5at DIDCLAB can be seen in Figure 5. As shown in Figure 5(a)-(f), increasing the level of concurrency up to 16 improved theend-to-end data transfer throughput while reducing the en-ergy consumption. Although the throughput curves showedsimilar increasing pattern for all three servers, the highestthroughput is achieved from the Chameleon Cloud in Austinnode, which is 105 Mbps for the html, 117 Mbps for the image,and 124 Mbps for the video dataset. Energy consumptionrates on three servers also showed similarity in decreasingwhen the concurrency level is changed from 1 to 16, and thenit comes to a balance. Overall, we obtained the best energysavings for the html dataset, which was 50% on ChameleonCloud, 70% on EC2 Sydney, and 65% on EC2 Frankfurt.
5 PROPOSED MODELDynamic nature of the real-time background tra�c on net-work links has a profound impact on the data transfer perfor-mance, and makes it very challenging to predict the optimalparameter combination to achieve the highest throughput
7
0
20
40
60
80
100
120
0 5 10 15 20 25 30 35
Thro
ughput (M
bps)
cc-level
a) HTML Dataset Throughput
sydneyfrankfurt
chameleon 0
20
40
60
80
100
120
0 5 10 15 20 25 30 35
Thro
ughput (M
bps)
cc-level
b) IMAGE Dataset Throughput
sydneyfrankfurt
chameleon 0
20
40
60
80
100
120
0 5 10 15 20 25 30 35
Thro
ughput (M
bps)
cc-level
c) VIDEO Dataset Throughput
sydneyfrankfurt
chameleon lt 7
20
40
60
80
100
120
0 5 10 15 20 25 30 35
Energ
y (
Joule
) per
100 M
B
cc-level
d) HTML Dataset Energy Consumption
sydneyfrankfurt
chameleon
20
40
60
80
100
0 5 10 15 20 25 30 35
Energ
y (
Joule
) per
100 M
B
cc-level
e) IMAGE Dataset Energy Consumption
sydneyfrankfurt
chameleon
30
40
50
60
70
0 5 10 15 20 25 30 35
Energ
y (
Joule
) per
100 M
B
cc-level
f) VIDEO Dataset Energy Consumption
sydneyfrankfurt
chameleon
Figure 5: Throughput vs Energy Consumption per 100 MB data transfer from di�erent servers to SamsungGalaxy S5 at DIDCLAB.
User http request
Check param cache
Found?
Perform transfer
Learning module
Store logs in mem.
Send logs
No
Yes
th drop?
No
Send logs+
Update model request
Yes
Periodically call
Send updated model
Data over the link
Logs + update request
Logs
Remote/ Edge server
Destination
Source
Transfer broker app
New params
Figure 6: Overview of the FastHLA model.
possible. Historical data transfer logs can provide useful in-formation about the data transfer pattern on a given link andthe achievable throughput behavior. We de�ne optimizationbased on this approach as Historical Log Analysis (HLA).However, the only historical analysis is not enough to keepup with the dynamic network conditions. We also need the
current network status to decide and dynamically tune theparameter settings. We de�ne this approach as Online Net-work Probing (ONP). An ideal solution might be combiningboth approaches to �nd the best parameter settings for thetransfers. HLA model is an o�ine analysis model that takeshistorical transfer logs as input and �nds optimal parameter
8
settings for the requested data transfer. However, We have totake into account several design challenges explained below.
Challenge 1. Mobile devices are not suitable for compute-intensive historical analysis. Historical analysis needs to bedone outside the mobile device.
Challenge 2. Historical analysis introduces a new cost onboth computation and energy consumption. We also have toconsider the frequency of the historical analysis as each fulliteration of the analysis will introduce more compute andpower cost.
Challenge 3. The bene�t of �guring out the optimal param-eter setting has to outweigh a transfer without any opti-mization. Assuming C is the cost function, we can strictlyconstrain C as follows -
C(HLA) +C(Topt ) < C(Tno-opt ) (3)
Here, Topt is the transfer with optimized parameters andTno-opt is the transfer without any optimization.
Challenge 4. Mobile devices have limited memory, therefore,we should allocate a �xed memory size to store the logs. Dueto the �xed memory size, it is possible that the new logs canoverwrite the old historical logs.
Challenge 5. We also need to make sure that the commu-nication between the historical analysis server and sourcedevice is minimal. Too much communication can take tollon the data transfer throughput.
To address these challenges, we have introduced a dy-namic framework called FastHLA as presented in the nextsubsection.
5.1 Fast Historical Log Analysis (FastHLA)Conceptually, FastHLA outsources the analysis of historicaldata transfer logs to an edge server or to the cloud. Thehistorical analysis will introduce additional computationand energy consumption. Even if we outsource the task itis still consuming computational resources and power onthe edge server or in the cloud. Challenge 3 might seemcounter-intuitive at the beginning, however, we have seenthat a transfer with sub-optimal parameter choice achieveslow throughput which leads to longer transfer time and highpower consumption. We designed FastHLA in a way that itdoes not need to be run for every transfer. Therefore, thecost of FastHLA can be amortized over many subsequenttransfers. To generalize the model even farther we can runFastHLA for many mobile devices in the cloud to amortizethe FastHLA cost over many mobile devices.
An overview of the FastHLA model is provided in Figure 6.We introduced a light-weight transfer broker that receivesa transfer request and performs transfer with best possible
parameters. Network condition does not change signi�cantlyover a short period of time, however, when it changes theprevious optimal choice of parameters might become sub-optimal. Therefore, running FastHLA once in the beginningis no better than statically setting the transfer parameters(an approach used in many current solutions). Therefore,we need a strategy to minimize the frequency of runningFastHLA. To resolve this issue, we introduced a cachingmechanism for previous optimal parameters and a LearningModule (LM) in the mobile device. The parameter cacheis a dictionary structure that maps network condition toparameter value list. On the other hand, the LM can takeuser request and network condition as input and providebest known parameters. The training of the LM is performedas a part of FastHLA outside the mobile device. Each timethe FastHLA runs, it updates the local Learning Module.A trained LM in the mobile device can provide predictedoptimal parameters in almost constant time. Transfer broker�rst looks into the cache for the parameter settings. In caseof a cache miss, it asks parameters from the LM and performsthe transfer using those parameters. It is crucial to keep LMup-to-date. It can be done by accepting periodic updatesfrom FastHLA. However, there might be a highly unlikelycase where the network condition is unknown to the LMitself and the parameters provided by LM are sub-optimal. Inthat case, an immediate update request will be issued onlyif there is a signi�cant drop in data transfer performance.However, the chance of such miss signi�cantly reduces aftereach FastHLA update, because the training is an additiveprocess with proper generalization method. Therefore, LMgets more and more precise after each FastHLA update.
To address memory issue explained in Challenge 4, thetransfer broker periodically sends historical transfer logs tothe remote server where HLA is performed, so that old histor-ical logs become available to HLA before being overwrittenby the new logs. The communication overhead explained inChallenge 5 are the periodic update requests and periodic logtransfers. We do not need to communicate with HLA serverduring the transfer except during the highly unlikely caseexplained above where both cache and LM fails to provideoptimal parameters. To reduce the communication overheadduring the transfer, we decided not to include the OnlineNetwork Probing into our model. We can use the most recentlogs to assess the network condition.
The model consists of �ve steps - (1) historical transferlog collection and preprocessing; (2) clustering similar logs;(3) optimization; (4) learning optimal parameters; and (5)scheduling mixed sized data. The details of these steps areexplained below.Step 1 – Historical log collection and preprocessing:We collect historical logs for the previous data transfers.Historical log contains detailed information about the data,
9
network characteristics, application level parameters, mobiledevice information, and external tra�c status. Data infor-mation contains �le size (f s) and number of �les (nf iles ).Network characteristics contain round trip time (tr t t ), tcpbu�er size (bstcp ), and bandwidth (bw). Application levelparameters contain concurrency (cc), parallelism (p) and I/Oblock size (bio ). Resource usage information contains CPUutilization (µcpu ), memory utilization (µmem), NIC card uti-lization (µnic ), and power consumption (pw). Mobile deviceinformation contains the model, operating system, processor,memory, and network interface (WiFi/radio) speci�cs.
Historical logs might contain information about the trans-fers which were aborted or failed; or sometimes, due to asystem error, logs might contain unreasonable informationsuch as achieved throughput greater than the bandwidth.During preprocessing phase we remove those logs. Standardoutlier detection model is used to remove those outliers.Step 2 – Clustering similar logs: Application level param-eters have di�erent impact on di�erent types of transfers.Categorize logs into groups based on their similarity couldprovide us more structured view of the log information. Af-ter analyzing the logs we come to the conclusion that someparameters have direct precedence over other parameters.We use Hierarchical Agglomerative Clustering which is themost suitable clustering technique for such cases.Step 3 – Optimization: This is the most important part ofthe analysis. We �rst modeled both throughput and energyfunction based on historical log. Then we performed mathe-matical optimization to �nd the best parameter settings. Thedetails of the optimization are presented in Section 5.2.Step 4 – Learning optimal parameters: As we decidedto do historical log analysis on the edge servers or in thecloud, there should be an e�cient way to transfer the ac-quired knowledge from the analysis server to the mobiledevices. The simple solution is sending the optimal resultsgained for each transfer to the mobile device. But, this isnot a scalable solution as this approach is too speci�c to theindividual transfers. A mobile device cannot generalize theknowledge for even similar transfers. Moreover, it will take aconsiderable amount of memory to store those individual re-sults. Another solution would be the use of machine learningtechniques, which can be used to learn the knowledge fromthe optimization step, and can have the power to predictparameters for the unknown transfers.
Machine learning techniques come with two distinct steps –(1) learning and (2) prediction. These two steps can be decou-pled. As all the historical logs and optimization results arestored in HLA servers, it is reasonable to do learning stepin the HLA server. Then the trained model is transferredto the mobile device. Another reason to choose the num-ber of parameters (also known as weights, connections) in
the learning module is �xed. The number of connectionsand weights do not increase as the historical log increases,only the values of the weights are updated as the modellearns. Therefore, HLA server always sends a �xed sizedupdate (e.g., updated values of the weights) to the mobiledevice. It simultaneously optimizes the memory and com-munication overhead between the server and the device. Inour model we have used o� the shelf non-linear machinelearning techniques, such as - Arti�cial Neural Networks(ANN) and Support Vector Machines (SVM). As we have lim-ited feature space (number of meta-data in the log), we donot need any deep learning techniques capable of extractingcomplex pattern from high number of features.Step 5 – Scheduling mixed sized data: We observed thatthe �les with di�erent sizes can have di�erent optimal pa-rameter settings. Therefore, a dataset containing di�erentsized �les should not be transferred with the same param-eter settings. A more �ne-tuned solution is to cluster the�les based on similarity and use optimal parameter settingsfor each cluster. However, each optimal parameter settingis optimized for that speci�c cluster and agnostic towardsother clusters’ parameters. Transferring these clusters con-currently can over-provision the network and introducepacket loss. Therefore, we scale down the parameter valuesaccording the the cluster size and some known heuristics.An overview is provided in Algorithm 1.
Algorithm 1: Mixed Data Schedulinginput :Data arguments, data_arдs =
{Dataset ,avд_f ile_size,num_f iles}output :Optimal parameter settings, θopt
1 procedure Scheduling(Fs , Rs , Is)2 C ← cluster(Dataset)
3 for ci in C do4 θi ← get_optimal_params (ci )5 end6 if sum (θi ) > user_limit then7 θopt ← (θi × user_limit)/sum(θi )8 end
5.2 OptimizationApplication level parameters, such as concurrency (cc), par-allelism (p) and I/O block size (bs) can be tuned properly toachieve both high throughput and low energy consumptions.We de�ne the throughput (th) and energy consumption (E)as:
th = fth(p, cc,bs) (4)E = fe (p, cc) (5)
Appropriate modeling of th and E is crucial to �nd theoptimal parameter settings. Historical log contain samples
10
of the parameter space, therefore, can not provide overallview of the whole parameter space. We need an interpolationtechnique to predict the missing parameters. Then we can op-timize these functions to get optimal parameters. We followtwo steps - (1) interpolation of unknown parameters, and (2)�nding the optimal parameters. These steps are explainedbelow.Step 1 – Interpolation of unknown parameters: We ob-served that the throughput and energy consumption followa cubic pattern. Therefore, we modeled both throughput andenergy consumption as piece-wise cubic interpolation. Cu-bic interpolation �lls the achievable throughput and energyconsumption of the unknown parameters. These piece-wisecubic functions are stitched with a guarantee of smoothnessup to second derivate. As I/O block size is di�erent fromconcurrency and parallelism, we modeled it separately.
To model the throughput, we construct a 2-dimensioncubic spline interpolation for th = f (bs). Piece-wise cubicinterpolation can be constructed using interpolant thi =f (bsi ) and connecting them by maintaining smoothness upto second derivative. we can de�ne each cubic polynomialpiece as generic cubic function:
fi (bs) = xi,0+xi,1bs+xi,2bs2+xi,3bs
3,∀bs ∈ [bsi ,bsi+1]. (6)
Boundaries can be constrained as f (bsi+1) = f (bsi ). Wecan have:
fi (bsi ) = thi , i = 1, ...,N (7)Therefore, the N continuity constraints of f (bs) are as:
fi−1(bsi ) = thi = fi (bsi ), i = 2, ...,N . (8)
The following constraint con�rms smoothness up to sec-ond derivatives.
d2 fi−1
d2bs(bsi ) =
d2 fid2bs(bsi ), i = 2, ...,N (9)
The boundary condition for spline could be written as:d2 f
d2bs(bs1) =
d2 f
d2bs(bsn) = 0 (10)
The coe�cients can be computed by solving the system oflinear equations.
Throughput is also dependent on concurrency and par-allelism. The example above can be extended to generatethroughput surface with two independent variables - cc andp. Similarly, we modeled energy as a function of concurrency,parallelism and I/O block size.Step 2 – Find optimal parameters: Energy e�cient trans-fer aims to reduce the energy consumption without com-promising the transfer performance. This objective functiontries to optimize both throughput and power consumptionat the same time. This objective function does not guaran-tee both maximally achievable throughput with minimum
power consumption, however, it ensures that every unit ofpower can be spent to achieve highest possible throughputunder the energy e�ciency constraint. The objective func-tion here is to maximize achievable throughput over powerconsumption.
maximize∫ tf
tsth/E (11)
We take into account all the boundary constraints for theparameters and other necessary constraints. Due to the spacelimitation we are not including those here. Then we usednon-linear optimizer to �nd the optimal parameters.
5.3 Evaluation of FastHLA ModelHistorical log analysis (HLA) data transfer experiments areconducted in the same experimental testbed described inSection 3. We trained and tested our model (FastHLA) on thereal data transfer logs and compared the performance andpower consumption FastHLA with energy-agnostic wget [4]and curl [1] clients as well as two versions of de-facto appli-cation layer transfer protocol of HTTP, which are HTTP/1.1and HTTP/2 [3]. While HTTP/1.1 is a textual protocol, thenewly introduced HTTP/2 is a binary protocol that supportsmultiplexing, header compressions and lets the server topush responses.
To evaluate our model, we used HTML, image and videodatasets (as described in Section 3) along with a combineddataset that contains a mix of three datasets. We comparedFastHLA with other models using these dataset so that wecan get a �ne-grained analysis of performance. Figure 7shows both energy and throughput comparison of di�er-ent existing approaches along with our model. We observethat FastHLA outperforms all other tested solutions in ev-ery data category. For image, video, HTML, and mixed datasets, we see 2×, 4×, 10× and 4× throughput improvementover the closest competitor HTTP/2. HTTP/2 uses multiplex-ing to transfer multiple streams over a single connectionto remove head-of-line blocking. However, single connec-tion can achieve very poor results in long RTT WAN links.HTTP/1.1 uses multiple connections to request multiple �les,however, there is no way to dynamically set those number ofconnections (parallelism). On the other hand, we have usedhistorical analysis to decide on optimal level of parallelism,concurrency and I/O block size.
Figure 7(b) shows the energy consumption of di�erentmodels. As we can see standard applications like wget or curlare not optimized for power consumption and draw a hugeenergy compare to HTTP/2. On the other hand, FastHLA im-proves power consumption 5× and 2× for HTML and video�les respectively compared to HTTP/2. We have observedthat high transfer throughput can shorten the data transfertime. That means CPU has to work for a shorter period of
11

0
50
100
150
200
curlwget
http/1.1
http/2.0
FastHLA
Thro
ughput (M
bps)
Achieved throughput of different models
HTMLImageVideoMixed
(a) Achieved Throughput
0
50
100
150
200
250
300
350
400
450
curlwget
http/1.1
http/2.0
FastHLA
Energ
y (
Joule
per
100 M
B)
Energy Consumption of different models
HTMLImageVideoMixed
(b) Energy Consumption
0
2
4
6
8
10
12
14
16
curlwget
http/1.1
http/2.0
FastHLA
Thro
ughput effic
iency (
Mbps/J
oule
)
Throughput efficiency of different models
HTMLImageVideoMixed
(c) Throughput E�ciency
Figure 7: Achievable throughput and corresponding energy consumption of di�erent optimization objectives andthe accuracy of the learning module.
80
82
84
86
88
90
92
94
96
ANN
SVMKN
N
Accura
cy (
%)
Learning model accuracy
Figure 8: Accuracy of di�erent learning modules.
time and CPU consumes most of the power during the trans-fer. That explains why FastHLA consumes less power com-pared to other approaches. However, the energy consump-tion is similar for image and mixed data. Even if the powerconsumption is similar for image and video, FastHLA canprovide more achievable throughput compared to HTTP/2.We use throughput e�ciency, th/E to measure the energye�ciency of the models (as shown in Figure 7(c)). FastHLAimproves throughput e�ciency 2.5× for both video and im-age data.
We have used three di�erent learning modules to see thee�ciency of those models. Among them ANN and SVM canreach up to 94% and 92% accuracy respectively (as shownin Figure 8). However, KNN can achieve up to 86% accuracy.As K-Nearest Neighbor takes into account k closest logs todecide on the parameters, it is not feasible to transfer allthe optimal results to mobile due to memory issues. That iswhy we decided not to use KNN in our model. However, theshallow Neural Network and SVM both can learn e�ciently
the optimal parameters. We can use coe�cient of determina-tion, R2 to see how well the the prediction learning modulematches the target. It can be expressed as:
R2 = 1 −∑(yi − y)2/
∑(fi − y)2 (12)
where yi is the actual optimal throughput and y is themean of yi . The predicted throughput is de�ned as fi . R2 isa good statistical indicator that can point out the stronglyactual and prediction values are related. In case of perfectmatches between all known targets and the predictions R2
value will be 1. However, we can say a model can predict withgood generalization ifR2 value is close to 1. We computed thisfor both ANN and SVM as R2
ANN = 0.92 and R2SVM = 0.87
respectively.
6 CONCLUSION & FUTUREWORKIn this paper, we performed extensive analysis and presentedthe e�ects of application-layer data transfer protocol param-eters (such as the number of parallel data streams per �le,the level of concurrent �le transfers to �ll the mobile net-work pipes, and the I/O request size) on mobile data transferthroughput and energy consumption for WiFi and 4G LTEconnections. We also proposed a novel historical-data analy-sis based model, called FastHLA, that can achieve signi�cantenergy savings at the application layer during mobile net-work I/O without sacri�cing the performance. Our analysisshows that FastHLA model can achieve signi�cant energysavings using only application-layer solutions at the mobilesystems during data transfer with no performance penalty.We also show that, in many cases, our FastHLA model canincrease the performance and save energy simultaneously.
According to our experiments, by intelligently tuning theconcurrency and parallelism levels during data transfers, ourFastHLA model can increase the data transfer throughput
12
by up to 10X, and decrease the energy consumption by upto 5X compared to state-of-the-art HTTP/2.0 transfers. Theimprovement is even larger compared to base HTTP/1.1transfers and client tools such as wget and curl.
As a future work, we are planning to develop SLA-basedtransfer tuning algorithms to balance the performance vsenergy trade-o� during mobile network I/O according to thepreferences of the mobile users. While keeping the quality ofservice (i.e., transfer throughput) at the desired level, thesealgorithms will try to keep the energy consumption at theminimum possible level.
REFERENCES[1] curl. http://curl.haxx.se/.[2] Ibm cloud. https://www.ibm.com/cloud/.[3] Okhttp http/2 client for android. http://square.github.io/okhttp/.[4] wget. https://www.gnu.org/software/wget/.[5] S. A. Akella, R. K. Balan, and N. Bansal. Protocols for low-power. 2001.[6] I. Alan, E. Arslan, and T. Kosar. Energy-Performance Trade-o�s in
Data Transfer Tuning at the End-Systems. Sustainable Computing:Informatics and Systems Journal, 4:4:318-329, 2014.
[7] I. Alan, E. Arslan, and T. Kosar. Power-aware data scheduling algo-rithms. In Proceedings of IEEE/ACM Supercomputing Conference (SC15),November 2015.
[8] B. Allen, J. Bresnahan, L. Childers, I. Foster, G. Kandaswamy, R. Ket-timuthu, J. Kordas, M. Link, S. Martin, K. Pickett, and S. Tuecke. Soft-ware as a service for data scientists. Communications of the ACM,55:2:81–88, 2012.
[9] H. Balakrishman, V. N. Padmanabhan, S. Seshan, M. Stemm, and R. H.Katz. Tcp behavior of a busy internet server: Analysis and improve-ments. In Proceedings of INFOCOM ’98, pages 252–262. IEEE, March1998.
[10] N. Balasubramanian, A. Balasubramanian, and A. Venkataramani. En-ergy consumption in mobile phones: a measurement study and im-plications for network applications. In Proceedings of the 9th ACMSIGCOMM conference on Internet measurement conference, pages 280–293. ACM, 2009.
[11] D. Bertozzi, L. Benini, and B. Ricco. Power aware network interfacemanagement for streaming multimedia. In Wireless Communicationsand Networking Conference, 2002. WCNC2002. 2002 IEEE, volume 2,pages 926–930. IEEE, 2002.
[12] D. Bertozzi, A. Raghunathan, L. Benini, and S. Ravi. Transport pro-tocol optimization for energy e�cient wireless embedded systems.In Proceedings of the conference on Design, Automation and Test inEurope-Volume 1, page 10706. IEEE Computer Society, 2003.
[13] V. Bharghavan, A. Demers, S. Shenker, and L. Zhang. Macaw: a mediaaccess protocol for wireless lan’s. ACM SIGCOMM Computer Commu-nication Review, 24(4):212–225, 1994.
[14] A. Carroll and G. Heiser. An analysis of power consumption in asmartphone. InUSENIX annual technical conference, volume 14. Boston,MA, 2010.
[15] S. Chandra and A. Vahdat. Application-speci�c network managementfor energy-aware streaming of popular multimedia formats. InUSENIXAnnual Technical Conference, General Track, pages 329–342, 2002.
[16] J.-H. Chang and L. Tassiulas. Energy conserving routing in wireless ad-hoc networks. In INFOCOM 2000. Nineteenth Annual Joint Conferenceof the IEEE Computer and Communications Societies. Proceedings. IEEE,volume 1, pages 22–31. IEEE, 2000.
[17] E. Cianca, M. Ruggieri, and R. Prasad. Improving tcp/ip performanceover cdma wireless links: A physical layer approach. In Personal,
Indoor and Mobile Radio Communications, 2001 12th IEEE InternationalSymposium on, volume 1, pages A–83. IEEE, 2001.
[18] L. M. Correia, D. Zeller, O. Blume, D. Ferling, Y. Jading, I. Gódor,G. Auer, and L. Van Der Perre. Challenges and enabling technologiesfor energy aware mobile radio networks. Communications Magazine,IEEE, 48(11):66–72, 2010.
[19] S. Cui, A. J. Goldsmith, and A. Bahai. Energy-e�ciency of mimo andcooperative mimo techniques in sensor networks. IEEE Journal onselected areas in communications, 22(6):1089–1098, 2004.
[20] J. Czyz, M. Allman, J. Zhang, S. IekelJohnson, E. Osterweil, and M. Bai-ley. Measuring ipv6 adoption. SIGCOMM Comput. Commun. Rev.,44(4):87–98, Aug. 2014.
[21] K. M. Dixit. Overview of the spec benchmarks., 1993.[22] F. R. Dogar and P. Steenkiste. Catnap: Exploiting high bandwidth
wireless interfaces to save energy for mobile devices. In Proc. Int. Conf.Mobile Systems, Applications and Services (MobiSys), 2010.
[23] L. Eggert, J. Heidemann, and J. Touch. E�ects of ensemble-tcp. ACMSIGCOMM Computer Communication Review, 30(1):15–29, January2000.
[24] Z. J. Haas. Mobile-tcp: an asymmetric transport protocol design formobile systems. In Mobile Multimedia Communications, pages 117–128.Springer, 1997.
[25] T. J. Hacker, B. D. Noble, and B. D. Atley. The end-to-end perfor-mance e�ects of parallel tcp sockets on a lossy wide area network. InProceedings of IPDPS ’02, page 314. IEEE, April 2002.
[26] T. J. Hacker, B. D. Noble, and B. D. Atley. Adaptive data block sched-uling for parallel streams. In Proceedings of HPDC ’05, pages 265–275.ACM/IEEE, July 2005.
[27] R. P. Karrer, J. Park, and J. Kim. Tcp-rome:performance and fairnessin parallel downloads for web and real time multimedia streamingapplications. In Technical Report. Deutsche Telekom Laboratories,September 2006.
[28] A. Kellerman. Daily spatial mobilities: Physical and virtual. Routledge,2016.
[29] S. Khan, Y. Peng, E. Steinbach, M. Sgroi, and W. Kellerer. Application-driven cross-layer optimization for video streaming over wirelessnetworks. IEEE Communications Magazine, 44(1):122–130, 2006.
[30] J. Kim, E. Yildirim, and T. Kosar. A highly-accurate and low-overheadprediction model for transfer throughput optimization. Cluster Com-puting, 18(1):41–59, 2015.
[31] J. Kim, E. Yildirim, and T. Kosar. A highly-accurate and low-overheadprediction model for transfer throughput optimization. In Proc. ofDISCS Workshop, November 2012.
[32] G. Kola, T. Kosar, J. Frey, M. Livny, R. Brunner, and M. Remijan. Disc: Asystem for distributed data intensive scienti�c computing. In WORLDS,2004.
[33] T. Kosar. Data Placement in Widely Distributed Sytems. PhD thesis,University of Wisconsin–Madison, 2005.
[34] T. Kosar. Data intensive distributed computing: Challenges and solu-tions for large-scale information management, 2012.
[35] T. Kosar, E. Arslan, B. Ross, and B. Zhang. Storkcloud: Data transferscheduling and optimization as a service. In Proceedings of the 4thACM workshop on Scienti�c cloud computing, pages 29–36. ACM, 2013.
[36] T. Kosar and M. Balman. A new paradigm: Data-aware scheduling ingrid computing. Future Generation Computing Systems, 25(4):406–413,2009.
[37] T. Kosar, M. Balman, E. Yildirim, S. Kulasekaran, and B. Ross. Stork datascheduler: Mitigating the data bottleneck in e-science. PhilosophicalTransactions of the Royal Society of London A: Mathematical, Physicaland Engineering Sciences, 369(1949):3254–3267, 2011.
[38] T. Kosar and M. Livny. Stork: Making data placement a �rst classcitizen in the grid. In Proceedings of ICDCS’04, pages 342–349, March
13
2004.[39] R. Krashinsky and H. Balakrishnan. Minimizing energy for wireless
web access with bounded slowdown. Wireless Networks, 11(1-2):135–148, 2005.
[40] R. Kravets and P. Krishnan. Application-driven power managementfor mobile communication. Wireless Networks, 6(4):263–277, 2000.
[41] J. Lee, D. Gunter, B. Tierney, B. Allcock, J. Bester, J. Bresnahan, andS. Tuecke. Applied techniques for high bandwidth data transfersacross wide area networks. In International Conference on Computingin High Energy and Nuclear Physics, April 2001.
[42] W. Liu, B. Tieman, R. Kettimuthu, and I. Foster. A data transfer frame-work for large-scale science experiments. In Proc. 3rd InternationalWorkshop on Data Intensive Distributed Computing (DIDC ’10) in con-junction with 19th International Symposium on High Performance Dis-tributed Computing (HPDC ’10), June 2010.
[43] D. Lu, Y. Qiao, and P. A. Dinda. Characterizing and predicting tcpthroughput on the wide area network. In Proceedings of ICDCS ’05,pages 414–424. IEEE, June 2005.
[44] D. Lu, Y. Qiao, P. A. Dinda, and F. E. Bustamante. Modeling and tamingparallel tcp on the wide area network. In Proceedings of IPDPS ’05,page 68.2. IEEE, April 2005.
[45] J. Mambretti, J. Chen, and F. Yeh. Next generation clouds, thechameleon cloud testbed, and software de�ned networking (sdn). InCloud Computing Research and Innovation (ICCCRI), 2015 InternationalConference on, pages 73–79. IEEE, 2015.
[46] A. Nasipuri, S. Ye, J. You, and R. E. Hiromoto. A mac protocol for mobilead hoc networks using directional antennas. In Wireless Communi-cations and Networking Confernce, 2000. WCNC. 2000 IEEE, volume 3,pages 1214–1219. IEEE, 2000.
[47] A. Nika, Y. Zhu, N. Ding, A. Jindal, Y. C. Hu, X. Zhou, B. Y. Zhao, andH. Zheng. Energy and performance of smartphone radio bundlingin outdoor environments. In Proceedings of the 24th InternationalConference on World Wide Web, pages 809–819. International WorldWide Web Conferences Steering Committee, 2015.
[48] A. Pathak, Y. C. Hu, and M. Zhang. Where is the energy spent insidemy app?: �ne grained energy accounting on smartphones with eprof.In Proceedings of the 7th ACM european conference on Computer Systems,pages 29–42. ACM, 2012.
[49] T. Pering, Y. Agarwal, R. Gupta, and R. Want. Coolspots: reducing thepower consumption of wireless mobile devices with multiple radiointerfaces. In Proceedings of the 4th international conference on Mobilesystems, applications and services, pages 220–232. ACM, 2006.
[50] P. Richter, N. Chatzis, G. Smaragdakis, A. Feldmann, and W. Willinger.Distilling the internet’s application mix from packet-sampled tra�c.In J. Mirkovic and Y. Liu, editors, Passive and Active Measurement,volume 8995 of Lecture Notes in Computer Science, pages 179–192.2015.
[51] A. Schulman, V. Navda, R. Ramjee, N. Spring, P. Deshpande,C. Grunewald, K. Jain, and V. N. Padmanabhan. Bartendr: a practicalapproach to energy-aware cellular data scheduling. In Proceedings ofthe sixteenth annual international conference on Mobile computing andnetworking, pages 85–96. ACM, 2010.
[52] C. Schurgers, O. Aberthorne, and M. Srivastava. Modulation scalingfor energy aware communication systems. In Proceedings of the 2001international symposium on Low power electronics and design, pages96–99. ACM, 2001.
[53] K. Seada, M. Zuniga, A. Helmy, and B. Krishnamachari. Energy-e�cient forwarding strategies for geographic routing in lossy wirelesssensor networks. In Proceedings of the 2nd international conference onEmbedded networked sensor systems, pages 108–121. ACM, 2004.
[54] S. Singh and C. S. Raghavendra. PamasÃŚpower aware multi-accessprotocol with signalling for ad hoc networks. ACM SIGCOMM Com-puter Communication Review, 28(3):5–26, 1998.
[55] S. Singh, M. Woo, and C. S. Raghavendra. Power-aware routing inmobile ad hoc networks. In Proceedings of the 4th annual ACM/IEEEinternational conference on Mobile computing and networking, pages181–190. ACM, 1998.
[56] H. Sivakumar, S. Bailey, and R. L. Grossman. Psockets: The case forapplication-level network striping fpr data intensive applications usinghigh speed wide area networks. In Proceedings of SC’00 ACM/IEEEconference on Supercomputing, pages 37–es. ACM/IEEE, September2001.
[57] C. Systems. Visual networking index: Forecast and methodology,2015–2020, June 2016.
[58] M. Takai, J. Martin, and R. Bagrodia. E�ects of wireless physical layermodeling in mobile ad hoc networks. In Proceedings of the 2nd ACMinternational symposium on Mobile ad hoc networking & computing,pages 87–94. ACM, 2001.
[59] C.-K. Toh. Maximum battery life routing to support ubiquitous mo-bile computing in wireless ad hoc networks. IEEE communicationsMagazine, 39(6):138–147, 2001.
[60] N. Vallina-Rodriguez and J. Crowcroft. Erdos: achieving energy sav-ings in mobile os. In Proceedings of the sixth international workshop onMobiArch, pages 37–42. ACM, 2011.
[61] N. Vallina-Rodriguez and J. Crowcroft. Energy management tech-niques in modern mobile handsets. Communications Surveys & Tutori-als, IEEE, 15(1):179–198, 2013.
[62] J. Varia and S. Mathew. Overview of amazon web services. AmazonWeb Services, 2014.
[63] H. Woesner, J.-P. Ebert, M. Schlager, and A. Wolisz. Power-savingmechanisms in emerging standards for wireless lans: The mac levelperspective. IEEE Personal Communications, 5(3):40–48, 1998.
[64] A. Woo and D. E. Culler. A transmission control scheme for media ac-cess in sensor networks. In Proceedings of the 7th annual internationalconference on Mobile computing and networking, pages 221–235. ACM,2001.
[65] R. Xu, Z. Li, C. Wang, and P. Ni. Impact of data compression on energyconsumption of wireless-networked handheld devices. In DistributedComputing Systems, 2003. Proceedings. 23rd International Conferenceon, pages 302–311. IEEE, 2003.
[66] Y. Xu, J. Heidemann, and D. Estrin. Geography-informed energyconservation for ad hoc routing. In Proceedings of the 7th annualinternational conference on Mobile computing and networking, pages70–84. ACM, 2001.
[67] W. Ye, J. Heidemann, and D. Estrin. An energy-e�cient mac protocolfor wireless sensor networks. In INFOCOM 2002. Twenty-First AnnualJoint Conference of the IEEE Computer and Communications Societies.Proceedings. IEEE, volume 3, pages 1567–1576. IEEE, 2002.
[68] E. Yildirim, E. Arslan, J. Kim, and T. Kosar. Application-level opti-mization of big data transfers through pipelining, parallelism andconcurrency. To appear in IEEE Transactions on Cloud Computing(TCC), 18(1):41–59, 2015.
[69] E. Yildirim, M. Balman, and T. Kosar. Dynamically tuning level ofparallelism in wide area data transfers. In Proceedings of the 2008International Workshop on Data-aware Distributed Computing, DADC’08, pages 39–48, New York, NY, USA, 2008. ACM.
[70] E. Yildirim, J. Kim, and T. Kosar. How gridftp pipelining, parallelismand concurrency work: A guide for optimizing large dataset transfers.In High Performance Computing, Networking, Storage and Analysis(SCC), 2012 SC Companion:, pages 506–515. IEEE, 2012.
[71] E. Yildirim and T. Kosar. Network-aware end-to-end data throughputoptimization. In Proceedings of the �rst international workshop on
14
Network-aware data management, pages 21–30. ACM, 2011.[72] E. Yildirim and T. Kosar. End-to-end data-�ow parallelism for through-
put optimization in high-speed networks. Journal of Grid Computing,pages 1–24, 2012.
[73] E. Yildirim, I. H. Suslu, and T. Kosar. Which network measurementtool is right for you? a multidimensional comparison study. In GridComputing, 2008 9th IEEE/ACM International Conference on, pages266–275. IEEE, 2008.
[74] E. Yildirim, D. Yin, and T. Kosar. Balancing tcp bu�er vs parallelstreams in application level throughput optimization. In Proceedings ofthe second international workshop on Data-aware distributed computing,pages 21–30. ACM, 2009.
[75] E. Yildirim, D. Yin, and T. Kosar. Prediction of optimal parallelismlevel in wide area data transfers. IEEE Transactions on Parallel andDistributed Systems, 22(12), 2011.
[76] D. Yin, E. Yildirim, and T. Kosar. A data throughput prediction andoptimization service for widely distributed many-task computing.IEEE Transactions on Parallel and Distributed Systems, 22(6), 2011.
[77] M. Zorzi and R. R. Rao. Is tcp energy e�cient? In Mobile MultimediaCommunications, 1999.(MoMuC’99) 1999 IEEE International Workshopon, pages 198–201. IEEE, 1999.
15