Embed Size (px)
Citation preview
Energy-Efficient Windows for Residential Windows Course No: M06-028
Credit: 6 PDH
Mark Rossow, PhD, PE, Retired
Continuing Education and Development, Inc. 9 Greyridge Farm Court Stony Point, NY 10980 P: (877) 322-5800 F: (877) 322-4774 [email protected]
Measure Guideline: Energy-Efficient Window Performance and Selection John Carmody and Kerry Haglund NorthernSTAR
November 2012
NOTICE
This report was prepared as an account of work sponsored by an agency of the United States government. Neither the United States government nor any agency thereof, nor any of their employees, subcontractors, or affiliated partners makes any warranty, express or implied, or assumes any legal liability or responsibility for the accuracy, completeness, or usefulness of any information, apparatus, product, or process disclosed, or represents that its use would not infringe privately owned rights. Reference herein to any specific commercial product, process, or service by trade name, trademark, manufacturer, or otherwise does not necessarily constitute or imply its endorsement, recommendation, or favoring by the United States government or any agency thereof. The views and opinions of authors expressed herein do not necessarily state or reflect those of the United States government or any agency thereof.
Available electronically at www.osti.gov/bridge
Available for a processing fee to U.S. Department of Energy and its contractors, in paper, from:
U.S. Department of Energy Office of Scientific and Technical Information
P.O. Box 62 Oak Ridge, TN 37831-0062
phone: 865.576.8401 fax: 865.576.5728
email: [email protected]
Available for sale to the public, in paper, from: U.S. Department of Commerce
National Technical Information Service 5285 Port Royal Road Springfield, VA 22161 phone: 800.553.6847
fax: 703.605.6900 email: [email protected]
online ordering: www.ntis.gov/ordering.htm
Printed on paper containing at least 50% wastepaper, including 20% postconsumer waste
iii
Measure Guideline: Energy-Efficient Window Performance and Selection
Prepared for:
The National Renewable Energy Laboratory
On behalf of the U.S. Department of Energy’s Building America Program
Office of Energy Efficiency and Renewable Energy
15013 Denver West Parkway
Golden, CO 80401
NREL Contract No. DE-AC36-08GO28308
Prepared by:
John Carmody, Kerry Haglund
NorthernSTAR
University of Minnesota
2004 Folwell Avenue
St. Paul, MN 55108
NREL Technical Monitor: Stacey Rothgeb
Prepared under Subcontract No. KNDJ-0-40338-02
November 2012
iv
Acknowledgments This report was prepared for the U.S. Department of Energy Building America program. Funding for this work was provided by the National Renewable Energy Laboratory under contract KNDJ-0-40338-02. Additional funds were provided by the University of Minnesota, the Initiative for Renewable Energy and the Environment, and Building Knowledge Inc.
This guide is the product of a collaborative effort and builds on work done through the U.S. Department of Energy’s Windows and Glazing Program and related work done by other Building America teams. We appreciate the contributions of Jim Larsen (Cardinal Glass Industries), Garrett Mosiman (Center for Sustainable Building Research), and Nils Petermann (Alliance to Save Energy). We offer special thanks to Ren Anderson, Stacy Rothgeb, and Chuck Booten at the National Renewable Energy Laboratory.
v
Contents List of Figures ........................................................................................................................................... vii List of Tables ............................................................................................................................................ viii Definitions ................................................................................................................................................... ix Executive Summary .................................................................................................................................... x Progression Summary ............................................................................................................................... xi 1 Introduction ........................................................................................................................................... 1 2 Measuring Window Performance ........................................................................................................ 2
2.1 U-Factor ...............................................................................................................................3 2.2 Solar Heat Gain Coefficient .................................................................................................3 2.3 Visible Transmittance ..........................................................................................................4 2.4 Air Leakage ..........................................................................................................................4 2.5 Condensation Resistance .....................................................................................................5
3 Window Technologies .......................................................................................................................... 6 3.1 Glazing Types ......................................................................................................................6
3.1.1 Multiple Layers ........................................................................................................6 3.1.2 Low-Emittance Coatings .........................................................................................7
3.2 Low-Conductance Spacers and Gas Fills ............................................................................9 3.2.1 Low-Conductance Gas Fills .....................................................................................9 3.2.2 Warm Edge Spacers .................................................................................................9
3.3 Frame Types.......................................................................................................................12 3.3.1 Metal Frames .........................................................................................................12 3.3.2 Thermally Broken Metal Frames ...........................................................................12 3.3.3 Nonmetal Frames ...................................................................................................13
4 Window Selection Process ................................................................................................................ 16 4.1 Energy Codes .....................................................................................................................16
4.1.1 Windows in the 2009 International Energy Conservation Code ...........................17 4.1.2 Windows in the 2012 International Energy Conservation Code ...........................18
4.2 ENERGY STAR ................................................................................................................18 4.3 Window Selection Tool .....................................................................................................20 4.4 RESFEN .............................................................................................................................21
5 Cost and Performance ....................................................................................................................... 23 5.1 Energy and Cost Savings for New Windows .....................................................................23
5.1.1 Savings for New Windows in Climate Zones 1 and 2 ...........................................24 5.1.2 Savings for New Windows in Climate Zones 3 and 4 ...........................................26 5.1.3 Savings for New Windows in Climate Zones 5–8 .................................................29
5.2 Energy and Cost Savings for Replacement Windows .......................................................33 5.2.1 Savings for Replacement Windows in Climate Zones 1 and 2 ..............................33 5.2.2 Savings for Replacement Windows in Climate Zones 3 and 4 ..............................35 5.2.3 Savings for Replacement Windows in Climate Zones 5–8 ...................................38
5.3 Window Costs (New and Replacement) ............................................................................42 5.4 Life Cycle Cost Analysis ...................................................................................................43
5.4.1 Life Cycle Cost Summary ......................................................................................44 5.5 Other Benefits ....................................................................................................................45
5.5.1 Comfort ..................................................................................................................45 5.5.2 Reduced Peak Demand and Heating, Ventilation, and Air Conditioning Costs ...49
vi
6 Impact of Design on Performance .................................................................................................... 52 6.1 Orientation .........................................................................................................................52
6.1.1 Orientation in the Northern Zone (Heating Dominated) ........................................52 6.1.2 Orientation in the Central Zones (Heating and Cooling) .......................................53 6.1.3 Orientation in the Southern Zone (Cooling Dominated) .......................................54
6.2 Window Area .....................................................................................................................55 6.2.1 Window Area in the Northern Zone (Heating Dominated) ...................................55 6.2.2 Window Area in the Central Zones (Heating and Cooling) ..................................56 6.2.3 Window Area in the Southern Zone (Cooling Dominated) ...................................57
6.3 Shading ..............................................................................................................................58 6.3.1 Shading in the Northern Zone (Heating Dominated) .............................................58 6.3.2 Shading in the Central Zones (Heating and Cooling) ............................................59 6.3.3 Shading in the Southern Zone (Cooling Dominated) ............................................60 Important Resources ..........................................................................................................61
7 Installation ........................................................................................................................................... 61 7.1 General Installation Guidelines ..........................................................................................61 7.2 Watertight Installation .......................................................................................................62
7.2.1 Storage or Mass Wall System ................................................................................62 7.2.2 Perfect Barrier System ...........................................................................................62 7.2.3 Drained Wall System .............................................................................................63
7.3 Replacement Windows and Sashes ....................................................................................63 References ................................................................................................................................................. 65
vii
List of Figures Figure 1. Heat flow through a window ...................................................................................................... 2 Figure 2. Window properties on the NFRC label...................................................................................... 2 Figure 3. Heat loss through a window by conduction, convection, and radiation ............................... 3 Figure 4. Solar gain through a window ..................................................................................................... 3 Figure 5. Visible light through a window .................................................................................................. 4 Figure 6. Air leakage through window assembly .................................................................................... 4 Figure 7. Condensation on window surface ............................................................................................. 5 Figure 8. Advancements to improve energy efficiency .......................................................................... 6 Figure 9. Spectral transmittance curves for glazings with low-e coatings ........................................... 8 Figure 10. Surface placement of low-e coatings ..................................................................................... 8 Figure 11. Various metal and nonmetal spacer systems ...................................................................... 11 Figure 12. Thermogram of double-glazed clear window with an aluminum spacer (left) and double-
glazed low-e window with an insulating spacer (right). Cold regions in purple and blue represent the large amounts of heat flowing through the spacer. ................................................ 12
Figure 13. Aluminum frame ...................................................................................................................... 13 Figure 14. Aluminum frame with thermal break ..................................................................................... 13 Figure 15. Wood frame ............................................................................................................................. 13 Figure 16. Wood with clad frame ............................................................................................................. 13 Figure 17. Vinyl frame ............................................................................................................................... 14 Figure 18. Insulated vinyl frame .............................................................................................................. 14 Figure 19. Hybrid frame ............................................................................................................................ 14 Figure 20. Climate zone map referenced in IECC 2006 and later versions ......................................... 17 Figure 21. ENERGY STAR zone map ...................................................................................................... 18 Figure 22. Results from the Window Selection Tool ............................................................................. 20 Figure 23. Manufacturers listed for a specific window in the Window Selection Tool ...................... 21 Figure 24. Products by a manufacturer listed in the Windows Selection Tool .................................. 21 Figure 25. RESFEN computer simulation data entry screen ................................................................ 22 Figure 26. IECC climate zone map with cities used in simulations ..................................................... 23 Figure 27. Comparison of inside glass surface temperature for different glazing types .................. 47 Figure 28. Probability of discomfort near a window in the winter ....................................................... 47 Figure 29. Probability of discomfort near a window in the summer .................................................... 48 Figure 30. Peak summer cooling loads in Phoenix, Arizona ................................................................ 50 Figure 31. Peak summer cooling loads in Minneapolis, Minnesota .................................................... 50 Figure 32. Annual energy cost by orientation in Boston, Massachusetts .......................................... 52 Figure 33. Annual energy cost by orientation in Sacramento, California ........................................... 53 Figure 34. Annual energy cost by orientation in Phoenix, Arizona ..................................................... 54 Figure 35. Annual energy cost by window area in Boston, Massachusetts ....................................... 55 Figure 36. Annual energy cost by window area in Sacramento, California ........................................ 56 Figure 37. Annual energy cost by window area in Phoenix, Arizona .................................................. 57 Figure 38. Annual energy cost by shading type in Boston, Massachusetts ...................................... 58 Figure 39. Annual energy cost by shading type in Sacramento, California ....................................... 59 Figure 40. Annual energy cost by shading type in Phoenix, Arizona ................................................. 60
Unless otherwise noted, all figures were created by the NorthernSTAR team.
viii
List of Tables Table 1. Properties of Generic Set of Windows ..................................................................................... 15 Table 2. Prescriptive Window Requirements in the 2009 IECC ............................................................ 17 Table 3. Prescriptive Window Requirements in the 2012 IECC ............................................................ 18 Table 4. Current ENERGY STAR Performance Requirements ............................................................. 19 Table 5. Proposed 2013 ENERGY STAR Performance Requirements ................................................. 19 Table 6. Properties of Windows Used in Climate Zones 1 and 2 ......................................................... 24 Table 7. Savings of New Windows in Miami, Florida ............................................................................. 25 Table 8. Savings of New Windows in Houston, Texas .......................................................................... 25 Table 9. Savings of New Windows in Phoenix, Arizona ........................................................................ 25 Table 10. Properties of Windows Used in Climate Zones 3 and 4 ....................................................... 26 Table 11. Savings of New Windows in Atlanta, Georgia ....................................................................... 27 Table 12. Savings of New Windows in Las Vegas, Nevada .................................................................. 27 Table 13. Savings of New Windows in San Francisco, California ........................................................ 27 Table 14. Savings of New Windows in Washington, D.C. ..................................................................... 28 Table 15. Savings of New Windows in Albuquerque, New Mexico ...................................................... 28 Table 16. Savings of New Windows in Seattle, Washington ................................................................ 28 Table 17. Properties of Windows Used in Climate Zones 5–8 .............................................................. 29 Table 18. Savings of New Windows in Chicago, Illinois ....................................................................... 30 Table 19. Savings of New Windows in Boston, Massachusetts ........................................................... 30 Table 20. Savings of New Windows in Denver, Colorado ..................................................................... 30 Table 21. Savings of New Windows in Minneapolis, Minnesota .......................................................... 31 Table 22. Savings of New Windows in Billings, Montana ..................................................................... 31 Table 23. Savings of New Windows in Bismarck, North Dakota .......................................................... 31 Table 24. Savings of New Windows in Fairbanks, Alaska .................................................................... 32 Table 25. Properties of Windows Used in Climate Zones 1 and 2 ....................................................... 33 Table 26. Savings of Replacement Windows in Miami, Florida ............................................................ 34 Table 27. Savings of Replacement Windows in Houston, Texas ......................................................... 34 Table 28. Savings of Replacement Windows in Phoenix, Arizona ....................................................... 34 Table 29. Properties of Windows Used in Climate Zones 3 and 4 ....................................................... 35 Table 30. Savings of Replacement Windows in Atlanta, Georgia ........................................................ 36 Table 31. Savings of Replacement Windows in Las Vegas, Nevada ................................................... 36 Table 32. Savings of Replacement Windows in San Francisco, California ........................................ 36 Table 33. Savings of Replacement Windows in Washington, D.C. ...................................................... 37 Table 34. Savings of Replacement Windows in Albuquerque, New Mexico ....................................... 37 Table 35. Savings of Replacement Windows in Seattle, Washington ................................................. 37 Table 36. Properties of Windows Used in Climate Zones 5–8 .............................................................. 38 Table 37. Savings of Replacement Windows in Chicago, Illinois ........................................................ 39 Table 38. Savings of Replacement Windows in Boston, Massachusetts ........................................... 39 Table 39. Savings of Replacement Windows in Denver, Colorado ...................................................... 39 Table 40. Savings of Replacement Windows in Minneapolis, Minnesota ........................................... 40 Table 41. Savings of Replacement Windows in Billings, Montana ...................................................... 40 Table 42. Savings of Replacement Windows in Bismarck, North Dakota ........................................... 40 Table 43. Savings of Replacement Windows in Fairbanks, Alaska ..................................................... 41 Table 44. Example of Window Costs ....................................................................................................... 42 Table 45. Simple Payback for New Windows ......................................................................................... 42 Table 46. Simple Payback for Replacement Windows .......................................................................... 43 Table 47. Winter and Summer Comfort Index for Typical Windows .................................................... 48 Unless otherwise noted, all figures were created by the NorthernSTAR team.
ix
Definitions
AAMA American Architectural Manufacturers Association
AL Air leakage
ASHRAE American Society of Heating, Refrigerating and Air-Conditioning Engineers
ASTM formerly American Society for Testing and Materials
CR Condensation resistance
DOE U.S. Department of Energy
EIA Energy Information Administration
EPA U.S. Environmental Protection Agency
EWC Efficient Windows Collaborative
HVAC Heating, ventilation, and air conditioning
IECC International Energy Conservation Code
IGU Insulating glass unit
LBNL Lawrence Berkley National Laboratory
LCC Life cycle costs
LCCA Life cycle cost analysis
Low-e Low-emittance coating
MBtu Million (106) Btu
NFRC National Fenestration Rating Council
RECA Responsible Energy Codes Alliance
SHGC Solar heat gain coefficient
VT Visible transmittance
x
Executive Summary
This measure guideline helps builders, homeowners, and designers select energy-efficient windows in new and existing residential construction in all U.S. climate zones. It includes information about window products, attributes, and performance. It provides cost/benefit information about window energy savings and about nonenergy benefits such as thermal comfort and reduced heating, ventilation, and air conditioning demands. The guideline also provides information about the energy impacts of design decisions such as window orientation, total glazing area, shading conditions, and about proper window installation. The guideline is intended to complement other Building America information and efforts.
Windows are an important component of the energy performance of any house. They are also one of the more costly and multifaceted building products with a wide range of technology options. Up-to-date information about window products, attributes, and performance is needed in the Building America Program to reach the higher levels of overall energy efficiency that are targeted. Over the last 20 years, window technology and building codes have advanced to the point where low-e windows are commonplace and often required. However, optimizing window technology and related design decisions is not well understood.
xi
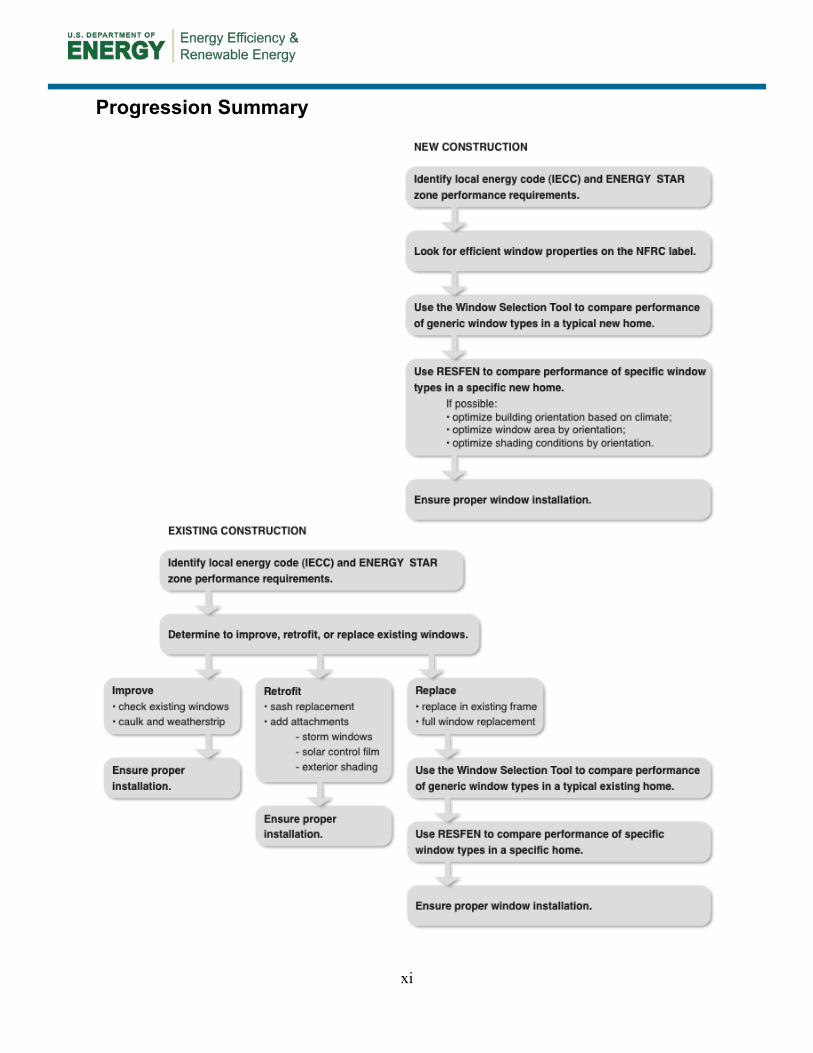
Progression Summary
1
1 Introduction Residential buildings consume about 21% of the total energy in the United States. According to Lawrence Berkeley National Laboratory (LBNL), windows are responsible for 25%–30% of residential heating and cooling energy use (about 2.5 quadrillion Btu). Upgrading the current window stock to ENERGY STAR® performance could save more than 1 quadrillion Btu. Upgrading the current window stock to the U.S. Department of Energy’s long-term performance goals (U-factor = 0.1 with dynamic solar control) could save more than 2 quadrillion Btu.
This measure guideline provides information to help homeowners, builders, and designers select energy-efficient windows. Section 2 provides an overview of measuring window performance. Section 3 describes window technologies, including glazing types, low conductance spacers and gas fills, and frame types. Section 4 leads the user through a step-by-step window selection process involving codes, the ENERGY STAR program, and the use of tools such as the Efficient Windows Collaborative’s (EWC) Window Selection Tool and RESFEN. In Section 5, the energy savings are shown for several window types in 16 cities representing the full range of U.S. climate zones. Savings are shown in the context of new and replacement windows. Section 5 also includes a discussion of window costs, life cycle cost (LCC) issues, and other benefits. Section 6 addresses the impact of design conditions such as orientation, window area, and shading on performance, and Section 7 summarizes key issues in window installation. Resources are provided in the References section.
2
2 Measuring Window Performance
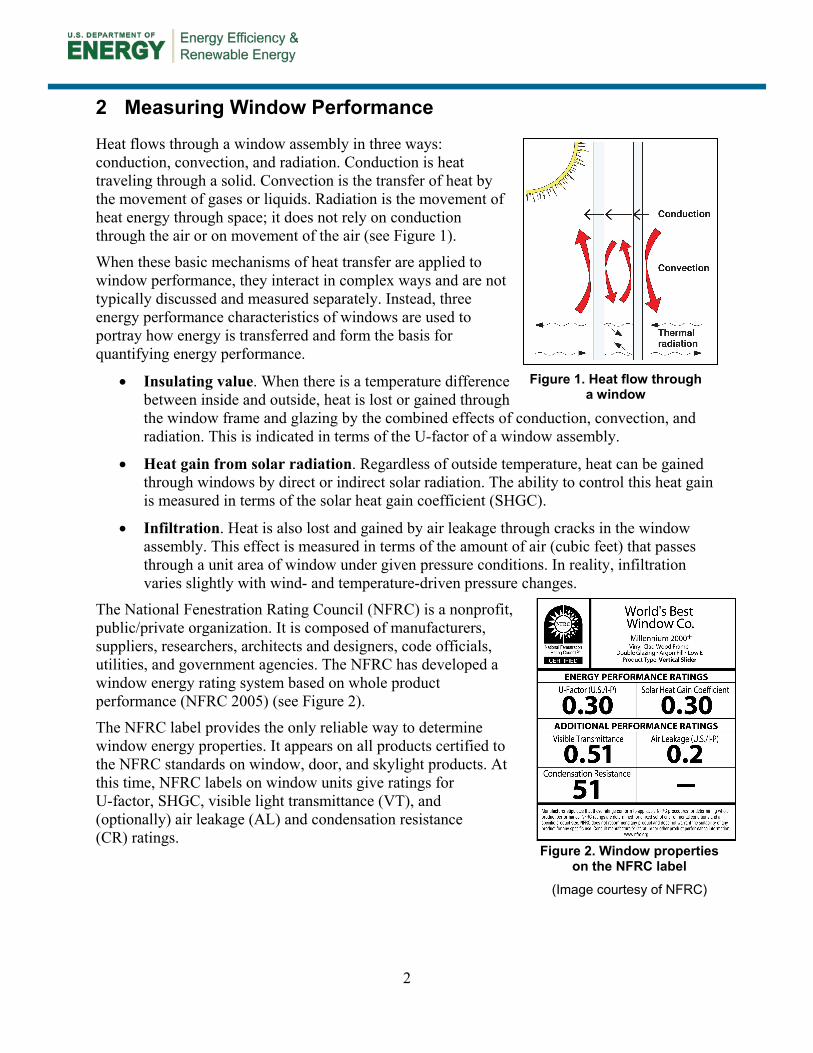
Heat flows through a window assembly in three ways: conduction, convection, and radiation. Conduction is heat traveling through a solid. Convection is the transfer of heat by the movement of gases or liquids. Radiation is the movement of heat energy through space; it does not rely on conduction through the air or on movement of the air (see Figure 1).
When these basic mechanisms of heat transfer are applied to window performance, they interact in complex ways and are not typically discussed and measured separately. Instead, three energy performance characteristics of windows are used to portray how energy is transferred and form the basis for quantifying energy performance.
• Insulating value. When there is a temperature difference between inside and outside, heat is lost or gained through the window frame and glazing by the combined effects of conduction, convection, and radiation. This is indicated in terms of the U-factor of a window assembly.
• Heat gain from solar radiation. Regardless of outside temperature, heat can be gained through windows by direct or indirect solar radiation. The ability to control this heat gain is measured in terms of the solar heat gain coefficient (SHGC).
• Infiltration. Heat is also lost and gained by air leakage through cracks in the window assembly. This effect is measured in terms of the amount of air (cubic feet) that passes through a unit area of window under given pressure conditions. In reality, infiltration varies slightly with wind- and temperature-driven pressure changes.
The National Fenestration Rating Council (NFRC) is a nonprofit, public/private organization. It is composed of manufacturers, suppliers, researchers, architects and designers, code officials, utilities, and government agencies. The NFRC has developed a window energy rating system based on whole product performance (NFRC 2005) (see Figure 2).
The NFRC label provides the only reliable way to determine window energy properties. It appears on all products certified to the NFRC standards on window, door, and skylight products. At this time, NFRC labels on window units give ratings for U-factor, SHGC, visible light transmittance (VT), and (optionally) air leakage (AL) and condensation resistance (CR) ratings.
Figure 2. Window properties on the NFRC label
(Image courtesy of NFRC)
Figure 1. Heat flow through a window
3
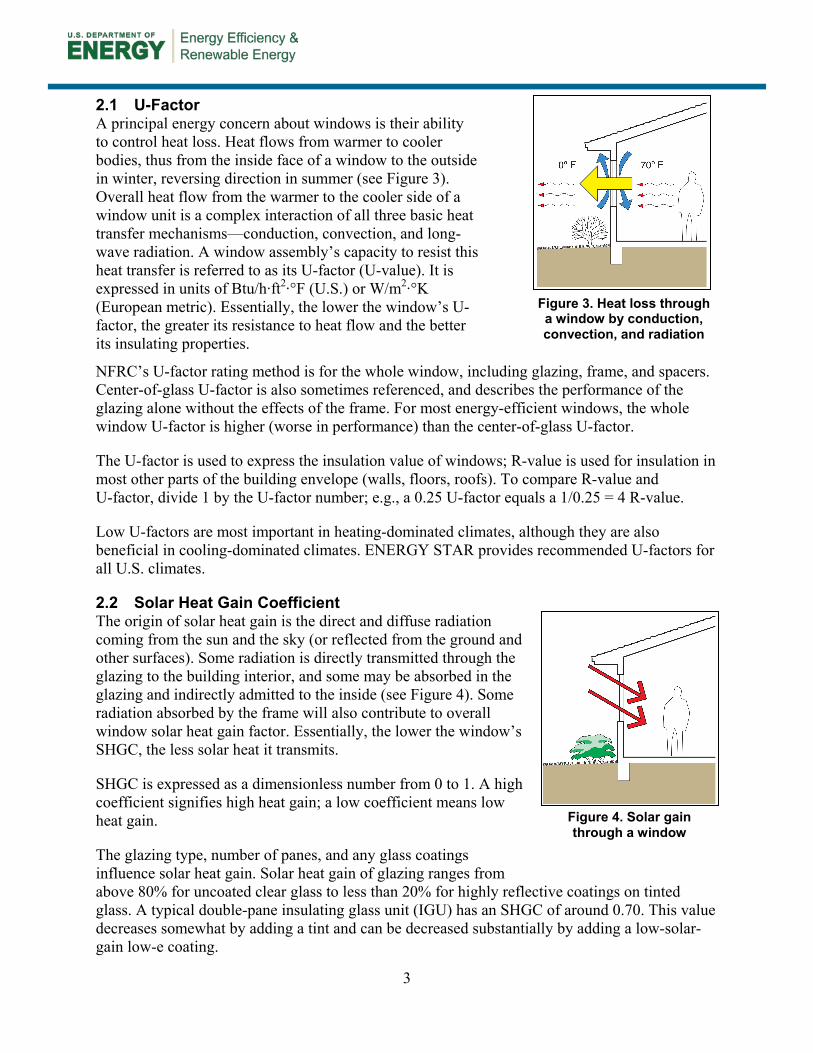
2.1 U-Factor A principal energy concern about windows is their ability to control heat loss. Heat flows from warmer to cooler bodies, thus from the inside face of a window to the outside in winter, reversing direction in summer (see Figure 3). Overall heat flow from the warmer to the cooler side of a window unit is a complex interaction of all three basic heat transfer mechanisms—conduction, convection, and long-wave radiation. A window assembly’s capacity to resist this heat transfer is referred to as its U-factor (U-value). It is expressed in units of Btu/h∙ft2∙°F (U.S.) or W/m2∙°K (European metric). Essentially, the lower the window’s U-factor, the greater its resistance to heat flow and the better its insulating properties.
NFRC’s U-factor rating method is for the whole window, including glazing, frame, and spacers. Center-of-glass U-factor is also sometimes referenced, and describes the performance of the glazing alone without the effects of the frame. For most energy-efficient windows, the whole window U-factor is higher (worse in performance) than the center-of-glass U-factor.
The U-factor is used to express the insulation value of windows; R-value is used for insulation in most other parts of the building envelope (walls, floors, roofs). To compare R-value and U-factor, divide 1 by the U-factor number; e.g., a 0.25 U-factor equals a 1/0.25 = 4 R-value.
Low U-factors are most important in heating-dominated climates, although they are also beneficial in cooling-dominated climates. ENERGY STAR provides recommended U-factors for all U.S. climates.
2.2 Solar Heat Gain Coefficient The origin of solar heat gain is the direct and diffuse radiation coming from the sun and the sky (or reflected from the ground and other surfaces). Some radiation is directly transmitted through the glazing to the building interior, and some may be absorbed in the glazing and indirectly admitted to the inside (see Figure 4). Some radiation absorbed by the frame will also contribute to overall window solar heat gain factor. Essentially, the lower the window’s SHGC, the less solar heat it transmits.
SHGC is expressed as a dimensionless number from 0 to 1. A high coefficient signifies high heat gain; a low coefficient means low heat gain.
The glazing type, number of panes, and any glass coatings influence solar heat gain. Solar heat gain of glazing ranges from above 80% for uncoated clear glass to less than 20% for highly reflective coatings on tinted glass. A typical double-pane insulating glass unit (IGU) has an SHGC of around 0.70. This value decreases somewhat by adding a tint and can be decreased substantially by adding a low-solar-gain low-e coating.
Figure 3. Heat loss through a window by conduction, convection, and radiation
Figure 4. Solar gain through a window
4
NFRC’s SHGC rating method is for the whole window, including the effects of the frame. The area of a frame has a very low SHGC, so the overall window SHGC is lower than the center-of-glass value. Alternatively, the center-of-glass SHGC, which describes the effect of the glazing alone, is sometimes referenced.
Solar heat gain can provide free heat in the winter but can also lead to overheating in the summer. The best balance of solar heat gain with an appropriate SHGC depends on climate, orientation, shading conditions, and other factors. ENERGY STAR provides simplified guidance on recommended SHGC values for all U.S. climates.
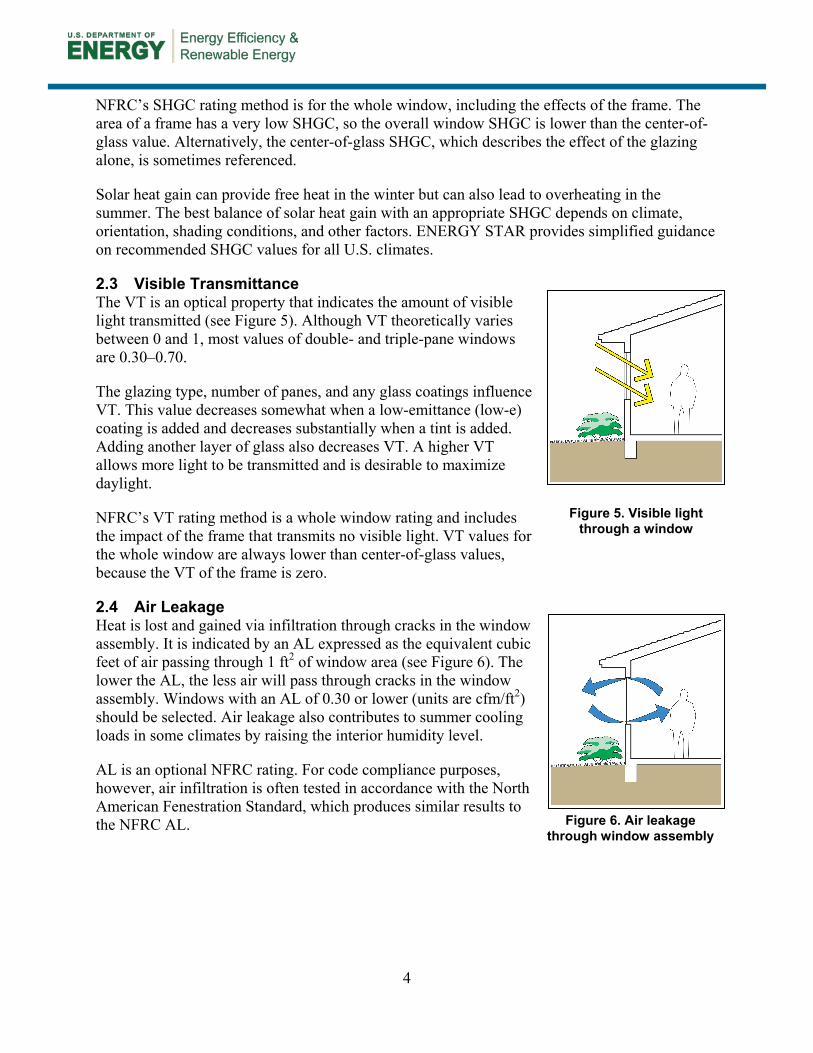
2.3 Visible Transmittance The VT is an optical property that indicates the amount of visible light transmitted (see Figure 5). Although VT theoretically varies between 0 and 1, most values of double- and triple-pane windows are 0.30–0.70.
The glazing type, number of panes, and any glass coatings influence VT. This value decreases somewhat when a low-emittance (low-e) coating is added and decreases substantially when a tint is added. Adding another layer of glass also decreases VT. A higher VT allows more light to be transmitted and is desirable to maximize daylight.
NFRC’s VT rating method is a whole window rating and includes the impact of the frame that transmits no visible light. VT values for the whole window are always lower than center-of-glass values, because the VT of the frame is zero.
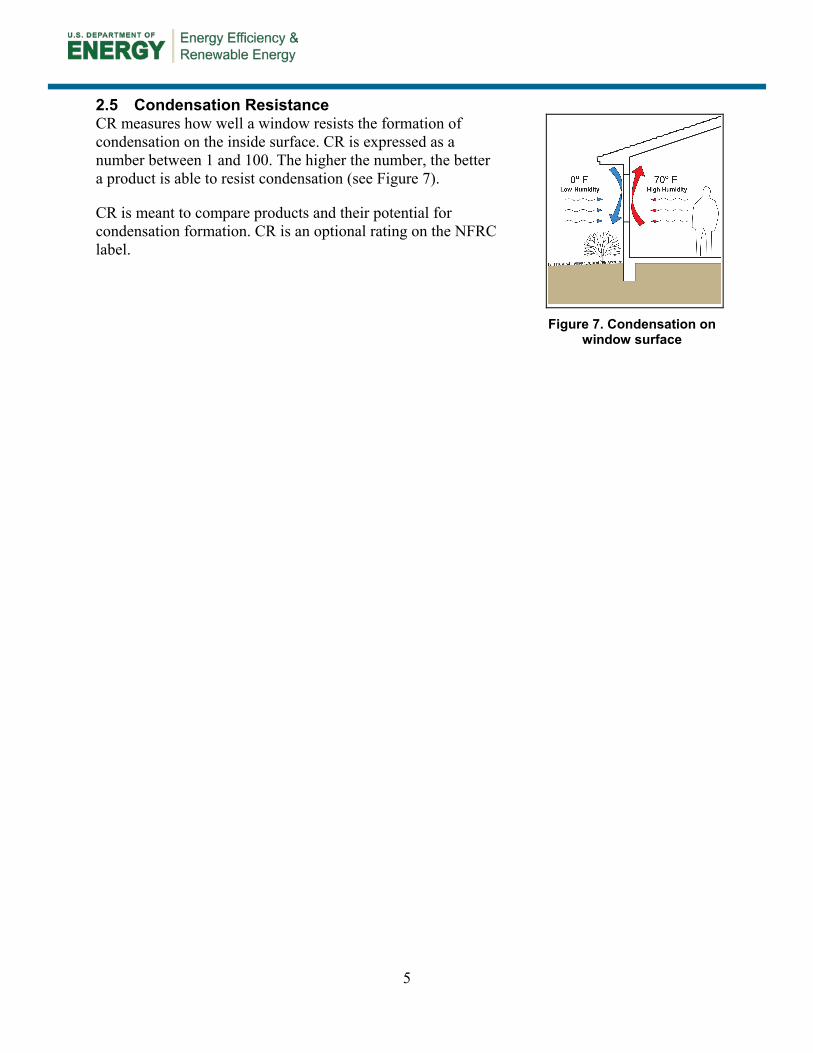
2.4 Air Leakage Heat is lost and gained via infiltration through cracks in the window assembly. It is indicated by an AL expressed as the equivalent cubic feet of air passing through 1 ft2 of window area (see Figure 6). The lower the AL, the less air will pass through cracks in the window assembly. Windows with an AL of 0.30 or lower (units are cfm/ft2) should be selected. Air leakage also contributes to summer cooling loads in some climates by raising the interior humidity level.
AL is an optional NFRC rating. For code compliance purposes, however, air infiltration is often tested in accordance with the North American Fenestration Standard, which produces similar results to the NFRC AL. Figure 6. Air leakage
through window assembly
Figure 5. Visible light through a window
5
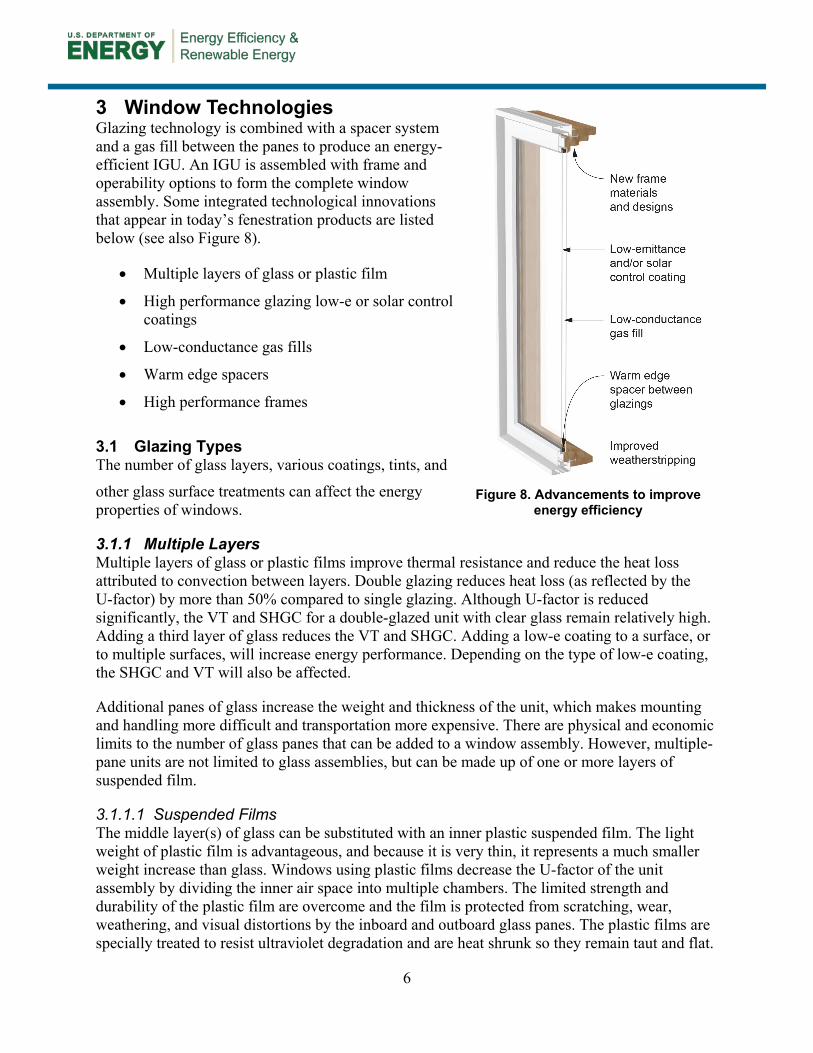
2.5 Condensation Resistance CR measures how well a window resists the formation of condensation on the inside surface. CR is expressed as a number between 1 and 100. The higher the number, the better a product is able to resist condensation (see Figure 7).
CR is meant to compare products and their potential for condensation formation. CR is an optional rating on the NFRC label.
Figure 7. Condensation on
window surface
6
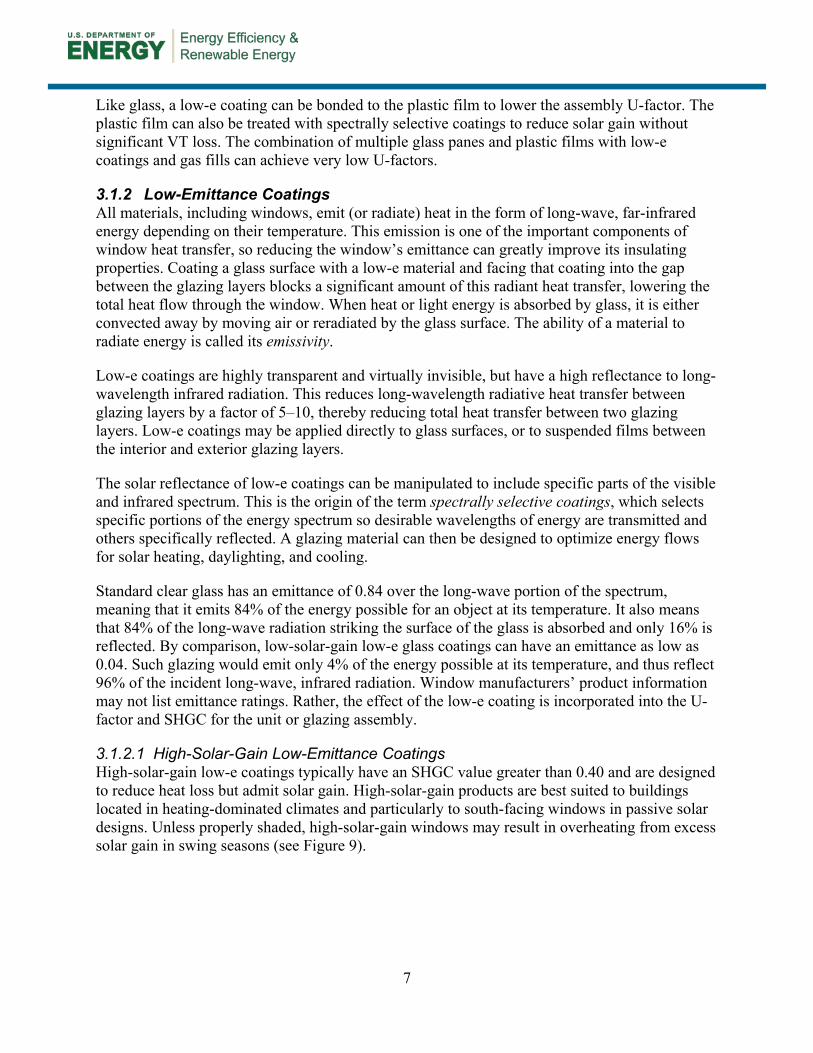
3 Window Technologies Glazing technology is combined with a spacer system and a gas fill between the panes to produce an energy-efficient IGU. An IGU is assembled with frame and operability options to form the complete window assembly. Some integrated technological innovations that appear in today’s fenestration products are listed below (see also Figure 8).
• Multiple layers of glass or plastic film
• High performance glazing low-e or solar control coatings
• Low-conductance gas fills
• Warm edge spacers
• High performance frames
3.1 Glazing Types The number of glass layers, various coatings, tints, and
other glass surface treatments can affect the energy properties of windows.
3.1.1 Multiple Layers Multiple layers of glass or plastic films improve thermal resistance and reduce the heat loss attributed to convection between layers. Double glazing reduces heat loss (as reflected by the U-factor) by more than 50% compared to single glazing. Although U-factor is reduced significantly, the VT and SHGC for a double-glazed unit with clear glass remain relatively high. Adding a third layer of glass reduces the VT and SHGC. Adding a low-e coating to a surface, or to multiple surfaces, will increase energy performance. Depending on the type of low-e coating, the SHGC and VT will also be affected.
Additional panes of glass increase the weight and thickness of the unit, which makes mounting and handling more difficult and transportation more expensive. There are physical and economic limits to the number of glass panes that can be added to a window assembly. However, multiple-pane units are not limited to glass assemblies, but can be made up of one or more layers of suspended film.
3.1.1.1 Suspended Films The middle layer(s) of glass can be substituted with an inner plastic suspended film. The light weight of plastic film is advantageous, and because it is very thin, it represents a much smaller weight increase than glass. Windows using plastic films decrease the U-factor of the unit assembly by dividing the inner air space into multiple chambers. The limited strength and durability of the plastic film are overcome and the film is protected from scratching, wear, weathering, and visual distortions by the inboard and outboard glass panes. The plastic films are specially treated to resist ultraviolet degradation and are heat shrunk so they remain taut and flat.
Figure 8. Advancements to improve energy efficiency
7
Like glass, a low-e coating can be bonded to the plastic film to lower the assembly U-factor. The plastic film can also be treated with spectrally selective coatings to reduce solar gain without significant VT loss. The combination of multiple glass panes and plastic films with low-e coatings and gas fills can achieve very low U-factors.
3.1.2 Low-Emittance Coatings All materials, including windows, emit (or radiate) heat in the form of long-wave, far-infrared energy depending on their temperature. This emission is one of the important components of window heat transfer, so reducing the window’s emittance can greatly improve its insulating properties. Coating a glass surface with a low-e material and facing that coating into the gap between the glazing layers blocks a significant amount of this radiant heat transfer, lowering the total heat flow through the window. When heat or light energy is absorbed by glass, it is either convected away by moving air or reradiated by the glass surface. The ability of a material to radiate energy is called its emissivity.
Low-e coatings are highly transparent and virtually invisible, but have a high reflectance to long-wavelength infrared radiation. This reduces long-wavelength radiative heat transfer between glazing layers by a factor of 5–10, thereby reducing total heat transfer between two glazing layers. Low-e coatings may be applied directly to glass surfaces, or to suspended films between the interior and exterior glazing layers.
The solar reflectance of low-e coatings can be manipulated to include specific parts of the visible and infrared spectrum. This is the origin of the term spectrally selective coatings, which selects specific portions of the energy spectrum so desirable wavelengths of energy are transmitted and others specifically reflected. A glazing material can then be designed to optimize energy flows for solar heating, daylighting, and cooling.
Standard clear glass has an emittance of 0.84 over the long-wave portion of the spectrum, meaning that it emits 84% of the energy possible for an object at its temperature. It also means that 84% of the long-wave radiation striking the surface of the glass is absorbed and only 16% is reflected. By comparison, low-solar-gain low-e glass coatings can have an emittance as low as 0.04. Such glazing would emit only 4% of the energy possible at its temperature, and thus reflect 96% of the incident long-wave, infrared radiation. Window manufacturers’ product information may not list emittance ratings. Rather, the effect of the low-e coating is incorporated into the U-factor and SHGC for the unit or glazing assembly.
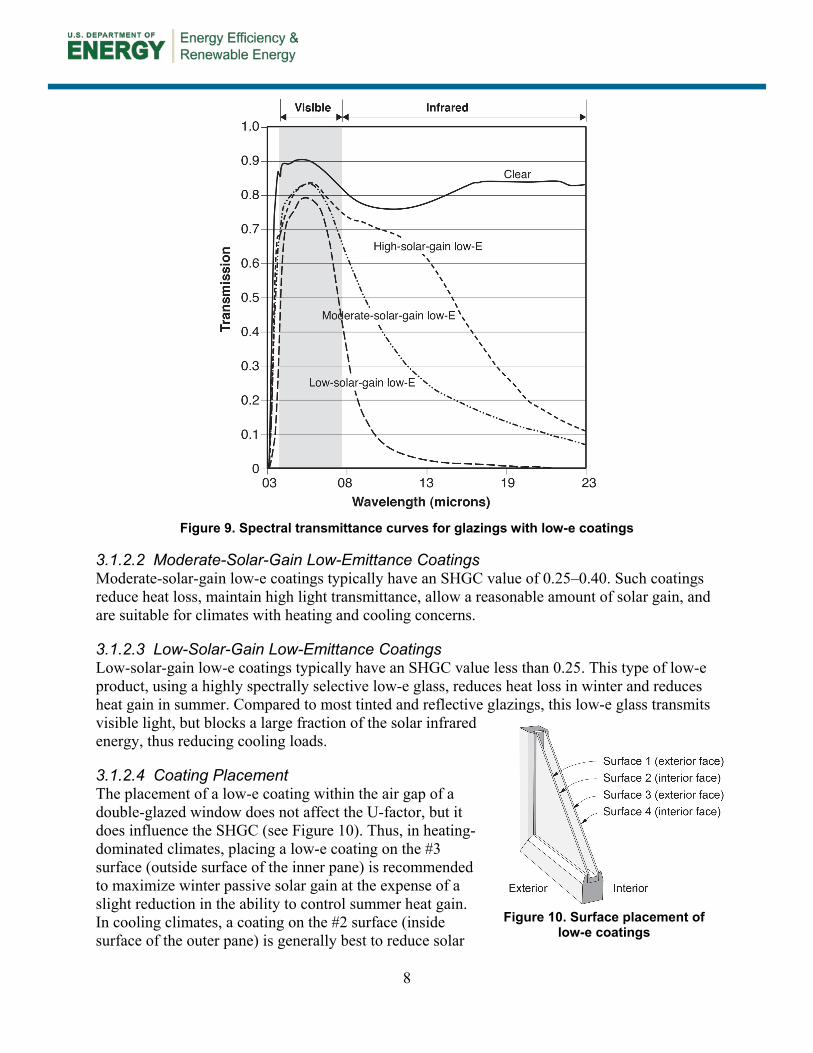
3.1.2.1 High-Solar-Gain Low-Emittance Coatings High-solar-gain low-e coatings typically have an SHGC value greater than 0.40 and are designed to reduce heat loss but admit solar gain. High-solar-gain products are best suited to buildings located in heating-dominated climates and particularly to south-facing windows in passive solar designs. Unless properly shaded, high-solar-gain windows may result in overheating from excess solar gain in swing seasons (see Figure 9).
8
3.1.2.2 Moderate-Solar-Gain Low-Emittance Coatings Moderate-solar-gain low-e coatings typically have an SHGC value of 0.25–0.40. Such coatings reduce heat loss, maintain high light transmittance, allow a reasonable amount of solar gain, and are suitable for climates with heating and cooling concerns.
3.1.2.3 Low-Solar-Gain Low-Emittance Coatings Low-solar-gain low-e coatings typically have an SHGC value less than 0.25. This type of low-e product, using a highly spectrally selective low-e glass, reduces heat loss in winter and reduces heat gain in summer. Compared to most tinted and reflective glazings, this low-e glass transmits visible light, but blocks a large fraction of the solar infrared energy, thus reducing cooling loads.
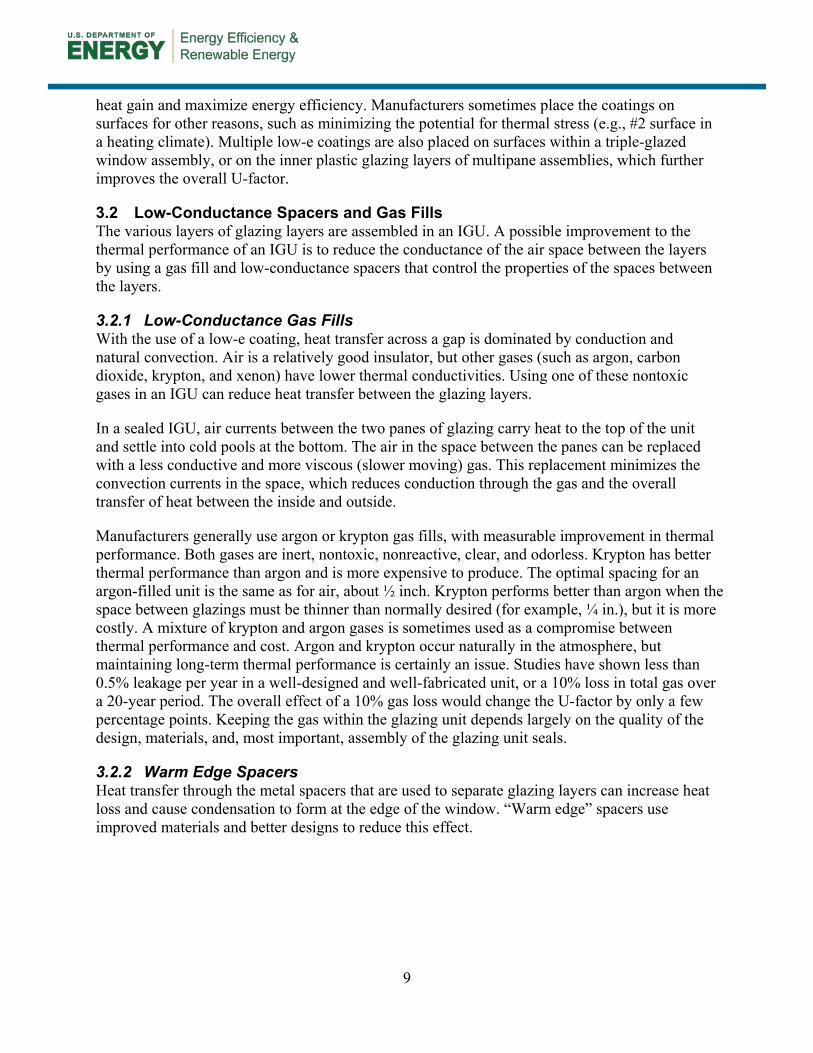
3.1.2.4 Coating Placement The placement of a low-e coating within the air gap of a double-glazed window does not affect the U-factor, but it does influence the SHGC (see Figure 10). Thus, in heating-dominated climates, placing a low-e coating on the #3 surface (outside surface of the inner pane) is recommended to maximize winter passive solar gain at the expense of a slight reduction in the ability to control summer heat gain. In cooling climates, a coating on the #2 surface (inside surface of the outer pane) is generally best to reduce solar
Figure 9. Spectral transmittance curves for glazings with low-e coatings
Figure 10. Surface placement of low-e coatings
9
heat gain and maximize energy efficiency. Manufacturers sometimes place the coatings on surfaces for other reasons, such as minimizing the potential for thermal stress (e.g., #2 surface in a heating climate). Multiple low-e coatings are also placed on surfaces within a triple-glazed window assembly, or on the inner plastic glazing layers of multipane assemblies, which further improves the overall U-factor.
3.2 Low-Conductance Spacers and Gas Fills The various layers of glazing layers are assembled in an IGU. A possible improvement to the thermal performance of an IGU is to reduce the conductance of the air space between the layers by using a gas fill and low-conductance spacers that control the properties of the spaces between the layers.
3.2.1 Low-Conductance Gas Fills With the use of a low-e coating, heat transfer across a gap is dominated by conduction and natural convection. Air is a relatively good insulator, but other gases (such as argon, carbon dioxide, krypton, and xenon) have lower thermal conductivities. Using one of these nontoxic gases in an IGU can reduce heat transfer between the glazing layers.
In a sealed IGU, air currents between the two panes of glazing carry heat to the top of the unit and settle into cold pools at the bottom. The air in the space between the panes can be replaced with a less conductive and more viscous (slower moving) gas. This replacement minimizes the convection currents in the space, which reduces conduction through the gas and the overall transfer of heat between the inside and outside.
Manufacturers generally use argon or krypton gas fills, with measurable improvement in thermal performance. Both gases are inert, nontoxic, nonreactive, clear, and odorless. Krypton has better thermal performance than argon and is more expensive to produce. The optimal spacing for an argon-filled unit is the same as for air, about ½ inch. Krypton performs better than argon when the space between glazings must be thinner than normally desired (for example, ¼ in.), but it is more costly. A mixture of krypton and argon gases is sometimes used as a compromise between thermal performance and cost. Argon and krypton occur naturally in the atmosphere, but maintaining long-term thermal performance is certainly an issue. Studies have shown less than 0.5% leakage per year in a well-designed and well-fabricated unit, or a 10% loss in total gas over a 20-year period. The overall effect of a 10% gas loss would change the U-factor by only a few percentage points. Keeping the gas within the glazing unit depends largely on the quality of the design, materials, and, most important, assembly of the glazing unit seals.
3.2.2 Warm Edge Spacers Heat transfer through the metal spacers that are used to separate glazing layers can increase heat loss and cause condensation to form at the edge of the window. “Warm edge” spacers use improved materials and better designs to reduce this effect.
10
The glass lights in an IGU must be held apart at the appropriate distance by spacers. In addition to keeping the glass lights separated, the spacer system must serve a number of functions:
• Accommodate stress induced by thermal expansion and pressure differences.
• Provide a moisture barrier that prevents passage of water or water vapor that would fog the unit.
• Provide a gas-tight seal that prevents the loss of any special low-conductance gas in the air space.
• Create an insulating barrier that reduces the formation of interior condensation at the edge.
The traditional approach for IGUs is to use metal spacers and sealants. These spacers, typically aluminum, also contain a desiccant that absorbs residual moisture. The spacer is sealed to the glass lights with organic sealants that provide structural support and act as a moisture barrier. There are two generic systems for such IGUs: a single-seal spacer and a dual-seal system. Unfortunately, aluminum is an excellent conductor of heat, and the aluminum spacer used in traditional edge systems represents a significant thermal “short circuit” at the edge of the IGU, which reduces the benefits of improved glazings. In addition to the increased heat loss, the colder edge is more prone to condensation. To overcome these problems, warm edge spacers are now used in more than 90% of new windows.
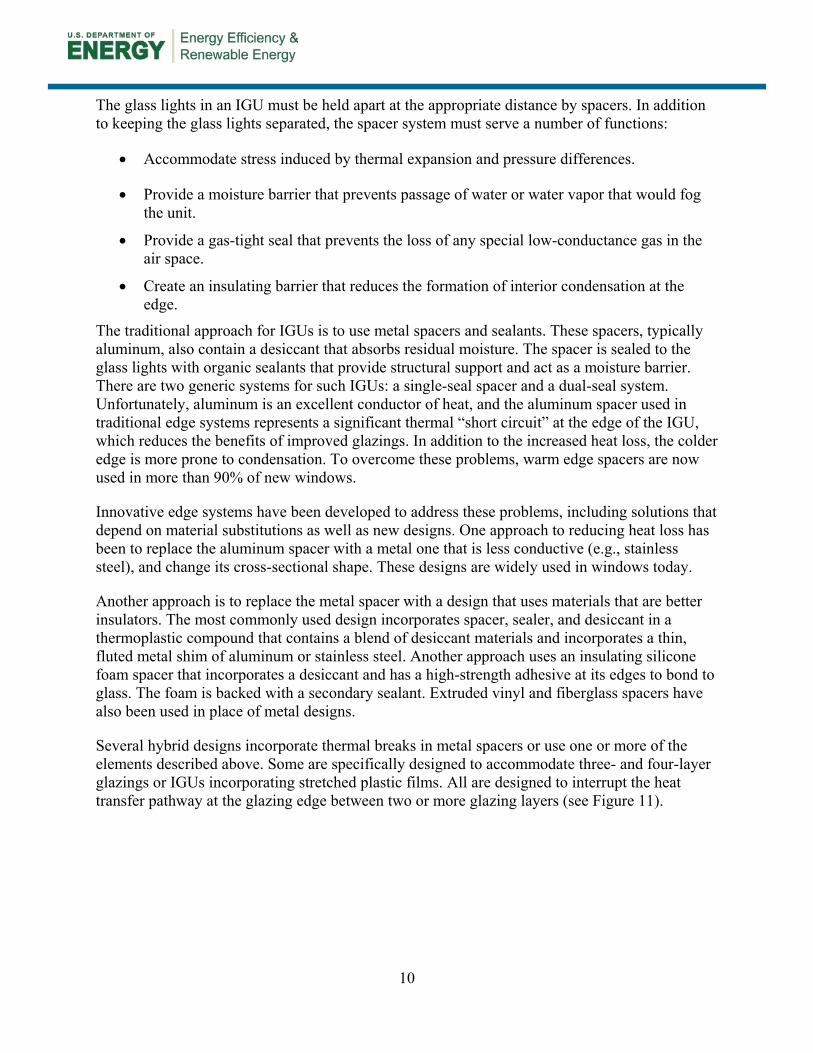
Innovative edge systems have been developed to address these problems, including solutions that depend on material substitutions as well as new designs. One approach to reducing heat loss has been to replace the aluminum spacer with a metal one that is less conductive (e.g., stainless steel), and change its cross-sectional shape. These designs are widely used in windows today.
Another approach is to replace the metal spacer with a design that uses materials that are better insulators. The most commonly used design incorporates spacer, sealer, and desiccant in a thermoplastic compound that contains a blend of desiccant materials and incorporates a thin, fluted metal shim of aluminum or stainless steel. Another approach uses an insulating silicone foam spacer that incorporates a desiccant and has a high-strength adhesive at its edges to bond to glass. The foam is backed with a secondary sealant. Extruded vinyl and fiberglass spacers have also been used in place of metal designs.
Several hybrid designs incorporate thermal breaks in metal spacers or use one or more of the elements described above. Some are specifically designed to accommodate three- and four-layer glazings or IGUs incorporating stretched plastic films. All are designed to interrupt the heat transfer pathway at the glazing edge between two or more glazing layers (see Figure 11).
11
Warm edge spacers have become increasingly important as manufacturers switch from conventional double glazing to high performance glazing. To determine the overall window U-factor, the edge spacer has an effect that extends beyond its physical size to a band about 2½ in. wide. The contribution of this 2½-in.-wide “glass edge” to the total window U-factor depends on the size of the window. For a typical residential-size window (3 ft × 4 ft), changing from a standard aluminum edge spacer to a good-quality warm edge spacer will reduce the overall window U-factor by approximately .02 Btu/h∙ft2∙°F.
A more significant benefit may be the rise in interior surface temperature at the bottom edge of the window, which has the highest risk of condensation. With an outside temperature of 0°F, a thermally improved spacer could result in temperature increases of 6°–8°F at the window sightline—or 4°–6°F at a point 1 in. in from the sightline, which is an important improvement. As new highly insulating multiple layer windows are developed, the improved edge spacer becomes an even more important element (see Figure 12).
Figure 11. Various metal and nonmetal spacer systems
12
3.3 Frame Types 3.3.1 Metal Frames Aluminum is light, strong, durable, and easily extruded into the complex shapes required for window parts. Aluminum window frames are available in anodized and factory-baked enamel finishes that are extremely durable and low maintenance.
The biggest disadvantage of aluminum as a window frame material is its high thermal conductance. It readily conducts heat, greatly raising the overall U-factor of a window unit. In cold climates, a simple aluminum frame can easily become cold enough to condense moisture or frost on the inside surfaces of window frames. This condensation problem, even more than heat loss, has spurred the development of better insulating aluminum frames. In hot climates, where solar gain is often more important than conductive heat transfer, using a higher performance glazing system can be much more important than improving the insulating value of the frame.
3.3.2 Thermally Broken Metal Frames The most common solution to the heat conduction problem of aluminum frames is to provide a “thermal break” by splitting the frame components into interior and exterior pieces and use a less conductive material to join them (see Figures 13 and 14). Current technology with standard thermal breaks has decreased aluminum frame U-factors (heat loss rate) from roughly 2.0 to about 1.0 Btu/h∙ft2∙°F.
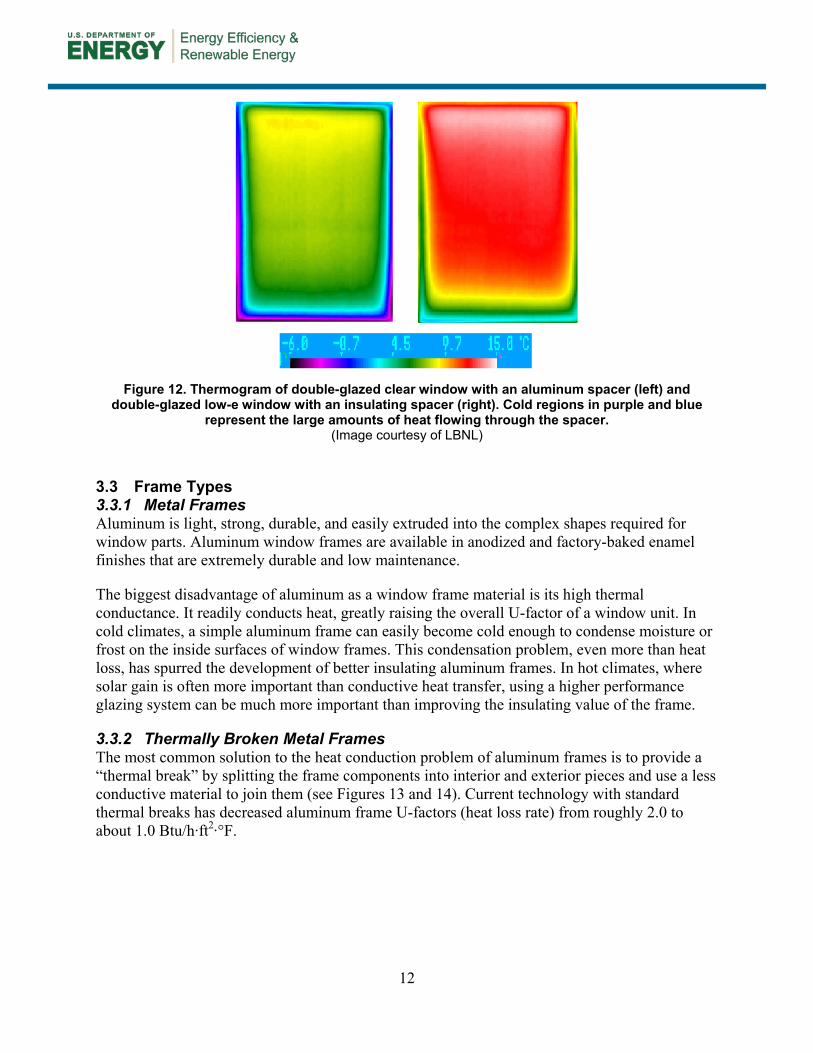
Figure 12. Thermogram of double-glazed clear window with an aluminum spacer (left) and double-glazed low-e window with an insulating spacer (right). Cold regions in purple and blue
represent the large amounts of heat flowing through the spacer. (Image courtesy of LBNL)
13
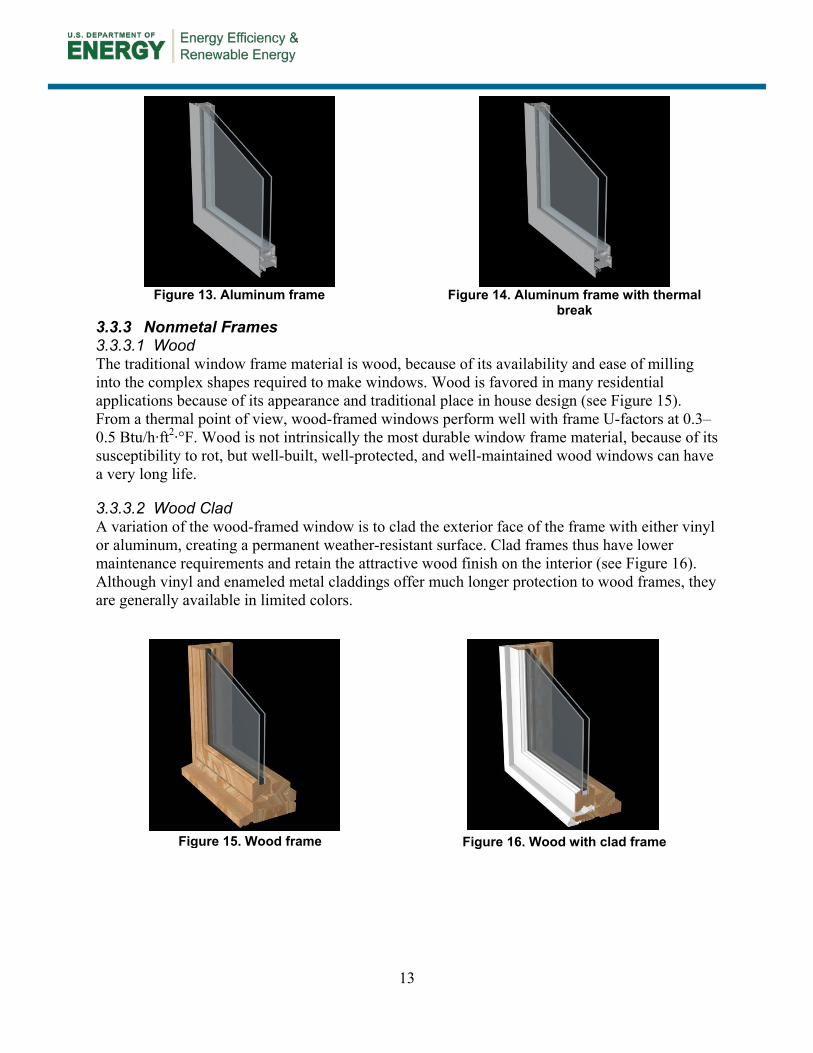
Figure 13. Aluminum frame
Figure 14. Aluminum frame with thermal
break 3.3.3 Nonmetal Frames 3.3.3.1 Wood The traditional window frame material is wood, because of its availability and ease of milling into the complex shapes required to make windows. Wood is favored in many residential applications because of its appearance and traditional place in house design (see Figure 15). From a thermal point of view, wood-framed windows perform well with frame U-factors at 0.3–0.5 Btu/h∙ft2∙°F. Wood is not intrinsically the most durable window frame material, because of its susceptibility to rot, but well-built, well-protected, and well-maintained wood windows can have a very long life.
3.3.3.2 Wood Clad A variation of the wood-framed window is to clad the exterior face of the frame with either vinyl or aluminum, creating a permanent weather-resistant surface. Clad frames thus have lower maintenance requirements and retain the attractive wood finish on the interior (see Figure 16). Although vinyl and enameled metal claddings offer much longer protection to wood frames, they are generally available in limited colors.
Figure 15. Wood frame Figure 16. Wood with clad frame
14
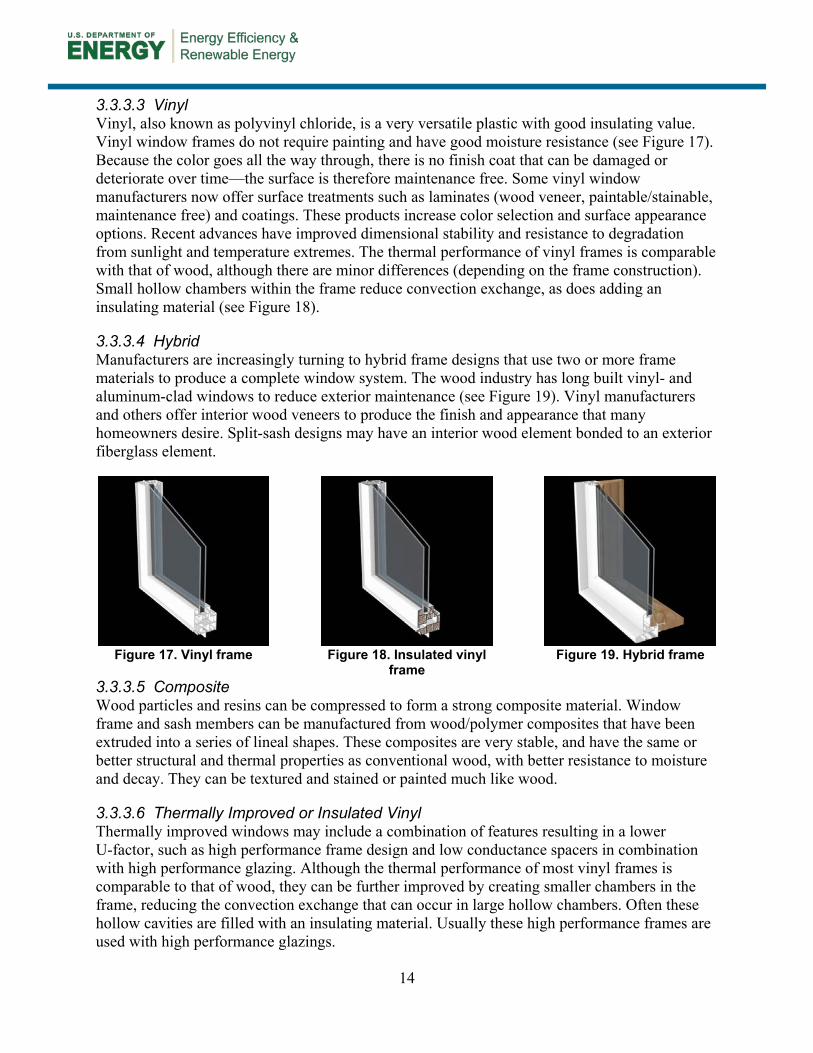
3.3.3.3 Vinyl Vinyl, also known as polyvinyl chloride, is a very versatile plastic with good insulating value. Vinyl window frames do not require painting and have good moisture resistance (see Figure 17). Because the color goes all the way through, there is no finish coat that can be damaged or deteriorate over time—the surface is therefore maintenance free. Some vinyl window manufacturers now offer surface treatments such as laminates (wood veneer, paintable/stainable, maintenance free) and coatings. These products increase color selection and surface appearance options. Recent advances have improved dimensional stability and resistance to degradation from sunlight and temperature extremes. The thermal performance of vinyl frames is comparable with that of wood, although there are minor differences (depending on the frame construction). Small hollow chambers within the frame reduce convection exchange, as does adding an insulating material (see Figure 18).
3.3.3.4 Hybrid Manufacturers are increasingly turning to hybrid frame designs that use two or more frame materials to produce a complete window system. The wood industry has long built vinyl- and aluminum-clad windows to reduce exterior maintenance (see Figure 19). Vinyl manufacturers and others offer interior wood veneers to produce the finish and appearance that many homeowners desire. Split-sash designs may have an interior wood element bonded to an exterior fiberglass element.
Figure 17. Vinyl frame
Figure 18. Insulated vinyl
frame
Figure 19. Hybrid frame
3.3.3.5 Composite Wood particles and resins can be compressed to form a strong composite material. Window frame and sash members can be manufactured from wood/polymer composites that have been extruded into a series of lineal shapes. These composites are very stable, and have the same or better structural and thermal properties as conventional wood, with better resistance to moisture and decay. They can be textured and stained or painted much like wood.
3.3.3.6 Thermally Improved or Insulated Vinyl Thermally improved windows may include a combination of features resulting in a lower U-factor, such as high performance frame design and low conductance spacers in combination with high performance glazing. Although the thermal performance of most vinyl frames is comparable to that of wood, they can be further improved by creating smaller chambers in the frame, reducing the convection exchange that can occur in large hollow chambers. Often these hollow cavities are filled with an insulating material. Usually these high performance frames are used with high performance glazings.
15
As with standard vinyl frames, thermally improved or insulated vinyl frames do not require painting and have good moisture resistance. Because the color goes all the way through, there is no finish coat that can be damaged or that will deteriorate over time. Recent advances have improved dimensional stability and resistance to degradation from sunlight and temperature extremes (see Table 1).
3.3.3.7 Fiberglass or Engineered Thermoplastics Window frames can be made of glass-fiber-reinforced polyester (fiberglass) or engineered thermoplastics that are pultruded into lineal forms and then assembled into windows. These frames are dimensionally stable and have air cavities (similar to vinyl). The frame cavities can be filled with insulation or designed with multiple small chambers to reduce convection exchange. Because these materials are stronger than vinyl, the frames can have smaller cross-sectional shapes and thus less area, and are therefore particularly well suited to hold heavier triple glazing. Usually these high performance frames are used with high performance glazings.
3.3.3.8 Thermally Improved Wood and Composite Frames Wood-framed windows have frame U-factors of 0.30–0.50 Btu/h∙ft2∙°F. Although the absence of frame cavities limits the options to further boost wood frame insulating value, thermal improvements can be achieved through thicker frame design, by avoiding thermal shortcuts through metal parts, and with low conductance spacers.
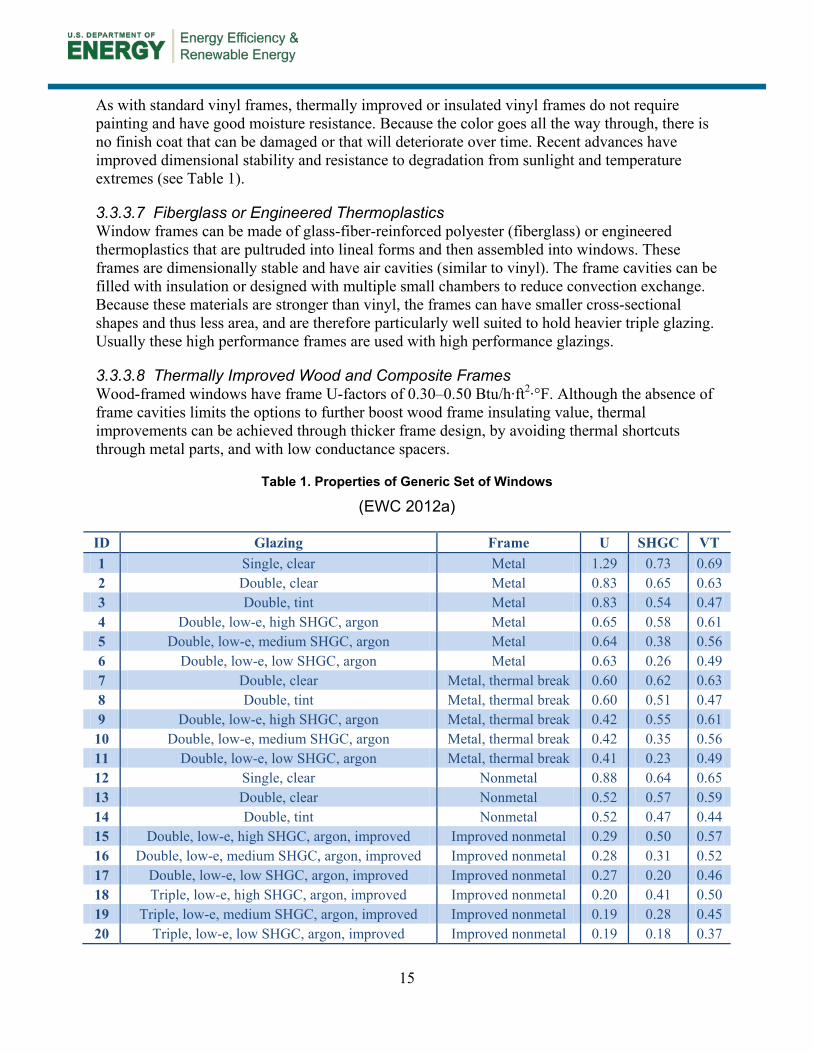
Table 1. Properties of Generic Set of Windows
(EWC 2012a)
ID Glazing Frame U SHGC VT 1 Single, clear Metal 1.29 0.73 0.69 2 Double, clear Metal 0.83 0.65 0.63 3 Double, tint Metal 0.83 0.54 0.47 4 Double, low-e, high SHGC, argon Metal 0.65 0.58 0.61 5 Double, low-e, medium SHGC, argon Metal 0.64 0.38 0.56 6 Double, low-e, low SHGC, argon Metal 0.63 0.26 0.49 7 Double, clear Metal, thermal break 0.60 0.62 0.63 8 Double, tint Metal, thermal break 0.60 0.51 0.47 9 Double, low-e, high SHGC, argon Metal, thermal break 0.42 0.55 0.61
10 Double, low-e, medium SHGC, argon Metal, thermal break 0.42 0.35 0.56 11 Double, low-e, low SHGC, argon Metal, thermal break 0.41 0.23 0.49 12 Single, clear Nonmetal 0.88 0.64 0.65 13 Double, clear Nonmetal 0.52 0.57 0.59 14 Double, tint Nonmetal 0.52 0.47 0.44 15 Double, low-e, high SHGC, argon, improved Improved nonmetal 0.29 0.50 0.57 16 Double, low-e, medium SHGC, argon, improved Improved nonmetal 0.28 0.31 0.52 17 Double, low-e, low SHGC, argon, improved Improved nonmetal 0.27 0.20 0.46 18 Triple, low-e, high SHGC, argon, improved Improved nonmetal 0.20 0.41 0.50 19 Triple, low-e, medium SHGC, argon, improved Improved nonmetal 0.19 0.28 0.45 20 Triple, low-e, low SHGC, argon, improved Improved nonmetal 0.19 0.18 0.37
16
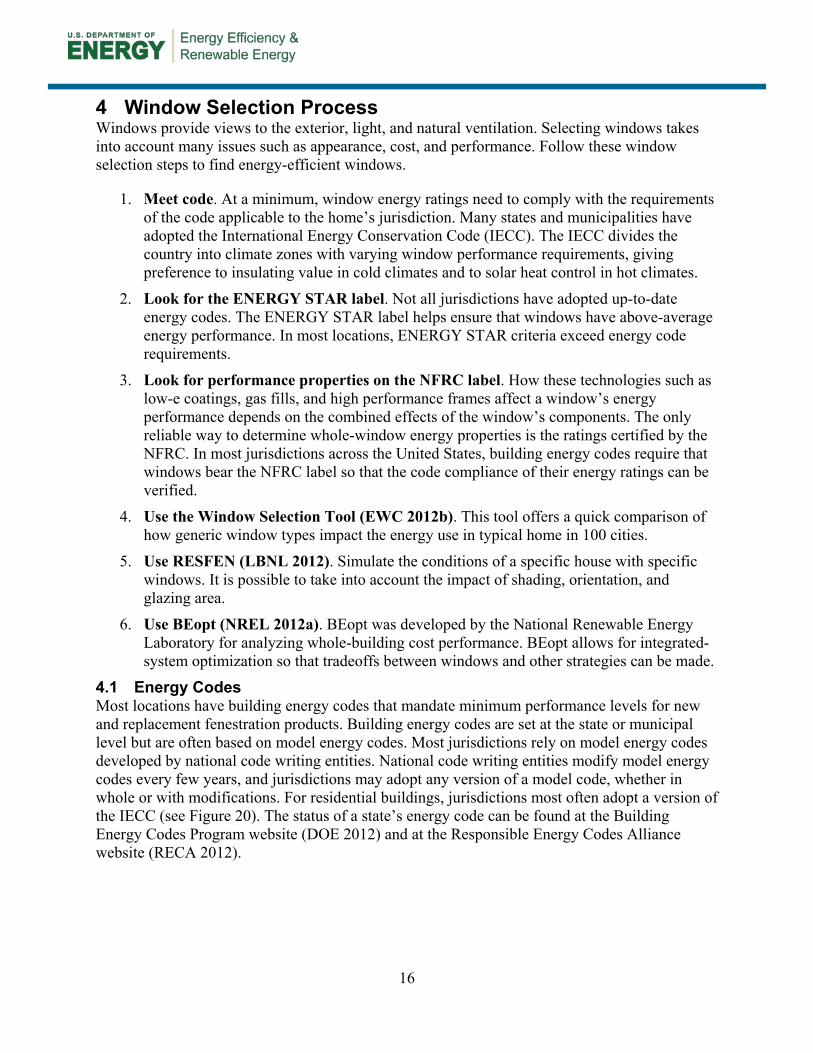
4 Window Selection Process Windows provide views to the exterior, light, and natural ventilation. Selecting windows takes into account many issues such as appearance, cost, and performance. Follow these window selection steps to find energy-efficient windows.
1. Meet code. At a minimum, window energy ratings need to comply with the requirements of the code applicable to the home’s jurisdiction. Many states and municipalities have adopted the International Energy Conservation Code (IECC). The IECC divides the country into climate zones with varying window performance requirements, giving preference to insulating value in cold climates and to solar heat control in hot climates.
2. Look for the ENERGY STAR label. Not all jurisdictions have adopted up-to-date energy codes. The ENERGY STAR label helps ensure that windows have above-average energy performance. In most locations, ENERGY STAR criteria exceed energy code requirements.
3. Look for performance properties on the NFRC label. How these technologies such as low-e coatings, gas fills, and high performance frames affect a window’s energy performance depends on the combined effects of the window’s components. The only reliable way to determine whole-window energy properties is the ratings certified by the NFRC. In most jurisdictions across the United States, building energy codes require that windows bear the NFRC label so that the code compliance of their energy ratings can be verified.
4. Use the Window Selection Tool (EWC 2012b). This tool offers a quick comparison of how generic window types impact the energy use in typical home in 100 cities.
5. Use RESFEN (LBNL 2012). Simulate the conditions of a specific house with specific windows. It is possible to take into account the impact of shading, orientation, and glazing area.
6. Use BEopt (NREL 2012a). BEopt was developed by the National Renewable Energy Laboratory for analyzing whole-building cost performance. BEopt allows for integrated-system optimization so that tradeoffs between windows and other strategies can be made.
4.1 Energy Codes Most locations have building energy codes that mandate minimum performance levels for new and replacement fenestration products. Building energy codes are set at the state or municipal level but are often based on model energy codes. Most jurisdictions rely on model energy codes developed by national code writing entities. National code writing entities modify model energy codes every few years, and jurisdictions may adopt any version of a model code, whether in whole or with modifications. For residential buildings, jurisdictions most often adopt a version of the IECC (see Figure 20). The status of a state’s energy code can be found at the Building Energy Codes Program website (DOE 2012) and at the Responsible Energy Codes Alliance website (RECA 2012).
17
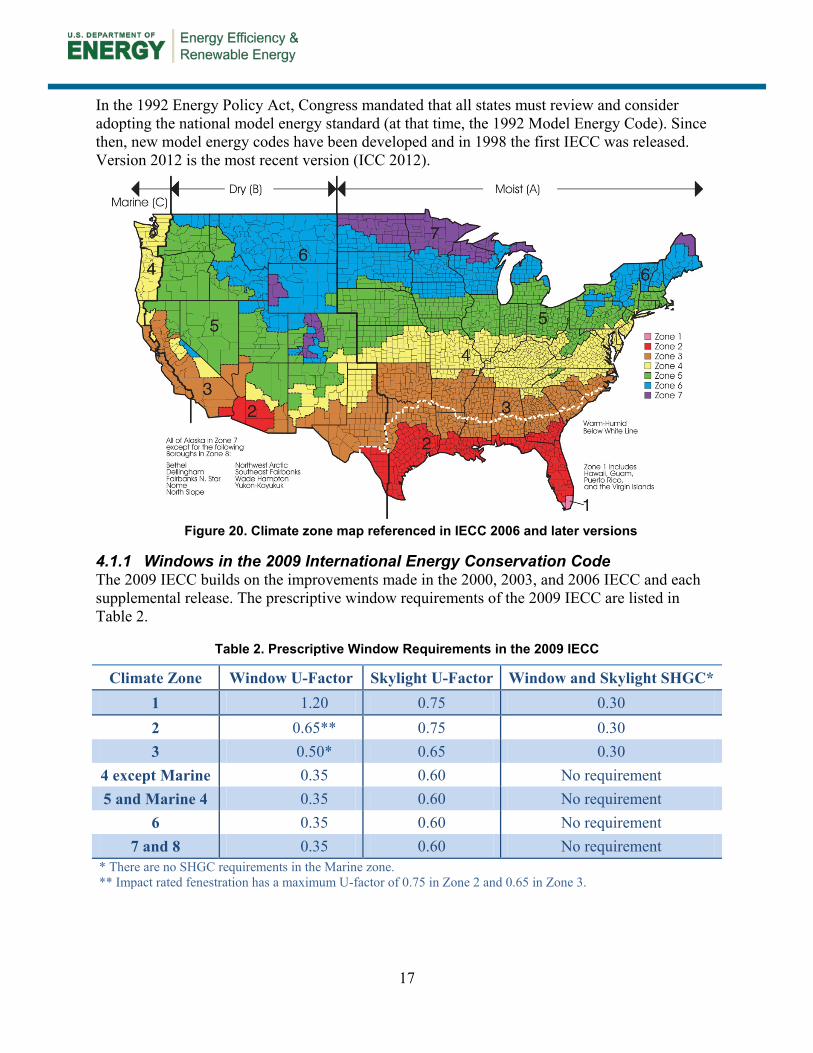
In the 1992 Energy Policy Act, Congress mandated that all states must review and consider adopting the national model energy standard (at that time, the 1992 Model Energy Code). Since then, new model energy codes have been developed and in 1998 the first IECC was released. Version 2012 is the most recent version (ICC 2012).
4.1.1 Windows in the 2009 International Energy Conservation Code The 2009 IECC builds on the improvements made in the 2000, 2003, and 2006 IECC and each supplemental release. The prescriptive window requirements of the 2009 IECC are listed in Table 2.
Table 2. Prescriptive Window Requirements in the 2009 IECC
Climate Zone Window U-Factor Skylight U-Factor Window and Skylight SHGC* 1 1.20 0.75 0.30 2 0.65** 0.75 0.30 3 0.50* 0.65 0.30
4 except Marine 0.35 0.60 No requirement 5 and Marine 4 0.35 0.60 No requirement
6 0.35 0.60 No requirement 7 and 8 0.35 0.60 No requirement
* There are no SHGC requirements in the Marine zone. ** Impact rated fenestration has a maximum U-factor of 0.75 in Zone 2 and 0.65 in Zone 3.
Figure 20. Climate zone map referenced in IECC 2006 and later versions
18
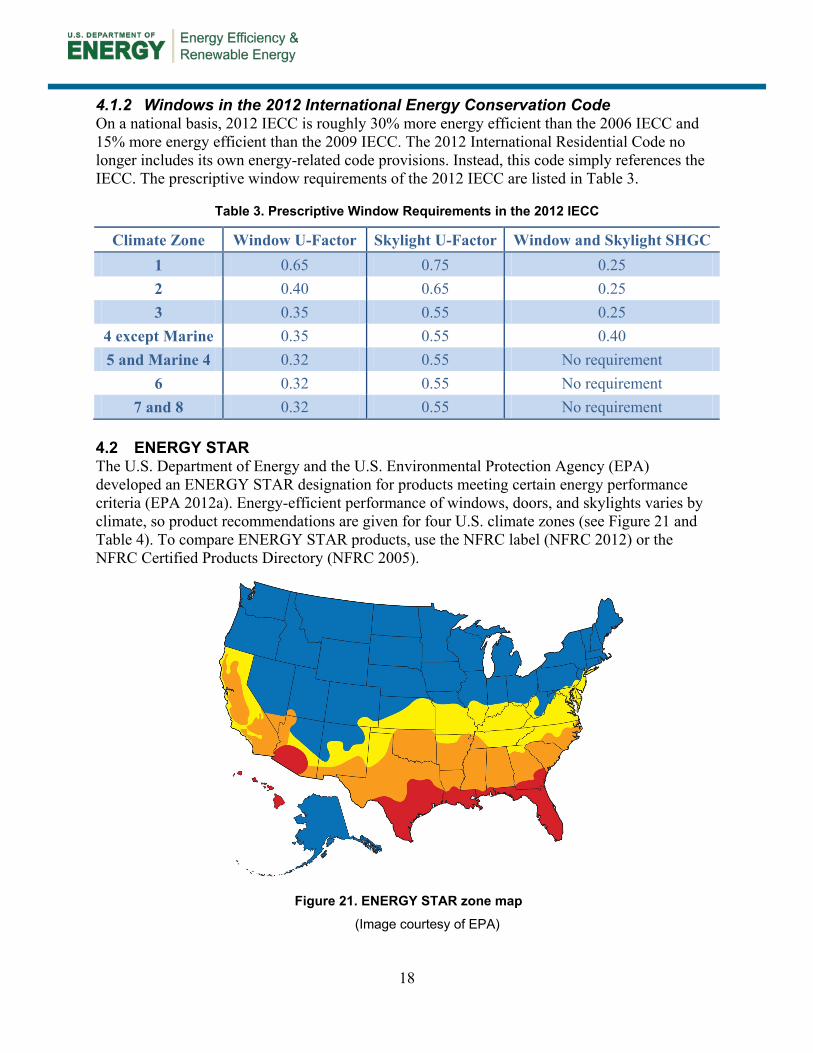
4.1.2 Windows in the 2012 International Energy Conservation Code On a national basis, 2012 IECC is roughly 30% more energy efficient than the 2006 IECC and 15% more energy efficient than the 2009 IECC. The 2012 International Residential Code no longer includes its own energy-related code provisions. Instead, this code simply references the IECC. The prescriptive window requirements of the 2012 IECC are listed in Table 3.
Table 3. Prescriptive Window Requirements in the 2012 IECC
Climate Zone Window U-Factor Skylight U-Factor Window and Skylight SHGC 1 0.65 0.75 0.25 2 0.40 0.65 0.25 3 0.35 0.55 0.25
4 except Marine 0.35 0.55 0.40 5 and Marine 4 0.32 0.55 No requirement
6 0.32 0.55 No requirement 7 and 8 0.32 0.55 No requirement
4.2 ENERGY STAR The U.S. Department of Energy and the U.S. Environmental Protection Agency (EPA) developed an ENERGY STAR designation for products meeting certain energy performance criteria (EPA 2012a). Energy-efficient performance of windows, doors, and skylights varies by climate, so product recommendations are given for four U.S. climate zones (see Figure 21 and Table 4). To compare ENERGY STAR products, use the NFRC label (NFRC 2012) or the NFRC Certified Products Directory (NFRC 2005).
Figure 21. ENERGY STAR zone map
(Image courtesy of EPA)
19
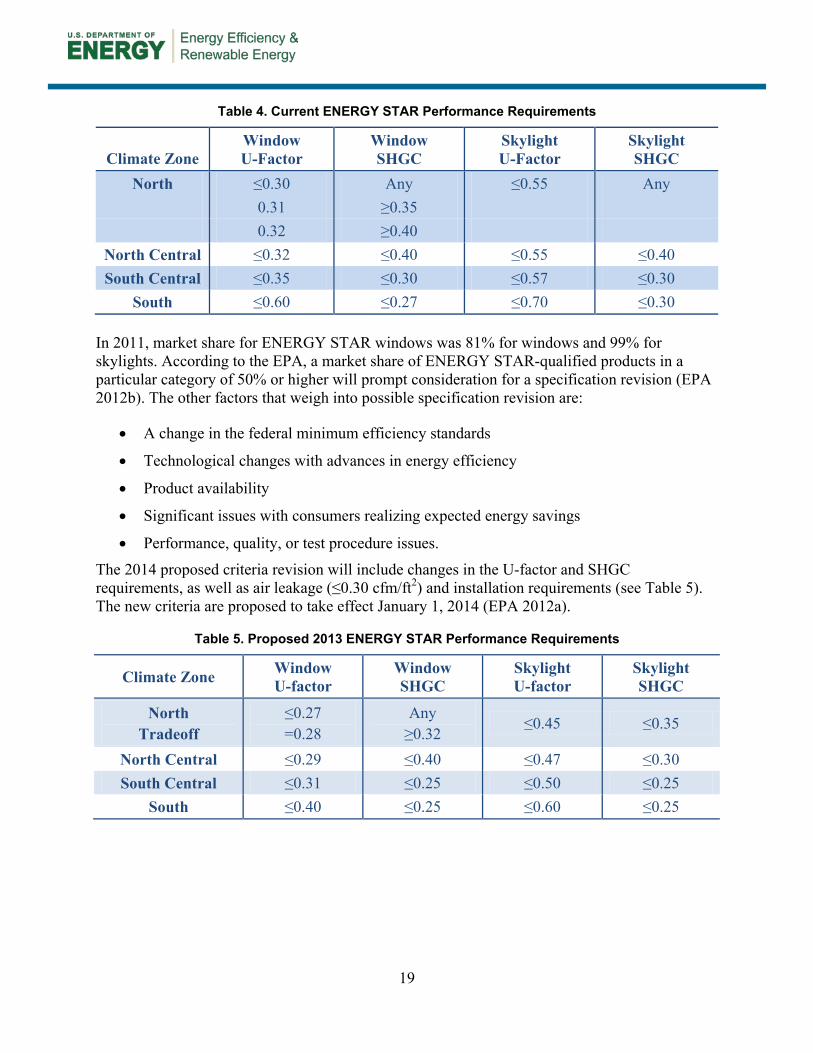
Table 4. Current ENERGY STAR Performance Requirements
Climate Zone Window U-Factor
Window SHGC
Skylight U-Factor
Skylight SHGC
North ≤0.30 Any ≤0.55 Any 0.31 ≥0.35 0.32 ≥0.40
North Central ≤0.32 ≤0.40 ≤0.55 ≤0.40 South Central ≤0.35 ≤0.30 ≤0.57 ≤0.30
South ≤0.60 ≤0.27 ≤0.70 ≤0.30 In 2011, market share for ENERGY STAR windows was 81% for windows and 99% for skylights. According to the EPA, a market share of ENERGY STAR-qualified products in a particular category of 50% or higher will prompt consideration for a specification revision (EPA 2012b). The other factors that weigh into possible specification revision are:
• A change in the federal minimum efficiency standards
• Technological changes with advances in energy efficiency
• Product availability
• Significant issues with consumers realizing expected energy savings
• Performance, quality, or test procedure issues.
The 2014 proposed criteria revision will include changes in the U-factor and SHGC requirements, as well as air leakage (≤0.30 cfm/ft2) and installation requirements (see Table 5). The new criteria are proposed to take effect January 1, 2014 (EPA 2012a).
Table 5. Proposed 2013 ENERGY STAR Performance Requirements
Climate Zone Window U-factor
Window SHGC
Skylight U-factor
Skylight SHGC
North Tradeoff
≤0.27 =0.28
Any ≥0.32
≤0.45 ≤0.35
North Central ≤0.29 ≤0.40 ≤0.47 ≤0.30 South Central ≤0.31 ≤0.25 ≤0.50 ≤0.25
South ≤0.40 ≤0.25 ≤0.60 ≤0.25
20
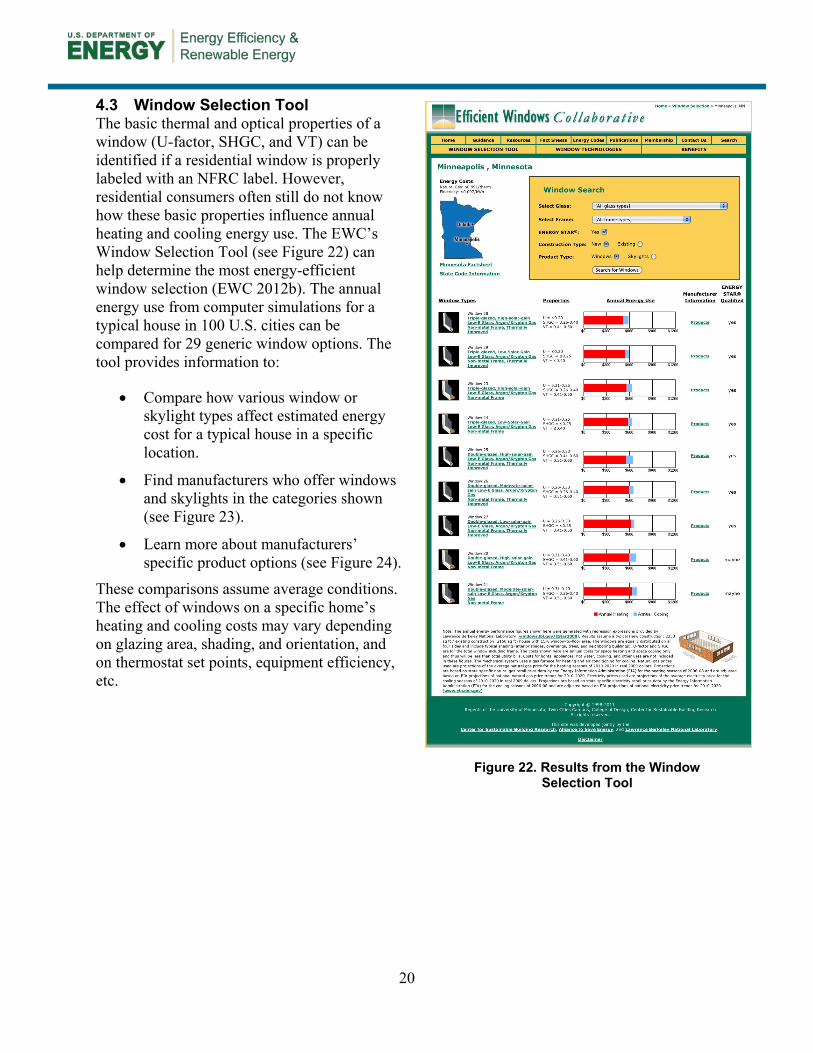
4.3 Window Selection Tool The basic thermal and optical properties of a window (U-factor, SHGC, and VT) can be identified if a residential window is properly labeled with an NFRC label. However, residential consumers often still do not know how these basic properties influence annual heating and cooling energy use. The EWC’s Window Selection Tool (see Figure 22) can help determine the most energy-efficient window selection (EWC 2012b). The annual energy use from computer simulations for a typical house in 100 U.S. cities can be compared for 29 generic window options. The tool provides information to:
• Compare how various window or skylight types affect estimated energy cost for a typical house in a specific location.
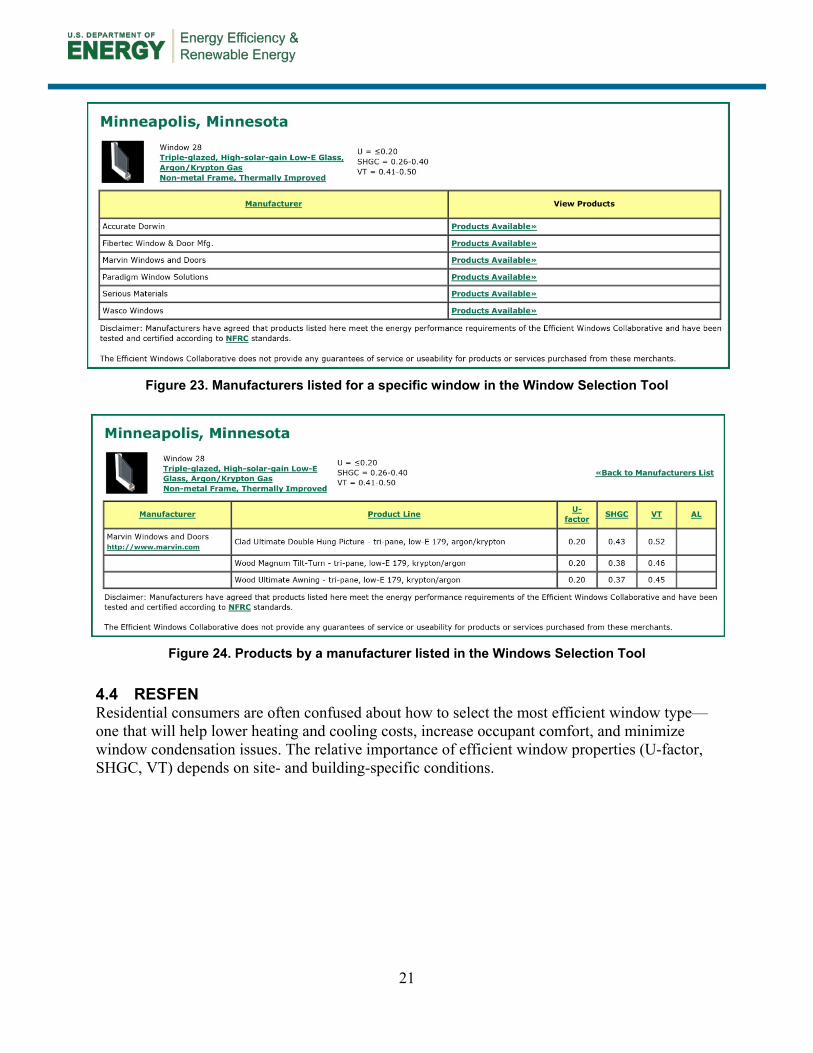
• Find manufacturers who offer windows and skylights in the categories shown (see Figure 23).
• Learn more about manufacturers’ specific product options (see Figure 24).
These comparisons assume average conditions. The effect of windows on a specific home’s heating and cooling costs may vary depending on glazing area, shading, and orientation, and on thermostat set points, equipment efficiency, etc.
Figure 22. Results from the Window Selection Tool
21
4.4 RESFEN Residential consumers are often confused about how to select the most efficient window type—one that will help lower heating and cooling costs, increase occupant comfort, and minimize window condensation issues. The relative importance of efficient window properties (U-factor, SHGC, VT) depends on site- and building-specific conditions.
Figure 24. Products by a manufacturer listed in the Windows Selection Tool
Figure 23. Manufacturers listed for a specific window in the Window Selection Tool
22
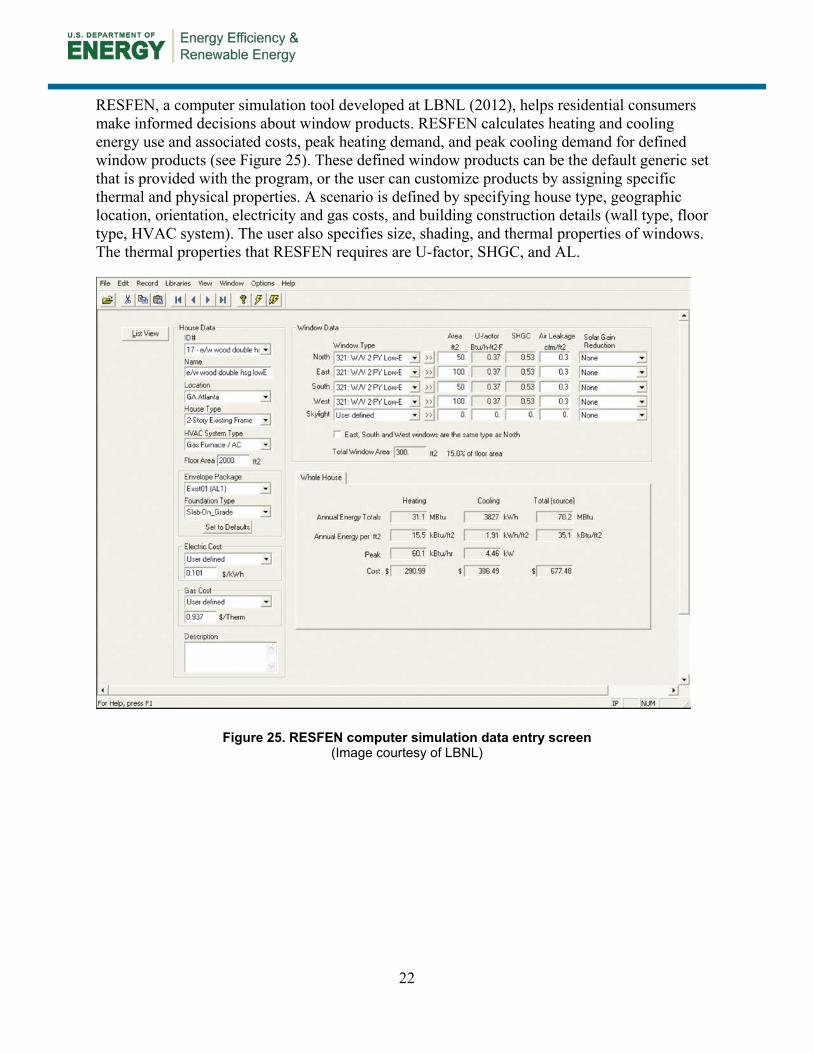
RESFEN, a computer simulation tool developed at LBNL (2012), helps residential consumers make informed decisions about window products. RESFEN calculates heating and cooling energy use and associated costs, peak heating demand, and peak cooling demand for defined window products (see Figure 25). These defined window products can be the default generic set that is provided with the program, or the user can customize products by assigning specific thermal and physical properties. A scenario is defined by specifying house type, geographic location, orientation, electricity and gas costs, and building construction details (wall type, floor type, HVAC system). The user also specifies size, shading, and thermal properties of windows. The thermal properties that RESFEN requires are U-factor, SHGC, and AL.
Figure 25. RESFEN computer simulation data entry screen (Image courtesy of LBNL)
23
5 Cost and Performance
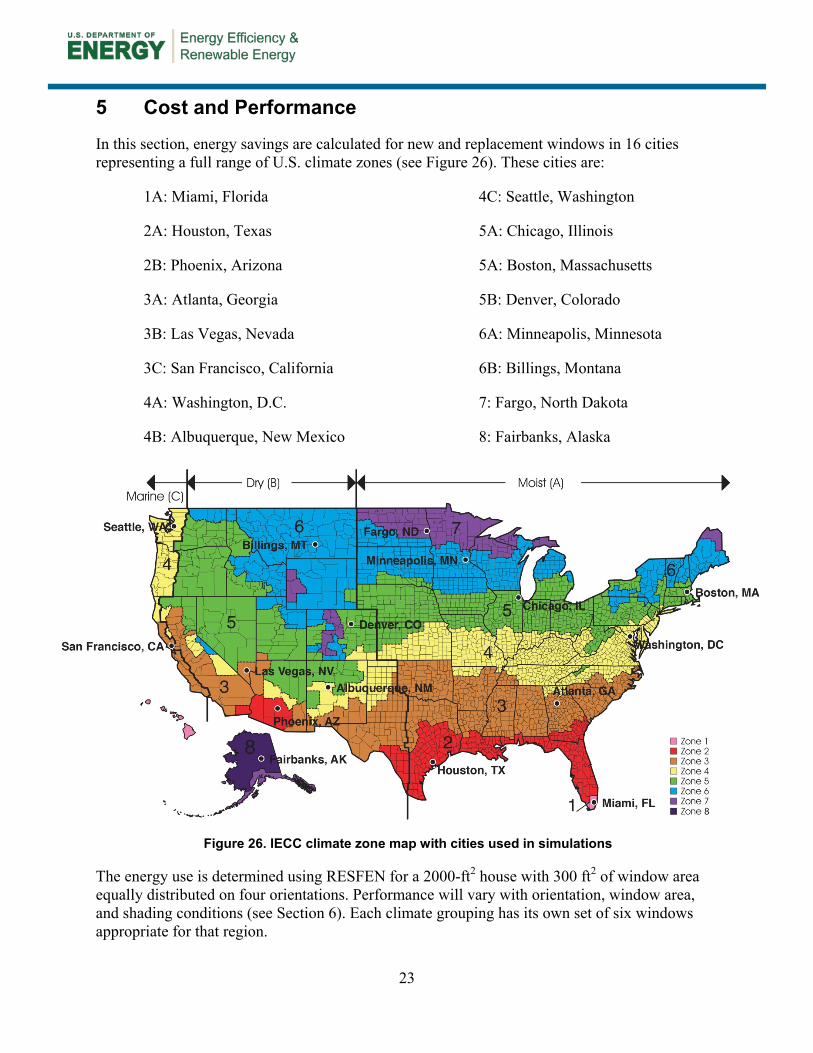
In this section, energy savings are calculated for new and replacement windows in 16 cities representing a full range of U.S. climate zones (see Figure 26). These cities are:
1A: Miami, Florida
2A: Houston, Texas
2B: Phoenix, Arizona
3A: Atlanta, Georgia
3B: Las Vegas, Nevada
3C: San Francisco, California
4A: Washington, D.C.
4B: Albuquerque, New Mexico
4C: Seattle, Washington
5A: Chicago, Illinois
5A: Boston, Massachusetts
5B: Denver, Colorado
6A: Minneapolis, Minnesota
6B: Billings, Montana
7: Fargo, North Dakota
8: Fairbanks, Alaska
The energy use is determined using RESFEN for a 2000-ft2 house with 300 ft2 of window area equally distributed on four orientations. Performance will vary with orientation, window area, and shading conditions (see Section 6). Each climate grouping has its own set of six windows appropriate for that region.
Figure 26. IECC climate zone map with cities used in simulations
24
5.1 Energy and Cost Savings for New Windows For new construction, the base case in each climate is a window that meets the 2009 IECC (usually a double-glazed low-e window with a specified U-factor and SHGC). The other four windows represent improvements over the base case with different low-e coating types, different frame materials, more glazing layers, or other thermal improvements. Because the 2009 IECC requires a relatively high performance window as a minimum, the additional savings from even higher performance windows are often minimal. (All cases in these tables are simulated with no shading; thus, solar heat gain is maximized.) In a heating-dominated climate, increased passive solar heat gain from no shading is a benefit, but it actually reduces the energy savings from higher performance windows (low U-factor). In cooling-dominated climates, the increase in unwanted solar gain from no shading increases energy savings from high performance windows (low SHGC).
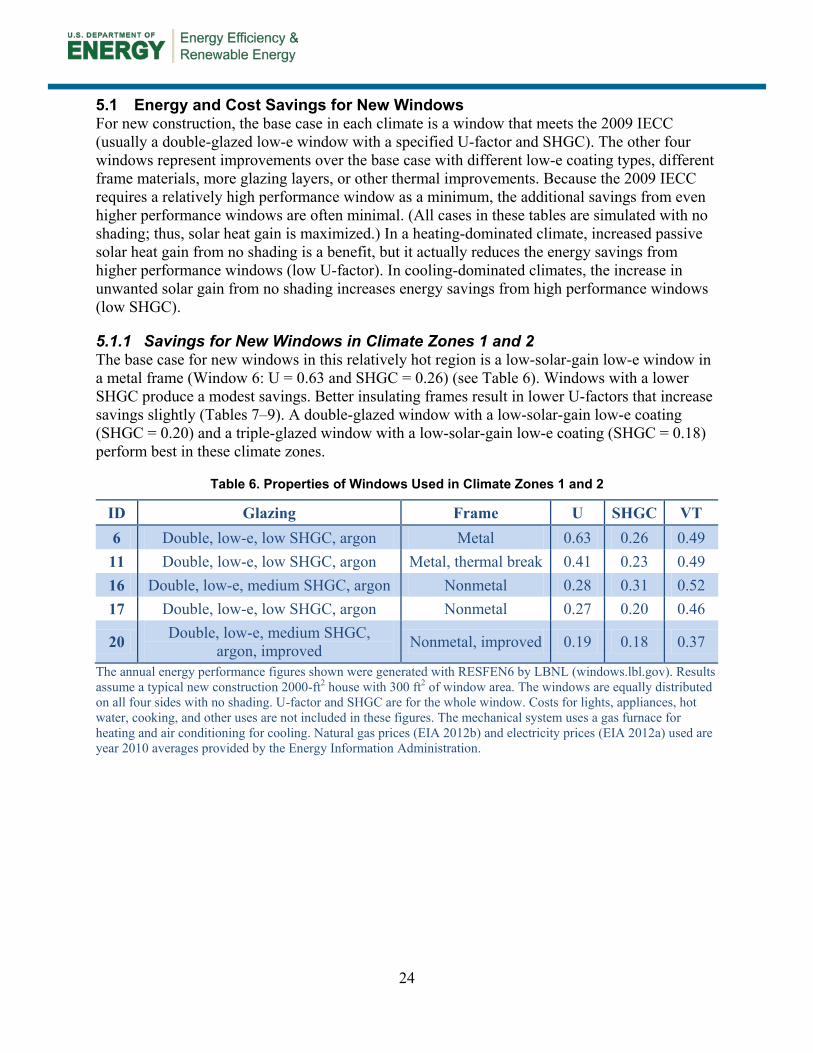
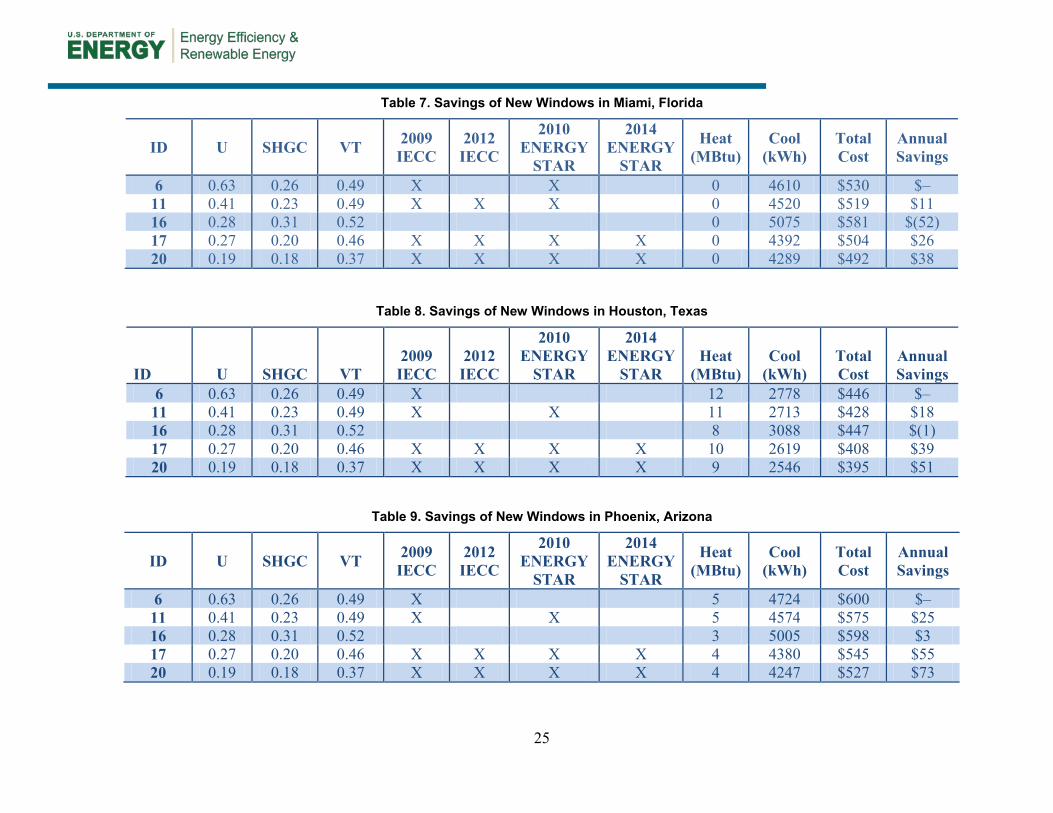
5.1.1 Savings for New Windows in Climate Zones 1 and 2 The base case for new windows in this relatively hot region is a low-solar-gain low-e window in a metal frame (Window 6: U = 0.63 and SHGC = 0.26) (see Table 6). Windows with a lower SHGC produce a modest savings. Better insulating frames result in lower U-factors that increase savings slightly (Tables 7–9). A double-glazed window with a low-solar-gain low-e coating (SHGC = 0.20) and a triple-glazed window with a low-solar-gain low-e coating (SHGC = 0.18) perform best in these climate zones.
Table 6. Properties of Windows Used in Climate Zones 1 and 2
ID Glazing Frame U SHGC VT 6 Double, low-e, low SHGC, argon Metal 0.63 0.26 0.49 11 Double, low-e, low SHGC, argon Metal, thermal break 0.41 0.23 0.49 16 Double, low-e, medium SHGC, argon Nonmetal 0.28 0.31 0.52 17 Double, low-e, low SHGC, argon Nonmetal 0.27 0.20 0.46
20 Double, low-e, medium SHGC, argon, improved Nonmetal, improved 0.19 0.18 0.37
The annual energy performance figures shown were generated with RESFEN6 by LBNL (windows.lbl.gov). Results assume a typical new construction 2000-ft2 house with 300 ft2 of window area. The windows are equally distributed on all four sides with no shading. U-factor and SHGC are for the whole window. Costs for lights, appliances, hot water, cooking, and other uses are not included in these figures. The mechanical system uses a gas furnace for heating and air conditioning for cooling. Natural gas prices (EIA 2012b) and electricity prices (EIA 2012a) used are year 2010 averages provided by the Energy Information Administration.
25
Table 7. Savings of New Windows in Miami, Florida
ID U SHGC VT 2009 IECC
2012 IECC
2010 ENERGY
STAR
2014 ENERGY
STAR
Heat (MBtu)
Cool (kWh)
Total Cost
Annual Savings
6 0.63 0.26 0.49 X X 0 4610 $530 $– 11 0.41 0.23 0.49 X X X 0 4520 $519 $11 16 0.28 0.31 0.52 0 5075 $581 $(52) 17 0.27 0.20 0.46 X X X X 0 4392 $504 $26 20 0.19 0.18 0.37 X X X X 0 4289 $492 $38
Table 8. Savings of New Windows in Houston, Texas
ID U SHGC VT 2009 IECC
2012 IECC
2010 ENERGY
STAR
2014 ENERGY
STAR Heat
(MBtu) Cool
(kWh) Total Cost
Annual Savings
6 0.63 0.26 0.49 X 12 2778 $446 $– 11 0.41 0.23 0.49 X X 11 2713 $428 $18 16 0.28 0.31 0.52 8 3088 $447 $(1) 17 0.27 0.20 0.46 X X X X 10 2619 $408 $39 20 0.19 0.18 0.37 X X X X 9 2546 $395 $51
Table 9. Savings of New Windows in Phoenix, Arizona
ID U SHGC VT 2009 IECC
2012 IECC
2010 ENERGY
STAR
2014 ENERGY
STAR
Heat (MBtu)
Cool (kWh)
Total Cost
Annual Savings
6 0.63 0.26 0.49 X 5 4724 $600 $– 11 0.41 0.23 0.49 X X 5 4574 $575 $25 16 0.28 0.31 0.52 3 5005 $598 $3 17 0.27 0.20 0.46 X X X X 4 4380 $545 $55 20 0.19 0.18 0.37 X X X X 4 4247 $527 $73
26
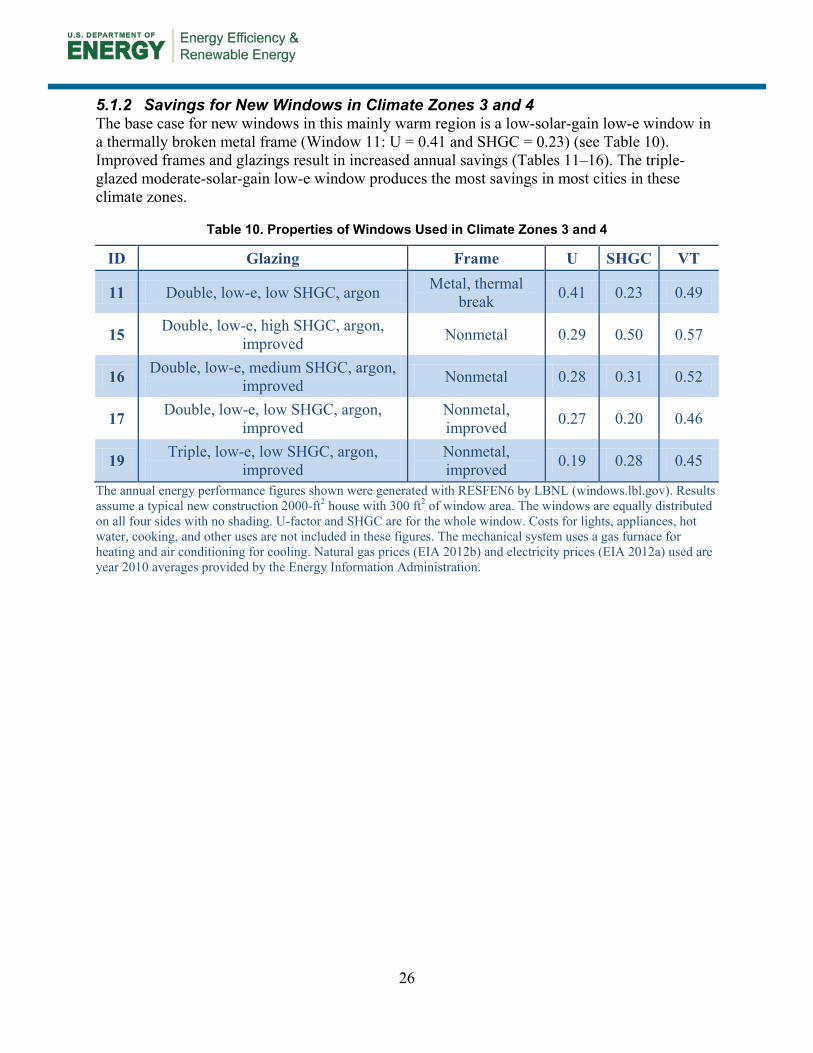
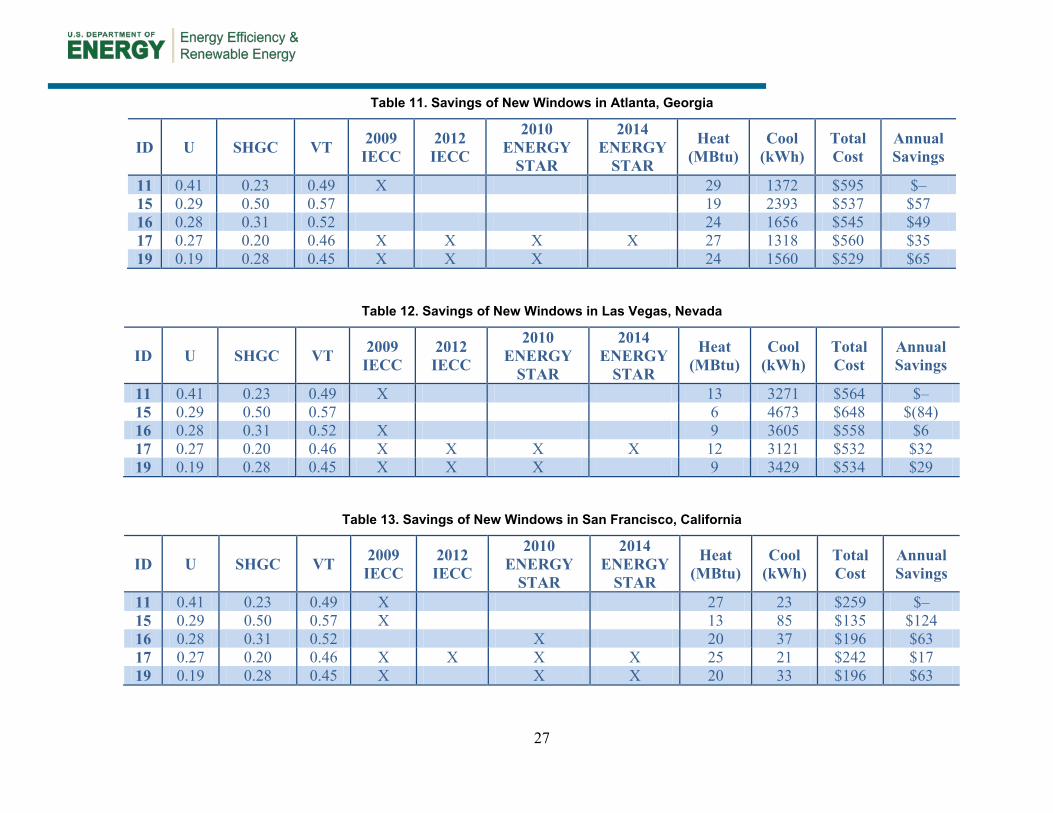
5.1.2 Savings for New Windows in Climate Zones 3 and 4 The base case for new windows in this mainly warm region is a low-solar-gain low-e window in a thermally broken metal frame (Window 11: U = 0.41 and SHGC = 0.23) (see Table 10). Improved frames and glazings result in increased annual savings (Tables 11–16). The triple-glazed moderate-solar-gain low-e window produces the most savings in most cities in these climate zones.
Table 10. Properties of Windows Used in Climate Zones 3 and 4
ID Glazing Frame U SHGC VT
11 Double, low-e, low SHGC, argon Metal, thermal break 0.41 0.23 0.49
15 Double, low-e, high SHGC, argon, improved Nonmetal 0.29 0.50 0.57
16 Double, low-e, medium SHGC, argon, improved Nonmetal 0.28 0.31 0.52
17 Double, low-e, low SHGC, argon, improved
Nonmetal, improved 0.27 0.20 0.46
19 Triple, low-e, low SHGC, argon, improved
Nonmetal, improved 0.19 0.28 0.45
The annual energy performance figures shown were generated with RESFEN6 by LBNL (windows.lbl.gov). Results assume a typical new construction 2000-ft2 house with 300 ft2 of window area. The windows are equally distributed on all four sides with no shading. U-factor and SHGC are for the whole window. Costs for lights, appliances, hot water, cooking, and other uses are not included in these figures. The mechanical system uses a gas furnace for heating and air conditioning for cooling. Natural gas prices (EIA 2012b) and electricity prices (EIA 2012a) used are year 2010 averages provided by the Energy Information Administration.
27
Table 11. Savings of New Windows in Atlanta, Georgia
ID U SHGC VT 2009 IECC
2012 IECC
2010 ENERGY
STAR
2014 ENERGY
STAR
Heat (MBtu)
Cool (kWh)
Total Cost
Annual Savings
11 0.41 0.23 0.49 X 29 1372 $595 $– 15 0.29 0.50 0.57 19 2393 $537 $57 16 0.28 0.31 0.52 24 1656 $545 $49 17 0.27 0.20 0.46 X X X X 27 1318 $560 $35 19 0.19 0.28 0.45 X X X 24 1560 $529 $65
Table 12. Savings of New Windows in Las Vegas, Nevada
ID U SHGC VT 2009 IECC
2012 IECC
2010 ENERGY
STAR
2014 ENERGY
STAR
Heat (MBtu)
Cool (kWh)
Total Cost
Annual Savings
11 0.41 0.23 0.49 X 13 3271 $564 $– 15 0.29 0.50 0.57 6 4673 $648 $(84) 16 0.28 0.31 0.52 X 9 3605 $558 $6 17 0.27 0.20 0.46 X X X X 12 3121 $532 $32 19 0.19 0.28 0.45 X X X 9 3429 $534 $29
Table 13. Savings of New Windows in San Francisco, California
ID U SHGC VT 2009 IECC
2012 IECC
2010 ENERGY
STAR
2014 ENERGY
STAR
Heat (MBtu)
Cool (kWh)
Total Cost
Annual Savings
11 0.41 0.23 0.49 X 27 23 $259 $– 15 0.29 0.50 0.57 X 13 85 $135 $124 16 0.28 0.31 0.52 X 20 37 $196 $63 17 0.27 0.20 0.46 X X X X 25 21 $242 $17 19 0.19 0.28 0.45 X X X 20 33 $196 $63
28
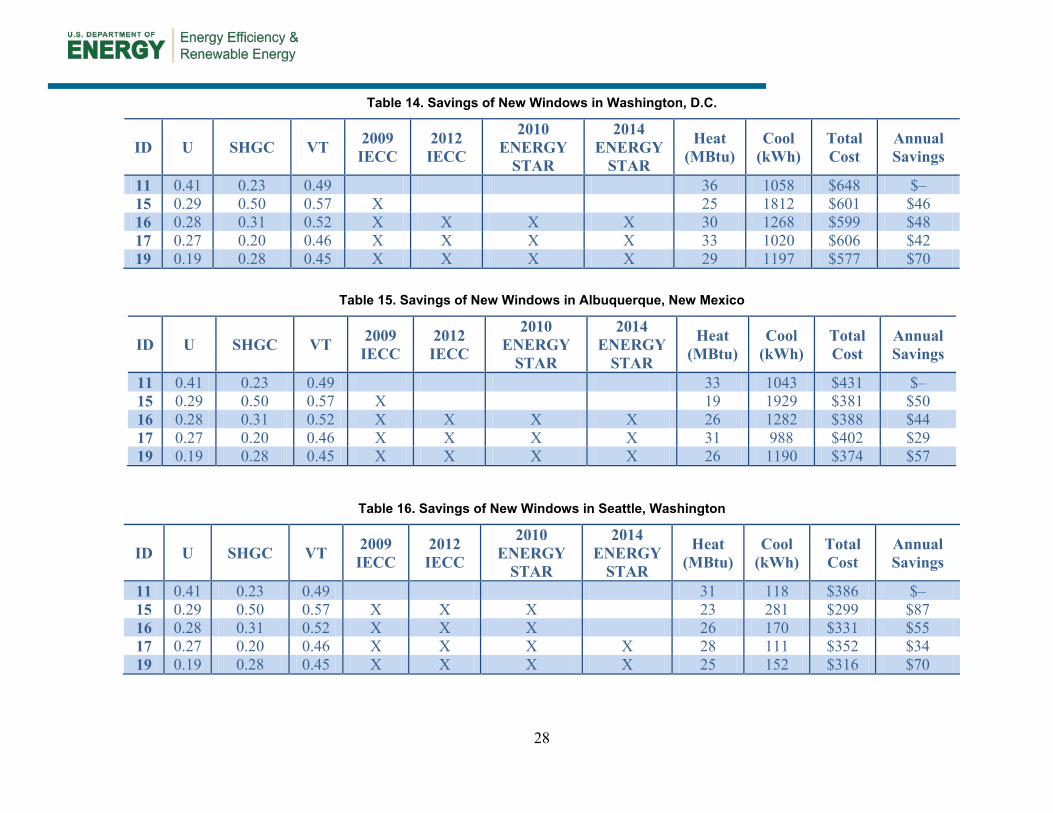
Table 14. Savings of New Windows in Washington, D.C.
ID U SHGC VT 2009 IECC
2012 IECC
2010 ENERGY
STAR
2014 ENERGY
STAR
Heat (MBtu)
Cool (kWh)
Total Cost
Annual Savings
11 0.41 0.23 0.49 36 1058 $648 $– 15 0.29 0.50 0.57 X 25 1812 $601 $46 16 0.28 0.31 0.52 X X X X 30 1268 $599 $48 17 0.27 0.20 0.46 X X X X 33 1020 $606 $42 19 0.19 0.28 0.45 X X X X 29 1197 $577 $70
Table 15. Savings of New Windows in Albuquerque, New Mexico
ID U SHGC VT 2009 IECC
2012 IECC
2010 ENERGY
STAR
2014 ENERGY
STAR
Heat (MBtu)
Cool (kWh)
Total Cost
Annual Savings
11 0.41 0.23 0.49 33 1043 $431 $– 15 0.29 0.50 0.57 X 19 1929 $381 $50 16 0.28 0.31 0.52 X X X X 26 1282 $388 $44 17 0.27 0.20 0.46 X X X X 31 988 $402 $29 19 0.19 0.28 0.45 X X X X 26 1190 $374 $57
Table 16. Savings of New Windows in Seattle, Washington
ID U SHGC VT 2009 IECC
2012 IECC
2010 ENERGY
STAR
2014 ENERGY
STAR
Heat (MBtu)
Cool (kWh)
Total Cost
Annual Savings
11 0.41 0.23 0.49 31 118 $386 $– 15 0.29 0.50 0.57 X X X 23 281 $299 $87 16 0.28 0.31 0.52 X X X 26 170 $331 $55 17 0.27 0.20 0.46 X X X X 28 111 $352 $34 19 0.19 0.28 0.45 X X X X 25 152 $316 $70
29
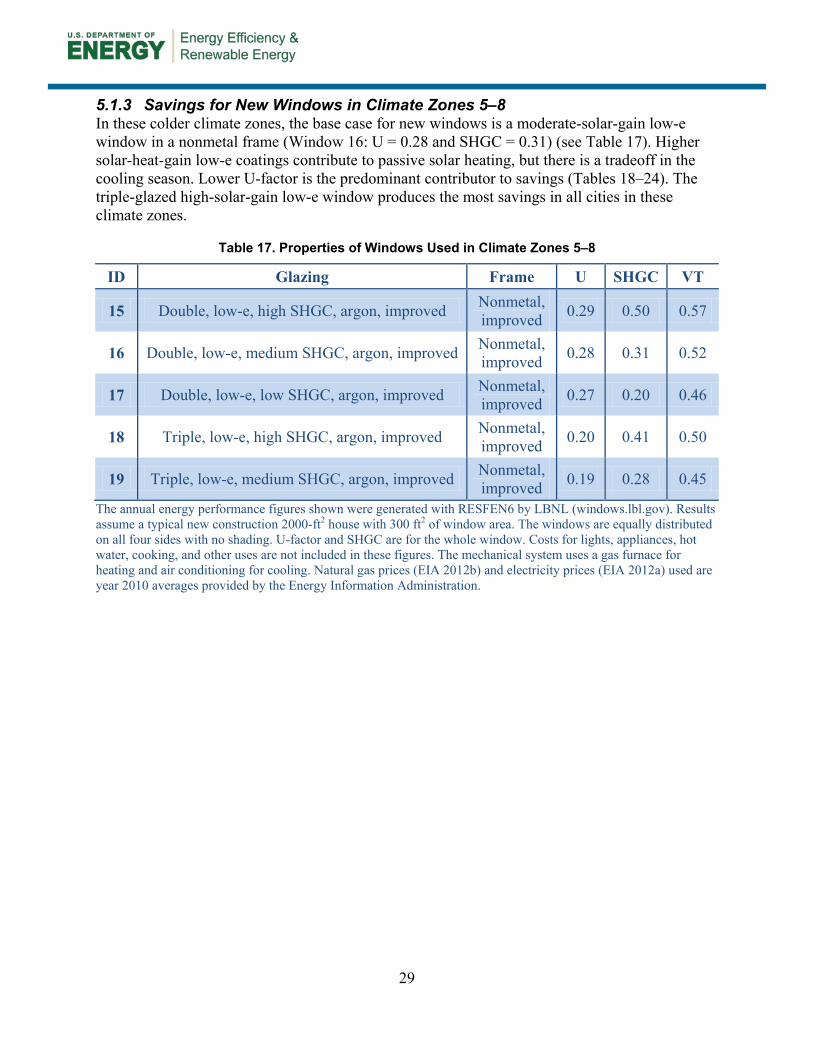
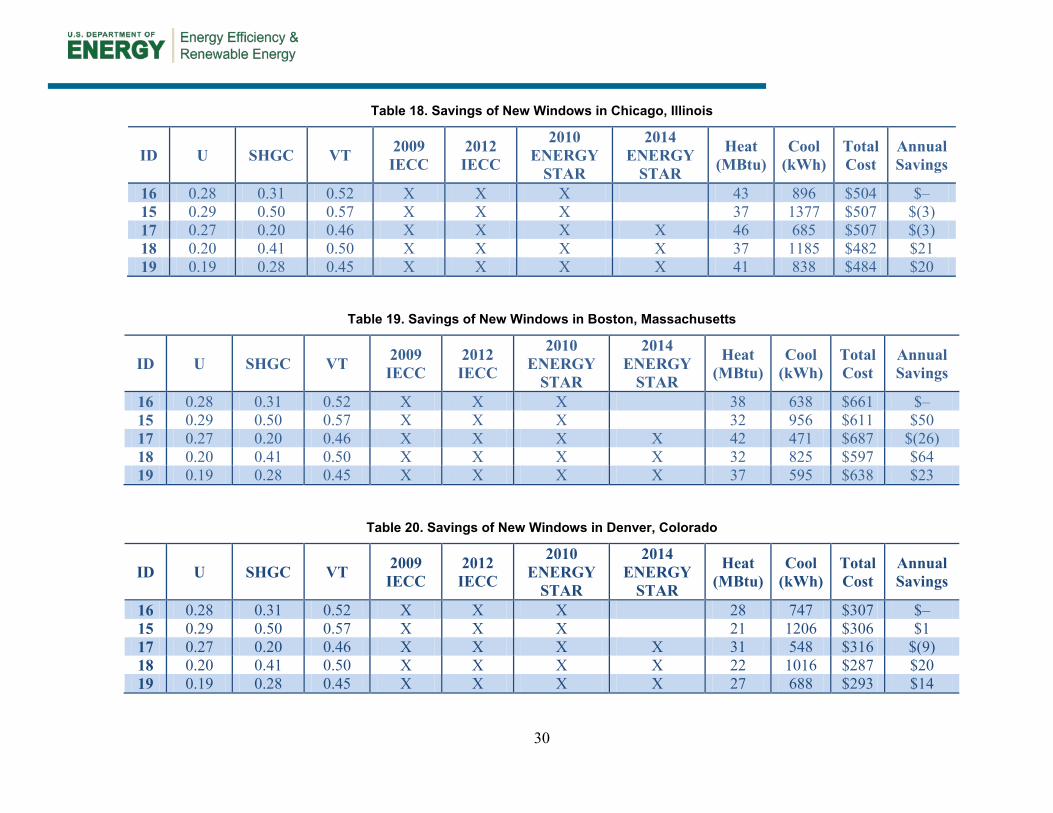
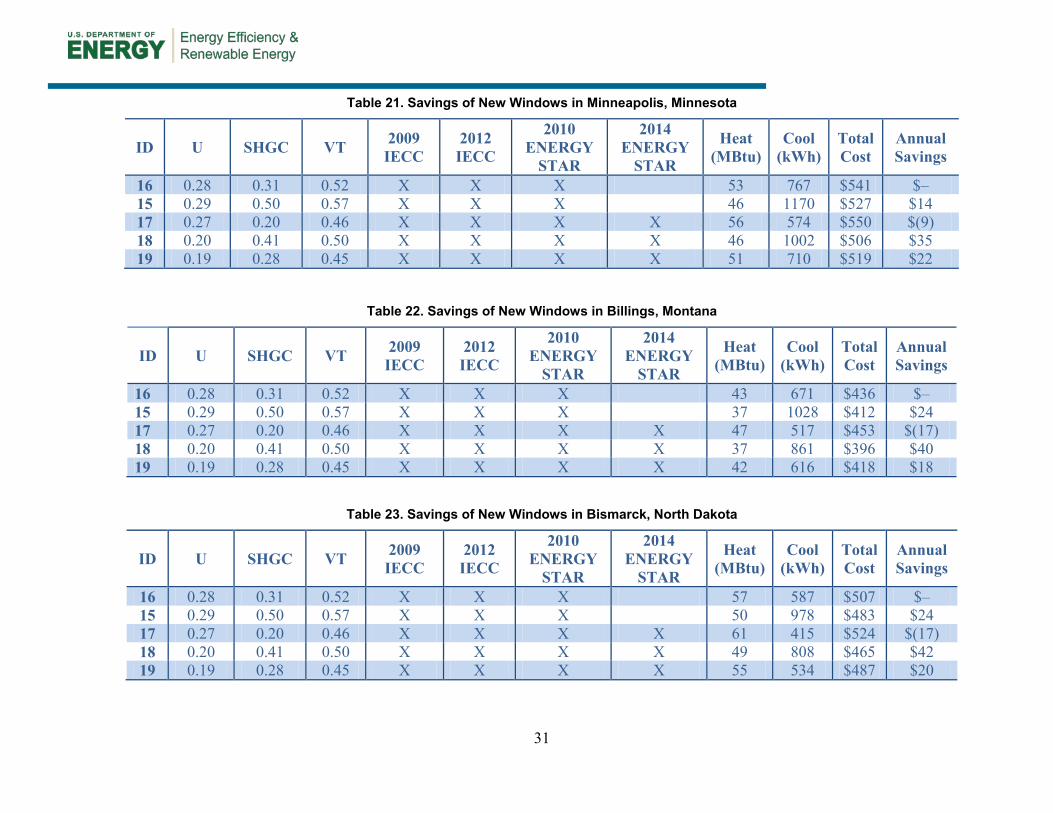
5.1.3 Savings for New Windows in Climate Zones 5–8 In these colder climate zones, the base case for new windows is a moderate-solar-gain low-e window in a nonmetal frame (Window 16: U = 0.28 and SHGC = 0.31) (see Table 17). Higher solar-heat-gain low-e coatings contribute to passive solar heating, but there is a tradeoff in the cooling season. Lower U-factor is the predominant contributor to savings (Tables 18–24). The triple-glazed high-solar-gain low-e window produces the most savings in all cities in these climate zones.
Table 17. Properties of Windows Used in Climate Zones 5–8
ID Glazing Frame U SHGC VT
15 Double, low-e, high SHGC, argon, improved Nonmetal, improved 0.29 0.50 0.57
16 Double, low-e, medium SHGC, argon, improved Nonmetal, improved 0.28 0.31 0.52
17 Double, low-e, low SHGC, argon, improved Nonmetal, improved 0.27 0.20 0.46
18 Triple, low-e, high SHGC, argon, improved Nonmetal, improved 0.20 0.41 0.50
19 Triple, low-e, medium SHGC, argon, improved Nonmetal, improved 0.19 0.28 0.45
The annual energy performance figures shown were generated with RESFEN6 by LBNL (windows.lbl.gov). Results assume a typical new construction 2000-ft2 house with 300 ft2 of window area. The windows are equally distributed on all four sides with no shading. U-factor and SHGC are for the whole window. Costs for lights, appliances, hot water, cooking, and other uses are not included in these figures. The mechanical system uses a gas furnace for heating and air conditioning for cooling. Natural gas prices (EIA 2012b) and electricity prices (EIA 2012a) used are year 2010 averages provided by the Energy Information Administration.
30
Table 18. Savings of New Windows in Chicago, Illinois
ID U SHGC VT 2009 IECC
2012 IECC
2010 ENERGY
STAR
2014 ENERGY
STAR
Heat (MBtu)
Cool (kWh)
Total Cost
Annual Savings
16 0.28 0.31 0.52 X X X 43 896 $504 $– 15 0.29 0.50 0.57 X X X 37 1377 $507 $(3) 17 0.27 0.20 0.46 X X X X 46 685 $507 $(3) 18 0.20 0.41 0.50 X X X X 37 1185 $482 $21 19 0.19 0.28 0.45 X X X X 41 838 $484 $20
Table 19. Savings of New Windows in Boston, Massachusetts
ID U SHGC VT 2009 IECC
2012 IECC
2010 ENERGY
STAR
2014 ENERGY
STAR
Heat (MBtu)
Cool (kWh)
Total Cost
Annual Savings
16 0.28 0.31 0.52 X X X 38 638 $661 $– 15 0.29 0.50 0.57 X X X 32 956 $611 $50 17 0.27 0.20 0.46 X X X X 42 471 $687 $(26) 18 0.20 0.41 0.50 X X X X 32 825 $597 $64 19 0.19 0.28 0.45 X X X X 37 595 $638 $23
Table 20. Savings of New Windows in Denver, Colorado
ID U SHGC VT 2009 IECC
2012 IECC
2010 ENERGY
STAR
2014 ENERGY
STAR
Heat (MBtu)
Cool (kWh)
Total Cost
Annual Savings
16 0.28 0.31 0.52 X X X 28 747 $307 $– 15 0.29 0.50 0.57 X X X 21 1206 $306 $1 17 0.27 0.20 0.46 X X X X 31 548 $316 $(9) 18 0.20 0.41 0.50 X X X X 22 1016 $287 $20 19 0.19 0.28 0.45 X X X X 27 688 $293 $14
31
Table 21. Savings of New Windows in Minneapolis, Minnesota
ID U SHGC VT 2009 IECC
2012 IECC
2010 ENERGY
STAR
2014 ENERGY
STAR
Heat (MBtu)
Cool (kWh)
Total Cost
Annual Savings
16 0.28 0.31 0.52 X X X 53 767 $541 $– 15 0.29 0.50 0.57 X X X 46 1170 $527 $14 17 0.27 0.20 0.46 X X X X 56 574 $550 $(9) 18 0.20 0.41 0.50 X X X X 46 1002 $506 $35 19 0.19 0.28 0.45 X X X X 51 710 $519 $22
Table 22. Savings of New Windows in Billings, Montana
ID U SHGC VT 2009 IECC
2012 IECC
2010 ENERGY
STAR
2014 ENERGY
STAR
Heat (MBtu)
Cool (kWh)
Total Cost
Annual Savings
16 0.28 0.31 0.52 X X X 43 671 $436 $– 15 0.29 0.50 0.57 X X X 37 1028 $412 $24 17 0.27 0.20 0.46 X X X X 47 517 $453 $(17) 18 0.20 0.41 0.50 X X X X 37 861 $396 $40 19 0.19 0.28 0.45 X X X X 42 616 $418 $18
Table 23. Savings of New Windows in Bismarck, North Dakota
ID U SHGC VT 2009 IECC
2012 IECC
2010 ENERGY
STAR
2014 ENERGY
STAR
Heat (MBtu)
Cool (kWh)
Total Cost
Annual Savings
16 0.28 0.31 0.52 X X X 57 587 $507 $– 15 0.29 0.50 0.57 X X X 50 978 $483 $24 17 0.27 0.20 0.46 X X X X 61 415 $524 $(17) 18 0.20 0.41 0.50 X X X X 49 808 $465 $42 19 0.19 0.28 0.45 X X X X 55 534 $487 $20
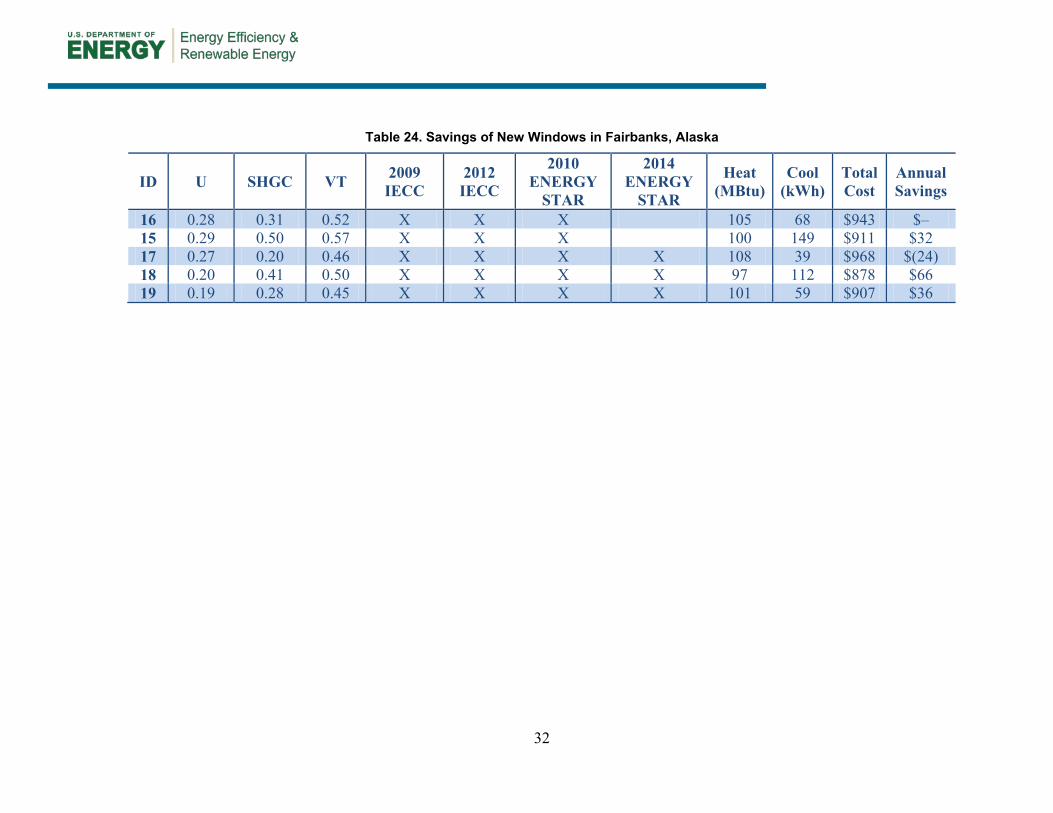
32
Table 24. Savings of New Windows in Fairbanks, Alaska
ID U SHGC VT 2009 IECC
2012 IECC
2010 ENERGY
STAR
2014 ENERGY
STAR
Heat (MBtu)
Cool (kWh)
Total Cost
Annual Savings
16 0.28 0.31 0.52 X X X 105 68 $943 $– 15 0.29 0.50 0.57 X X X 100 149 $911 $32 17 0.27 0.20 0.46 X X X X 108 39 $968 $(24) 18 0.20 0.41 0.50 X X X X 97 112 $878 $66 19 0.19 0.28 0.45 X X X X 101 59 $907 $36
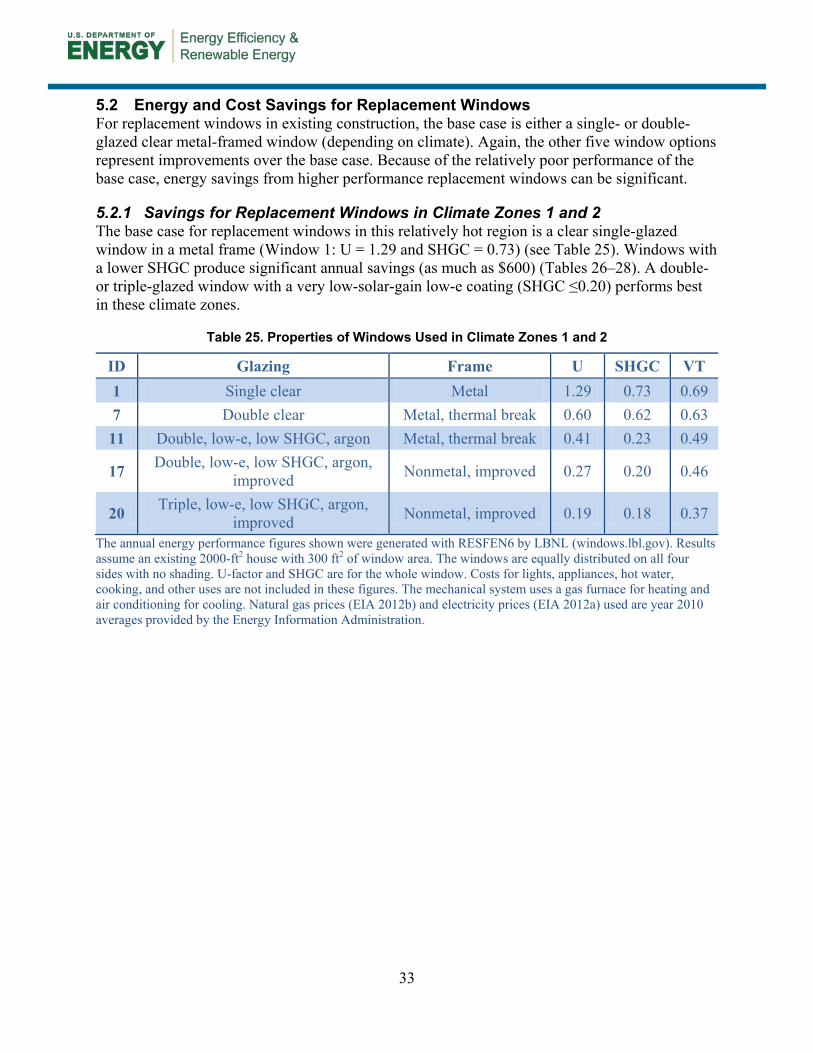
33
5.2 Energy and Cost Savings for Replacement Windows For replacement windows in existing construction, the base case is either a single- or double-glazed clear metal-framed window (depending on climate). Again, the other five window options represent improvements over the base case. Because of the relatively poor performance of the base case, energy savings from higher performance replacement windows can be significant.
5.2.1 Savings for Replacement Windows in Climate Zones 1 and 2 The base case for replacement windows in this relatively hot region is a clear single-glazed window in a metal frame (Window 1: U = 1.29 and SHGC = 0.73) (see Table 25). Windows with a lower SHGC produce significant annual savings (as much as $600) (Tables 26–28). A double- or triple-glazed window with a very low-solar-gain low-e coating (SHGC ≤0.20) performs best in these climate zones.
Table 25. Properties of Windows Used in Climate Zones 1 and 2
ID Glazing Frame U SHGC VT 1 Single clear Metal 1.29 0.73 0.69 7 Double clear Metal, thermal break 0.60 0.62 0.63 11 Double, low-e, low SHGC, argon Metal, thermal break 0.41 0.23 0.49
17 Double, low-e, low SHGC, argon, improved Nonmetal, improved 0.27 0.20 0.46
20 Triple, low-e, low SHGC, argon, improved Nonmetal, improved 0.19 0.18 0.37
The annual energy performance figures shown were generated with RESFEN6 by LBNL (windows.lbl.gov). Results assume an existing 2000-ft2 house with 300 ft2 of window area. The windows are equally distributed on all four sides with no shading. U-factor and SHGC are for the whole window. Costs for lights, appliances, hot water, cooking, and other uses are not included in these figures. The mechanical system uses a gas furnace for heating and air conditioning for cooling. Natural gas prices (EIA 2012b) and electricity prices (EIA 2012a) used are year 2010 averages provided by the Energy Information Administration.
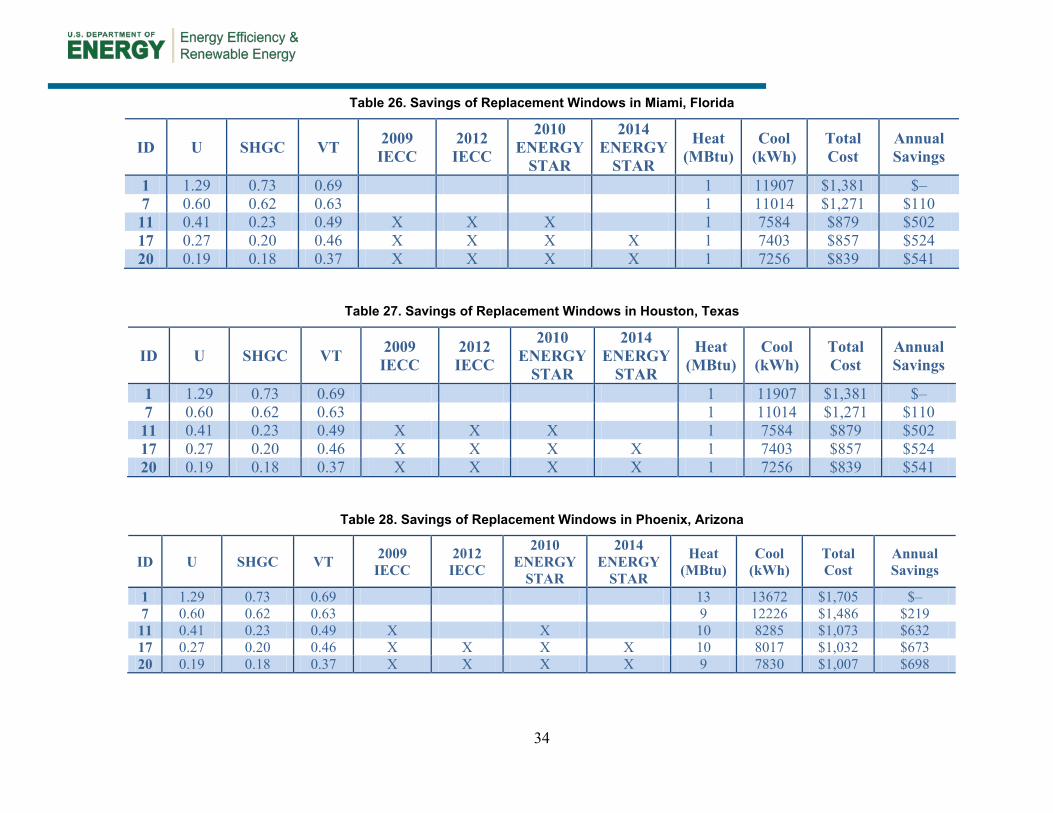
34
Table 26. Savings of Replacement Windows in Miami, Florida
ID U SHGC VT 2009 IECC
2012 IECC
2010 ENERGY
STAR
2014 ENERGY
STAR
Heat (MBtu)
Cool (kWh)
Total Cost
Annual Savings
1 1.29 0.73 0.69 1 11907 $1,381 $– 7 0.60 0.62 0.63 1 11014 $1,271 $110 11 0.41 0.23 0.49 X X X 1 7584 $879 $502 17 0.27 0.20 0.46 X X X X 1 7403 $857 $524 20 0.19 0.18 0.37 X X X X 1 7256 $839 $541
Table 27. Savings of Replacement Windows in Houston, Texas
ID U SHGC VT 2009 IECC
2012 IECC
2010 ENERGY
STAR
2014 ENERGY
STAR
Heat (MBtu)
Cool (kWh)
Total Cost
Annual Savings
1 1.29 0.73 0.69 1 11907 $1,381 $– 7 0.60 0.62 0.63 1 11014 $1,271 $110 11 0.41 0.23 0.49 X X X 1 7584 $879 $502 17 0.27 0.20 0.46 X X X X 1 7403 $857 $524 20 0.19 0.18 0.37 X X X X 1 7256 $839 $541
Table 28. Savings of Replacement Windows in Phoenix, Arizona
ID U SHGC VT 2009 IECC
2012 IECC
2010 ENERGY
STAR
2014 ENERGY
STAR
Heat (MBtu)
Cool (kWh)
Total Cost
Annual Savings
1 1.29 0.73 0.69 13 13672 $1,705 $– 7 0.60 0.62 0.63 9 12226 $1,486 $219 11 0.41 0.23 0.49 X X 10 8285 $1,073 $632 17 0.27 0.20 0.46 X X X X 10 8017 $1,032 $673 20 0.19 0.18 0.37 X X X X 9 7830 $1,007 $698

35
5.2.2 Savings for Replacement Windows in Climate Zones 3 and 4 The base case for replacement windows in this relatively hot region is a clear single-glazed window in a metal frame (Window 1: U = 1.29 and SHGC = 0.73) (see Table 29). Windows with a lower SHGC produce significant annual savings (as much as $500) (Tables 30–35). Depending on the dominance of the heating or cooling loads, a double-glazed window with a moderate-solar-gain (SHGC = 0.31) or low-solar-gain low-e coating (SHGC = 0.20) performs well in these climate zones; the triple-glazed window with a moderate-solar-gain performs best.
Table 29. Properties of Windows Used in Climate Zones 3 and 4
ID Glazing Frame U SHGC VT 1 Single clear Metal 1.29 0.73 0.69 11 Double, low-e, low SHGC, argon Metal, thermal break 0.41 0.23 0.49
16 Double, low-e, medium SHGC, argon, improved Nonmetal, improved 0.28 0.31 0.52
17 Double, low-e, low SHGC, argon, improved Nonmetal, improved 0.27 0.20 0.46
19 Triple, low-e, low SHGC, argon, improved Nonmetal, improved 0.19 0.28 0.45
The annual energy performance figures shown were generated with RESFEN6 by LBNL (windows.lbl.gov). Results assume an existing 2000-ft2 house with 300 ft2 of window area. The windows are equally distributed on all four sides with no shading. U-factor and SHGC are for the whole window. Costs for lights, appliances, hot water, cooking, and other uses are not included in these figures. The mechanical system uses a gas furnace for heating and air conditioning for cooling. Natural gas prices (EIA 2012b) and electricity prices (EIA 2012a) used are year 2010 averages provided by the Energy Information Administration.
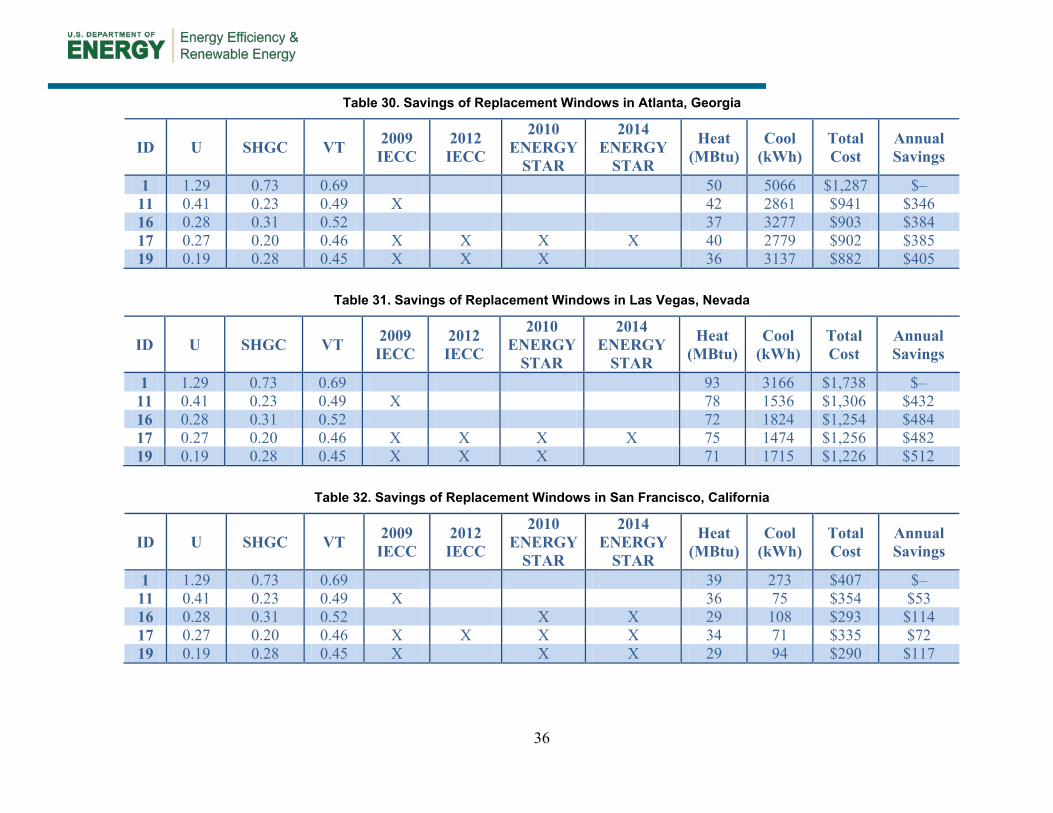
36
Table 30. Savings of Replacement Windows in Atlanta, Georgia
ID U SHGC VT 2009 IECC
2012 IECC
2010 ENERGY
STAR
2014 ENERGY
STAR
Heat (MBtu)
Cool (kWh)
Total Cost
Annual Savings
1 1.29 0.73 0.69 50 5066 $1,287 $– 11 0.41 0.23 0.49 X 42 2861 $941 $346 16 0.28 0.31 0.52 37 3277 $903 $384 17 0.27 0.20 0.46 X X X X 40 2779 $902 $385 19 0.19 0.28 0.45 X X X 36 3137 $882 $405
Table 31. Savings of Replacement Windows in Las Vegas, Nevada
ID U SHGC VT 2009 IECC
2012 IECC
2010 ENERGY
STAR
2014 ENERGY
STAR
Heat (MBtu)
Cool (kWh)
Total Cost
Annual Savings
1 1.29 0.73 0.69 93 3166 $1,738 $– 11 0.41 0.23 0.49 X 78 1536 $1,306 $432 16 0.28 0.31 0.52 72 1824 $1,254 $484 17 0.27 0.20 0.46 X X X X 75 1474 $1,256 $482 19 0.19 0.28 0.45 X X X 71 1715 $1,226 $512
Table 32. Savings of Replacement Windows in San Francisco, California
ID U SHGC VT 2009 IECC
2012 IECC
2010 ENERGY
STAR
2014 ENERGY
STAR
Heat (MBtu)
Cool (kWh)
Total Cost
Annual Savings
1 1.29 0.73 0.69 39 273 $407 $– 11 0.41 0.23 0.49 X 36 75 $354 $53 16 0.28 0.31 0.52 X X 29 108 $293 $114 17 0.27 0.20 0.46 X X X X 34 71 $335 $72 19 0.19 0.28 0.45 X X X 29 94 $290 $117
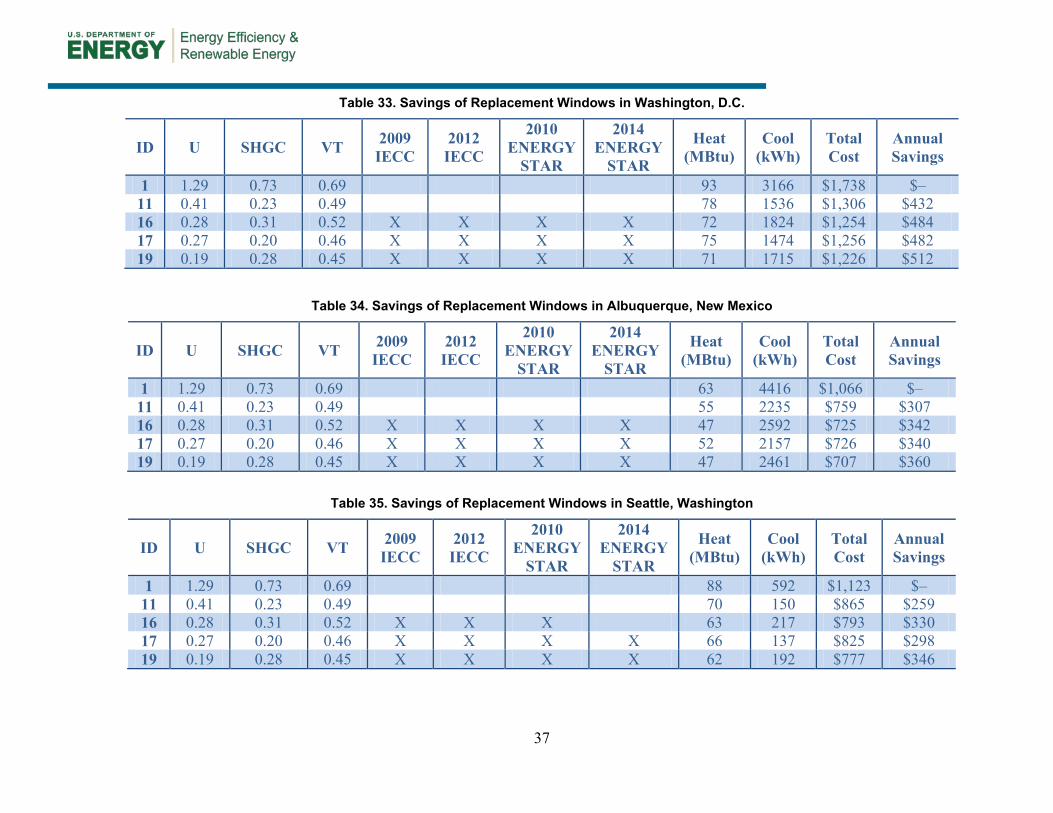
37
Table 33. Savings of Replacement Windows in Washington, D.C.
ID U SHGC VT 2009 IECC
2012 IECC
2010 ENERGY
STAR
2014 ENERGY
STAR
Heat (MBtu)
Cool (kWh)
Total Cost
Annual Savings
1 1.29 0.73 0.69 93 3166 $1,738 $– 11 0.41 0.23 0.49 78 1536 $1,306 $432 16 0.28 0.31 0.52 X X X X 72 1824 $1,254 $484 17 0.27 0.20 0.46 X X X X 75 1474 $1,256 $482 19 0.19 0.28 0.45 X X X X 71 1715 $1,226 $512
Table 34. Savings of Replacement Windows in Albuquerque, New Mexico
ID U SHGC VT 2009 IECC
2012 IECC
2010 ENERGY
STAR
2014 ENERGY
STAR
Heat (MBtu)
Cool (kWh)
Total Cost
Annual Savings
1 1.29 0.73 0.69 63 4416 $1,066 $– 11 0.41 0.23 0.49 55 2235 $759 $307 16 0.28 0.31 0.52 X X X X 47 2592 $725 $342 17 0.27 0.20 0.46 X X X X 52 2157 $726 $340 19 0.19 0.28 0.45 X X X X 47 2461 $707 $360
Table 35. Savings of Replacement Windows in Seattle, Washington
ID U SHGC VT 2009 IECC
2012 IECC
2010 ENERGY
STAR
2014 ENERGY
STAR
Heat (MBtu)
Cool (kWh)
Total Cost
Annual Savings
1 1.29 0.73 0.69 88 592 $1,123 $– 11 0.41 0.23 0.49 70 150 $865 $259 16 0.28 0.31 0.52 X X X 63 217 $793 $330 17 0.27 0.20 0.46 X X X X 66 137 $825 $298 19 0.19 0.28 0.45 X X X X 62 192 $777 $346
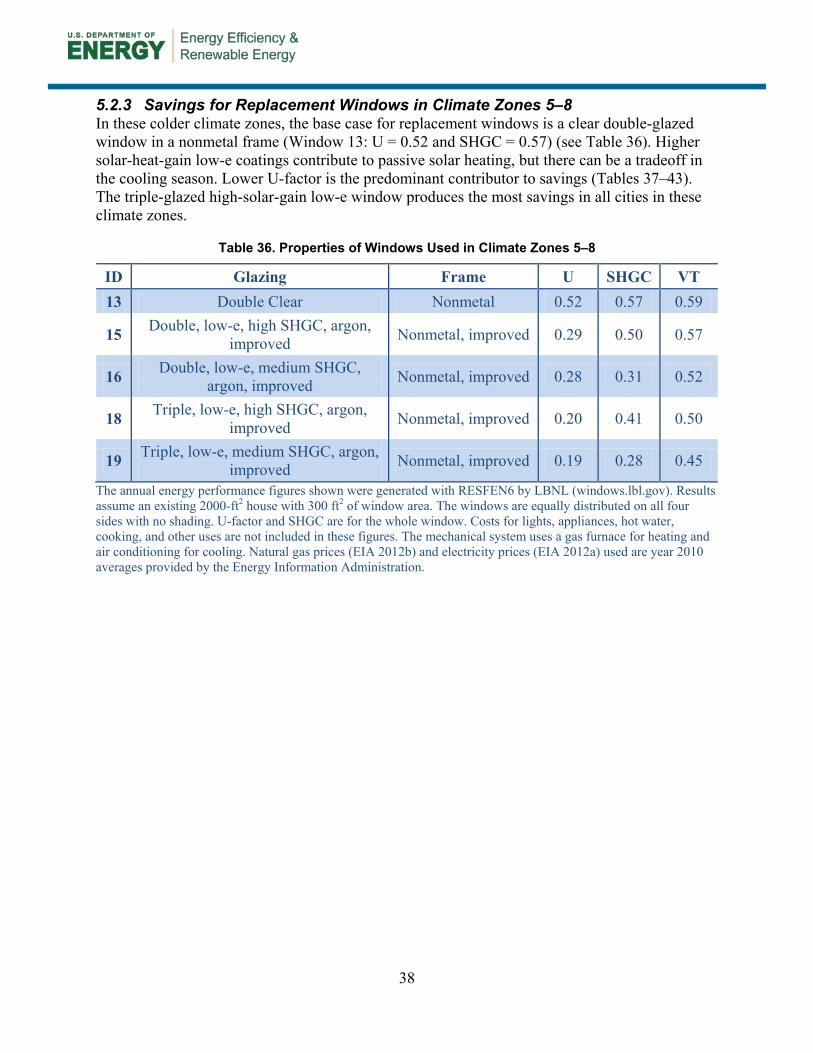
38
5.2.3 Savings for Replacement Windows in Climate Zones 5–8 In these colder climate zones, the base case for replacement windows is a clear double-glazed window in a nonmetal frame (Window 13: U = 0.52 and SHGC = 0.57) (see Table 36). Higher solar-heat-gain low-e coatings contribute to passive solar heating, but there can be a tradeoff in the cooling season. Lower U-factor is the predominant contributor to savings (Tables 37–43). The triple-glazed high-solar-gain low-e window produces the most savings in all cities in these climate zones.
Table 36. Properties of Windows Used in Climate Zones 5–8
ID Glazing Frame U SHGC VT 13 Double Clear Nonmetal 0.52 0.57 0.59
15 Double, low-e, high SHGC, argon, improved Nonmetal, improved 0.29 0.50 0.57
16 Double, low-e, medium SHGC, argon, improved Nonmetal, improved 0.28 0.31 0.52
18 Triple, low-e, high SHGC, argon, improved Nonmetal, improved 0.20 0.41 0.50
19 Triple, low-e, medium SHGC, argon, improved Nonmetal, improved 0.19 0.28 0.45
The annual energy performance figures shown were generated with RESFEN6 by LBNL (windows.lbl.gov). Results assume an existing 2000-ft2 house with 300 ft2 of window area. The windows are equally distributed on all four sides with no shading. U-factor and SHGC are for the whole window. Costs for lights, appliances, hot water, cooking, and other uses are not included in these figures. The mechanical system uses a gas furnace for heating and air conditioning for cooling. Natural gas prices (EIA 2012b) and electricity prices (EIA 2012a) used are year 2010 averages provided by the Energy Information Administration.
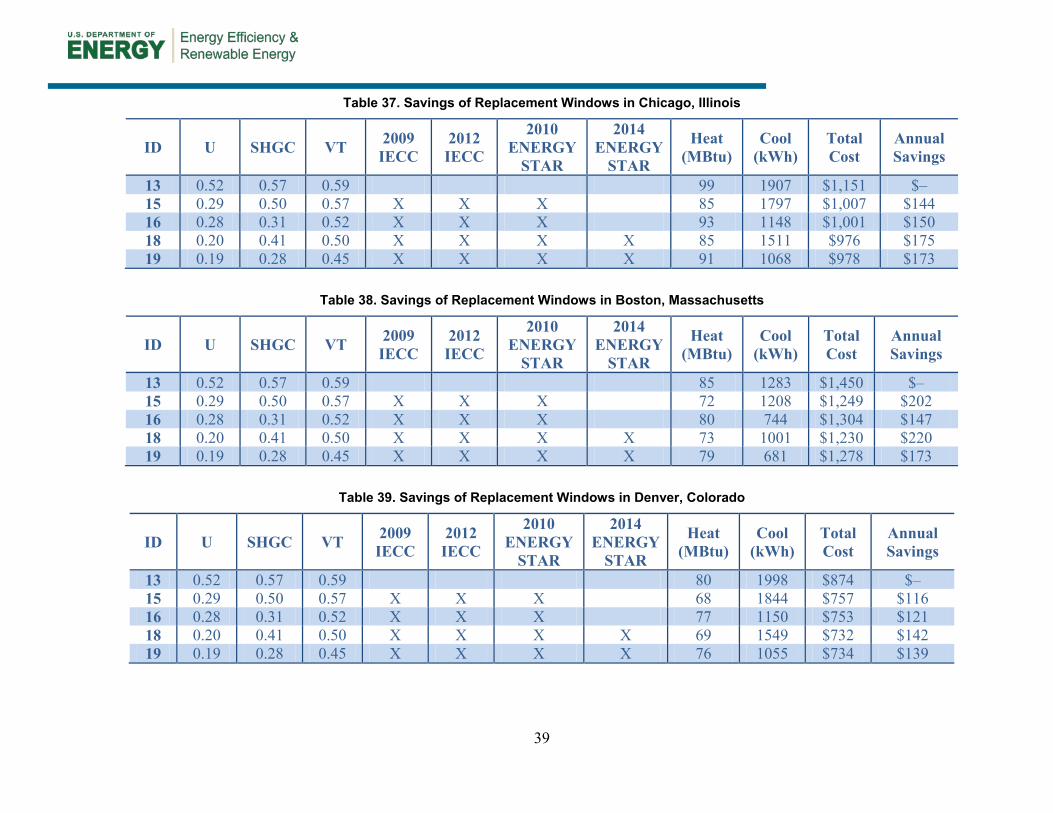
39
Table 37. Savings of Replacement Windows in Chicago, Illinois
ID U SHGC VT 2009 IECC
2012 IECC
2010 ENERGY
STAR
2014 ENERGY
STAR
Heat (MBtu)
Cool (kWh)
Total Cost
Annual Savings
13 0.52 0.57 0.59 99 1907 $1,151 $– 15 0.29 0.50 0.57 X X X 85 1797 $1,007 $144 16 0.28 0.31 0.52 X X X 93 1148 $1,001 $150 18 0.20 0.41 0.50 X X X X 85 1511 $976 $175 19 0.19 0.28 0.45 X X X X 91 1068 $978 $173
Table 38. Savings of Replacement Windows in Boston, Massachusetts
ID U SHGC VT 2009 IECC
2012 IECC
2010 ENERGY
STAR
2014 ENERGY
STAR
Heat (MBtu)
Cool (kWh)
Total Cost
Annual Savings
13 0.52 0.57 0.59 85 1283 $1,450 $– 15 0.29 0.50 0.57 X X X 72 1208 $1,249 $202 16 0.28 0.31 0.52 X X X 80 744 $1,304 $147 18 0.20 0.41 0.50 X X X X 73 1001 $1,230 $220 19 0.19 0.28 0.45 X X X X 79 681 $1,278 $173
Table 39. Savings of Replacement Windows in Denver, Colorado
ID U SHGC VT 2009 IECC
2012 IECC
2010 ENERGY
STAR
2014 ENERGY
STAR
Heat (MBtu)
Cool (kWh)
Total Cost
Annual Savings
13 0.52 0.57 0.59 80 1998 $874 $– 15 0.29 0.50 0.57 X X X 68 1844 $757 $116 16 0.28 0.31 0.52 X X X 77 1150 $753 $121 18 0.20 0.41 0.50 X X X X 69 1549 $732 $142 19 0.19 0.28 0.45 X X X X 76 1055 $734 $139
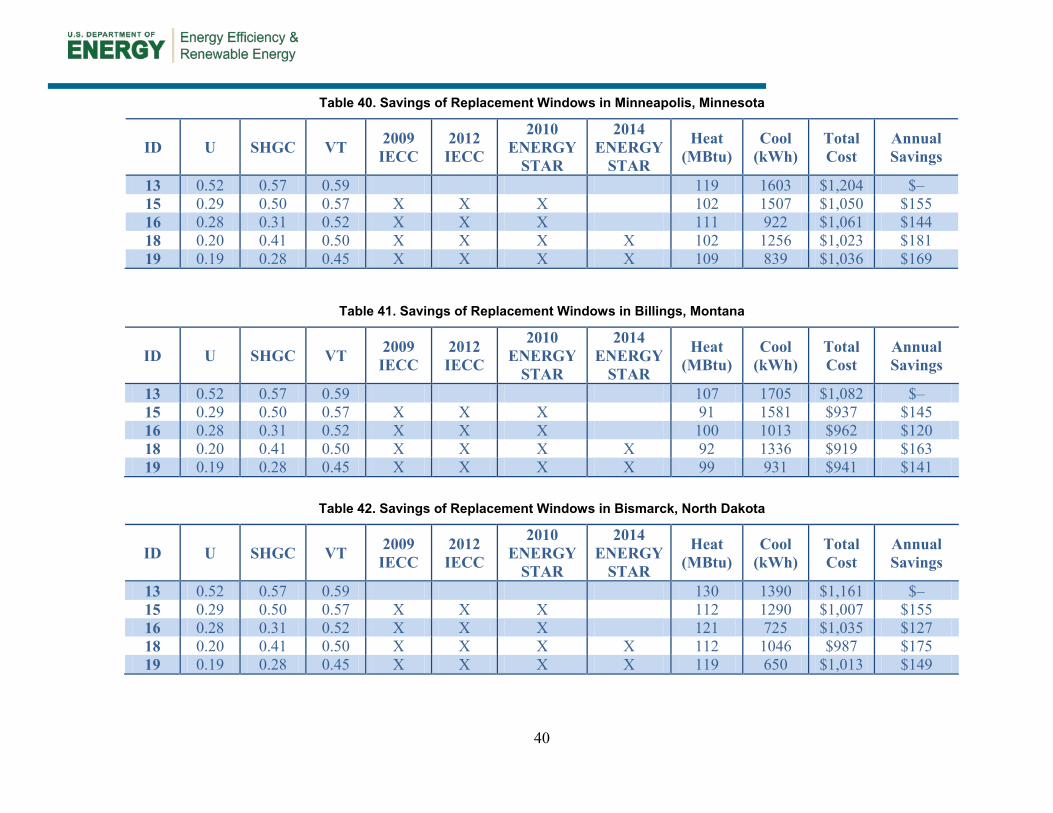
40
Table 40. Savings of Replacement Windows in Minneapolis, Minnesota
ID U SHGC VT 2009 IECC
2012 IECC
2010 ENERGY
STAR
2014 ENERGY
STAR
Heat (MBtu)
Cool (kWh)
Total Cost
Annual Savings
13 0.52 0.57 0.59 119 1603 $1,204 $– 15 0.29 0.50 0.57 X X X 102 1507 $1,050 $155 16 0.28 0.31 0.52 X X X 111 922 $1,061 $144 18 0.20 0.41 0.50 X X X X 102 1256 $1,023 $181 19 0.19 0.28 0.45 X X X X 109 839 $1,036 $169
Table 41. Savings of Replacement Windows in Billings, Montana
ID U SHGC VT 2009 IECC
2012 IECC
2010 ENERGY
STAR
2014 ENERGY
STAR
Heat (MBtu)
Cool (kWh)
Total Cost
Annual Savings
13 0.52 0.57 0.59 107 1705 $1,082 $– 15 0.29 0.50 0.57 X X X 91 1581 $937 $145 16 0.28 0.31 0.52 X X X 100 1013 $962 $120 18 0.20 0.41 0.50 X X X X 92 1336 $919 $163 19 0.19 0.28 0.45 X X X X 99 931 $941 $141
Table 42. Savings of Replacement Windows in Bismarck, North Dakota
ID U SHGC VT 2009 IECC
2012 IECC
2010 ENERGY
STAR
2014 ENERGY
STAR
Heat (MBtu)
Cool (kWh)
Total Cost
Annual Savings
13 0.52 0.57 0.59 130 1390 $1,161 $– 15 0.29 0.50 0.57 X X X 112 1290 $1,007 $155 16 0.28 0.31 0.52 X X X 121 725 $1,035 $127 18 0.20 0.41 0.50 X X X X 112 1046 $987 $175 19 0.19 0.28 0.45 X X X X 119 650 $1,013 $149
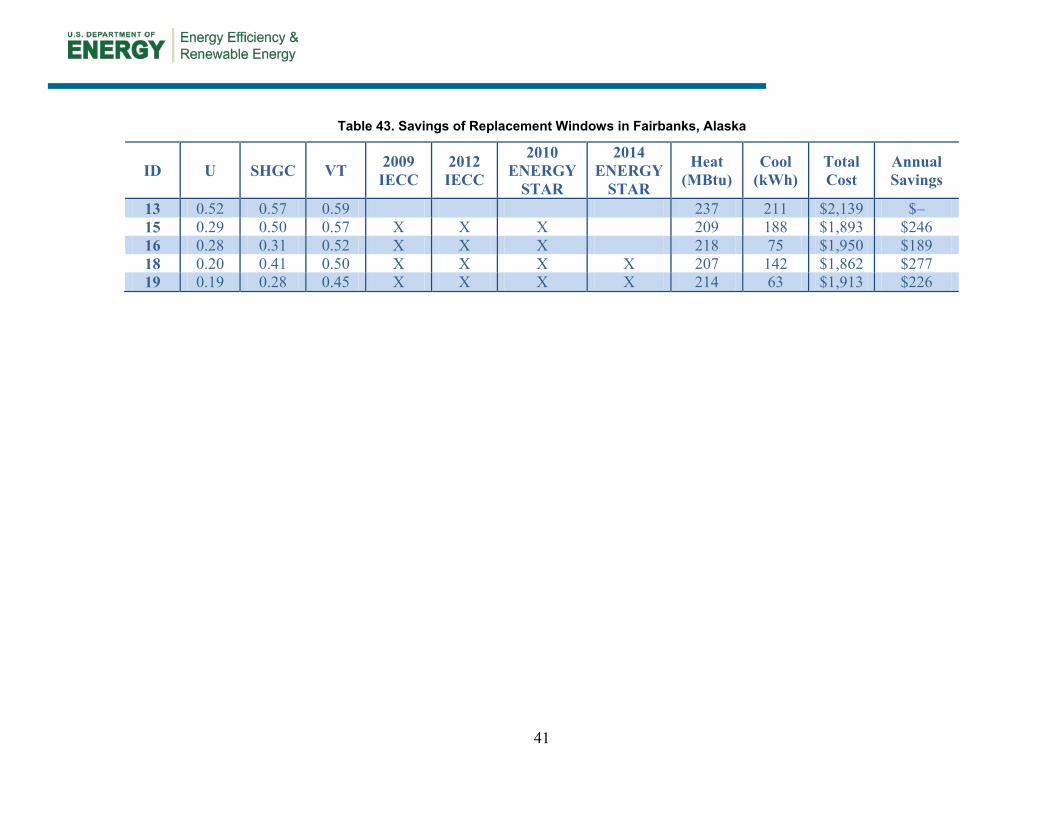
41
Table 43. Savings of Replacement Windows in Fairbanks, Alaska
ID U SHGC VT 2009 IECC
2012 IECC
2010 ENERGY
STAR
2014 ENERGY
STAR
Heat (MBtu)
Cool (kWh)
Total Cost
Annual Savings
13 0.52 0.57 0.59 237 211 $2,139 $– 15 0.29 0.50 0.57 X X X 209 188 $1,893 $246 16 0.28 0.31 0.52 X X X 218 75 $1,950 $189 18 0.20 0.41 0.50 X X X X 207 142 $1,862 $277 19 0.19 0.28 0.45 X X X X 214 63 $1,913 $226
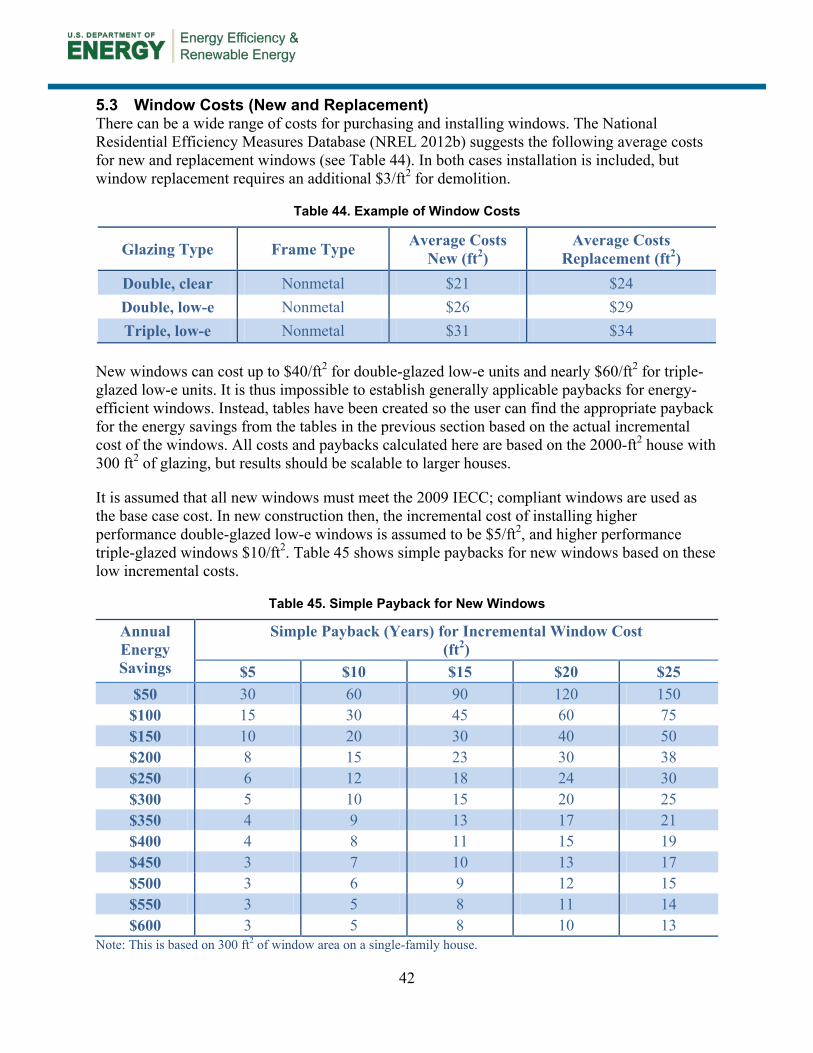
42
5.3 Window Costs (New and Replacement) There can be a wide range of costs for purchasing and installing windows. The National Residential Efficiency Measures Database (NREL 2012b) suggests the following average costs for new and replacement windows (see Table 44). In both cases installation is included, but window replacement requires an additional $3/ft2 for demolition.
Table 44. Example of Window Costs
Glazing Type Frame Type Average Costs New (ft2)
Average Costs Replacement (ft2)
Double, clear Nonmetal $21 $24 Double, low-e Nonmetal $26 $29 Triple, low-e Nonmetal $31 $34
New windows can cost up to $40/ft2 for double-glazed low-e units and nearly $60/ft2 for triple-glazed low-e units. It is thus impossible to establish generally applicable paybacks for energy-efficient windows. Instead, tables have been created so the user can find the appropriate payback for the energy savings from the tables in the previous section based on the actual incremental cost of the windows. All costs and paybacks calculated here are based on the 2000-ft2 house with 300 ft2 of glazing, but results should be scalable to larger houses.
It is assumed that all new windows must meet the 2009 IECC; compliant windows are used as the base case cost. In new construction then, the incremental cost of installing higher performance double-glazed low-e windows is assumed to be $5/ft2, and higher performance triple-glazed windows $10/ft2. Table 45 shows simple paybacks for new windows based on these low incremental costs.
Table 45. Simple Payback for New Windows
Annual Energy Savings
Simple Payback (Years) for Incremental Window Cost (ft2)
$5 $10 $15 $20 $25 $50 30 60 90 120 150 $100 15 30 45 60 75 $150 10 20 30 40 50 $200 8 15 23 30 38 $250 6 12 18 24 30 $300 5 10 15 20 25 $350 4 9 13 17 21 $400 4 8 11 15 19 $450 3 7 10 13 17 $500 3 6 9 12 15 $550 3 5 8 11 14 $600 3 5 8 10 13
Note: This is based on 300 ft2 of window area on a single-family house.
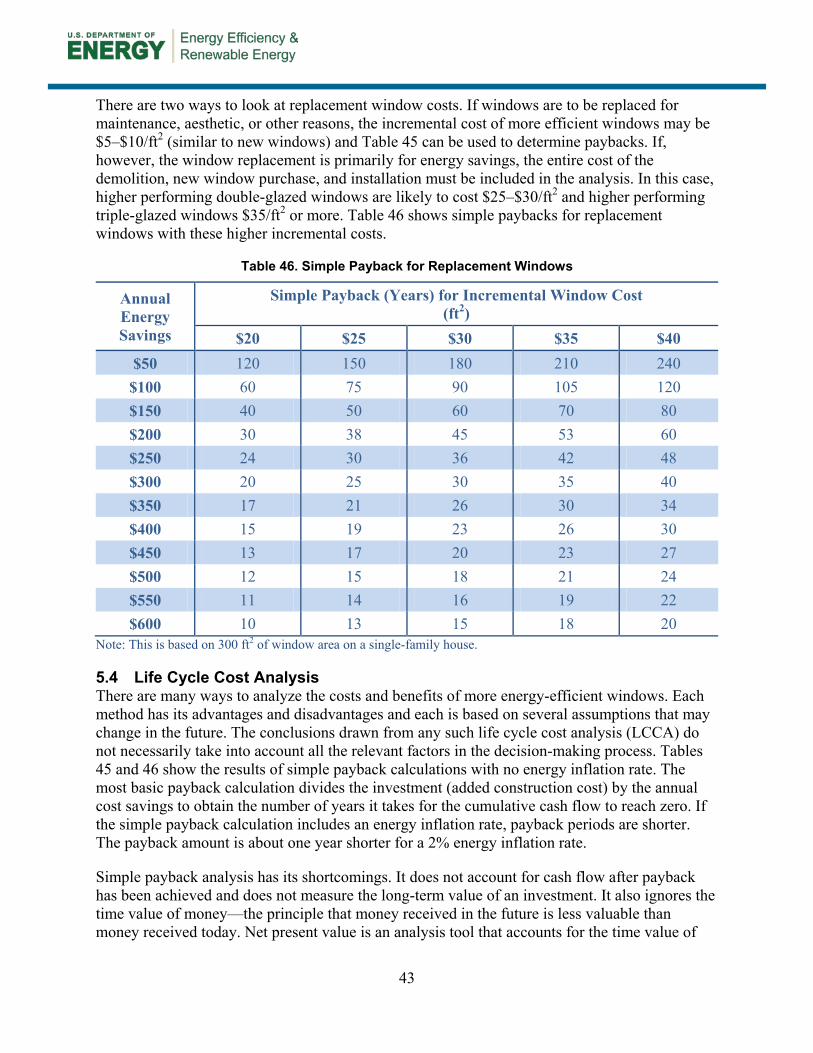
43
There are two ways to look at replacement window costs. If windows are to be replaced for maintenance, aesthetic, or other reasons, the incremental cost of more efficient windows may be $5–$10/ft2 (similar to new windows) and Table 45 can be used to determine paybacks. If, however, the window replacement is primarily for energy savings, the entire cost of the demolition, new window purchase, and installation must be included in the analysis. In this case, higher performing double-glazed windows are likely to cost $25–$30/ft2 and higher performing triple-glazed windows $35/ft2 or more. Table 46 shows simple paybacks for replacement windows with these higher incremental costs.
Table 46. Simple Payback for Replacement Windows
Annual Energy Savings
Simple Payback (Years) for Incremental Window Cost (ft2)
$20 $25 $30 $35 $40 $50 120 150 180 210 240 $100 60 75 90 105 120 $150 40 50 60 70 80 $200 30 38 45 53 60 $250 24 30 36 42 48 $300 20 25 30 35 40 $350 17 21 26 30 34 $400 15 19 23 26 30 $450 13 17 20 23 27 $500 12 15 18 21 24 $550 11 14 16 19 22 $600 10 13 15 18 20
Note: This is based on 300 ft2 of window area on a single-family house.
5.4 Life Cycle Cost Analysis There are many ways to analyze the costs and benefits of more energy-efficient windows. Each method has its advantages and disadvantages and each is based on several assumptions that may change in the future. The conclusions drawn from any such life cycle cost analysis (LCCA) do not necessarily take into account all the relevant factors in the decision-making process. Tables 45 and 46 show the results of simple payback calculations with no energy inflation rate. The most basic payback calculation divides the investment (added construction cost) by the annual cost savings to obtain the number of years it takes for the cumulative cash flow to reach zero. If the simple payback calculation includes an energy inflation rate, payback periods are shorter. The payback amount is about one year shorter for a 2% energy inflation rate.
Simple payback analysis has its shortcomings. It does not account for cash flow after payback has been achieved and does not measure the long-term value of an investment. It also ignores the time value of money—the principle that money received in the future is less valuable than money received today. Net present value is an analysis tool that accounts for the time value of
44
money by discounting future cash flows. If the result of a net present value calculation is a positive number over the time period specified, it is considered a good investment; if it is a negative number, it is not a good investment.
Net monthly cash flow analysis is another way to evaluate an investment in energy efficiency. The monthly mortgage payment is calculated for the additional money spent for the energy efficiency improvement. This is compared to the monthly energy savings. Any investment with a positive net monthly cash flow is attractive to the homeowner. A final method of comparing alternative scenarios is 30-year lifetime cost. This represents the total of the initial construction cost, the energy costs, and the cost of the mortgage payment on borrowed money over 30 years.
5.4.1 Life Cycle Cost Summary The preceding LCCA discussion is not intended to provide definitive answers about the cost effectiveness of new or replacement windows. Instead, it serves as a means to illustrate the many issues and variables that might be considered in such a decision.
It is important to remember that all this analysis is based on using RESFEN for a typical house with a number of assumptions about the house characteristics and window options. Changes in key assumptions can significantly change the results and conclusions. The cost of the windows is one important factor. As the window cost difference is reduced, the LCC are more attractive. Similarly, energy price increases or carbon taxes designed to increase fossil fuel energy prices would make the analysis more favorable for investing in higher levels of energy efficiency. Remember that if windows are to be replaced for maintenance, aesthetic, or other reasons, payback calculations should not be based on the full cost of the window replacement but instead on the incremental cost of more efficient windows (typically $5–$10/ft2).
The LCCA presented here excludes several important factors that can favorably influence the decision to invest in energy-efficient windows:
• Replacement windows can represent maintenance cost savings as well as energy savings. Durability is a key issue in selecting new windows.
• High performance windows generally improve thermal comfort. On a cold day, the warmer surface of a new window means less radiant heat loss. This may allow homeowners to be comfortable at an air temperature that is 2°F lower. Lowering the thermostat setting to reflect this adds to the energy savings attributable to the windows (see next section).
• If installed properly, replacement windows will reduce air leakage through the window and through the building envelope surrounding the window. This can significantly increase energy savings in cold climates. The fact that this analysis does not include the improvement in airtightness means that the value of replacement windows is somewhat shortchanged. The improved comfort may also save additional energy if thermostats are lowered.
• Installing high performance windows in new construction often means the heating, ventilation, and air conditioning (HVAC) system loads are reduced. This in turn means that smaller heating and cooling units can be installed, resulting in cost savings that offset
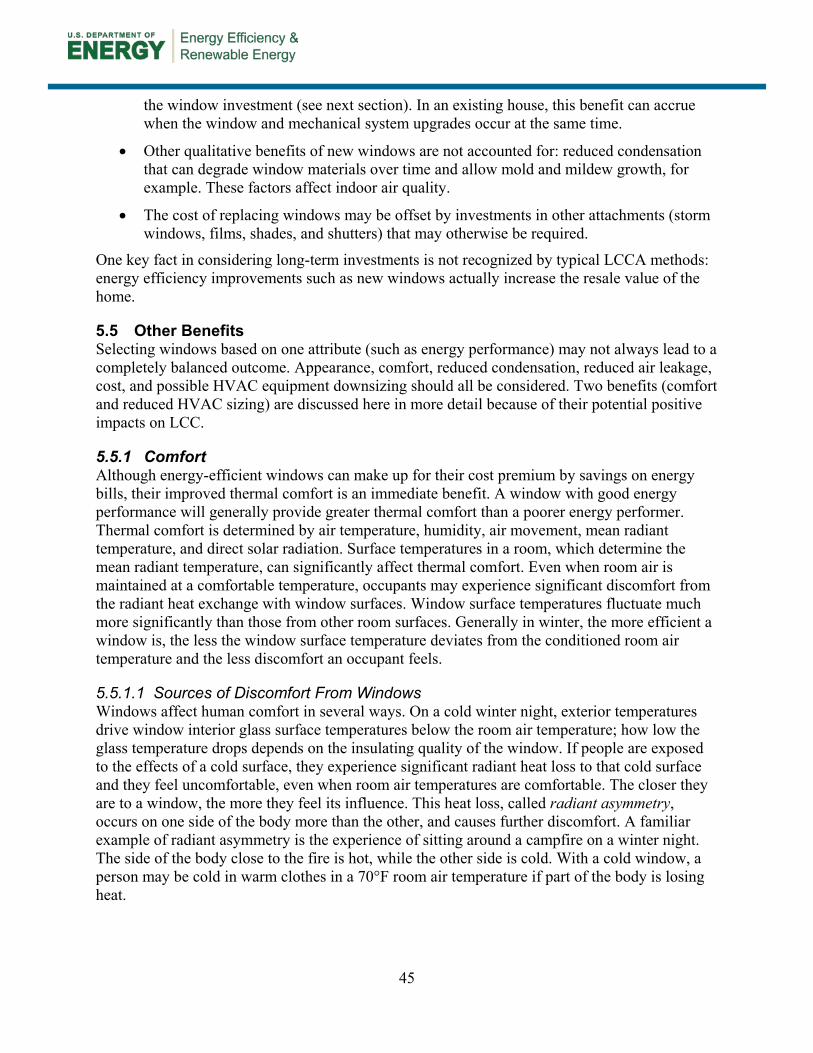
45
the window investment (see next section). In an existing house, this benefit can accrue when the window and mechanical system upgrades occur at the same time.
• Other qualitative benefits of new windows are not accounted for: reduced condensation that can degrade window materials over time and allow mold and mildew growth, for example. These factors affect indoor air quality.
• The cost of replacing windows may be offset by investments in other attachments (storm windows, films, shades, and shutters) that may otherwise be required.
One key fact in considering long-term investments is not recognized by typical LCCA methods: energy efficiency improvements such as new windows actually increase the resale value of the home.
5.5 Other Benefits Selecting windows based on one attribute (such as energy performance) may not always lead to a completely balanced outcome. Appearance, comfort, reduced condensation, reduced air leakage, cost, and possible HVAC equipment downsizing should all be considered. Two benefits (comfort and reduced HVAC sizing) are discussed here in more detail because of their potential positive impacts on LCC.
5.5.1 Comfort Although energy-efficient windows can make up for their cost premium by savings on energy bills, their improved thermal comfort is an immediate benefit. A window with good energy performance will generally provide greater thermal comfort than a poorer energy performer. Thermal comfort is determined by air temperature, humidity, air movement, mean radiant temperature, and direct solar radiation. Surface temperatures in a room, which determine the mean radiant temperature, can significantly affect thermal comfort. Even when room air is maintained at a comfortable temperature, occupants may experience significant discomfort from the radiant heat exchange with window surfaces. Window surface temperatures fluctuate much more significantly than those from other room surfaces. Generally in winter, the more efficient a window is, the less the window surface temperature deviates from the conditioned room air temperature and the less discomfort an occupant feels.
5.5.1.1 Sources of Discomfort From Windows Windows affect human comfort in several ways. On a cold winter night, exterior temperatures drive window interior glass surface temperatures below the room air temperature; how low the glass temperature drops depends on the insulating quality of the window. If people are exposed to the effects of a cold surface, they experience significant radiant heat loss to that cold surface and they feel uncomfortable, even when room air temperatures are comfortable. The closer they are to a window, the more they feel its influence. This heat loss, called radiant asymmetry, occurs on one side of the body more than the other, and causes further discomfort. A familiar example of radiant asymmetry is the experience of sitting around a campfire on a winter night. The side of the body close to the fire is hot, while the other side is cold. With a cold window, a person may be cold in warm clothes in a 70°F room air temperature if part of the body is losing heat.
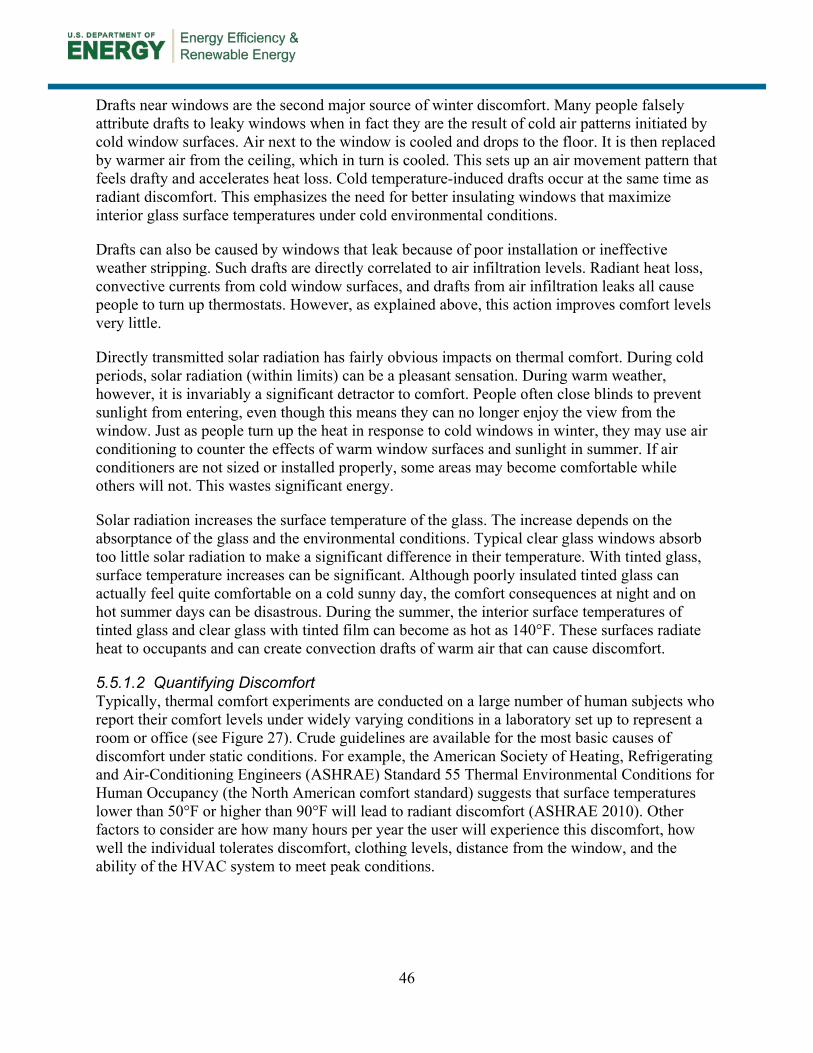
46
Drafts near windows are the second major source of winter discomfort. Many people falsely attribute drafts to leaky windows when in fact they are the result of cold air patterns initiated by cold window surfaces. Air next to the window is cooled and drops to the floor. It is then replaced by warmer air from the ceiling, which in turn is cooled. This sets up an air movement pattern that feels drafty and accelerates heat loss. Cold temperature-induced drafts occur at the same time as radiant discomfort. This emphasizes the need for better insulating windows that maximize interior glass surface temperatures under cold environmental conditions.
Drafts can also be caused by windows that leak because of poor installation or ineffective weather stripping. Such drafts are directly correlated to air infiltration levels. Radiant heat loss, convective currents from cold window surfaces, and drafts from air infiltration leaks all cause people to turn up thermostats. However, as explained above, this action improves comfort levels very little.
Directly transmitted solar radiation has fairly obvious impacts on thermal comfort. During cold periods, solar radiation (within limits) can be a pleasant sensation. During warm weather, however, it is invariably a significant detractor to comfort. People often close blinds to prevent sunlight from entering, even though this means they can no longer enjoy the view from the window. Just as people turn up the heat in response to cold windows in winter, they may use air conditioning to counter the effects of warm window surfaces and sunlight in summer. If air conditioners are not sized or installed properly, some areas may become comfortable while others will not. This wastes significant energy.
Solar radiation increases the surface temperature of the glass. The increase depends on the absorptance of the glass and the environmental conditions. Typical clear glass windows absorb too little solar radiation to make a significant difference in their temperature. With tinted glass, surface temperature increases can be significant. Although poorly insulated tinted glass can actually feel quite comfortable on a cold sunny day, the comfort consequences at night and on hot summer days can be disastrous. During the summer, the interior surface temperatures of tinted glass and clear glass with tinted film can become as hot as 140°F. These surfaces radiate heat to occupants and can create convection drafts of warm air that can cause discomfort.
5.5.1.2 Quantifying Discomfort Typically, thermal comfort experiments are conducted on a large number of human subjects who report their comfort levels under widely varying conditions in a laboratory set up to represent a room or office (see Figure 27). Crude guidelines are available for the most basic causes of discomfort under static conditions. For example, the American Society of Heating, Refrigerating and Air-Conditioning Engineers (ASHRAE) Standard 55 Thermal Environmental Conditions for Human Occupancy (the North American comfort standard) suggests that surface temperatures lower than 50°F or higher than 90°F will lead to radiant discomfort (ASHRAE 2010). Other factors to consider are how many hours per year the user will experience this discomfort, how well the individual tolerates discomfort, clothing levels, distance from the window, and the ability of the HVAC system to meet peak conditions.
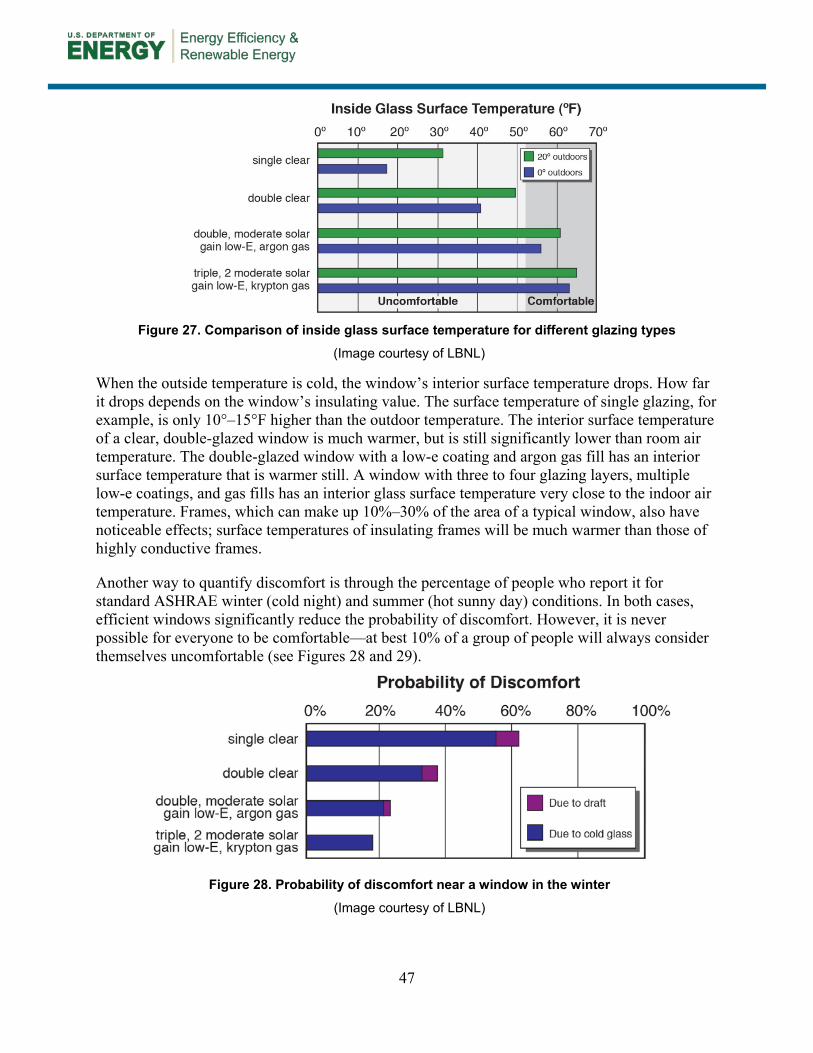
47
When the outside temperature is cold, the window’s interior surface temperature drops. How far it drops depends on the window’s insulating value. The surface temperature of single glazing, for example, is only 10°–15°F higher than the outdoor temperature. The interior surface temperature of a clear, double-glazed window is much warmer, but is still significantly lower than room air temperature. The double-glazed window with a low-e coating and argon gas fill has an interior surface temperature that is warmer still. A window with three to four glazing layers, multiple low-e coatings, and gas fills has an interior glass surface temperature very close to the indoor air temperature. Frames, which can make up 10%–30% of the area of a typical window, also have noticeable effects; surface temperatures of insulating frames will be much warmer than those of highly conductive frames.
Another way to quantify discomfort is through the percentage of people who report it for standard ASHRAE winter (cold night) and summer (hot sunny day) conditions. In both cases, efficient windows significantly reduce the probability of discomfort. However, it is never possible for everyone to be comfortable—at best 10% of a group of people will always consider themselves uncomfortable (see Figures 28 and 29).
Figure 27. Comparison of inside glass surface temperature for different glazing types (Image courtesy of LBNL)
Figure 28. Probability of discomfort near a window in the winter
(Image courtesy of LBNL)
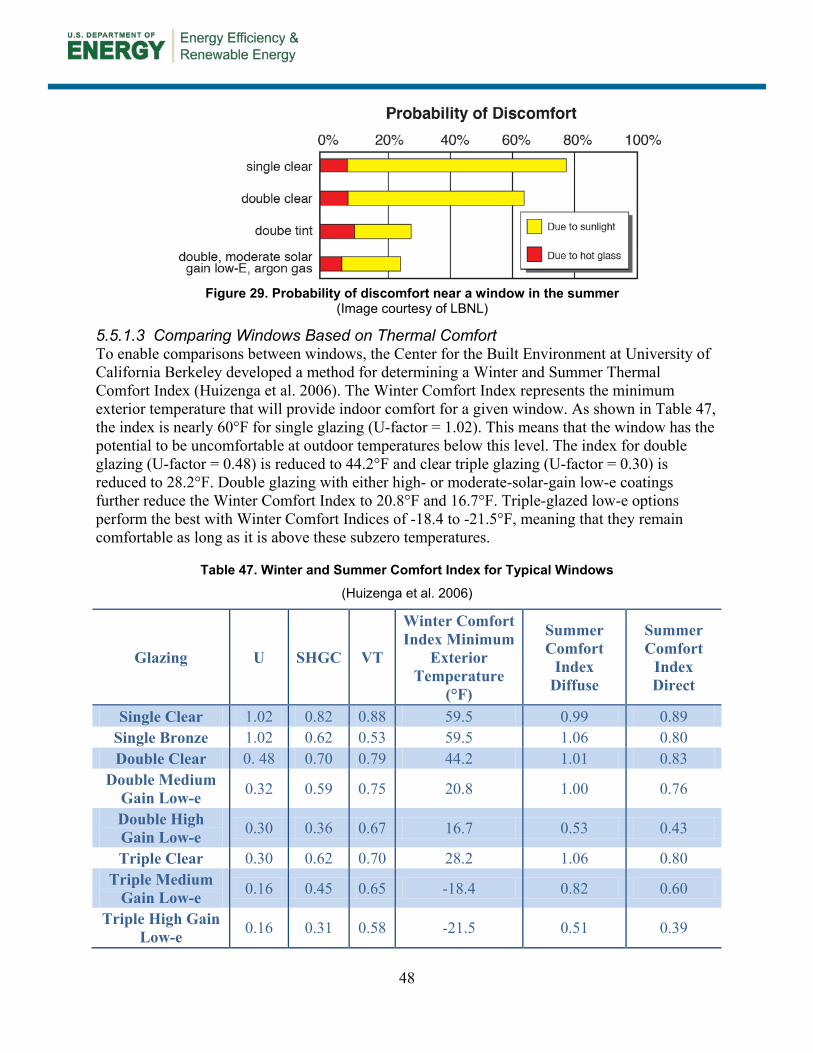
48
5.5.1.3 Comparing Windows Based on Thermal Comfort To enable comparisons between windows, the Center for the Built Environment at University of California Berkeley developed a method for determining a Winter and Summer Thermal Comfort Index (Huizenga et al. 2006). The Winter Comfort Index represents the minimum exterior temperature that will provide indoor comfort for a given window. As shown in Table 47, the index is nearly 60°F for single glazing (U-factor = 1.02). This means that the window has the potential to be uncomfortable at outdoor temperatures below this level. The index for double glazing (U-factor = 0.48) is reduced to 44.2°F and clear triple glazing (U-factor = 0.30) is reduced to 28.2°F. Double glazing with either high- or moderate-solar-gain low-e coatings further reduce the Winter Comfort Index to 20.8°F and 16.7°F. Triple-glazed low-e options perform the best with Winter Comfort Indices of -18.4 to -21.5°F, meaning that they remain comfortable as long as it is above these subzero temperatures.
Table 47. Winter and Summer Comfort Index for Typical Windows
(Huizenga et al. 2006)
Glazing U SHGC VT
Winter Comfort Index Minimum
Exterior Temperature
(°F)
Summer Comfort
Index Diffuse
Summer Comfort
Index Direct
Single Clear 1.02 0.82 0.88 59.5 0.99 0.89 Single Bronze 1.02 0.62 0.53 59.5 1.06 0.80 Double Clear 0. 48 0.70 0.79 44.2 1.01 0.83
Double Medium Gain Low-e 0.32 0.59 0.75 20.8 1.00 0.76
Double High Gain Low-e 0.30 0.36 0.67 16.7 0.53 0.43
Triple Clear 0.30 0.62 0.70 28.2 1.06 0.80 Triple Medium
Gain Low-e 0.16 0.45 0.65 -18.4 0.82 0.60
Triple High Gain Low-e 0.16 0.31 0.58 -21.5 0.51 0.39
Figure 29. Probability of discomfort near a window in the summer
(Image courtesy of LBNL)
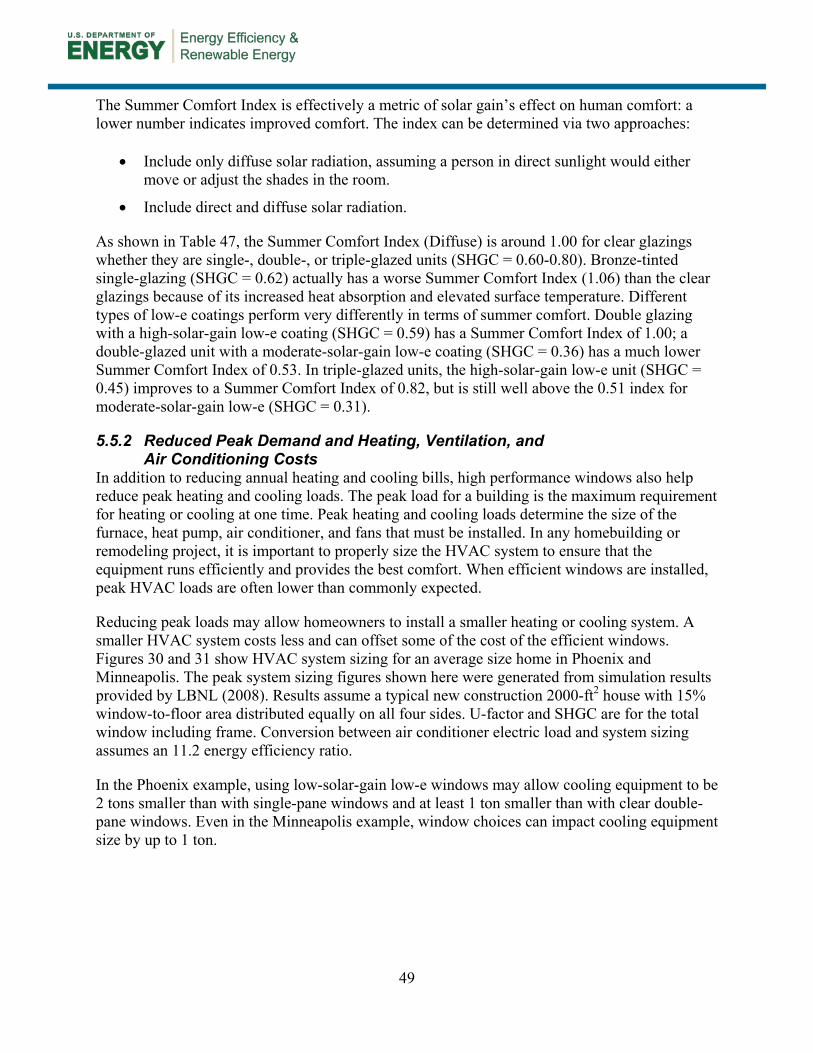
49
The Summer Comfort Index is effectively a metric of solar gain’s effect on human comfort: a lower number indicates improved comfort. The index can be determined via two approaches:
• Include only diffuse solar radiation, assuming a person in direct sunlight would either move or adjust the shades in the room.
• Include direct and diffuse solar radiation.
As shown in Table 47, the Summer Comfort Index (Diffuse) is around 1.00 for clear glazings whether they are single-, double-, or triple-glazed units (SHGC = 0.60-0.80). Bronze-tinted single-glazing (SHGC = 0.62) actually has a worse Summer Comfort Index (1.06) than the clear glazings because of its increased heat absorption and elevated surface temperature. Different types of low-e coatings perform very differently in terms of summer comfort. Double glazing with a high-solar-gain low-e coating (SHGC = 0.59) has a Summer Comfort Index of 1.00; a double-glazed unit with a moderate-solar-gain low-e coating (SHGC = 0.36) has a much lower Summer Comfort Index of 0.53. In triple-glazed units, the high-solar-gain low-e unit (SHGC = 0.45) improves to a Summer Comfort Index of 0.82, but is still well above the 0.51 index for moderate-solar-gain low-e (SHGC = 0.31).
5.5.2 Reduced Peak Demand and Heating, Ventilation, and Air Conditioning Costs
In addition to reducing annual heating and cooling bills, high performance windows also help reduce peak heating and cooling loads. The peak load for a building is the maximum requirement for heating or cooling at one time. Peak heating and cooling loads determine the size of the furnace, heat pump, air conditioner, and fans that must be installed. In any homebuilding or remodeling project, it is important to properly size the HVAC system to ensure that the equipment runs efficiently and provides the best comfort. When efficient windows are installed, peak HVAC loads are often lower than commonly expected.
Reducing peak loads may allow homeowners to install a smaller heating or cooling system. A smaller HVAC system costs less and can offset some of the cost of the efficient windows. Figures 30 and 31 show HVAC system sizing for an average size home in Phoenix and Minneapolis. The peak system sizing figures shown here were generated from simulation results provided by LBNL (2008). Results assume a typical new construction 2000-ft2 house with 15% window-to-floor area distributed equally on all four sides. U-factor and SHGC are for the total window including frame. Conversion between air conditioner electric load and system sizing assumes an 11.2 energy efficiency ratio.
In the Phoenix example, using low-solar-gain low-e windows may allow cooling equipment to be 2 tons smaller than with single-pane windows and at least 1 ton smaller than with clear double-pane windows. Even in the Minneapolis example, window choices can impact cooling equipment size by up to 1 ton.
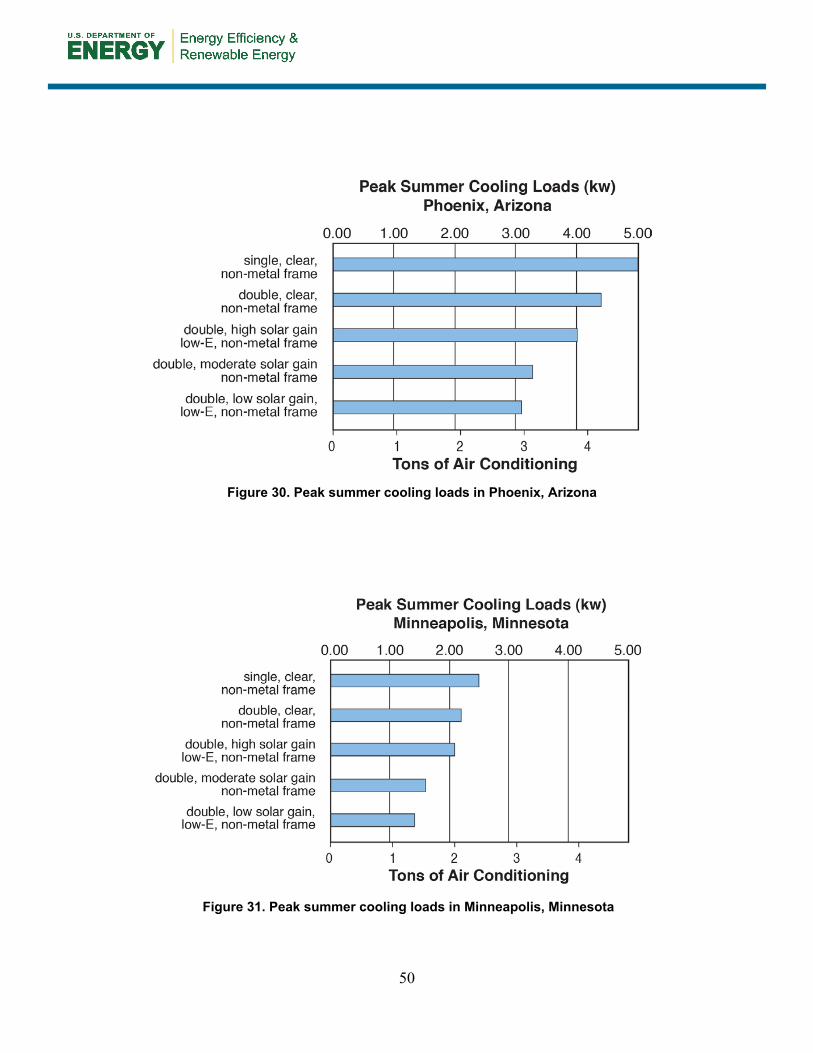
50
Figure 31. Peak summer cooling loads in Minneapolis, Minnesota
Figure 30. Peak summer cooling loads in Phoenix, Arizona
51
5.5.2.1 Rightsizing Heating, Ventilation, and Air Conditioning Systems Properly sized HVAC systems provide a number of benefits (Proctor et al. 1995):
• Health and comfort. By running more constantly, smaller HVAC systems provide the best air quality and comfort.
• Mold prevention. In climates with humidity issues, HVAC systems that are more closely matched to peak cooling loads achieve better dehumidification.
• First cost savings. Smaller HVAC units cost less. If, for example, downsizing the HVAC system by ½ ton saves $275, the cost premium of energy-efficient windows presents a smaller up-front investment.
• Energy savings. Oversized units may have inefficient stop-and-go cycles; the best system efficiency is realized when HVAC units are sized appropriately.
5.5.2.2 Heating, Ventilation, and Air Conditioning Sizing Tools Several computation procedures are available for proper sizing of HVAC equipment. The most prominent ones, which are also recommended by the ENERGY STAR Homes program, are Air Conditioning Contractors of America Manual J (ACCA 2011) and the ASHRAE Handbook of Fundamentals (ASHRAE 2009). Factors to be considered:
• The energy performance of the windows must be considered in load calculations. NFRC-certified window performance values (U-factor and SHGC) significantly increase the accuracy of these calculations.
• Window orientation and overhangs must be taken into account. Overhangs are an important factor influencing solar gains through windows. Where internal shades and blinds will be actively used, these should also be accounted for in load calculations.
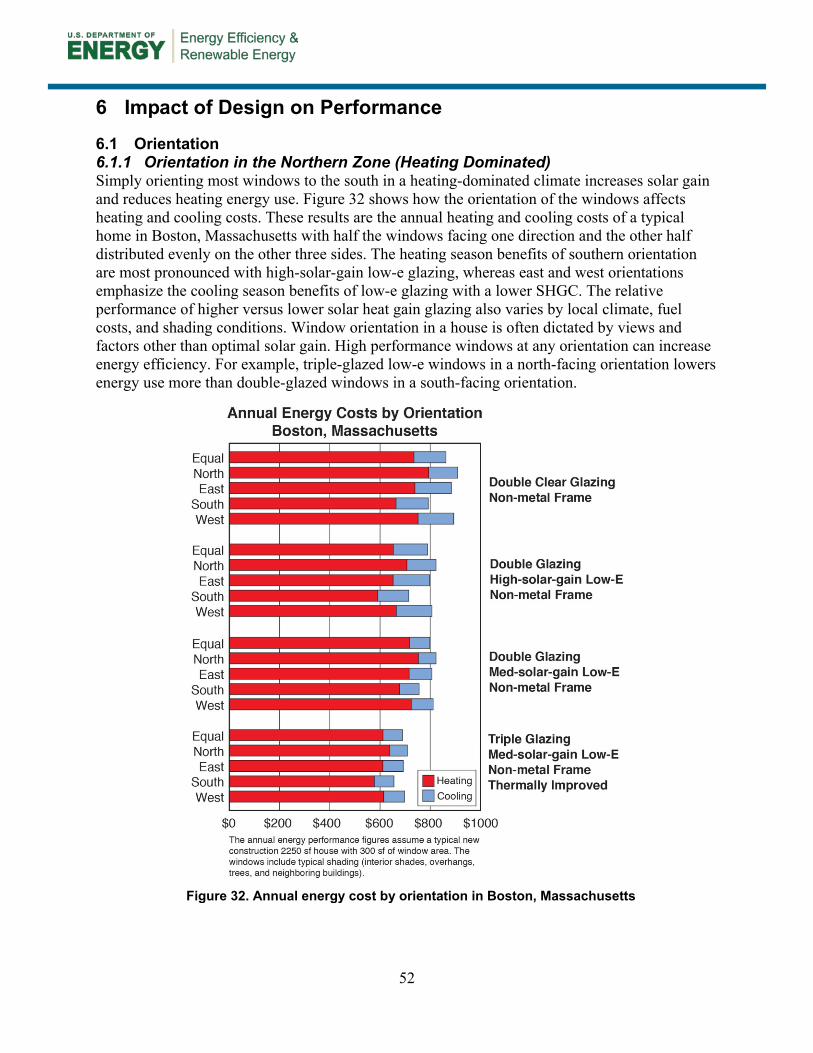
52
6 Impact of Design on Performance
6.1 Orientation 6.1.1 Orientation in the Northern Zone (Heating Dominated) Simply orienting most windows to the south in a heating-dominated climate increases solar gain and reduces heating energy use. Figure 32 shows how the orientation of the windows affects heating and cooling costs. These results are the annual heating and cooling costs of a typical home in Boston, Massachusetts with half the windows facing one direction and the other half distributed evenly on the other three sides. The heating season benefits of southern orientation are most pronounced with high-solar-gain low-e glazing, whereas east and west orientations emphasize the cooling season benefits of low-e glazing with a lower SHGC. The relative performance of higher versus lower solar heat gain glazing also varies by local climate, fuel costs, and shading conditions. Window orientation in a house is often dictated by views and factors other than optimal solar gain. High performance windows at any orientation can increase energy efficiency. For example, triple-glazed low-e windows in a north-facing orientation lowers energy use more than double-glazed windows in a south-facing orientation.
Figure 32. Annual energy cost by orientation in Boston, Massachusetts
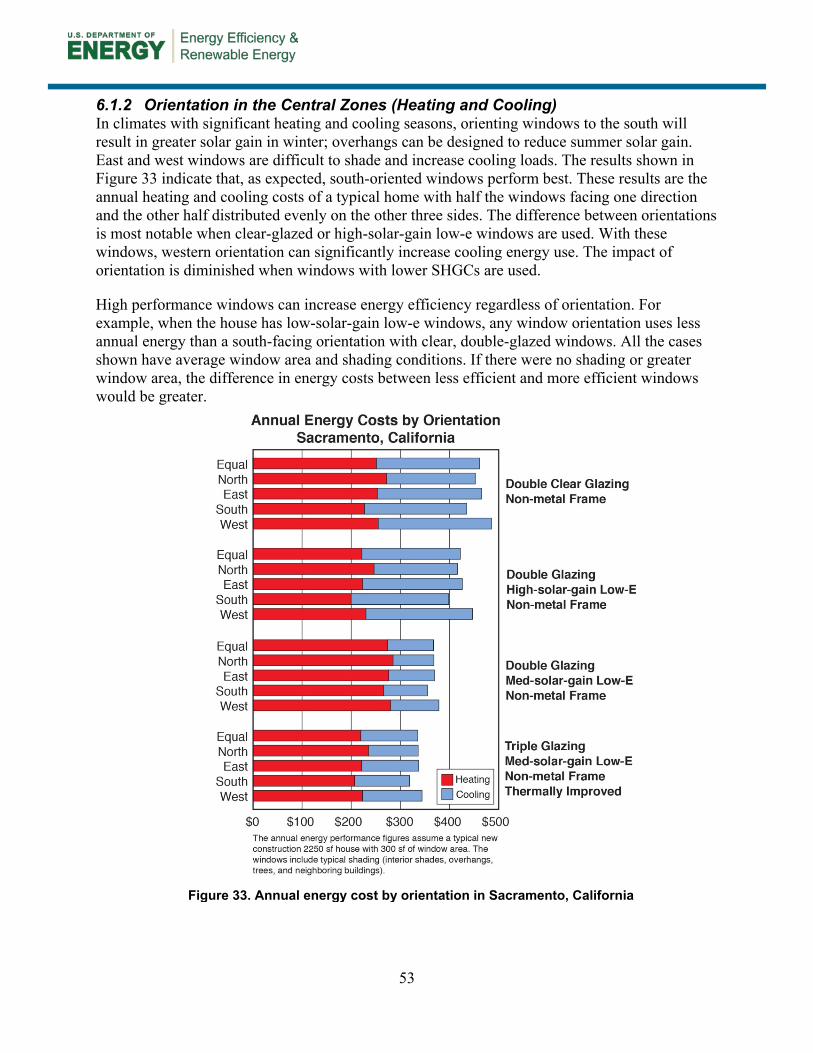
53
6.1.2 Orientation in the Central Zones (Heating and Cooling) In climates with significant heating and cooling seasons, orienting windows to the south will result in greater solar gain in winter; overhangs can be designed to reduce summer solar gain. East and west windows are difficult to shade and increase cooling loads. The results shown in Figure 33 indicate that, as expected, south-oriented windows perform best. These results are the annual heating and cooling costs of a typical home with half the windows facing one direction and the other half distributed evenly on the other three sides. The difference between orientations is most notable when clear-glazed or high-solar-gain low-e windows are used. With these windows, western orientation can significantly increase cooling energy use. The impact of orientation is diminished when windows with lower SHGCs are used.
High performance windows can increase energy efficiency regardless of orientation. For example, when the house has low-solar-gain low-e windows, any window orientation uses less annual energy than a south-facing orientation with clear, double-glazed windows. All the cases shown have average window area and shading conditions. If there were no shading or greater window area, the difference in energy costs between less efficient and more efficient windows would be greater.
Figure 33. Annual energy cost by orientation in Sacramento, California
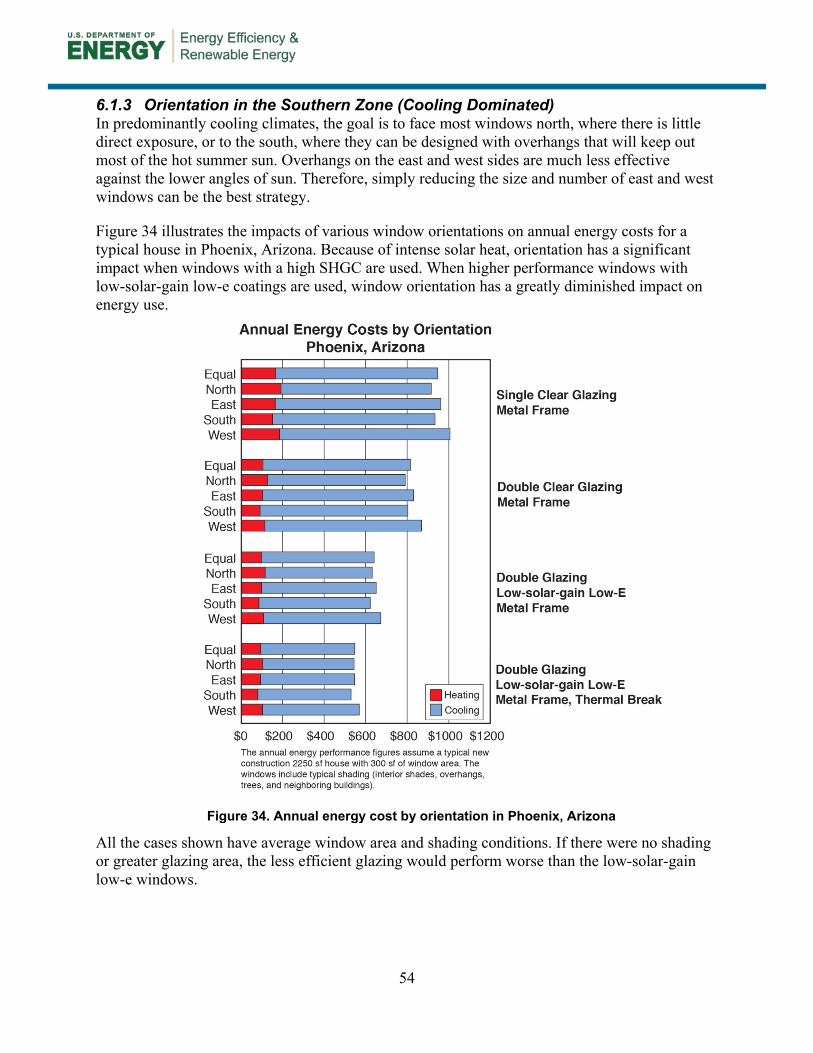
54
6.1.3 Orientation in the Southern Zone (Cooling Dominated) In predominantly cooling climates, the goal is to face most windows north, where there is little direct exposure, or to the south, where they can be designed with overhangs that will keep out most of the hot summer sun. Overhangs on the east and west sides are much less effective against the lower angles of sun. Therefore, simply reducing the size and number of east and west windows can be the best strategy.
Figure 34 illustrates the impacts of various window orientations on annual energy costs for a typical house in Phoenix, Arizona. Because of intense solar heat, orientation has a significant impact when windows with a high SHGC are used. When higher performance windows with low-solar-gain low-e coatings are used, window orientation has a greatly diminished impact on energy use.
All the cases shown have average window area and shading conditions. If there were no shading or greater glazing area, the less efficient glazing would perform worse than the low-solar-gain low-e windows.
Figure 34. Annual energy cost by orientation in Phoenix, Arizona
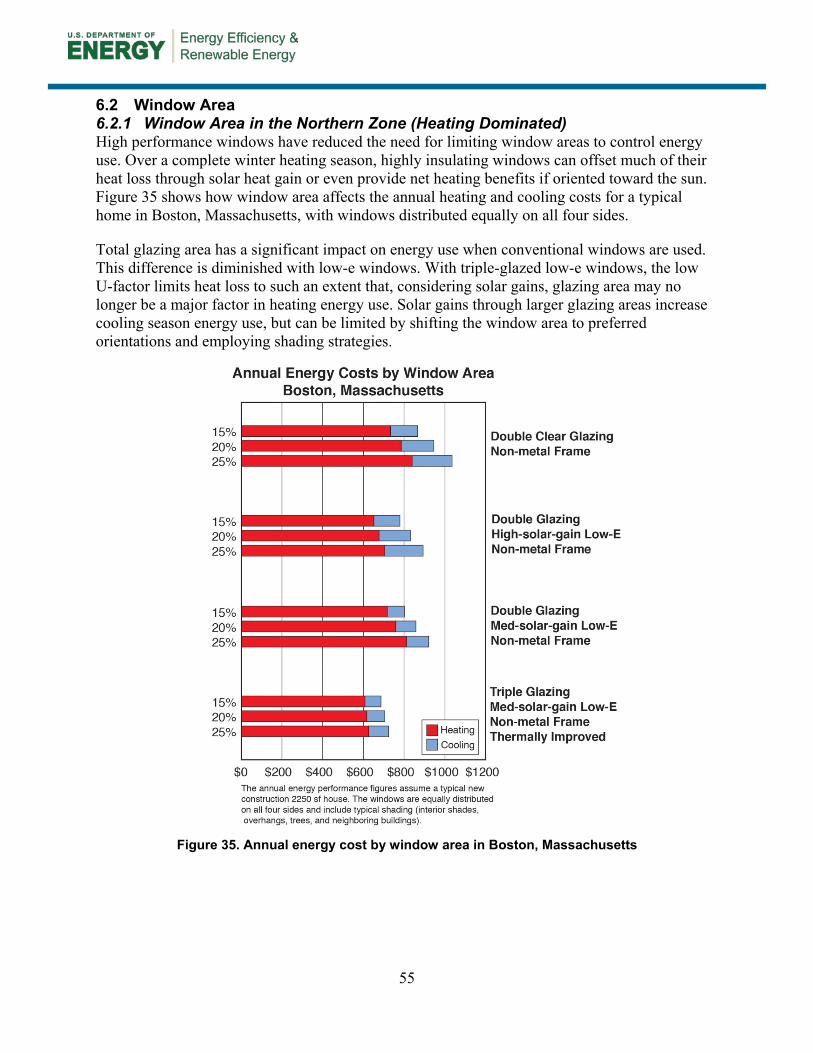
55
6.2 Window Area 6.2.1 Window Area in the Northern Zone (Heating Dominated) High performance windows have reduced the need for limiting window areas to control energy use. Over a complete winter heating season, highly insulating windows can offset much of their heat loss through solar heat gain or even provide net heating benefits if oriented toward the sun. Figure 35 shows how window area affects the annual heating and cooling costs for a typical home in Boston, Massachusetts, with windows distributed equally on all four sides.
Total glazing area has a significant impact on energy use when conventional windows are used. This difference is diminished with low-e windows. With triple-glazed low-e windows, the low U-factor limits heat loss to such an extent that, considering solar gains, glazing area may no longer be a major factor in heating energy use. Solar gains through larger glazing areas increase cooling season energy use, but can be limited by shifting the window area to preferred orientations and employing shading strategies.
Figure 35. Annual energy cost by window area in Boston, Massachusetts
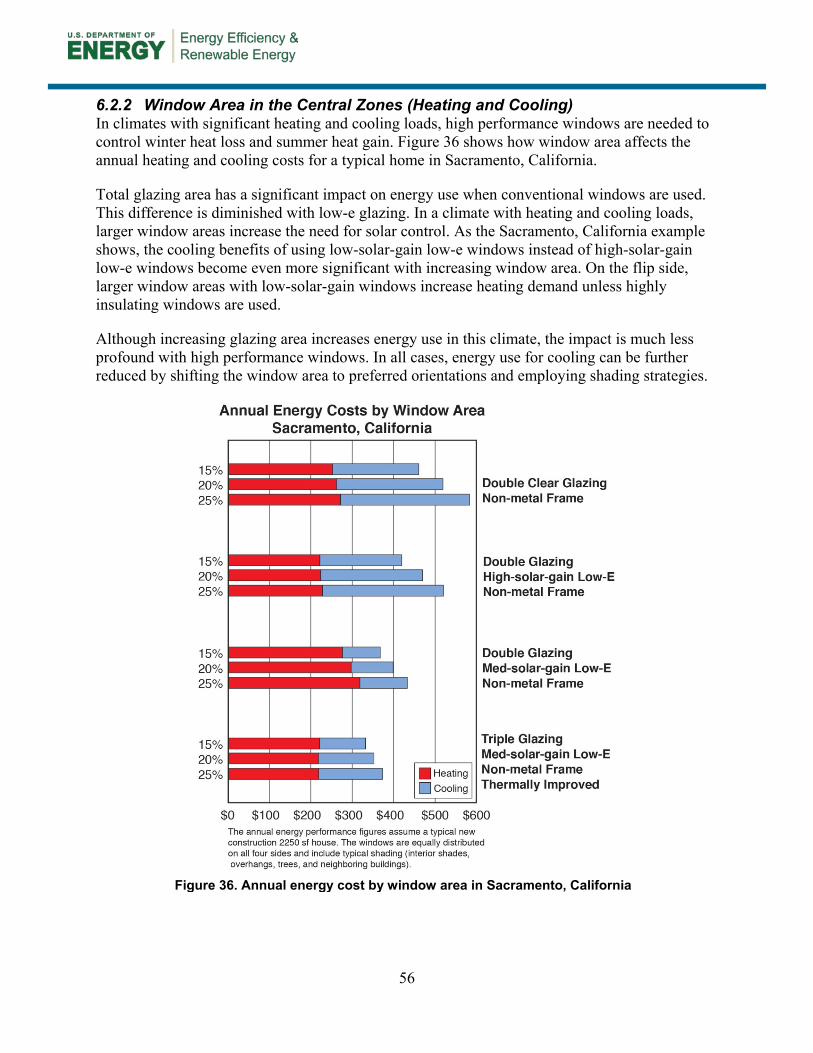
56
6.2.2 Window Area in the Central Zones (Heating and Cooling) In climates with significant heating and cooling loads, high performance windows are needed to control winter heat loss and summer heat gain. Figure 36 shows how window area affects the annual heating and cooling costs for a typical home in Sacramento, California.
Total glazing area has a significant impact on energy use when conventional windows are used. This difference is diminished with low-e glazing. In a climate with heating and cooling loads, larger window areas increase the need for solar control. As the Sacramento, California example shows, the cooling benefits of using low-solar-gain low-e windows instead of high-solar-gain low-e windows become even more significant with increasing window area. On the flip side, larger window areas with low-solar-gain windows increase heating demand unless highly insulating windows are used.
Although increasing glazing area increases energy use in this climate, the impact is much less profound with high performance windows. In all cases, energy use for cooling can be further reduced by shifting the window area to preferred orientations and employing shading strategies.
Figure 36. Annual energy cost by window area in Sacramento, California
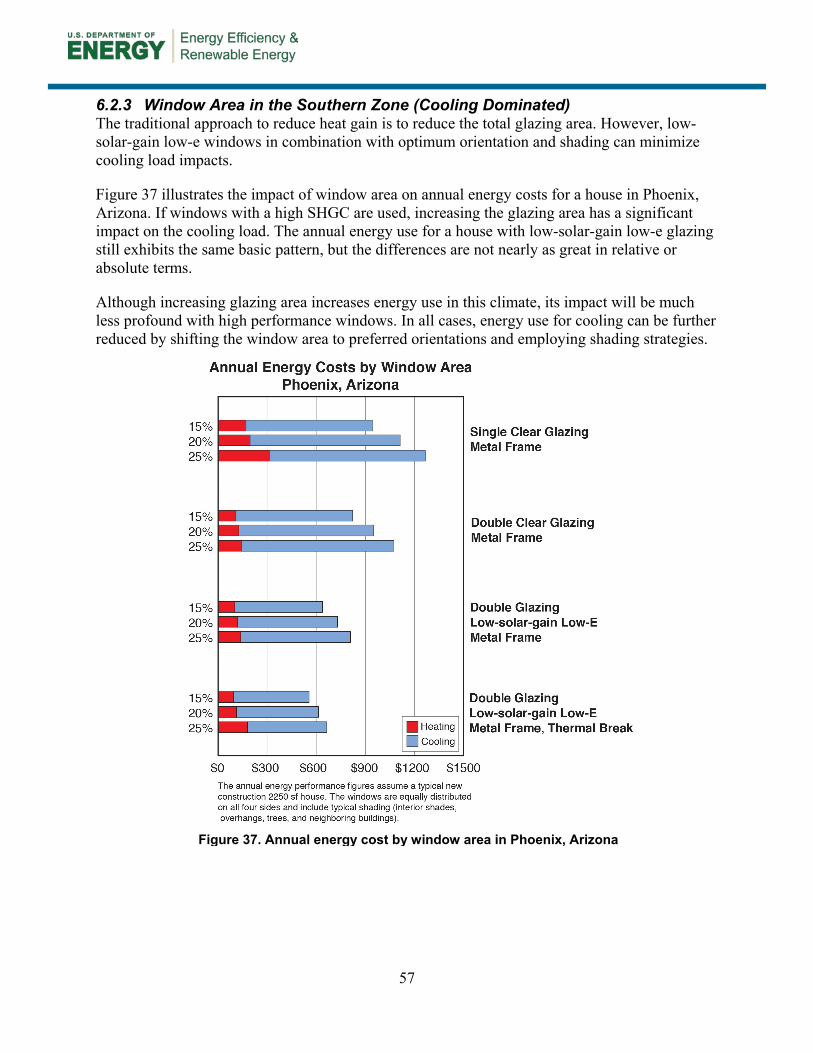
57
6.2.3 Window Area in the Southern Zone (Cooling Dominated) The traditional approach to reduce heat gain is to reduce the total glazing area. However, low-solar-gain low-e windows in combination with optimum orientation and shading can minimize cooling load impacts.
Figure 37 illustrates the impact of window area on annual energy costs for a house in Phoenix, Arizona. If windows with a high SHGC are used, increasing the glazing area has a significant impact on the cooling load. The annual energy use for a house with low-solar-gain low-e glazing still exhibits the same basic pattern, but the differences are not nearly as great in relative or absolute terms.
Although increasing glazing area increases energy use in this climate, its impact will be much less profound with high performance windows. In all cases, energy use for cooling can be further reduced by shifting the window area to preferred orientations and employing shading strategies.
Figure 37. Annual energy cost by window area in Phoenix, Arizona
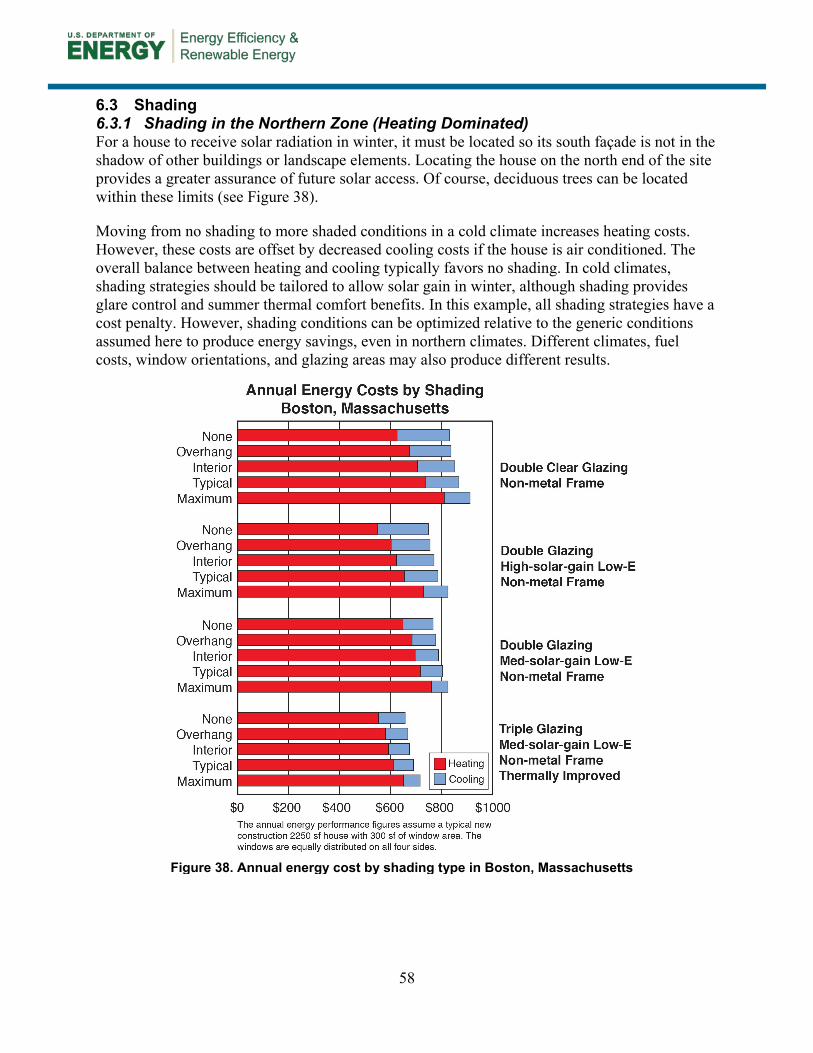
58
6.3 Shading 6.3.1 Shading in the Northern Zone (Heating Dominated) For a house to receive solar radiation in winter, it must be located so its south façade is not in the shadow of other buildings or landscape elements. Locating the house on the north end of the site provides a greater assurance of future solar access. Of course, deciduous trees can be located within these limits (see Figure 38).
Moving from no shading to more shaded conditions in a cold climate increases heating costs. However, these costs are offset by decreased cooling costs if the house is air conditioned. The overall balance between heating and cooling typically favors no shading. In cold climates, shading strategies should be tailored to allow solar gain in winter, although shading provides glare control and summer thermal comfort benefits. In this example, all shading strategies have a cost penalty. However, shading conditions can be optimized relative to the generic conditions assumed here to produce energy savings, even in northern climates. Different climates, fuel costs, window orientations, and glazing areas may also produce different results.
Figure 38. Annual energy cost by shading type in Boston, Massachusetts
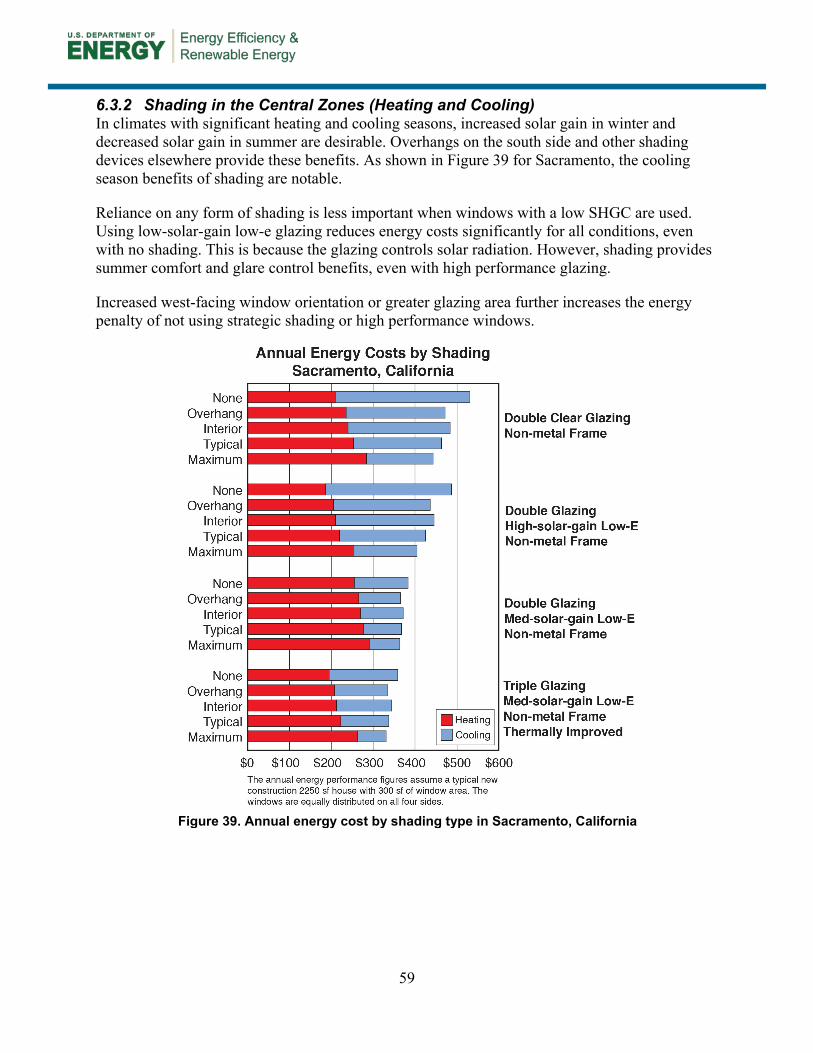
59
6.3.2 Shading in the Central Zones (Heating and Cooling) In climates with significant heating and cooling seasons, increased solar gain in winter and decreased solar gain in summer are desirable. Overhangs on the south side and other shading devices elsewhere provide these benefits. As shown in Figure 39 for Sacramento, the cooling season benefits of shading are notable.
Reliance on any form of shading is less important when windows with a low SHGC are used. Using low-solar-gain low-e glazing reduces energy costs significantly for all conditions, even with no shading. This is because the glazing controls solar radiation. However, shading provides summer comfort and glare control benefits, even with high performance glazing.
Increased west-facing window orientation or greater glazing area further increases the energy penalty of not using strategic shading or high performance windows.
Figure 39. Annual energy cost by shading type in Sacramento, California
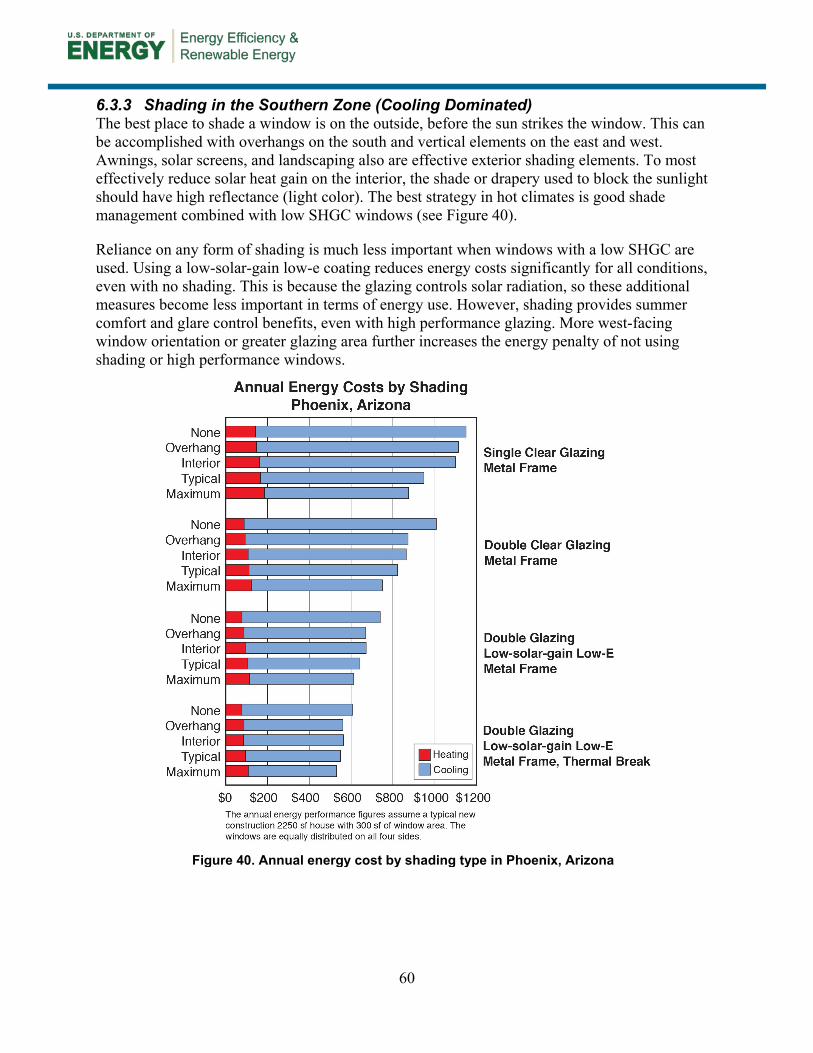
60
6.3.3 Shading in the Southern Zone (Cooling Dominated) The best place to shade a window is on the outside, before the sun strikes the window. This can be accomplished with overhangs on the south and vertical elements on the east and west. Awnings, solar screens, and landscaping also are effective exterior shading elements. To most effectively reduce solar heat gain on the interior, the shade or drapery used to block the sunlight should have high reflectance (light color). The best strategy in hot climates is good shade management combined with low SHGC windows (see Figure 40).
Reliance on any form of shading is much less important when windows with a low SHGC are used. Using a low-solar-gain low-e coating reduces energy costs significantly for all conditions, even with no shading. This is because the glazing controls solar radiation, so these additional measures become less important in terms of energy use. However, shading provides summer comfort and glare control benefits, even with high performance glazing. More west-facing window orientation or greater glazing area further increases the energy penalty of not using shading or high performance windows.
Figure 40. Annual energy cost by shading type in Phoenix, Arizona
61
7 Installation No matter how advanced the glazing and frame materials are in a window, the ultimate performance also depends on the quality of its installation. Improper installation can contribute to air leakage, unnecessary heat loss, condensation, and water leakage. This may lead to diminished energy performance as well as deterioration of walls, insulation, and the window unit.
A properly installed window must maintain barriers keeping air and water from penetrating the wall and it must restrict vapor flow. It must also reduce heat loss and condensation around the window unit. In addition, the installation must meet several structural and functional requirements. Building loads cannot rest on the window frame, the installation must allow for movement, the window must protect against forced entry, and yet it must maintain ease of operation.
7.1 General Installation Guidelines
• Always follow the manufacturer’s instructions.
• Meet all codes for energy efficiency, structure, proper egress, safety glass, and grade (design pressure).
• Size the rough opening properly to accommodate thermal expansion and movement.
• Install the window unit level, plumb, and square.
• Maintain the continuity of the weather-resistant barrier. In a barrier system, this is achieved with sealants on the outermost surface of the wall. In a membrane/drainage system, residual water must drain freely on the drainage plane. Use flashings overlapped shingle style and drip caps where needed. Avoid trapping water within the wall.
• Sill pan flashings are always recommended.
• Do not leave thermal bridges between the interior and exterior. Carefully insulate all voids left between window and wall, but use only foam insulation that expands at a minimum rate.
• Maintain the integrity of air and vapor retarders. The air barrier must be connected continuously from the wall assembly to the window; this is typically accomplished using low-expansion foam (as per above) or caulk with a backer rod. Note that fibrous insulation (e.g., fiberglass) is air permeable, and should not be used in this application.
Important Resources ASTM E 2112, “Standard Practice for Installation of Exterior Windows, Doors and Skylights.” www.astm.org/Standards/E2112.htm
Water Management Guide, by Joseph Lstiburek, is a guide that shows how to minimize water intrusion into home. This guide has many installation diagrams.
InstallationMasters includes a directory of certified installers in the United States. www.installationmastersusa.com
EPA brochure on lead-hazard for renovation, repair, and painting. www.epa.gov/lead/pubs/renovaterightbrochure.pdf
EPA website for lead in paint, dust, and soil. www.epa.gov/lead
62
• Avoid using incompatible materials such as certain metal combinations, or asphaltic caulks on chemically vulnerable substrates. Apply caulks and sealants that are compatible with the substrate.
• If applicable, follow the EPA’s lead-safe practices during renovation, repair, or painting projects.
There are important differences in the details of how a window is installed, depending on the type of construction (wood versus masonry) or exterior cladding material (wood siding, stucco, brick veneer). In addition, each operator type, frame material, and individual manufacturer may have its own recommended installation practices. It is important to refer to the appropriate manufacturer’s instructions and not to rely solely on general guidelines.
Given the importance of proper installation, there are some guidelines for installation. The American Architectural Manufacturers Association has developed an installer training and registration program called, Installation Masters (AAMA 2010) and ASTM has developed a window installation standard (ASTM 2007). The Water Management Guide (Lstiburek 2006) is another excellent resource.
7.2 Watertight Installation Although there are many wall materials and construction assemblies, there are three fundamental approaches to water control—storage or mass wall systems, the perfect barrier system, and the membrane/drainage system (Straube 2011). Determining which is used in the wall affects the window installation approach.
7.2.1 Storage or Mass Wall System This approach requires enough storage mass in the wall to absorb all rainwater not otherwise drained away. Then the moisture evaporates to the exterior before reaching the interior wall surface. Examples include rubble, brick, and masonry walls. Windows placed into a storage or mass wall with a surface barrier system rely on a sealant joint between the frame and the opening in the wall.
7.2.2 Perfect Barrier System A wall with a perfect barrier system relies on the outermost surface to be weather resistant. Some window frames, metal, and glass curtain wall systems are perfect barriers. Solid walls of masonry, concrete, or brick with no cavities are sometimes referred to as surface barrier systems but are imperfect. Windows placed into a wall with a surface barrier system rely on a sealant joint between the frame and opening in the wall. This type of system has only one line of defense against water intrusion. It this requires very careful installation. There is no provision for draining moisture that enters the wall. Sill pan flashings are recommended in all cases.
63
7.2.3 Drained Wall System A wall with a drainage system accepts small amounts of water that may penetrate the outermost wall surface. The system is designed to control and drain away any residual water that penetrates the wall. Typically a weather-resistant barrier such as house wrap or building paper is placed behind the exterior cladding material (wood siding, brick veneer, or stucco). This drainage plane must be overlapped shingle-style and open at the base so water drains to the exterior. In some cases this requires flashing and weep holes at the base of the wall. It is important to use caution when sealing a window unit to the exterior cladding of a membrane/drainage wall system so water within the drainage plane is not blocked and is allowed to escape. Sill pan flashings are recommended in all cases.
In membrane/drainage systems, a window with a mounting flange (nail fin) is typically used to attach the frame to the wall. Block frame windows with brick mold may also be used with a membrane/drainage system. The integrity of the drainage membrane must be preserved by the proper use of flashings and sealants in this type of installation. The placement of flashings must follow a careful sequence resulting in the overlapping of all materials in weather-board (shingle style) fashion. One common procedure recommends that the flashing beneath the sill is placed first, then the jamb flashings, then the window is installed with mounting fins over these flashings, and then the head flashing over the top window fin. Some variations and intricate procedures involve proper flashing, depending on the exact wall assembly and construction sequence.
7.3 Replacement Windows and Sashes Half of all windows sold are installed as replacements. Installing these windows presents a wide range of possible situations and potential problems. Following manufacturers’ instructions as well as guidelines and standards noted earlier in this section is essential. Replacement windows can be considered in three categories:
• Removal of and complete replacement of the original window
• Placement of a complete new window within the original window frame
• Replacement of the sash only, where the original frame remains in place, and only the glazing, operable sash, and jamb liners are new.
Window installation in a remodeling or renovation must address all the considerations discussed previously for new windows as well as greater concerns about maintaining drainage planes and air/vapor barriers. Insulation and air/water vapor barrier continuity should be maintained all around the window. Foam-in-place sealants can be used to fill irregular voids created between old and new components; however, as with new installations, it is important to use low-expansion foams so frames are not distorted. Remodeling is often an opportunity to check the interior condition of walls and increase insulation in the opened areas.
In a simpler approach, the old sash and other adjacent trim are removed, leaving the original frame in place. The new window is inserted into this framed opening, following prescribed installation procedures. Then, appropriate trim is installed on the interior and exterior. This provides many of the benefits of a complete window replacement, but at a lower cost. However, the net effect is typically to reduce the total glazing area, as a complete window assembly is
64
basically fitted into the old frame. Caution must be used to avoid diminishing the opening below egress code requirements.
Replacement sashes involve less expense and disruption for a household. They are custom sized and detailed to fit into original window frames. Only the glazing, operable sash, and jamb liners are new. This is a good approach for upgrading window energy performance when the original window frames are in good shape. At the same time the sash is replaced, new weather stripping that is most appropriate to the window type and frame details should be installed. Some of the benefits of energy-efficient glazing can be compromised if the new sash is not properly weather stripped. For a more in-depth discussion of the topic of rehabilitation of windows, see Baker and Eng (2012).
65
References AAMA. (2010) Installation Masters. www.installationmastersusa.com.
ACCA. (2011). Manual J Residential Load Calculation, 7th Edition. Arlington, VA: Air Conditioning Contractors of America. www.acca.org/store/category.php?cid=2.
ASHRAE. (2009). Handbook—Fundamentals. Atlanta, GA: American Society of Heating, Refrigerating and Air-Conditioning Engineers. www.ashrae.org/resources--publications/Table-of-Contents-2009-ASHRAE-Handbook-Fundamentals.
ASHRAE. (2010). Standard 55-2010: Thermal Environmental Conditions for Human Occupancy. Atlanta, GA: American Society of Heating, Refrigerating and Air-Conditioning Engineers. www.techstreet.com/cgi-bin/detail?doc_no=ashrae|55_2010;product_id=1741646.
ASTM. (2007). “E2112 – 07 Standard Practice for Installation of Exterior Windows, Doors and Skylights.” West Conshohocken, PA: ASTM. www.astm.org/Standards/E2112.htm.
Baker, P.; Eng, P. (2012). Measure Guideline: Window Repair, Rehabilitation, and Replacement. Prepared by Building Science Corporation. Golden, CO: National Renewable Energy Laboratory. NREL/SR-5500-55219. www.nrel.gov/docs/fy12osti/55219.pdf.
Carmody, J., Selkowitz, S., Arasteh, D., Heschong, L. Residential Windows: A Guide to New Technologies and Energy Performance, 3rd Edition. W.W. Norton, 2007.
Carmody, J., Selkowitz, S., Lee, E., Arasteh, D., Willmert, T. Window Systems for High-performance Commercial Buildings. W.W. Norton, 2004.
DOE. (2012). Status of State Energy Codes. Washington, D.C.: U.S. Department of Energy. www.energycodes.gov/states.
EIA. (2012a). “Electric Power Monthly.” www.eia.gov/electricity/sales_revenue_price/pdf/table4.pdf.
EIA. (2012b). “Natural Gas.” www.eia.gov/dnav/ng/ng_sum_lsum_dcu_nus_m.htm.
EPA. (2012a).“ENERGY STAR Program Requirements Product Specification for Residential Windows, Doors, and Skylights: Eligibility Criteria, Draft 1 Version 6.0.” Washington, D.C.: U.S. Environmental Protection Agency, July 2012. www.energystar.gov/ia/partners/ prod_development/revisions/downloads/windows_doors/Spec_Draft1_V6.pdf?9087-cb4d.
EPA. (2012b).“ENERGY STAR for Windows, Doors, and Skylights: Version 6.0 Draft 1 Criteria and Analysis Report.” Washington, D.C.: U.S. Environmental Protection Agency July 2012. www.energystar.gov/ia/partners/prod_development/ revisions/downloads/windows_doors/Draft6_V1_Criteria_Analysis_Report.pdf?e34a-4eb4.
EWC. (2012a). Efficient Windows Collaborative. Minneapolis, MN: Efficient Windows Collaborative. www.efficientwindows.org.
66
EWC. (2012b). Window Selection Tool. Minneapolis, MN: Efficient Windows Collaborative. www.efficientwindows.org/selection.cfm.
Huizenga, C.; Zhang, H.; Mattelaer, P.; Yu, T.; Arens, E. (2006). Window Performance for Human Thermal Comfort. Final Report to the National Fenestration Rating Council. Center for the Built Environment, University of California, Berkeley. www.cbe.berkeley.edu/research/pdf_files/SR_NFRC2006_FinalReport.pdf.
ICC. (2012). International Energy Conservation Code. Washington, D.C.: International Code Council. www.iccsafe.org/Store/Pages/2012I-Codes.aspx?r=2012icodes.
LBNL. (2012). RESFEN 5.0. Berkeley, CA: Lawrence Berkeley National Laboratory. windows.lbl.gov/software/resfen/resfen.html.
LBNL. (2008). 2008 Energy STAR Windows Revisions - Technical Analysis. windows.lbl.gov/EStar2008.
Lstiburek, Joseph, W. Water Management Guide. Building Science Press, Inc., 2006.
NFRC. (2005). The NFRC Label. Greenbelt, MD: National Fenestration Ratings Council. www.nfrc.org/label.aspx.
NFRC. (2012). The NFRC Certified Products Directory. Greenbelt, MD: National Fenestration Ratings Council. search.nfrc.org/search/searchDefault.aspx.
NREL. (2012a). BEopt. Golden, CO: National Renewable Energy Laboratory. beopt.nrel.gov/download.
NREL. (2012b). National Residential Efficiency Measures Database. Golden, CO: National Renewable Energy Laboratory. www.nrel.gov/ap/retrofits/index.cfm.
Proctor, J., Z. Katsnelson, and B. Wilson. “Bigger is Not Better: Sizing Air Conditioners Properly.” Article published in Home Energy Magazine, May/June 1995.
RECA. (2012). “IECC Compliance Guides.” reca-codes.org/iecc-compliance-guides.php.
Straube, J. BSD-013: Rain Control in Buildings, 2011. (www.buildingscience.com/ documents/digests/bsd-013-rain-control-in-buildings?topic=doctypes/digests). Straube, J. BSD-030: Rain Control Theory, 2010. www.buildingscience.com/ documents/digests/bsd030-rain-control-theory?topic=doctypes/digests. Windows for High-Performance Commercial Buildings. (2012). www.commercialwindows.org.
DOE/GO-102012-3656 ▪ November 2012
Printed with a renewable-source ink on paper containing at least 50% wastepaper, including 10% post-consumer waste.