Embed Size (px)
Citation preview
Energy, Environment and Society (5.92) Student Project Results Disclaimer The following document was created by undergraduate students at the Massachusetts Institute of Technology as part of a Spring 2007 class “Energy, Environment and Society”. The report, which includes data that were collected and analyzed by students as part of an intensive educational experience, is not intended to be comprehensive or conclusive. All data and analyses should confirmed prior to use in the implementation of any energy installation. No licensed engineers or architects participated in the creation of this analysis. The following information has been copyrighted; it may additionally contain third party copyrighted material. Please contact Beth Conlin at the LFEE Education Program with any requests regarding distribution and/or duplication. Ms. Conlin can be reached at 617-452-3199 or [email protected].


Wind Study: Feasibility Study and Recommendations for Implementing
Wind Power on MIT’s Campus
5.92 Energy, Environment, and Society
May 16, 2007
Richard Bates, Samantha Fox, Katherine McCusker, Kathryn Pesce
and T.A. Dan Wesolowski
Bates, Fox, McCusker, Pesce 1
Table of Contents
Executive Summary........................................................................................................................ 3
Introduction..................................................................................................................................... 4
Background on Wind Power and Small Scale Wind .................................................................. 5
Methodology................................................................................................................................. 11
Interviews.................................................................................................................................. 11
Turbine Selection...................................................................................................................... 12
Measurement............................................................................................................................. 15
Site Selection and Set-up ...................................................................................................... 15
Statistical Descriptive Analysis ............................................................................................ 16
Correlation and Prediction ........................................................................................................ 17
Power Analysis ......................................................................................................................... 18
Technical Feasibility..................................................................................................................... 19
Data Summary and Analysis..................................................................................................... 19
Wind Speed........................................................................................................................... 19
Wind Direction...................................................................................................................... 22
Economic Feasibility .................................................................................................................... 25
Assumptions.............................................................................................................................. 25
Power and Electricity Generation ............................................................................................. 26
Social Feasibility........................................................................................................................... 33
Influence on Avian Life ............................................................................................................ 33
Aesthetics.................................................................................................................................. 33
Added social benefits................................................................................................................ 36
Greenhouse gases...................................................................................................................... 36
Recommendations......................................................................................................................... 38
Conclusion .................................................................................................................................... 39
References..................................................................................................................................... 41
Appendix A..................................................................................................................................... 1
Site Setup .................................................................................................................................... 1
Appendix B ..................................................................................................................................... 1

Bates, Fox, McCusker, Pesce 2
Methodology Specifics ............................................................................................................... 1
Power and Wind Direction...................................................................................................... 1
Appendix C ..................................................................................................................................... 1
Error Analysis ............................................................................................................................. 1
Predicted Wind Speed Distribution Error ............................................................................... 1
Predicted Power Error- ........................................................................................................... 2
Appendix D..................................................................................................................................... 1
Power, Generation, and Payback Tables..................................................................................... 1
Skystream Summary Data....................................................................................................... 1
AeroVironment Summary Data .............................................................................................. 2
Appendix E ..................................................................................................................................... 1
Rebates........................................................................................................................................ 1
MTC Small Scale Renewable Initiative.................................................................................. 1
Bates, Fox, McCusker, Pesce 3
Executive Summary The purpose of this project was to assess the viability of small scale wind power as a
means for Massachusetts Institute of Technology (MIT) to economically reduce its usage of
dirty, non-renewable energy. We find that, although most of campus is a sub par resource, some
wind sites offer the potential to produce electricity at half of the current utility cost. The results
of this study concluded that if a Skystream 3.7 turbine were placed on top of Eastgate Graduate
Housing it could supply electricity for as low as $0.08 per kWh and would have a payback
period within its lifetime. Carbon offsets at all sites however are unsurprisingly small compared
to MIT’s enormous carbon emissions, per year they would offset approximately 10 seconds
worth of MIT carbon emissions. Additionally, we find overwhelming support from the MIT
undergraduate community in support of on-campus wind power and carbon emission reductions.
One of the greatest concerns with this project was its ability to be accepted by the MIT
campus as a whole. Would people be willing to see wind turbines on top of buildings? With the
creation of a campus survey, the team was able to ascertain that not only would people be willing
to see wind turbines, but they also would like to see MIT lower its greenhouse gas emissions. We
created a personal opinion survey and sent it to both graduate and undergraduate dorms. We had
responses from over 200 students. Also, this study has had a tremendous amount of support from
MIT faculty and facilities, so there will be few problems with that aspect of implementation.
Overall, since MIT’s goal is to reduce emissions in a cost effective way, we recommend
on-campus wind power as a viable option. Its implementation sets precedent for MIT, helps
publicize successful implementation of renewable technologies, and provides educational
opportunities for future students.

Bates, Fox, McCusker, Pesce 4
Introduction Recently Susan Hockfield, President of MIT, declared that the university would be
pursuing a “walk the talk” stance in reference to the energy crisis and carbon emissions. The
reasoning being that MIT shouldn’t only research and recommend solutions to climate change; it
should itself be involved in carrying those solutions out. Since the President’s announcement, the
Institute has created classes, like 5.92 “Energy, Environment, and Society”, to investigate
alternative sources of energy for the MIT campus, ramped up publicity about climate change and
possible solutions, and intensified research efforts in relevant areas.
First and foremost, where exactly does MIT get its electricity? MIT receives its energy
from two places. A large portion is produced by the 20MW cogeneration plant, while a smaller
portion by the utility company NSTAR. The cogeneration plant burns natural gas and oil to
generate both heat and power at extremely high efficiencies. NSTAR is a retail power
distribution company, and it receives its power from coal (10%), natural gas (25%), residual oil
(19%) and the remainder from hydropower nuclear and solar.1
The next consideration is how to reduce this consumption of carbon intensive electricity.
Obviously efficiency upgrades and conservation efforts are of the utmost importance. It cannot
be stressed enough how far simple efficiency or awareness improvements can go. One can easily
understand how conservation of one kWh (turning off ten 100 watt light bulbs for an hour) is not
only free (in fact its profitable) and 100% efficient, but requires much less economic and
environmental costs than attempting to produce one kWh by means of combustion of natural gas
(a process that is at best 30% efficient). However, once these behavioral and efficiency
modifications have reached their maximum benefit, what is the next step?
1 Power MIT.

Bates, Fox, McCusker, Pesce 5
The implementation of wind turbines on campus buildings is one such novel method of
clean energy generation which may be the next step. Consequently, this report hopes to
determine and quantify the effectiveness of “clean” wind energy on the MIT campus in an
unbiased manner. Using a cost benefit analysis approach, the report will maintain an
overarching philosophy that these turbines must make economic sense and have a payback time
within their lifetime. In other words, the turbines must not simply be purchased as fancy- but
ineffective- gadgetry. Both MIT’s budget and reputation would be damaged if this kind of
assessment is side-stepped. In addition to the cost benefit analysis, this report will also discuss
non-economic, educational, social, and environmental benefits of installing such a system. All
this will be performed in the hopes of reinforcing MIT’s new “Walk the Talk” campaign.
Background on Wind Power and Small Scale Wind
There are large-scale wind farms being built all over the US and even close to MIT. The
first large scale wind project in the Massachusetts area is Hull. This was also the first
commercial wind turbine on the eastern seaboard.2 This groundbreaking project consists mainly
of Hull 1, a 660kW turbine, and Hull 2, a larger 1.8MW turbine. Dubbed Hull “two and a half” a
small, 2.4kW Skystream 3.7 which can turn 360°, has recently been installed as well.3
The origins and development of such a revolutionary turbine go back several years. In
2005 National Renewable Energy Lab, Department of Energy, along with Southwest Wind
Power put together a project with a goal “to reduce the lifecycle cost of energy to 10-
15cents/kilowatt-hour in Class 3 wind resources by 2007”.4 Through this project the Storm
turbine was designed with aesthetics, sound, and price in mind. Designed to be as unobtrusive
2 Manwell, 635. 3 Hull. 4 D. Calley et al, 3.
Bates, Fox, McCusker, Pesce 6
and more economically feasible for the average home, Storm was not the final small-scale wind
turbine to be developed by Southwest. Southwest continued to develop the small-scale turbine,
improving upon it in every respect: aesthetics, sound, cost. By testing various blade designs, they
tried to balance the aesthetics and noise issues while still producing an affordable machine that
can generate power in low wind speeds.5 Eventually, they attained their goal with the production
of the Skystream 3.7.
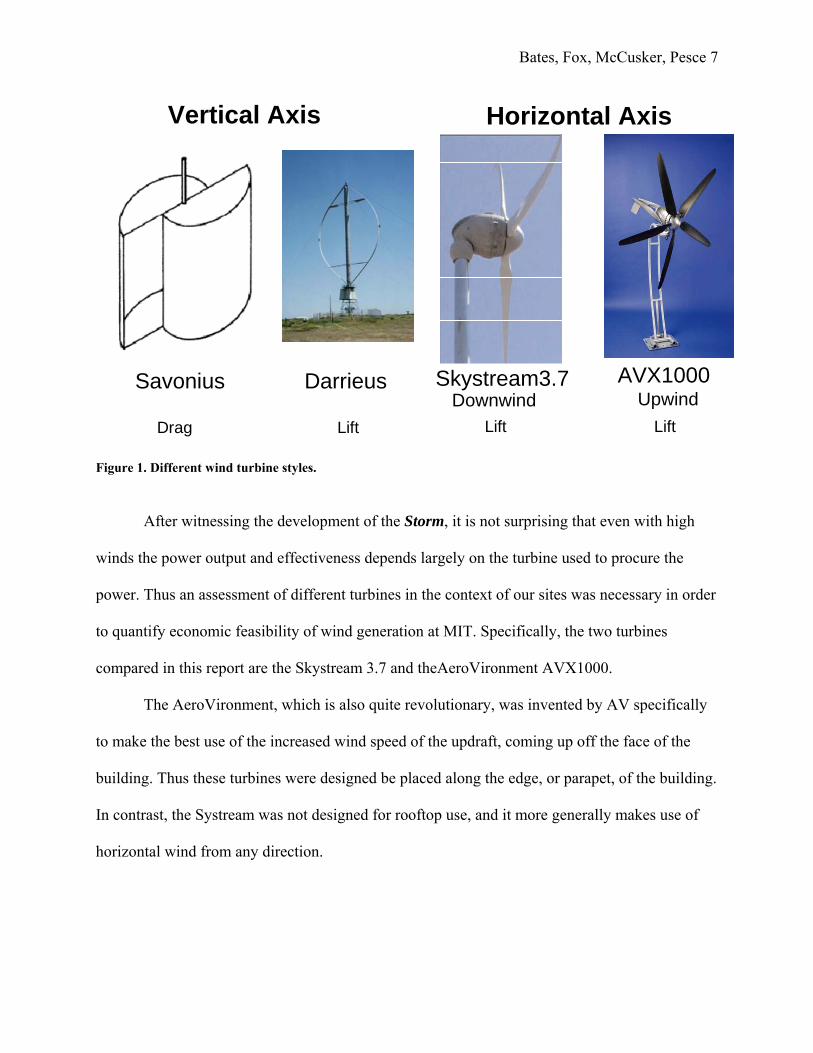
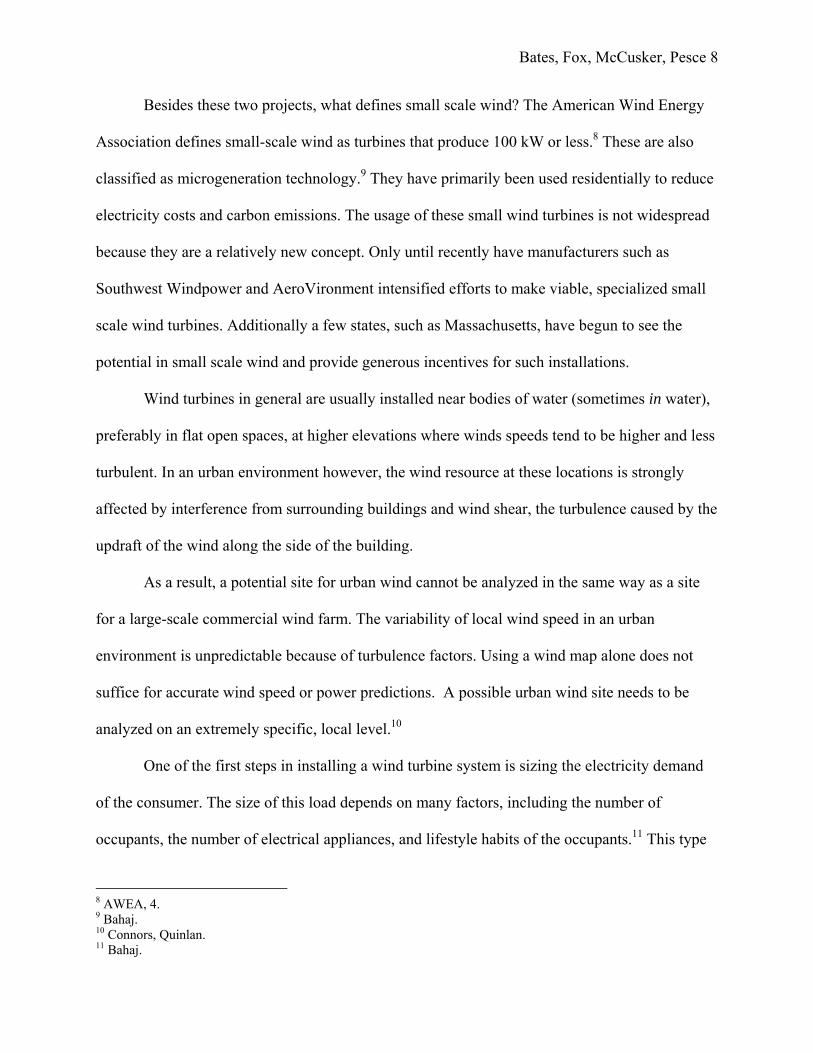
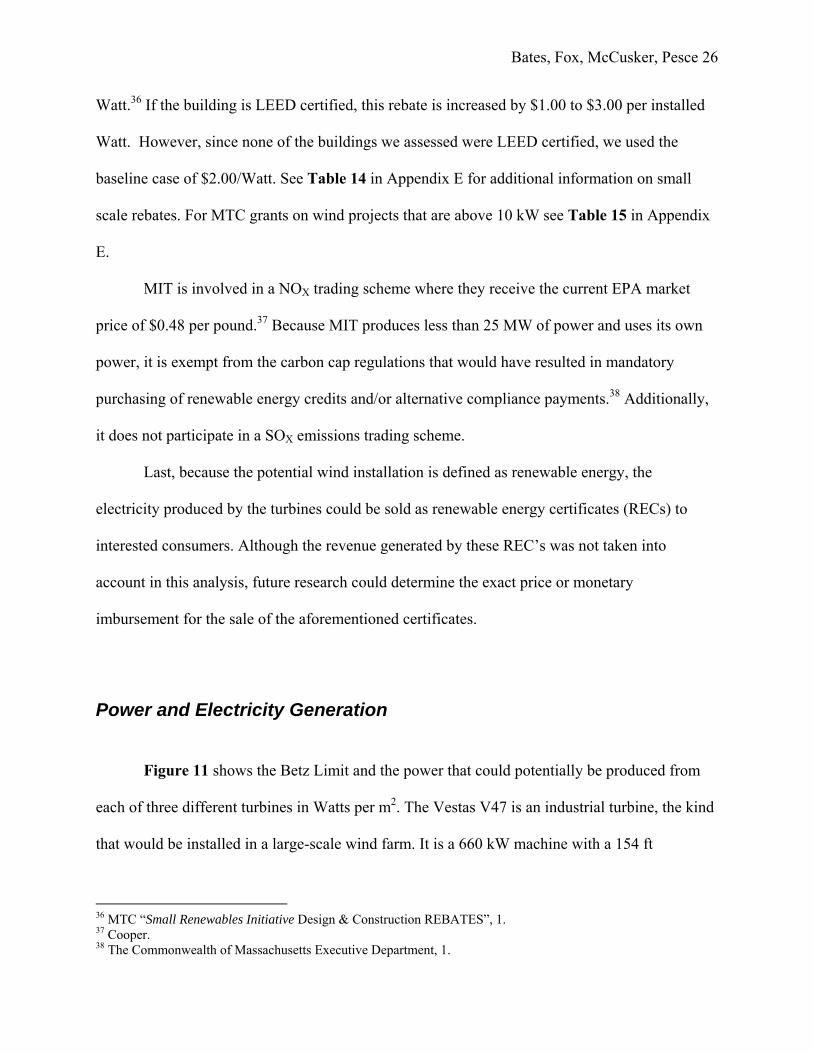
There are many different types of turbine styles to consider. Figure 1 below shows
examples of each variation. The axis of rotation is one aspect which varies. Some, such as the
Savonius and Darrieus rotate around a vertical axis, while the Skystream 3.7 and the AVX100
rotate around a horizontal axis.
Horizontal axis turbines can also be upwind or downwind machines. Upwind machines
are actively, meaning motor-controlled, or passively, meaning the blade design facilitates
without a motor, rotated to face the direction the wind is coming from. Downwind are actively or
passively rotated in the direction towards which the wind is blowing.6
Another major distinction in turbine styles are lift and drag type turbines. Lift type use an
airfoil, just like airplane wings, to create lift to turn the blades and generate power. Drag type
turbines can generate power in lower wind speeds than lift type, and they can generate power
with wind from any direction, but their theoretical efficiency is much lower than that of lift type
turbines.7
5 Calley, 3. 6 Danish Wind Energy Association. 7 Danish Wind Energy Association.
Bates, Fox, McCusker, Pesce 7
Vertical Axis Horizontal Axis
Savonius
Drag
Darrieus
Lift
Skystream3.7
LiftDownwind
AVX1000Upwind
Lift
Figure 1. Different wind turbine styles.
After witnessing the development of the Storm, it is not surprising that even with high
winds the power output and effectiveness depends largely on the turbine used to procure the
power. Thus an assessment of different turbines in the context of our sites was necessary in order
to quantify economic feasibility of wind generation at MIT. Specifically, the two turbines
compared in this report are the Skystream 3.7 and theAeroVironment AVX1000.
The AeroVironment, which is also quite revolutionary, was invented by AV specifically
to make the best use of the increased wind speed of the updraft, coming up off the face of the
building. Thus these turbines were designed be placed along the edge, or parapet, of the building.
In contrast, the Systream was not designed for rooftop use, and it more generally makes use of
horizontal wind from any direction.
Bates, Fox, McCusker, Pesce 8
Besides these two projects, what defines small scale wind? The American Wind Energy
Association defines small-scale wind as turbines that produce 100 kW or less.8 These are also
classified as microgeneration technology.9 They have primarily been used residentially to reduce
electricity costs and carbon emissions. The usage of these small wind turbines is not widespread
because they are a relatively new concept. Only until recently have manufacturers such as
Southwest Windpower and AeroVironment intensified efforts to make viable, specialized small
scale wind turbines. Additionally a few states, such as Massachusetts, have begun to see the
potential in small scale wind and provide generous incentives for such installations.
Wind turbines in general are usually installed near bodies of water (sometimes in water),
preferably in flat open spaces, at higher elevations where winds speeds tend to be higher and less
turbulent. In an urban environment however, the wind resource at these locations is strongly
affected by interference from surrounding buildings and wind shear, the turbulence caused by the
updraft of the wind along the side of the building.
As a result, a potential site for urban wind cannot be analyzed in the same way as a site
for a large-scale commercial wind farm. The variability of local wind speed in an urban
environment is unpredictable because of turbulence factors. Using a wind map alone does not
suffice for accurate wind speed or power predictions. A possible urban wind site needs to be
analyzed on an extremely specific, local level.10
One of the first steps in installing a wind turbine system is sizing the electricity demand
of the consumer. The size of this load depends on many factors, including the number of
occupants, the number of electrical appliances, and lifestyle habits of the occupants.11 This type
8 AWEA, 4. 9 Bahaj. 10 Connors, Quinlan. 11 Bahaj.
Bates, Fox, McCusker, Pesce 9
of analysis was not required because the electricity demand of MIT is so large (approximately
175,000 MWH annually12) relative to the power that could potentially be produced on campus by
a 6 kW turbine system, that the wind system would only replace a small percentage of the
electricity that MIT buys from NSTAR.
Additionally, wind speeds (and power production) peak in winter which matches the
energy profile of many places whose energy demand increases in winter due to heating.13
Furthermore, Connors indicates in his paper, “Offshore Wind Power in the Northeast: Estimating
Emissions Reductions”, that the peak power generation of wind turbine coincides with the winter
induced switch to the dirtiest of the fossil fuels, coal.14 In such respects, wind power has great
advantages.
Although there is an abundance of information on wind power in general, there has been
little conclusive research done on the effectiveness and feasibility of wind turbines in an urban
environment. Encraft, a renewable energy consulting firm in the United Kingdom, is conducting
the Warwickshire Wind Trial of domestic roof-mounted wind turbines. Twenty turbines will be
mounted with wind speed anemometers and energy production export meters. The findings from
this study will help Encraft's clients select the appropriate turbine model.15
Consumers who are looking into installing a turbine face a lack of standardized, credible
wind data. However, there is a wind resource rating system. Although it is technically incorrect
to predict the wind resource of a site solely on the average wind speed16, wind class is often used
in the industry to predict the economic feasibility of a site. The Army Corps of Engineers follows
12 Power MIT. 13 Bahaj. 14 Connors. 15 Sampson.16 This occurs because “most of the wind energy is available at wind speeds which are twice the most common wind speed at the site”. Specifically, it is fallacious to simply plug the average wind speed into a power function to determine average power. (Source) http://www.windpower.org/en/tour/wres/pwr.htm
Bates, Fox, McCusker, Pesce 10
particular criteria for citing wind farms. For onshore privately funded wind farms to be
economically feasible, wind class should be class 4 or better. For offshore sites, this
classification must be class 5 or better because of higher transmission costs.17 The Hull wind
turbines installed on land in Hull, MA are in a class 3 wind resource18, and Cape Wind, the
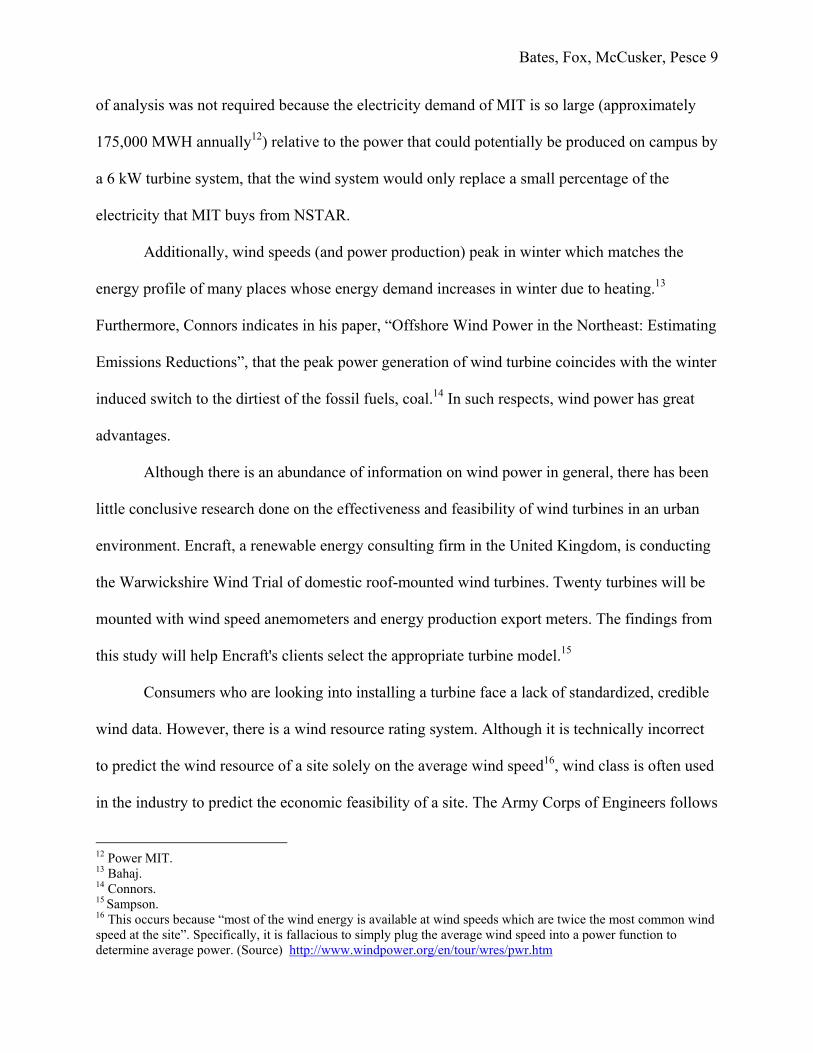
proposed wind farm offshore of Cape Cod, MA, is in a class 5 wind resource19. Figure 2 below
shows the wind power classification for different regions in Massachusetts.20 The key in the
lower left corner gives the wind power classes and the corresponding wind speeds and densities.
Interestingly, our report shows how small scale has the potential to be economical in wind
classes as low as 2. Rather than look down upon small scale wind for its seemingly low annual
kWh’s, we believe that the relative efficiency and ability to be economical at relatively low wind
speeds is impressive.
17 ESS Group, Inc. 18 Hull. 19 USDOE Massachusetts Wind Resource Map. 20 USDOE Massachusetts Wind Resource Map.

Bates, Fox, McCusker, Pesce 11
Figure 2. Massachusetts Wind Power Classification at 50m.
There are big plans for small-wind's future. A twenty year roadmap was drawn up in
2002 by a collection of small-wind turbine companies outlining their market potential, barriers,
action plan, and strategy. By 2020, they estimate that small-wind turbines could generate 3% of
America's energy demand.21
Methodology
Interviews At the beginning of the project, names of several contacts, ranging from professors to
wind experts, were given as possible sources of information. The first goal was to meet with as
21AWEA, 4.
Bates, Fox, McCusker, Pesce 12
many experts as possible to learn how to perform the research using robust, proven, and efficient
methods.
Patrick Quinlan, an expert on wind power, was among the first interviews. His expertise
and position as Director of Wind Systems at Second Wind helped provide invaluable knowledge
with regards to wind assessment and data collection techniques. Additionally, Heidi Nepf from
MIT’s Environmental Engineering department provided ideas about campus airflow around
buildings. Last, Stephen Connors from MIT’s Lab for Energy and Environment contributed
greatly to the development of our methodology.
A trip to Hull, a town off the coast of Massachusetts, was arranged later in the semester
to gain further understanding about larger scale wind turbines and the public opinions that go
along with such projects. Also, AeroVironment’s Director of Global and Strategic sales, Jeff
Wright, was able to provide information regarding the AVX1000 and AV’s wind site feasibility
methods.
Turbine Selection There were a few options for turbines to analyze, both vertical and horizontal axes, lift
and drag style, as well as a range of efficiencies and different performances in different wind
speeds. Two turbines were analyzed and used as references when setting up our data collection
equipment.
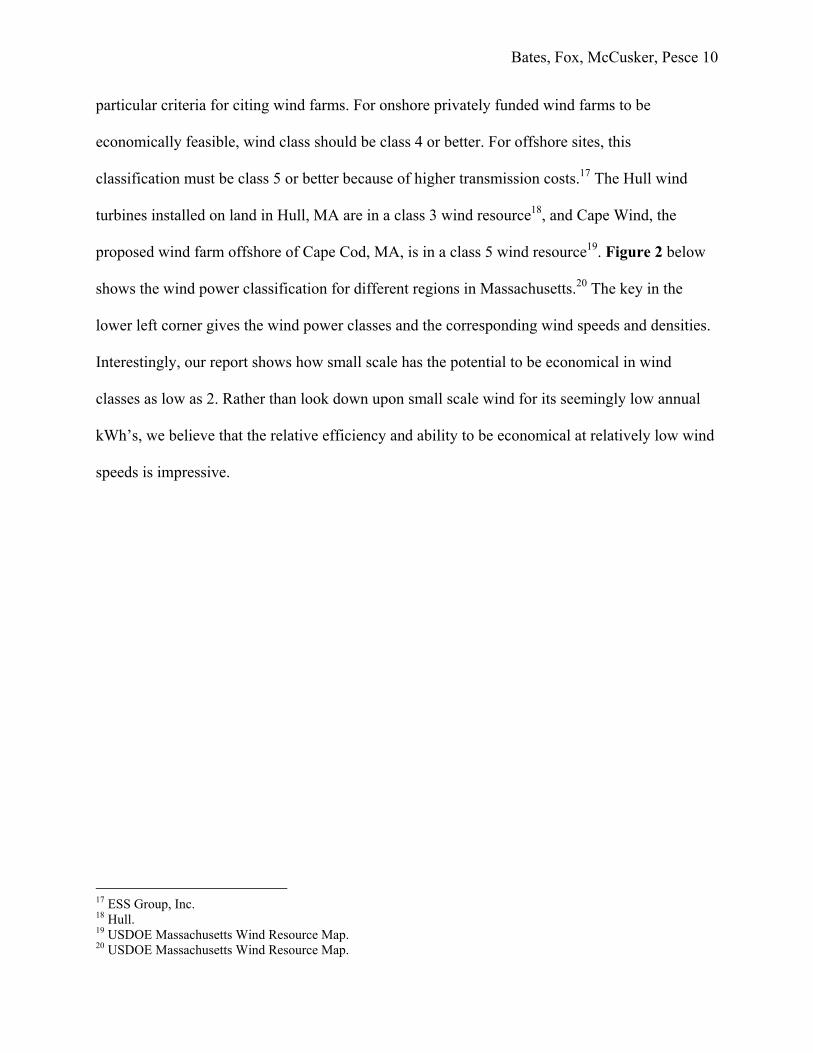
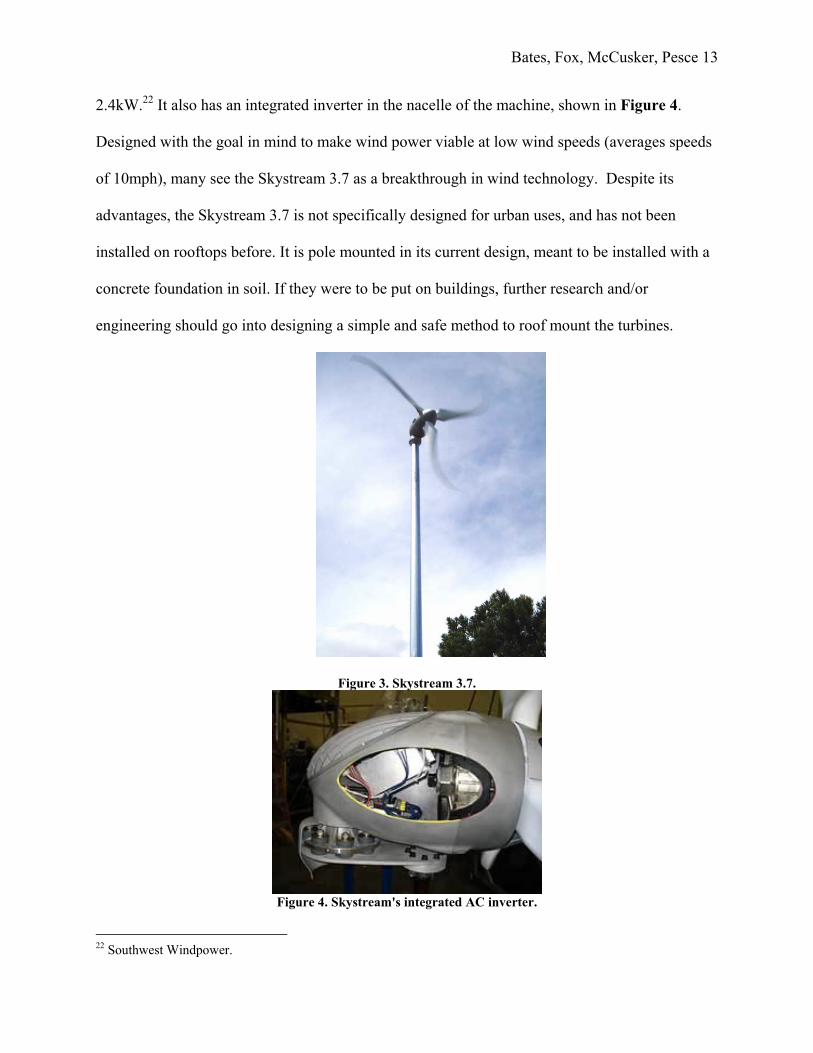
Southwest Windpower’s Skystream 3.7, shown in Figure 3, was one of the turbines
chosen. Its integrated design, 360° wind-tracking capability, successful use at Hull, MA, and
efficiency make it a good fit for the resource available on top of MIT’s roofs. It has a 12ft
diameter and is a downwind, horizontal-axis, lift type turbine that produces a maximum of
Bates, Fox, McCusker, Pesce 13
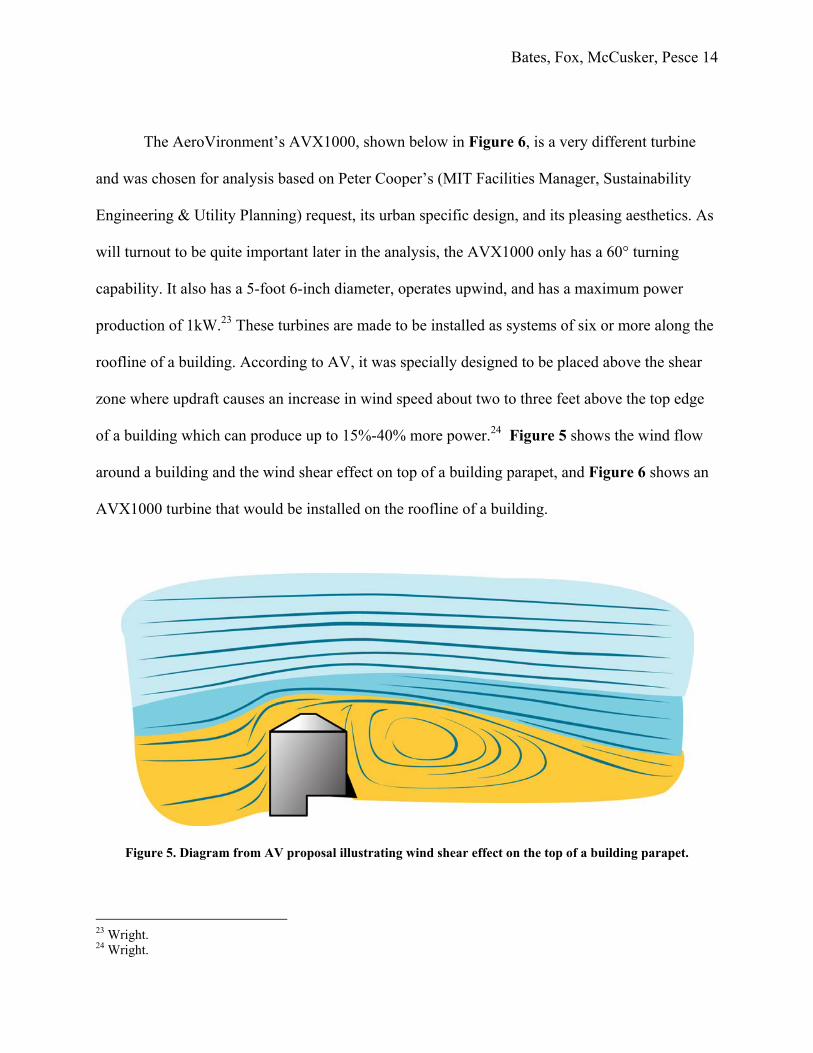
2.4kW.22 It also has an integrated inverter in the nacelle of the machine, shown in Figure 4.
Designed with the goal in mind to make wind power viable at low wind speeds (averages speeds
of 10mph), many see the Skystream 3.7 as a breakthrough in wind technology. Despite its
advantages, the Skystream 3.7 is not specifically designed for urban uses, and has not been
installed on rooftops before. It is pole mounted in its current design, meant to be installed with a
concrete foundation in soil. If they were to be put on buildings, further research and/or
engineering should go into designing a simple and safe method to roof mount the turbines.
Figure 3. Skystream 3.7.
Figure 4. Skystream's integrated AC inverter.
22 Southwest Windpower.
Bates, Fox, McCusker, Pesce 14
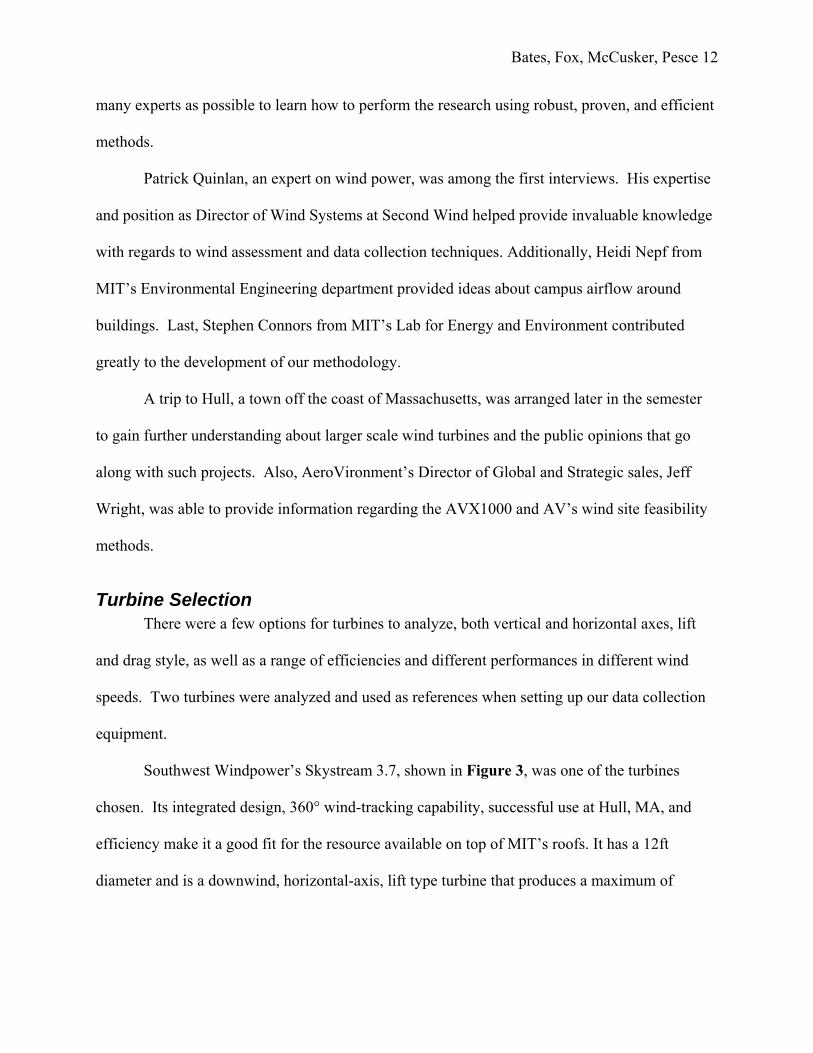
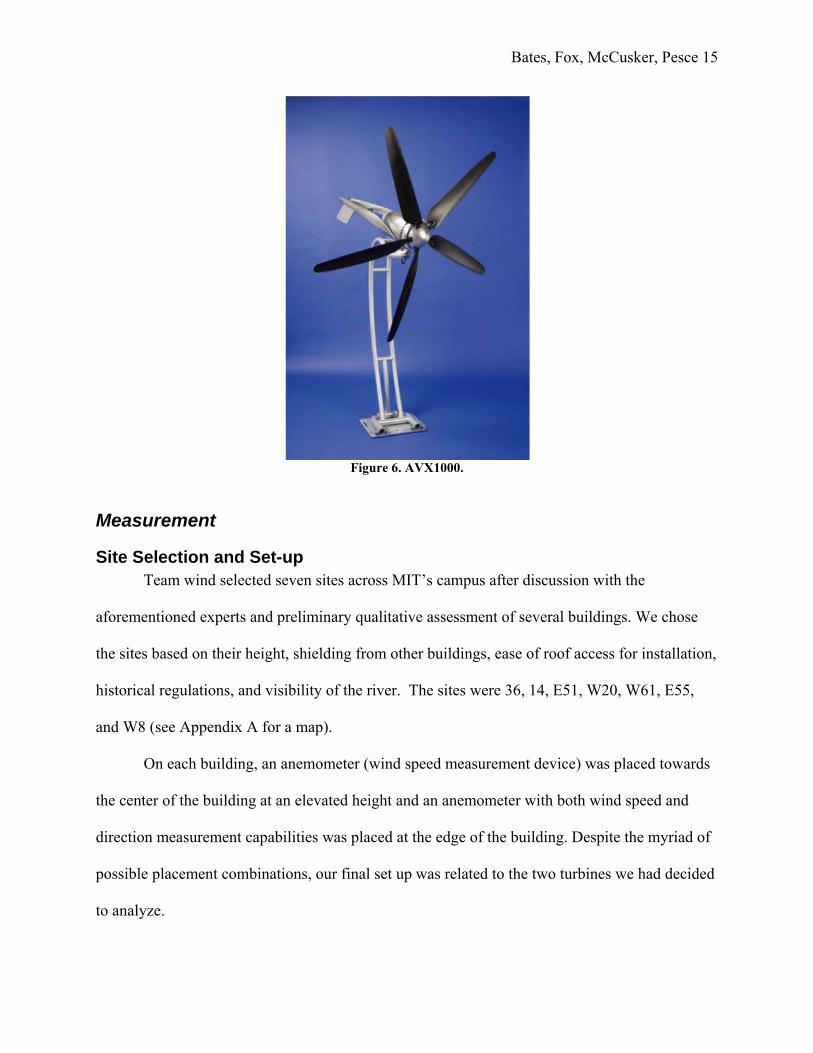
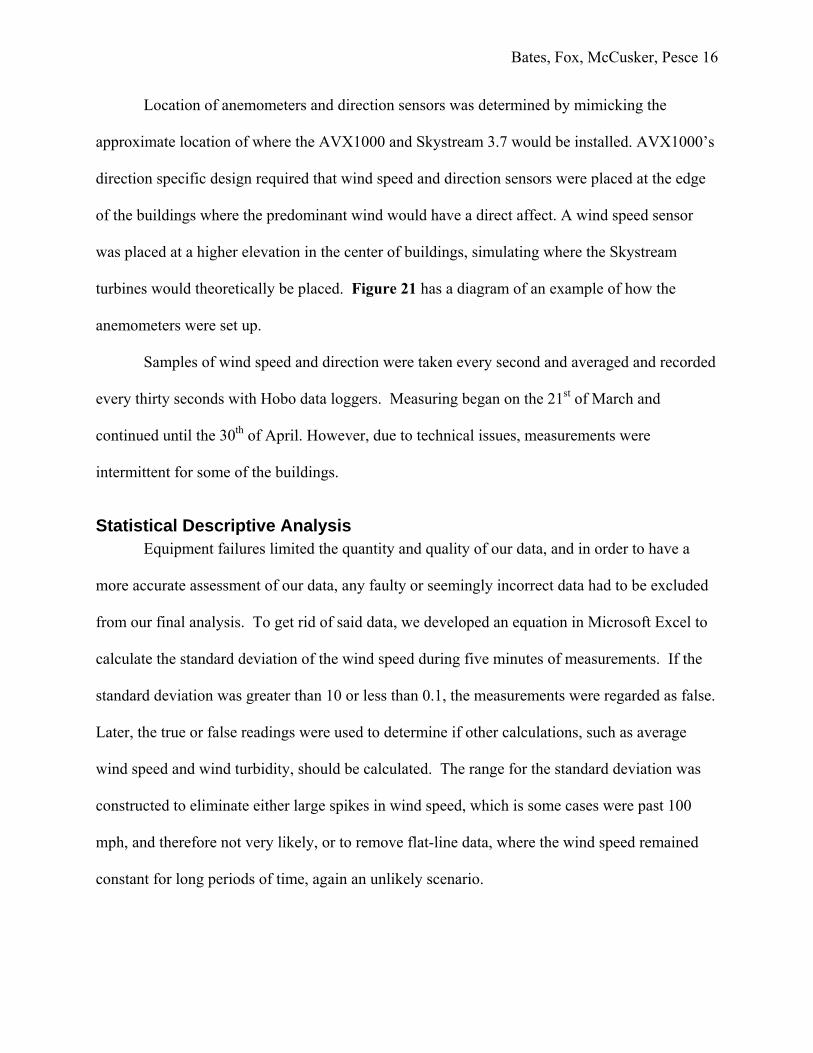
The AeroVironment’s AVX1000, shown below in Figure 6, is a very different turbine
and was chosen for analysis based on Peter Cooper’s (MIT Facilities Manager, Sustainability
Engineering & Utility Planning) request, its urban specific design, and its pleasing aesthetics. As
will turnout to be quite important later in the analysis, the AVX1000 only has a 60° turning
capability. It also has a 5-foot 6-inch diameter, operates upwind, and has a maximum power
production of 1kW.23 These turbines are made to be installed as systems of six or more along the
roofline of a building. According to AV, it was specially designed to be placed above the shear
zone where updraft causes an increase in wind speed about two to three feet above the top edge
of a building which can produce up to 15%-40% more power.24 Figure 5 shows the wind flow
around a building and the wind shear effect on top of a building parapet, and Figure 6 shows an
AVX1000 turbine that would be installed on the roofline of a building.
Figure 5. Diagram from AV proposal illustrating wind shear effect on the top of a building parapet.
23 Wright. 24 Wright.
Bates, Fox, McCusker, Pesce 15
Figure 6. AVX1000.
Measurement
Site Selection and Set-up Team wind selected seven sites across MIT’s campus after discussion with the
aforementioned experts and preliminary qualitative assessment of several buildings. We chose
the sites based on their height, shielding from other buildings, ease of roof access for installation,
historical regulations, and visibility of the river. The sites were 36, 14, E51, W20, W61, E55,
and W8 (see Appendix A for a map).
On each building, an anemometer (wind speed measurement device) was placed towards
the center of the building at an elevated height and an anemometer with both wind speed and
direction measurement capabilities was placed at the edge of the building. Despite the myriad of
possible placement combinations, our final set up was related to the two turbines we had decided
to analyze.
Bates, Fox, McCusker, Pesce 16
Location of anemometers and direction sensors was determined by mimicking the
approximate location of where the AVX1000 and Skystream 3.7 would be installed. AVX1000’s
direction specific design required that wind speed and direction sensors were placed at the edge
of the buildings where the predominant wind would have a direct affect. A wind speed sensor
was placed at a higher elevation in the center of buildings, simulating where the Skystream
turbines would theoretically be placed. Figure 21 has a diagram of an example of how the
anemometers were set up.
Samples of wind speed and direction were taken every second and averaged and recorded
every thirty seconds with Hobo data loggers. Measuring began on the 21st of March and
continued until the 30th of April. However, due to technical issues, measurements were
intermittent for some of the buildings.
Statistical Descriptive Analysis Equipment failures limited the quantity and quality of our data, and in order to have a
more accurate assessment of our data, any faulty or seemingly incorrect data had to be excluded
from our final analysis. To get rid of said data, we developed an equation in Microsoft Excel to
calculate the standard deviation of the wind speed during five minutes of measurements. If the
standard deviation was greater than 10 or less than 0.1, the measurements were regarded as false.
Later, the true or false readings were used to determine if other calculations, such as average
wind speed and wind turbidity, should be calculated. The range for the standard deviation was
constructed to eliminate either large spikes in wind speed, which is some cases were past 100
mph, and therefore not very likely, or to remove flat-line data, where the wind speed remained
constant for long periods of time, again an unlikely scenario.
Bates, Fox, McCusker, Pesce 17
Correlation and Prediction Recommendation by Stephen Connors led us to use a widely known and robust
correlation method set forth by University of Massachusetts wind energy researcher, Dr. Jim
Manwell.25 The method allows months of data to be correlated with years of data by a
comparison to a similar site with data recorded for the year one would like to predict. Beverly
Municipal Airport, located about twenty miles northeast of Boston, MA, is a location with about
thirty years worth of historical weather data and is a decent match for our purposes of
correlation. Its similar geographic location (distance from the coast) and its availability of
hourly observational data made it acceptable. A map showing where Cambridge and Beverly are
located in relation to each other and the coast is available Appendix A. Logan International
Airport was considered but disregarded for its unique placement on a peninsula. A closer
location such as the Green Building would have been optimal both in data resolution and
relevance; however, acquisition of this data proved to be difficult. We suggest that future
analysis use the Green Building data for even more accurate results if the data is available.
The first step in the measure-correlate-predict (MCP) method was to calculate the
standard deviation and average wind speeds for the Beverly data and at our own sites during the
measurement period. Equation 1 below is the correlation equation used in the Hull Wind II case
study where he proved it to be a very accurate method.26
Equation 1. Correlation.
ŷ = (µy - (σy / σx) µx) + (σy / σx) x
ŷ is the wind speed that is predicted, x is the wind speed at the airport at the historical
time, and σ and µ are the standard deviation and average wind speed, respectively, for the airport
25 Rogers. 26 Manwell.
Bates, Fox, McCusker, Pesce 18
and campus building for the measured time period. Using this equation, we could predict what
the wind speed at any of our sites would have been at any time in the past 15-30 years.
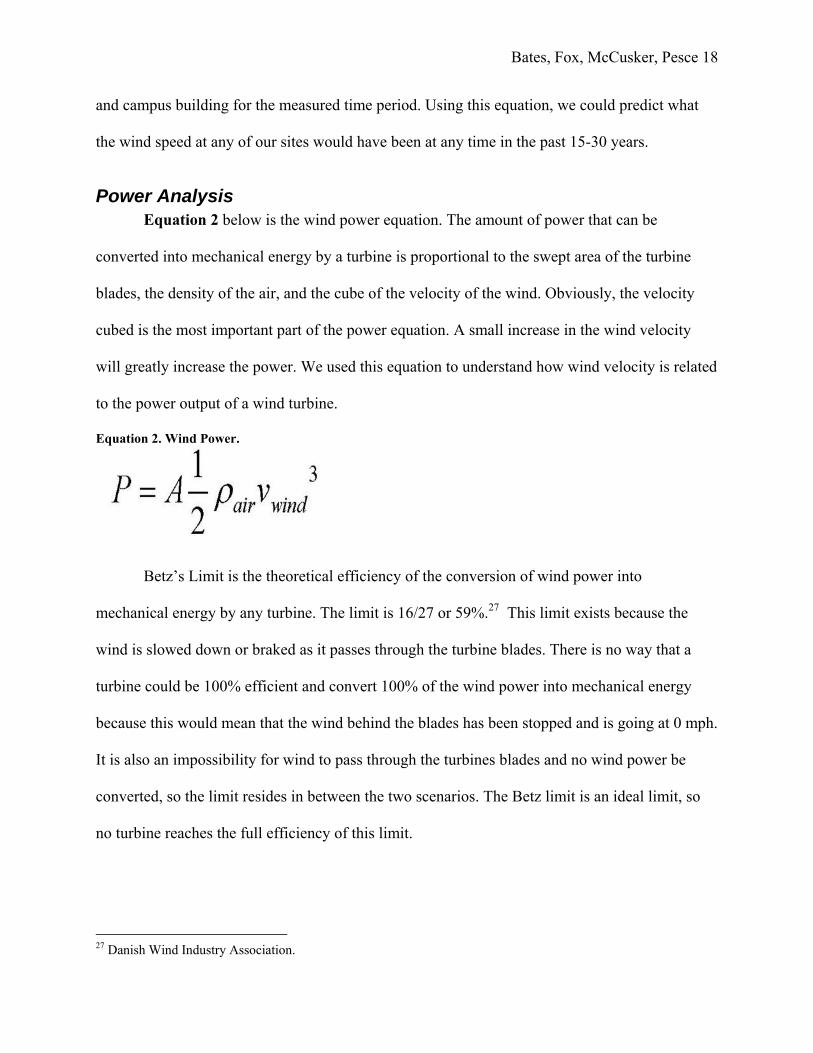
Power Analysis Equation 2 below is the wind power equation. The amount of power that can be
converted into mechanical energy by a turbine is proportional to the swept area of the turbine
blades, the density of the air, and the cube of the velocity of the wind. Obviously, the velocity
cubed is the most important part of the power equation. A small increase in the wind velocity
will greatly increase the power. We used this equation to understand how wind velocity is related
to the power output of a wind turbine.
Equation 2. Wind Power.
Betz’s Limit is the theoretical efficiency of the conversion of wind power into
mechanical energy by any turbine. The limit is 16/27 or 59%.27 This limit exists because the
wind is slowed down or braked as it passes through the turbine blades. There is no way that a
turbine could be 100% efficient and convert 100% of the wind power into mechanical energy
because this would mean that the wind behind the blades has been stopped and is going at 0 mph.
It is also an impossibility for wind to pass through the turbines blades and no wind power be
converted, so the limit resides in between the two scenarios. The Betz limit is an ideal limit, so
no turbine reaches the full efficiency of this limit.
27 Danish Wind Industry Association.
Bates, Fox, McCusker, Pesce 19
Technical Feasibility
Data Summary and Analysis
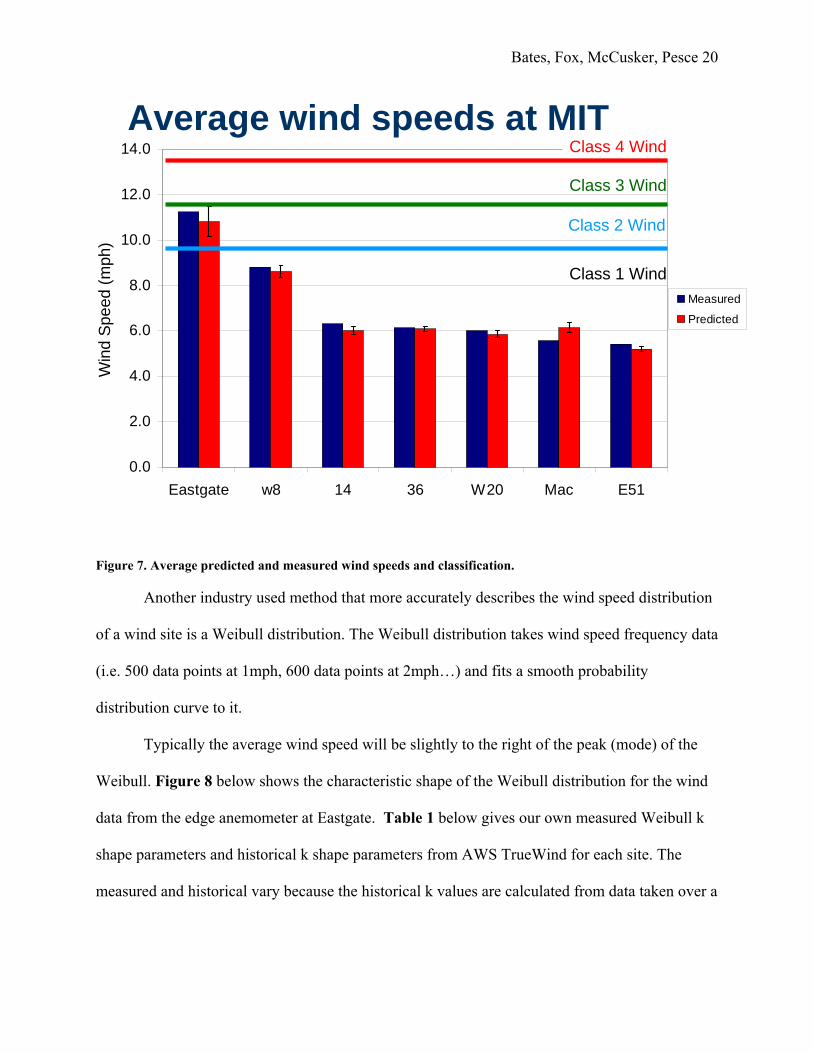
Wind Speed One simple and easy to compare wind statistic is the mean (average) wind speed. Our
analysis of the wind resource shows that most of our sites, except for Eastgate, qualify as Class I
wind sites, meaning that their average wind speeds are less than 9.8 mph. Eastgate is a class II
wind resource because its average wind speed is between 11.5 and 9.8 mph. Figure 7 below is a
graph of the average wind speeds at each site. These blue averages were measured by our
anemometers that were place at the edge of each roof. The red averages are the predicted average
wind speeds that we calculated when we correlated our own data with the historical data from
Beverly. The confidence interval28 on each of these has an error bar ranging from ±2% to ±6% of
the predicted wind speed.
28 The error bars indicate means that we are 95% sure that the average wind speed lies between the error bars.
Bates, Fox, McCusker, Pesce 20
0.0
2.0
4.0
6.0
8.0
10.0
12.0
14.0
Eastgate w8 14 36 W20 Mac E51
Win
d Sp
eed
(mph
)
Measured
Predicted
Class 4 Wind
Class 3 Wind
Class 2 Wind
Class 1 Wind
Average wind speeds at MIT
Figure 7. Average predicted and measured wind speeds and classification. Another industry used method that more accurately describes the wind speed distribution
of a wind site is a Weibull distribution. The Weibull distribution takes wind speed frequency data
(i.e. 500 data points at 1mph, 600 data points at 2mph…) and fits a smooth probability
distribution curve to it.
Typically the average wind speed will be slightly to the right of the peak (mode) of the
Weibull. Figure 8 below shows the characteristic shape of the Weibull distribution for the wind
data from the edge anemometer at Eastgate. Table 1 below gives our own measured Weibull k
shape parameters and historical k shape parameters from AWS TrueWind for each site. The
measured and historical vary because the historical k values are calculated from data taken over a

Bates, Fox, McCusker, Pesce 21
longer time interval, at least a whole year, while ours are calculated from data from only a
month.
Weibull Distribution of Eastgate Wind Speeds at the Edge
0
100
200
300
400
500
600
700
800
0 10 20 30 40 50 60
Wind Speed (mph)
Freq
uenc
y
0
0.02
0.04
0.06
0.08
0.1
0.12
FrequencyWeibull
Figure 8. Sample Weibull curve from data from Eastgate edge anemometer. Table 1. Measured and Historical Weibull k shape parameters. Building Measured k Edge Historical k29
14 2.7 2.16
36 1.5 2.16
E51 1.9 2.17
Eastgate 2.1 2.17
Mac 1.7 2.16
w8 1.7 2.16
W20 2.6 2.16
29 AWS TrueWind
Bates, Fox, McCusker, Pesce 22
Because of the nature of Weibull distributions, many statistics such as the mean, mode,
variance, and skewness, can be calculated from the k shape factor and the λ scale factor.30 An
additional benefit of Weibull distributions is that the manufacturers of Skystream provide
spreadsheets that allow one to predict annual average kWh’s simply with average wind speed
and Weibull k shape factor. This quick approximation method was used to compare to our actual
energy production values.
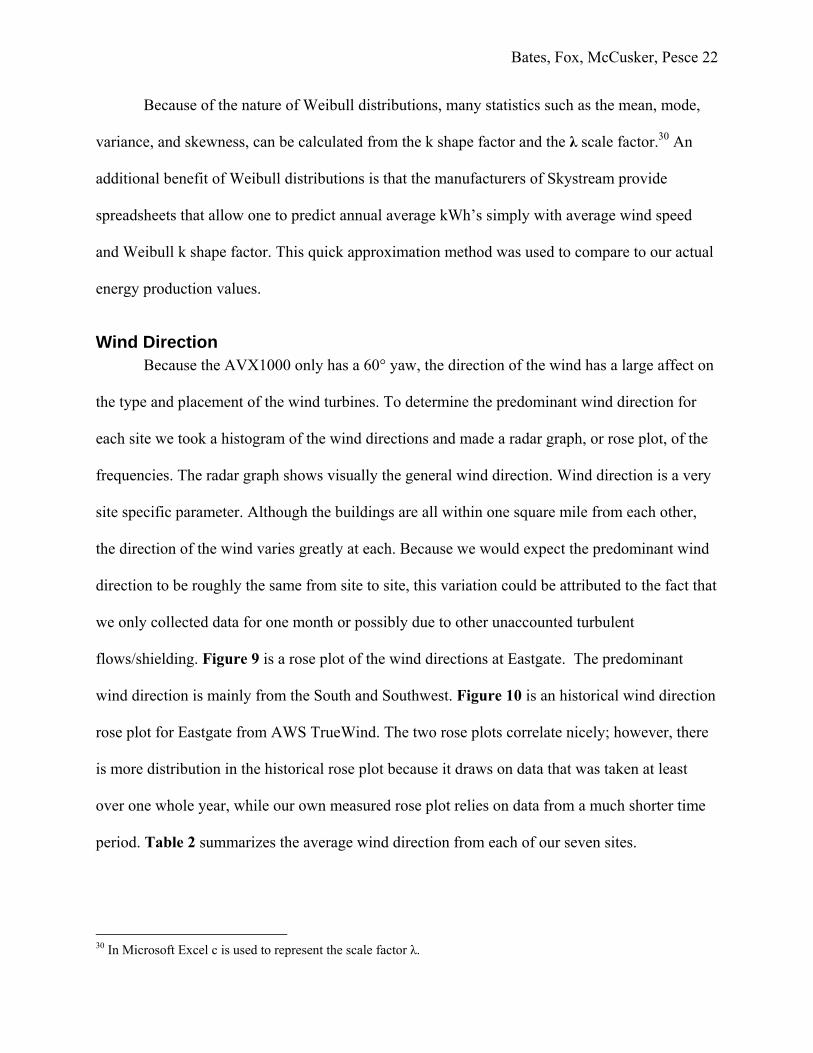
Wind Direction Because the AVX1000 only has a 60° yaw, the direction of the wind has a large affect on
the type and placement of the wind turbines. To determine the predominant wind direction for
each site we took a histogram of the wind directions and made a radar graph, or rose plot, of the
frequencies. The radar graph shows visually the general wind direction. Wind direction is a very
site specific parameter. Although the buildings are all within one square mile from each other,
the direction of the wind varies greatly at each. Because we would expect the predominant wind
direction to be roughly the same from site to site, this variation could be attributed to the fact that
we only collected data for one month or possibly due to other unaccounted turbulent
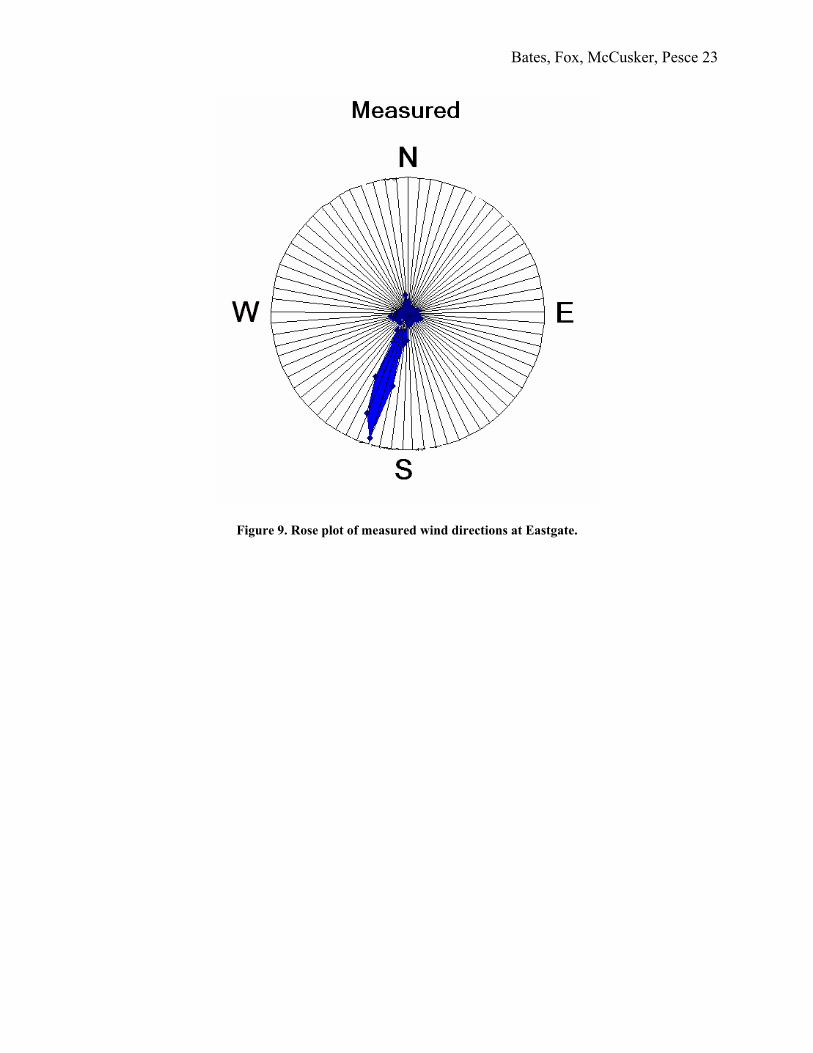
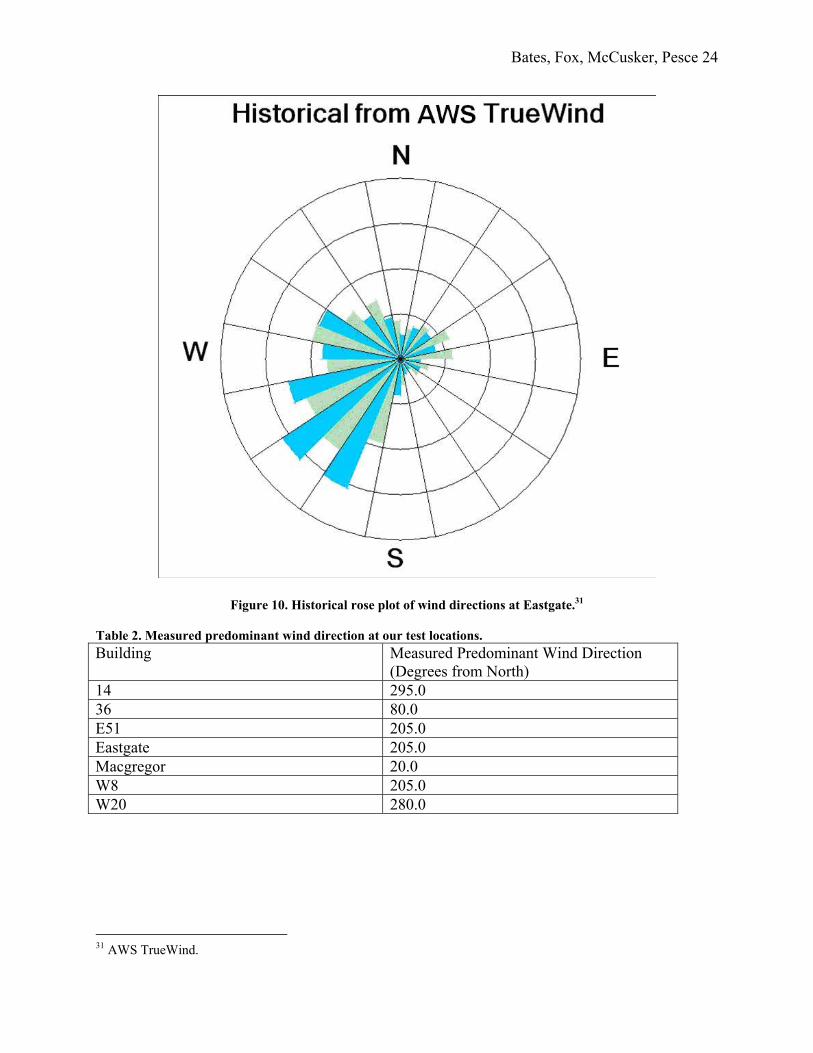
flows/shielding. Figure 9 is a rose plot of the wind directions at Eastgate. The predominant
wind direction is mainly from the South and Southwest. Figure 10 is an historical wind direction
rose plot for Eastgate from AWS TrueWind. The two rose plots correlate nicely; however, there
is more distribution in the historical rose plot because it draws on data that was taken at least
over one whole year, while our own measured rose plot relies on data from a much shorter time
period. Table 2 summarizes the average wind direction from each of our seven sites.
30 In Microsoft Excel c is used to represent the scale factor λ.
Bates, Fox, McCusker, Pesce 23
Figure 9. Rose plot of measured wind directions at Eastgate.
Bates, Fox, McCusker, Pesce 24
Figure 10. Historical rose plot of wind directions at Eastgate.31
Table 2. Measured predominant wind direction at our test locations. Building Measured Predominant Wind Direction
(Degrees from North) 14 295.0 36 80.0 E51 205.0 Eastgate 205.0 Macgregor 20.0 W8 205.0 W20 280.0
31 AWS TrueWind.
Bates, Fox, McCusker, Pesce 25
Economic Feasibility
Assumptions Obviously, besides the wind related site specific considerations, there are many other
factors that affect the feasibility of a wind turbine system. The lifetime, maintenance costs, price
of electricity, emissions credits, and state and/or federal rebates and tax credits, all must be
weighed in.
For the analysis, we assumed a constant cost of electricity of $0.15/kWh.32 This
electricity cost is the price that MIT currently pays NSTAR utilities to supply them with power.
For the purposes of a fair comparison between the turbine manufacturers, we decided to
compare all wind systems at a 6 kW capacity.33 The AeroVironment turbines are designed to be
purchased as a 6 turbine, 6 kW system. Since each Skystream 3.7 turbine has a capacity of
2.4kW this meant comparing them as a two and a half turbine system. According to the owner’s
manual, “The Skystream is designed for 20 years of maintenance-free operation. All bearings
and components were designed for a 20 year life at a site with an average annual wind speed of
19 mph (8.5 m/s).”34 Despite this, annual owner performed checkups are recommended by the
manufacturer. Although no owner’s manual is available for the AVX1000, we assumed a similar
nominal maintenance cost for the AV turbine. See Table 16 and Table 17 in Appendix E for
additional information on turbine costs.
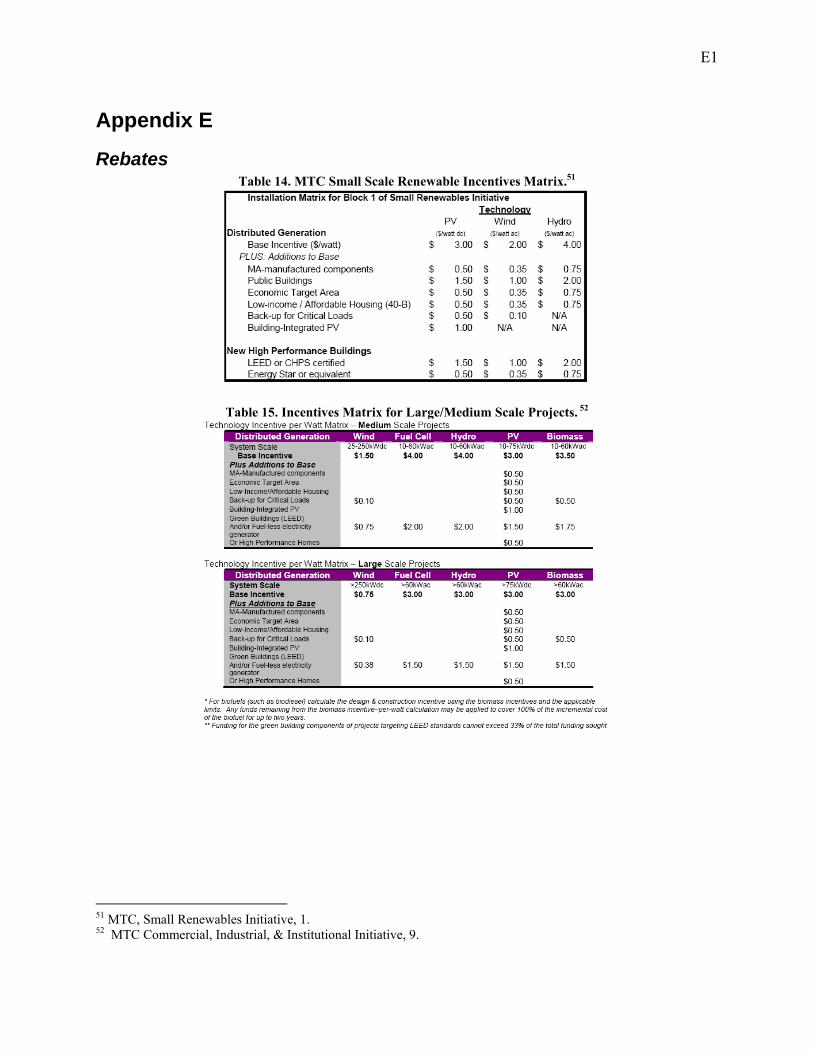
Additionally, rebates from the Massachusetts Technology Collaborative help make wind
turbine purchases more viable. For small wind projects that are less than 10 kW, they provide
rebate substantial rebates.35 First the MTC provides a baseline rebate of $2.00 per installed
32 Cooper 33 See Error! Reference source not found. in appendix for clarification 34 Southwest Windpower, 30 35 See Error! Reference source not found. in appendix for additional eligibility requirements.
Bates, Fox, McCusker, Pesce 26
Watt.36 If the building is LEED certified, this rebate is increased by $1.00 to $3.00 per installed
Watt. However, since none of the buildings we assessed were LEED certified, we used the
baseline case of $2.00/Watt. See Table 14 in Appendix E for additional information on small
scale rebates. For MTC grants on wind projects that are above 10 kW see Table 15 in Appendix
E.
MIT is involved in a NOX trading scheme where they receive the current EPA market
price of $0.48 per pound.37 Because MIT produces less than 25 MW of power and uses its own
power, it is exempt from the carbon cap regulations that would have resulted in mandatory
purchasing of renewable energy credits and/or alternative compliance payments.38 Additionally,
it does not participate in a SOX emissions trading scheme.
Last, because the potential wind installation is defined as renewable energy, the
electricity produced by the turbines could be sold as renewable energy certificates (RECs) to
interested consumers. Although the revenue generated by these REC’s was not taken into
account in this analysis, future research could determine the exact price or monetary
imbursement for the sale of the aforementioned certificates.
Power and Electricity Generation
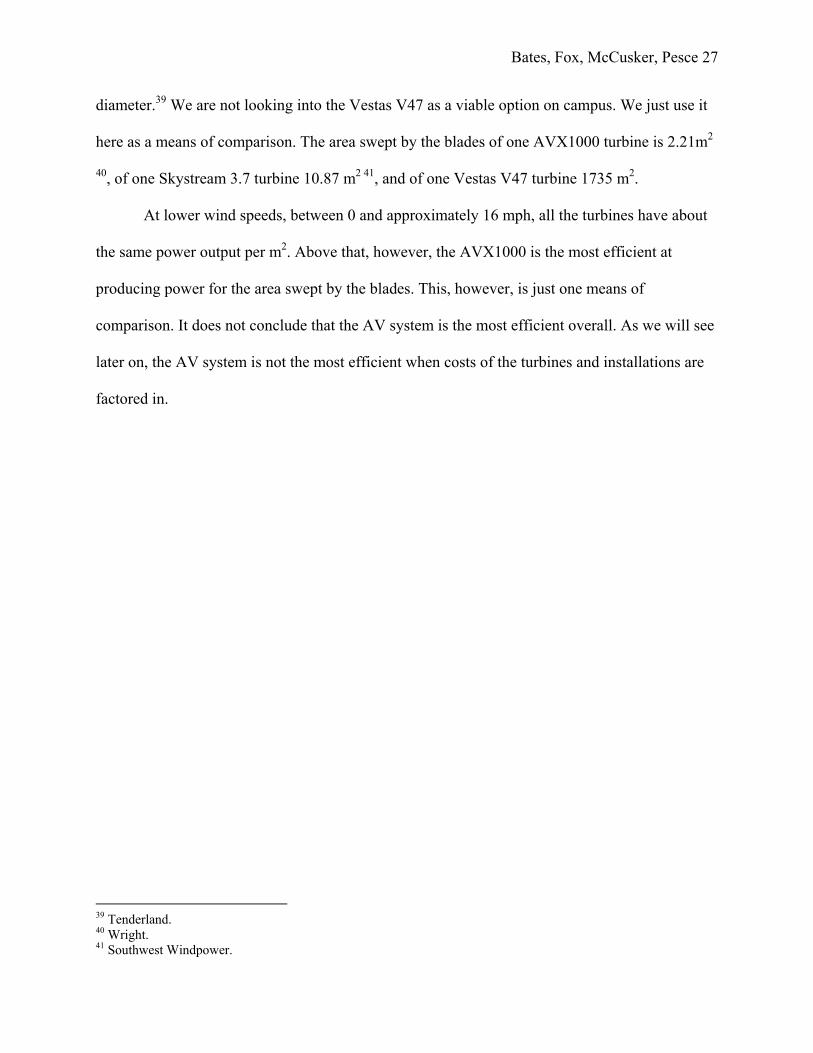
Figure 11 shows the Betz Limit and the power that could potentially be produced from
each of three different turbines in Watts per m2. The Vestas V47 is an industrial turbine, the kind
that would be installed in a large-scale wind farm. It is a 660 kW machine with a 154 ft
36 MTC “Small Renewables Initiative Design & Construction REBATES”, 1. 37 Cooper. 38 The Commonwealth of Massachusetts Executive Department, 1.
Bates, Fox, McCusker, Pesce 27
diameter.39 We are not looking into the Vestas V47 as a viable option on campus. We just use it
here as a means of comparison. The area swept by the blades of one AVX1000 turbine is 2.21m2
40, of one Skystream 3.7 turbine 10.87 m2 41, and of one Vestas V47 turbine 1735 m2.
At lower wind speeds, between 0 and approximately 16 mph, all the turbines have about
the same power output per m2. Above that, however, the AVX1000 is the most efficient at
producing power for the area swept by the blades. This, however, is just one means of
comparison. It does not conclude that the AV system is the most efficient overall. As we will see
later on, the AV system is not the most efficient when costs of the turbines and installations are
factored in.
39 Tenderland. 40 Wright. 41 Southwest Windpower.
Bates, Fox, McCusker, Pesce 28
Figure 11. Power converted from the wind energy by each turbine in Watts per m2.
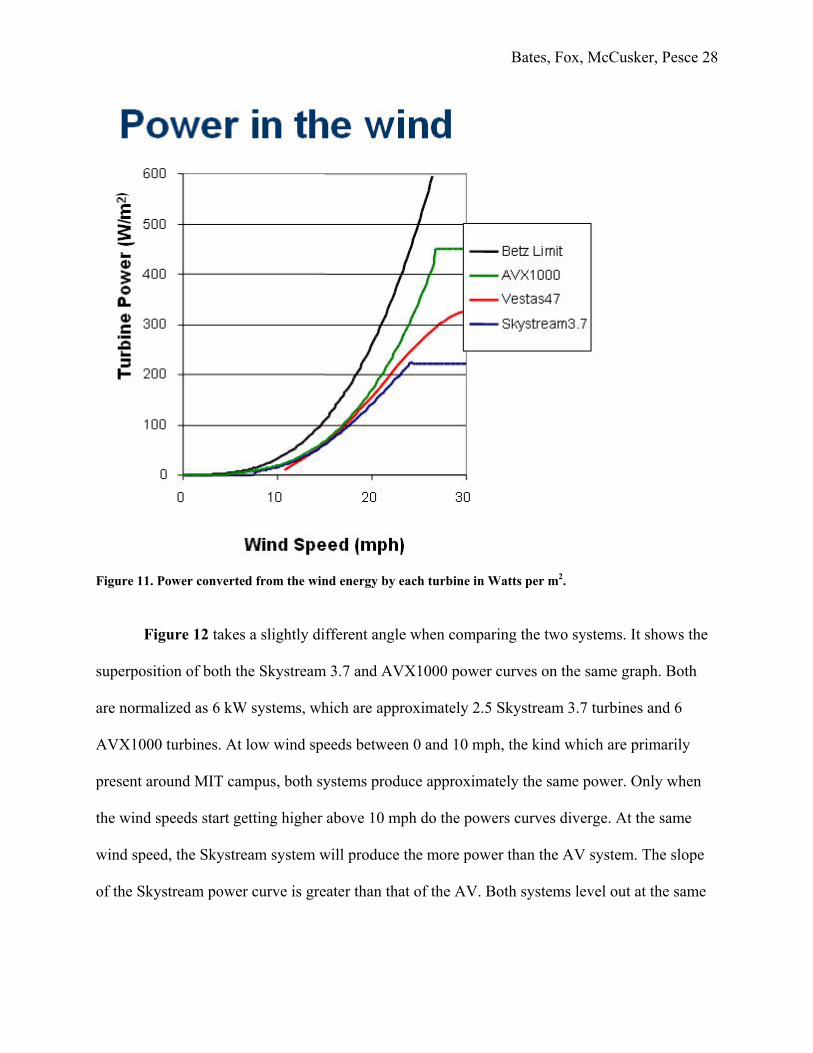
Figure 12 takes a slightly different angle when comparing the two systems. It shows the
superposition of both the Skystream 3.7 and AVX1000 power curves on the same graph. Both
are normalized as 6 kW systems, which are approximately 2.5 Skystream 3.7 turbines and 6
AVX1000 turbines. At low wind speeds between 0 and 10 mph, the kind which are primarily
present around MIT campus, both systems produce approximately the same power. Only when
the wind speeds start getting higher above 10 mph do the powers curves diverge. At the same
wind speed, the Skystream system will produce the more power than the AV system. The slope
of the Skystream power curve is greater than that of the AV. Both systems level out at the same
Bates, Fox, McCusker, Pesce 29
power output, 6000 Watts, but the AV system does so at a higher wind speed. Both systems
discontinue power production at 60 mph because of safety concerns.
0
1000
2000
3000
4000
5000
6000
7000
0 10 20 30 40 50 60 70 80Wind Speed (mph)
Power (W
atts)
0
1000
2000
3000
4000
5000
6000
7000
0 10 20 30 40 50 60 70 80Wind Speed (mph)
Power (W
atts)
Actual Power SS 6KW SystemActual AV Power 6KW SystemActual Power SS 6KW SystemActual AV Power 6KW System
Power curve comparison
Figure 12. Power curve comparison of normalized Skystream and AV systems.
By correlating our own data to the historical data, we were able to predict what the wind
speed at our sites would have been between 01/01/1990 and 03/31/2006. Under the assumption
that the aforementioned time period accounted for seasonal and/or annual wind changes, we
extrapolated the wind speed distributions an equal number of years forward. From that we
calculated the mean, standard deviation, Weibull k and λ factors, for the wind speed. Next,
because we correlated our data to hourly observations and not hourly averages, it was possible to
plug these wind speeds directly into manufacturer power curves. After averaging these
Bates, Fox, McCusker, Pesce 30
instantaneous powers and multiplying them by length of time of operation, we could determine
the total and average annual electricity produced.
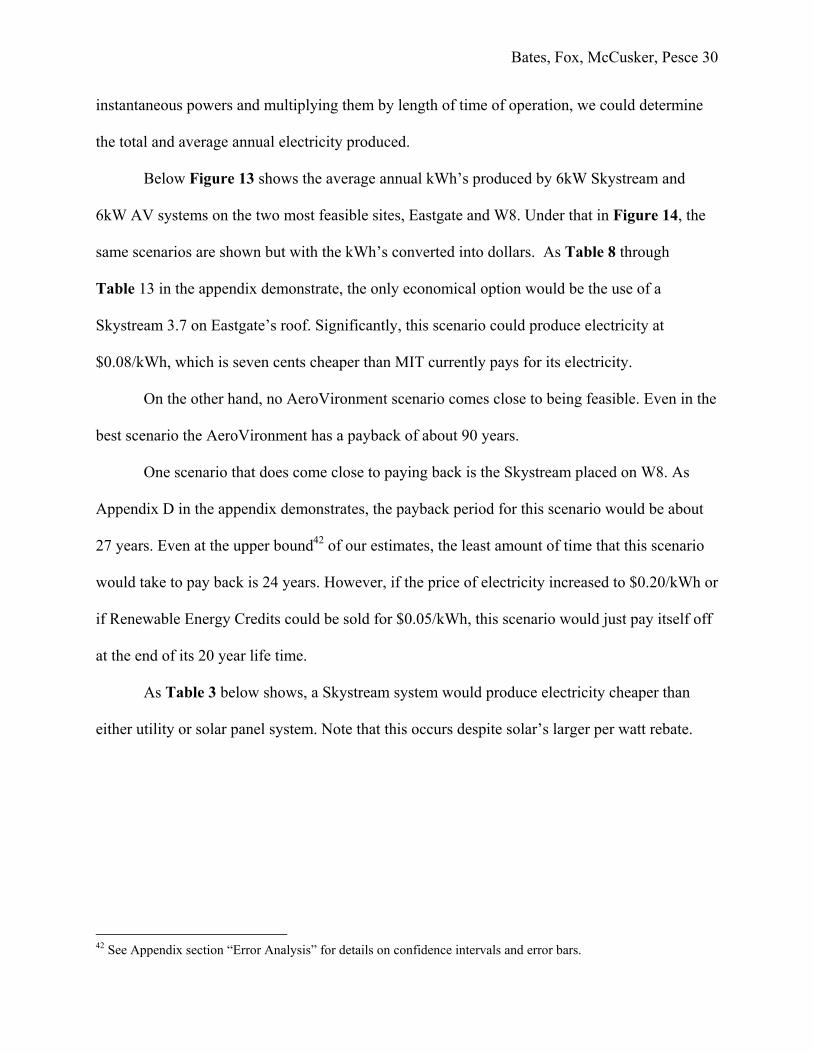
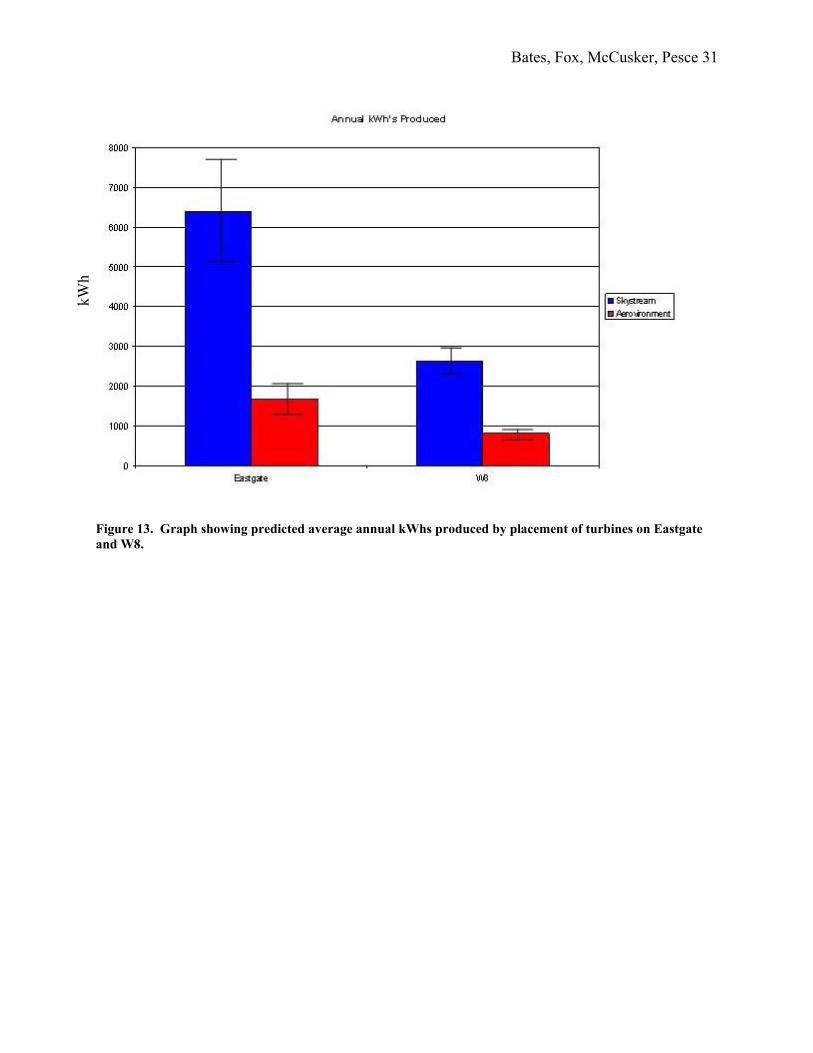
Below Figure 13 shows the average annual kWh’s produced by 6kW Skystream and
6kW AV systems on the two most feasible sites, Eastgate and W8. Under that in Figure 14, the
same scenarios are shown but with the kWh’s converted into dollars. As Table 8 through
Table 13 in the appendix demonstrate, the only economical option would be the use of a
Skystream 3.7 on Eastgate’s roof. Significantly, this scenario could produce electricity at
$0.08/kWh, which is seven cents cheaper than MIT currently pays for its electricity.
On the other hand, no AeroVironment scenario comes close to being feasible. Even in the
best scenario the AeroVironment has a payback of about 90 years.
One scenario that does come close to paying back is the Skystream placed on W8. As
Appendix D in the appendix demonstrates, the payback period for this scenario would be about
27 years. Even at the upper bound42 of our estimates, the least amount of time that this scenario
would take to pay back is 24 years. However, if the price of electricity increased to $0.20/kWh or
if Renewable Energy Credits could be sold for $0.05/kWh, this scenario would just pay itself off
at the end of its 20 year life time.
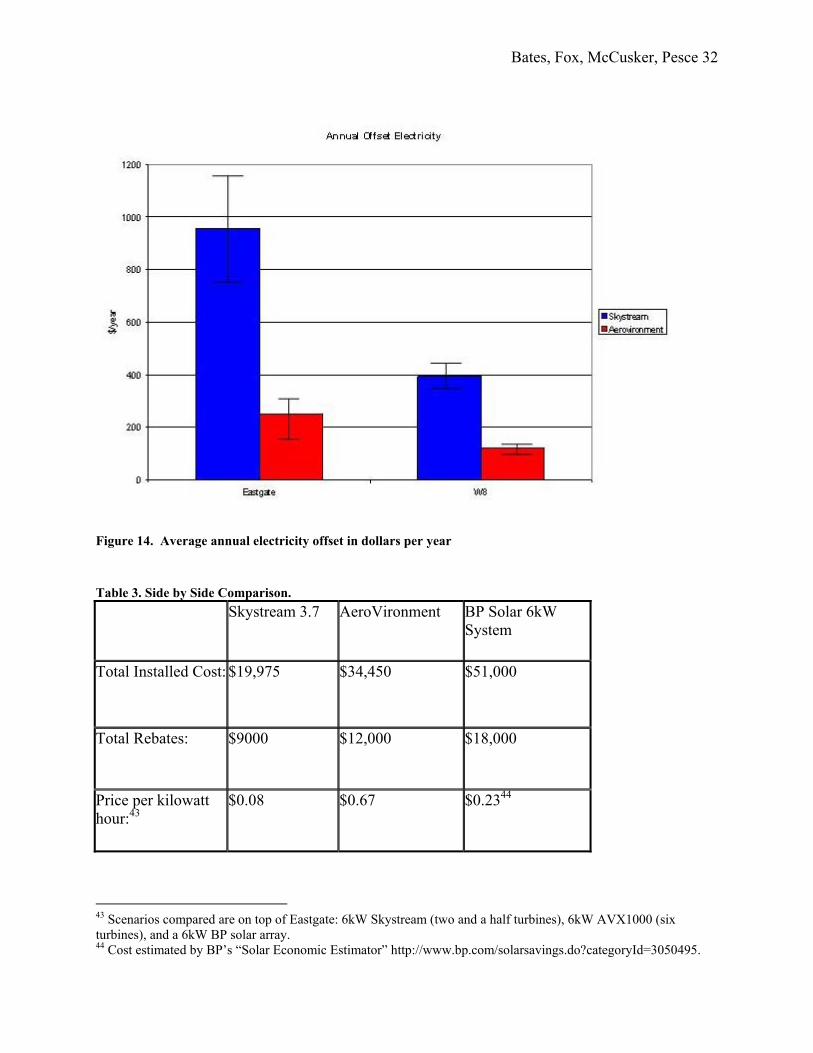
As Table 3 below shows, a Skystream system would produce electricity cheaper than
either utility or solar panel system. Note that this occurs despite solar’s larger per watt rebate.
42 See Appendix section “Error Analysis” for details on confidence intervals and error bars.
Bates, Fox, McCusker, Pesce 31
kWh
Figure 13. Graph showing predicted average annual kWhs produced by placement of turbines on Eastgate and W8.
Bates, Fox, McCusker, Pesce 32
Figure 14. Average annual electricity offset in dollars per year
Table 3. Side by Side Comparison.
Skystream 3.7 AeroVironment BP Solar 6kW System
Total Installed Cost: $19,975 $34,450 $51,000
Total Rebates: $9000 $12,000 $18,000
Price per kilowatt hour:43
$0.08 $0.67 $0.2344
43 Scenarios compared are on top of Eastgate: 6kW Skystream (two and a half turbines), 6kW AVX1000 (six turbines), and a 6kW BP solar array. 44 Cost estimated by BP’s “Solar Economic Estimator” http://www.bp.com/solarsavings.do?categoryId=3050495.
Bates, Fox, McCusker, Pesce 33
Social Feasibility Any project that can have an influence a community must have the support of that
community before it can be implemented. Common concerns with wind turbine installation
include their affect on birds and bats as well as their visual and audio disturbances.45
Influence on Avian Life An issue of concern with installing wind turbines is the effect they can have on birds in
the area. However, many environmental groups, including both the National Audubon Society
and Mass Audubon, have shown their support for wind turbines as a cleaner form of energy. In
Mass Audubon’s position statement on wind energy development, the group claims to support
“responsible planning, permitting, and production of renewable energy resources including wind
energy.”46 Responsible installation is largely defined by their placement in relation to the
migratory path of birds or if the area is known for its avian life. Since the concept of putting
turbines on top of buildings is relatively new, their affect on birds is still in question. However,
it is believed that since MIT is not in the middle of any major migratory path, the effect on the
birds in the area will be minimal. There is at least one hawk that nests on an MIT building. This
may affect the implementation of a turbine if it is on or near that building.
Aesthetics An important component of wind turbine installation is having support from the
community. Common opinions claim turbines to be unsightly and loud. As such, it can be
difficult to generate public support for such projects. As part of our analysis, a survey was
conducted and given to the undergraduate students at MIT and 274 responses were received.
The same survey was given to residents of Eastgate, or E55, one of our test sites, but
45 Firestone (2007). 46 Clarke (2003).
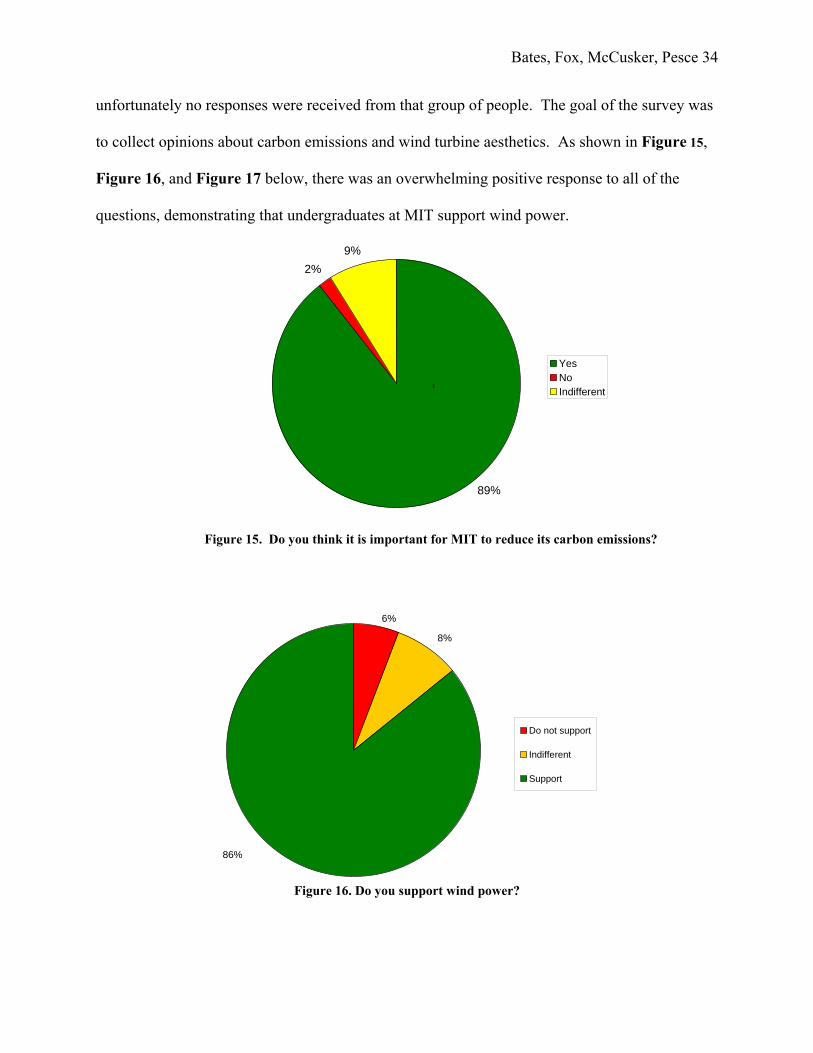
Bates, Fox, McCusker, Pesce 34
unfortunately no responses were received from that group of people. The goal of the survey was
to collect opinions about carbon emissions and wind turbine aesthetics. As shown in Figure 15,
Figure 16, and Figure 17 below, there was an overwhelming positive response to all of the
questions, demonstrating that undergraduates at MIT support wind power.
2%9%
89%
YesNoIndifferent
c
Figure 15. Do you think it is important for MIT to reduce its carbon emissions?
86%
8%
6%
Do not support
Indifferent
Support
Figure 16. Do you support wind power?

Bates, Fox, McCusker, Pesce 35
80%
7%
13%
UnacceptableIndifferentAcceptable
Figure 17. Is it acceptable to put a turbine on top of an MIT building?
These questions were asked to both get a general understanding of our audience and their
interactions with wind power as well as their opinions. The high percentage of people
supporting MIT’s reduction of emissions is a positive sign for our project. Also, the fact that
many people have seen turbines and still support their use implies that those who have seen them
were not appalled and that an installation on MIT’s campus might not be greeted with harsh
aesthetics critics.
Hull, MA, a location on the coast of Massachusetts with two large scale turbines, has
demonstrated a positive outlook on turbines within a community. In 2002, a 660 kW turbine was
installed near the town’s high school. After its installation, a survey was conducted to gather
public opinions regarding the new turbine as well as possible implementation of multiple
turbines. There was an amazingly positive response and 475 residents out of 499 surveyed
supported the installation of more turbines. This demonstrates that perhaps some of the common
Bates, Fox, McCusker, Pesce 36
beliefs about turbine aesthetics are not valid, and people do not mind having them near their
homes.47
The survey was voluntary, so we may have suffered from voluntary response bias. But
because of the short nature of the survey, we suspect that even unbiased/impartial students would
have been willing to share their opinion.
Added social benefits Implementing wind power at MIT is important for many reasons, including setting a
precedent. If turbines on campus are quiet and aesthetically pleasing, then the public view and
opinion of turbines could change for the better and trigger more widespread use of wind power.
The mere fact we are even considering small scale wind may cause other universities, schools,
and even homeowners to think about whether their own wind resource could be viable. The
prospect that current or future students may be motivated by a successful wind installation to
direct their efforts into energy/environment related field is not far fetched either. Last, with the
changing global climate, the implementation of wind power helps MIT send the message to the
rest of the world that it too does care strongly about reducing greenhouse gas emissions This sort
of investment into renewable resources would illustrate just how willing MIT is to fulfill its
“walk the talk” attitude.
Greenhouse gases The amount of greenhouse gases offset was calculated after our power analysis was
completed. The survey demonstrated that MIT undergraduates are concerned about carbon
emissions; therefore, it was important to see how much CO2 a turbine could offset. The graph
47 Manwell et al (2003).

Bates, Fox, McCusker, Pesce 37
below assumes each system to have a 6 kW capacity. This is to make a fair comparison between
the two turbines.
Figure 18. Pounds of carbon dioxide offset by using each turbine on the two most promising buildings. From Figure 18, one can see that a Skystream on top of Eastgate would offset
approximately 9000 pounds of CO2 per year. MIT’s overall CO2 emissions add up to be 270,000
Tonnes per year, which translates to about 600 million pounds. Obviously, a single turbine
would not impact the overall emissions a large amount, but it is important to realize that all the
small projects that offset a small amount of carbon dioxide add up and make a cumulative
difference.
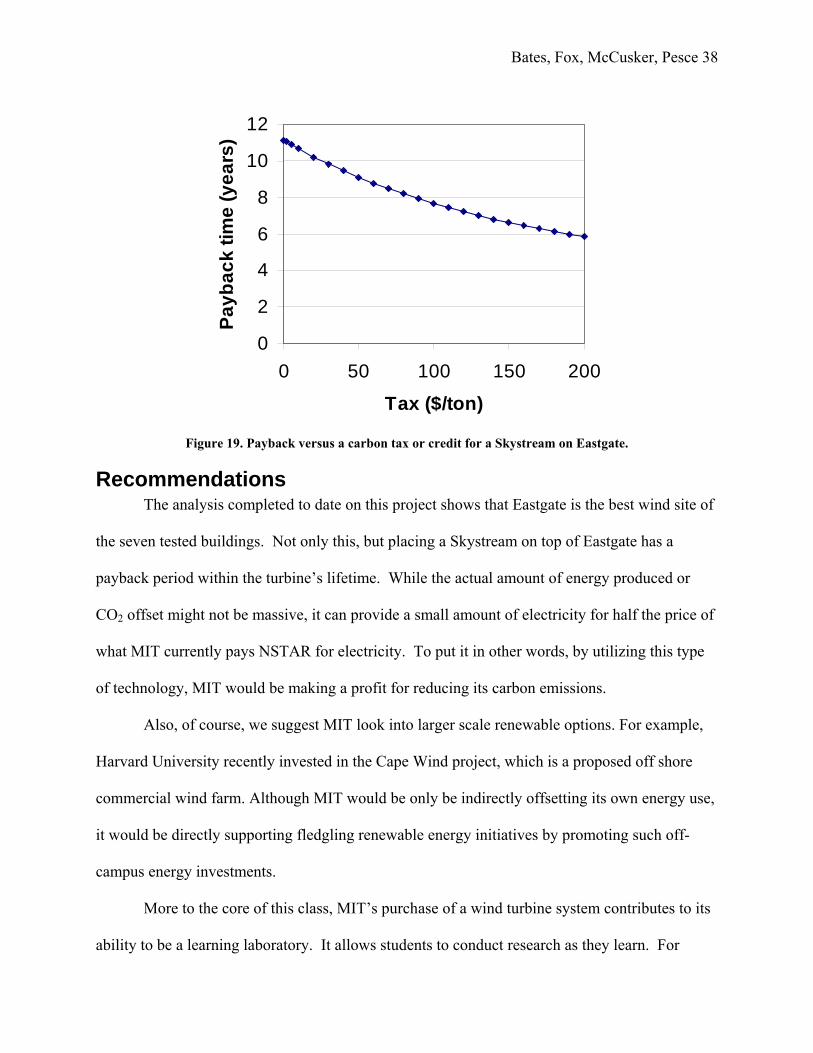
Currently, there is no carbon tax or credit in place in the state of Massachusetts.
However, there has been much talk about implementing such a system to reward those who make
an effort to reduce their carbon dioxide emissions. Figure 19 shows how a carbon tax could
affect the payback time for a Skystream 3.7 on top of Eastgate. The highest value discussed to
date is $200 per ton of CO2.
Bates, Fox, McCusker, Pesce 38
0
2
4
6
8
10
12
0 50 100 150 200
Tax ($/ton)
Payb
ack
time
(yea
rs)
Figure 19. Payback versus a carbon tax or credit for a Skystream on Eastgate.
Recommendations The analysis completed to date on this project shows that Eastgate is the best wind site of
the seven tested buildings. Not only this, but placing a Skystream on top of Eastgate has a
payback period within the turbine’s lifetime. While the actual amount of energy produced or
CO2 offset might not be massive, it can provide a small amount of electricity for half the price of
what MIT currently pays NSTAR for electricity. To put it in other words, by utilizing this type
of technology, MIT would be making a profit for reducing its carbon emissions.
Also, of course, we suggest MIT look into larger scale renewable options. For example,
Harvard University recently invested in the Cape Wind project, which is a proposed off shore
commercial wind farm. Although MIT would be only be indirectly offsetting its own energy use,
it would be directly supporting fledgling renewable energy initiatives by promoting such off-
campus energy investments.
More to the core of this class, MIT’s purchase of a wind turbine system contributes to its
ability to be a learning laboratory. It allows students to conduct research as they learn. For
Bates, Fox, McCusker, Pesce 39
example, one of the groups in this year’s Environmental Engineering Design Lab designed and
tested turbine that could generate power from the wind energy on a campus building’s roof. If
MIT were to install actual turbines on top of a building, they could be used as a teaching tool for
such classes. Perhaps, through an MIT sponsored wind turbine competition, students could
examine turbine mechanics and be challenged to design a wind turbine that could thrive in an
urban small scale situation.
Most importantly, further research needs to be conducted. Limitations posed by this
project forced us to limit our sites to only seven, yet there are a few other buildings across
campus that would most likely be excellent wind resources, including 54 (the Green building)
and Tang, a graduate resident hall. Further analysis should continue on the more promising sites
of this study, including Eastgate and W8. Because of our short time interval, our data is neither
ideal nor free from error. Consequently, a year-long analysis of these locations would raise the
level of confidence for our calculations considerably.
Conclusion Where can we find energy? It is well known that oil, and other fossil fuels store energy
very efficiently. However, their supply up to this date, convenience, and accessibility has not
come without cost. These energy sources have proven to be detrimental to the environment in the
form of climate-warming gaseous byproducts such as carbon dioxide, nitrous oxides, sulfur
dioxide. These gases enter the atmosphere and trap heat in the case of carbon dioxide or in the
case of sulfur dioxide, cause acid rain. The damage to our atmosphere and biosphere can be
irreversible and may have future consequences beyond our comprehension. Action must be taken
immediately to reduce our reliance on these gases and their irrefutable deleterious effects. In
addition to environmental impetuses, the increasingly uncertain nature of the global energy

Bates, Fox, McCusker, Pesce 40
market and the dwindling supply of these fossil fuels call for immediate change. This is where
renewable energy comes in to play. Not only are renewable energy resources clean but they are
permanent and found all over the planet.
However, our group was interested in renewable energy at a very specific and important
place- MIT. With the recent “Walk the Talk” campaign, the increasing momentum of the MIT
energy initiative (MITei), and the overwhelming support for emissions reductions from students,
now more than ever is MIT’s chance to improve its green image, support small scale renewable
initiatives, and at the same time improve energy/climate change awareness. From the results of
our survey, we would predict little resistance to implementing wind power on campus.
Regardless of what MIT decides, both energy efficiency modifications and avenues for
new energy sources should be explored by the Institute. MIT is the leading technology school in
the nation and by initiating renewable options on or off campus it would help set a precedent that
others would be sure to notice.
Bates, Fox, McCusker, Pesce 41
References American Wind Energy Association (AWEA) Small Wind Turbine Committee, The U.S. Small
Wind Turbine Industry Roadma: A 20-year industry plan for small wind turbine technology, June 2002. www.awea.org/smallwind/documents/31958.pdf.
AWS TrueWind, LLC. The New England Wind Map. 2003.
http://truewind.teamcamelot.com/ne/. Bahaj, A. S., L. Meyers, P. A. B. James. Urban Energy Generation: Influence of micro-wind
turbine output one electricity consumption in buildings. Energy and Buildings; Feb 2007, Vol. 39 Issue 2, p 154-165.
Calley, D., J. Green, J. Lonjaret, P. Migliore. (2005 August) National Renewable Energy
Laboratory (NREL). Prepared for Wind Power 2005 Conference Paper. Balancing Performance, Noise, Cost, and Aesthetics, in the Southwest Windpower “Storm” Wind Turbine.
Clarke, John J. and Heidi Ricci. (2003, May 12) “Mass Audubon’s Positions Statement on Wind
Energy Development.” http://www.massaudubon.org/housetohabitat/news.php?id=358&event=no (2007, May 13)
The Commonwealth of Massachusetts Executive Department. Governor Patrick Signs Regional
Pact to Reduce Greenhouse Gas Emissions. 18 Jan 2007. http://www.mass.gov/?pageID=pressreleases&agId=Agov3&prModName=gov3pressrelease&prFile=reduce_greenhouse_gases011807.xml.
Connors, Steven. “Offshore Windpower in the Northeast: Estimating Emissions Reductions.”
MIT Laboratory for Energy and the Environment; July 2005 page 4-5 Danish Wind Energy Association. Betz’s Law: The Ideal Braking of the Wind. Last updated 1
June 2003. http://www.windpower.org/en/tour/wres/betz.htm. Danish Wind Energy Association. The Power of the Wind: Cube of Wind Speed. Last updated 1
June 2003. http://www.windpower.org/en/tour/wres/enrspeed.htm. Danish Wind Energy Association. Wind Turbines: Horizontal or Vertical Axis Machines? Last
Updated 23 July 2003. http://www.windpower.org/en/tour/design/horver.htm. ESS Group, Inc. Wind Energy as a Siting Criteria for Potential Wind Parks. Prepared for the
U.S. Army Corps of Engineers. Nov 2004. Firestone, Jeremy et al. (2007, January 16) Delaware Opinion on Offshore Wind Power.
http://www.ocean.udel.edu/windpower/docs/DE-survey-InterimReport-16Jan2007.pdf (2007, May 14
Bates, Fox, McCusker, Pesce 42
Hull. Citizens for Alternative Renewable Energy. 2006. www.hullwind.org. Manwell, J.F. et al. (2003) Wind Turbine Sitting in an Urban Environment: The Hull, MA 660
kW Turbine. http://www.ceere.org/rerl/publications/whitepapers/AWEA_Hull_2003.pdf. (2007, May 13)
Massachusetts Technology Collaborative. Commercial, Industrial, and Institutional Initiative:
Feasibility Study and Design & Construction GRANTS. Amended 27 Dec 2004. http://www.masstech.org/Grants_and_Awards/CI3/CI3Solicitationamend2FINAL.pdf.
Massachusetts Technology Collaborative. Question File: Small Renewables Initiative. April
2005. http://www.masstech.org/Grants_and_Awards/GBP/Question2005SR1RD1April05_final.pdf.
Massachusetts Technology Collaborative. Small Renewables Initiative: Design & Construction
REBATES. http://www.masstech.org/Grants_and_Awards/GBP/_2005-SR-01-RD1_%20SRI%20Solicitation_FINAL.pdf.
Power MIT. Current MIT Power. Last updated 15 May 2007. http://cogen.mit.edu/powerMIT/. Rogers, Anthony L., J. W. Rogers, and J. F. Manwell. Comparison of the Performance of Four
Measure-Correlate-Predict Algorithms. University of Massachusetts Amherst. 2005. http://www.ceere.org/rerl/publications/published/2005/JWEIA_MCP.pdf.
Sampson, Ben. Up on the Roof. Professional Engineering; 7 March 2007, Vol. 20 Issue 5, p 31-
33, 2p. Southwest Windpower, Inc. Skystream 3.7 Owner’s Manual. April 2007.
http://windenergy.com/documents/manuals/0313_Skystream_Manual.pdf. Southwest Windpower. Skystream 3.7: Product Info.
http://www.skystreamenergy.com/skystream/. TenderLand Power Company. Projects: Alta Mesa Project – Phase IV.
http://www.tenderland.com/projects.htm. U.S. Department of Energy (USDOE). Energy Efficiency and Renewable Energy. Wind
Powering America: Massachusetts Wind Resource Map. Last updated 22 March 2007. Wright, Jeff. AeroVironment. Director of Strategic and Global Sales Energy Initiatives. Personal
interview. 19 April 2007.

A1
Appendix A
Site Setup
Figure 20. W8 Anemometer locations48.
257’ 9”
6’
12’
Figure 21. Heights of anemometers on Eastgate.
48 Picture modified from Google Earth.
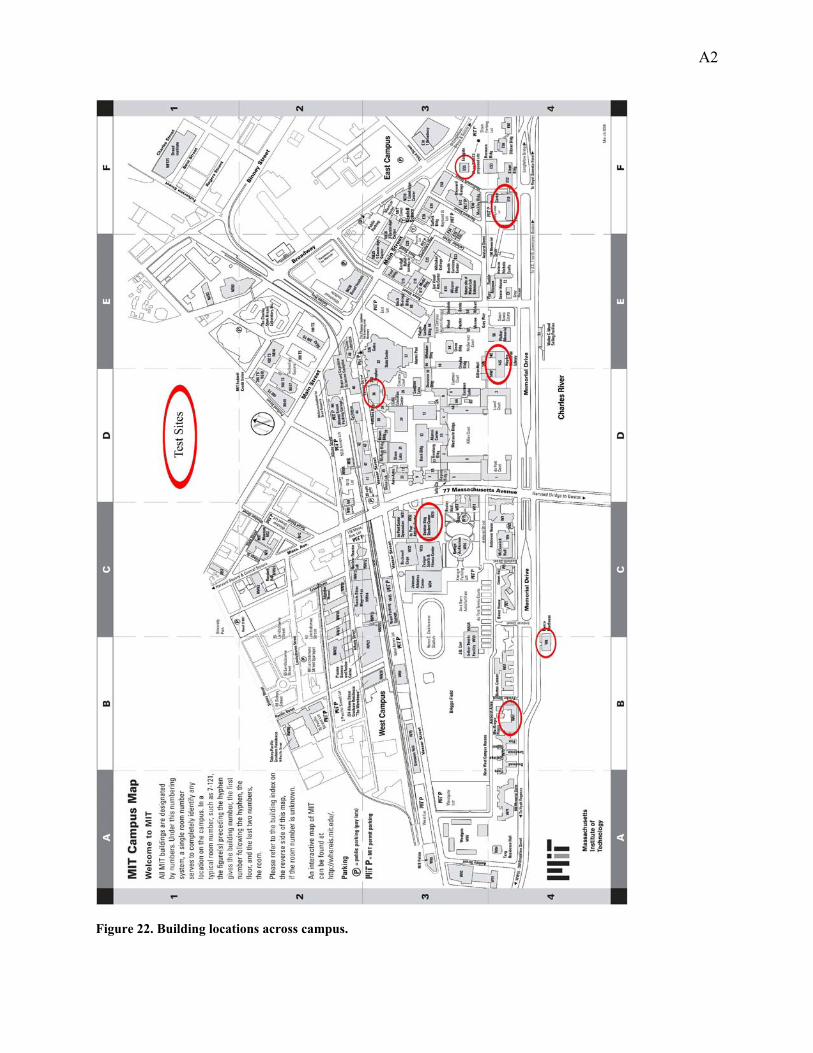
A2
Figure 22. Building locations across campus.
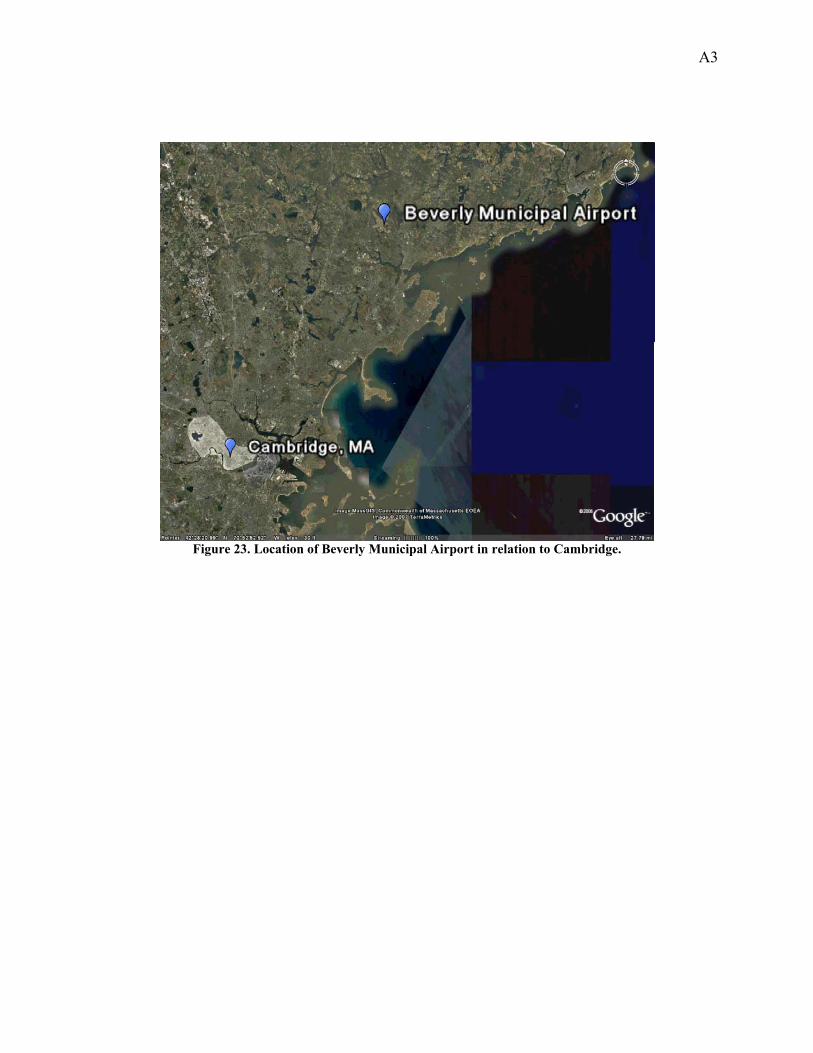
A3
Figure 23. Location of Beverly Municipal Airport in relation to Cambridge.
B1
Appendix B
Methodology Specifics Power and Wind Direction
Team Wind’s first attempt to take into account wind direction involved using excel to
disregard data points unless they were in specified wind direction ranges (i.e 120-180 degrees).
By looking at the geographical orientation (North/South/East/West) of specific edges of campus
buildings, this method had the potential to very accurately predict the power produced by AV
turbine systems on different faces of a building. Unfortunately, the Beverly wind direction data
produced dominant wind direction results (N-NE) that contradicted MIT’s actual predominant
wind direction (S-SW), making the results useless. Consequently, one area of future analysis
would be to use Green Building wind data instead of Beverly. One could produce much more
accurate results with the said method coupled with accurate on-campus wind direction data.
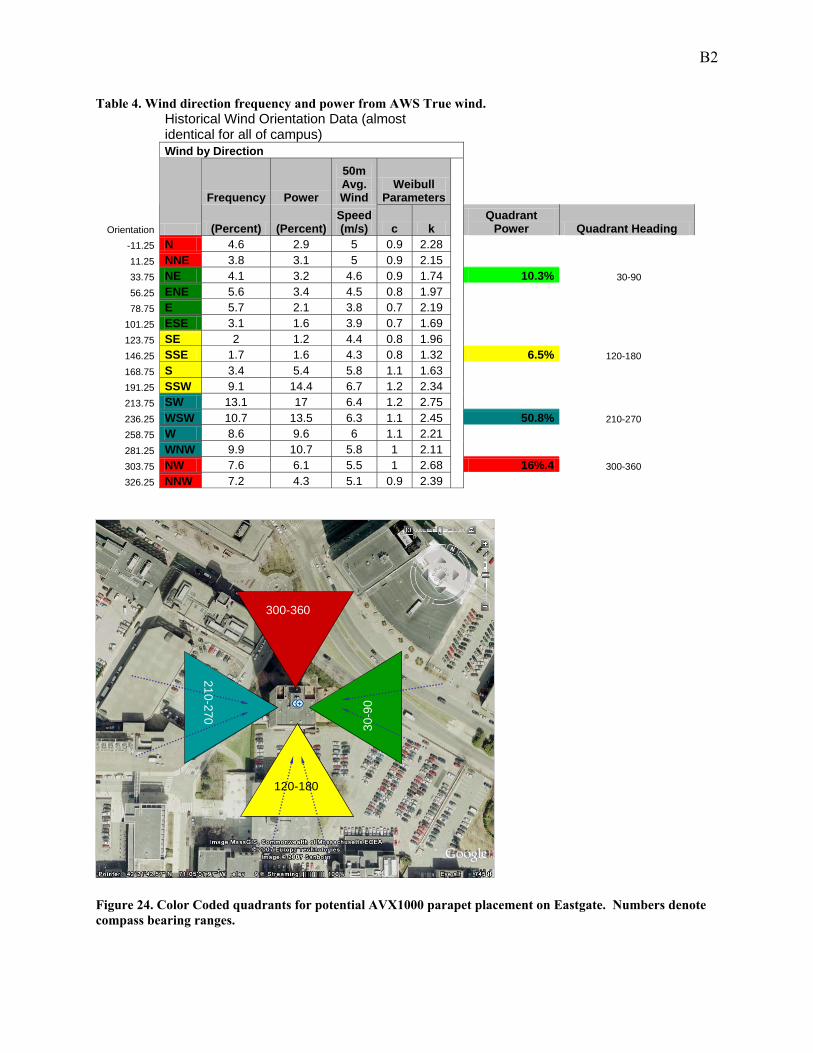
As a result of the predominant wind direction contradiction, we decided to use the wind rose
method. The following table shows the percentage of total power produced from certain 60
degree bins. (It is a wind rose in tabular form). Note how AVX1000’s mounted on the western
edge of the building (Eastgate) would be able to capture as much as 50% of the total wind
resource.
B2
Table 4. Wind direction frequency and power from AWS True wind.
Historical Wind Orientation Data (almost identical for all of campus)
Wind by Direction
Frequency Power
50m Avg. Wind
Weibull Parameters
Orientation (Percent) (Percent) Speed (m/s) c k
Quadrant Power Quadrant Heading
-11.25 N 4.6 2.9 5 0.9 2.28 11.25 NNE 3.8 3.1 5 0.9 2.15 33.75 NE 4.1 3.2 4.6 0.9 1.74 10.3% 30-90 56.25 ENE 5.6 3.4 4.5 0.8 1.97 78.75 E 5.7 2.1 3.8 0.7 2.19
101.25 ESE 3.1 1.6 3.9 0.7 1.69 123.75 SE 2 1.2 4.4 0.8 1.96 146.25 SSE 1.7 1.6 4.3 0.8 1.32 6.5% 120-180 168.75 S 3.4 5.4 5.8 1.1 1.63 191.25 SSW 9.1 14.4 6.7 1.2 2.34 213.75 SW 13.1 17 6.4 1.2 2.75 236.25 WSW 10.7 13.5 6.3 1.1 2.45 50.8% 210-270 258.75 W 8.6 9.6 6 1.1 2.21 281.25 WNW 9.9 10.7 5.8 1 2.11 303.75 NW 7.6 6.1 5.5 1 2.68 16%.4 300-360 326.25 NNW 7.2 4.3 5.1 0.9 2.39
300-360
120-180
30-9
0
210-270
Figure 24. Color Coded quadrants for potential AVX1000 parapet placement on Eastgate. Numbers denote compass bearing ranges.
C1
Appendix C
Error Analysis
Predicted Wind Speed Distribution Error To measure the accuracy of the correlation and prediction with the Beverly Data, we followed
the methods set out by Dr. Rogers and performed a Chi Square goodness of fit test.49 Equation 3
shows the method of determined the normalized Chi square statistic. After wind speed were
binned in the following way: “less than 3 m/s, 3 to less then 4, 4 to less then 5, …, 11 to less then
12, and 12 m/s or greater”. We binned the Beverly Wind data during the testing period
(3/21/2007 through 4/30/2007) and our own wind site data in the same way.
Equation 3. Chi Squared Goodness of Fit Test.
50
nyi- denotes (Observed frequency) n(yhat)i- denots (Predicted frequency) N denotes the number of observations
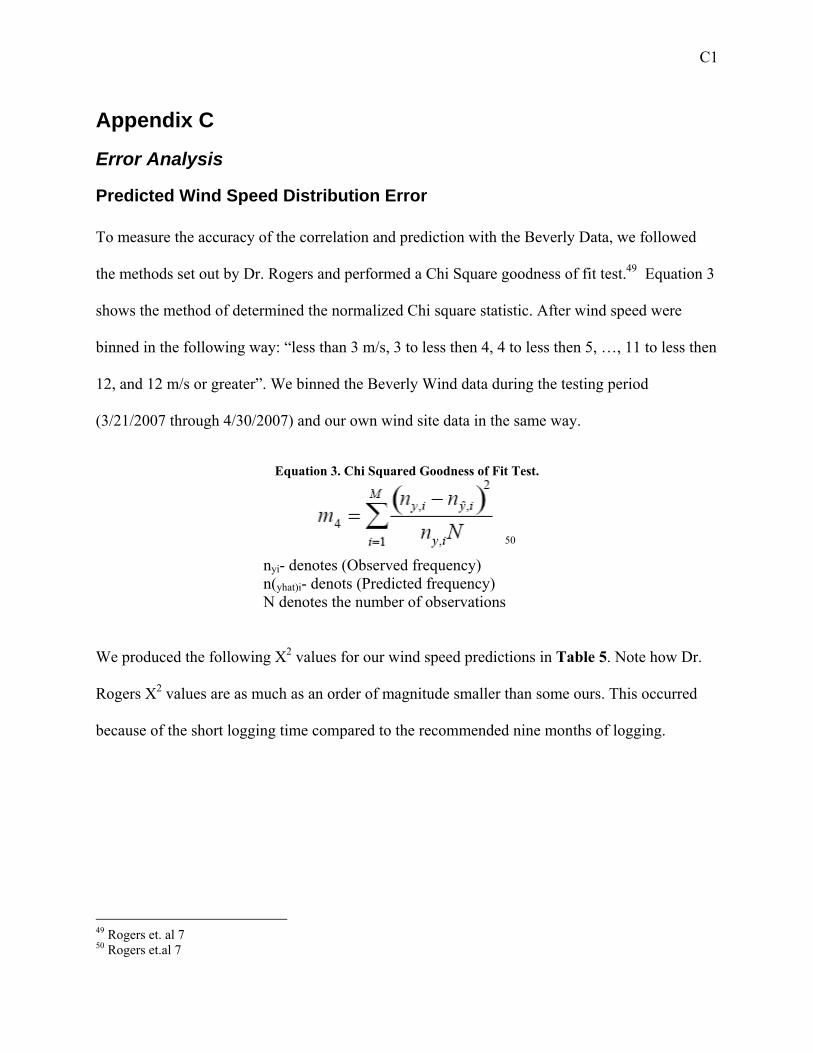
We produced the following X2 values for our wind speed predictions in Table 5. Note how Dr.
Rogers X2 values are as much as an order of magnitude smaller than some ours. This occurred
because of the short logging time compared to the recommended nine months of logging.
49 Rogers et. al 7 50 Rogers et.al 7
C2
Table 5. X2 values.
Rogers, et al.
W20
w8
Mac
Eastgate
E51
36
14
Rogers, et al.
W20
w8
Mac
Eastgate
E51
36
14
0.064
0.159
0.176
0.194
0.644
0.106
0.111
0.148
0.064
0.159
0.176
0.194
0.644
0.106
0.111
0.148
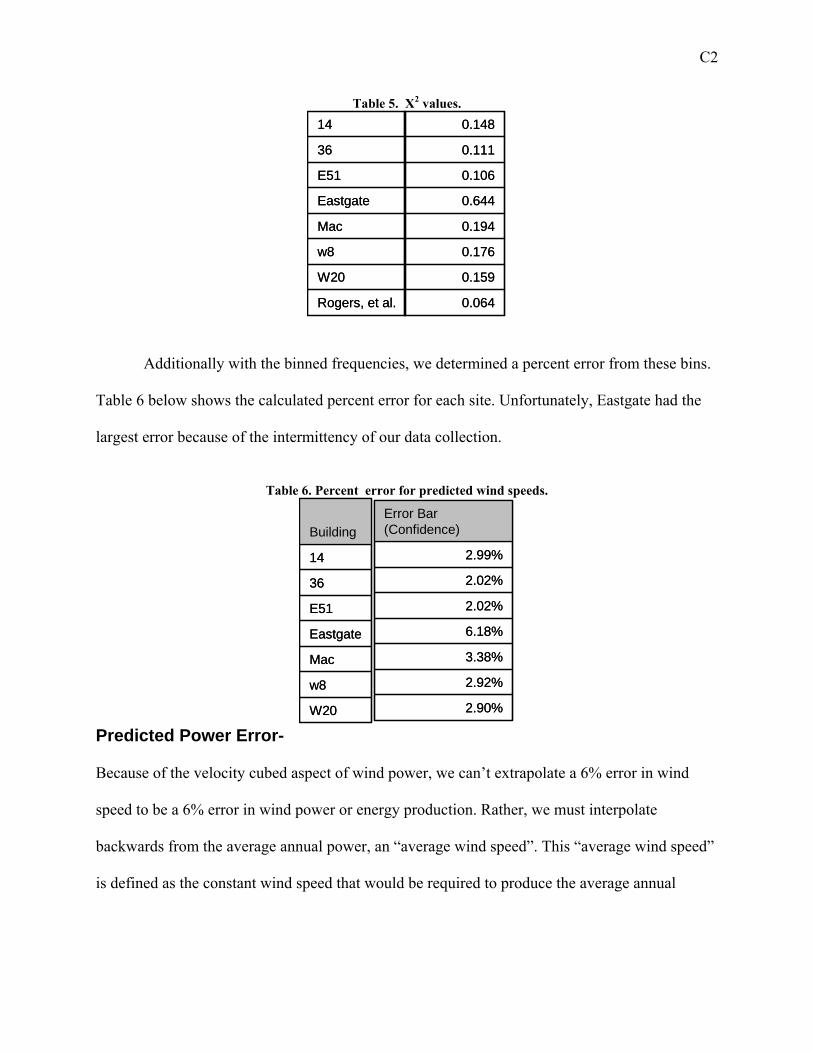
Additionally with the binned frequencies, we determined a percent error from these bins.
Table 6 below shows the calculated percent error for each site. Unfortunately, Eastgate had the
largest error because of the intermittency of our data collection.
Table 6. Percent error for predicted wind speeds.
2.90%
2.92%
3.38%
6.18%
2.02%
2.02%
2.99%
Error Bar (Confidence)
2.90%
2.92%
3.38%
6.18%
2.02%
2.02%
2.99%
Error Bar (Confidence)
W20
w8
Mac
Eastgate
E51
36
14
Building
W20
w8
Mac
Eastgate
E51
36
14
Building
Predicted Power Error- Because of the velocity cubed aspect of wind power, we can’t extrapolate a 6% error in wind
speed to be a 6% error in wind power or energy production. Rather, we must interpolate
backwards from the average annual power, an “average wind speed”. This “average wind speed”
is defined as the constant wind speed that would be required to produce the average annual
C3
power. From this point on, we will refer to “average wind speed” as AWS’. Just to emphasize,
AWS’ is not that average annual wind speed.
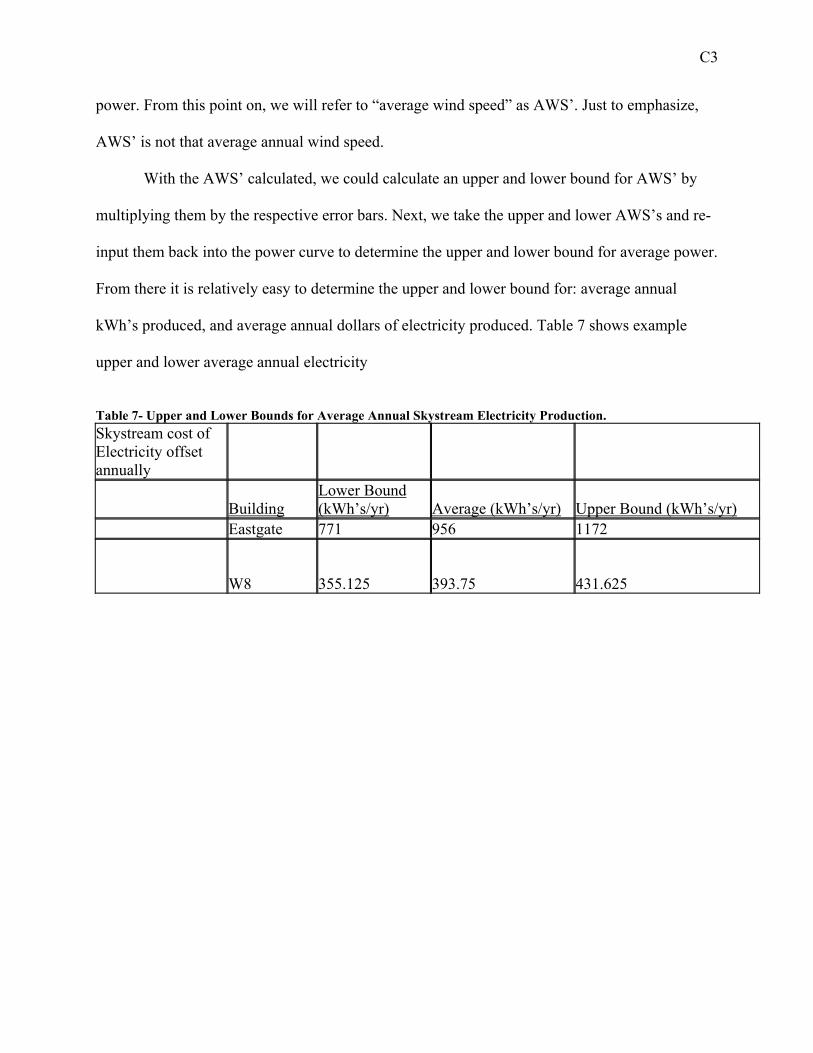
With the AWS’ calculated, we could calculate an upper and lower bound for AWS’ by
multiplying them by the respective error bars. Next, we take the upper and lower AWS’s and re-
input them back into the power curve to determine the upper and lower bound for average power.
From there it is relatively easy to determine the upper and lower bound for: average annual
kWh’s produced, and average annual dollars of electricity produced. Table 7 shows example
upper and lower average annual electricity
Table 7- Upper and Lower Bounds for Average Annual Skystream Electricity Production. Skystream cost of Electricity offset annually
BuildingLower Bound (kWh’s/yr) Average (kWh’s/yr) Upper Bound (kWh’s/yr)
Eastgate 771 956 1172
W8 355.125 393.75 431.625
D1
Appendix D Power, Generation, and Payback Tables
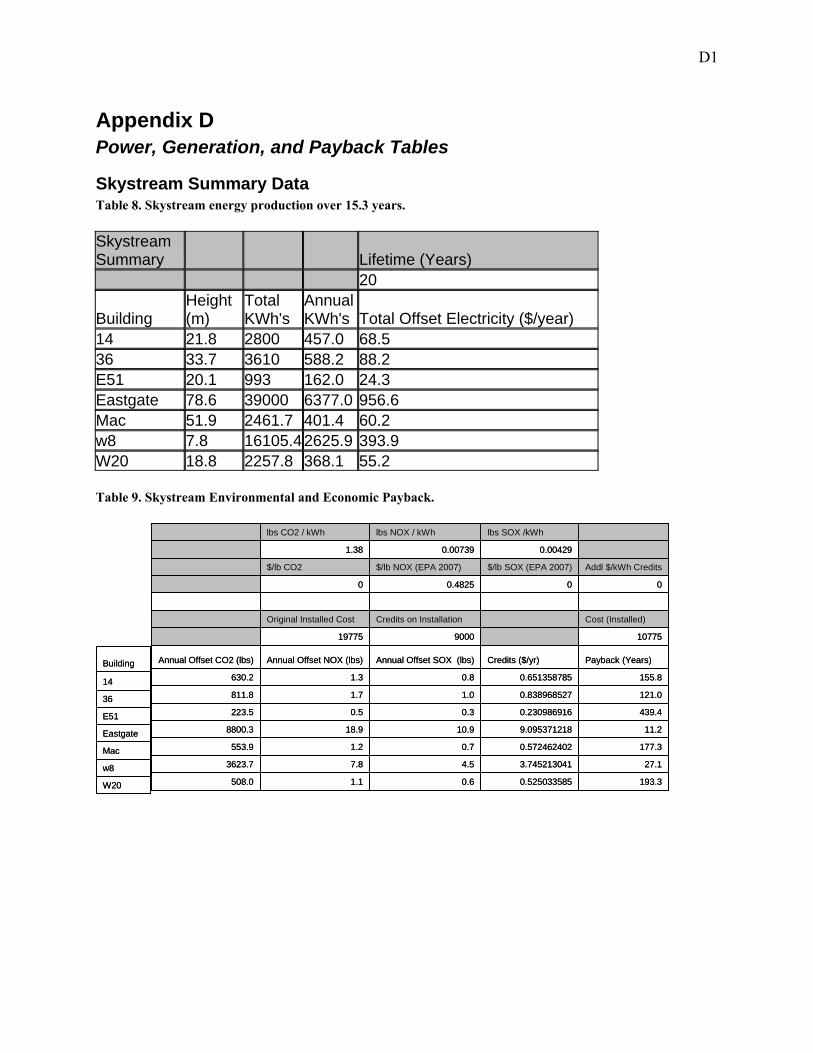
Skystream Summary Data Table 8. Skystream energy production over 15.3 years. Skystream Summary Lifetime (Years) 20
Building Height (m)
Total KWh's
Annual KWh's Total Offset Electricity ($/year)
14 21.8 2800 457.0 68.5 36 33.7 3610 588.2 88.2 E51 20.1 993 162.0 24.3 Eastgate 78.6 39000 6377.0 956.6 Mac 51.9 2461.7 401.4 60.2 w8 7.8 16105.4 2625.9 393.9 W20 18.8 2257.8 368.1 55.2 Table 9. Skystream Environmental and Economic Payback.
193.30.5250335850.61.1508.0
27.13.7452130414.57.83623.7
177.30.5724624020.71.2553.9
11.29.09537121810.918.98800.3
439.40.2309869160.30.5223.5
121.00.8389685271.01.7811.8
155.80.6513587850.81.3630.2
Payback (Years)Credits ($/yr)Annual Offset SOX (lbs)Annual Offset NOX (lbs)Annual Offset CO2 (lbs)
10775900019775
Cost (Installed)Credits on InstallationOriginal Installed Cost
000.48250
Addl $/kWh Credits$/lb SOX (EPA 2007)$/lb NOX (EPA 2007)$/lb CO2
0.004290.007391.38
lbs SOX /kWhlbs NOX / kWhlbs CO2 / kWh
W20
w8
Mac
Eastgate
E51
36
14
Building
W20
w8
Mac
Eastgate
E51
36
14
Building

D2
Table 10. Cost of Electricity Produced (Skystream).
1.40.21.3
0.083.30.91.2
Lifetime $/kWhBuilding1436E51EastgateMacw8W20
AeroVironment Summary Data Table 11. AeroVironment Energy Production over 15.3 years. AV Summary Lifetime (Years) 20
Building Height (m) Total KWh's
Annual KWh's Total Offset Electricity ($/year)
14 21.8 734 287.5 43.1 36 33.7 868 340.0 51.0 E51 20.1 541 211.9 31.8 Eastgate 78.6 4270 1670.6 251 Mac 51.9 710 277.0 41.5 w8 7.8 2100 802.5 120 W20 18.8 606 237.3 35.6 Table 12. AeroVironment Environmental Impact and Payback.
W20
w8
Mac
Eastgate
E51
36
14
Building
W20
w8
Mac
Eastgate
E51
36
14
Building
629.70.10.20.3327.4
186.20.50.61.01107.4
539.50.20.20.3382.2
89.41.01.22.12305.4
705.00.10.20.3292.5
439.50.20.20.4469.2
519.80.20.20.4396.7
Payback timeCredits ($/yr)Annual Offset SOX (lbs)Annual Offset NOX (lbs)Annual Offset CO2 (lbs)
225001200034500
Cost (Installed)Credits on InstallationOriginal Installed Cost
D3
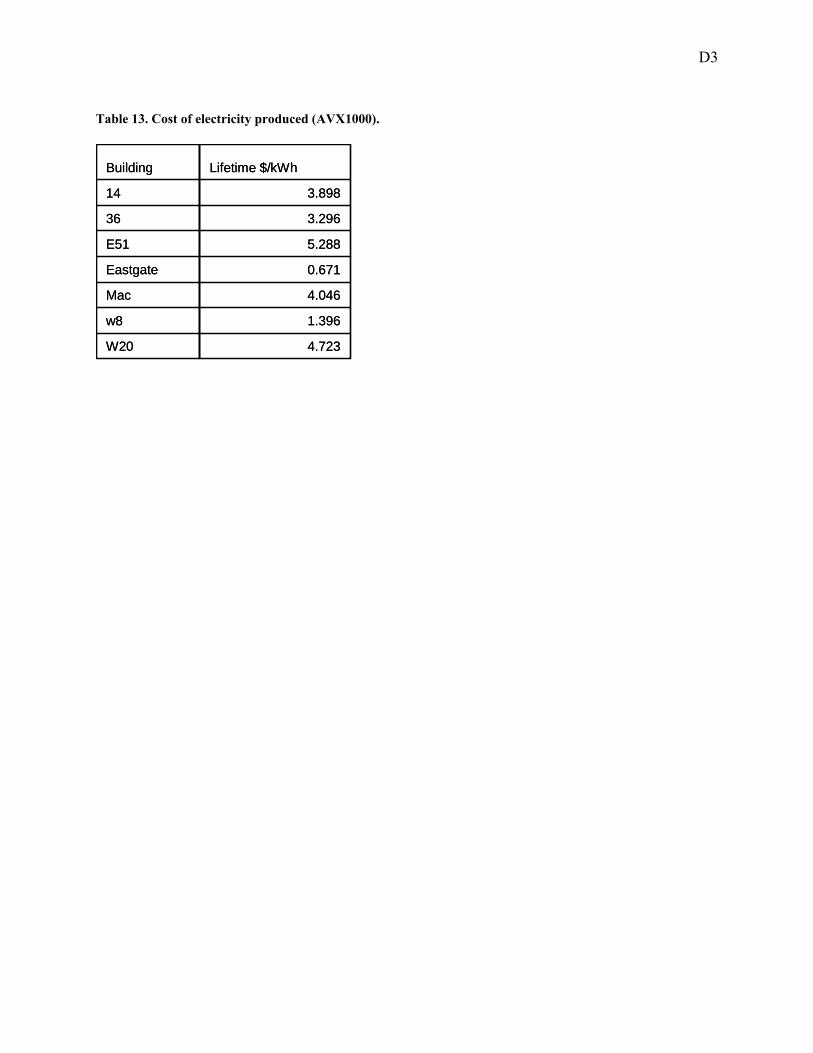
Table 13. Cost of electricity produced (AVX1000).
4.723
1.396
4.046
0.671
5.288
3.296
3.898
Lifetime $/kWh
4.723
1.396
4.046
0.671
5.288
3.296
3.898
Lifetime $/kWh
W20
w8
Mac
Eastgate
E51
36
14
Building
W20
w8
Mac
Eastgate
E51
36
14
Building
E1
Appendix E
Rebates Table 14. MTC Small Scale Renewable Incentives Matrix.51
Table 15. Incentives Matrix for Large/Medium Scale Projects. 52
51 MTC, Small Renewables Initiative, 1. 52 MTC Commercial, Industrial, & Institutional Initiative, 9.
E2
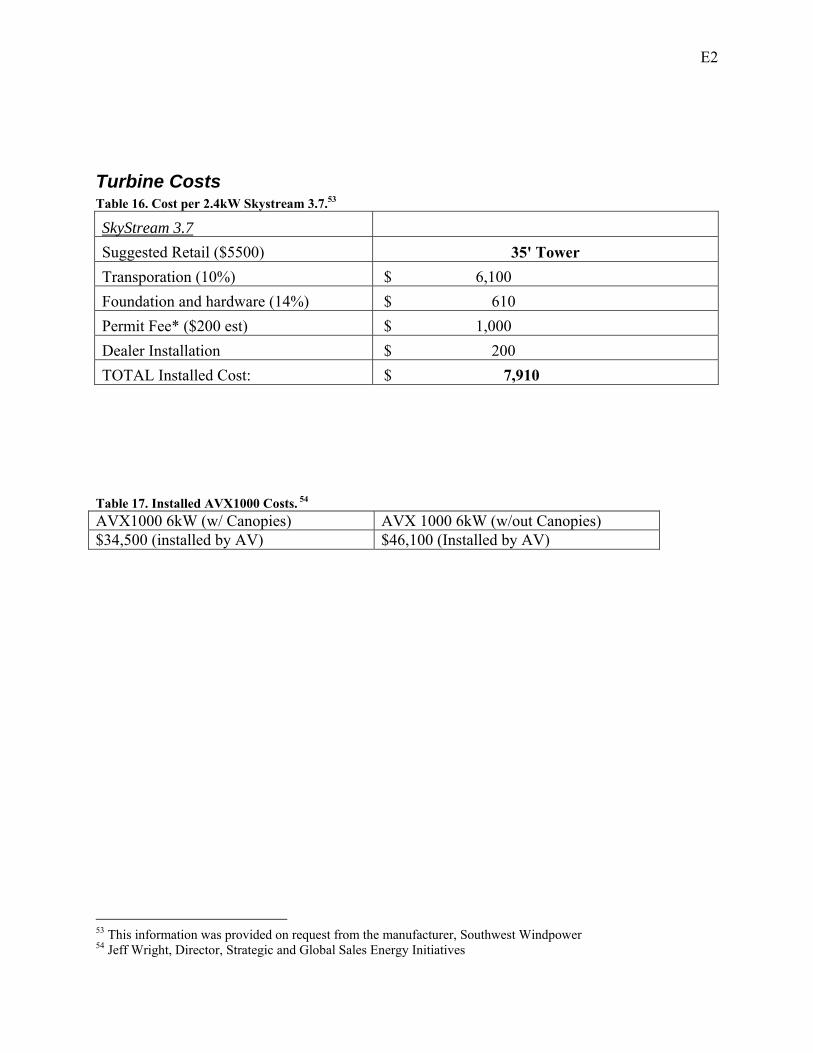
Turbine Costs Table 16. Cost per 2.4kW Skystream 3.7.53
SkyStream 3.7 Suggested Retail ($5500) 35' Tower Transporation (10%) $ 6,100 Foundation and hardware (14%) $ 610 Permit Fee* ($200 est) $ 1,000 Dealer Installation $ 200 TOTAL Installed Cost: $ 7,910
Table 17. Installed AVX1000 Costs. 54
AVX1000 6kW (w/ Canopies) AVX 1000 6kW (w/out Canopies) $34,500 (installed by AV) $46,100 (Installed by AV)
53 This information was provided on request from the manufacturer, Southwest Windpower 54 Jeff Wright, Director, Strategic and Global Sales Energy Initiatives