Embed Size (px)
Citation preview
Energy Flow
Food websPyramids

Classifying Organisms Producer: organisms that can use inorganic
sources to make their own food (e.g. plants) Consumer: organisms that eat other organisms to
obtain energy Predator: animals that catch and feed on other
live animals Prey: animals that are hunted and eaten by
others Top carnivore: organism at the top of the food
chain that is not hunted or consumed by another organism
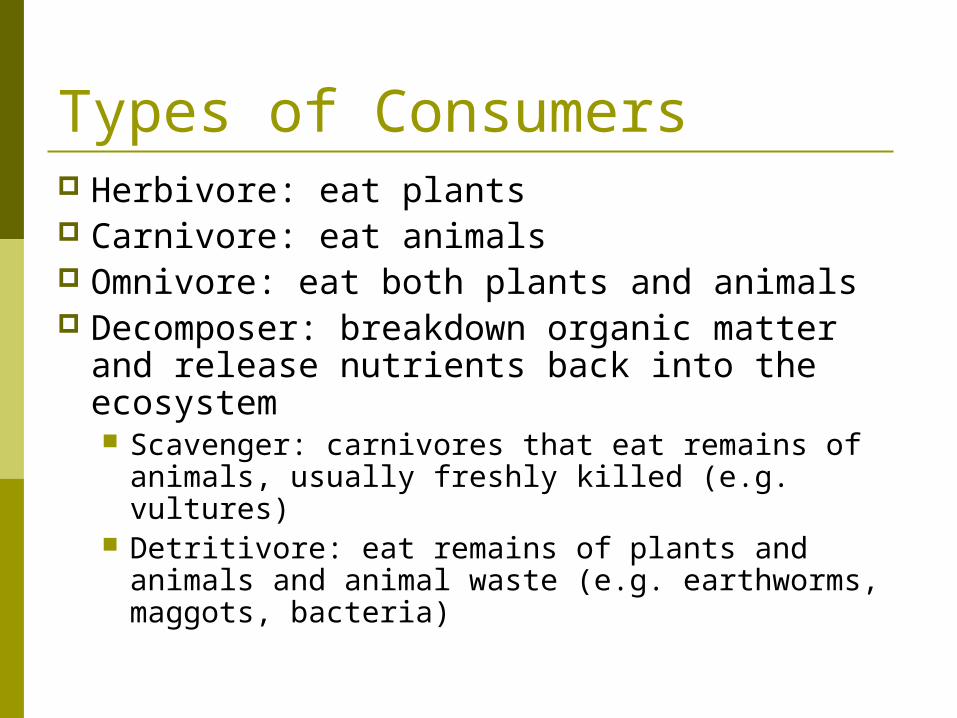
Types of Consumers Herbivore: eat plants Carnivore: eat animals Omnivore: eat both plants and animals Decomposer: breakdown organic matter
and release nutrients back into the ecosystem Scavenger: carnivores that eat remains of
animals, usually freshly killed (e.g. vultures) Detritivore: eat remains of plants and animals
and animal waste (e.g. earthworms, maggots, bacteria)

Energy in Ecosystems The source of all energy is the SUN.
PLANTS use the suns energy to make food. Most of the sun’s energy never reaches
the Earth’s surface but is reflected or absorbed by gases in the upper atmosphere.
Of the energy that reaches the lower atmosphere, 30% is reflected by clouds or Earth’s surface and 70% is absorbed.
Greenhouse gases allow energy from sun to enter but prevent energy from leaving.

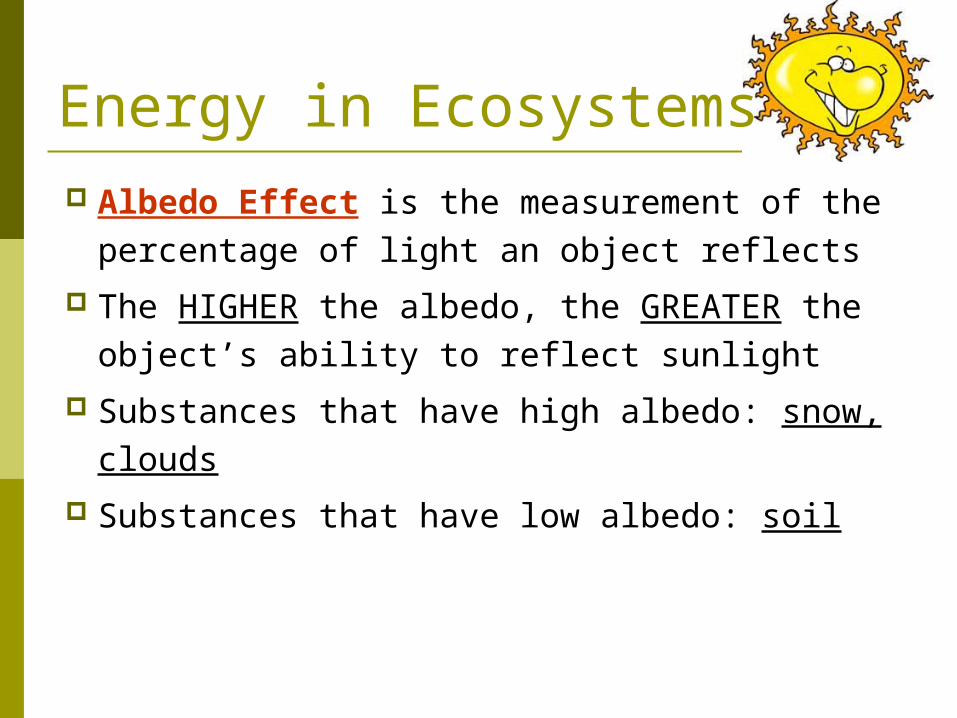
Energy in Ecosystems Albedo Effect is the measurement of the
percentage of light an object reflects
The HIGHER the albedo, the GREATER the object’s ability to reflect sunlight
Substances that have high albedo: snow, clouds
Substances that have low albedo: soil

Energy Movement Food chains show
simple feeding relationships
Food chains do not exist in nature
Food webs are a number of interconnecting food chains
Even food webs aren’t accurate
http://www.geographyalltheway.com/ib_geography/ib_ecosystems/imagesetc/food_web.gif
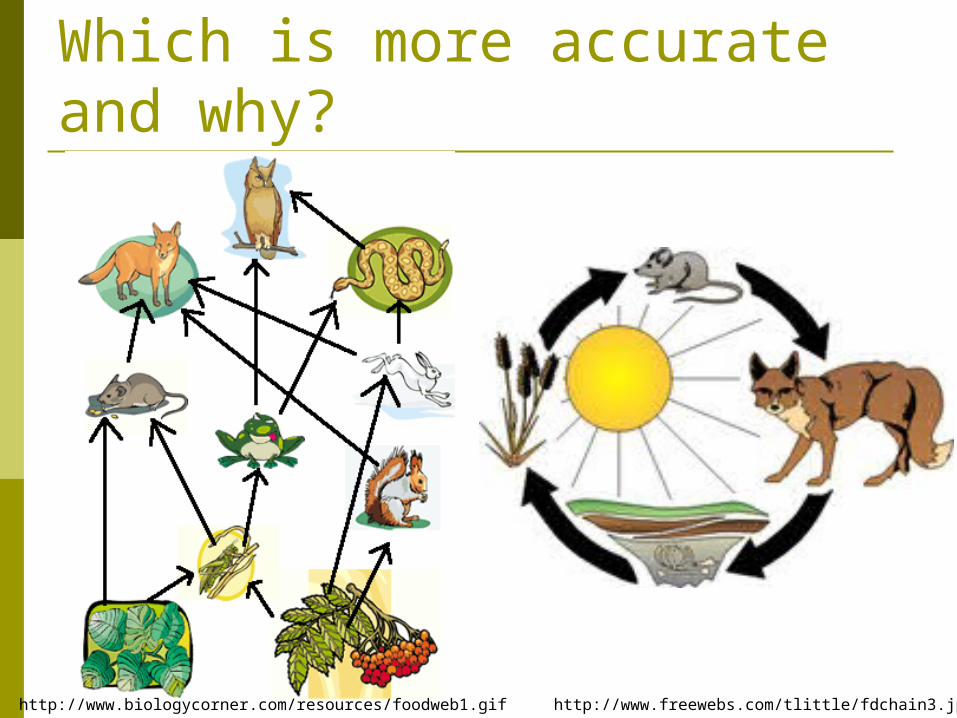
Which is more accurate and why?
http://www.freewebs.com/tlittle/fdchain3.jpghttp://www.biologycorner.com/resources/foodweb1.gif

Trophic Levels Trophic levels: feeding levels that describe the
position of an organism along a food chain 1st trophic levels always contain producers 2nd trophic levels contain herbivores 3rd trophic levels contain consumers that eat herbivores
Classification of organisms at the trophic levels Primary consumer: eats producers Secondary consumer: eats primary consumers Tertiary consumer: eats secondary consumer
An organism can change its trophic level depending on the food chain

Trophic Levels
http://pack152.net/AcademicsAndSports/WildlifeConservation/FoodChain.gif
http://www.zoomschool.com/subjects/foodchain/samplefoodchains.GIF

Different Forms of Energy Sound, solar, kinetic, potential, thermal, electric,
nuclear energy
Laws of Thermodynamics
Thermodynamics is the study of energy transformations
First Law: Energy can be transformed (changed) from one form to another but it cannot be created or destroyed
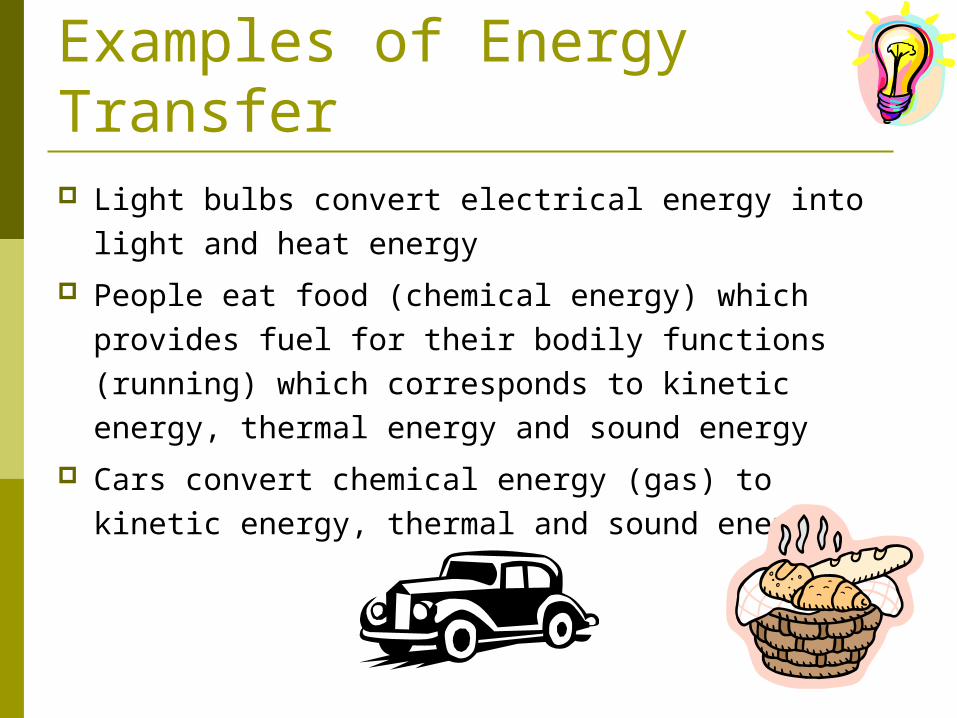
Examples of Energy Transfer Light bulbs convert electrical energy into light and
heat energy
People eat food (chemical energy) which provides fuel for their bodily functions (running) which corresponds to kinetic energy, thermal energy and sound energy
Cars convert chemical energy (gas) to kinetic energy, thermal and sound energy
Energy Loss There is always a loss of energy with each
level because: some energy is released to the environment as
thermal energy (heat) not all parts of an organism is eaten
Only about 10% of energy taken in by an individual is passed onto the next level
Organisms at the highest trophic levels have less energy available to them than species at the bottom

Laws of Thermodynamics
Second Law: During any energy transfer, some energy is lost because it is converted to an unusable form such as heat

Ecological Pyramids Displays relationships between trophic
levels in an ecosystem Three types of ecological pyramids:
Energy Numbers Biomass
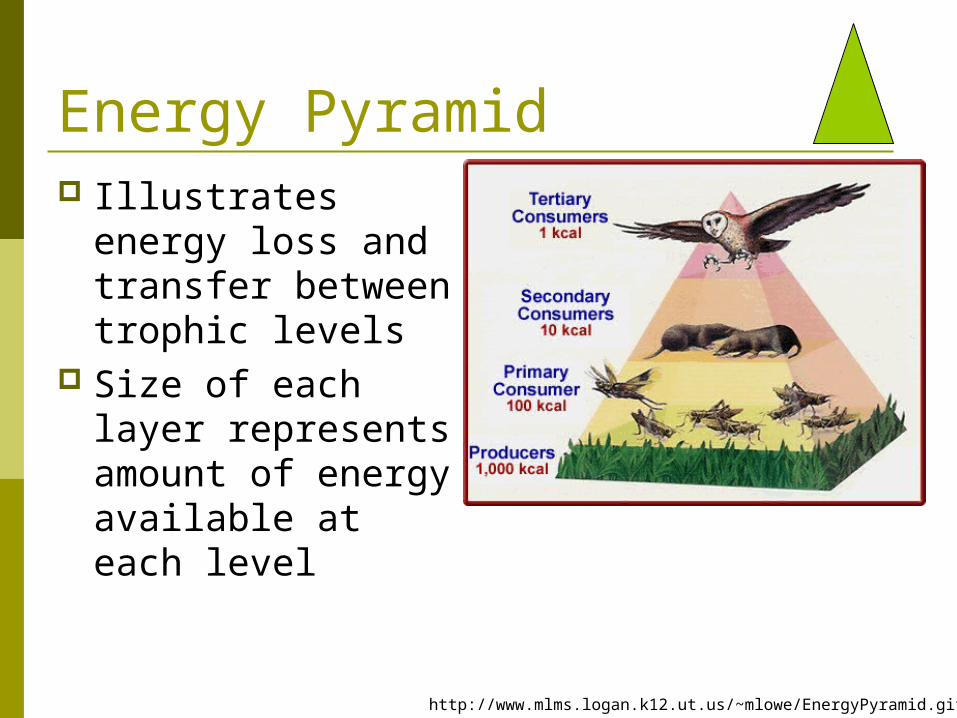
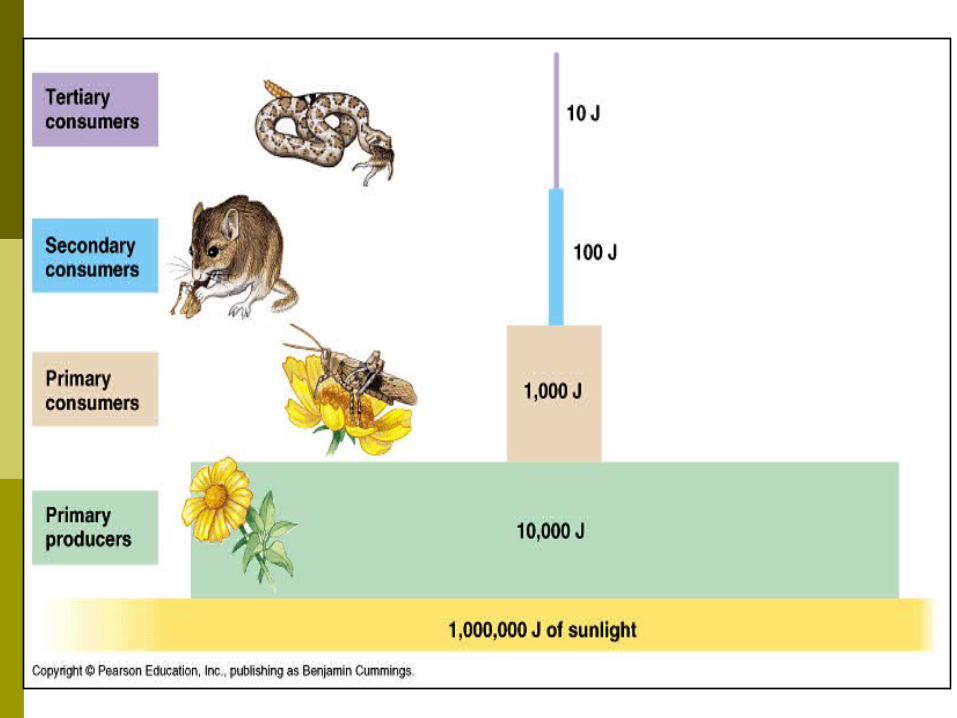
Energy Pyramid Illustrates energy
loss and transfer between trophic levels
Size of each layer represents amount of energy available at each level
http://www.mlms.logan.k12.ut.us/~mlowe/EnergyPyramid.gif
Pyramids of energy are difficult to measure because it is hard to measure the amount of energy in an organism without killing the organism.
Energy is measured using kilojoules (kJ)
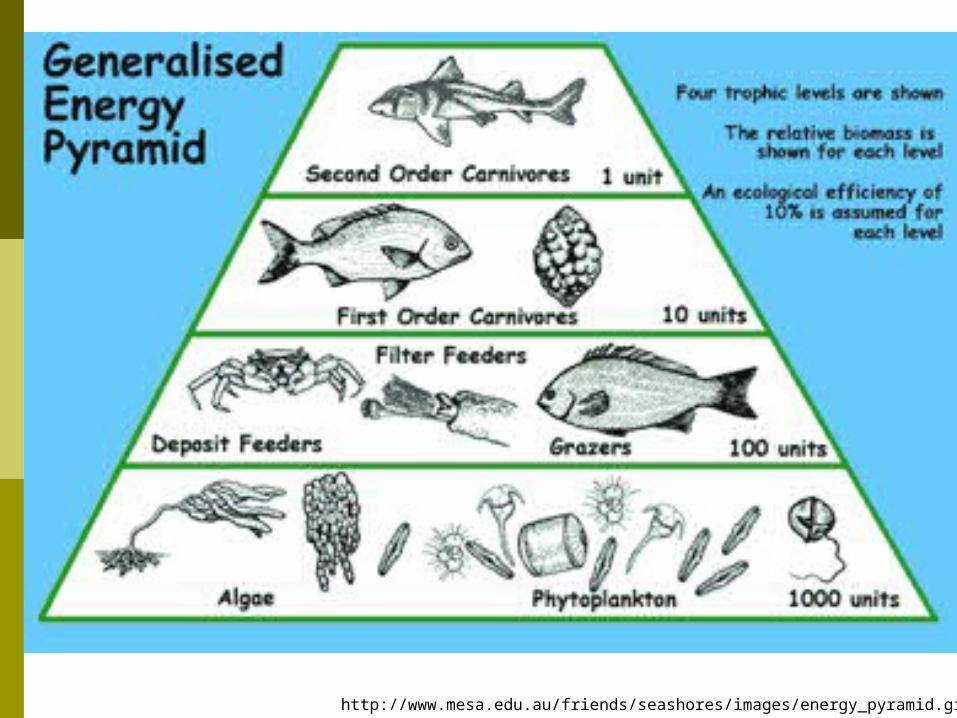
http://www.mesa.edu.au/friends/seashores/images/energy_pyramid.gif

Pyramid of Numbers illustrates the number of organisms at
each trophic level As the trophic levels increase the number
of organisms often decrease Example: grass mouse fox
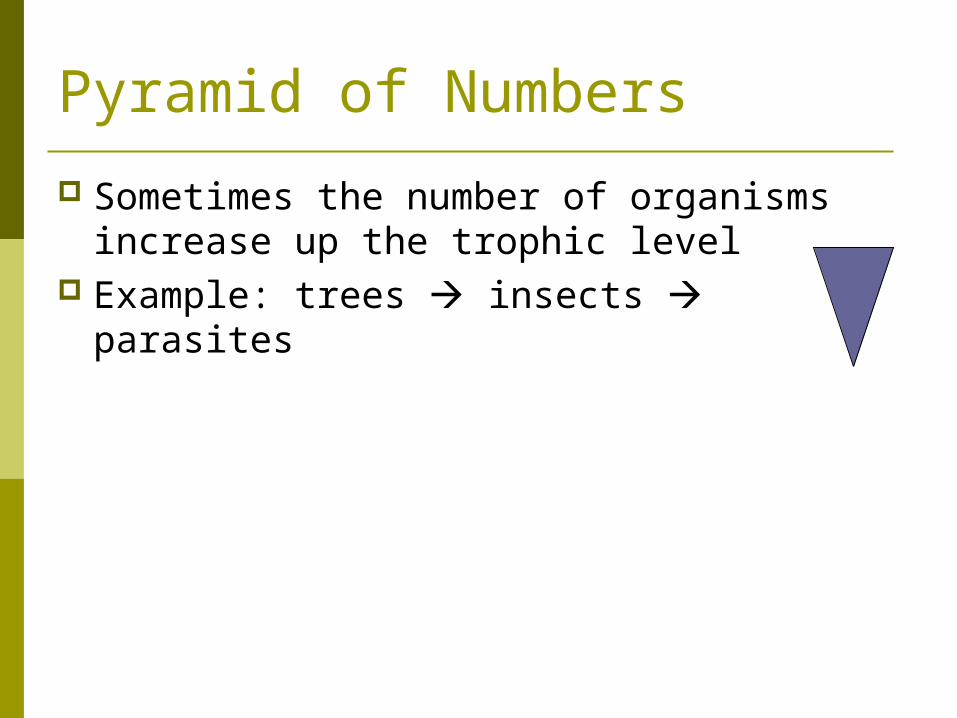
Pyramid of Numbers
Sometimes the number of organisms increase up the trophic level
Example: trees insects parasites
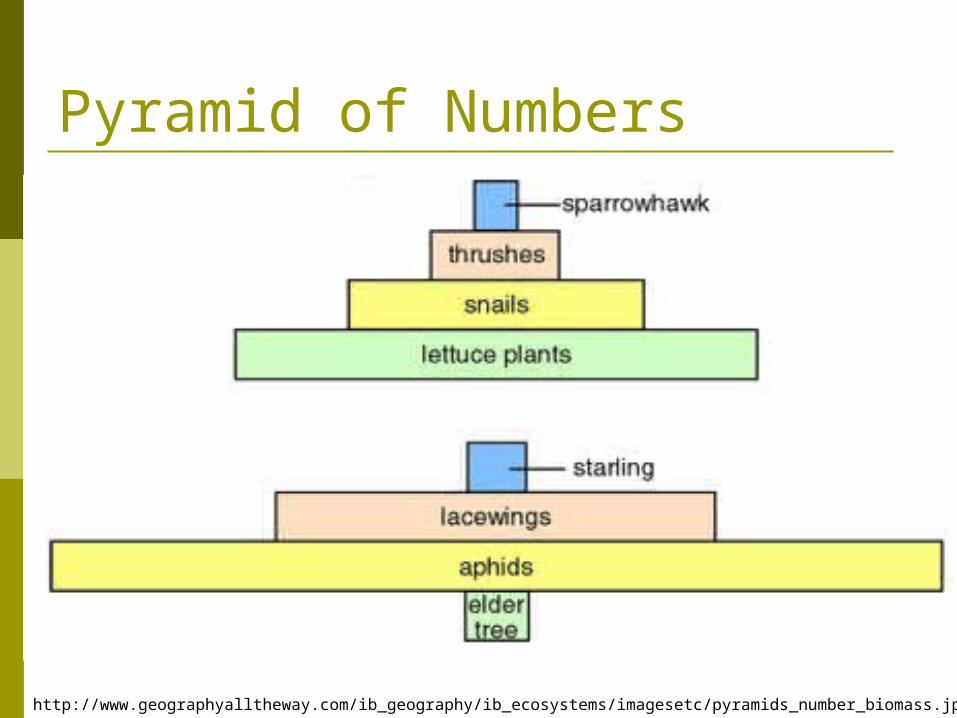
Pyramid of Numbers
http://www.geographyalltheway.com/ib_geography/ib_ecosystems/imagesetc/pyramids_number_biomass.jpg

Biomass Pyramid Biomass is the dry mass of an organism
after water is removed from its tissues Pyramid illustrates the total mass of
individuals at each trophic level
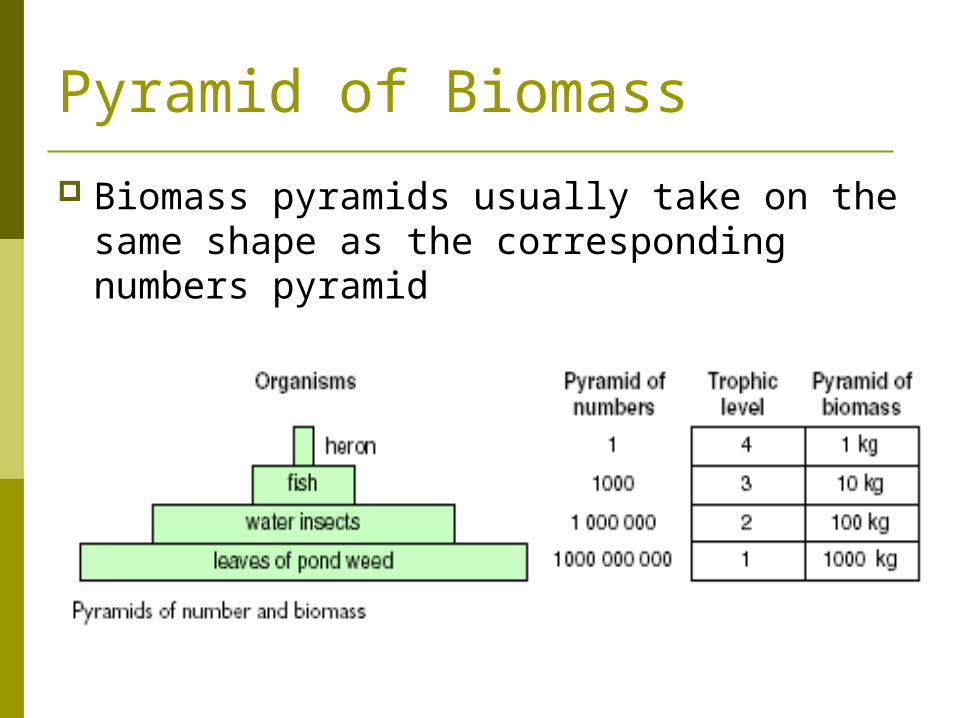
Pyramid of Biomass
Biomass pyramids usually take on the same shape as the corresponding numbers pyramid

Some Exceptions Comparing Pyramids: number vs biomass

Characteristics being
compared
Hunter-Gatherer Agricultural Revolution
Industrial Revolution
Food supply Collected edible plants and hunted animals.
Social Structure
Small groups, little population growth because of limited resources.
Energy consumption and impact
on surrounding ecosystems
Low energy demands on the ecosystem because of nomadic lifestyle which allowed ecosystems to recover after groups moved to new area.

Characteristics being
compared
Hunter-Gatherer Agricultural Revolution
Industrial Revolution
Food supply Collected edible plants and hunted animals.
Plants and animals were domesticated.
Social Structure
Small groups, little population growth because of limited resources.
Shift from nomadic lifestyle to farming. Greater population growth.
Energy consumption and impact
on surrounding ecosystems
Low energy demands on the ecosystem because of nomadic lifestyle which allowed ecosystems to recover after groups moved to new area.
Trees were cut to make houses and create farmland. Greater demand for energy and water to run the farms.

Characteristics being
compared
Hunter-Gatherer Agricultural Revolution
Industrial Revolution
Food supply Collected edible plants and hunted animals.
Plants and animals were domesticated.
Farming resulted in even greater food production.
Social Structure
Small groups, little population growth because of limited resources.
Shift from nomadic lifestyle to farming. Greater population growth.
Population continues to grow and cities thrive.
Energy consumption and impact
on surrounding ecosystems
Low energy demands on the ecosystem because of nomadic lifestyle which allowed ecosystems to recover after groups moved to new area.
Trees were cut to make houses and create farmland. Greater demand for energy and water to run the farms.
Even greater demand for energy to run machines. More damaging for the environment.

Gizmo www.explorelearning.com Grade 9-12 biology Ecology and interdependence Food chain