Embed Size (px)
Citation preview
Energy Flow & Nutrient CycleEnergy Flow & Nutrient Cycle
Big bugs have little bugs upon their backs to bite ‘em
Little bugs have lesser ones an so ad infinitum.
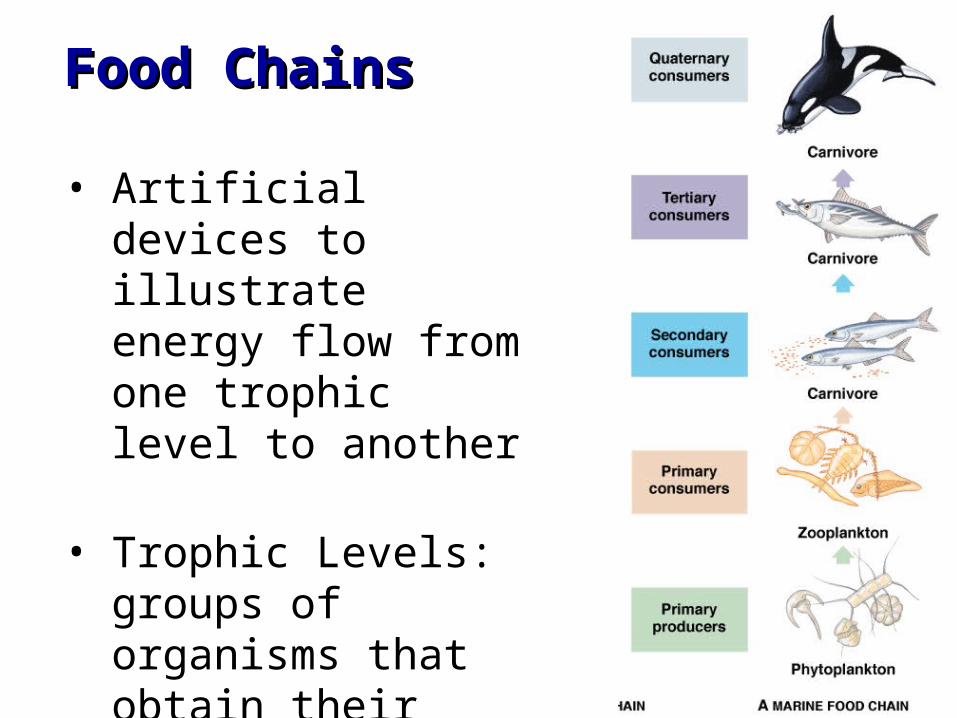
Food ChainsFood Chains
• Artificial devices to illustrate energy flow from one trophic level to another
• Trophic Levels: groups of organisms that obtain their energy in a similar manner
• Total number of levels in a food chain depends upon locality and number of species
• Highest trophic levels occupied by adult animals with no predators of their own
• Secondary Production: total amount of biomass produced in all higher trophic levels
Food ChainsFood Chains
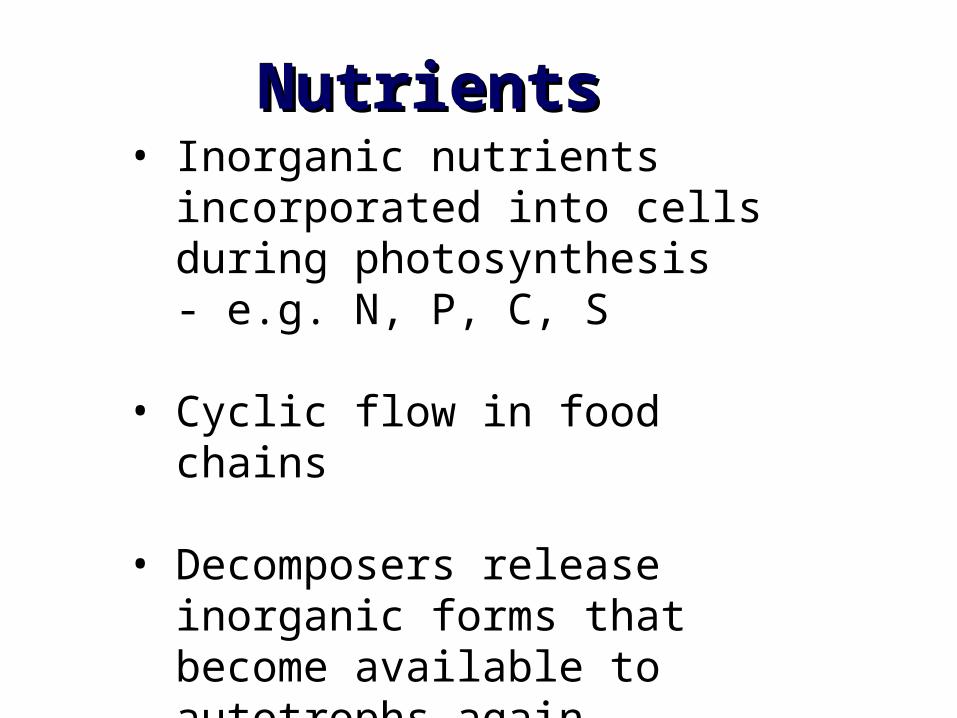
NutrientsNutrients• Inorganic nutrients incorporated
into cells during photosynthesis- e.g. N, P, C, S
• Cyclic flow in food chains
• Decomposers release inorganic forms that become available to autotrophs again
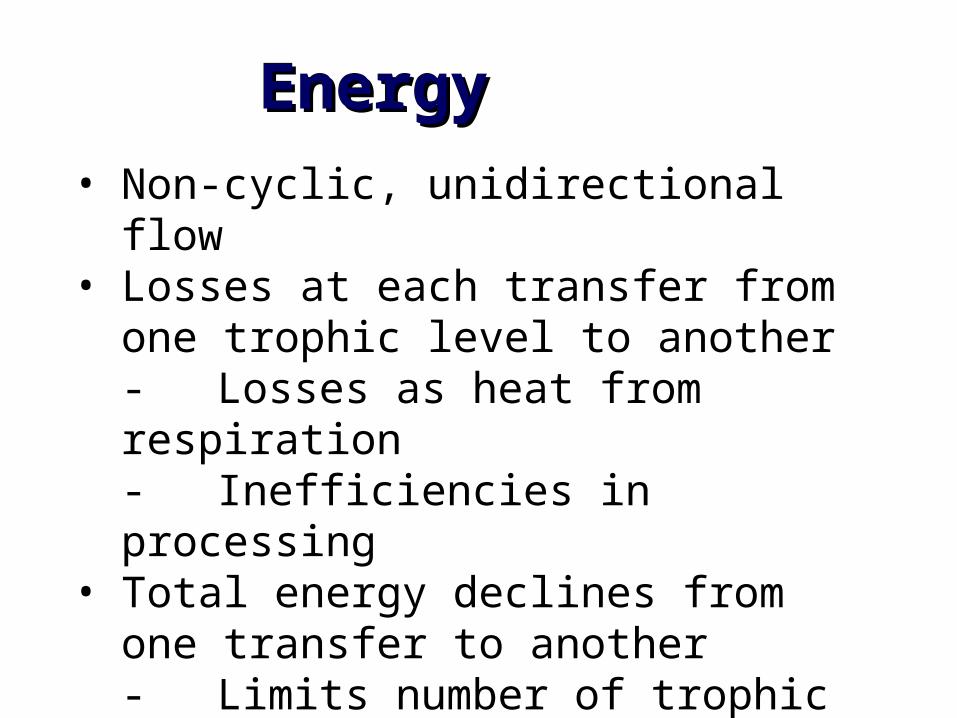
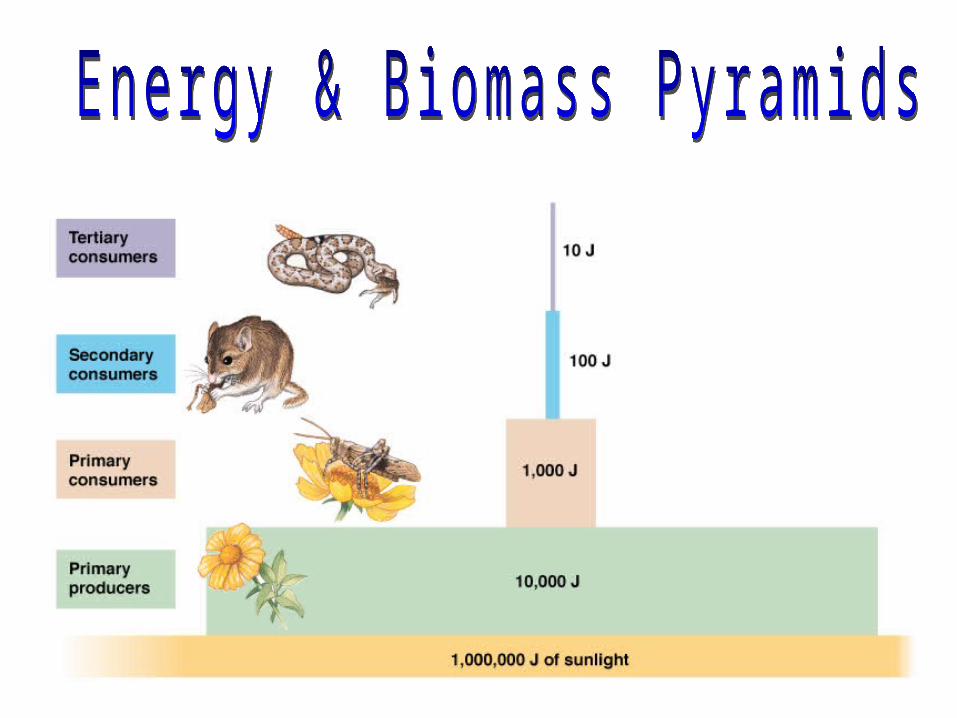
EnergyEnergy• Non-cyclic, unidirectional flow• Losses at each transfer from one
trophic level to another- Losses as heat from respiration- Inefficiencies in processing
• Total energy declines from one transfer to another- Limits number of trophic levels
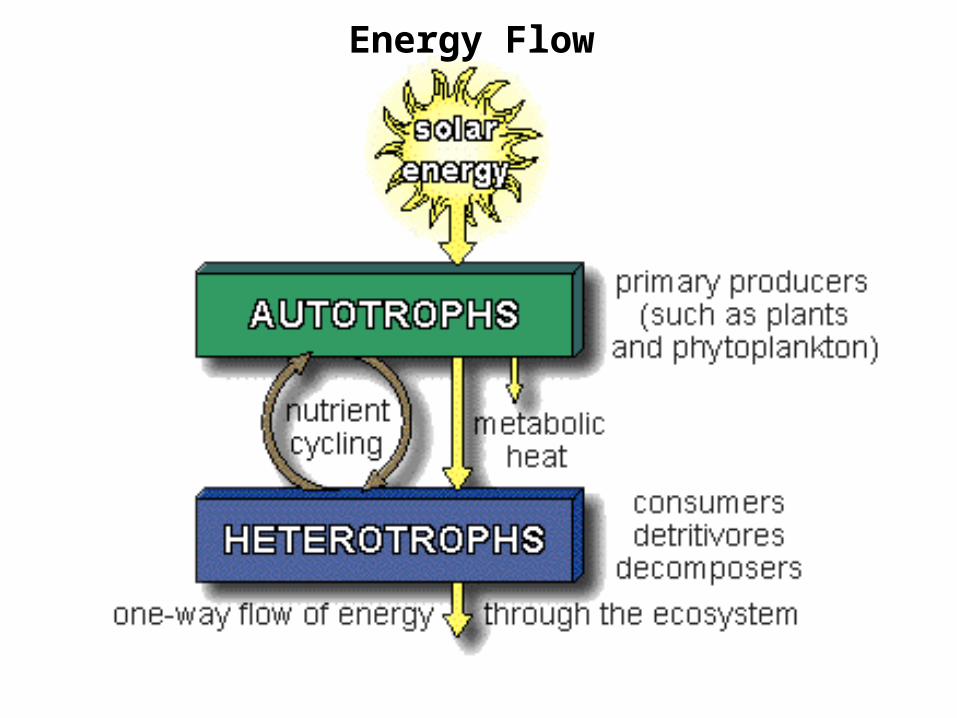
Energy Flow
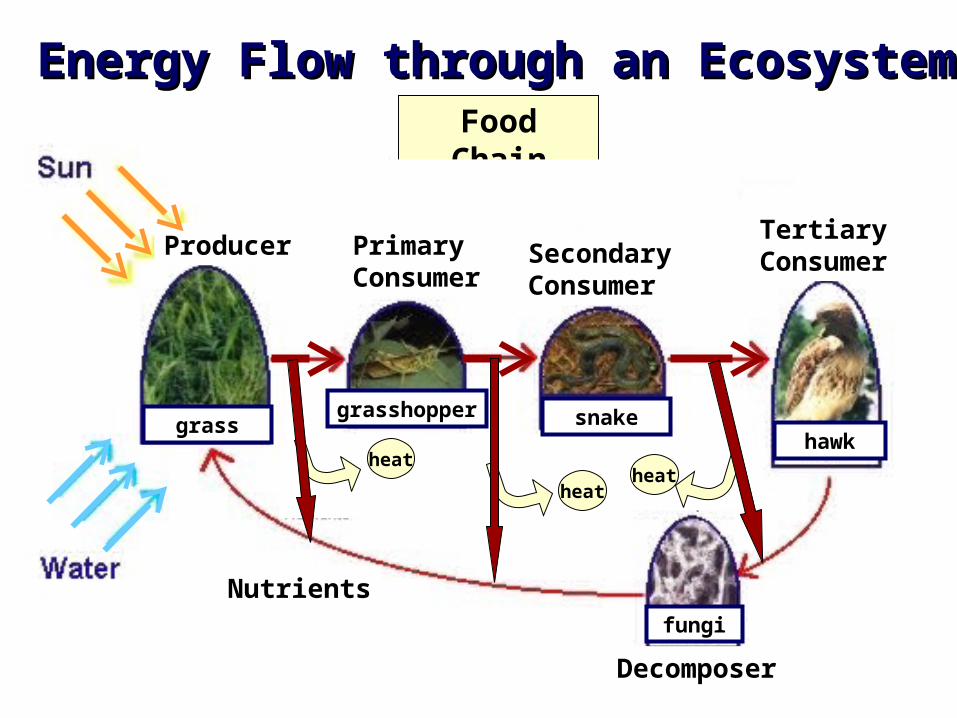
Producer Primary Consumer
Secondary Consumer
Tertiary Consumer
Food Chain
Nutrients
Decomposer
grassgrasshopper snake
hawk
fungi
Energy Flow through an EcosystemEnergy Flow through an Ecosystem
heatheat
heat
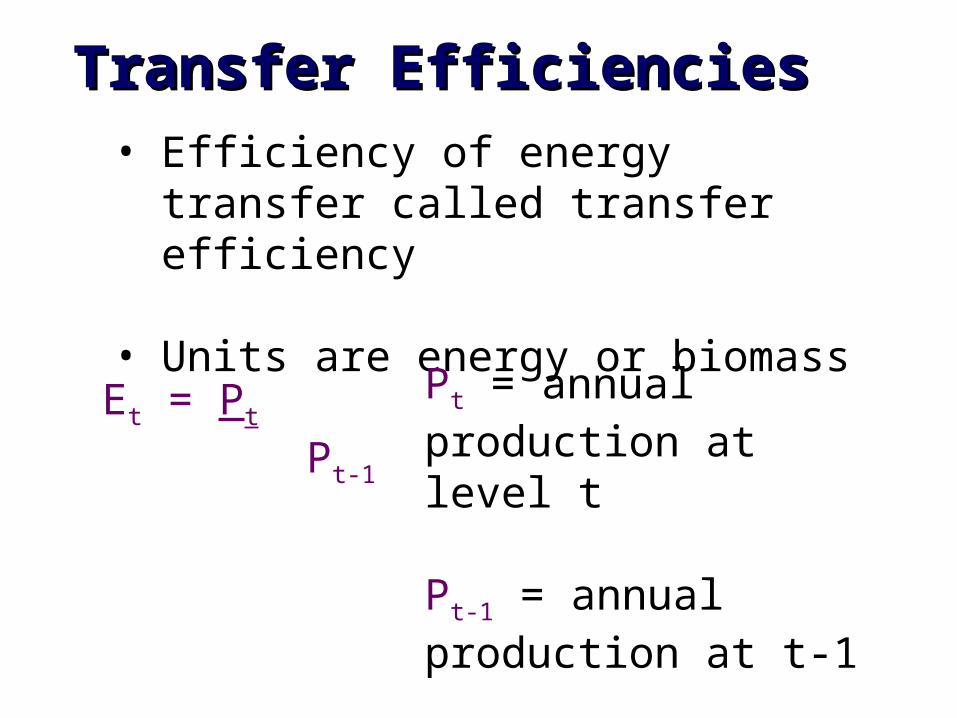
Transfer EfficienciesTransfer Efficiencies• Efficiency of energy transfer called
transfer efficiency
• Units are energy or biomass
Et = Pt
Pt-1
Pt = annual production at level t
Pt-1 = annual production at t-1
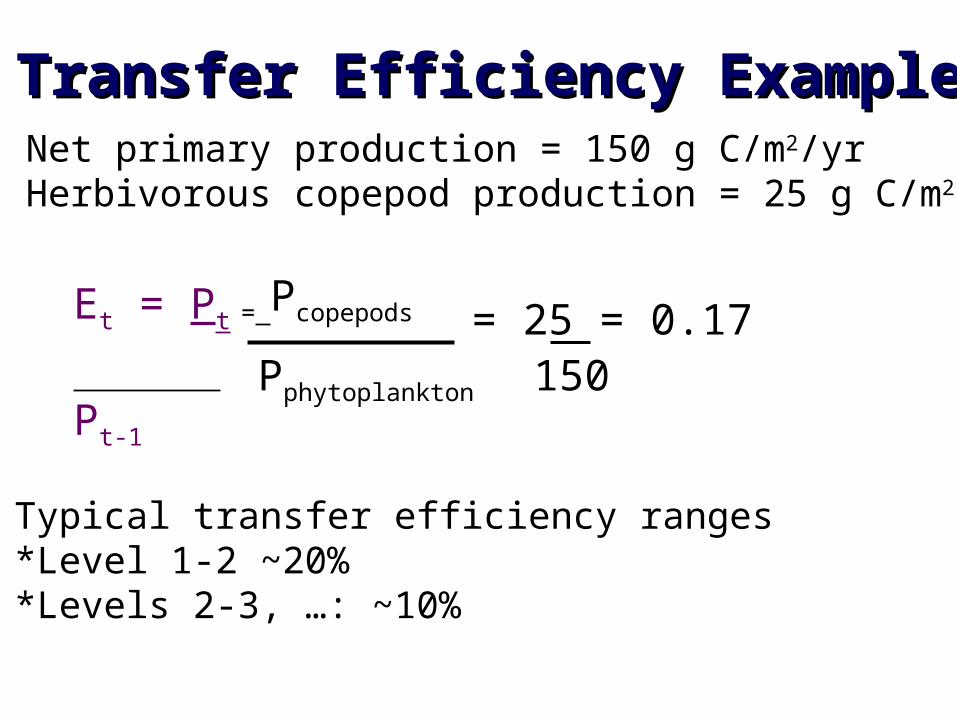
Transfer Efficiency ExampleTransfer Efficiency Example• Net primary production = 150 g C/m2/yr• Herbivorous copepod production = 25 g C/m2/yr
• Typical transfer efficiency ranges*Level 1-2 ~20%*Levels 2-3, …: ~10%
Et = Pt
Pt-1
= Pcopepods
Pphytoplankton
= 25 = 0.17150

Feces
Growth
CellularRespiration
Food WebsFood Webs
• Food chains don’t exist in real ecosystems
• Almost all organisms are eaten by more than one predator
• Food webs reflect these multiple and shifting interactions
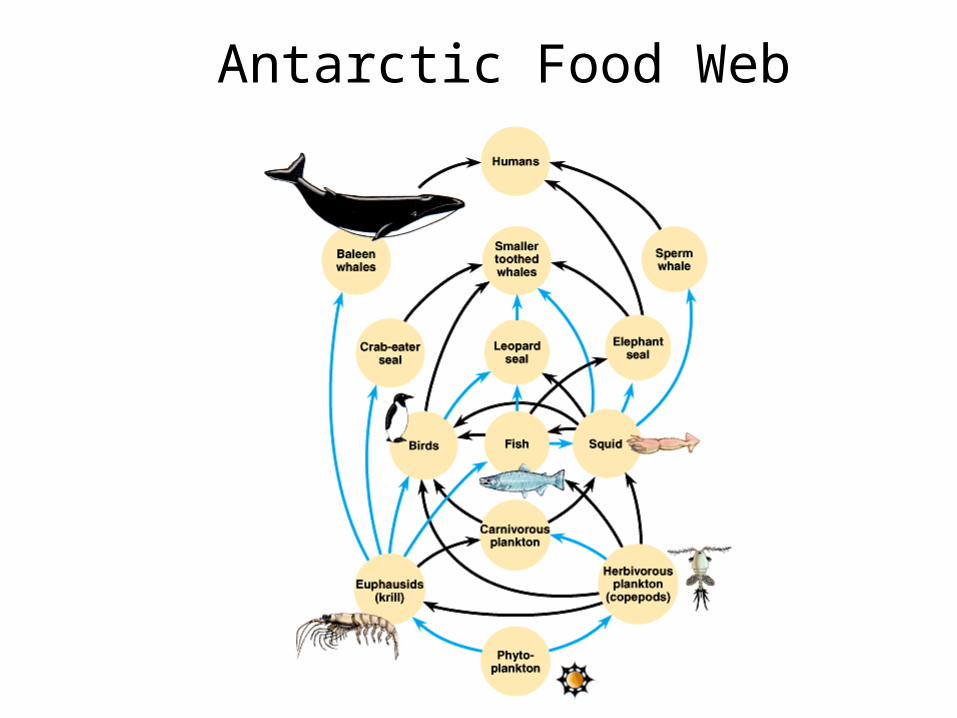
Antarctic Food Web
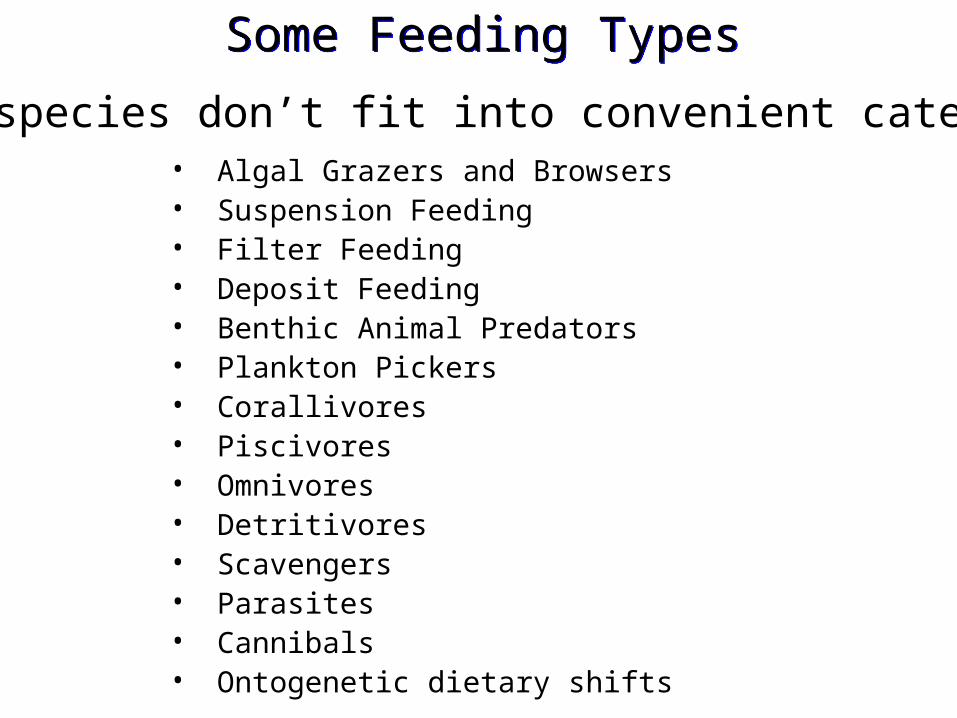
Some Feeding TypesSome Feeding Types
Many species don’t fit into convenient categories• Algal Grazers and Browsers• Suspension Feeding• Filter Feeding• Deposit Feeding• Benthic Animal Predators• Plankton Pickers• Corallivores• Piscivores• Omnivores• Detritivores• Scavengers• Parasites• Cannibals• Ontogenetic dietary shifts
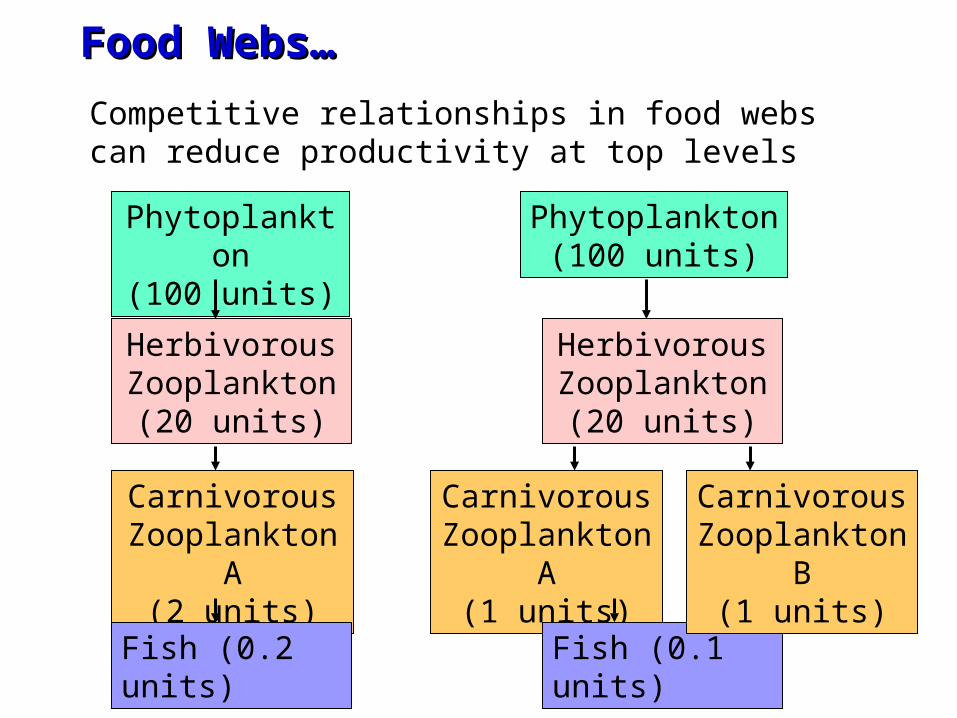
Food Webs…Food Webs…
Competitive relationships in food webs can reduce productivity at top levels
Phytoplankton(100 units)
Phytoplankton(100 units)
Herbivorous Zooplankton
(20 units)
Carnivorous Zooplankton A
(2 units)
Fish (0.2 units)
Herbivorous Zooplankton
(20 units)
Carnivorous Zooplankton A
(1 units)
Fish (0.1 units)
Carnivorous Zooplankton B
(1 units)
Recycling: The Microbial LoopRecycling: The Microbial Loop
• All organisms leak and excrete dissolved organic carbon (DOC)
• Bacteria can utilize DOC• Bacteria abundant in the euphotic
zone (~5 million/ml)• Numbers controlled by grazing due to
nanoplankton• Increases food web efficiency
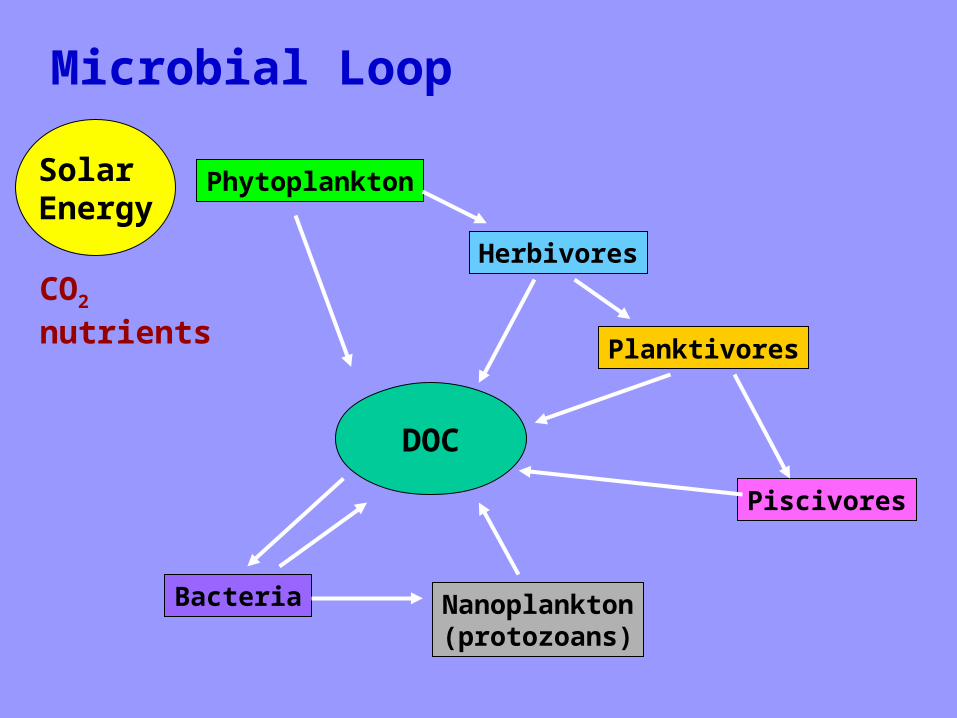
Solar Energy
Microbial Loop
CO2
nutrients
Phytoplankton
Herbivores
Planktivores
Piscivores
DOC
Bacteria Nanoplankton(protozoans)
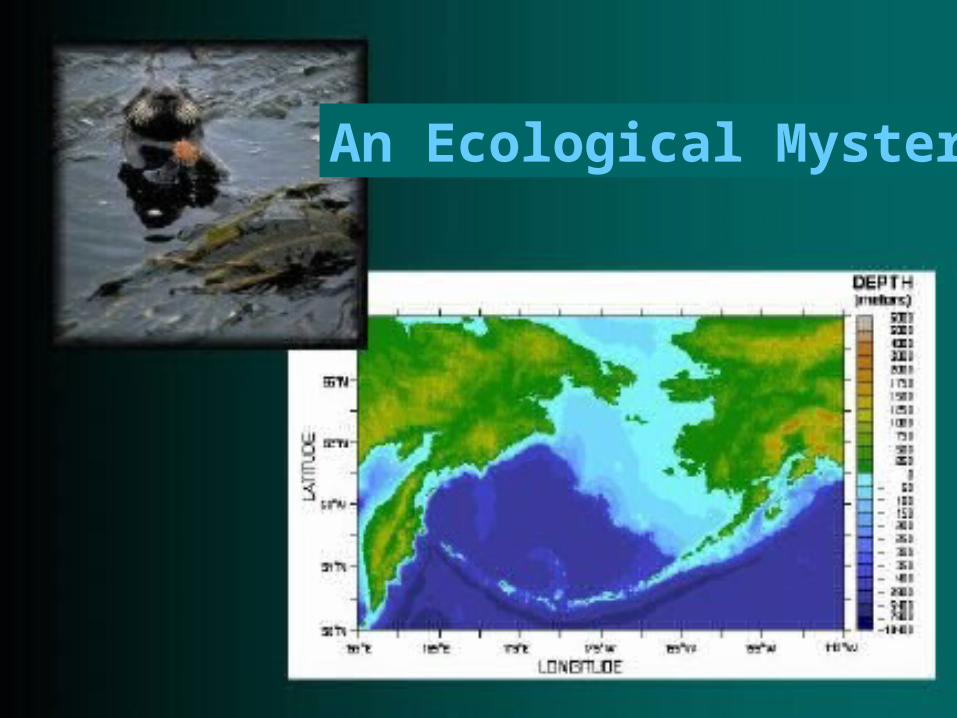
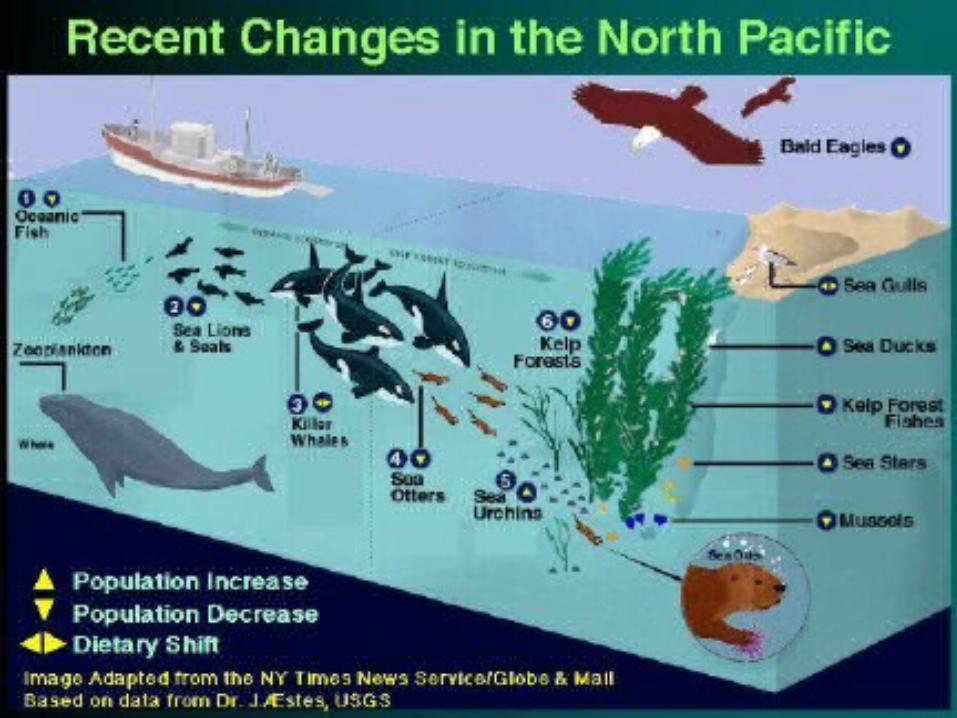
An Ecological Mystery
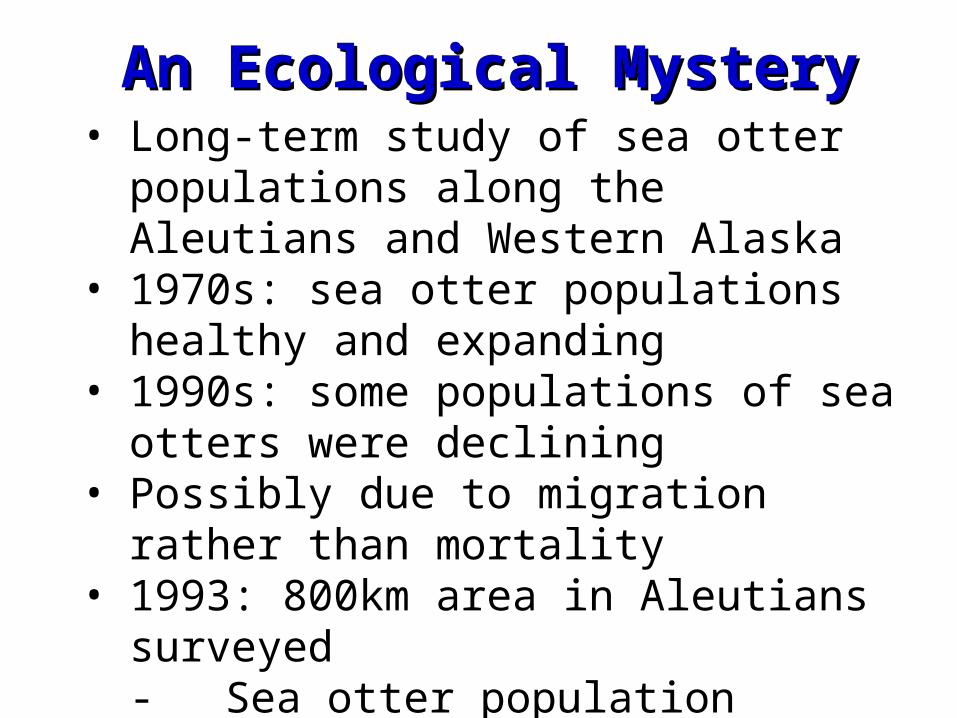
An Ecological MysteryAn Ecological Mystery• Long-term study of sea otter populations
along the Aleutians and Western Alaska• 1970s: sea otter populations healthy and
expanding• 1990s: some populations of sea otters
were declining• Possibly due to migration rather than
mortality• 1993: 800km area in Aleutians surveyed
- Sea otter population reduced by 50%
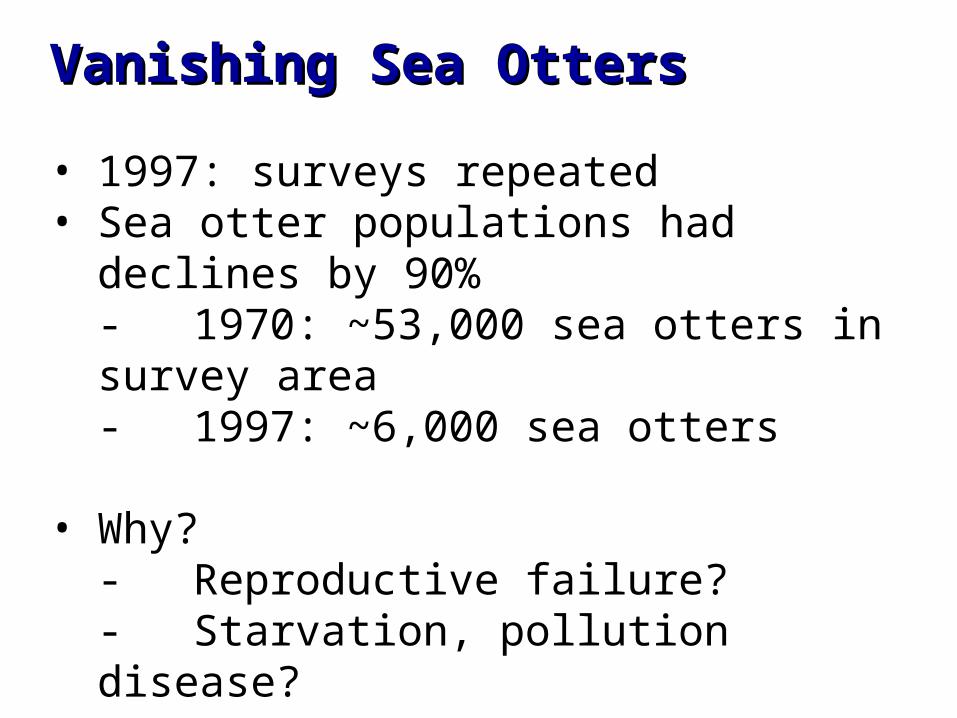
Vanishing Sea OttersVanishing Sea Otters
• 1997: surveys repeated• Sea otter populations had declines by 90%
- 1970: ~53,000 sea otters in survey area- 1997: ~6,000 sea otters
• Why?- Reproductive failure?- Starvation, pollution disease?
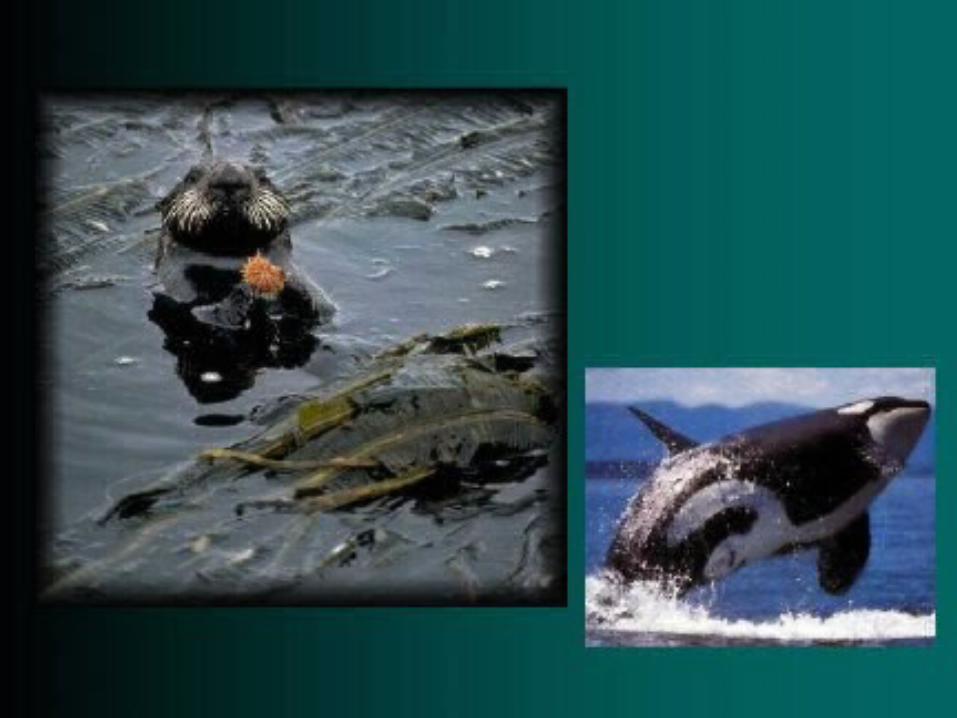
Cause of the DeclineCause of the Decline• 1991: one researcher observed an orca
eating a sea otter• Sea lions and seals are normal prey for
orcas• Clam Lagoon inaccessible to orcas- no
decline• Decline in usual prey led to a switch to sea
otters• As few as 4 orcas feeding on otters could
account on the impact- Single orca could consume 1,825 otters/year