Embed Size (px)
Citation preview
Article
Energy Flows and Carbon Footprint in theForestry-Pulp and Paper Industry
Qingjian Zhao 1,2,* , Sheng Ding 1, Zuomin Wen 1 and Anne Toppinen 3
1 College of Economics and Management, Nanjing Forestry University, Nanjing 210037, China2 Faculty of Forestry, University of Toronto, Toronto, ON M5S 3H7, Canada3 Department of Forest Sciences, University of Helsinki, 00014 Helsinki, Finland* Correspondence: [email protected]; Tel.: +86-138-5170-2610
Received: 15 July 2019; Accepted: 17 August 2019; Published: 23 August 2019
Abstract: In the context of global climate change, energy conservation and greenhouse effect gases(GHG) reduction are major challenges to mankind. The forestry-pulp and paper industry is a typicalhigh energy consumption and high emission industry. We conducted in-depth research on the energyflows and carbon footprint of the forestry-pulp paper industry. The results show that: (1) The mainsources of energy supply include external fossil fuel coal and internal biomass fuel black liquor,which supply 30,057,300 GJ and 14,854,000 GJ respectively; in addition, the energy produced bydiesel in material transportation reaches 11,624,256 GJ. (2) The main energy consumption processesinclude auxiliary engineering projects, material transportation, papermaking, alkali recovery, pulpingand other production workshops. The percentages of energy consumption account for 26%, 18%,15%, 10% and 6%, respectively. (3) The main sources of carbon include coal and forest biomass,reaching 770,000 tons and 1.39 million tons, respectively. (4) Carbon emissions mainly occur in fuelcombustion in combined heating and power (CHP) and diesel combustion in material transportation,reaching 6.78 million tons and 790,000 tons of carbon, respectively. (5) Based on steam and electricityconsumption, the indirect carbon emissions of various thermal and electric energy production unitswere calculated, and the key energy consumption process units and hotspot carbon flow pathswere further found. This research established a theoretical and methodological basis for energyconservation and emission reduction.
Keywords: forestry-pulp and paper industry; production process; energy flow; carbon footprint;flowchart
1. Introduction
In the context of global climate change, reduction of greenhouse gas emissions is a majorchallenge to mankind [1]. Rapid deep decarbonization requires a profound shift in the socialtechnology system [2,3]. The low-carbon sustainable transformation of social technology systemsrequires high-energy, high-emission industries such as energy, electricity, transportation, forestry andagriculture to achieve low-carbon transformation and innovation-driven development strategies [4].According to the International Energy Agency, global energy consumption in 2018 increased atnearly twice the average rate of growth since 2010, driven by a robust global economy and higherheating and cooling needs in some parts of the world, and as a result of higher energy consumption,CO2 emissions rose 1.7% in 2017 and hit a new record [5]. The large-scale raw material industries,such as forestry-based, chemicals, cement and steel industries, accounts for more than two-thirds oftotal emissions.
The pulp and paper industry converts lignocellulosic materials into pulp and paper products [6–8].The life cycle of forestry-pulp and paper industry products includes multiple process units such
Forests 2019, 10, 725; doi:10.3390/f10090725 www.mdpi.com/journal/forests
Forests 2019, 10, 725 2 of 23
as forest tending, wood harvesting, preparation, pulping, papermaking, product distribution anduse [9,10], with each value added unit consuming a lot of heat and electricity [11]. As the world’sfourth-largest energy-consuming industry, the pulp and paper industry consumes a large amount ofenergy, accounting for about 5% of the world’s total industrial energy consumption, and its carbonemissions account for about 2% of global industrial direct carbon emissions [12].
Most of the on-site production of electricity used in the forestry-pulp and paper industry isgenerated using combined heating and power (CHP) generation units, and a small part is derivedfrom other power generation methods, such as generators that use combustible energy or renewableresources [13,14]. Steam from CHP is used as the main energy source for process heating systems,and electricity is the main source of energy-based machine-driven systems. The forestry industrysector meets a large number of energy needs through on-site power generation (combustion powergeneration and steam power generation), in addition to fossil fuels such as coal, forestry companies usewood residues (e.g., tree bark) and by-products (e.g., black liquor) to self-produce energy. The biomassresources utilized include black liquor from the kraft pulping processes and wood residues collected inthe wood processing and manufacturing, producing steam and electricity to meet a significant portionof the energy needs.
Pulp and paper industry has a variety of different production processes, and energy usage patternsvarying from sector to sector [15]. Even in some sectors, the energy requirements may vary dependingon the technologies. For example, pulp can be manufactured by chemical pulping, mechanical pulpingor a combination of two pulping processes, so that the production process differs greatly from theenergy requirements. Depending on the type of process, the energy used in the production processescan be divided into process heating (e.g., furnaces, ovens, furnaces and ribbon heaters), process cooling,machine drives (e.g., motors and pumps associated with process equipment), electrochemical processes(such as reduction processes) and other direct process applications.
The use of high-intensity energy, the burning and leakage of wood raw materials in the process ofproduct conversion make the pulp and paper industry become a highly polluting and high-emissionindustry [16,17]. The international industrial and business community has also conducted long-termand in-depth research on energy consumption and carbon emissions in the production of forestry, pulpand paper. Technical Association of the Pulp and Paper Industry (TAPPI) promotes the use of emergingmaterials and technologies such as biomass energy and nanotechnology in pulp and paper to reduceenergy consumption and carbon emissions [18]. Confederation of European Paper Industries (CEPI)has begun to develop the 2050 roadmap for moving to a competitive low-carbon economy 2050 [19].By 2050, CEPI aims to: (1) Reduce CO2 emissions by 80% (compared to 1990 levels); (2) reduce energyrequirements by 20% in the wood fiber industry (in 2010 benchmark) and (3) increase product value by50% (based on 2010). In recent years, many studies are working to reduce energy consumption andcarbon emissions in the pulp and paper industry.
Various models of energy consumption and carbon emissions from the forestry-pulp and paperindustries were established. The internationally renowned company Fisher proposes to measure thecarbon footprint using the “cradle to gate” or “cradle to destination” approach to the carbon footprintand corporate carbon emissions measurement of the pulp and paper industry [20]. It involves energyconsumption, factory manufacturing processes, transportation and product consumption. The lifecycle method is also important for studying the energy consumption and carbon emission intensityof pulp (chemical pulp, mechanical pulp and waste pulp) and paper [21,22]. A variety of methodshave been combined to create and visualize bottom-up integrated logistics, energy efficiency andcarbon emissions assessment models [23]. The energy consumption and carbon emissions of thepulp and paper industry in different countries are compared and analyzed and it was found thatthe carbon emissions of the pulp and paper industry are closely related to various factors such asenergy efficiency, carbon intensity of main energy sources and substitution of biomass energy [24].The American Institute of Chemical Engineers (AIChE) conducted an in-depth research report ofthe energy bandwidth of the US pulp and paper industry [25]. At present, most of the research on

Forests 2019, 10, 725 3 of 23
energy consumption and carbon emission of the forestry-pulp paper industry is carried out fromthe aspects of single equipment, single process, single product and single-stock logistics. In fact, theintegrated operation of forestry-pulp and paper is the current mainstream operation mode. Foresttending, pulping, papermaking and other sectors constitute a complete system. Energy flows andcarbon footprint are embodied in the production processes [26]. Life cycle assessment (LCA) was usedto compare factors such as wood consumption, energy consumption and other environmental impactsof unbleached primary pulp, recycled fiber pulp and chemical preheated mechanical pulp.
This research quantifies the energy flows and carbon footprint of the forestry-pulp and paperindustry. Based on the analysis of production processes and product life cycle theory, the energyconsumption, carbon flow and carbon emission models of each production process unit were established.The energy consumption and carbon emissions of the main production processes were discussed, andthe hot-spot carbon flow paths were found, which established a theoretical and methodological basisfor energy conservation and emission reduction.
2. Materials and Methods
2.1. Materials
The forestry industry produces thousands of products based on forestry renewable raw materialsfor transportation, packaging, consumer goods and construction. Many companies producing pulpand paper are engaged in the integrated business of forest and paper products [27,28]. This researchtakes Stora Enso Co., Ltd. (Beihai, China) as a typical case study modeling and calculating the energyconsumption and carbon emissions in its production and processes. The company’s forest plantationsextend by 15 counties of the four cities of Beihai, Fangchenggang, Yulin and Chongzuo in GuangxiProvince, as well as Gaofeng, Qipo, Bobai, Liuwan, Qinlian, Dongmen and Payangshan. The totalarea is 1600 hectares. The main forest species are acacia and eucalypt, and the main rotation periodis 6–7 years. The company’s annual production scale is 900,000 tons of bleached eucalypt chemicalpulp, of which 450,000 tons are used as raw materials for the production of high-grade cultural paperand packaging paperboard, and 450,000 tons are used as pulp for sale as commercial pulp; one highgrade packaging cardboard production line has an annual output of 450,000 tons, producing liquidpackaging paperboard and coated white cardboard and one high grade cultural paper productionline has an annual output of 450,000 tons of dry electrostatic copying paper, offset printing paper andcopper paper.
In addition to eucalypt from its own plantations, other raw materials for the company’s productionactivities come from the market, including bleached softwood pulp, bleached hardwood pulp andvarious chemicals such as limestone, calcium sulfate, sodium sulfate, starch and latex. The company’smain energy resources are raw coal, heavy oil, liquefied gas, bark and electricity. The forestry-pulpand paper industry consumes a lot of heat and electricity energy in the forest harvesting, preparation,pulping, pulp bleaching, alkali recovery, causticization, lime calcination and waste treatment.
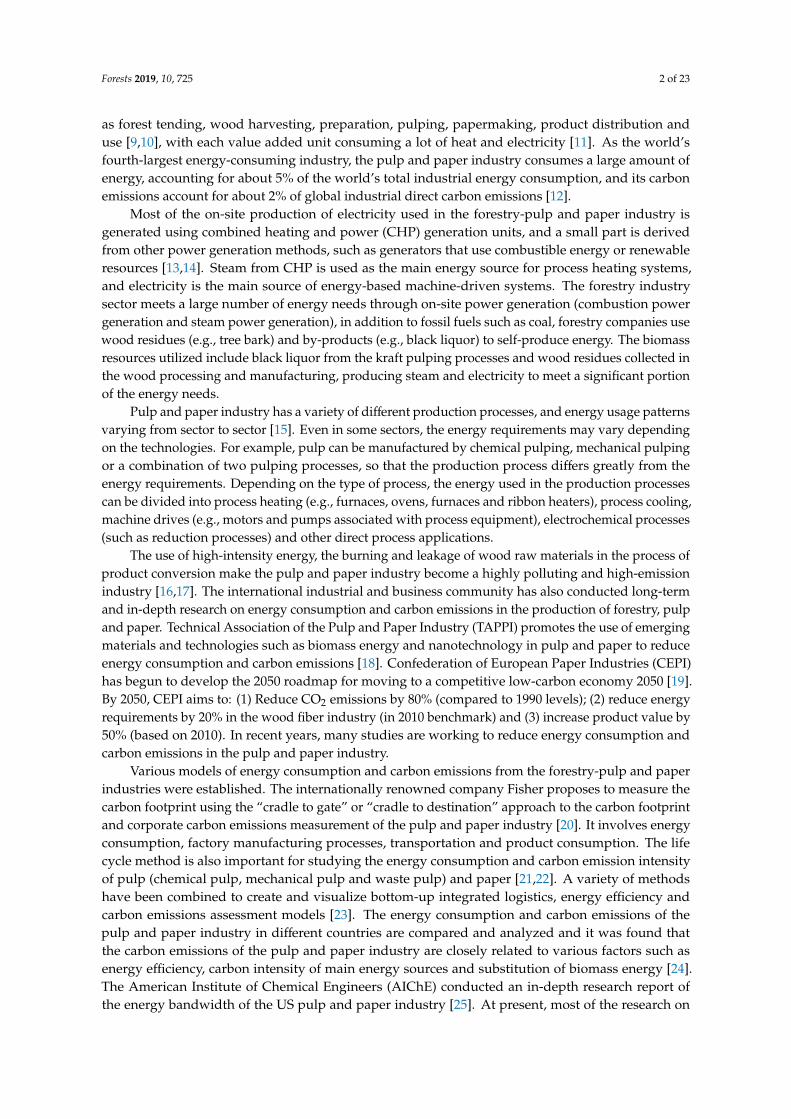
The forestry-pulp and paper industry is composed of a number of sectors, which essentiallycreates a material circulation network that connects multiple sectors and has multiple levels ofcharacteristics [29,30]. The exchange of products and services between sectors leads to energyconsumption and carbon transfer [31]. The forestry-pulp and paper industry production processesand the energy supply network are shown in Figure 1. The figure shows the forestry-pulp andpaper industry production units and energy flow network. The squares in the figure represent thetransitions, indicating various types of production processes, and corresponding physical and chemicalchanges are produced in the process; the left and right circles of the transition represent the input andproduct output of the carbon-containing resources, respectively; the arrows represent the flows ofmatter; the red circles represent the input and output of materials or energy; the grey circles representCO2 emissions. The energy network is relatively independent (including energy production nodes,energy transmission paths, energy use nodes, energy conversion and energy recovery processes). The

Forests 2019, 10, 725 4 of 23
generation, conversion and transportation of energy flows are represented by different colors; thegreen arrows represent thermal energy flows; the blue arrows represent electrical energy flows; thebrown arrows represent thermal energy recovery during production. The main production units andkey equipment in the forestry-pulp and paper industry production are shown in Table 1.
Forests 2019, 10, x FOR PEER REVIEW 4 of 24
by different colors; the green arrows represent thermal energy flows; the blue arrows represent electrical energy flows; the brown arrows represent thermal energy recovery during production. The main production units and key equipment in the forestry-pulp and paper industry production are shown in Table 1.
Figure 1. Production processes units and energy supplies.
Table 1. Main production units and key equipment.
Production Sector
Production Processes Unit
Major Equipment Energy Consumption
Main Use of Energy
References
Forest tending and harvesting
T1
Forest tending and harvesting
T1
Equipment, Trucks
Diesel oil Transportation
[25,29,31–33]
Wood room T2
Barking T2 Barker Electricity Machine driving
Chipping T2 Disc chipper Electricity Machine driving
P101 White mud (calcium carbonate, etc.) P102 CO2 emissions P103 Heavy oil P104 CO2emission P105 Calcined waste P106 Limestone P111 Landfill waste P112 CO2 emissions
P81 Steam P82 Ash P83 CO2 emissions P84 Electric power P85 Dark black liquor P86 Recycle steam P91 Green liquor P92 CO2 emissions P93 Quicklime
P51 Paper products P52 Sewage sludge P53 Dry sludge P54 Waste water P55 CO2emissions P56 Commercial pulp board P61 Waste paper P62 CO2emissions P71 Coal P72 Natural gas
P41 Black liquor P42 Pulp P43 Commercial pulp P44 CO2 emissions P45 Sewage sludge P46 Purchased softwood pulp P47 Purchased bleaching machine pulp P48 Heavy calcium carbonate P49 Starch
P11 Atmospheric CO2 P12 fertilizer P13 Soil nutrients P14 Electricity supply P15 Fossil Energy P21 power supply P22 log P23 Fossil Energy P24 CO2 emissions P31 Bark P32 Chips P33 Bleached wooden pulp P34 CO2 emissions
T0 External grid T1 Forest tending and harvesting T2 Wood preparation T3 Pulping T4 Papermaking T5 Paper usage T6 Black liquor concentration T7 Alkali recovery T8 Caustic T9 Waste treatment T10 Pulp board production T11 Sewage sludge treatment T12 Lime kiln calcination T13 Hybrid boiler T14 Steam turbine generator
Figure 1. Production processes units and energy supplies.
Table 1. Main production units and key equipment.
ProductionSector
ProductionProcesses Unit Major Equipment Energy
ConsumptionMain Use of
Energy References
Forest tendingand harvesting
T1
Forest tendingand harvesting
T1Equipment, Trucks Diesel oil Transportation
[25,29,31–33]Wood room T2
Barking T2 Barker Electricity Machine driving
Chipping T2 Disc chipper Electricity Machine drivingConveying T2 Conveyor Electricity Machine driving

Forests 2019, 10, 725 5 of 23
Table 1. Cont.
ProductionSector
ProductionProcesses Unit Major Equipment Energy
ConsumptionMain Use of
Energy References
Pulping T3, T6
Wood DigestingT3
Continuous Digester,Wood chip washing
bin, Wood chipreaction chamber,Pressure refiner,
Screw press, Steaminjector, Process heat
exchanger
Steam,Electricity
Heating, Machinedriving
[25,29,31–33]
Washing T3 Vacuum washer,Black liquor cooler
Steam,Electricity
Heating, Machinedriving
Oxygendelignification
T3
Two stages reactors, Oremoval tank
Steam,Electricity
Heating, Machinedriving
Bleaching T3
Washing andconcentrating
equipment, pulpconveyor, bleaching
reaction tower
Electricity Machine driving
Alkali recoveryT6, T7, T8, T12
Evaporating T6 Evaporator Steam,Electricity
Heating, Machinedriving
Alkalirecovering T7
Alkali recovery boilerGreen liquor
dissolution tank,Pump, Soot blowers
Electricity Machine driving
Causticizer T8
Green liquorstabilization tank,
clarifier, vacuum tank,jet condenser,
Causticizer, Filter,vacuum
Steam,Electricity Machine driving
Calcinations T12 Lime KilnsSteam,
Residual fueloil
Evaporating,Direct fuel
AuxiliaryEquipment Pump, Fan, Stripper Electricity Machine driving
PapermakingT4, T10
StockPreparation T4
Grinders, Steaminjector
Steam,Electricity
Heating, Machinedriving
Paper formingT4 Twin wire formers Electricity Machine driving
Pressing T4 Shoe Electricity,Steam
Machine driving,Water removal
Drying T4Thermo-compressor
Dryer, Watercondenser
Gas, Electricity Evaporate water,Machine driving
Coating dryingT4 Dryer Gas, Electricity Evaporate water,
Machine driving
SuperCalendaring T4 Calendar Electricity Machine driving
Pulp board T10 Dryer Steam,Electricity
Heating, Machinedriving
Sludge andwastewater
treatment T11
Sludgedewatering
Sludge dewateringmachine Electricity Machine driving
Sewagetreatment
Sewage biochemicaltreatment facility,
PumpElectricity Machine driving

Forests 2019, 10, 725 6 of 23
Table 1. Cont.
ProductionSector
ProductionProcesses Unit Major Equipment Energy
ConsumptionMain Use of
Energy References
Auxiliary mill AuxiliaryEquipment
Air compressorstation, Chlorine
dioxide preparationstation, Oxygen
station, Liquefiedpetroleum gas station,Waste heat recovery
Steam,Electricity
Machine driving,Heating,
Refrigeration,Waste heatrecovery
[25,29,31–33]
HVAC,Lighting
HVAC Air conditioner Electricity Refrigeration,Machine driving
Lighting Lighting facility Electricity Lighting
Thermal powerstation T13, T14
Hybrid boilerT13
Circulating FluidizedBed Boiler
Coal, Bark,Natural gas,Heavy oil
Steam producing
Steam turbinegenerator T14
Back Pressure SteamTurbine Generator,Condensed WaterGenerator, pump
SteamPower
generation,Steam delivery
Logistics andtransportation
T5Logistics Trucks Diesel oil Transportation
According to the energy consumption profile, the integrated production process of forestrypulp and paper can be classified into multiple sectors, and each sector may be divided into multipleproduction units [25,32]. External energy (coal, natural gas, electricity and steam) reach the plantboundary and produce on-site energy through CHP, which deliver thermal and electrical energydirectly used to meet the power and steam needs of processes and non-process end uses. Another partof the on-site energy comes from a by-product that can be used as a fuel. For example, the black liquorproduced in the pulping process is burned to obtain a large amount of heat energy, and a part of thisheat energy is transported to each production unit as a process energy source.
Energy flows through various production units, resulting in energy consumption (such as facilityenergy consumption), energy form conversion (such as conversion of thermal energy into electricalenergy and conversion of electrical energy into thermal energy), energy loss (including transport andconversion losses) and by-products that can be further be fueled (black liquor). The energy flows in theenergy transportation will fork to generate multiple paths [34]. Different paths will transport energy todifferent process and non-process terminal energy consumption sites. A complex network is formedbetween the production units, and there are many energy flow bifurcation paths and cycles. Differentenergy flows are represented by different colors in Figure 1. In order to avoid double counting energyconsumption, it is necessary to carefully distinguish the flow directions and conversion relationshipsamong the energy flows.
2.2. Energy Consumption and Supply Modeling
2.2.1. Energy Consumption Based on Production Processes
The main production process of the forestry pulp-paper industry can be divided into forest tending,forest harvesting, preparation, pulping, bleaching, alkali recovery, slurry drying, papermaking, logisticsand other production process units. Based on the supply chain perspective, the “cradle to gate” approachis a new insight to measure the energy consumption to improve energy efficiency and reduce carbonemissions [35–37]. The energy consumption equation is as follows:
(1) Energy consumption during forest cultivation and harvesting.

Forests 2019, 10, 725 7 of 23
EW = D·µ1 (1)
In the equation, EW is the energy consumption for forest cultivation and harvesting; D is thewood volume and µ1 is the energy consumption per unit volume wood during forest cultivation andharvesting, taking 0.07 GJ/m3 [38].
(2) Energy consumption of material transportation.
ET = M·d·µ2 (2)
In the equation, ET is the energy consumption of material transportation, including the energyconsumption of the main material and auxiliary materials transportation, GJ; M is the material quantity,t; d is the transportation distance, km and µ2 is the energy consumption per t km, and taking theenergy value of unit mass diesel, 0.01922 GJ/t km [33]. The average transportation distance of domesticproduction materials is set to 100 km, and the average transportation distance of imported materials isset to 500 km.
(3) Energy consumption equation of production process.
The main production processes of pulp and paper companies include preparation, pulping,washing, bleaching, evaporation, alkali recovery, causticization, calcination, slurry preparation,pressing, drying, calendaring, waste treatment, etc. [25]. The total energy consumption model basedon the production process is as follows.
EP =n∑
i=1
EiP =
n∑i=1
(EiS+Ei
E + EiF) (3)
where EP represents the total energy consumption of the production process, GJ; EiS, Ei
E and EiF represent
the steam consumption of process i, GJ, power consumption, GJ, and fossil fuel consumption, GJ,respectively.
EiS = qi
S· jS·yi (4)
EiE = qi
E· jE·yi (5)
EiF = qi
F· jF·yi (6)
The energy consumed per unit of the product output in the production process is called energyintensity. Where qi
S, qiE and qi
F represent the steam consumption intensity of process unit i, MMBtu/adt,power consumption intensity, kWh/adt, and direct fossil fuel consumption intensity, MMBtu/adtrespectively. jS, jE and jF represent the heat enthalpy value of unit steam, GJ/kg, electricity, GJ/kWh,and fossil fuel, GJ/kWh, respectively. yi represents the yield of process unit i.
2.2.2. Energy Supply and Conversion Processes
(1) Energy supply.
The energy in the forestry-pulp and paper industry comes mainly from electricity and heat,produced by coal and other auxiliary fuels. Energy is present in different forms attached to a certaincarrier, including fossil energy, biomass energy and current, water and steam. The thermal enthalpyand conversion parameters are in Table S2. The equations are as follows.
The effective calorific value of coal combustion is:
EC = X·Q·F·T (7)
where, EC is the coal energy supply, GJ; X is the calorific value of the unit mass of coal, GJ/t; Q is thetotal coal supply, t; F is the boiler combustion efficiency and T is the energy conversion ratio.
Forests 2019, 10, 725 8 of 23
The effective calorific value produced by bark burning is:
ET = X·Q·F·T (8)
where, ET is the bark burning energy supply, GJ; X is the calorific value of the bark of unit mass, taking4 GJ/admt; Q is the total supply of bark, t; F is the combustion efficiency of the boiler and T is the ratioof energy conversion.
The effective calorific value produced by black liquor combustion is:
EB = X·Q·F·T (9)
where, EB represents the calorific value of black liquor combustion, GJ; X represents the calorific valueof black liquor per unit mass, taking 14 GJ/tDS; Q is the total supply of black liquor, admt; F is thecombustion efficiency of the boiler and T is the ratio of energy conversion.
In addition to the energy consumption of the on-site production process, there are certain energyconsumption and losses in the non-process primary energy production outside the factory, secondaryenergy production at the plant site, energy transportation, energy use, energy recovery and auxiliaryfacilities and lighting.
(2) Energy conversion processes.
In the production process, energy is constantly undergoing formal transformation and interaction,such as conversion of chemical energy into heat energy, conversion of heat energy into electrical energy,and conversion of electrical energy into kinetic energy. To analyze the transfer and transformationof energy from the perspective of energy flow, it is necessary to define the source and sink of theenergy flow. Fossil energy and biomass energy are burned in boilers, converting energy into heatand using hot water and steam to transfer heat. An important carrier of energy flow in the pulp andpaper industry is water, which enables heat transfer and thermal energy utilization through heatexchange between two forms of water (water and steam) [33]. Important nodes in the energy flownetwork include fuel supplies, steam boilers, alkali recovery boilers, steam turbine generator sets andenergy-consuming production and living units. In different production processes, energy transfer willcause loss, conversion and emissions. Energy efficiency analysis needs to consider the energy loss,heat recovery and heat dissipated in hot waste water and flue gas during the exchange of differentenergy forms.
After a certain conversion, the energy is transferred from the source to the sink through a certaincarrier, such as hot water, steam, electric wire and the like [33]. Energy can cause some loss andconsumption during the conversion and transmission processes, depending on the efficiency of theprocess such as boiler and heat exchange. The energy conversion rate is calculated as:
γ =(EDest,HPprod + EDest,PRV + EDest,∆THX
)/ESP (10)
where γ represents the energy conversion rate; EDest,HPprod represents the loss generated during thecombustion of high-pressure steam for energy combustion; EDest,PRV represents the loss of high-pressuresteam converted to medium-low pressure steam; EDest,∆THX indicates the energy loss in the interactionbetween steam and heat sink and ESP indicates the energy that fuel combustion can provide for theproduction process. The rest of the energy is discharged with the waste water and flue gas.
For process unit j, its energy use efficiency equation is:
η j = mCp(T − TET)/E jSP (11)
where η j represents the energy use efficiency of the production unit j; m represents the steam mass, kg;Cp represents the thermal enthalpy value of the unit steam mass, KJ/kg·C; T represents the intake air

Forests 2019, 10, 725 9 of 23
temperature; TET represents the extraction steam temperature and E jSP represents the energy supply of
the production unit j.
2.3. Carbon Footprint Modeling
2.3.1. Framework of the Carbon Footprint
The life cycle processes of the forestry-pulp and paper industry include various stages suchas forest tending, wood harvesting, preparation, pulping, papermaking, product distribution anduse [39]. From the perspective of the supply chain, carbon will undergo spatial and morphologicalchanges at different stages of the supply chain [40]. Spatially, carbon sinks from company’s forestplantation will go through different sectors in the supply chain, including wood chip processing plants,pulp mills, paper mills and finally to dealer warehouses around the world. A range of processesfrom forest breeding to final paper product consumption will also bring about a variety of carbonmorphological changes.
In general, carbon comes mainly from three major parts: Electricity consumption, fossil fuelsand pulp and paper raw materials. The forestry-pulp and paper industry consists of a number ofdifferent production sectors, essentially creating a material distribution network with multiple levels ofcharacteristics that connects multiple sectors. Each sector generates carbon emissions based on energyconsumption and physical and chemical changes in materials. Carbon flows are generated due to thetransfer of materials [41–44]. According to the Greenhouse Gas Protocol: Guidelines for EnterpriseAccounting and Reporting [43], the carbon emissions of forestry-pulp paper companies mainly comesfrom the inner CHP which include: Indirect carbon emissions from external thermal power supply,direct carbon emissions from combustion of thermal power plants, direct carbon emissions frombiomass energy combustion, carbon emissions from direct fuel combustion in the production processand non-process, carbon emissions from the biological treatment process of wastewater, and carbonemissions generated by the volatilization of the production processes. The carbon emissions generatedby the on-site and off-site primary and secondary energy supply and transportation losses can bemapped to the production units and transportation links of the plant. The framework of the carbonfootprint is shown in Figure 2.
Forests 2019, 10, x FOR PEER REVIEW 10 of 24
processes from forest breeding to final paper product consumption will also bring about a variety of carbon morphological changes.
In general, carbon comes mainly from three major parts: Electricity consumption, fossil fuels and pulp and paper raw materials. The forestry-pulp and paper industry consists of a number of different production sectors, essentially creating a material distribution network with multiple levels of characteristics that connects multiple sectors. Each sector generates carbon emissions based on energy consumption and physical and chemical changes in materials. Carbon flows are generated due to the transfer of materials [41–44]. According to the Greenhouse Gas Protocol: Guidelines for Enterprise Accounting and Reporting [43], the carbon emissions of forestry-pulp paper companies mainly comes from the inner CHP which include: Indirect carbon emissions from external thermal power supply, direct carbon emissions from combustion of thermal power plants, direct carbon emissions from biomass energy combustion, carbon emissions from direct fuel combustion in the production process and non-process, carbon emissions from the biological treatment process of wastewater, and carbon emissions generated by the volatilization of the production processes. The carbon emissions generated by the on-site and off-site primary and secondary energy supply and transportation losses can be mapped to the production units and transportation links of the plant. The framework of the carbon footprint is shown in Figure 2.
Figure 2. Framework of the carbon footprint.
Six important greenhouse gases are specified in the Kyoto Protocol, namely carbon dioxide (CO2), methane (CH4), nitrous oxide (N2O), hydrofluorocarbons, perfluorocarbons and sulfur hexafluoride. Different greenhouse gases have different radiation characteristics, so the effect of a temperature increase caused by their emission into the atmosphere is also different. The global warming effects of various other greenhouse gases in 100 years, namely global warming potential (GWP), were converted to a CO2 equivalent, according to the method of the lifecycle assessment of greenhouse gas given in PAS 2050 [45]. The first three types of greenhouse gases account for a large proportion of global greenhouse gas emissions, and are more common in various industrial production sectors, of which CO2 and CH4 has accounted for 86% of the greenhouse effect.
2.3.2. Direct Carbon Emissions from Fossil and Biomass Fuel Combustion
Figure 2. Framework of the carbon footprint.

Forests 2019, 10, 725 10 of 23
Six important greenhouse gases are specified in the Kyoto Protocol, namely carbon dioxide (CO2),methane (CH4), nitrous oxide (N2O), hydrofluorocarbons, perfluorocarbons and sulfur hexafluoride.Different greenhouse gases have different radiation characteristics, so the effect of a temperatureincrease caused by their emission into the atmosphere is also different. The global warming effects ofvarious other greenhouse gases in 100 years, namely global warming potential (GWP), were convertedto a CO2 equivalent, according to the method of the lifecycle assessment of greenhouse gas givenin PAS 2050 [45]. The first three types of greenhouse gases account for a large proportion of globalgreenhouse gas emissions, and are more common in various industrial production sectors, of whichCO2 and CH4 has accounted for 86% of the greenhouse effect.
2.3.2. Direct Carbon Emissions from Fossil and Biomass Fuel Combustion
The coal, natural gas, bark and wood residual, black liquor and auxiliary fuels (heavy oil) areburned in boilers to generate secondary thermoelectric energy, while emitting a large amount of carbondioxide. Although measurements of biomass burning are not prescribed in the Kyoto Protocol, a largeamount of methane and nitrous oxide released in this industry still play an important role in climateimpact [46–48]. A direct carbon emission model for fossil and biomass fuels is established based on theEquations (7)–(9).
The carbon emission equivalent equation is as follows:
Ow =∑
i
ADw·EFw,i·GWP (12)
where, Ow is the CO2 equivalent produced by fuel combustion; ADw is the energy value of the fuel, GJ;EFw,i is the emission factor of greenhouse gas i for fuel combustion and GWPi is the 100-year globalwarming of greenhouse gas i. It is assumed that the fuel is fully combusted, that is, the combustionrate is 100%.
Fossil and biomass fuels produce steam and electricity through CHP, one part being used in theproduction process and the other being lost. The carbon emissions from energy consumption areconcentrated when the fuel is burned. In order to express the carbon emission effect caused by theenergy consumption of each production process, the CO2 released is distributed according to theenergy consumption of each process unit, which is called the embodied carbon emission. In the processof fuel combustion into thermoelectric energy and transportation, certain losses will occur, especiallyin steam transportation. The carbon emission equivalent of fuel combustion can be mapped to eachproduction and auxiliary process unit in embodied carbon flow and carbon emissions.
2.3.3. Direct Carbon Emissions from Forest Tending, Harvesting and Transportation
Carbon emissions from forest tending and harvesting come from the burning of non-road mobilefacilities using diesel as fuel [38]. According to the forest tending and harvesting energy consumptionEquation (1), a direct carbon emission model for forest tending and harvesting is obtained.
OH =∑
i
ADH·EFH,i·GWPi (13)
where, OH is the CO2 equivalent of diesel consumed by the facility; ADH is the energy consumed bydiesel for non-road forestry operations, GJ; EFH,i is the emission equivalent factor of greenhouse gas ifor diesel and GWPi is the 100-year global warming potential of greenhouse gas i.
The materials transported in the forestry-pulp and paper industry mainly include logs, pulpboards, paper, coal, coal slag ash, sludge and chemical raw materials. According to factory surveys, thetotal annual transportation volume was 6.048 million t/a, of which the import volume was 3.782 milliont/a, and the shipment volume was 2.266 million t/a. Material transportation is often in the form of trucks.Distance-based emission factor methods are often used because of the difficulty in obtaining accurate
Forests 2019, 10, 725 11 of 23
fossil fuel consumption data for carbon emissions calculations in vehicle transportation. According tothe equation of material transportation energy consumption (2), the direct carbon emission model ofmaterial transportation is obtained.
OT =∑
i
ADT·EFT,i·GWPi (14)
where OT is the CO2 equivalent of diesel consumed by the facility, ADT is the energy consumed by thediesel, GJ; EFT,i is the emission equivalent factor of the greenhouse gas i produced by diesel and GWPiis the 100-year global warming potential of greenhouse gas i.
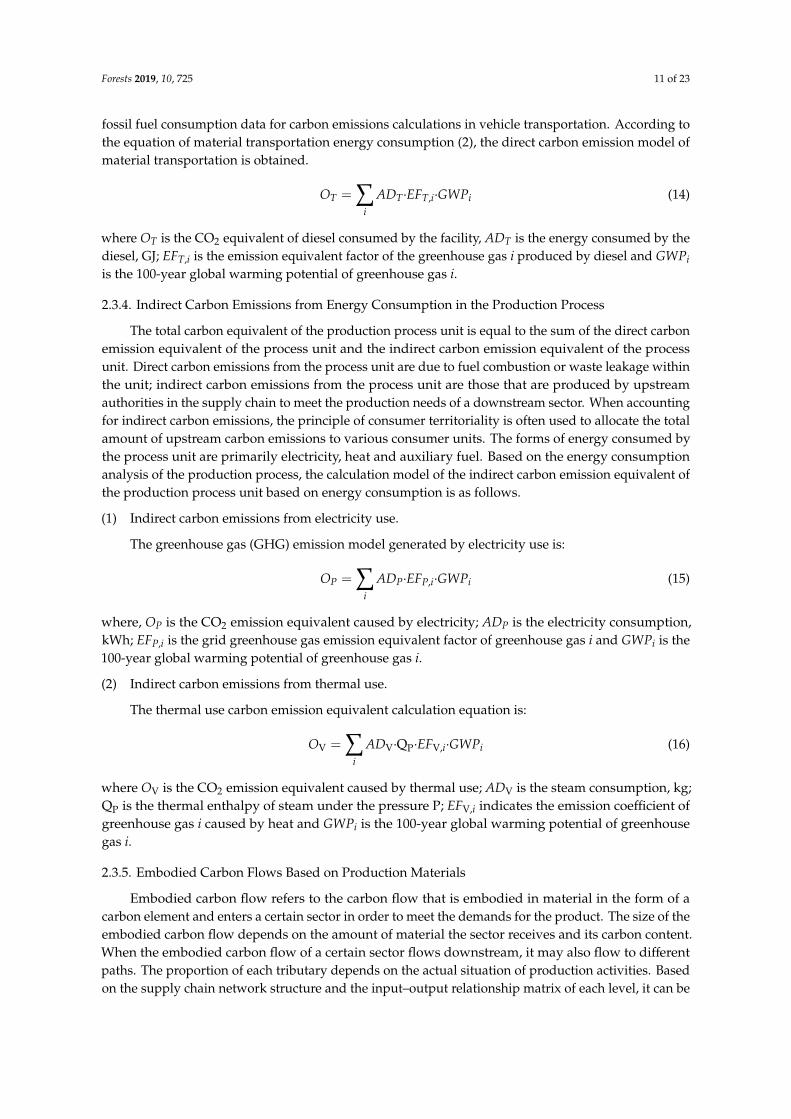
2.3.4. Indirect Carbon Emissions from Energy Consumption in the Production Process
The total carbon equivalent of the production process unit is equal to the sum of the direct carbonemission equivalent of the process unit and the indirect carbon emission equivalent of the processunit. Direct carbon emissions from the process unit are due to fuel combustion or waste leakage withinthe unit; indirect carbon emissions from the process unit are those that are produced by upstreamauthorities in the supply chain to meet the production needs of a downstream sector. When accountingfor indirect carbon emissions, the principle of consumer territoriality is often used to allocate the totalamount of upstream carbon emissions to various consumer units. The forms of energy consumed bythe process unit are primarily electricity, heat and auxiliary fuel. Based on the energy consumptionanalysis of the production process, the calculation model of the indirect carbon emission equivalent ofthe production process unit based on energy consumption is as follows.
(1) Indirect carbon emissions from electricity use.
The greenhouse gas (GHG) emission model generated by electricity use is:
OP =∑
i
ADP·EFP,i·GWPi (15)
where, OP is the CO2 emission equivalent caused by electricity; ADP is the electricity consumption,kWh; EFP,i is the grid greenhouse gas emission equivalent factor of greenhouse gas i and GWPi is the100-year global warming potential of greenhouse gas i.
(2) Indirect carbon emissions from thermal use.
The thermal use carbon emission equivalent calculation equation is:
OV =∑
i
ADV·QP·EFV,i·GWPi (16)
where OV is the CO2 emission equivalent caused by thermal use; ADV is the steam consumption, kg;QP is the thermal enthalpy of steam under the pressure P; EFV,i indicates the emission coefficient ofgreenhouse gas i caused by heat and GWPi is the 100-year global warming potential of greenhousegas i.
2.3.5. Embodied Carbon Flows Based on Production Materials
Embodied carbon flow refers to the carbon flow that is embodied in material in the form of acarbon element and enters a certain sector in order to meet the demands for the product. The size of theembodied carbon flow depends on the amount of material the sector receives and its carbon content.When the embodied carbon flow of a certain sector flows downstream, it may also flow to differentpaths. The proportion of each tributary depends on the actual situation of production activities. Basedon the supply chain network structure and the input–output relationship matrix of each level, it can be

Forests 2019, 10, 725 12 of 23
traced back to the carbon resources of the upstream relevant sectors from the downstream productdemands [49].
The calculation of the embodied carbon flow and carbon emissions in the forestry-pulp and papersupply chain is mainly based on the material balance of input and output at all levels in the supplychain [26,50]. First, based on the input–output mapping matrix among the various sectors, the lossrate is fully considered, and the resource consumption of each sector is calculated. Secondly, basedon the carbon content of each resource, the embodied carbon flow of each sector is further calculated.The measurement of embodied carbon flows and carbon emissions require full consideration of thecomplex physical and chemical changes in the supply chain. In the forestry-pulp and paper supplychain, due to consumer demands for downstream paper products, the embodied carbon stream flowsfrom upstream to downstream, and carbon emissions are generated in the production activities ofrelevant sectors at each level. Thus, based on the market demands for final paper products, input andoutput of various materials at all levels in the supply chain can be obtained, including paper products,pulp, excipients, wood chips, logs, coal, bark and the fossils such as black liquor and biomass fuel.
The input–output method is used to calculate the embodied carbon flows in the material [31].By the Leontief equation, there is:
x = (I −A)−1y (17)
where y is the final products demand vector; x is the total output vector; A is the matrix of consumptioncoefficients and the element Apq of A represents the input–output coefficient between sector p andsector q.
L = (I −A)−1 (18)
where L is the inverse matrix of the Leontief matrix and its element Lpq represents the total output(direct and indirect) from sector p to meet one unit of demand of sector q.
Using the power approximation of the Leontief inverse matrix [51], we can get:
L = (I −A)−1
= I + A + A2 + · · ·+ At
limt→∞At = 0(19)
where At = At−1A. It is assumed that the various levels of the supply chain (L0, L1, · · · , Lt) have therelationship At = At−1A among different levels, that is, the previous level of each sector inputs resourcesfor production, whose output will be reinvested as raw materials to the next level of productionactivities. The multi-level input-output model of the supply chain can be established based on theLeontief inverse matrix [31].
From Equation (19) we can get:
X = (I + A + A2 + · · ·+ At)y= y + Ay + A2y + · · ·+ Aty
(20)
The power expansion of the Leontief inverse matrix L is understood as the input–outputrelationship at multiple levels of the supply chain. Assuming y is the final product demands vector, tomeet the market demands for the product, the embodied carbon flow of sector S in level Lt is:
FtS = mt
SAS:At−2y (21)
where mtS represents the carbon content of the resource of sector s at level Lt; A represents the matrix of
consumption coefficients and AS: is a vector indicating the input–output coefficients matrix amongsector s and other sectors.

Forests 2019, 10, 725 13 of 23
3. Results
3.1. Energy Consumption and Energy Flows
Based on Equations (7)–(9), Table S1 and Table S2, the total thermal enthalpies and energyproduction of different fuels were calculated, as shown in Figure 3. Based on the energy consumptionparameters of major production processes in Table S1, we calculated the thermal energy consumptionand comprehensive energy consumption (heat energy, electric energy and water treatment) of the mainproduction units. The results are shown in Figures 4 and 5.
Forests 2019, 10, x FOR PEER REVIEW 14 of 24
3. Results
3.1. Energy Consumption and Energy Flows
Based on Equations (7)–(9), Table S1 and Table S2, the total thermal enthalpies and energy production of different fuels were calculated, as shown in Figure 3. Based on the energy consumption parameters of major production processes in Table S1, we calculated the thermal energy consumption and comprehensive energy consumption (heat energy, electric energy and water treatment) of the main production units. The results are shown in Figures 4 and 5.
Figure 3. Main fuel thermal enthalpy and thermal energy production.
Figure 4. Annual energy consumptions of the major production units.
Figure 5. Energy consumptions of the main production units.
Each production unit needs to consume different types of energy such as electricity, steam, fossil fuel, etc., and the by-product black liquor in the alkali recovery process is an important fuel source. The energy flowchart of the pulping and papermaking processes is shown in Figure 6. The
Figure 3. Main fuel thermal enthalpy and thermal energy production.
Forests 2019, 10, x FOR PEER REVIEW 14 of 24
3. Results
3.1. Energy Consumption and Energy Flows
Based on Equations (7)–(9), Table S1 and Table S2, the total thermal enthalpies and energy production of different fuels were calculated, as shown in Figure 3. Based on the energy consumption parameters of major production processes in Table S1, we calculated the thermal energy consumption and comprehensive energy consumption (heat energy, electric energy and water treatment) of the main production units. The results are shown in Figures 4 and 5.
Figure 3. Main fuel thermal enthalpy and thermal energy production.
Figure 4. Annual energy consumptions of the major production units.
Figure 5. Energy consumptions of the main production units.
Each production unit needs to consume different types of energy such as electricity, steam, fossil fuel, etc., and the by-product black liquor in the alkali recovery process is an important fuel source. The energy flowchart of the pulping and papermaking processes is shown in Figure 6. The
Figure 4. Annual energy consumptions of the major production units.
Forests 2019, 10, x FOR PEER REVIEW 14 of 24
3. Results
3.1. Energy Consumption and Energy Flows
Based on Equations (7)–(9), Table S1 and Table S2, the total thermal enthalpies and energy production of different fuels were calculated, as shown in Figure 3. Based on the energy consumption parameters of major production processes in Table S1, we calculated the thermal energy consumption and comprehensive energy consumption (heat energy, electric energy and water treatment) of the main production units. The results are shown in Figures 4 and 5.
Figure 3. Main fuel thermal enthalpy and thermal energy production.
Figure 4. Annual energy consumptions of the major production units.
Figure 5. Energy consumptions of the main production units.
Each production unit needs to consume different types of energy such as electricity, steam, fossil fuel, etc., and the by-product black liquor in the alkali recovery process is an important fuel source. The energy flowchart of the pulping and papermaking processes is shown in Figure 6. The
Figure 5. Energy consumptions of the main production units.
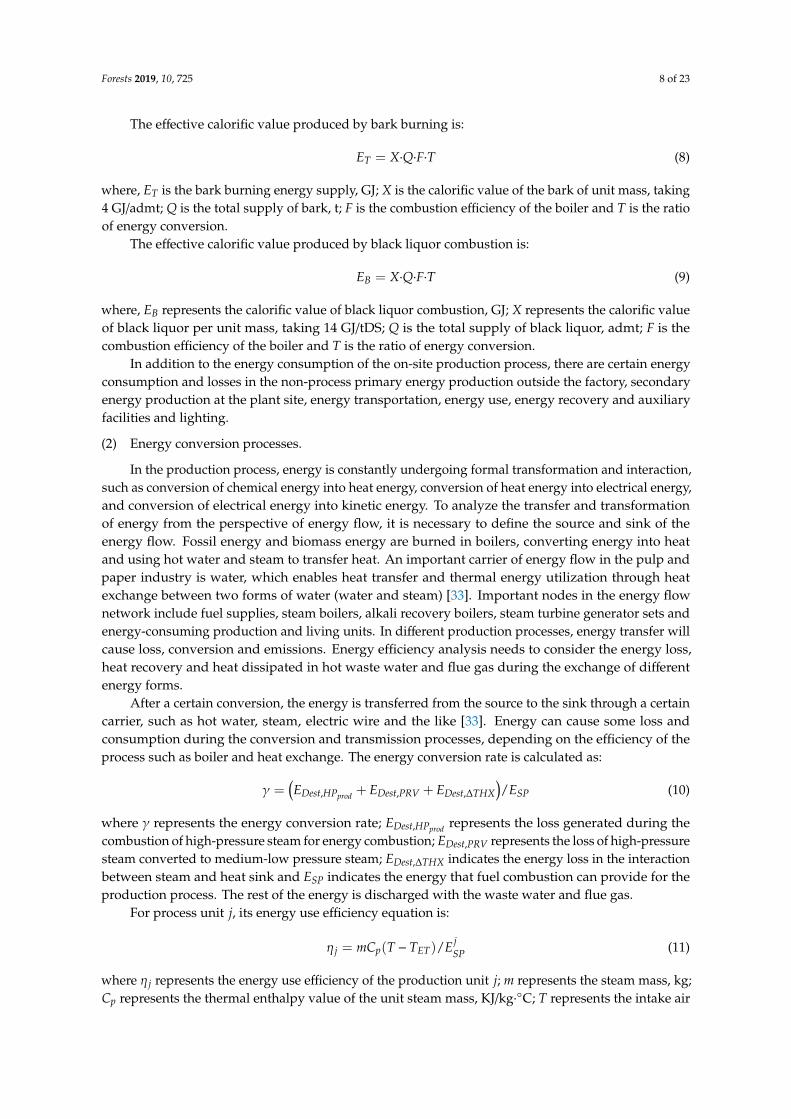
Each production unit needs to consume different types of energy such as electricity, steam, fossilfuel, etc., and the by-product black liquor in the alkali recovery process is an important fuel source. Theenergy flowchart of the pulping and papermaking processes is shown in Figure 6. The basic parameters

Forests 2019, 10, 725 14 of 23
are in Tables S3–S6. The software package e!Sankey 4 was used when making the flowcharts [1]. As wecan see from Figure 6, the two main sources of energy were external coal and internal black liquor,which supplied 30,057,300 GJ and 14,854,000 GJ, respectively. It can be seen that black liquor playedan extremely important role in energy recycling. External electricity and internal bark provided asmall amount of energy for the system. As auxiliary fuels, the energy flows of natural gas and heavyoil are not shown in Figure 6. The CHP system has four units, corresponding to the actual “fourfurnace three machines”, namely an alkali recovery boiler, three sets of fluidized bed boilers andsteam turbine generator sets. The parameters are in Tables S8 and S9. Most of the steam and electricenergy were produced from the CHP, and a small part was supplied from outside the company. Theenergy produced by CHP was used in various production plants and auxiliary works. Heat energywas mainly used for alkali recovery, pulping, pulp board, high grade packaging paperboard, highgrade cultural paper and the paper machine hot air system. The power output was mainly used forauxiliary projects (including water supply engineering, circulating water engineering, sewage processengineering, compressed air stations, oxygen plants, thermal power plants, etc.) and machine drives invarious production plants. The steam energy output accounted for the majority of energy production,and the electricity energy output was smaller than the steam energy output. Losses in heat exchangeand transportation (including energy generation, energy transmission and direct end uses) accountedfor about 20% of the total energy. In different production units, due to different ways of using energy,the ratios of final energy applications and thermal energy consumption were significantly different.
Forests 2019, 10, x FOR PEER REVIEW 15 of 24
basic parameters are in Tables S3–S6. The software package e!Sankey 4 was used when making the flowcharts [1]. As we can see from Figure 6, the two main sources of energy were external coal and internal black liquor, which supplied 30,057,300 GJ and 14,854,000 GJ, respectively. It can be seen that black liquor played an extremely important role in energy recycling. External electricity and internal bark provided a small amount of energy for the system. As auxiliary fuels, the energy flows of natural gas and heavy oil are not shown in Figure 6. The CHP system has four units, corresponding to the actual “four furnace three machines”, namely an alkali recovery boiler, three sets of fluidized bed boilers and steam turbine generator sets. The parameters are in Tables S8 and S9. Most of the steam and electric energy were produced from the CHP, and a small part was supplied from outside the company. The energy produced by CHP was used in various production plants and auxiliary works. Heat energy was mainly used for alkali recovery, pulping, pulp board, high grade packaging paperboard, high grade cultural paper and the paper machine hot air system. The power output was mainly used for auxiliary projects (including water supply engineering, circulating water engineering, sewage process engineering, compressed air stations, oxygen plants, thermal power plants, etc.) and machine drives in various production plants. The steam energy output accounted for the majority of energy production, and the electricity energy output was smaller than the steam energy output. Losses in heat exchange and transportation (including energy generation, energy transmission and direct end uses) accounted for about 20% of the total energy. In different production units, due to different ways of using energy, the ratios of final energy applications and thermal energy consumption were significantly different.
Figure 6. Energy flows in pulping and papermaking workshops (unit: GJ).
3.2. Carbon Flows and Emissions
3.2.1. Carbon Emissions from Production Processes
According to the calculation results, the company needed about 3,397,100 m3 log one year (debarked), and it was about 3,613,900 m3 before debarking. The energy consumed during the cultivation and harvesting of the forest was 252,973 GJ/a. The carbon equivalent produced by cultivation and harvesting was 16,899 t CO2-equiv/a. The energy consumption of material transportation was 11,624,256 GJ/a. The energy equivalent of the energy consumption of material transportation was 776,500 t CO2-equiv/a. The statistical average transport distance was 100 km. The total requirement of the coal of the thermal power station was about 110.912 million tons one year. If the carbon content was set to 70% as shown in Table S7, then the carbon content was 770,400 tons. According to the boiler combustion efficiency parameters in Table S2, the coal and bark combustion conversion rates were set to 86% and 69%, respectively, and the black liquor combustion boiler
Figure 6. Energy flows in pulping and papermaking workshops (unit: GJ).
3.2. Carbon Flows and Emissions
3.2.1. Carbon Emissions from Production Processes
According to the calculation results, the company needed about 3,397,100 m3 log one year(debarked), and it was about 3,613,900 m3 before debarking. The energy consumed during thecultivation and harvesting of the forest was 252,973 GJ/a. The carbon equivalent produced by cultivationand harvesting was 16,899 t CO2-equiv/a. The energy consumption of material transportation was11,624,256 GJ/a. The energy equivalent of the energy consumption of material transportation was776,500 t CO2-equiv/a. The statistical average transport distance was 100 km. The total requirement ofthe coal of the thermal power station was about 110.912 million tons one year. If the carbon contentwas set to 70% as shown in Table S7, then the carbon content was 770,400 tons. According to theboiler combustion efficiency parameters in Table S2, the coal and bark combustion conversion rateswere set to 86% and 69%, respectively, and the black liquor combustion boiler efficiency was set to64%, allowing for calculations of direct carbon emissions from fuel burning. Based on the energy flowand the carbon emission equivalent value per unit of energy consumption in Figure 7, we calculated
Forests 2019, 10, 725 15 of 23
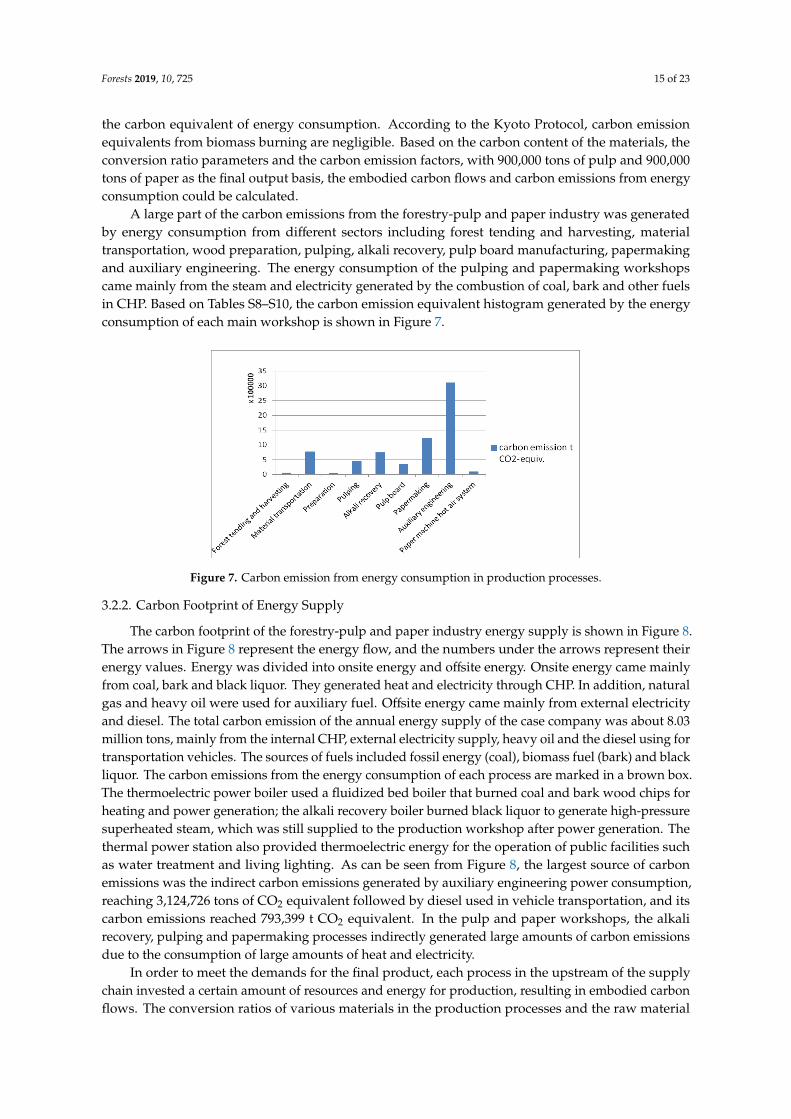
the carbon equivalent of energy consumption. According to the Kyoto Protocol, carbon emissionequivalents from biomass burning are negligible. Based on the carbon content of the materials, theconversion ratio parameters and the carbon emission factors, with 900,000 tons of pulp and 900,000tons of paper as the final output basis, the embodied carbon flows and carbon emissions from energyconsumption could be calculated.
A large part of the carbon emissions from the forestry-pulp and paper industry was generatedby energy consumption from different sectors including forest tending and harvesting, materialtransportation, wood preparation, pulping, alkali recovery, pulp board manufacturing, papermakingand auxiliary engineering. The energy consumption of the pulping and papermaking workshopscame mainly from the steam and electricity generated by the combustion of coal, bark and other fuelsin CHP. Based on Tables S8–S10, the carbon emission equivalent histogram generated by the energyconsumption of each main workshop is shown in Figure 7.
Forests 2019, 10, x FOR PEER REVIEW 16 of 24
efficiency was set to 64%, allowing for calculations of direct carbon emissions from fuel burning. Based on the energy flow and the carbon emission equivalent value per unit of energy consumption in Figure 7, we calculated the carbon equivalent of energy consumption. According to the Kyoto Protocol, carbon emission equivalents from biomass burning are negligible. Based on the carbon content of the materials, the conversion ratio parameters and the carbon emission factors, with 900,000 tons of pulp and 900,000 tons of paper as the final output basis, the embodied carbon flows and carbon emissions from energy consumption could be calculated.
A large part of the carbon emissions from the forestry-pulp and paper industry was generated by energy consumption from different sectors including forest tending and harvesting, material transportation, wood preparation, pulping, alkali recovery, pulp board manufacturing, papermaking and auxiliary engineering. The energy consumption of the pulping and papermaking workshops came mainly from the steam and electricity generated by the combustion of coal, bark and other fuels in CHP. Based on Tables S8–S10, the carbon emission equivalent histogram generated by the energy consumption of each main workshop is shown in Figure 7.
Figure 7. Carbon emission from energy consumption in production processes.
3.2.2. Carbon Footprint of Energy Supply
The carbon footprint of the forestry-pulp and paper industry energy supply is shown in Figure 8. The arrows in Figure 8 represent the energy flow, and the numbers under the arrows represent their energy values. Energy was divided into onsite energy and offsite energy. Onsite energy came mainly from coal, bark and black liquor. They generated heat and electricity through CHP. In addition, natural gas and heavy oil were used for auxiliary fuel. Offsite energy came mainly from external electricity and diesel. The total carbon emission of the annual energy supply of the case company was about 8.03 million tons, mainly from the internal CHP, external electricity supply, heavy oil and the diesel using for transportation vehicles. The sources of fuels included fossil energy (coal), biomass fuel (bark) and black liquor. The carbon emissions from the energy consumption of each process are marked in a brown box. The thermoelectric power boiler used a fluidized bed boiler that burned coal and bark wood chips for heating and power generation; the alkali recovery boiler burned black liquor to generate high-pressure superheated steam, which was still supplied to the production workshop after power generation. The thermal power station also provided thermoelectric energy for the operation of public facilities such as water treatment and living lighting. As can be seen from Figure 8, the largest source of carbon emissions was the indirect carbon emissions generated by auxiliary engineering power consumption, reaching 3,124,726 tons of CO2 equivalent followed by diesel used in vehicle transportation, and its carbon emissions reached 793,399 t CO2 equivalent. In the pulp and paper workshops, the alkali recovery, pulping and papermaking processes indirectly generated large amounts of carbon emissions due to the consumption of large amounts of heat and electricity.
Figure 7. Carbon emission from energy consumption in production processes.
3.2.2. Carbon Footprint of Energy Supply
The carbon footprint of the forestry-pulp and paper industry energy supply is shown in Figure 8.The arrows in Figure 8 represent the energy flow, and the numbers under the arrows represent theirenergy values. Energy was divided into onsite energy and offsite energy. Onsite energy came mainlyfrom coal, bark and black liquor. They generated heat and electricity through CHP. In addition, naturalgas and heavy oil were used for auxiliary fuel. Offsite energy came mainly from external electricityand diesel. The total carbon emission of the annual energy supply of the case company was about 8.03million tons, mainly from the internal CHP, external electricity supply, heavy oil and the diesel using fortransportation vehicles. The sources of fuels included fossil energy (coal), biomass fuel (bark) and blackliquor. The carbon emissions from the energy consumption of each process are marked in a brown box.The thermoelectric power boiler used a fluidized bed boiler that burned coal and bark wood chips forheating and power generation; the alkali recovery boiler burned black liquor to generate high-pressuresuperheated steam, which was still supplied to the production workshop after power generation. Thethermal power station also provided thermoelectric energy for the operation of public facilities suchas water treatment and living lighting. As can be seen from Figure 8, the largest source of carbonemissions was the indirect carbon emissions generated by auxiliary engineering power consumption,reaching 3,124,726 tons of CO2 equivalent followed by diesel used in vehicle transportation, and itscarbon emissions reached 793,399 t CO2 equivalent. In the pulp and paper workshops, the alkalirecovery, pulping and papermaking processes indirectly generated large amounts of carbon emissionsdue to the consumption of large amounts of heat and electricity.
In order to meet the demands for the final product, each process in the upstream of the supplychain invested a certain amount of resources and energy for production, resulting in embodied carbonflows. The conversion ratios of various materials in the production processes and the raw material

Forests 2019, 10, 725 16 of 23
ratio of the main products are shown in Tables S11–S14. Based on the product life cycle perspectiveand input–output model, we calculated the embodied carbon flows in the production processes in thereverse direction of the supply chain. The results are shown in Figure 9. As can be seen from the figure,the system involved a total amount of biomass carbon of about 1.39 million tons, including roots andbranches. These carbon sinks were embodied in the biomass material and flowed along the supplychain of the production system to the final product. In the wood handling workshop, a part of carbonwas embodied in the bark, about 100,000 tons, and was sent to the power boiler to burn with the coalto generate thermoelectric power. About 880,000 tons of carbon was embodied in the wood chips forpulping. In the carbon pulp and paper workshop, 440,000 tons were sent to the recovery boiler andburned in the black liquor. The slurry purchased from the external market contains about 440,000 tonsof carbon. Waste paper recycling and landfill disposal had important impacts on the carbon cycle.If the proportion of waste paper recycling is higher, the carbon emissions from landfill and combustionwill be less. There is still considerable uncertainty and potential in this area.
1
Figure 8. Carbon footprint of energy supply.
1
Figure 9. Embodied carbon flows based on product life cycle (unit: 10,000 t C).
Forests 2019, 10, 725 17 of 23
3.3. Flowchart of Material, Energy and Carbon Flows
Based on the above calculation and analysis, the whole flowchart of the energy flows, embodiedcarbon flows and emissions in the forestry-pulp and paper industry were obtained and depicted inFigure 10. The arrows represent the directions of the embodied carbon flows and energy flows. Theflowchart consisted of two major sections, the forestry-pulp and paper system and the CHP system.The thermal and electrical energy produced by CHP was supplied to various production process unitsin the pulp and paper mills. From Figure 10, we can observe the carbon flows embodied in the materialinput and product output, the thermoelectric energy consumption of each process unit and the carbonemissions from the energy consumption from the perspective of the overall landscape. For example,for forest tending and harvesting, involving 1.39 million tons of biomass carbon sinks, electricity usecontained 252,973 GJ of energy, and electricity consumption indirectly produced about 50,000 tonsof CO2 equivalent emissions. About 970,000 tons of carbon were embodied in the harvested logsand transported to the wood preparation plant. The remaining branches and roots contained about420,000 tons of carbon. Due to the complexity of the system, multiple processes in the productionsupply chain involved the circulation of materials and energy. For example, sludge produced bypulping was sent to a power boiler for combustion, and white liquor was reused in alkali recovery.Accurately estimating energy consumption and carbon emissions from various production processes isa huge challenge.
4. Discussion
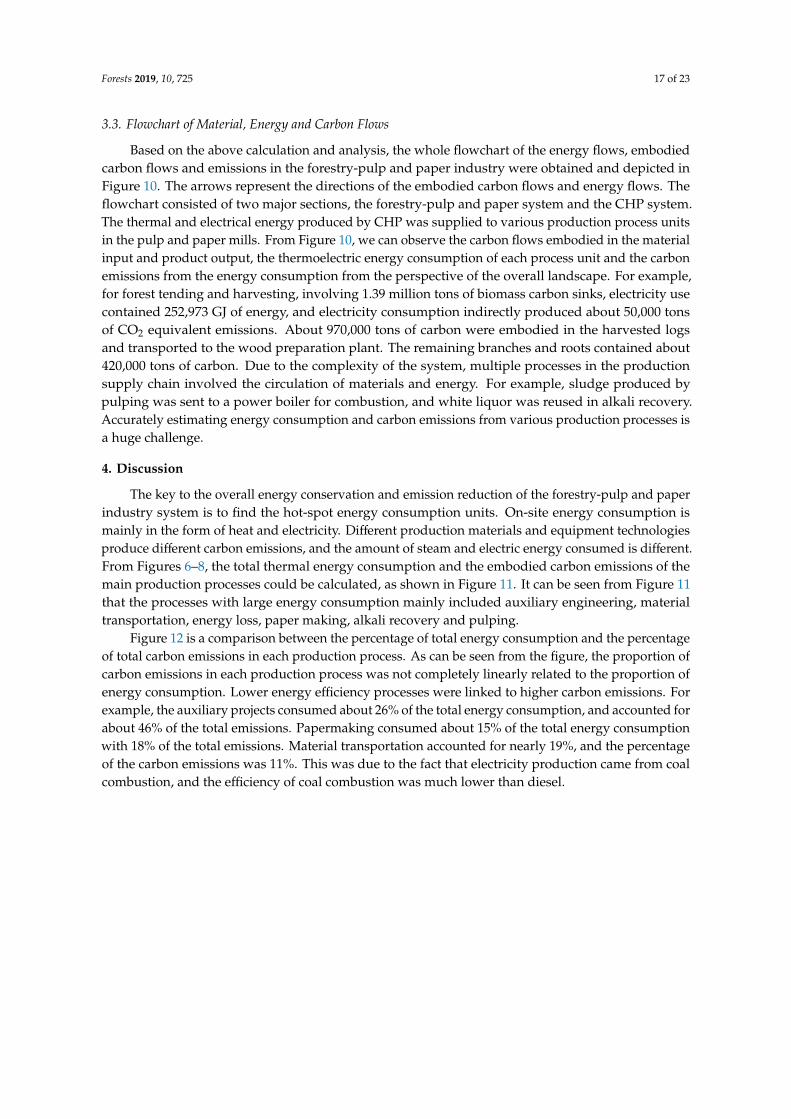
The key to the overall energy conservation and emission reduction of the forestry-pulp and paperindustry system is to find the hot-spot energy consumption units. On-site energy consumption ismainly in the form of heat and electricity. Different production materials and equipment technologiesproduce different carbon emissions, and the amount of steam and electric energy consumed is different.From Figures 6–8, the total thermal energy consumption and the embodied carbon emissions of themain production processes could be calculated, as shown in Figure 11. It can be seen from Figure 11that the processes with large energy consumption mainly included auxiliary engineering, materialtransportation, energy loss, paper making, alkali recovery and pulping.
Figure 12 is a comparison between the percentage of total energy consumption and the percentageof total carbon emissions in each production process. As can be seen from the figure, the proportion ofcarbon emissions in each production process was not completely linearly related to the proportion ofenergy consumption. Lower energy efficiency processes were linked to higher carbon emissions. Forexample, the auxiliary projects consumed about 26% of the total energy consumption, and accounted forabout 46% of the total emissions. Papermaking consumed about 15% of the total energy consumptionwith 18% of the total emissions. Material transportation accounted for nearly 19%, and the percentageof the carbon emissions was 11%. This was due to the fact that electricity production came from coalcombustion, and the efficiency of coal combustion was much lower than diesel.

Forests 2019, 10, 725 18 of 23Forests 2019, 10, x FOR PEER REVIEW 19 of 24
Figure 10. Flowchart of energy flows, embodied carbon flows and emissions in the forestry-pulp and paper industry (Units: Energy, GJ; embodied carbon flows, 10,000 t C;
carbon emissions, t CO2-equiv).
Figure 10. Flowchart of energy flows, embodied carbon flows and emissions in the forestry-pulp and paper industry (Units: Energy, GJ; embodied carbon flows,10,000 t C; carbon emissions, t CO2-equiv).
Forests 2019, 10, 725 19 of 23Forests 2019, 10, x FOR PEER REVIEW 20 of 24
Figure 11. Energy consumption and embodied carbon emissions from major production processes.
Figure 12. Comparison of energy consumption and carbon emissions in major production processes.
A plurality of hot-spot carbon flow paths can be obtained from Figures 9 and 10. A hot-spot carbon flow path refers to a path consisting of a series of adjacent production processes with high embodied carbon flows and large emissions. In consideration of the main production process units, the total number of carbon flow paths in the forestry-pulp and paper industry supply chain may be thousands or even tens of thousands, and detailed calculations need to be processed by means of network modeling and analysis tools [52,53]. In fact, in a carbon flow path, people are most concerned about a section with the largest carbon emissions, rather than the entire path, in order to accurately implement equipment technology upgrades or process modification measures to effectively reduce carbon emissions. Table 2 lists the key sections of the hot-spot carbon flow paths and their proportions. Among them, the path ① is one of the energy supply paths, and the rest are the production side paths. Figure 13 visually compares the amount of carbon emissions from each hotspot path and its proportion in the form of a histogram. As can be seen from the figure, the carbon emissions generated by path ① accounted for 74.6% of the total emissions generated by the energy supplies, and the carbon emissions generated by path 4 accounted for 22.7% of the total emissions generated by the energy consumption processes. Referring to Figure 11, we also know that one hot-spot carbon flow path usually contains hot-spot energy consumption units linked with major energy location processes.
Figure 11. Energy consumption and embodied carbon emissions from major production processes.
Forests 2019, 10, x FOR PEER REVIEW 20 of 24
Figure 11. Energy consumption and embodied carbon emissions from major production processes.
Figure 12. Comparison of energy consumption and carbon emissions in major production processes.
A plurality of hot-spot carbon flow paths can be obtained from Figures 9 and 10. A hot-spot carbon flow path refers to a path consisting of a series of adjacent production processes with high embodied carbon flows and large emissions. In consideration of the main production process units, the total number of carbon flow paths in the forestry-pulp and paper industry supply chain may be thousands or even tens of thousands, and detailed calculations need to be processed by means of network modeling and analysis tools [52,53]. In fact, in a carbon flow path, people are most concerned about a section with the largest carbon emissions, rather than the entire path, in order to accurately implement equipment technology upgrades or process modification measures to effectively reduce carbon emissions. Table 2 lists the key sections of the hot-spot carbon flow paths and their proportions. Among them, the path ① is one of the energy supply paths, and the rest are the production side paths. Figure 13 visually compares the amount of carbon emissions from each hotspot path and its proportion in the form of a histogram. As can be seen from the figure, the carbon emissions generated by path ① accounted for 74.6% of the total emissions generated by the energy supplies, and the carbon emissions generated by path 4 accounted for 22.7% of the total emissions generated by the energy consumption processes. Referring to Figure 11, we also know that one hot-spot carbon flow path usually contains hot-spot energy consumption units linked with major energy location processes.
Figure 12. Comparison of energy consumption and carbon emissions in major production processes.
A plurality of hot-spot carbon flow paths can be obtained from Figures 9 and 10. A hot-spotcarbon flow path refers to a path consisting of a series of adjacent production processes with highembodied carbon flows and large emissions. In consideration of the main production process units,the total number of carbon flow paths in the forestry-pulp and paper industry supply chain may bethousands or even tens of thousands, and detailed calculations need to be processed by means ofnetwork modeling and analysis tools [52,53]. In fact, in a carbon flow path, people are most concernedabout a section with the largest carbon emissions, rather than the entire path, in order to accuratelyimplement equipment technology upgrades or process modification measures to effectively reducecarbon emissions. Table 2 lists the key sections of the hot-spot carbon flow paths and their proportions.Among them, the path 1O is one of the energy supply paths, and the rest are the production side paths.Figure 13 visually compares the amount of carbon emissions from each hotspot path and its proportionin the form of a histogram. As can be seen from the figure, the carbon emissions generated by path 1Oaccounted for 74.6% of the total emissions generated by the energy supplies, and the carbon emissionsgenerated by path 4 accounted for 22.7% of the total emissions generated by the energy consumptionprocesses. Referring to Figure 11, we also know that one hot-spot carbon flow path usually containshot-spot energy consumption units linked with major energy location processes.

Forests 2019, 10, 725 20 of 23
Table 2. Hot-spot paths of carbon flows unit: Ton.
Code Key Sections of Hot-SpotCarbon Flow Paths
Emissions(10,000
CO2-equiv)Proportion (%) Note
1O Fuel—Thermal power station 678 74.6
Percentage of totalemissions. Fossil fuel
combustion produces alot of emissions
2O Forest harvesting—Materialtransport—Wood preparation 89 9.8%
Percentage of totalemissions. Diesel
combustion produces alarge amount of
emissions when truckstransport materials.
3O Black liquor—black liquorcombustion 140 15.4%
Percentage of totalemissions. Lean black
liquor concentration andcombustion consume a lot
of energy and producecarbon emissions.
4OPulping—Papermaking
Pulping—Pulp boardproduction
206 22.7%
Percentage of totalemissions. Paper and
pulp productionconsumes a lot of heat
and electricity.
5O White mud—Calcination 13 1.4%
Percentage of totalemissions. Calcinationreleases a lot of carbon
emissions.
6O Productdistribution—Transportation 79 8.7%
Percentage of totalemissions. Distributiondistances and quantitiesaffect carbon emissions
and their flows.
Forests 2019, 10, x FOR PEER REVIEW 21 of 24
Table 2. Hot-spot paths of carbon flows unit: Ton.
Code Key Sections of Hot-Spot
Carbon Flow Paths
Emissions (10,000
CO2-equiv)
Proportion (%) Note
① Fuel—Thermal power station 678 74.6 Percentage of total emissions.
Fossil fuel combustion produces a lot of emissions
② Forest harvesting—Material transport—Wood preparation 89 9.8%
Percentage of total emissions. Diesel combustion produces a
large amount of emissions when trucks transport
materials.
③ Black liquor—black liquor combustion
140 15.4%
Percentage of total emissions. Lean black liquor
concentration and combustion consume a lot of energy and produce carbon emissions.
④ Pulping—Papermaking Pulping—Pulp board
production 206 22.7%
Percentage of total emissions. Paper and pulp production consumes a lot of heat and
electricity.
⑤ White mud—Calcination 13 1.4% Percentage of total emissions. Calcination releases a lot of
carbon emissions.
⑥ Product distribution—Transportation 79 8.7%
Percentage of total emissions. Distribution distances and
quantities affect carbon emissions and their flows.
Figure 13. Hot-spot carbon flow paths.
5. Conclusions
The forestry-pulp and paper industry is a typical high energy consumption and high emission industry. We conducted an in-depth research on the energy flows and carbon footprint of the forestry-pulp paper industry. The results show that: (1) The main sources of energy supply included external fossil fuel coal and internal biomass fuel black liquor, which supplied 30,057,300 GJ and 14,854,000 GJ respectively; external electricity and internal bark provided a small amount of energy to the system; in addition, the energy produced by diesel in material transportation reached 11,624,256 GJ. (2) The main energy consumption processes included auxiliary engineering projects,
Figure 13. Hot-spot carbon flow paths.
5. Conclusions
The forestry-pulp and paper industry is a typical high energy consumption and high emissionindustry. We conducted an in-depth research on the energy flows and carbon footprint of theforestry-pulp paper industry. The results show that: (1) The main sources of energy supplyincluded external fossil fuel coal and internal biomass fuel black liquor, which supplied 30,057,300
Forests 2019, 10, 725 21 of 23
GJ and 14,854,000 GJ respectively; external electricity and internal bark provided a small amount ofenergy to the system; in addition, the energy produced by diesel in material transportation reached11,624,256 GJ. (2) The main energy consumption processes included auxiliary engineering projects,material transportation, papermaking, alkali recovery, pulping and other production workshops. Thepercentages of energy consumption accounted for 26%, 18%, 15%, 10% and 6%, respectively. (3) Themain sources of carbon included coal and forest biomass, reaching 770,000 tons and 1.39 million tons,respectively. (4) Carbon emissions mainly occurred in fuel combustion in CHP and diesel combustionin material transportation, reaching 6.78 million tons and 790,000 tons of carbon, respectively. (5) Basedon steam and electricity consumption, the indirect carbon emissions of various thermal and electricenergy production units were calculated, and the key energy consumption process units and hotspotcarbon flow paths were further found, which established a theoretical and methodological basis forenergy conservation and emission reduction.
Supplementary Materials: The following are available online at http://www.mdpi.com/1999-4907/10/9/725/s1,Table S1: Energy consumption intensity table of major production processes, Table S2: Energy supply andconversion parameters in the forestry pulp and paper industry, Table S3: Carbon content of materials, Table S4:Conversion ratio parameters of materials in the supply chain, Table S5: Proportions of raw materials for high-gradepackaging cardboard, Table S6: Main raw materials of high-grade writing paper, Table S7: Main raw materials ofcoated paper, Table S8: Boiler performance parameters, Table S9: Turbine generator set performance parameters,Table S10: Main production workshop heat load parameters, Table S11: Energy value and boiler combustionefficiency, Table S12: Carbon emissions parameters of raw materials, Table S13: Global warming potential ofgreenhouse gases for 100 years, Table S14: Emission Factors.
Author Contributions: Conceptualization, Q.Z.; methodology, Q.Z. and S.D.; investigation, Q.Z., Z.W. and A.T.;resources, Z.W.; writing—original draft preparation, Q.Z.; All authors contributed with ideas and discussion.
Funding: This research was funded by National Natural Science Foundation of China, grant number 71373125;Project of International Cooperation and Exchanges of National Natural Science Foundation NSFC, grant number3136113034 and Academy of Finland, Grant number 265593.
Conflicts of Interest: The authors declare no conflict of interest.
References
1. Liu, Z.; Guan, D.; Wei, W.; Davis, S.J.; Ciais, P.; Bai, J.; Peng, S.; Zhang, Q.; Hubacek, K.; Marland, G.; et al.Reduced carbon emission estimates from fossil fuel combustion and cement production in China. Nature2015, 524, 335–338. [CrossRef] [PubMed]
2. Geels, F.W.; Sovacool, B.K.; Schwanen, T.; Sorrell, S. Sociotechnical transitions for deep decarbonization.Science 2017, 357, 1242–1244. [CrossRef] [PubMed]
3. Geels, F.W.; Schwanen, T.; Sorrell, S.; Jenkins, K.; Sovacool, B.K. Reducing energy demand through lowcarbon innovation: A sociotechnical transitions perspective and thirteen research debates. Energy Res.Soc. Sci. 2018, 40, 23–35. [CrossRef]
4. Wesseling, J.H.; Lechtenböhmer, S.; Åhman, M.; Nilsson, L.J.; Worrell, E.; Coenen, L. The transition of energyintensive processing industries towards deep decarbonization: Characteristics and implications for futureresearch. Renew. Sustain. Energy Rev. 2017, 79, 1303–1313. [CrossRef]
5. IEA (International Energy Agency). Global Energy and CO2 Status Report. 2019. Available online:https://webstore.iea.org/global-energy-CO2-status-report-2018 (accessed on 5 March 2019).
6. He, Z.X.; Shen, W.X.; Li, Q.B.; Xu, S.C.; Zhao, B.; Long, R.Y.; Chen, H. Investigating external and internalpressures on corporate environmental behavior in papermaking enterprises of China. J. Clean. Prod. 2018,172, 1193–1211. [CrossRef]
7. Chen, J.; Ter-Mikaelian, M.T.; Yang, H.; Colombo, S.J. Assessing the greenhouse gas effects of harvested woodproducts manufactured from managed forests in Canada. For. Int. J. For. Res. 2018, 91, 193–205. [CrossRef]
8. Zhang, X.; Yang, H.; Chen, J. Life-cycle carbon budget of China’s harvested wood products in 1900–2015.For. Policy Econ. 2018, 92, 181–192. [CrossRef]
9. Cotea, W.A.; Younga, R.J.; Risseb, K.B. A carbon balance method for paper and wood products. Environ.Pollut. 2002, 116, 1–6. [CrossRef]

Forests 2019, 10, 725 22 of 23
10. Shabbir, I.; Mirzaeian, M. Carbon emissions reduction potentials in pulp and paper mills by applyingcogeneration technologies. Energy Procedia 2017, 112, 142–149. [CrossRef]
11. Korhonen, J.; Wihersaari, M.; Savolainen, I. Industrial ecosystem in the Finnish forest industry: Using thematerial and energy flow model of a forest ecosystem in a forest industry system. Ecol. Econ. 2001, 39,145–161. [CrossRef]
12. Trudeau, N.; Tam, C.; Graczyk, D.; Taylor, P. Energy Transition for Industry: India and the Global Context; IEA(International Energy Agency): Paris, France, 2011.
13. Kong, L.; Hasanbeigi, A.; Price, L. Assessment of emerging energy-efficiency technologies for the pulp andpaper industry: A technical review. J. Clean. Prod. 2016, 122, 5–28. [CrossRef]
14. Kong, L.; Price, L.; Hasanbeigi, A.; Liu, H.; Li, J. Potential for reducing paper mill energy use and carbondioxide emissions through plant-wide energy audits: A case study in China. Appl. Energy 2013, 102,1334–1342. [CrossRef]
15. Bieler, P.S.; Fischer, U.; Hungerbühler, K. Modeling the Energy Consumption of Chemical Batch Plants:Bottom-Up Approach. Ind. Eng. Chem. Res. 2004, 42, 6135–6144. [CrossRef]
16. Chen, H.W.; Hsu, C.H.; Hong, G.B. The case study of energy flow analysis and strategy in pulp and paperindustry. Energy Policy 2012, 43, 448–455. [CrossRef]
17. Hong, G.B.; Ma, C.M.; Chen, H.W.; Chuang, K.J.; Chang, C.T.; Su, T.L. Energy flow analysis in pulp andpaper industry. Energy 2011, 36, 3063–3068. [CrossRef]
18. TAPPI. Available online: https://www.tappi.org/industries/bioenergy/ (accessed on 8 May 2019).19. CEPI (Confederation of European Paper Industries). Unfold the Future: The Forest Fibre Industry—2050
Roadmap to a Low-Carbon Bio-Economy; Confederation of European Paper Industries: Brussels, Belgium, 2011.20. Fisher, R. Analyzing Carbon Emissions in the Pulp and Paper Industry. 2014. Available online: http:
//www.tappi.org (accessed on 10 August 2018).21. Laurijssen, J.; Faaij, A.; Worrell, E. Benchmarking energy use in the paper industry: A benchmarking study
on process unit level. Energy Effic. 2013, 6, 49–63. [CrossRef]22. Manda, B.M.K.; Blok, K.; Patel, M.K. Innovations in papermaking: An LCA of printing and writing paper
from conventional and high yield pulp. Sci. Total Environ. 2012, 439, 307–320. [CrossRef]23. Mantau, U. Wood flow analysis: Quantification of resource potentials, cascades and carbon effects. Biomass
Bioenergy 2015, 79, 28–38. [CrossRef]24. Sun, M.; Wang, Y.; Shi, L.; Klemeš, J.J. Uncovering energy use, carbon emissions and environmental burdens
of pulp and paper industry: A systematic review and meta-analysis. Renew. Sustain. Energy Rev. 2018, 92,823–833. [CrossRef]
25. AIChE (American Institute of Chemical Engineers). Pulp and Paper Industry Energy Bandwidth Study; AmericanInstitute of Chemical Engineers: New York, NY, USA, 2006.
26. Zhao, Q.; Wen, Z.; Toppinen, A. Constructing the embodied Carbon flows and emissions landscape from theperspective of supply chain. Sustainability 2018, 10, 3865. [CrossRef]
27. Toppinen, A.; Korhonen, K.K. Global Reporting Initiative and social impact in managing corporateresponsibility: A case study of three multinationals in the forest industry. Bus. Ethics Eur. Rev. 2013, 22,202–217. [CrossRef]
28. D’Amato, D.; Wan, M.; Li, N.; Rekola, M.; Toppinen, A. Managerial Views of Corporate Impacts andDependencies on Ecosystem Services: A Case of International and Domestic Forestry Companies in China.J. Bus. Ethics 2018, 150, 1–18. [CrossRef]
29. Xu, T.; Galama, T.; Sathaye, J. Reducing carbon footprint in cement material making: Characterizing costs ofconserved energy and reduced carbon emissions. Sustain. Cities Soc. 2013, 9, 54–61. [CrossRef]
30. Acquaye, A.; Genovese, A.; Barrett, J.; Koh, S.L. Benchmarking carbon emissions performance in supplychains. Supply Chain Manag. Int. J. 2014, 19, 306–321. [CrossRef]
31. Karali, N. Greenhouse Gas Mitigation Options in ISEEM Global Energy Model: 2010–2050 Scenario Analysis forLeast-Cost Carbon Reduction in Iron and Steel Sector; Lawrence Berkeley National Laboratory: Berkeley, CA,USA, 2014.
32. Martin, N.; Anglani, N.; Einstein, D. Opportunities to Improve Energy Efficiency and Reduce Greenhouse GasEmissions in the U.S. Pulp and Paper Industry; Ernest Orlando Lawrence Berkeley National Laboratory (LBNL):Berkeley, CA, USA, 2000.
Forests 2019, 10, 725 23 of 23
33. Mateos-Espejel, E.; Savulescu, L.; Maréchal, F.; Paris, J. Base case process development for energy efficiencyimprovement, application to a Kraft pulping mill. Part II: Benchmarking analysis. Chem. Eng. Res. Des. 2011,89, 729–741. [CrossRef]
34. Chen, C.; Qiu, R.Z. Estimation of energy consumption and carbon emissions of China’s pulp & paper industry.Chung-kuo Tsao Chih/China Pulp Pap. 2014, 33, 50–55.
35. Brueske, S.; Sabouni, R.; Zach, C.; Andres, H. U.S. Manufacturing Energy Use and Greenhouse Gas EmissionsAnalysis; Office of Scientific & Technical Information Technical Reports; Office of Energy Efficiency &Renewable Energy: Washington, DC, USA, 2012; Volume 249, pp. 4196–4201.
36. England, J.; May, B.; Raison, R.; Paul, K. Cradle-to-gate inventory of wood production from Australiansoftwood plantations and native hardwood forests: Carbon sequestration and greenhouse gas emissions.Forest. Ecol. Manag. 2013, 302, 295–307. [CrossRef]
37. Wagner, M.; Lippe, M.; Lewandowski, I.; Salzer, M.; Cadisch, G. CO2 footprint of the seeds of rubber (Heveabrasiliensis) as a biodiesel feedstock source. Forests 2018, 9, 548. [CrossRef]
38. Chen, H.; Chen, G.Q. Energy cost of rapeseed-based biodiesel as alternative energy in China. Renew. Energy2011, 36, 1374–1378. [CrossRef]
39. Pineda-Henson, R.; Culaba, A.B.; Mendoza, G.A. Evaluating Environmental Performance of Pulp and PaperManufacturing Using the Analytic Hierarchy Process and Life-Cycle Assessment. J. Ind. Ecol. 2010, 6, 15–28.[CrossRef]
40. Leuschner, C.; Moser, G.; Hertel, D.; Erasmi, S.; Leitner, D.; Culmsee, H.; Schuldt, B.; Schwendenmann, L.Conversion of tropical moist forest into cacao agroforest: consequences for carbon pools and annual Csequestration. Agrofor. Syst. 2013, 87, 1173–1187. [CrossRef]
41. Hu, Y.; Lin, J.; Cui, S.; Khanna, N.Z. Measuring urban carbon footprint from carbon flows in the globalsupply chain. Environ. Sci. Technol. 2016, 50, 6154–6163. [CrossRef] [PubMed]
42. Kang, C.; Zhou, T.; Chen, Q.; Wang, J.; Sun, Y.; Xia, Q.; Yan, H. Carbon Emission Flow from Generation toDemand: A Network-Based Model. IEEE Trans. Smart Grid 2017, 6, 2386–2394. [CrossRef]
43. NCASI (National Council for Air and Stream Improvement, Inc.). Calculation Tools for Estimating GreenhouseGas Emissions from Pulp and Paper Mills Version 1.1; National Council for Air and Stream Improvement, Inc.:Research Triangle Park, NC, USA, 2005.
44. Gu, L.; Zhou, Y.; Mei, T.; Zhou, G.; Xu, L. Carbon Footprint Analysis of Bamboo ScrimberFlooring—Implications for Carbon Sequestration of Bamboo Forests and Its Products. Forests 2019, 10, 51.[CrossRef]
45. BSI (British Standards Institution). PAS 2050: Specification for the Assessment of the Life Cycle Greenhouse GasEmissions of Goods and Services; British Standards Institution: London, UK, 2011.
46. Weaver, A.J. Climate change. Toward the second commitment period of the Kyoto Protocol. Science 2011,332, 795–796. [CrossRef] [PubMed]
47. Schulze, E.D.; Luyssaert, S.; Ciais, P.; Freibauer, A.; Janssens, I.A.; Soussana, J.F.; Smith, P.; Grace, J.; Levin, I.;Thiruchittampalam, B.; et al. Importance of methane and nitrous oxide for Europe’s terrestrial greenhouse-gasbalance. Nat. Geosci. 2009, 4, 1685–1690. [CrossRef]
48. IPCC (Intergovemmental Panel on Climate Change). Greenhouse Gas Inventory Book—1996 IPCC Guidelines forNational Greenhouse Gas Inventories; IPCC: Geneva, Switzerland, 1996.
49. Cheng, H.; Dong, S.; Li, F.; Yang, Y.; Li, S.; Li, Y. Multiregional Input-Output Analysis of Spatial-TemporalEvolution Driving Force for Carbon Emissions Embodied in Interprovincial Trade and Optimization Policies:Case Study of Northeast Industrial District in China. Environ. Sci. Technol. 2018, 52, 346–358. [CrossRef]
50. Sarkis, J. A boundaries and flows perspective of green supply chain management. Supply Chain Manag. Int. J.2012, 17, 202–216. [CrossRef]
51. Tukker, A.; Dietzenbacher, E. Global multiregional input-output frameworks: An introduction and outlook.Econ. Syst. Res. 2013, 25, 1–19. [CrossRef]
52. Sankey Diagram Software. Available online: https://www.ifu.com/e-sankey/? (accessed on 6 June 2018).53. Ulanowicz, R.E. Identifying the structure of cycling in ecosystems. Math. Biosci. 1983, 65, 219–237. [CrossRef]
© 2019 by the authors. Licensee MDPI, Basel, Switzerland. This article is an open accessarticle distributed under the terms and conditions of the Creative Commons Attribution(CC BY) license (http://creativecommons.org/licenses/by/4.0/).