Embed Size (px)
Citation preview
Green Technology and Low Carbon Building
Development Programme
26 November 2013
Energy Management in Buildings
- To reduce energy and carbon emission for
(New Design & Existing Buildings)(New Design & Existing Buildings)
2829102 2829102
Steve Anthony LojuntinSteve Anthony LojuntinSustainable Energy Development Authority (SEDA Malaysia)Sustainable Energy Development Authority (SEDA Malaysia)
Tel / SMS / Tel / SMS / WhatsUpWhatsUp: +6019: +6019--2829102 2829102 EE--mail : mail : [email protected]@seda.gov.my / [email protected]/ [email protected]
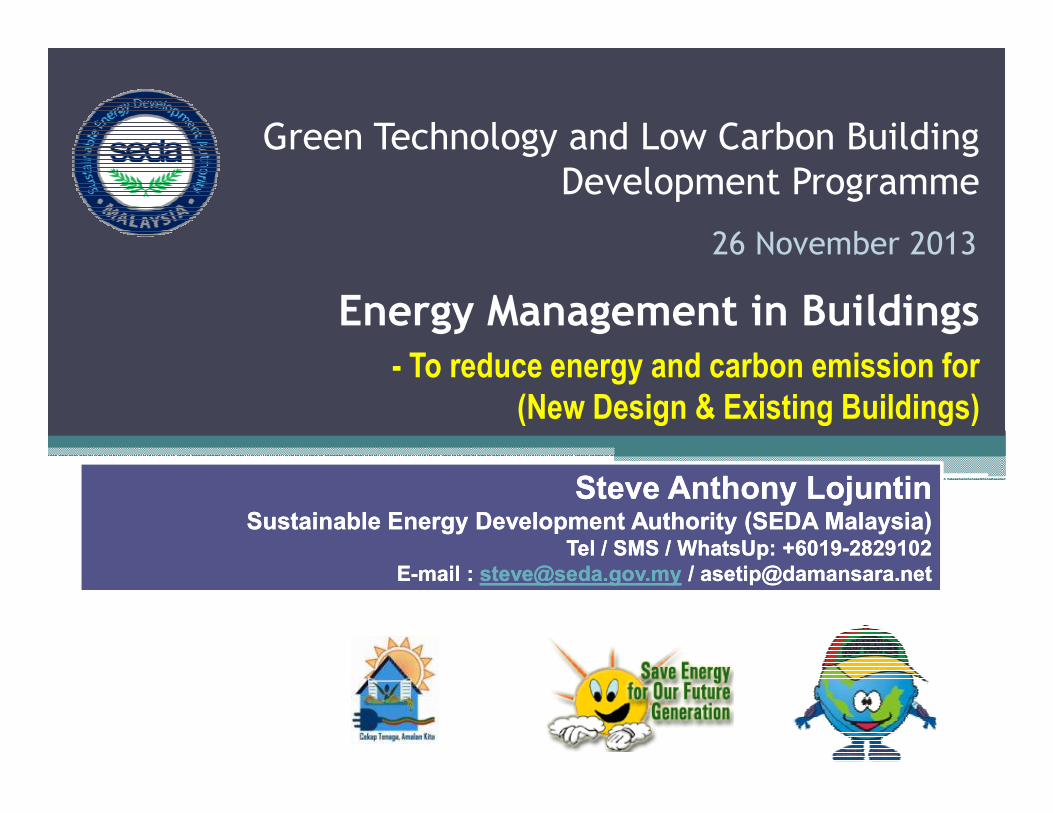
Low Carbon Building System (Common Carbon
Metric) ** Alternative approach
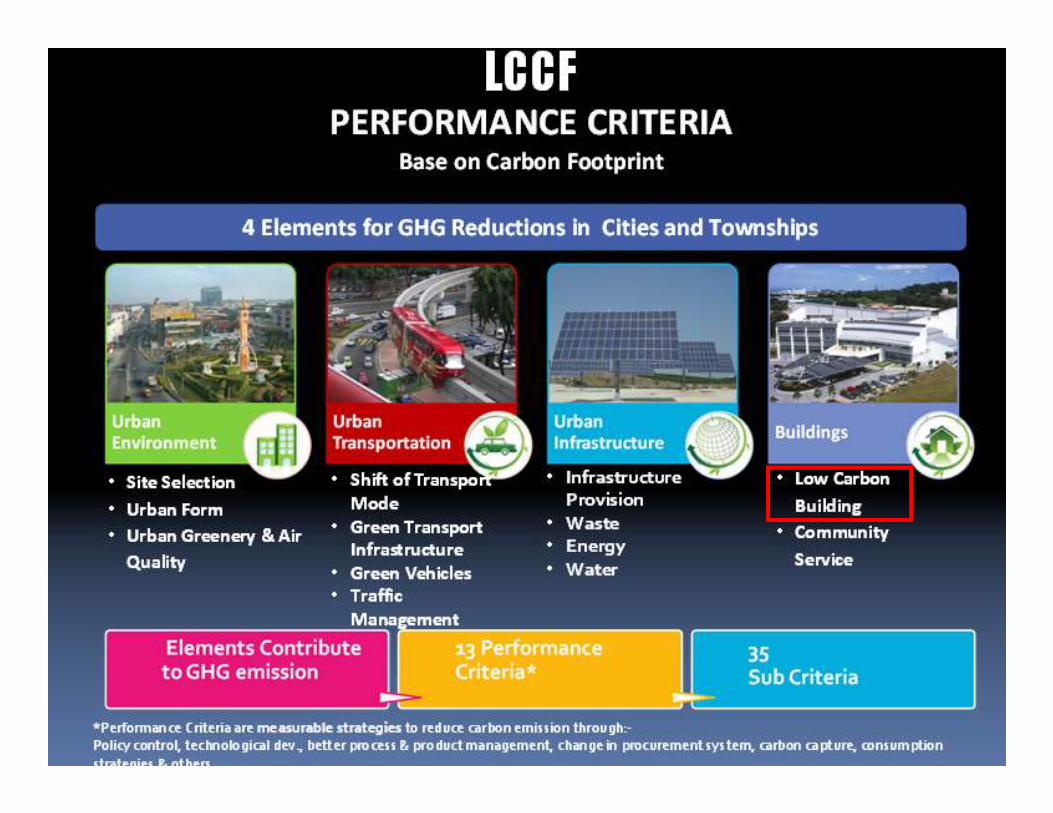
Performance Criteria for GHG Reductions for Cities
• Urban Environment
• Urban Transportation
• Urban Infrastructure
• Urban Environment (20)
• Urban Transportation (8)
• Urban Infrastructure (7)
• Urban Environment (5)
• Urban Transportation (4)
• Urban Infrastructure (4)
4
• Urban Infrastructure
• Building
• Urban Infrastructure (7)
• Building (7)
• Urban Infrastructure (4)
• Building (2)
Save Green Save FutureSave Green Save FutureSave Green Save FutureSave Green Save Future
4
Performance Criteria are measurable strategies to reduce
carbon emission through:-- Policy control, Technological development, better process & product
management, change in procurement system, carbon capture, consumption
strategies & others.

Relation between use of energy and the environment
0.747 kg of CO2 emitted to the atmosphere for
each 1 kWh electricity generated by power
plant (Peninsula Malaysia)
Kawasan 2011
Semenanjung Malaysia 0.747 kg CO2 / kwj
Sarawak 0.841 kg CO2 / kwj
Sabah 0.531 kg CO2 / kwj
Sumber: Laporan Penanda Aras Clean Development Mechanism (CDM) Malaysia
2011 oleh Malaysian Green Technology Corporation
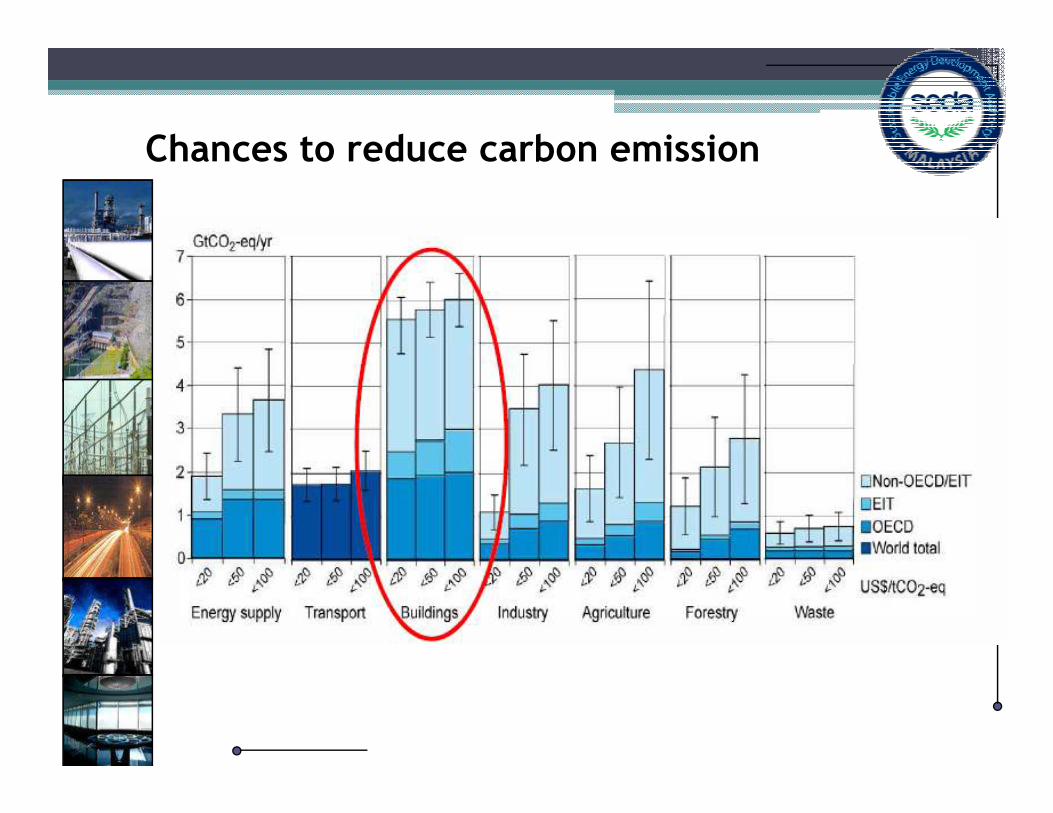
Chances to reduce carbon emission

Carbon emission in a life cycle of a building
Pre -
Design
Normally addressed by
Conventional Green
Building Tools
[Embodied CO2 footprint]
: Only 20% of total
emission
Building
Lifecycle Use, Management &
Maintenance
[Operational CO2 footprint]
: 80% of total
emission (HIGHER)]
FACT! Most of the CO2e emission is during the operation phase !!
ENERGY MANAGEMENT to tackle the source of the CO2 emission

What is Energy Management ?
� Energy Management is a term can be viewed as :
a) Energy Efficiency:-Using the most efficient technology / approach to achieve a
specific task to reduce energy consumption. (such as using
compact florescent instead of incandescent lamp)
b) Energy Conservation:-b) Energy Conservation:-Saving energy by undertaking a specific action (such as switching
off a light/equipment when it is not needed)
c) Tariff conservation:-To ensure being charge under the correct and most economical
tariff for operation. (Electricity tariff)
d) Energy type selection:-Using the most economical energy source
for your operation.
(eq. LPG/NG for hot water system)
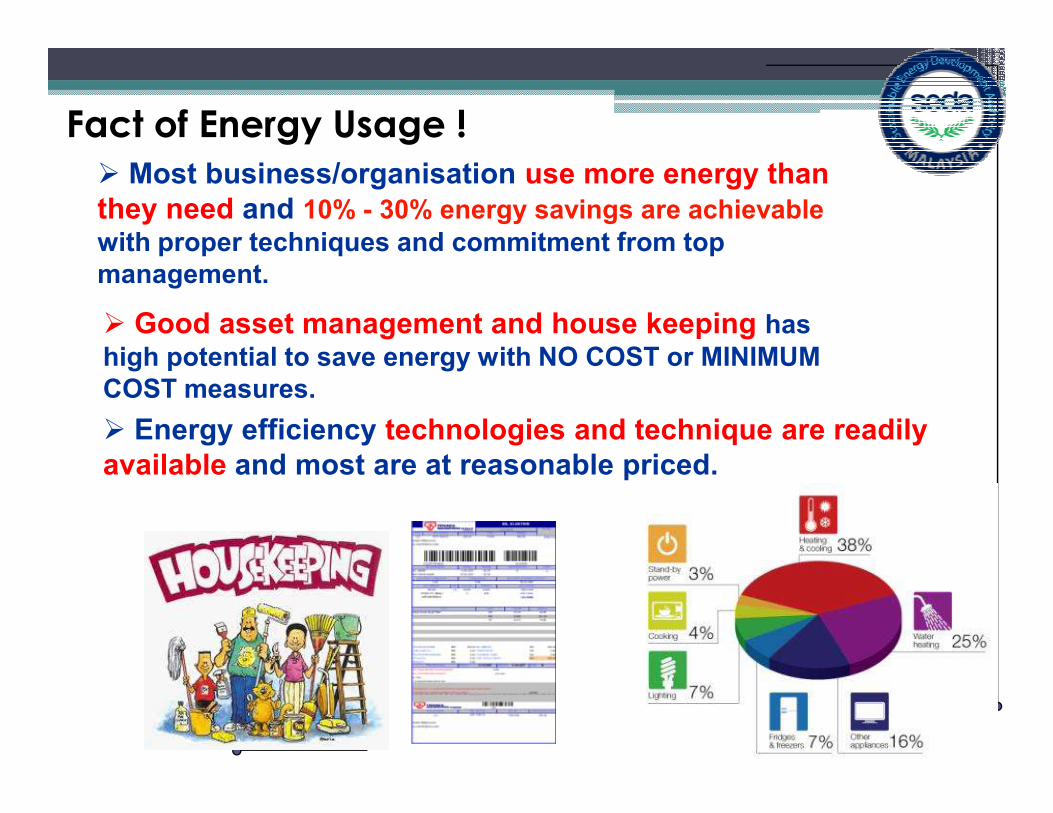
Fact of Energy Usage !
� Most business/organisation use more energy than they need and 10% - 30% energy savings are achievablewith proper techniques and commitment from top management.
� Good asset management and house keeping has high potential to save energy with NO COST or MINIMUM COST measures.
� Energy efficiency technologies and technique are readily available and most are at reasonable priced.

Energy Used in Buildings / Business
Premises
Plug
loads/others
20%
EnergyCentral A/C
55%
Split A/C
7%
Lighting
18%
Source: Energy Audit in
Government Buildings (2003)
Energy

Energy Used in an Industrial Building
EnergyEnergy

Energy consumption at home:

Energy Management for Existing Buildings
Energy Management for Existing Buildings

Energy Management Process
Organise
management
resources
1
Appoint an
Energy
Manager
2
Report & review
results regularly
9
Annual
review
10
Feed Back
Prepare an
energy
policy
3
Set up an energy
monitoring &
reporting system
4
Implement a staff
awareness &
train ing program
5Conduct an
energy audit
6
Prepare a plan
of action
based on
audit's findings
7
Implement
actions
8
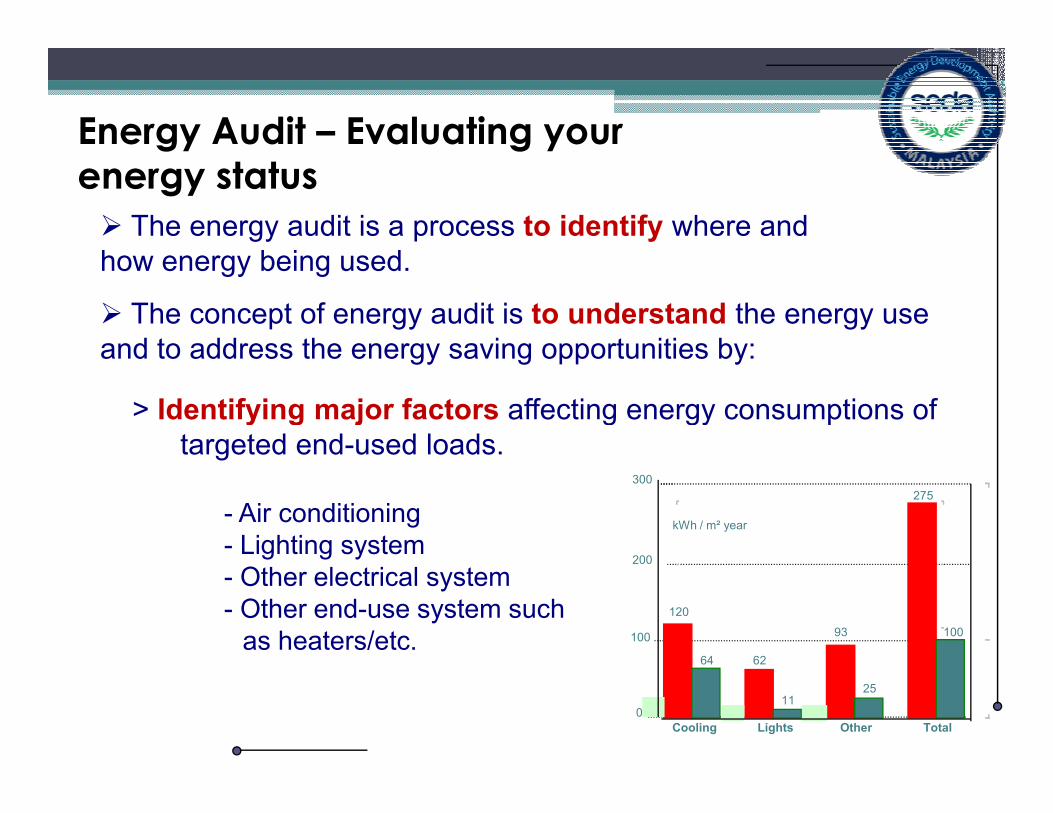
Energy Audit – Evaluating your
energy status
� The energy audit is a process to identify where and how energy being used.
� The concept of energy audit is to understand the energy use and to address the energy saving opportunities by:
> Identifying major factors affecting energy consumptions of > Identifying major factors affecting energy consumptions of targeted end-used loads.
- Air conditioning
- Lighting system
- Other electrical system
- Other end-use system such
as heaters/etc.
0
100
200
300
Cooling Lights Other Total
120
64 62
11
93
25
275
100
kWh / m² year
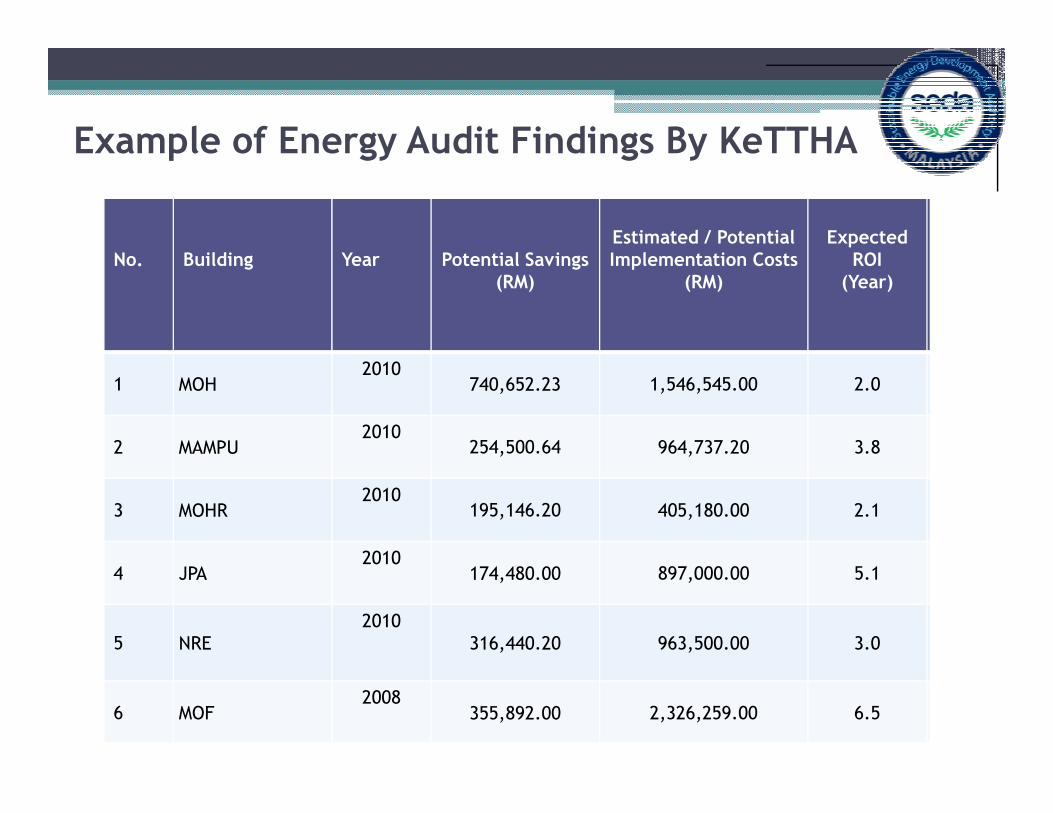
Example of Energy Audit Findings By KeTTHA
No. Building Year Potential Savings(RM)
Estimated / Potential Implementation Costs
(RM)
Expected ROI(Year)
Status of Implementation
1 MOH2010
740,652.23 1,546,545.00 2.0
2 MAMPU2010
254,500.64 964,737.20 3.8 in progress
3 MOHR2010
195,146.20 405,180.00 2.1
4 JPA2010
174,480.00 897,000.00 5.1
5 NRE
2010
316,440.20 963,500.00 3.0in progress
6 MOF2008
355,892.00 2,326,259.00 6.5 Implemented
Selayang2008
� Potential Saving in Electrical System.
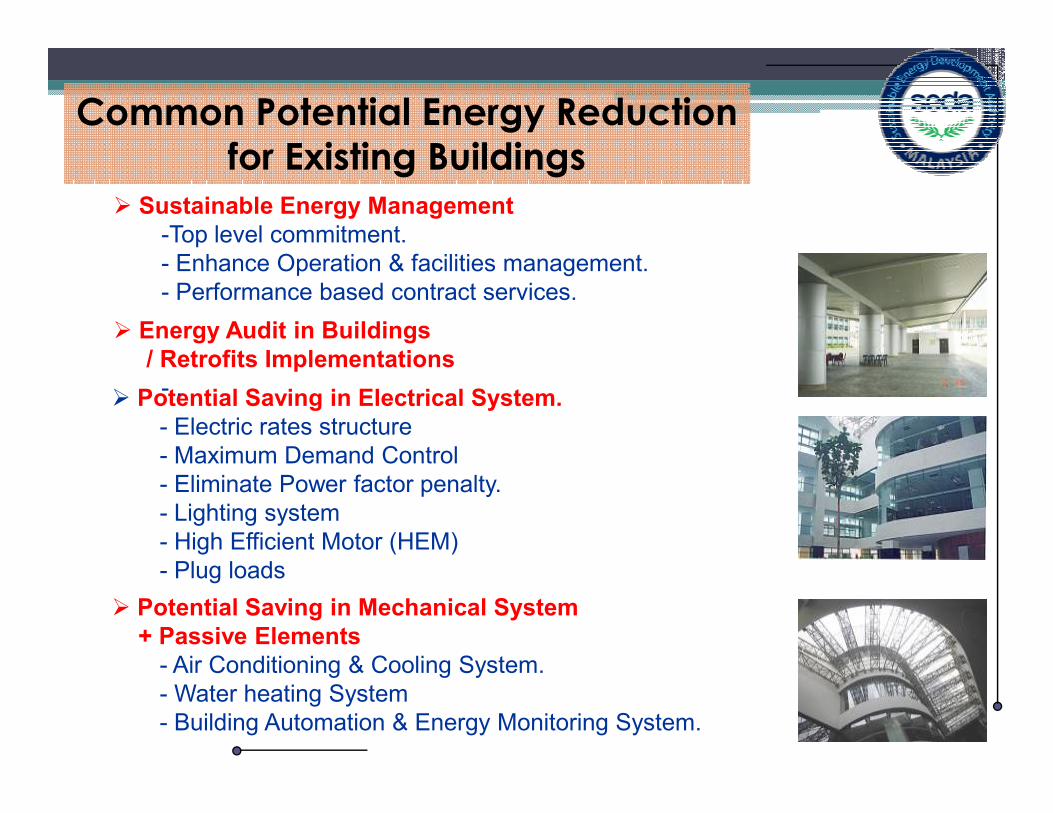
Common Potential Energy Reduction
for Existing Buildings� Sustainable Energy Management
-Top level commitment.
- Enhance Operation & facilities management.
- Performance based contract services.
� Energy Audit in Buildings / Retrofits Implementations - .
� Potential Saving in Electrical System.- Electric rates structure
- Maximum Demand Control
- Eliminate Power factor penalty.
- Lighting system
- High Efficient Motor (HEM)
- Plug loads
� Potential Saving in Mechanical System + Passive Elements- Air Conditioning & Cooling System.
- Water heating System
- Building Automation & Energy Monitoring System.

� ESCOs Partnership Programme / Energy Performance Contracting (EPC)
- Energy Saving Share programme. - One of the best mechanism in reducing operation cost with minimum / no investment cost to the owner.- Only pay when there is saving.
No saving = No Payment !
- Only pay when there is saving.
- Reduce cost in Energy (& water) Management implementation.
- Generate greater consciousness amongst Facilities Management companies to participate in saving programme.- Able to generate fund / incentive to reward staffs / team members.
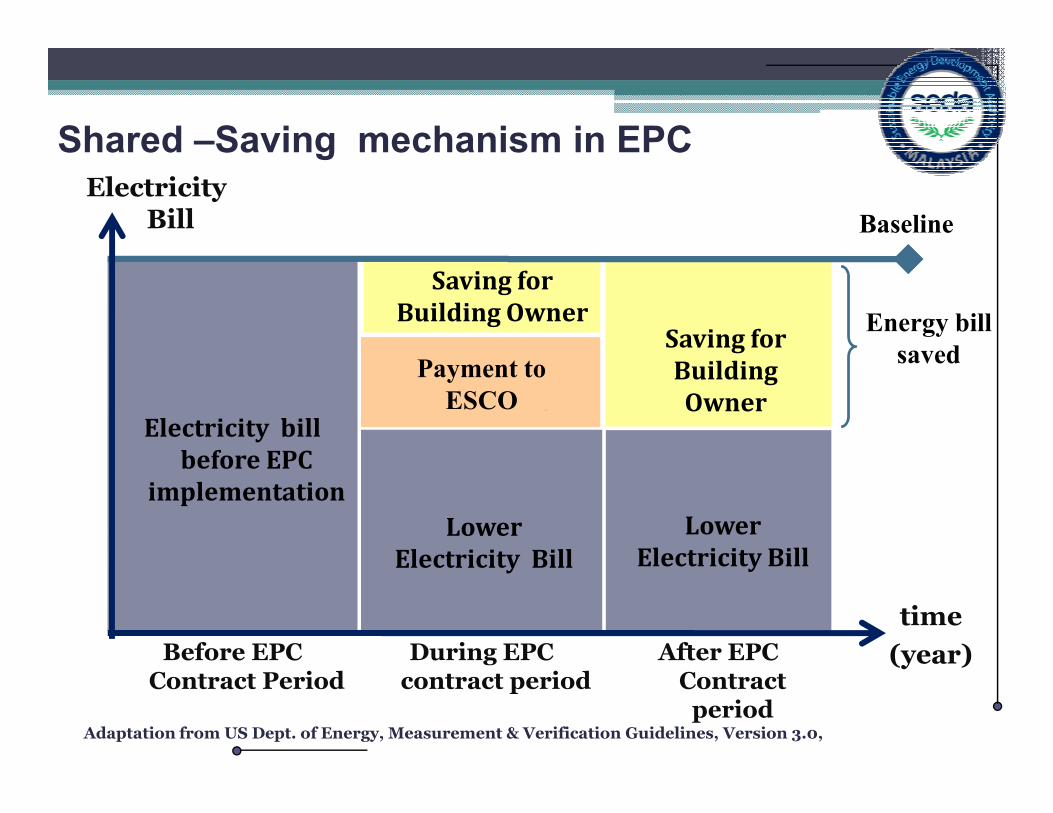
Shared –Saving mechanism in EPCElectricity
Bill
Energy bill
savedPayment to
ESCO
Government’s
SavingsSaving for
Building Owner
Baseline
Saving for
Building
Owner
Adaptation from US Dept. of Energy, Measurement & Verification Guidelines, Version 3.0,
time
(year)During EPC contract period
Lower
Electricity Bill
After EPC Contract
period
Before EPC Contract Period
Electricity bill
before EPC
implementation
ESCO
Lower
Electricity Bill
Owner

Energy Management for New Buildings DesignEnergy Management for New Buildings Design
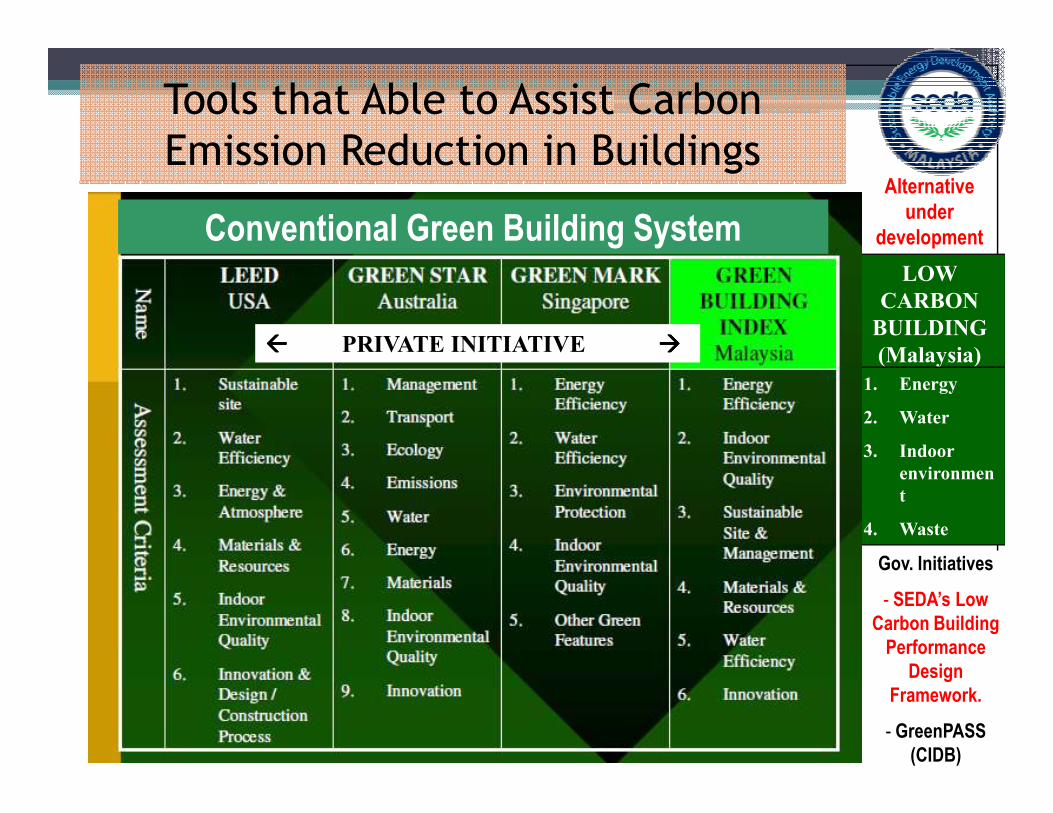
Tools that Able to Assist Carbon
Emission Reduction in Buildings
LOW
CARBON
BUILDING
(Malaysia)
1. Energy
2. Water
Alternative
under
development
���� PRIVATE INITIATIVE ����
Conventional Green Building System
2. Water
3. Indoor
environmen
t
4. Waste
Gov. Initiatives
- SEDA’s Low
Carbon Building
Performance
Design
Framework.
- GreenPASS
(CIDB)

• Low Carbon Building is similar to the conventional green building system which promotes uses of green technology and green habits to reduce the degradation of the environment.
• Use Carbon as metric for quantitative references to
What are the Low Carbon buildings
• Use Carbon as metric for quantitative references to achieve the actual environment impact and not based on points collected.
• A performance based: - Doesn’t assess on how the buildings to be designed.- Focus and measure what is the performance of it.
• Straight forward, flexible, transparent, easy to implement, consistance, easy to monitor since based on actual performance. Measurable, recordable, comparable, justifiable, can be monitor and easy to proof.
What are the Low Carbon buildings
and easy to proof.
• Cheaper and affordable since it is straight forward and focus only the relevant criteria that have high impact (lower $$$/CO2 reduction cost).
• Global trend - Relevant and gain popularity at international level.

Low Carbon Building Assessment System - GreenPASS by CIDB (Construction Industry Standard, CIS 20 - Draft)
- Green PASS is a
Green Building Rating
- Green PASS estimate the carbon emission from building construction works and building
operationsRating Tool
operations
The application of Green PASS is for:
1) Building Construction; and2) Building Operations

Proposed GreenPASS Diamond Rating Scheme by CIDB
Level of Achievement
(% of CO2e Reduction)
Diamond Rating
Scheme
Diamond Rating
Scheme
(without bonus
rating)*(with bonus rating)
100% Carbon Neutral
+
+
≥ 70 to < 100
≥ 50 to < 70
≥ 30 to < 50
≥ 10 to < 30
≥ 1 to < 10
+
+
+
+
+* Bonus Rating ONLY applicable for Building Construction Category – 70% IBS Score, 3
Star SHASSIC Rating, 70% QLASSIC Score

- Developed based on series of R&D, pilot projects, studies and continuosactual building performance monitoring since 2002.
- The Sustainable Low Carbon Building Performance are mostly refer to the technology, applications and management that has impact to the Energy and Environment related to building operation & services
a) Design : Sustainable Energy (Energy Efficiency &
Sustainable Low Carbon Building Method
- By SEDA Malaysia
a) Design : Sustainable Energy (Energy Efficiency & Renewable Energy)
b) Office / Home appliances
c) Operation: Energy & Environment management in the O&M.
d) Renovation / retrofiting
e) End users awareness
PRACTICAL SOLUTIONTO ACHIEVE LOW CARBON GREEN BUILDING WITH
REASONABLE COST

SEDA’s LOW CARBON BUILDING METHOD:SEDA’s LOW CARBON BUILDING METHOD:INTEGERATED DESIGN APPROACH TO GET THE BEST INTEGERATED DESIGN APPROACH TO GET THE BEST
/ LOWEST POSSIBLE ENERGY CONSUMPTION/ LOWEST POSSIBLE ENERGY CONSUMPTION
BRAINSTORM
ARCHITECTS & ID
M & E ENGINEERS
C & S ENGINEERS
INTERIOR DESIGNER BRAINSTORM
Using Energy Management
Approach
OWNER / USERS
DESIGNER
FACILITIES MANAGEMENT
ICT CONSULTANT
LANDSCAPE CONSULTANT
ENERGY / LOW CARBON / GREEN
CONSULTANT

SEDA’s LOW CARBON BUILDING METHOD:SEDA’s LOW CARBON BUILDING METHOD:INTEGERATED DESIGN APPROACH TO GET THE INTEGERATED DESIGN APPROACH TO GET THE
BEST / LOWEST POSSIBLE ENERGY CONSUMPTIONBEST / LOWEST POSSIBLE ENERGY CONSUMPTION
ROOT CAUSED ANALYSIS METHOD
Consider Technologies and
Human Factor.
* Use of technology are not the ultimate METHOD
WHY? WHAT? HOW? WHEN?
WHO?
Conduct Energy & Carbon Performance Analysis
not the ultimate solution.
SEDA’s LOW CARBON BUILDING METHOD:SEDA’s LOW CARBON BUILDING METHOD:SELECTION OF DESIGN STRATEGIESSELECTION OF DESIGN STRATEGIES
- The design and selection of the strategies are depends ultimate design target that required to be achieved !
- Different building will have different design strategies depend on the nature and physical of the strategies depend on the nature and physical of the building.
- Any irrelevant measures or too expensive could be omitted. Can be justified!
- The best is to put priority strategies that have high performance impact with low or minimum cost to implement (kWh or CO2 reduction / $$$ invested)
-

Examples of Low Carbon already exist! Government Low Carbon Building.CATALYS FOR GREEN BUILDING IN MALAYSIA
2007 2004 2010
Net BEI = 114 (59% reduce)
1,490 TonCO2/year
GBI : Silver (2011)
ASEAN Energy Award : 2006
Net BEI = 114 (59% reduce)
1,490 TonCO2/year
GBI : Silver (2011)
ASEAN Energy Award : 2006
Net BEI = 63 (70% reduce)
637 TonCO2/year (**To verify)
GBI & GreenMark : Platinum (2011)
ASEAN EA : 2012
Net BEI = 63 (70% reduce)
637 TonCO2/year (**To verify)
GBI & GreenMark : Platinum (2011)
ASEAN EA : 2012
Net BEI = 30 (86% reduce)
65 TonCO2/year
GBI : Certified (2009)
ASEAN EA : 2009/2010/2011
Net BEI = 30 (86% reduce)
65 TonCO2/year
GBI : Certified (2009)
ASEAN EA : 2009/2010/2011


EXAMPLE OF REDUCING CARBON THROUGH
ENERGY MANAGEMENT
EXAMPLE OF REDUCING CARBON THROUGH
ENERGY MANAGEMENTENERGY MANAGEMENT
- New Building Design
ENERGY MANAGEMENT
- New Building Design

KeTTHA’s LEO Building KeTTHA’s LEO Building : ENERGY DESIGN ELEMENTS: ENERGY DESIGN ELEMENTS
In-house Energy
Manager +
Operation
monitoring team by
SEDA

ENERGY-10 OptimisationEnergy Saving Features in LEO Building
275Reference Case
247 Daylight use
223 EE Lighting 22 - 16 w/m2
239 Insulation in walls and roof
EE in Building Guideline Target (136kWh/m2/yr)
Energy Index kWh/m2year
0 1000 200 300
223 EE Lighting 22 - 16 w/m2
195Equipment 27 – 20 w/m2
173 EE Light 16 – 8 w/m2
123 EE Equipment 20 - 7.5 w/2
112 "Energy Management”
102Room Temp 23 - 24 degrees
100 Especially Tight Building
100
56%
reductionPotential GreenPASS (Operational
carbon) Rating

= 3,366,475 kWh/yr
or more than RM 800,000
LEO BuildingLEO BEI = 100
(Conventional) BEI = 275
175 kWh/m2year
Average Building Energy Index (BEI) in Parcel B
[kWh/m2/yr]378
315
278
233253
322
349
321
268
236
273296
250
300
350
400
Comparison LEO Building with several buildings
in Putrajaya
LEO Building Performance
or more than RM 800,000
per year
= 3,366,475 kWh/yr x 0.614
kg CO2/kwh
= 2,067,016 kg/year CO2
= 2,067 tones CO2/year
Tariff C1
28.8 sen/kWh
Savings = 56%
196
233
123
236
167
198215
114
-
50
100
150
200
250
B1 B2 B3 B4 B5 B6 B7 B8 E4/5
Blocks
[kW
h/m
2/y
r]
AVERAGE (3276 hrs/yr) AVERAGE (Normalised to 2646hrs/yr)
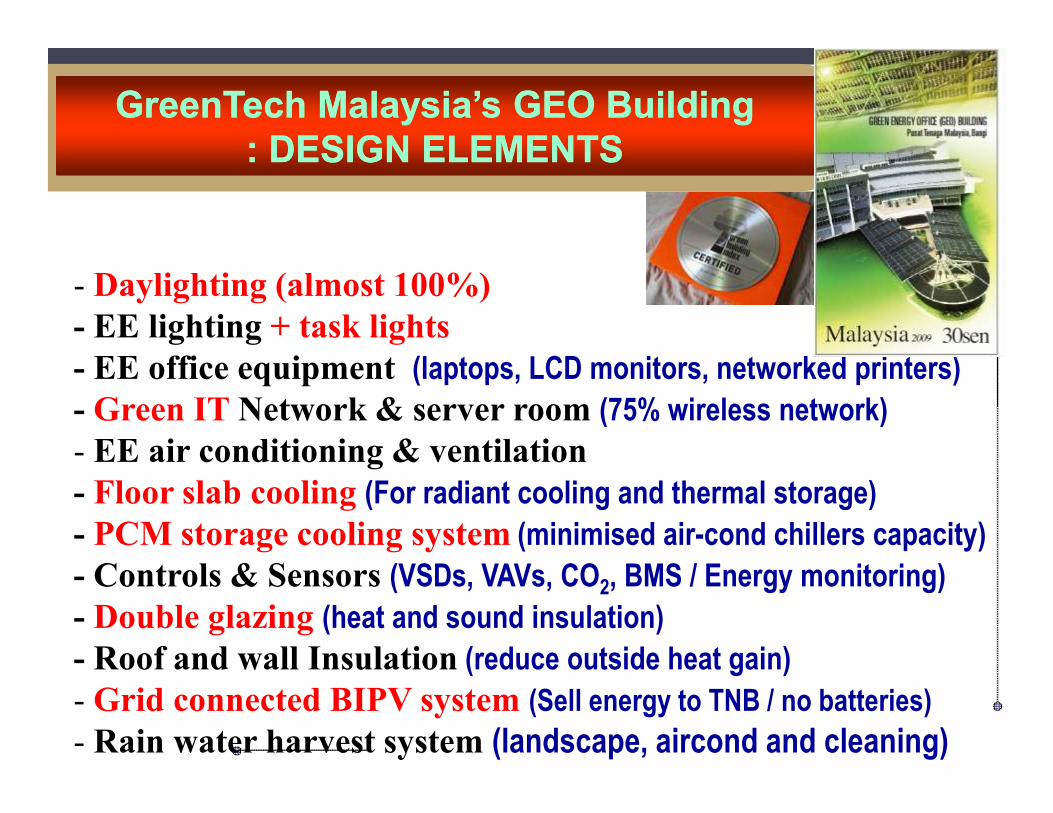
- Daylighting (almost 100%)
- EE lighting + task lights
- EE office equipment (laptops, LCD monitors, networked printers)
- Green IT Network & server room (75% wireless network)
GreenTech Malaysia’s GEO Building GreenTech Malaysia’s GEO Building : DESIGN ELEMENTS: DESIGN ELEMENTS
- Green IT Network & server room (75% wireless network)
- EE air conditioning & ventilation
- Floor slab cooling (For radiant cooling and thermal storage)
- PCM storage cooling system (minimised air-cond chillers capacity)
- Controls & Sensors (VSDs, VAVs, CO2, BMS / Energy monitoring)
- Double glazing (heat and sound insulation)
- Roof and wall Insulation (reduce outside heat gain)
- Grid connected BIPV system (Sell energy to TNB / no batteries)
- Rain water harvest system (landscape, aircond and cleaning)

MONTHLY GEO BUILDING ENERGY PERFORMANCE25,8
76
16,7
24
25,7
84
27,9
81
22,2
51
24,8
51
23,6
35
24,9
54
23,7
77
29,1
02
28,0
12
28,4
17
20,2
44
18,4
66
20,1
10
17,4
56
16,0
66
17,3
23
16,4
10
16,7
37
16,1
98
14,9
95 1
9,6
00
17,7
00
97.9 96
110
90 92 91 9388
11110410520,000
25,000
30,000
35,000
Energ
y C
onsum
ed / E
nerg
y G
enera
ted [kW
h/m
onth
]
100.0
120.0
140.0
160.0
180.0
BEI [kW
h/m
2/y
ear]
Monitored GEO Building Energy IndexHave own Energy &
Facility Manager +
8,8
24
8,3
68
6,9
93
8,2
13
9,3
94
9,5
23
8,5
86
8,2
05
8,7
96
9,1
09
9,1
05
10,3
12
8,9
68
8,2
34
10,0
67
9,5
11
8,0
52
8,5
39
6,7
62
7,2
68
7,4
19
8,4
07
6,1
48 8,7
44
10,6
60
0
16,7
24
16,0
66
16,4
10
16,7
37
16,1
98
14,9
95
6,1
02
0
63.0
90 92 91 9388
7569
7565 62 64 63 62 60 62
7368
23
0
33 32 3036 35 33 30 33
37 3440
33 3237 35
31 3226 27 28
35
2334
40
00
5,000
10,000
15,000
Energ
y C
onsum
ed / E
nerg
y G
enera
ted [kW
h/m
onth
]
0.0
20.0
40.0
60.0
80.0
BEI [kW
h/m
2/y
ear]
kWh PV kWh Total BEI [kWh/m2/yr] BEI PV Linear (BEI [kWh/m2/yr] )
kWh PV 8,824 8,368 6,993 8,213 9,394 9,523 8,586 8,205 8,796 9,109 9,105 10,312 8,968 8,234 10,067 9,511 8,052 8,539 6,762 7,268 7,419 8,407 6,148 8,744 10,660 0
kWh Total 25,876 16,724 25,784 27,981 22,251 24,851 23,635 24,954 23,777 29,102 28,012 28,417 20,244 18,466 20,110 17,456 16,066 17,323 16,410 16,737 16,198 14,995 19,600 17,700 6,102 0
Num of Days 13 31 30 31 30 31 31 28 31 30 31 30 31 31 30 31 30 31 31 28 31 30 2 0
BEI [kWh/m2/yr] 97.9 63.0 96 110 90 92 91 93 88 111 104 105 75 69 75 65 62 64 63 62 60 62 73 68 23 0
BEI PV 33 32 30 36 35 33 30 33 37 34 40 33 32 37 35 31 32 26 27 28 35 23 34 40 0
Avera
ge
Avera
ge
(with
July
08
Aug
08
Sept
08Oct 08
Nov
08Dec 08 Jan 09 Feb 09
Mac
09Apr 09
May
09
June
09
July
09
Aug
09
Sept
09Oct 09
Nov
09Dec 09 Jan 10 Feb 10
Mac
10Apr 10
May
10
June
10
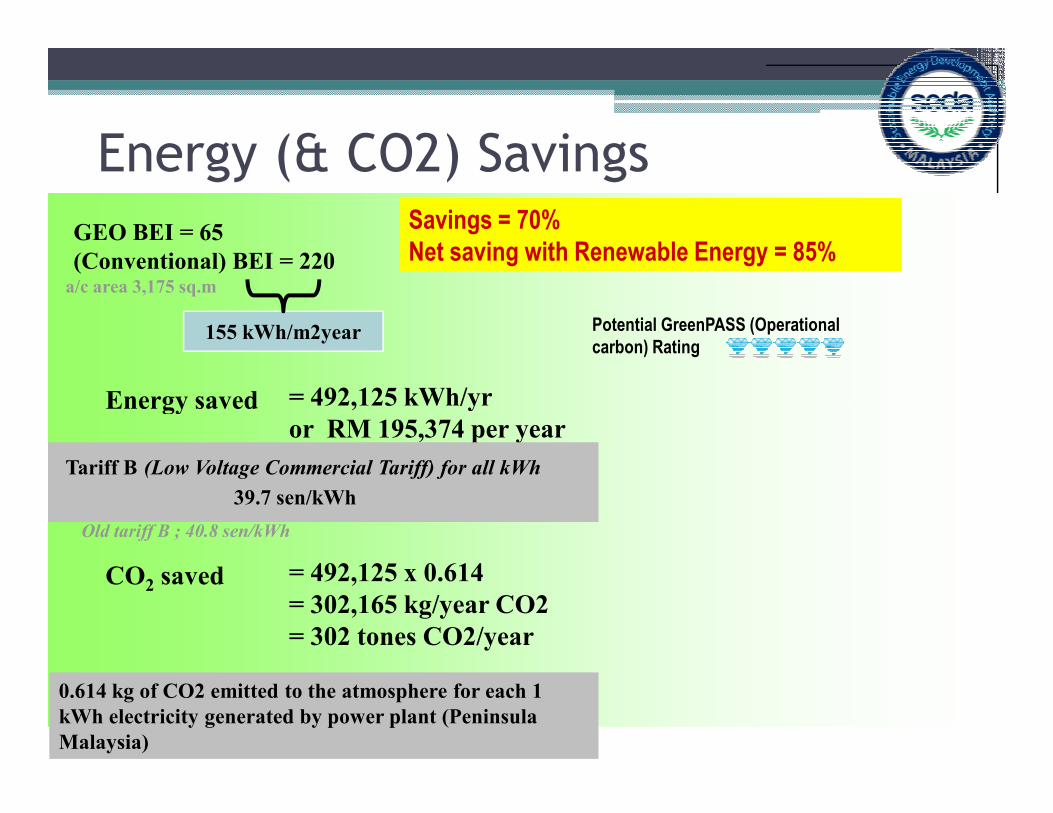
Energy (& CO2) Savings
= 492,125 kWh/yrEnergy saved
GEO BEI = 65
(Conventional) BEI = 220
155 kWh/m2year
a/c area 3,175 sq.m
Savings = 70%
Net saving with Renewable Energy = 85%
Potential GreenPASS (Operational
carbon) Rating
= 492,125 kWh/yr
or RM 195,374 per yearEnergy saved
= 492,125 x 0.614
= 302,165 kg/year CO2
= 302 tones CO2/year
CO2 saved
Tariff B (Low Voltage Commercial Tariff) for all kWh
39.7 sen/kWh
0.614 kg of CO2 emitted to the atmosphere for each 1
kWh electricity generated by power plant (Peninsula
Malaysia)
Old tariff B ; 40.8 sen/kWh
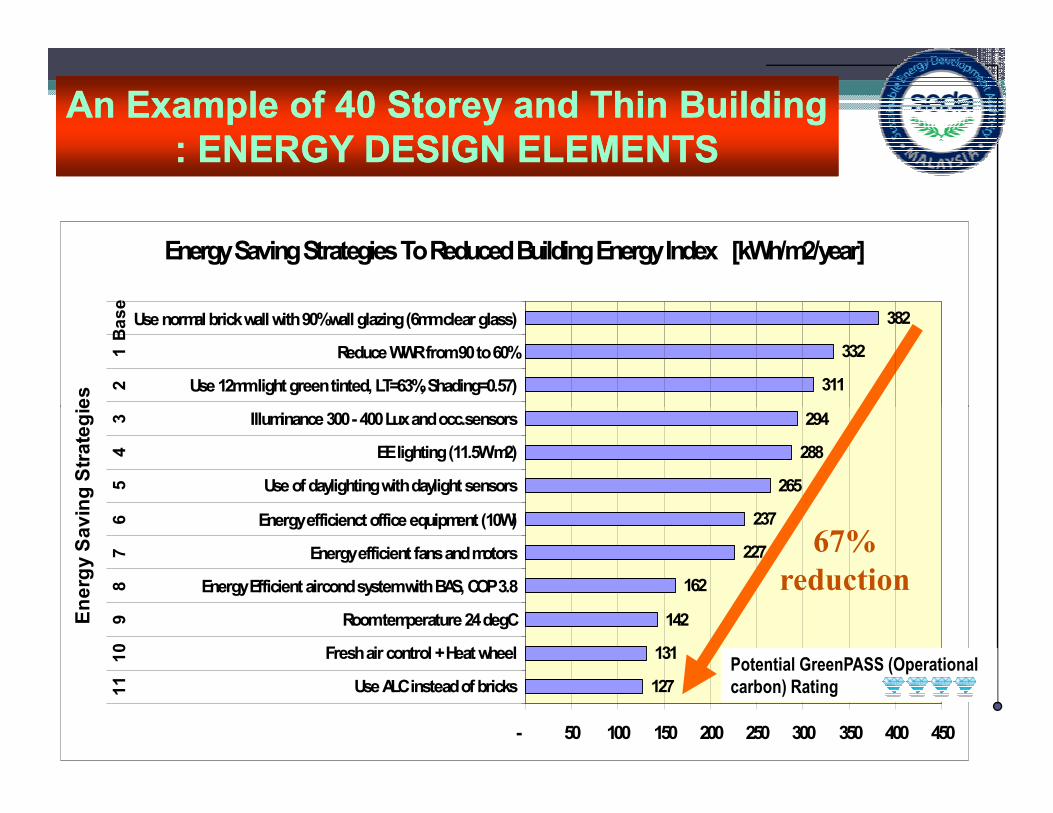
An Example of 40 Storey and Thin Building An Example of 40 Storey and Thin Building : ENERGY DESIGN ELEMENTS: ENERGY DESIGN ELEMENTS
Energy Saving Strategies To Reduced Building Energy Index [kWh/m2/year]
311
332
382
Use 12mm light green tinted, LT=63%, Shading=0.57)
Reduce WWR from 90 to 60%
Use normal brick wall with 90% wall glazing (6mm clear glass)
21
Base
Energ
y S
avin
g S
trate
gie
s
127
131
142
162
227
237
265
288
294
- 50 100 150 200 250 300 350 400 450
Use ALC instead of bricks
Fresh air control + Heat wheel
Room temperature 24 degC
Energy Efficient aircond system with BAS, COP 3.8
Energy efficient fans and motors
Energy efficienct office equipment (10W)
Use of daylighting with daylight sensors
EE lighting (11.5W/m2)
Illuminance 300 - 400 Lux and occ.sensors
11
10
98
76
54
3
Energ
y S
avin
g S
trate
gie
s
67%
reduction
Potential GreenPASS (Operational
carbon) Rating
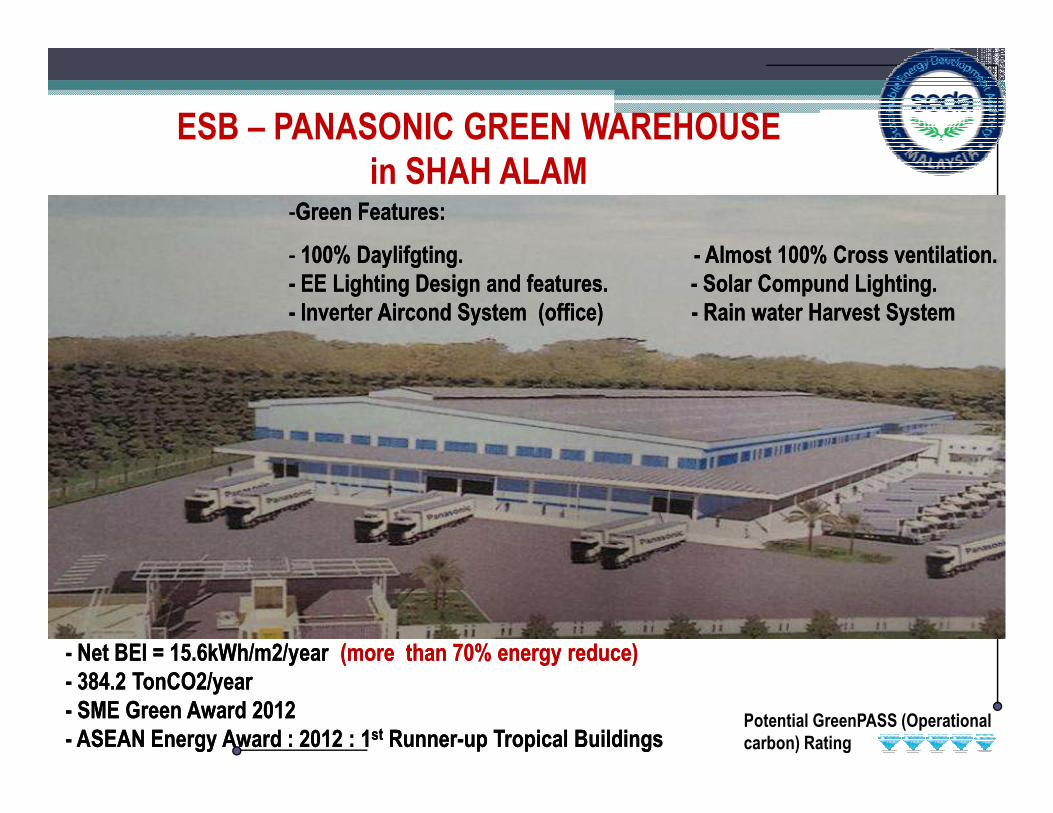
ESB – PANASONIC GREEN WAREHOUSE
in SHAH ALAM-Green Features:
- 100% Daylifgting. - Almost 100% Cross ventilation.
- EE Lighting Design and features. - Solar Compund Lighting.
- Inverter Aircond System (office) - Rain water Harvest System
-Green Features:
- 100% Daylifgting. - Almost 100% Cross ventilation.
- EE Lighting Design and features. - Solar Compund Lighting.
- Inverter Aircond System (office) - Rain water Harvest System
- Net BEI = 15.6kWh/m2/year (more than 70% energy reduce)
- 384.2 TonCO2/year
- SME Green Award 2012
- ASEAN Energy Award : 2012 : 1st Runner-up Tropical Buildings
- Net BEI = 15.6kWh/m2/year (more than 70% energy reduce)
- 384.2 TonCO2/year
- SME Green Award 2012
- ASEAN Energy Award : 2012 : 1st Runner-up Tropical BuildingsPotential GreenPASS (Operational
carbon) Rating
EXAMPLE OF REDUCING CARBON THROUGH
ENERGY MANAGEMENT
EXAMPLE OF REDUCING CARBON THROUGH
ENERGY MANAGEMENTENERGY MANAGEMENT
- Existing Building
ENERGY MANAGEMENT
- Existing Building
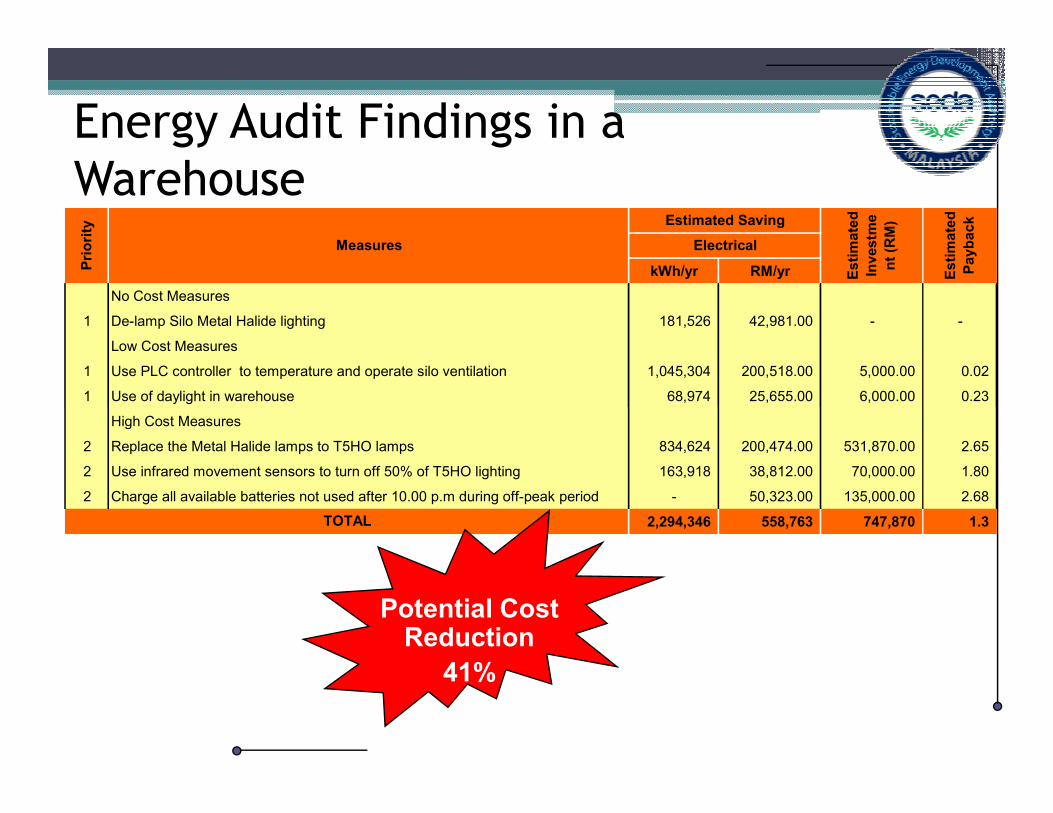
kWh/yr RM/yr
No Cost Measures
1 De-lamp Silo Metal Halide lighting 181,526 42,981.00 - -
Low Cost Measures
1 Use PLC controller to temperature and operate silo ventilation 1,045,304 200,518.00 5,000.00 0.02
1 Use of daylight in warehouse 68,974 25,655.00 6,000.00 0.23
Estim
ate
d
Investm
e
nt (R
M)
Estim
ate
d
Payback
Measures
Pri
ori
ty
Electrical
Estimated Saving
Energy Audit Findings in a
Warehouse
High Cost Measures
2 Replace the Metal Halide lamps to T5HO lamps 834,624 200,474.00 531,870.00 2.65
2 Use infrared movement sensors to turn off 50% of T5HO lighting 163,918 38,812.00 70,000.00 1.80
2 Charge all available batteries not used after 10.00 p.m during off-peak period - 50,323.00 135,000.00 2.68
2,294,346 558,763 747,870 1.3 TOTAL
Potential Cost Reduction
41%
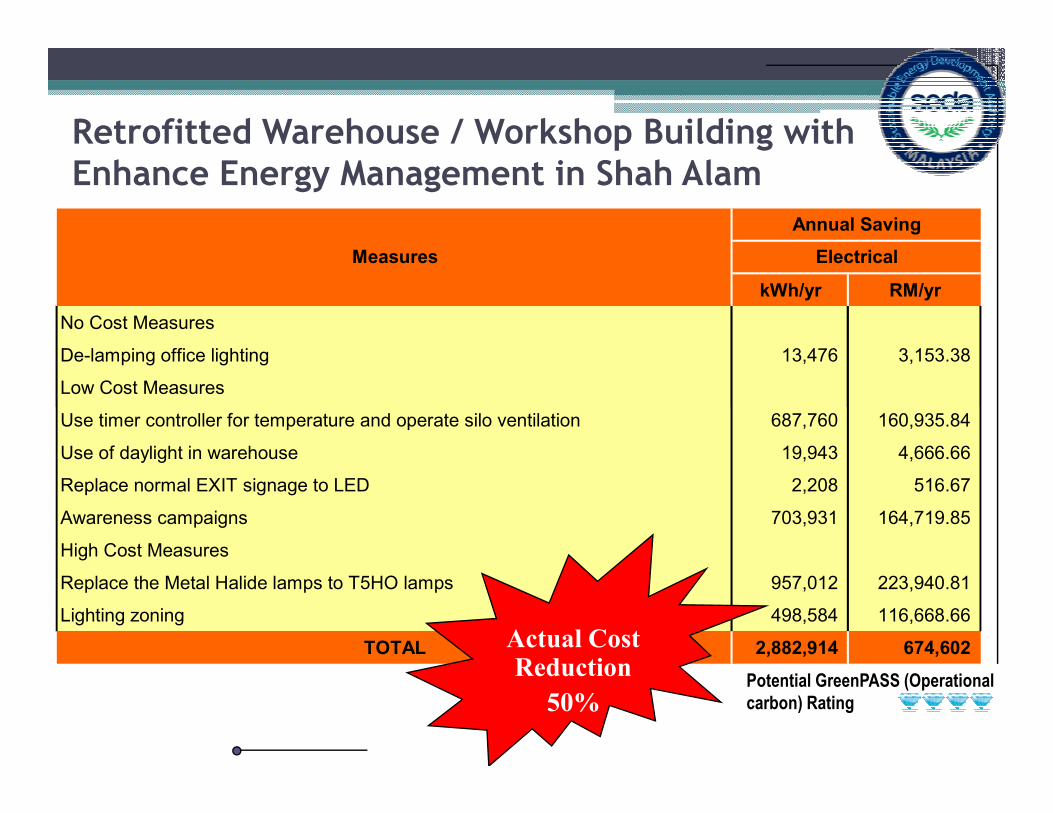
Retrofitted Warehouse / Workshop Building with Enhance Energy Management in Shah Alam
kWh/yr RM/yr
No Cost Measures
De-lamping office lighting 13,476 3,153.38
Low Cost Measures
Measures
Annual Saving
Electrical
Use timer controller for temperature and operate silo ventilation 687,760 160,935.84
Use of daylight in warehouse 19,943 4,666.66
Replace normal EXIT signage to LED 2,208 516.67
Awareness campaigns 703,931 164,719.85
High Cost Measures
Replace the Metal Halide lamps to T5HO lamps 957,012 223,940.81
Lighting zoning 498,584 116,668.66
TOTAL 2,882,914 674,602 Actual Cost Reduction
50%Potential GreenPASS (Operational
carbon) Rating
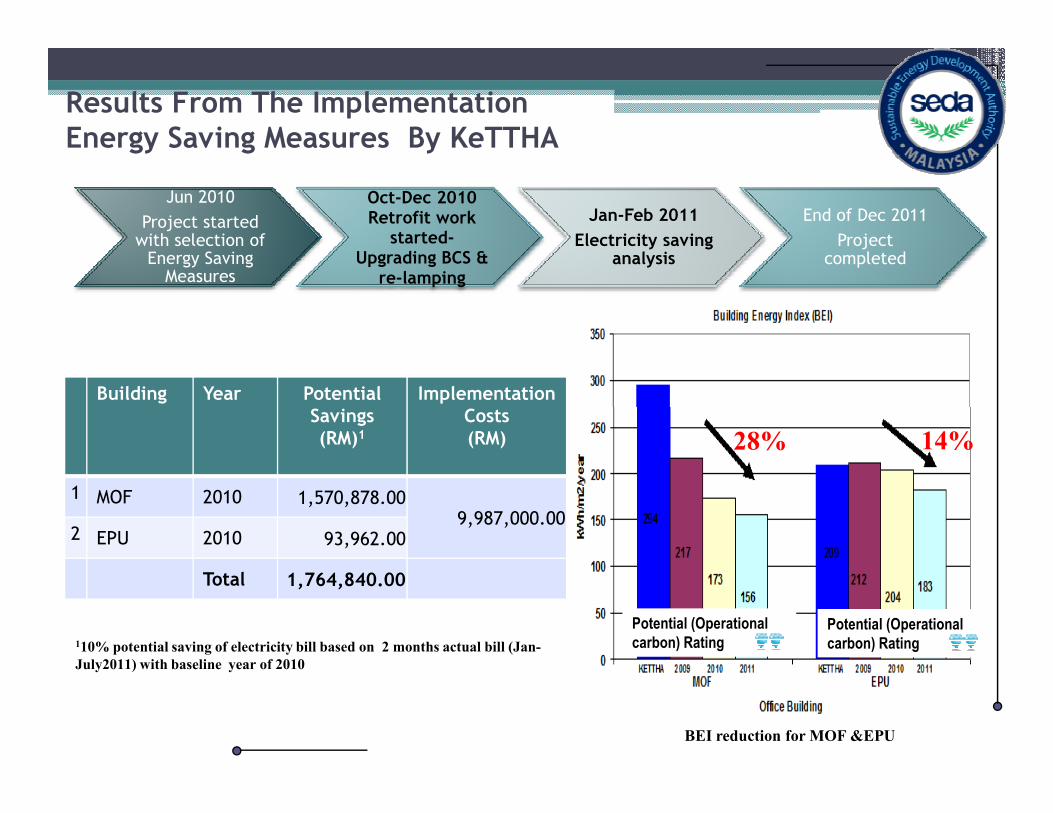
Results From The Implementation Energy Saving Measures By KeTTHA
Building Year Potential Savings
Implementation Costs
Jun 2010
Project started with selection of Energy Saving Measures
Oct-Dec 2010Retrofit work
started-Upgrading BCS &
re-lamping
Jan-Feb 2011
Electricity saving analysis
End of Dec 2011
Project completed
Savings(RM)1
Costs(RM)
1 MOF 2010 1,570,878.009,987,000.00
2 EPU 2010 93,962.00
Total 1,764,840.00
110% potential saving of electricity bill based on 2 months actual bill (Jan-
July2011) with baseline year of 2010
BEI reduction for MOF &EPU
28% 14%
Potential (Operational
carbon) RatingPotential (Operational
carbon) Rating
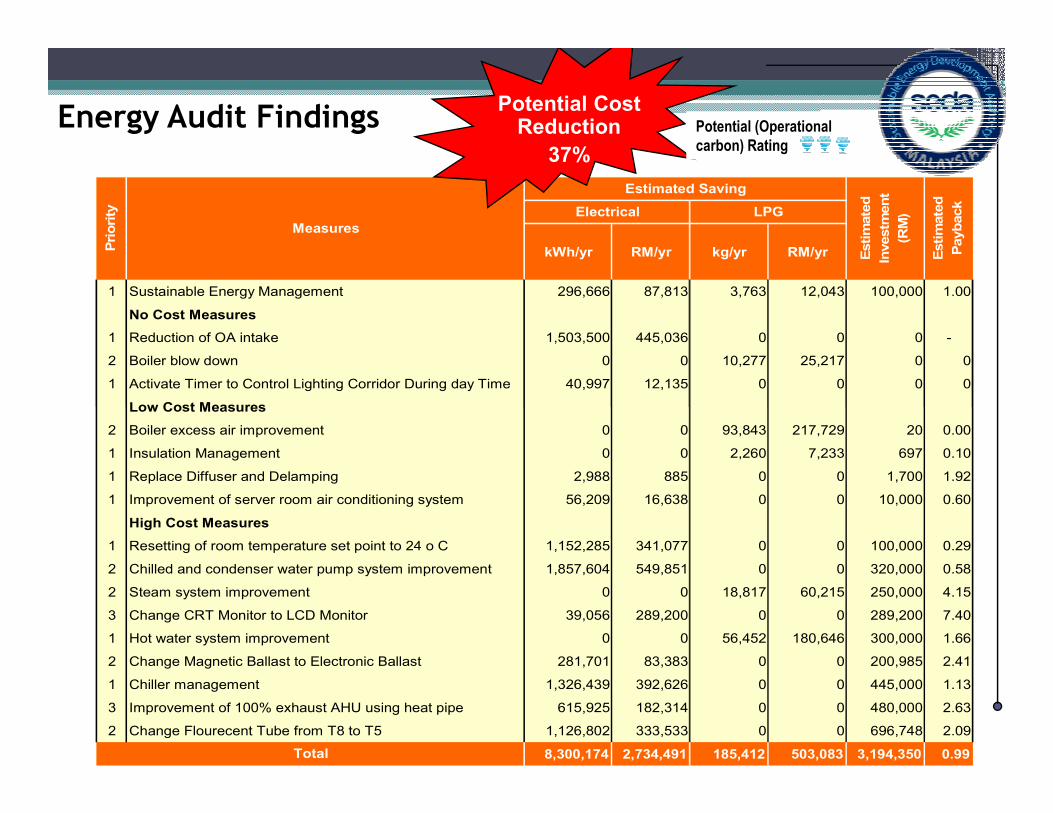
Energy Audit Findings
kWh/yr RM/yr kg/yr RM/yr
1 Sustainable Energy Management 296,666 87,813 3,763 12,043 100,000 1.00
No Cost Measures
1 Reduction of OA intake 1,503,500 445,036 0 0 0 -
2 Boiler blow down 0 0 10,277 25,217 0 0
1 Activate Timer to Control Lighting Corridor During day Time 40,997 12,135 0 0 0 0
Low Cost Measures
Priority
Estim
ate
d
Investm
ent
(RM
)
Estim
ate
d
Payback
Measures
Estimated Saving
Electrical LPG
Potential Cost Reduction
37%
Potential (Operational
carbon) Rating
Low Cost Measures
2 Boiler excess air improvement 0 0 93,843 217,729 20 0.00
1 Insulation Management 0 0 2,260 7,233 697 0.10
1 Replace Diffuser and Delamping 2,988 885 0 0 1,700 1.92
1 Improvement of server room air conditioning system 56,209 16,638 0 0 10,000 0.60
High Cost Measures
1 Resetting of room temperature set point to 24 o C 1,152,285 341,077 0 0 100,000 0.29
2 Chilled and condenser water pump system improvement 1,857,604 549,851 0 0 320,000 0.58
2 Steam system improvement 0 0 18,817 60,215 250,000 4.15
3 Change CRT Monitor to LCD Monitor 39,056 289,200 0 0 289,200 7.40
1 Hot water system improvement 0 0 56,452 180,646 300,000 1.66
2 Change Magnetic Ballast to Electronic Ballast 281,701 83,383 0 0 200,985 2.41
1 Chiller management 1,326,439 392,626 0 0 445,000 1.13
3 Improvement of 100% exhaust AHU using heat pipe 615,925 182,314 0 0 480,000 2.63
2 Change Flourecent Tube from T8 to T5 1,126,802 333,533 0 0 696,748 2.09
8,300,174 2,734,491 185,412 503,083 3,194,350 0.99Total
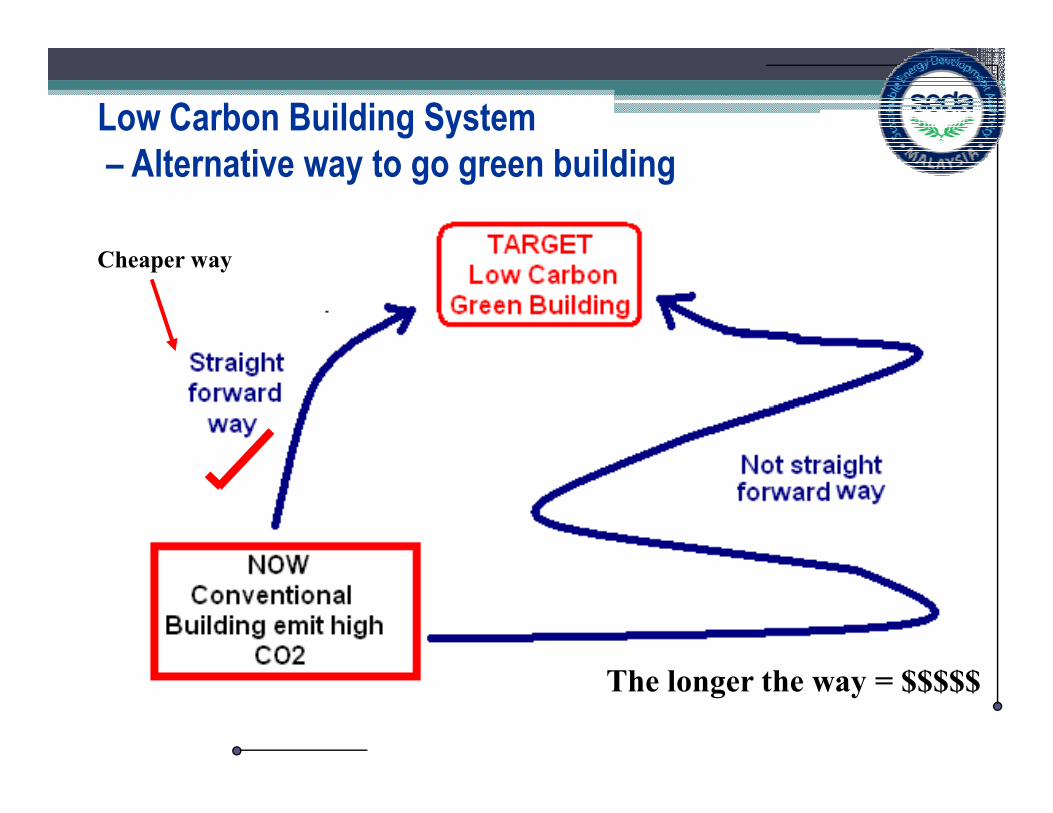
Low Carbon Building System
– Alternative way to go green building
Cheaper way
The longer the way = $$$$$

BASED ON SERIES OF R&D, STUDIES AND
DEMONSTRATIONS SHOWS THAT
ENERGY MANAGEMENT IS PART OF
SUSTAINABLE ENERGY ARE THE SUSTAINABLE ENERGY ARE THE
FUNDAMENTAL AND THE MOST
AFFORDABLE SOLUTION TO REDUCE
ENERGY & OPERATIONAL CARBON
EMISSION !!

Way Forward
� Energy Management practices to be included into the;- Development (design & construction).- Operation (O&M and monitoring).
� Can be started with government buildings, public buildings pusat komuniti, pasar, surau), schools, hospitals, etc.hospitals, etc.
� Private participation (Developers & Private owners).
� Encourage energy management activities and be part of the LA21 program.
� To establish Common Carbon Metric (CCM) for various building topologies and start to measures and monitor the performance annually.
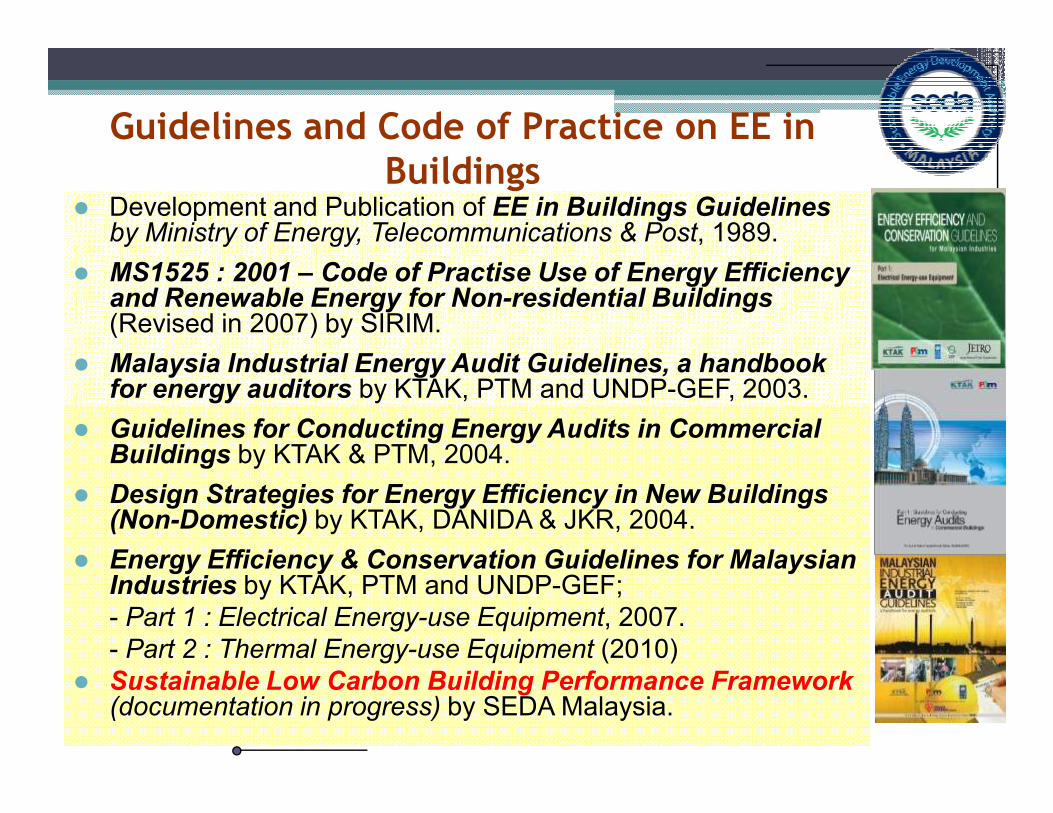
Guidelines and Code of Practice on EE in Buildings
� Development and Publication of EE in Buildings Guidelines by Ministry of Energy, Telecommunications & Post, 1989.
� MS1525 : 2001 – Code of Practise Use of Energy Efficiency and Renewable Energy for Non-residential Buildings(Revised in 2007) by SIRIM.
� Malaysia Industrial Energy Audit Guidelines, a handbook for energy auditors by KTAK, PTM and UNDP-GEF, 2003.
� Guidelines for Conducting Energy Audits in Commercial Buildings by KTAK & PTM, 2004.
� Design Strategies for Energy Efficiency in New Buildings (Non-Domestic) by KTAK, DANIDA & JKR, 2004.
� Energy Efficiency & Conservation Guidelines for Malaysian Industries by KTAK, PTM and UNDP-GEF;
- Part 1 : Electrical Energy-use Equipment, 2007.
- Part 2 : Thermal Energy-use Equipment (2010)
� Sustainable Low Carbon Building Performance Framework (documentation in progress) by SEDA Malaysia.
Thank you for your attention
50
SEDA Malaysia,Galeria PjH, Level 9
Jalan P4W, Persiaran Perdana,
Presint 4, 62100 Putrajaya, Malaysia.
Phone : +603-8870 5800
Email: [email protected]
Web: www.seda.gov.my
Get copy of paper? - Tel / SMS / WhatsUp :[email protected] / [email protected] @ http://www.slideshare.net/asetip
Steve Anthony Lojuntin

Sustainable Energy Development
Authority (SEDA) Malaysia
www.seda.gov.my
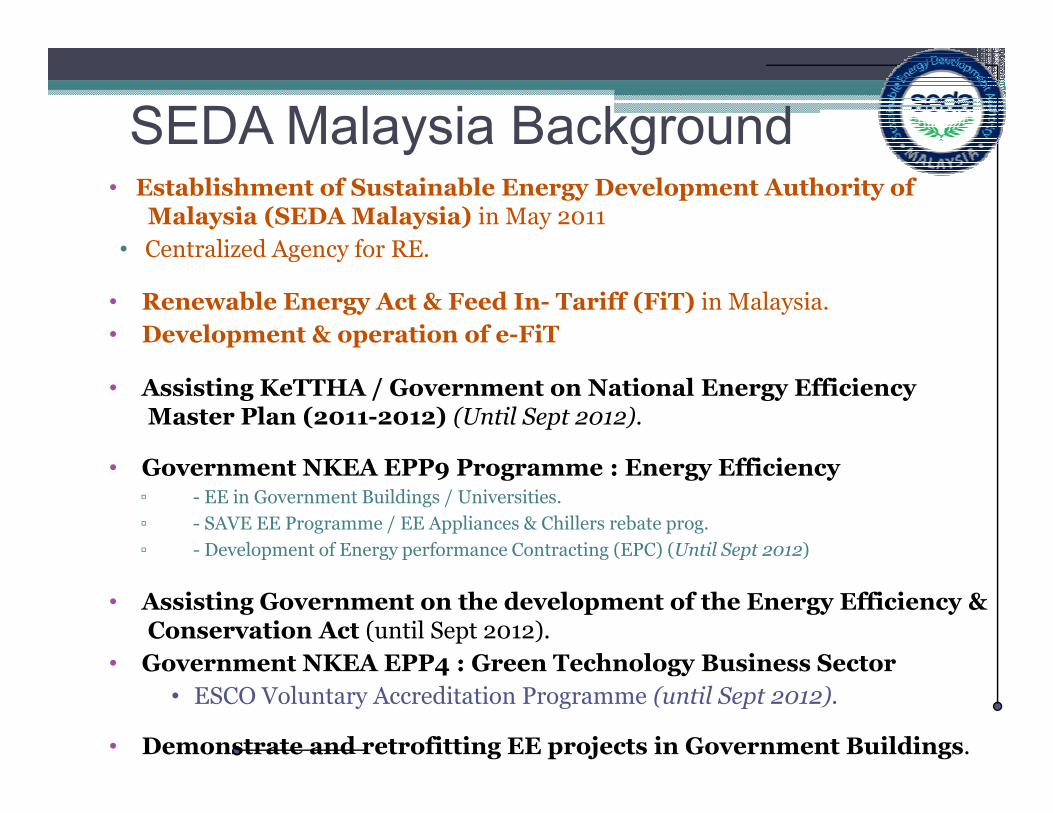
SEDA Malaysia Background• Establishment of Sustainable Energy Development Authority of
Malaysia (SEDA Malaysia) in May 2011
• Centralized Agency for RE.
• Renewable Energy Act & Feed In- Tariff (FiT) in Malaysia.
• Development & operation of e-FiT
• Assisting KeTTHA / Government on National Energy Efficiency Master Plan (2011-2012) (Until Sept 2012). Master Plan (2011-2012) (Until Sept 2012).
• Government NKEA EPP9 Programme : Energy Efficiency▫ - EE in Government Buildings / Universities.
▫ - SAVE EE Programme / EE Appliances & Chillers rebate prog.
▫ - Development of Energy performance Contracting (EPC) (Until Sept 2012)
• Assisting Government on the development of the Energy Efficiency & Conservation Act (until Sept 2012).
• Government NKEA EPP4 : Green Technology Business Sector
• ESCO Voluntary Accreditation Programme (until Sept 2012).
• Demonstrate and retrofitting EE projects in Government Buildings.

Program by SEDA Malaysia • Sustainable Low Carbon Building Performance System ***
▫ Documentation of the Low Carbon Building Framework based on past experiences (R&D, demonstration, energy monitoring, etc).
▫ To support National carbon reduction target.
▫ Compatible & direct support to LCCF, GreenPASS and Green RE, and it can be used to support other green building rating system.
▫ Development of Low Carbon Buildings (new design & existing buildings).
▫ Application & Promotion of MS1525 : Code of Practice Use of ▫ Application & Promotion of MS1525 : Code of Practice Use of Energy Efficiency & Renewable Energy for Non-residential Buildings.
• Sustainable Energy in Buildings (supporting the Gov. Lead By Example)
▫ - Facilitate, assist and providing technical advices on sustainable energy in buildings from time to time.
▫ - Sustainable Energy Management program.
▫ - Technical matters on Energy Performance Contracting activities.
▫ - Energy Auditing & Retrofitting.
▫ - Monitoring & Verification and Reporting.

Program by SEDA Malaysia • Low Carbon ICT (“of ICT” and “by ICT”).
▫ Promotion and Development of Low Carbon ICT in government.
▫ To support the Green ICT program by government.
▫ To support the Sustainable Low Carbon Building Performance.
▫ Baseline of energy / carbon emission in ICT.
▫ Development of Green ICT standard (committee in MCMC/MDeC).
▫ Building Energy Management System / Energy Monitoring System.
▫ Auditing, Retrofitting & Performance Monitoring.
• Capacity Building & Technical Services in Sustainable Energy.▫ Solar PV Installation.
▫ Mini Hydro Installation.
▫ Power Quality Study.
▫ Energy Audit / Energy management (including thermal energy)
▫ Energy Efficiency in Chillers & Air conditioning.
▫ Sustainable Low Carbon Buildings / MS1525 program.
▫ Low Carbon ICT.
▫ Retrofitting, Finetuning & Performance Monitoring.
▫ - Facilitate Energy Performance Contracting (EPC).
▫ - Facilitating the Government & Private agencies including the Local Councils / PBTs.

Low Carbon Program by SEDA Malaysia
• SEDA’s Low Carbon equation;
Low Carbon
= Sustainable Energy X Operational Carbon factor (0.747 kgCO2/kwh)Carbon factor (0.747 kgCO2/kwh)
• The low carbon scope is only within the sustainable energy programme. E-waste, recycling, product labelling, waste management are not included since it is out of SEDA Malaysia scope.
Thank YouTERIMA KASIH
Steve Anthony LojuntinSteve Anthony LojuntinSEDA MalaysiaSEDA Malaysia
Tel / SMS : 019Tel / SMS : 019--2829102 UMS Fax: 0192829102 UMS Fax: 019--23245932324593EE--mail : [email protected] : [email protected]
For further information