Embed Size (px)
Citation preview

Energy management principles and practice
This manual is based on the text of the book of the same name
to be published by BSi in September 2009. Copies are not to be
made without the written permission of the author or BSi.
Prepared by Vilnis Vesma
NIFES Consulting Group
Ref TRG 1997
Version 1.0
6 July 2009

Contents
0-1 Introduction .................................................................................................................. 1
0-2 Basics............................................................................................................................ 4
1-1 Monitoring energy consumption .................................................................................. 7
1-2 Understanding patterns of use .................................................................................... 13
1-3 Detecting and prioritising exceptions ......................................................................... 17
1-4 Raising awareness and motivation ............................................................................. 20
2-1 Building fabric............................................................................................................ 23
2-2 Heating and ventilation............................................................................................... 26
2-3 Combustion equipment............................................................................................... 30
2-4 Air conditioning and refrigeration.............................................................................. 33
2-5 Lighting ...................................................................................................................... 36
2-6 Hot water services ...................................................................................................... 42
2-7 Catering ...................................................................................................................... 44
2-8 Compressed air ........................................................................................................... 46
2-9 Steam .......................................................................................................................... 48
2-10 Process thermal insulation ........................................................................................ 52
2-11 Motor driven equipment ........................................................................................... 55
3-1 Managing energy saving opportunities....................................................................... 57
3-2 Energy audits and surveys .......................................................................................... 59
3-3 Selecting and briefing consultants.............................................................................. 64
3-4 Making the case for capital projects ........................................................................... 66
3-5 Evaluating savings achieved....................................................................................... 68
Further information........................................................................................................... 71

Assessor training manual on energy management
1
0-1 Introduction Energy management is all about reducing the cost of energy used by the organisation,
now with the added spin of minimising carbon emissions as well. Reducing energy costs
has two facets: price and quantity. EN 16001 is exclusively concerned with the latter. It
does not discuss competitive procurement or invoice validation. Nor does it discuss
carbon emissions reduction, beyond what will be achieved incidentally through energy
saving: so you will not find anything about alternative energy sources, renewables,
carbon trading or fuel substitution.
The Standard regards meeting your organization’s energy policy as the defining
objective. Why might the organization need a policy, and what should it look like?
At the corporate or strategic level, an energy policy is a public commitment or
undertaking which states, for the benefit of employees and contractors, what the
organization expects of them in general terms, and what the organization’s objectives are
in energy terms of its overall energy performance. It defines the scope and boundaries of
the organisation’s energy management system and provides a framework for action. EN
16001 (s 3.2) adds that the policy needs to include three specific commitments:
• to continual improvement in energy efficiency;
• to ensure the availability of information and of all necessary resources to achieve
objectives and targets; and
• to comply with all applicable requirements (legally required or voluntarily agreed to
by the organization)
Of these commitments the first two are crucial, since they bind the senior management to
creating the necessary environment and resources to make progress.
There is no one policy that fits all possible scenarios but the following model is
suggested as a starting point:

Assessor training manual on energy management
2
(Name of organization) is committed to
continuous improvement in the efficiency with
which energy is used, and the avoidance of
energy waste.
The scope of this policy covers all our
buildings, processes, and transport operations
This will need to be customized to the particular
organization, and might for example be extended to
include business travel, raw materials, or even
non-energy supplies. It may need to state explicitly that
it includes outsourced operations and services
Our first objective is to reduce our total energy
consumption each year by x% after taking
account of changes in levels of activity,
weather, and other relevant factors.
There is a danger here of setting a goal which is either
unachievable or too easy. In some ways it may be
preferable not to set a specific percentage, especially as
the percentage which can be saved would usually be
expected to decline year on year as the quick wins are
exploited
Our second objective is to reduce the carbon
intensity of our energy purchases by y% year
on year.
We undertake to comply not only with all
relevant legislation relating to energy use but
to additional voluntary requirements which
may be agreed from time to time.
We undertake to provide the resources
• to plan and supervise the necessary
projects and programmes;
• to maintain an energy management
system compliant with EN 16001;
• to monitor energy performance; and
• subject to justification on reasonable
criteria, to fund physical improvement
projects
__
We undertake to carry out such
awareness-raising, training, and maintenance
optimization programmes as may be required
in pursuit of improved energy efficiency and
reduced losses
We expect staff and contractors alike to
support our objectives and to cooperate
actively in achieving them
We will publish the results each year

Assessor training manual on energy management
3
So much for the corporate policy. The energy manager will probably also want to
develop technical policies defining in detail how things are to be done. For instance: what
lighting levels will be provided in corridors? Will computer workstations be turned off at
night? The idea is to define a common set of expectations and to remove the need for
debate at the micro level. Technical policies provide ready-made answers to common
everyday questions, and are the tactical counterpart of what the corporate policy does at a
strategic level.
Assessor training manual on energy management
4
0-2 Basics Improving energy efficiency is, in part, a technical pursuit with a scientific basis.
However, although some aspects are undeniably highly specialised, the essential science
should be familiar to most readers (perhaps dimly) from their school days and where BS
EN 16001 (section 3.4.2) calls for the energy manager to be appropriately qualified. I
read this as meaning that a basic grasp of physics and chemistry would be expected.
This chapter reviews some of the fundamental scientific concepts needed for the job, and
other more specific topics are introduced in individual chapters where they may be
helpful.
Energy and power
In BS EN16001 energy is defined as "electricity, fuel, steam, heat, compressed air and
other like media" (your physics teacher probably defined it more rigorously as "capacity
to do work" but the real-world definition is better for our purposes). When we buy or use
energy it may be billed or reported in a variety of units of measurement, but all have their
equivalents in kilowatt hours (kWh) which is how most practitioners commonly express
energy consumption.
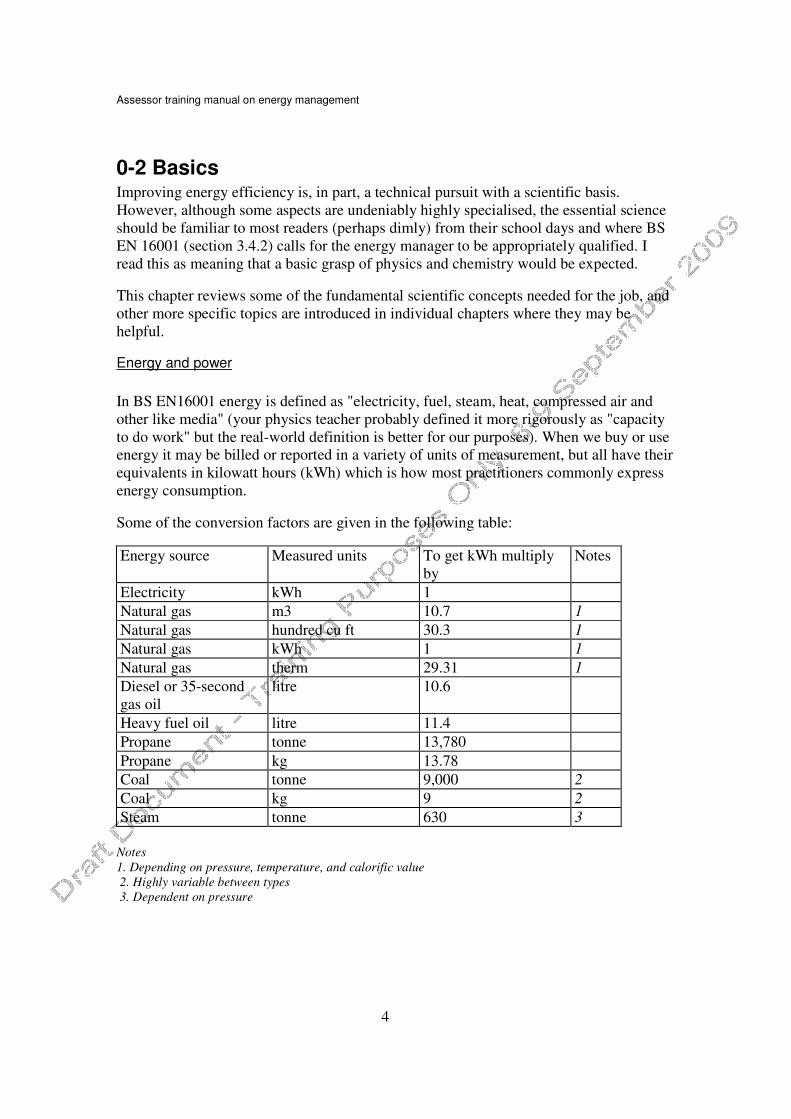
Some of the conversion factors are given in the following table:
Energy source Measured units To get kWh multiply
by
Notes
Electricity kWh 1
Natural gas m3 10.7 1
Natural gas hundred cu ft 30.3 1
Natural gas kWh 1 1
Natural gas therm 29.31 1
Diesel or 35-second
gas oil
litre 10.6
Heavy fuel oil litre 11.4
Propane tonne 13,780
Propane kg 13.78
Coal tonne 9,000 2
Coal kg 9 2
Steam tonne 630 3
Notes
1. Depending on pressure, temperature, and calorific value
2. Highly variable between types
3. Dependent on pressure

Assessor training manual on energy management
5
"Power" has a quite specific meaning: it is the rate at which energy is delivered,
commonly expressed in watts (W) or kilowatts (kW), although horsepower (HP) will also
come to mind in some contexts. Because both are measures of power, there is a
conversion factor between the two: 1 HP is equal to 0.746 kW.
The energy used by a piece of equipment running at fixed power for a certain time is the
time multiplied by the power. A 3 kW heater running for two hours will use 3 x 2 = 6
kWh. A 55 HP diesel engine running flat out for two hours will deliver 55 x 0.746 x 2 =
82.06 kWh
Power factor
In an electrical circuit, power is calculated by multiplying voltage and current together. In
the case of mains power, where the current alternates, this relationship holds true at any
given instant, so the instantaneous power will vary as the voltage and current
continuously vary through the cycle. However, in order to deliver the maximum useful
power, the current and voltage must be exactly in step. If they are not – for example if the
load characteristics make the current waveform lag slightly behind the voltage waveform
– then throughout the cycle either the voltage will coincide with a current that is less than
it would have been, or the current coincides with a voltage that is lower than it would
have been had they been in step. Indeed, there will be four occasions in each cycle when
the instantaneous power is zero (two when the current is zero, and two when the voltage
is zero). The result: less power will be developed for a given current. The power factor is
the ratio between delivered useful power and what it would have been with perfect
synchronisation of current and voltage.
Poor power factor means that a higher-than-necessary current must be drawn in order to
deliver the required useful power. This increases the load on supply cables and
switchgear, increases line losses, and (depending on the tariff) can impose higher supply-
capacity and maximum-demand charges.
Efficiency
This is another word that has quite a narrow meaning in the context of energy
management, where it refers to the ratio between useful energy output and energy input.
Examples might be the useful heat output from a boiler, divided by the amount of fuel put
in; or the work done by a car engine relative to diesel consumed. Take the earlier
example of the engine which delivered 82.06 kWh over two hours. If it used 25 litres of
fuel in the process, how efficient was it? from Table xxx we see that 25 litres of diesel
contain 25 x 10.6 = 265 kWh. So the efficiency of the engine was 82.06 / 265 = 30.9%
In common parlance "efficiency" is often used interchangeably with "efficacy" or
"effectiveness". If the occupants of a building tell one that its heating system is efficient,
they usually mean that it keeps them warm, not that the boilers are well tuned and
properly controlled to minimise standing losses. Beware also when promoting "efficiency
savings" as this term has connotations of downsizing and redundancies.

Assessor training manual on energy management
6
Energy balance
Most people talk about "consuming" energy (be it in the form of gas, oil, electricity, heat,
compressed air or steam) but purists would argue that we don't consume it: merely
convert it from one form to another. Nobody seriously argues that we stop using the term
"consume" but the point about conversion is important in a way. In the engine example,
we used 265 kWh of chemical energy in the diesel fuel to generate about 82 kWh of
useful mechanical work. But as energy cannot be destroyed, where did the missing 183
kWh go? It came out as heat in the exhaust and cooling system. There is an overall
balance between what goes in and what comes out. We will encounter a similar argument
when we discuss combustion efficiency in a later chapter.
Heat and temperature
Heat is one manifestation of energy. A flow of heat can be expressed in energy units
(such as kWh). You can meter, buy, or use a quantity of it. The engine in the earlier
example produced it by converting chemical fuel energy. Ten tonnes of steel at 300C
contains twice as much heat as five tonnes at 300C.
Temperature, by contrast, is just a measure of how hot something is. You cannot buy or
use temperature; it is not a form of energy. You can see how different heat and
temperature are if you think about taking some ice from the freezer and adding heat to it.
At first, starting from a temperature of -15C (say), its temperature rises as it absorbs the
heat. When it reaches melting point, it continues to absorb heat as it turns to water.
During this process its temperature stays constant at 0°C but its heat content continues
increasing (if you completely stop adding heat, the ice-water mix does not change). Once
it is all melted, the liquid water continues to absorb heat and its temperature starts
climbing again until it reaches the boiling point, whereupon the temperature again stops
rising while the water evaporates. Only when there is no more liquid left can the water,
now as vapour, start to increase in temperature (and become what is called 'superheated').
With a few odd exceptions that don't go through a liquid phase, as you add heat to any
solid its temperature rises unevenly, remaining on plateaux while it is melting or
vaporising, following the same trajectory back down as it first condenses to liquid and
then solidifies when heat is removed from it. Common physical manifestations of this are
(a) your drink with ice in it starts to warm abruptly once all the ice has melted; and (b)
boiling a pan of water rapidly does not raise its temperature.
One finicky point you will need to know. When engineers and scientists talk about
temperature differences they use a unit of measurement called a kelvin represented by a
capital K. One kelvin is numerically equal to a one-degree difference between two
temperatures in celsius (centigrade degree in the old nomenclature); when it is 19°C
indoors and 5°C outside, the temperature difference is 14K.

Assessor training manual on energy management
7
1-1 Monitoring energy consumption To manage energy successfully you need to measure how much you use, and that means
taking your own meter readings rather than relying on figures provided by the utility
companies. How frequently you get your meters read depends on your circumstances.
EN16001 section 3.5.1 places an obligation on the organization to monitor, measure and
record significant energy consumption 'at defined intervals'. My usual guidance is to
consider a weekly regime as the best starting point. Monthly monitoring, which has
historically been the norm, is too blunt an instrument for major users while fine-grained
data (30-minute intervals or less) brings attendant problems of data overload and
difficulties in interpretation and analysis. EN16001 also calls for 'energy factors' to be
recorded as well. By this it means weather data, usually in the form of degree-day figures
(also discussed later), production statistics, and the like -- what in normal energy
management terminology would have been called 'driving factors'. When we come to
discuss understanding patterns of energy consumption the value of this data will become
clear but suffice it to say, for now, that both consumption and driving-factor information
need to be synchronised and collected at intervals to match your required interval of
assessment and reporting.
Energy metering technologies
Many readers will be happy to make do with existing metering, but some may need to
install additional meters in order to separate out significant energy uses, or to measure
flows of product. To get the best accuracy it is important to choose an appropriate
measurement technology, but cost is always an issue. Fortunately, EN16001 does not lay
down accuracy standards. Section 3.5.1 merely stipulates that accuracy and repeatability
should be 'appropriate' and for routine energy management the requirement is actually
quite relaxed, since you will mainly be interested in changes and trends.
Electricity meters
Modern electricity meters are solid-state electronic devices which are either directly
connected in the supply cabling or (usually) where the measured current exceeds 100
amps indirectly through current transformers (CTs). A CT typically consists of a ring of
magnetic material through which the power cable passes, the load current inducing a
voltage in a secondary winding. It is this voltage which is sensed by the meter. The
advantage of indirect connection is that the meter can be mounted in a convenient
location remote from the power cable, where it may be easier to read; and multiple meters
can be marshalled together.
For the sake of accuracy, CTs should be matched to the current they will be measuring.
On a three-phase supply one CT per phase is needed and care must be taken that all are
properly connected: having one disconnected will reduce the measurement by one-third,
while one connect the wrong way around will reduce the measurement by two-thirds.
Such faults may go undetected for years, giving incorrect results and ultimately causing
embarrassment. More advanced meters nowadays include on-board diagnostics which aid

Assessor training manual on energy management
8
correct commissioning and prevent these problems; they can also report power quality,
harmonics, power factor and other parameters.
Where it is not possible to disconnect the power cable to thread it through the CT,
split-core types can be used which clip over the cable. There are even flexible types
where space is limited.
Flow meters
There are numerous technologies available for measuring gas, steam, compressed air, oil
and other fluids but even knowing what liquid or gas is being measured, other questions
will have a bearing on the choice of metering technique:
• What is the expected temperature range?
• What is the maximum expected pressure?
• What maximum and minimum flow rates need to be accommodated?
• What is the maximum acceptable pressure drop?
• In some cases, how much straight pipe is there upstream and downstream?
• In some cases, is electrical power available?
• If measuring a liquid, what is its viscosity? Is the viscosity likely to vary
significantly?
• What is the state of the measured liquid (dust, dirt, bubbles, etc.)?
This is definitely a case where advice from a consultant (or metering supplier with a wide
product range) will be invaluable. But for now here is some very general guidance for the
more common applications.
Firstly for gas supplies, turbine meters would be the usual choice for large meters (pipe
sizes of 200mm and over). Otherwise rotary positive displacement or bellows types
would normally be used. The latter are limited to low-pressure applications.
For oil, a positive-displacement type of meter would be the typical choice.
For compressed air submeters, turbine meters are unsuitable because they are easily
damaged by sudden pressure fluctuations, and entrained dust or water droplets. Orifice
plates are a robust solution where the flow rate is constant; otherwise either thermal-mass
or vortex meters should be employed. Both of the latter impose relatively low pressure
drop, making them attractive for retrofit applications. Pressure and temperature correction
is likely to be needed.
For steam the best candidates are likely to be vortex meters and variable-area orifice
meters such as the Spirax Gilflo, unless the flow rate is unlikely to vary, in which case a

Assessor training manual on energy management
9
fixed orifice might be an option. Pressure and temperature correction are definitely
required in all cases.
For water and other clean liquids, positive-displacement and multi-jet meters are
acceptable. Vortex and orifice meters are more tolerant of suspended contaminants but
the latter are only accurate over a narrow range of flow rates. Electromagnetic meters
may also be considered, as long as the fluid is conductive.
Data collection
You may collect the data automatically, manually, or both, but where manual readings
are involved it is worth paying attention to the following points of policy, preparation and
practice:
Policy
• Decide at what interval to read the meters – monthly or weekly, for example – and
set a target reading time such as, say, the first working day of the month, or 7 a.m.
each Monday morning.
• Make someone responsible for taking the readings and nominate a deputy to cover
for absences
• State how much leeway is allowed on meter-reading date and time.
• Make arrangements to collect driving factor information such as production, degree
day figures, etc, at the same intervals as meter readings.
Preparation
• Create a checklist of meters to be read.
• In the case of multi-rate meters (those with day/night or normal/low registers), say
which registers are to be read and recorded. Some electricity meters (such as 'Code 5'
meters in the UK) may record consumption in several distinct time bands.
• Record the meters' attributes: what commodity they measure, their location, units of
measurement (including any multiplier factor such as x10), number of readout digits,
serial number and other salient facts
• Consider fixing a durable label or tag near the meter to identify what it is measuring.
Don't fix it to the meter itself in case it is later swapped out.
• If appropriate, prepare forms on which meter readings can be recorded. Include
provision for time as well as date if readings are more frequent than once a month. It
is useful to show the meter serial number if known and also any special access
requirements (e.g. who holds the keys, swipe card or access codes)

Assessor training manual on energy management
10
• Take an initial set of readings for the record. This will help resolve ambiguous or
suspect readings later.
• Brief the nominated meter readers and provide training, especially relating to meters
with which they are not familiar
• If possible, disable any 'reset-to-zero' buttons.
• Check the security of power supplies to meters and ancillaries (where relevant). If
interruptions are a risk it may be necessary either to secure the supply, or read the
meter more frequently.
• In the case of natural gas supplies, identify where on the bills the calorific value and
the correction factor for temperature and pressure are shown. These will be needed to
convert the volumetric gas measurement to energy terms.
Practice
When you, your staff or contractors read your meters they should:
• Do so as close as possible to the target day and time
• Check each serial number or other unique identifer against that expected
• Always record the date and time on which each meter reading is actually taken (the
actual date and time as distinct from when it was supposed to be taken).
• Record the reading exactly as it appears on the meter. Show all the digits, including
the decimal fraction if there is one (decimal fraction digits may be indicated by a
contrasting colour scheme) and any fixed zero printed on the face of the meter. In
Figure xx the gas meter reading should be written down as 10558840.
• Gas-meter readings are usually volumetric and must be corrected for temperature
and pressure variations (unless the meter has a built-in corrector) and for calorific
value.
• Remember that the register displayed on most half-hourly electricity meters is not
the total units consumed, but rather the cumulative units for the rate band active at
the time of reading. Use the button provided to step through the available readout
registers to obtain the totals you want.
• On remote readouts with reset buttons, do not reset to zero after reading the meter.
• When meters are exchanged, take readings from both; note the date, and register the
attributes of the new meter on the central record.
• For unmetered commodities held in bulk on site, record their stock levels at the
same time as the readings are taken on meters, and the quantities of all deliveries
received since the last stock-level entry.

Assessor training manual on energy management
11
For sites with numerous meters it may be cost effective to invest in a handheld electronic
meter reading device to replace paper forms. This can be programmed to organise walk
orders and check that reads are sensible as they are entered, reducing the risk of misreads
and subsequent revisits or estimates. They can also save time by replacing manual data
entry with digital data import.
Any device with an internet connection and a web browser can also be used as a meter
data entry terminal by using the MeterPad web service. This provides a private,
password-protected central database for the storage and retrieval of meter readings.
Although it requires a little effort to set up, it then provides a highly organised framework
within which meter readers can, for example, preview earlier readings or leave comments
for other users sharing their data; it also creates an inventory of meters and their
attributes.
Automatic meter reading
An automatic meter reading (AMR) system will fulfil two distinct requirements:
facilitating remote readings, and providing fine-grained consumption histories. AMR is
thus beneficial in the following circumstances:
• A dispersed estate of multiple sites
• Unattended outposts
• Areas with access restrictions (tenants' areas, hazardous areas)
• Where numerous readings need to be synchronised, even if only on a weekly or
monthly basis
• Where information is required with minimum delay
• Where you want to monitor consumption within restricted time-bands, for example
to enable time-of-day billing of tenants’ supplies.
Some users will already have data collection capability in place, either through a building
energy management system (BEMS) or, in an industrial context, a supervisory control
and data acquisition (SCADA) system. Others will need to install some or all of the
infrastructure from scratch and in some cases, new compatible metering may be required.
AMR technology is too complex and diverse to deal with here. The technical issues and
options are outlined in an article at http://vesma.com/tutorial/art-amr.htm. Do not be
paralysed by the seemingly overwhelming choice of communication options, and do not
be tempted into thinking there is a 'one size fits all' solution. Most reputable providers of
data collection systems will use a variety of techniques suited to the circumstances of
individual meters.

Assessor training manual on energy management
12
Also, be skeptical of end-to-end solutions from single vendors. Companies that excel at
data collection often lack the knowhow to analyse and present data effectively, a topic
which is addressed in a later chapter. Split the project into two aspects:
• Metering, data collection and communications; and
• Analysis and reporting functions
The interface between the two is a database and that also is the place where diverse inputs
such as manual meter readings and driving-factor data are merged with AMR data. This
philosophy, furthermore, gives you the flexibility to have multiple AMR vendors if that is
convenient.

Assessor training manual on energy management
13
1-2 Understanding patterns of use A word of warning: this chapter contains some algebra, but don’t worry if it doesn’t go in
first time. All I want you to appreciate is that there is often a way to calculate expected
energy consumption from other independently-measured management data.
The point is that the overworked dictum 'you cannot manage what you do not measure'
does not quite tell the whole story. It is all very well to measure and record precisely how
much energy you have used: the big question is whether it was the appropriate amount.
That is a question we can't answer unless we understand, and can explain, patterns of
consumption in relation to prevailing circumstances by which I mean the weather, level
of production activity or other external driving factor. Traditionally, consumption that
varies because of such external factors has been treated as hard to manage, and the best
treatment that many people achieve is to ‘adjust’ their consumption data to take account
of what are seen as external disturbances that are somehow distorting the results. I
suggest that this is wrong-headed.
Let us think about two simple scenarios: the heating system in a building, and factory
which uses energy to process a homogeneous product. Start with the factory first. It
should be evident that the more product they make, the more energy they will require,
and it is quite plausible that each unit quantity of product requires a certain amount of
energy so that there is a simple proportionality between the two. We could say that the
production energy requirement E is linked to production output P by the formula
E = mP
where m is a constant specific to the process in question. However, in real life things are
not so simple. Usually, there is some constant background demand for energy in addition
to what goes directly into the product. This might be heat losses in the case of gas, or
other uses like lighting and extract ventilation in the case of electricity. Whether the
constant background energy requirement is associated with the process equipment or just
other continuous uses sharing the same meter, we can allow for it in the formula by
adding an extra term:
E = c + mP
where c represents the fixed demand in a given interval of time (one week, say). Readers
may recognize this formula as the equation of a straight line and one of the things we can
try, when developing a model of how energy consumption relates to a driving factor like
production throughput, is to plot our data on a scatter diagram of weekly energy against
weekly production to see if such a straight-line relationship seems to apply. This has been
done in Figure 1-2-1.

Assessor training manual on energy management
14
Figure 1-2-1
In a case like this, where we do indeed see a relationship, we can superimpose a best-fit
line and this gives us numbers for c (the intercept on the vertical axis) and m, the gradient
of the line, in energy units per unit of output. This straight-line ‘performance
characteristic’ enables us to estimate what the energy demand ought to have been, given
what the output was. In Figure 1-2-2 we see this illustrated. We draw a vertical line at the
prevailing production output and where this crosses the performance characteristic we
can read off the expected consumption. This will later come in useful because it gives us
a yardstick against which to assess what we have actually used. We can detect exceptions
(chapter 1-3) and evaluate savings relative to where we would otherwise have been
(chapter 3-5).
Figure 1-2-2

Assessor training manual on energy management
15
Could we have done the same thing for the building heating system? As it turns out, the
answer is yes. Figure 1-2-3 shows the weekly gas demand in a building: it is higher in
winter weeks than at other times. Figure 1-2-4 meanwhile shows something called the
‘degree-day’ value. This is a number, calculated each week from the recorded outside air
temperature, representing how cold each week was. The exact methods need not concern
us: the important thing is that the annual profile of degree-day values resembles the
profile of gas consumption:
Figure 1-2-3
Weekly gas consumption
Figure 1-2-4
Corresponding weekly weather
expressed as degree-day
values
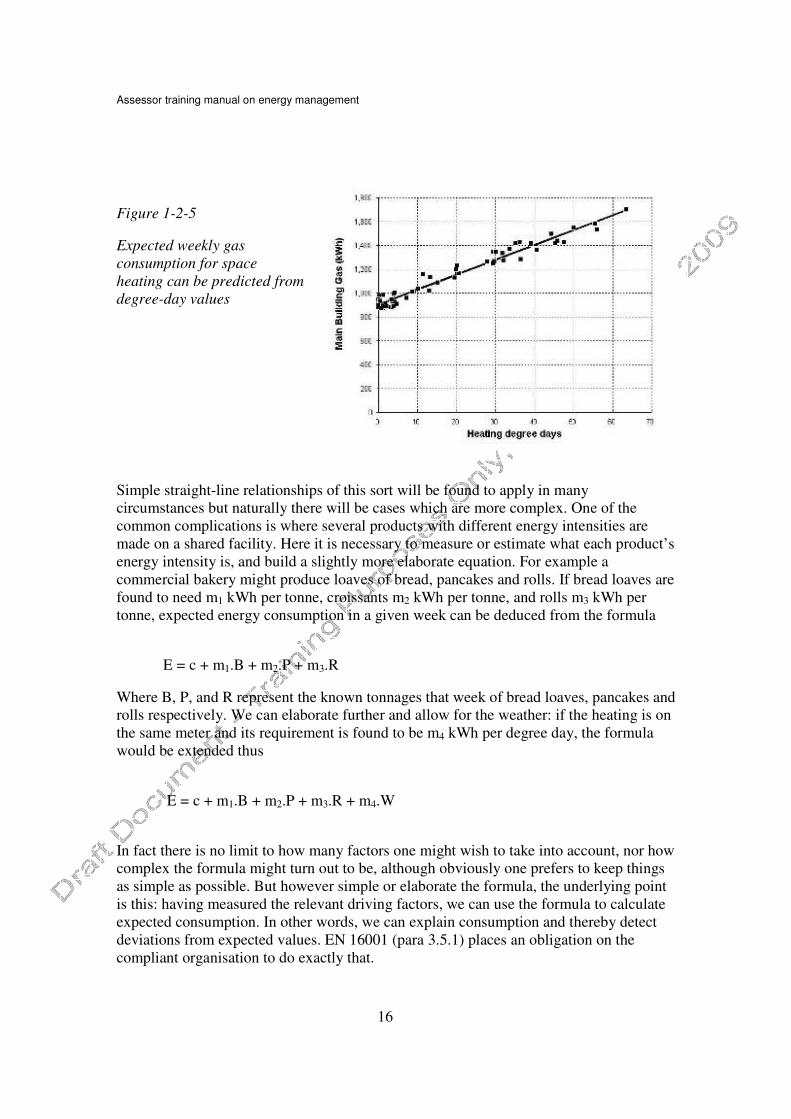
If we plot weekly gas consumption against the weekly degree-day values on a scatter
diagram, as in Figure 1-2-5, we see the familiar straight-line relationship. If the weather
measured in degree days for any given week is assigned the symbol W, we can write the
formula
E = c + mW
to describe the relationship. This is exactly analogous to the production example and if
we know how cold the weather was (in degree days) for a particular week, we can now
estimate the expected energy consumption.
Assessor training manual on energy management
16
Figure 1-2-5
Expected weekly gas
consumption for space
heating can be predicted from
degree-day values
Simple straight-line relationships of this sort will be found to apply in many
circumstances but naturally there will be cases which are more complex. One of the
common complications is where several products with different energy intensities are
made on a shared facility. Here it is necessary to measure or estimate what each product’s
energy intensity is, and build a slightly more elaborate equation. For example a
commercial bakery might produce loaves of bread, pancakes and rolls. If bread loaves are
found to need m1 kWh per tonne, croissants m2 kWh per tonne, and rolls m3 kWh per
tonne, expected energy consumption in a given week can be deduced from the formula
E = c + m1.B + m2.P + m3.R
Where B, P, and R represent the known tonnages that week of bread loaves, pancakes and
rolls respectively. We can elaborate further and allow for the weather: if the heating is on
the same meter and its requirement is found to be m4 kWh per degree day, the formula
would be extended thus
E = c + m1.B + m2.P + m3.R + m4.W
In fact there is no limit to how many factors one might wish to take into account, nor how
complex the formula might turn out to be, although obviously one prefers to keep things
as simple as possible. But however simple or elaborate the formula, the underlying point
is this: having measured the relevant driving factors, we can use the formula to calculate
expected consumption. In other words, we can explain consumption and thereby detect
deviations from expected values. EN 16001 (para 3.5.1) places an obligation on the
compliant organisation to do exactly that.

Assessor training manual on energy management
17
1-3 Detecting and prioritising exceptions It is good practice (and an explicit requirement of EN16001) to keep a register of
opportunities for saving energy. Opportunities will originate from energy surveys, from
suggestions made by staff or contractors, and from the detection of what EN 16001 calls
'accidental excess consumption' caused by minor faults, human error, and so on: what we
would call 'exceptions'.
Figure 1-3-1
This intermittent mechanism started
running continuously when a limit switch
in its control circuit came loose
Figure 1-3-2
Control valve on a heating system jammed
open with a lump of wood
Figure 1-3-3
Failed non-return valve on a nitrogen
compressor cost hundreds of pounds a year
in extra electricity for the compressor
The energy manager in a large organisation could have hundreds or even thousands of
metered streams of consumption to deal with and the traditional method of detecting
exceptions was to assess the monthly consumption through each against some yardstick

Assessor training manual on energy management
18
(maybe the consumption in the same month the year before) and set a percentage
variation limit on the deviation, which triggers an alarm. The results are very often
reported simply by flagging the supposed exceptions on general summary tabulations, or
at best by extracting a list of those streams which are supposedly out of limits. Leaving
aside the use of a monthly assessment interval (which I would regard as too long) this
methodology, which has unfortunately become the basis of some energy-management
software products, is crude, unreliable and inefficient.
A much better approach can be found in better commercial M&T packages and can
readily be implemented in a home-grown spreadsheet-based energy monitoring scheme.
It simply requires that you have, in each practicable case, a formula for calculating
expected consumption from the known values of the driving factors ('energy factors' in
EN 16001) as outlined in the previous chapter. Given the driving-factor data for the week
in question your software can thus assess the deviation (in energy-unit terms) from
expected consumption and it is the size, and more specifically the cost, of this deviation
which determines its importance. Percentage is secondary: a big percentage deviation on
a minor consumption stream could be less significant than a moderate deviation on a
large one. A small absolute deviation on an expensive commodity may be more important
than a bigger deviation in something cheaper.
Once we have a cash value for the deviation for every targeted stream for the week we
are reporting, we need to find an efficient way to present the information to the user and
the best method -- which will seem obvious when I say it -- is simply to rank the report in
descending order of the costs of deviations. Such a report is called an Overspend League
Table and it has the following attributes and advantages:
• The most important deviations are always at the top of page 1;
• It will immediately clear which, if any, consumption streams are worth pursuing. If
the biggest deviation is not costing too much, you can get on with other work and not
waste time;
• No specialist energy knowledge or computer skills are needed;
• Other consumables like water, chemicals, and so on, can be integrated into the same
management report;
• There is no limit to the number of streams reported (because of the way the
important cases float to the top).
There is one final refinement that I would suggest, and that is to have within your M&T
scheme a way of recording typical variability for each monitored stream; in other words,
the limits of normal deviation in unit terms. Some streams will exhibit more variability
than others because in some cases the formula for calculating expected consumption will
work well with only a small error under normal conditions, while in others the
uncertainty will be much greater. Suppose for example you had two
electricity-consumption streams, one which normally varied by plus or minus 500 kWh in
the week and the other plus or minus 7,000 kWh. If both experience excess consumption

Assessor training manual on energy management
19
of 2,500 kWh the apparent cash loss would be the same in both cases, but only the first
would be treated as a significant deviation. We want to avoid both spurious alerts and the
possibility of missing things, so we must tune our assessments of individual streams’
behaviour and filter the results accordingly.
Figure 1-3-5 is an overspend league table implemented in Excel and including
traffic-light symbols to indicate significance. Amber shows a deviation within normal
bounds, red indicates unusually high excess consumption, and green would indicate
consumption significantly below expectations. Where data-gathering has been taken care
of, it takes only a few moments a week to generate this report. It does not need to be
published or circulated: its purpose is to support a decision about what (if anything) needs
pursuing. It is all about enabling the energy manager to ask the right question of the right
person at the right time.
Figure 1-3-5
It is good practice to keep a record of any significant excess consumptions that you
detect, and to track them through to resolution. In fact EN 16001 makes this a
requirement. A word of caution, however: check the data before doing so, and not just the
consumption data. Remember that an error in degree-day figures, production, or other
driving factor could requally be to blame for spurious reports.

Assessor training manual on energy management
20
1-4 Raising awareness and motivation Although energy efficiency is a technical topic, the solutions are not all technological.
Human factors -- attitudes, knowledge, awareness and skills -- will be a significant
energy aspect for most organisations because while it is true that people cause some
energy waste they also hold three keys to improvement:
1. changing their own behaviour;
2. being vigilant for waste;
3. suggesting improved working methods or technical innovations.
But improvements will not happen spontaneously. People need help and guidance. We
need to think about their levels of energy awareness; about their attitudes; about what
motivates them; and about what knowledge (or even practical skills) they might need.
Figure 1-4-1
Energy awareness materials
for the BBC, designed for
NIFES by Purple Circle
What motivates people? A good way to start finding out is by asking them. The very act
of pounding the beat, chatting with folk informally about their views on energy and the
environment, will itself start to raise the profile of the subject. Some will mention
problems you did not realise existed: obstacles that perhaps can readily be corrected ("I
never turn any of these lights off because I don't know which switch controls which
area"). Others will volunteer ideas which up until that moment they have kept to
themselves. If you let the conversation roam, you will find clues about things which
might act as motivators ("I wish they'd plant some trees around the car park"). Of course
you will get moans and grumbles as well: "It's always freezing in here on Monday
mornings". This is important. You need to be in a position to do something about genuine
minor grievances like this. The complaints you hear will have been made many times
before and -- as far as the complainer can see -- ignored. If the problem is one which can
be solved, it will be important for you to resolve it, because otherwise it will be a

Assessor training manual on energy management
21
demotivator. But sometimes the problem itself is not what de-motivates: it is the fact of
the complaint being ignored. If you follow up an issue and then go back to explain why it
can't be resolved, that in itself may be such an improvement on earlier responses that
your dissatisfied occupant becomes an ally.
For medium to large organisations, a questionnaire can then be designed using some of
the clues that face-to-face interviews reveal. NIFES Consulting has done a lot of these,
both paper-based and on-line, and uses a scoring technique that allows the workforce's
profile to be plotted on a grid of motivation against awareness. The aim is to move people
towards the high-motivation, high-awareness zone and out of the others. It is not always a
question of people scoring low in both dimensions: those who are aware but unmotivated
need different treatment from those who are highly motivated but lack awareness of what
to do. Some people in that category present a perverse risk that they may take initiatives
which,being ill-informed, are counter-productive. Over the years a pattern has emerged
from these studies which is that people are motivated most by having a top person from
the organisation visit their department on a walk-about energy survey. The things they
value least are electronic communications.
The Web needs to be used with caution. My colleagues at NIFES have tried it for on-line
questionaires and found that exclusive reliance on web surveys can skew the response by
excluding those workers (such as domestics and catering staff in hospitals, or machine
operators in factories) who do not have access to the internet or intranet, and who
paradoxically may be among the most important people to target. So they now provide
paper questionnaires as a complementary input channel.
Fostering positive attitudes is not easy, but my experience has generally been that unless
morale is rock-bottom, people will usually engage in a helpful way with something as
worthy as environmental improvement. Motivation comes in many forms, of which
money is perhaps the least effective and the most risky. People value learning about
energy saving in the home, for instance, as a by-product of being trained about energy in
the workplace. Reduced energy use, when it is achieved by avoiding operating equipment
needlessly, also means reduced wear and tear, fewer breakdowns, and even in some cases
reduced noise nuisance.
Awareness-raising will be the least of your problems because everything you do
(including asking people about their attitudes) will automatically improve it. Just bear in
mind that there are at least two categories of awareness that you will want to test. One is
awareness of how and where the organisation uses energy; the other is awareness of what
individuals can and should be doing to minimise consumption. Historically, we have also
tested awareness of climate change and its causes, but this is much less important because
people today are either aware of the issue through media exposure, or want to argue the
toss, which does not help us.
Providing training (even very brief sessions) can help enormously not just by helping
people to work in an energy-conscious way, but also by creating a break from normal
routine and even providing a bit of fun. For some key workers, that essential bit of skills
training may contribute directly to energy saving. In 1986 when I was working for
Gloucestershire County Council, we spent just under £12,000 on off-the-job energy

Assessor training manual on energy management
22
training days for school caretakers. Not only did we raise their awareness; we found we
had (quite accidentally) improved their attitudes and motivation by providing them with
the first training most had ever had. They enjoyed meeting each other, and several went
on to make valuable energy-saving suggestions. One moved to a large college where he
single-handedly saved two-thirds of the cost of the programme. Three years later (and
after I had left) the County was still attributing those training courses with energy savings
worth over £80,000 a year. They had recouped their investment 20 times over; now that's
what I call a payback
The benefits of improved awareness fade with time, so how often should you refresh an
awareness campaign? Twice a year? Every three years? The answer is to use your energy
monitoring and targeting scheme to detect loss of momentum. You will also find that it
produces charts that can be used to provide feedback to staff.

Assessor training manual on energy management
23
2-1 Building fabric The significance of building fabric to the energy manager lies in the opportunities that
could present themselves to reduce heat loss from buildings in cold weather. By ‘heat
loss’ I mean the flow of thermal energy, not a decline in temperature. With the internal
temperature held constant above outside-air temperature, heat continually flows out (a)
by thermal conduction through the walls, roof, floors, doors, and window glass and (b) in
the warm air displaced by colder outside air, which is introduced either deliberately for
ventilation or incidentally through gaps in the fabric.
All the heat that flows out through conduction and air-displacement has to be balanced
by heat input from the heating system (assisted by incidental gains from lighting,
equipment and people within the space). Insulating to reduce conduction losses, and
draught-sealing to reduce air displacement, both have a direct beneficial impact on the
amount of fuel that needs to be purchased (similar arguments apply to the need for
cooling. Insulation, especially of roofs, can help to reduce heat inflows in hot weather,
reducing discomfort and the need for air conditioning).
Thermal comfort is an important issue and insulation has an interesting effect. Only
about half of our perception of comfort indoors is attributable to the temperature of the
air in the room; half is attributable to the temperatures of the walls and ceiling
surrounding us. This is because some of our body heat escapes by radiation to these cold
surfaces. Poorly-insulated walls and ceilings have significantly lower surface
temperatures than those with even a small insulating layer, whose thermal resistance
causes the internal surface temperature to rise towards the air temperature. By reducing
the discomfort attributable to cold surrounding surfaces, insulation enables us to maintain
the same level of comfort with a lower air temperature than was previously needed. This
further reduces the heat loss, including the heat loss through air displacement.
Opportunities to build new premises will not often arise, and when they do, regulations
will dictate the thermal performance of what you build; the big issue as far as this book is
concerned is what one can do through discretionary improvements to existing buildings.
Improving air-tightness is generally the easier route. Partly it is about applying suitable
draught-sealing products to openable elements like doors and window, or repairing them
so that they fit properly, or both. But it could also entail plugging up holes in the fabric
such as the gaps that will often be found where door and window frames are set into the
walls, or at the junctions between walls and roofs, or around penetrations for piped
services and cabling. Very often, straightforward measures will suffice like caulking with
mastic, filling with expanding foam, replacing loose mortar, or repairing damaged
cladding or blockwork.
A leaky building could easily be losing the majority of its heat through air displacement,
so the improvement may be significant. As is often the case, there will be incidental
benefits as well; discomfort from cold draughts, noise transmission from outside, and
dust ingress could all be reduced.
Thermal insulation tends to be more problematic. It is generally likely to be less
cost-effective and (with the possible exceptions of cavity filling, loft insulation and
external roof treatments) is usually disruptive. However, it should not be overlooked.

Assessor training manual on energy management
24
When a print works in Gloucester expanded into the neighbouring industrial unit, they
took the opportunity to insulate the space before occupying it, and they have found it
works without a heating system.
The effectiveness of insulation is gauged by the ‘U-value’ of the wall or other element of
the building envelope in which it is fitted. The U-value is the heat flow in watts through a
square metre of the surface, per degree Kelvin of temperature difference. Halving the U-
value halves the heat flow at a given temperature difference. The following table provides
a few examples:
Construction U (W/m2K)
approx.
Single-glazed window 5.5
Double-glazed window 3.0
Brick cavity wall (50mm cavity) 1.4
Ditto filled with mineral fibre 0.6
Uninsulated ceiling under pitched roof 3.0
Ditto with 50mm mineral fibre 0.7
Ditto with 150mm mineral fibre 0.3
There is a huge range of techniques and materials for insulating walls roofs and floors,
and every situation is different. Fortunately there are a number of very good specialist
installation contractors who can be found in the UK through trade associations such as
Eurisol and the Association for the Conservation of Energy. Choose one that offers a big
range of products and techniques, and can provide comprehensive and objective advisory
literature.
Figure 2-1-1
Thermal imaging to locate defective
insulation

Assessor training manual on energy management
25
Figure 2-1-2
Laying insulating panels over a flat roof
Figure 2-1-3
‘Punkah’ fan prevents hot air pooling
under the ceiling and increasing heat
transmission through the roof
If you would like to know more about the theory and how to estimate savings, or find
further contacts, visit www.vesma.com/tutorial/fabric.htm

Assessor training manual on energy management
26
2-2 Heating and ventilation Space-heating systems come in many forms. At the lower end sit the individual gas
radiant-tube, electric infra-red, or gas or oil-fired cabinet air heaters often found in
smaller industrial premises. At the upper end there are multi-boiler systems with ducted
air supply, generally with air-handling units supplied with hot water in a circulation
system. In between are central systems with radiators, natural convectors or
fan-convector units. Central boiler plant may use gas, oil, coal (rarely) or (increasingly)
biomass. Electric heating is still encountered, either off-peak storage heaters or on-peak
portable heaters. Heat pumps could also be added to the list but to make this chapter
manageable I will focus on central-boiler systems and point out in passing anything that
is relevant to other technologies.
Control is a critical issue when looking for efficiency improvements. The aspects to be
considered include:
1.. time;
2.. temperatures;
3.. zoning;
4.. frost prevention;
5.. boiler sequencing; and
6.. in ducted-air systems, the ventilation make-up and recirculation rate
The first thing to check is that time control is flexible enough to match heat supply to patterns of occupation. In most places that means the ability to set different occupied
periods depending on the day of the week, to provide for occasional out-of-hours use, and
to schedule public holidays and the like. Today, wireless digital programmable
thermostats that can achieve this are cheap enough for domestic use, meaning that there is
no excuse for soldiering on with fixed 24-hour timeswitches. With a computerised
building energy management system, it may just be a question of starting to use its
features properly.
A further opportunity, particularly applicable to buildings with poor thermal
characteristics, is ‘optimum-start’ control. Whereas you would set a conventional heating
timer to start the boilers at some fixed time in the early hours of the morning to preheat
the building, an optimiser is smarter. You tell it what time the building should be ready,
and the device itself decides, day by day, how late it can start the heating. It will
moreover train itself by monitoring how the building responds and in this way ensure that
the building is never maintained at occupied temperature longer than necessary. Optimum
start is a feature of building energy management systems and of stand-alone heating
controllers alike. It can be applied to almost any kind of heating.
The other significant feature to look for in an effective time-control regime is the ability

Assessor training manual on energy management
27
to set extra time occasionally (for evening lettings, overtime working at weekends, and so
on) without the risk of permanently altering the schedule.
Regarding temperature control, there are numerous methods. Thermostatic radiator
valves (TRV) are a common choice and can if required be fitted with remote sensing
heads. This gives some advantage over the integral sensor, which can be affected by the
heat emitted from nearby pipework. TRVs can be retrofitted to existing radiator systems
and can be locked to limit their range of control; some are even available with their own
wireless digital temperature and time programmer.
Radiator systems can also use a control technique called compensation, in which the
circulating water temperature varies according to the weather. The colder it is outside, the
hotter the radiators run; in mild conditions they run cooler. This strategy, which dates
from the era before TRVs, matches heat output to expected demand. It has the great
advantage that if the occupants open the windows, their rooms get cold and the heating
does not respond. With TRVs or other local thermostatic control on a system running at
fixed circulation temperature, the heaters would respond by delivering more heat, which
is obviously wasteful and does nothing to encourage people to close the windows again.
Compensation can be used in combination with TRVs and is particularly beneficial where
there are significant runs of uninsulated pipework, since these will no longer wastefully
overheat the spaces they pass through.
Figure 2-2-1
Extensive bare pipework on a radiator
system calls for compensated-temperature
control
Compensation is not compatible with fan-assisted convector heaters. The water circuits
feeding these must always be run at constant temperature or the air flow from them will
be perceived as cold (a manifestation of the wind-chill effect). Temperature control for
such heaters is often achieved by a thermostat turning the fan on and off. This may,
however, leave unwanted heat output due to natural convection, particularly where there
is significant vertical distance between the inlet and outlet grilles of the heater cabinet.
Where this is a problem, it may be feasible to fit a motorised valve to stop the water flow
through the heater coil when there is no heat demand.
In buildings with central ducted air supply, the inlet air may be partially preheated and
then delivered to the space through a ‘terminal reheat’ unit which operates under local
thermostatic control. With this arrangement, as with fan-convector heaters, greater
economy may be achieved by attention to the positioning of the temperature sensor or
thermostat and, in the case of thermostats, the use of electronic types with a narrow
switching differential. The older electromechanical thermostat may switch on and off
over a band of two degrees, allowing temperature swings which cause waste since they
result in a higher-than-necessary average temperature being maintained in order to satisfy
Assessor training manual on energy management
28
the required minimum.
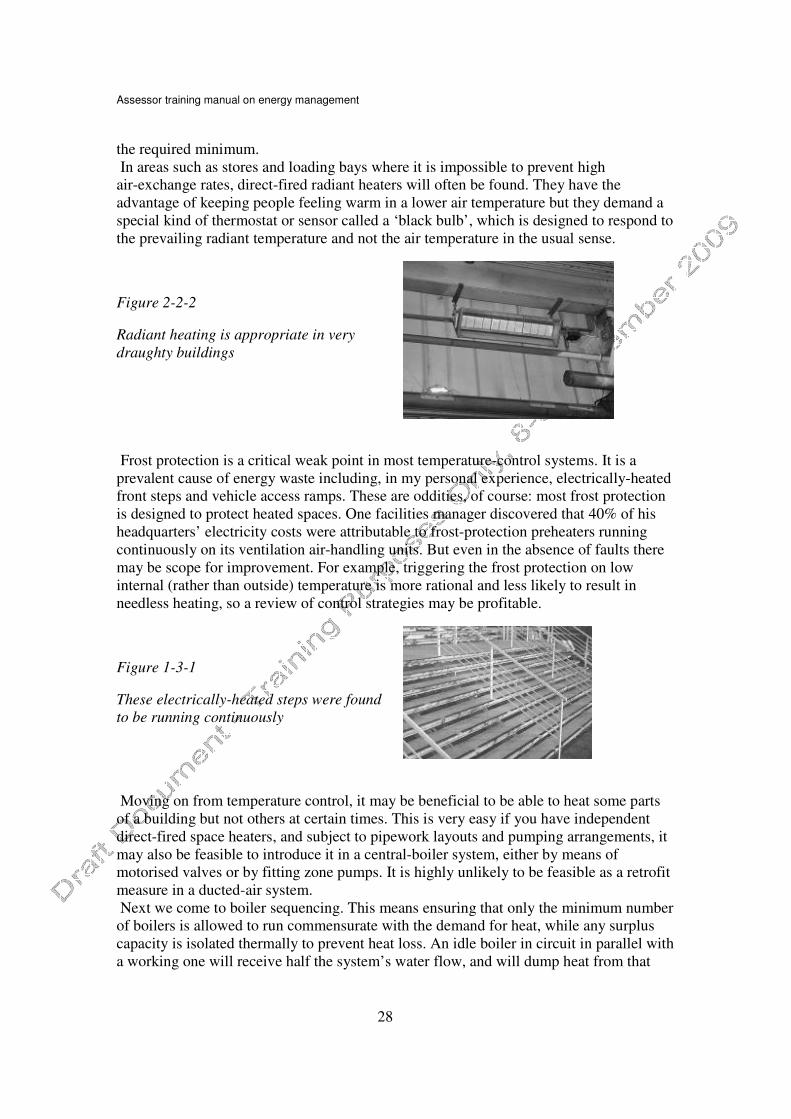
In areas such as stores and loading bays where it is impossible to prevent high
air-exchange rates, direct-fired radiant heaters will often be found. They have the
advantage of keeping people feeling warm in a lower air temperature but they demand a
special kind of thermostat or sensor called a ‘black bulb’, which is designed to respond to
the prevailing radiant temperature and not the air temperature in the usual sense.
Figure 2-2-2
Radiant heating is appropriate in very
draughty buildings
Frost protection is a critical weak point in most temperature-control systems. It is a
prevalent cause of energy waste including, in my personal experience, electrically-heated
front steps and vehicle access ramps. These are oddities, of course: most frost protection
is designed to protect heated spaces. One facilities manager discovered that 40% of his
headquarters’ electricity costs were attributable to frost-protection preheaters running
continuously on its ventilation air-handling units. But even in the absence of faults there
may be scope for improvement. For example, triggering the frost protection on low
internal (rather than outside) temperature is more rational and less likely to result in
needless heating, so a review of control strategies may be profitable.
Figure 1-3-1
These electrically-heated steps were found
to be running continuously
Moving on from temperature control, it may be beneficial to be able to heat some parts
of a building but not others at certain times. This is very easy if you have independent
direct-fired space heaters, and subject to pipework layouts and pumping arrangements, it
may also be feasible to introduce it in a central-boiler system, either by means of
motorised valves or by fitting zone pumps. It is highly unlikely to be feasible as a retrofit
measure in a ducted-air system.
Next we come to boiler sequencing. This means ensuring that only the minimum number
of boilers is allowed to run commensurate with the demand for heat, while any surplus
capacity is isolated thermally to prevent heat loss. An idle boiler in circuit in parallel with
a working one will receive half the system’s water flow, and will dump heat from that

Assessor training manual on energy management
29
water up the chimney. Heat will be wasted but – just as importantly – the combined flow
from the two boilers will be a 50/50 blend of heated water from one and slightly cooled
water from the other. This could actually prevent the connected heating and hot-water
system from working as it should. An effective sequencing control will enable full output
during the morning preheat period (to make it as short as possible) but will then trim back
the available capacity to match what is necessary for maintaining steady conditions
through the day. It is like accelerating your car away from traffic lights and then easing
back on the throttle to cruise at a steady speed, with more or less throttle depending on
the gradient.
The difference can be significant. In one instance I visited two office buildings
belonging to the same organisation when it was about 12°C outside to find one using
virtually no gas while its more modern sister building’s boiler were running at 20% of
rated maximum output. The difference was that the second building had ineffective
sequence control and all its boilers were taking turns to feed each other’s standing losses.
Effective sequence control demands two things:
1.. an appropriate control strategy applied to suitable sensor measurements; and
2.. effective means of physically isolating idle boilers. This may be valves or
dampers.
One or both of these factors may be absent, in which case there will be an opportunity to
reduce energy waste.
Finally we need to think about controlling the ventilation rate, which is most easily done
when the building has ducted air supply. Simple time control can make a significant
difference, remembering that even during the pre-occupation morning boost period the
ventilation can be minimised. Not only does this directly reduce heat loss: it reduces the
warm-up time which itself yields a small gain in efficiency. In some buildings with
ducted air supply, there is provision for recirculating a proportion of the extract air. You
need to check that the conrol strategy is maximising the recirculation rate because that
minimises the amount of cold outside air that needs to be drawn in and heated.
The recommended method for monitoring the health of a heating system is to assess the
building’s weekly fuel consumption against heating degree days, either calculated from
local outside-air temperatures or obtained on subscription from a nearby observing
station. For substantial installations it may be worthwhile installing a heat meter,
assessing fuel used against heat generated and heat generated against degree days. This
will enable you to discriminate between faults within the boilerhouse and waste in the
delivery of heat.

Assessor training manual on energy management
30
2-3 Combustion equipment In all combustion equipment, there are inevitable energy losses. Not all the energy in the
fuel can be effectively used. The losses can however be minimized by appropriate
maintenance, and this represents a small but very cost-effective contribution to the
enterprise’s energy saving programme.
The principles can be illustrated by reference to a piece of energy conversion equipment
that almost every reader will have responsibility for – a heating boiler. Most of the heat
released from the fuel is absorbed by the water in the boiler, but some escapes in the
exhaust gases. Some heat is also lost from the casing of the boiler. Figure 2-3-1 shows the
energy balance: energy arrives in the fuel at F units per hour; heat is lost up the stack at S
units per hour; and heat is lost from the casing at C units per hour. The difference, F-S-C,
leaves the system as useful energy, U units per hour (strictly speaking this is the net
useful heat: what leaves in the circulating water flow minus what comes back in the
return).
Figure 2-3-1
Energy balance for a
heating boiler
The stack loss S is a certain percentage of the fuel input F, and the ratio (F-S)/F is called
the ‘combustion efficiency’. S can never be zero because the exhaust gases have to be
maintained above a certain temperature to ensure that the chimney works effectively and
to prevent corrosive condensation (condensing boilers are an exception – see below).
How high or low the actual efficiency is depends on various factors that affect S,
including how well the burner is tuned. Excessively-high exhaust temperature will
increase losses because of the exhaust gases carrying more energy away. Excessive
exhaust-gas volumes will also waste energy (even if the temperature is OK) and this will
occur if the fuel:air ratio is too “lean” – that is to say, if more air is fed in than is
necessary for complete combustion. Conversely if too little air is supplied for complete
combustion, some unburned fuel will escape up the chimney (as smoke, soot or carbon
monoxide depending on the fuel). Damaged burners can cause incomplete combustion
even with considerable excess air.
Different burners can achieve different efficiencies, but a figure of about 80% - 85%
would be typical in a heating boiler. The burner in a condensing boiler can achieve close
to 100% because the exhaust gas is discharged at low temperature and latent heat is
recovered from the water vapour, in the exhaust. By contrast, a burner on a
high-temperature furnace would usually be much less efficient because of the high
temperature at which heat is exhausted up the chimney.
Correct adjustment of air:fuel ratio, combined with measures to minimise the exhaust
temperature (like keeping the boiler internals clean, Figure 2-3-2) will between them
ensure that the maximum useful heat is extracted from the fuel. This could yield a saving

Assessor training manual on energy management
31
of several percent on boiler fuel, depending on how bad the situation is to start with -
perhaps of the order of 20-30% in the worst cases. Moreover, these savings could be
achieved at little or no cost since combustion testing and adjustment of burners ought to
be part of good routine maintenance. Every boiler maintenance visit should include a
combustion test, which can be done by sampling the exhaust gases (figure 3) and its
results should be reported.
Figure 2-3-2
Combustion analysis equipment
in use
Combustion efficiency can be tested by taking the following measurements:
• Stack temperature
• Ambient temperature
• Percent of either oxygen or carbon dioxide in the exhaust gas
• Carbon monoxide level (for gas) or smoke number (for oil)
It is always worthwhile comparing each successive result with earlier tests. Set the best
achieved efficiency as the target, and query any result which is less than the previous
best. You may be able to compare similar installations (bearing in mind that particular
features, such as chimney height, may affect achievable efficiency).
If you don't do the tests yourself, you should check that the reported percentage
combustion efficiency is consistent with the recorded 'raw' measurements. A spreadsheet
is available that can help you do this (http://vesma.com/tutorial/combust05.xls). It is
based on something I did when I was energy manager for a large organisation, and had
checked through a batch of test reports from our boiler maintenance contractor to find
about half of them somewhat suspect. I went out and did some spot checks with my own
equipment, and stumbled over evidence of falsification: in some cases, previous test
results were chalked up on the boiler, obviously with the intention of saving the
technician the bother or doing a real test next time around. But the most surprising
evidence of cheating was that flue-gas tests has been reported on some installations
where there wasn't a probe hole in the boiler flue.
In summary: poor maintenance of burner equipment will cause avoidable losses.

Assessor training manual on energy management
32
Minimising costs is just a question of getting the maintenance right: and that will only
happen if you monitor performance and insist that things are done as they should be.
Figure 2-3-3
Boiler cleaning
Assessor training manual on energy management
33
2-4 Air conditioning and refrigeration Refrigeration equipment is found in air-conditioning, food-storage, and process
applications, and is the basis of ground-source and air-source heat pumps. There are two
main classes of machine to generate the cooling effect: absorption chillers (in which heat
is used as the power source) and the more commonplace vapour-compression chiller
which uses mechanical power, usually from an electric motor.
In the latter case an organic vapour in a closed loop is first compressed, which raises its
temperature. Heat is then removed from it in a heat exchanger cooled by ambient air or
cold water, which causes it to condense to liquid form. It then passes through a throttle
valve to a region of low pressure. At this reduced pressure, its boiling point is below the
temperature of the air or water that needs cooling. The two pass through another heat
exchanger where heat from the air or water boils the refrigerant, losing heat in the process
and dropping in temperature. The refrigerant, having now returned to vapour, goes back
around the circuit to the compressor.
Absorption machines operate on a somewhat more complex principle in which vapour is
absorbed by a liquid in one part of the circuit and then boiled out of solution in another.
Being driven by heat rather than mechanical power, it is an attractive option where waste
heat is available as an energy source.
Whichever type of refrigeration cycle is used, the overall picture is the same: heat is
extracted from the chilled medium in one heat exchanger (the evaporator) and dumped to
atmosphere, either directly or indirectly via a cooling circuit, in another (the condenser).
The efficient supply of cooling service can be ensured by taking the following
precautions:
1.. Make sure that nothing impedes the transfer of heat in condensers or evaporators,
by keeping them clean, unobstructed, and free of ice.
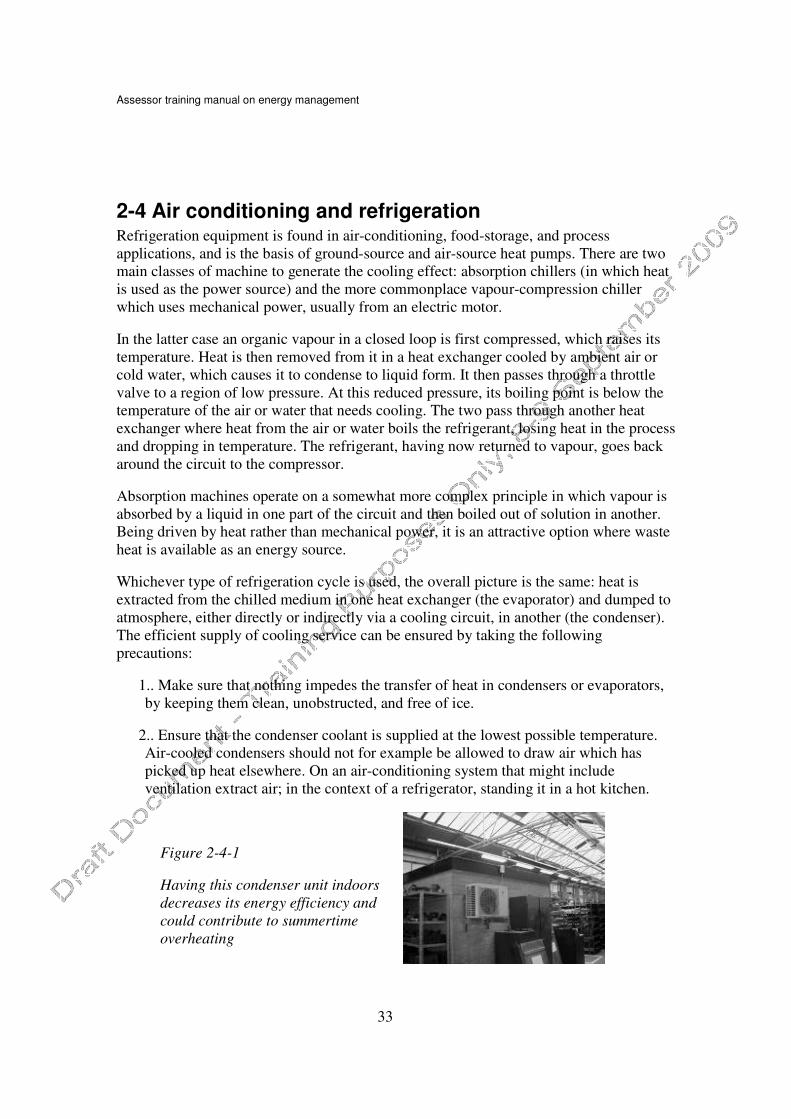
2.. Ensure that the condenser coolant is supplied at the lowest possible temperature.
Air-cooled condensers should not for example be allowed to draw air which has
picked up heat elsewhere. On an air-conditioning system that might include
ventilation extract air; in the context of a refrigerator, standing it in a hot kitchen.
Figure 2-4-1
Having this condenser unit indoors
decreases its energy efficiency and
could contribute to summertime
overheating

Assessor training manual on energy management
34
3.. Monitor temperatures and pressures in refrigerant circuits. Abnormal readings will
indicate loss or contamination of refrigerant charge, compressor faults, blocked
strainers, or other conditions that are likely to have an adverse impact on efficiency
(cooling power divided by input power).
4.. On multi-chiller installations, check that the control system is only running the
minimum number of chillers required at any given time.
Ensuring an efficient, least-cost source of cooling power is not of course the whole story.
You will also need to ensure that good use is made of the cooling supplied. Let us take air
conditioning first. Here, from my experience, the prevalent problem is simultaneous
heating and cooling of the same space. This is a classic example of avoidable waste
because it is superficially symptomless but, once detected, may require little more than a
change to temperature control set-points (the usual mistake being that the cooling and
heating target temperatures are set too close to each other; the slightest overshoot on one
or other causes them to lock in contention). The biggest risk is naturally where the two
control systems are independent, but failure of a valve or damper, or of a frost-protection
thermostat, can cause simultaneous heating and cooling in the best-designed installation.
Otherwise in air-condioned premises you should check that
1.. the conditioned space is not drawing in too much fresh air;
2.. there is no exchange of air with untreated spaces;
3.. time and temperature controls are appropriately set; and
4.. the target space temperature is reasonable.
Enlightened organisations these days prohibit the use of cooling below a certain internal
temperature, generally around 26C.
We should at this point mention humidity control, which is an aspect of some
air-conditioning systems that increases the demand for cooling power. Water vapour is
present in the air and, in the right quantities, contributes to comfort. Too little causes
itchy eyes; too much will make it feel muggy.
Our bodies perceive the relative humidity (RH), which is a measure of the degree to
which the air is saturated with water vapour, there being a maximum quantity of vapour
which air can hold at any given temperature.
Generally speaking, relative humidities in the range 30%–70% are acceptable. In
temperate climes such as the UK, buildings without humidity control naturally achieve
these conditions most of the time.
Some buildings do however have equipment for regulating the internal relative humidity.
This can be provided at two levels:
• Humidification only, to counteract the low relative humidity which can occur when
cold outside air is introduced and heated. Cold air cannot hold much water vapour,
and therefore has a very low RH after being heated.

Assessor training manual on energy management
35
• Full humidity control: this is where dehumidification is available to deal with high
RH, as may occur in summer in buildings with a high percentage of air recirculation.
The recirculated air will have picked up water vapour from the building occupants,
catering, potted plants and so on.
Both humidification and dehumidification require energy. Humidification needs heat to
evaporate liquid water. Dehumidification requires chilling and heating: the air must first
be cooled sufficiently to condense out the excess water vapour, and then reheated.
Energy demand can be reduced by relaxing the specification for internal RH. If the target
is 50% RH, the system will always be humidifying or dehumidifying, whereas if the
permitted range were extended to 40%–70%, then the building’s air supply would need
neither form of conditioning much of the time.
In process cooling applications it is usual to use a medium such as water, glycol or brine
circulating in a closed loop between the chiller plant and the various apparatus that needs
cooling. Depending on what the cooling uses are, there may be an opportunity to raise the
circulating temperature. Operating at an excessively-low circuit temperature has two
adverse effects. It reduces the thermodynamic efficiency of the chiller plant, since it has
to pump heat across a wider temperature differential; and it increases unwanted heat
gains in the distribution circuit since they are that much further below ambient
temperature. This incidentally raises another issue: the need to keep the pipework and
fittings well insulated.
There are two other possible opportunities in the context of central chiller plant, perhaps
more related to the chapter on motor-driven equipment, but worth mentioning here. The
first concerns the flow rate in the distribution loop. If demand is highly variable, there
may be scope to use variable-speed drives to minimise pumping energy requirements.
Secondly, where there is a bank of fan-assisted cooling towers, consideration should be
given to how they are controlled. If the fans run at fixed speed, schedule them so that
only the minimum number run at any one time to satisfy the condensers’ demand. But if
they have variable-speed fans, keep them all running and modulate the fan speed.
Refrigeration in food storage will be covered under the chapter on catering.
Finally, the usual recommendation for monitoring the energy used in air conditioning is
to relate weekly electricity consumption to cooling degree days (either measured locally
or obtained on subscription). Ideally, chillers should be separately metered, but even if
they are not their effect on overall building consumption should still be perceptible.
When monitoring process loads, the ideal arrangement is to use a heat meter to measure
the total cooling supply, using that as the driving factor for chiller energy use. Cooling
supply can then be assessed in relation to production activity or weather (or a
combination of the two); breaking the cooling supply chain in this fashion enables you to
discriminate between waste that occurs in the chiller plant and the downstream
applications respectively.

Assessor training manual on energy management
36
2-5 Lighting Lighting in itself is not always a major energy use, but it is disproportionately important
because of the visual cues it sends to the occupants of buildings. Very often when
training staff or interviewing them about their attitudes to energy, I have heard them
complain about the buildings where they can see lights being left on unnecessarily.
Conversely, working in a building with automatic lighting control, one is constantly
reminded, in effect, that the organisation cares.
There are a number of easy and inexpensive steps that you can take. There are some
workplaces, for example, where people may not even know where the light switches are,
or if they do, it may not be clear which of a bank of switches controls which area. Clearer
labeling is simple: it need not be flashy, and combined with motivation and awareness, it
will help to cut costs.
Figure 2-5-1
Well-labeled light switches
I will cover low-energy lighting technologies later, but suffice it to say for now that
tungsten-filament bulbs should just be replaced without further consideration. Replacing
a 60W bulb with a compact fluorescent lamp (CFL) will save something of the order of
£50 (at 2009 prices) over the life of the lamp, not counting the savings in maintenance
costs. CFLs are available in sizes and styles to suit almost every application including
spotlights and chandeliers, and start-up delays are a thing of the past.
Another important consideration is the level of illumination that is provided. The CIBSE
(Chartered Institution of Building Services Engineers) recommendation for offices, for
example, is 400 lux but a survey with an inexpensive light meter could reveal that this is exceeded. You are very likely to find that corridors and staircases are overlit compared
with the CIBSE recommended level of 200 lux. You may conclude that it is possible to
disconnect some light fittings. In fact in the absence of glare from windows or other light
sources, 200 lux is perfectly comfortable for office work, and I am writing this with an

Assessor training manual on energy management
37
ambient light level of 32 lux on my desk which is adequate for reading paperwork (but
makes the room look too gloomy for most people's tastes).
Figure 2-5-2
Light meter
Some building managers have successfully reduced the number of tubes in existing
multi-tube fittings, after replacing their reflectors to improve light delivery from the
luminaire. This can be done without detriment to light levels provided on working
surfaces.
Daylight
When daylight is available, it makes sense to use it in preference to artificial lighting.
Paradoxically, large windows are counter-productive, because they cause huge contrasts
in light level within the space, creating the impression that areas away from the window
are dark. The best results will be obtained when spaces are evenly lit. Having windows --
even small ones -- on both sides of a room, or using rooflights (or 'sun pipes' when there
is an intervening roof void) will help. Even though absolute light levels may be lower, the
space will feel better lit. When designing accommodation, remind the architect that tricks
like light-coloured sloping ceilings, splayed window reveals, and wide window-cills will
help to distribute natural light through the space. For an existing space, an external 'light
shelf' or properly-configured slatted blinds can be used to bounce incident light up onto
the ceiling.
Figure 2-5-3
Natural lighting from above and
angled reflective surfaces create
a well-lit appearance

Assessor training manual on energy management
38
The things which make spaces costly to light are some of the same things that make then
dispiriting to work in: dirty windows and rooflights, piles of clutter, and dark decor and
furnishings.
Controls
To make most effective use of natural light, photocell controls may be appropriate, but
this is just one aspect of the subject. The objectives of a lighting control regime are to
provide illumination
1. At the times it is required
2. Where it is required
3. At an appropriate level of illumination
4. Without causing distractions
5. Without compromising safety
The broad recommendations for various indoor lighting scenarios are as follows:
Circumstances Possible strategies
No daylight available Time switching where occupation patterns are
predictable (for example, department stores).
Occupancy sensing, where space is occupied at
unpredictable times (for example, locker
rooms). More localised manual switching
could also be considered if there is a risk of
nuisance switching from an automated system.
Daylight available, low occupation Because the lights are only rarely needed,
daylight-sensing is unlikely to be worth paying
extra for. Occupancy linking should be
considered, perhaps using a “manual on, auto
off” strategy.
Daylight available; one or two occupants More localised switching should be beneficial,
perhaps using a “manual on, auto off” strategy
if occupation is irregular and intermittent.
Daylight sensing may be warranted if the space
is continuously occupied. Timed “off” control
may be worthwhile if working hours are
regular. (see below)
Daylight available; multiple occupation Timed “off” control is likely to be worth
considering under all circumstances. This is a
regime whereby a signalling pulse is sent out at
key times (during lunch, after close of business
etc.) to turn off lights at work stations. A local
reset switch (often a pull-cord) is provided at
each work station to allow those still at work to
restore their local lighting.
Photoelectric (PE) daylight linking may be

Assessor training manual on energy management
39
worthwhile for spaces which are fully occupied
during working hours, and which therefore
need continuous lighting. PE control can be
restricted to perimeter zones in deep-plan
spaces.
Corridors, unmanned reception areas Fully automatic on/off control using presence
detectors, but leaving some residual light for
safety (which may itself be
photocell-controlled if there are windows)
Store rooms Time-delay manual switches can be a good
option if users will not necessarily want the
lights on. Otherwise, occupancy sensors.
A simple scheme which works reliably and saves a moderate fraction of the energy
required is preferable to a scheme which saves more energy but is temperamental or
difficult to maintain and operate. Because of the risk of unintended adverse
consequences, expert advice should always be sought in each case. The history of energy
management is littered with cases where automatic lighting control has irritated and
alienated the users of buildings.
Figure 2-5-4
Motion-sensor switch as a
replacement for a standard light-
switch
Lighting technologies
For a given level of illumination, different lamp technologies will require different
amounts of electric power.
Where T12 (one-and-a-half inch) fluorescent tubes are fitted and have switch-start
ballasts, slimline T8 (one-inch) tubes can almost always be used instead. These are more
efficient in terms of light output per unit of electrical power, and are no more expensive
to buy.

Assessor training manual on energy management
40
Fluorescent-tube installations can benefit from the introduction of high-frequency (HF)
ballasts in place of mains-frequency control gear. HF gear typically reduces electricity
consumption by 20%, gives quick startup and prevents the stroboscopic effect which can
be hazardous where there is rotating machinery. Furthermore, a fluorescent tube with HF
gear does not flicker near the end of its working life; it just stops working, and moreover
stops using energy whereas mains-frequency fluorescent lamps actually draw more power
when they have failed than when they are working.
The quality of light service is critical to the user and must not be compromised. Factors
which need to be taken into account are:
• Colour temperature: do the users want a 'warm' or 'cool' light?
• Colour rendering: this determines how well the user can identify and discriminate
between different hues. Low-pressure sodium lamps (the very yellow lights used in
street lighting) are among the worst, since everything illuminated by them appears
monochrome, but they are very energy-efficient.
• Glare: using a small number of high-output lamps creates concentrated light sources
that may cause difficulties.
• The aesthetic need for ‘sparkle’
Display lighting presents particular challenges. Spotlights still tend to be of the filament
variety since discharge (fluorescent) lamps cannot usually be focussed sufficiently well.
Low-voltage (LV) tungsten halogen ‘dichroic’ parabolic reflector lamps have an
efficiency advantage over mains-voltage reflector bulbs (such as the ubiquitous PAR38)
and additionally are designed to project light while not projecting heat to the same extent.
When lighting small subjects the LV lamp can usually provide a more concentrated
beam, allowing the required level of illumination to be provided on the subject with less
total light output and hence less energy input.
LV lamps must however be installed and used correctly. Their service life is critically
influenced by supply voltage, and where several are fed from a common transformer
without voltage regulation, the failure of one lamp will allow the voltage on the others to
rise, accelerating their failure. Failed lamps must be replaced immediately, or a
voltage-regulated power supply should be fitted to prevent the problem of cascade
failures.
An alternative to low voltage tungsten halogen lamps for display lighting is metal halide
discharge lamps. As a general guide, replacement of conventional sealed-beam reflector
lamps will give savings of 30-70% for the equivalent lighting.
For outdoor lighting applications, filament bulbs in bulkhead fittings can be replaced with
high pressure sodium, low pressure sodium, or compact fluorescent bulbs, yielding
savings of 75-85% on energy and significantly reducing maintenance costs. Meanwhile
for high-wattage floodlighting (filament lamps, including tungsten halogen floodlights)

Assessor training manual on energy management
41
the most appropriate energy-saving substitutes are high-pressure sodium or mercury
discharge lighting.
For a more thorough treatment of the comparison between lamp technologies, visit
www.vesma.com/tutorial/lampchart.htm

Assessor training manual on energy management
42
2-6 Hot water services In theory, domestic hot water services (those needed for hygeine and catering) should not
impose major costs. The daily requirements for an average office or factory worker is in
the order of 4 litres per day which (if delivered at 60C) ought to cost under £2 per person
per year if heated by gas (£6 if electric). In the much higher-consumption environment of,
say, a general hospital, one would expect the daily consumption per occupant to be 110
litres per day which, bearing in mind that it is also required seven days a week, implies
annual costs of £70 per occupant with gas-fired boilers.
The causes of energy loss in hot-water provision are twofold. There are those related to
excess consumption of water – leaks, taps left running to overflow, hot water being used
in excessive quantities, or where lower temperatures or even cold water would suffice –
and those which cause high standing heat loss independent of the quantity of hot water
drawn off. Such routes for standing heat loss obviously include long runs of uninsulated
hot water pipework, and poor insulation on hot water storage vessels. A more subtle
cause is the heat loss from a large heating boiler being run at very low load factor purely
to service hot-water requirements in the summer. This is a problem which in some
installations will have been addressed by providing electric immersion heaters to
substitute for boilers during the summer, but that in itself creates a new risk, which is that
the electric heaters may inadvertently be left running during the winter. This does not
exactly waste energy, but it does impose extra costs because of the price differential
between electricity and gas or oil.
Naturally, one should not rule out the unexpected. Some workmen painting the inside of
a hospital cold-water header tank were held up because after they had isolated and
emptied it, it began to refill from the outlet. It transpired that hot water was entering the
cold water pipework via defective mixer taps. This problem was of course completely
hidden during normal operation, when draw-off of cold water was sufficient to prevent
the leaking hot water from filling the tank past the overflow.
A common opportunity for reducing standing heat loss is to fit point-of-use water heaters
in order to dispense with central storage and long distribution runs. These may be wall-
mounted electric types in washrooms, or direct gas fired for catering, locker-room
showers and other larger users. Time controls can be fitted to local water heaters. A
secondary reason for eliminating long distribution runs for hot water from central storage
is that, in England at least, building codes require that they be kept charged with hot
water by pumping the hot water around a closed recirculation loop. This measure is
designed to conserve hot water by obviating the need to run the hot tap to purge the line
of cold water. But it increases both standing heat loss and electricity consumption.
Hot water may, of course, be needed in large quantities for process lines and cleaning
duties including laundries and kitchens. Here there may be little choice but to retain
central provision. In these circumstances it may be possible to recover heat from water-
cooled equipment (such as chillers) and processes, or even from hot process drains if
there is no contamination risk.

Assessor training manual on energy management
43
It is not usually possible or practical to monitor separately the energy used for dometic
hot water provision. In the majority of cases one can do little more than infer the scale of
energy use from the intercept on the energy-versus-degree-days scatter diagram. For
industrial uses, it may be possible to meter the consumption and assess it against
production activity, but the picture will not always be clear because often water is used in
short bursts for cleaning which only takes place at irregular intervals dictated by batch or
product changes and will probably bear no relation to product throughput. If you are in
this situation, either try relating consumption to the number of cleaning cycles, or
monitor subjectively by studying charts of consumption at intervals of (say) five to 15
minutes.

Assessor training manual on energy management
44
2-7 Catering In the majority of organizations catering is not a major user of energy, although there
may be worthwhile gains in large kitchens in hospitals, hotels and educational
establishments. Having said this there are also minor opportunities such as fitting night
blinds to chilled display cabinets (applicable also in food retail generally) and
timeswitches on vending machines which are refrigerated for purely aesthetic reasons
rather than to preserve the contents.
Many of the energy requirements in kitchens and restaurants are dealt with elsewhere in
this book. They have refrigeration equipment and are major users of hot water. They also
have space heating, ventilation and lighting requirements to which the same principles
apply as in the building at large, with the following possible additions:
• Because demand for ventilation air is likely to be very peaky, there would be more
scope for time controls, including in all likelihood separate schedules for the
kitchens and seating areas respectively;
• It may be possible to regulate air supply dynamically by means of more
sophisticated controls which sense the demand for fresh air;
• It may be necessary to provide fresh air supply fans to balance the extract air and
prevent the kitchen from scavenging heated air from the rest of the building;
• There may be scope for heat recovery from the extract air, albeit with complications
because of the need for filtration and the necessity of piping the heat to other parts of
the building (since kitchens themselves are probably the last places that need the
extra heat)
Energy requirements specifically for catering are likely to include gas and electricity for
cooking, hot water for sinks sterilisers and dishwashers, and electricity for dishwashers,
refrigerators, freezers, heated and chilled display cabinets in the primary catering area. In
principle one should also include electricity used for vending machines, kettles, water
boilers, cookers, refrigerators etc, distributed around the building.
Thinking about cooking appliances, the big gains will come from awareness and
training. Staff should be discouraged from leaving gas rings, grills, hotplates and ovens
running when they are not required. They should be trained not to turn on ovens to warm
up unnecessarily early, nor to set pans to boil before they are needed, nor to let pans boil
rapidly when gentle boiling will do (remembering that the water temperature will be
100C regardless of the rate of boiling). They should be taught to use lids on boiling pans
at least while coming to the boil, and during cooking for those foods where it is not
essential to leave the pan open. All these measures will save fuel and electricity and – as
importantly – will help counteract the overheating and excessive humidity that make a
kitchen uncomfortable. One chef in a major commercial kitchen who let his staff have
this training had a pleasant surprise. Not only did he save enough to fund the purchase of
the latest combi oven: he found that tempers were less frayed and staff turnover reduced.
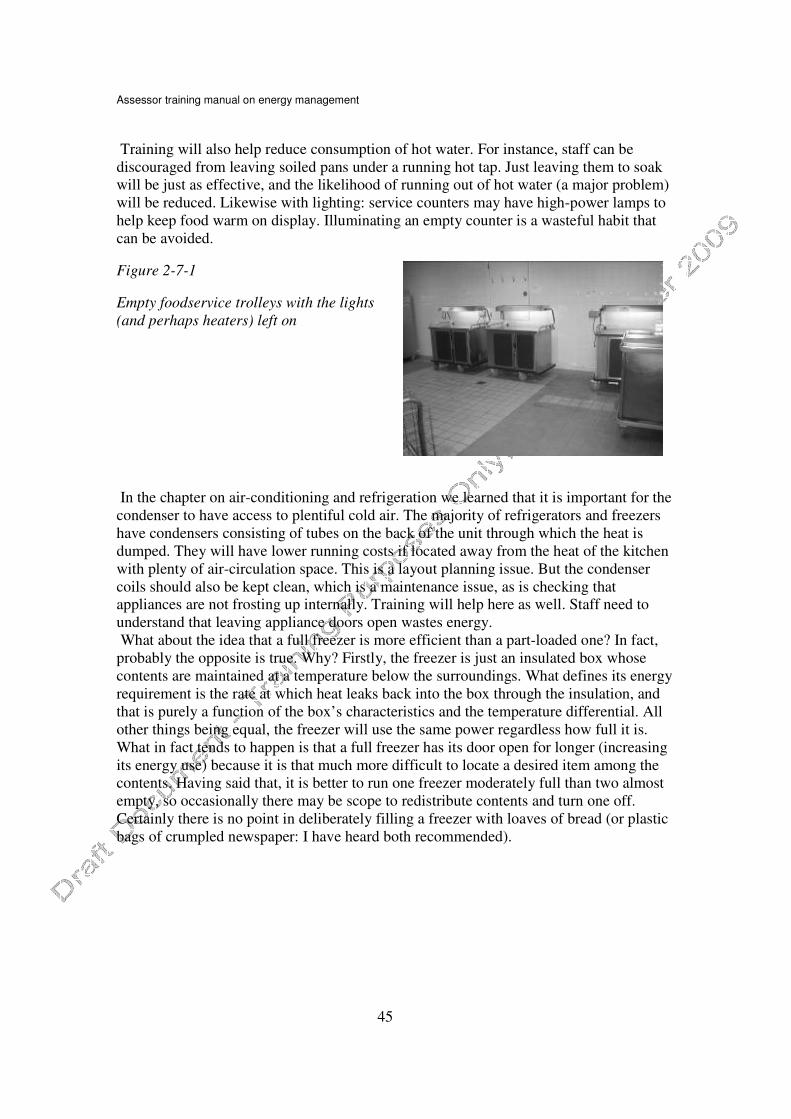
Assessor training manual on energy management
45
Training will also help reduce consumption of hot water. For instance, staff can be
discouraged from leaving soiled pans under a running hot tap. Just leaving them to soak
will be just as effective, and the likelihood of running out of hot water (a major problem)
will be reduced. Likewise with lighting: service counters may have high-power lamps to
help keep food warm on display. Illuminating an empty counter is a wasteful habit that
can be avoided.
Figure 2-7-1
Empty foodservice trolleys with the lights
(and perhaps heaters) left on
In the chapter on air-conditioning and refrigeration we learned that it is important for the
condenser to have access to plentiful cold air. The majority of refrigerators and freezers
have condensers consisting of tubes on the back of the unit through which the heat is
dumped. They will have lower running costs if located away from the heat of the kitchen
with plenty of air-circulation space. This is a layout planning issue. But the condenser
coils should also be kept clean, which is a maintenance issue, as is checking that appliances are not frosting up internally. Training will help here as well. Staff need to
understand that leaving appliance doors open wastes energy.
What about the idea that a full freezer is more efficient than a part-loaded one? In fact,
probably the opposite is true. Why? Firstly, the freezer is just an insulated box whose
contents are maintained at a temperature below the surroundings. What defines its energy
requirement is the rate at which heat leaks back into the box through the insulation, and
that is purely a function of the box’s characteristics and the temperature differential. All
other things being equal, the freezer will use the same power regardless how full it is.
What in fact tends to happen is that a full freezer has its door open for longer (increasing
its energy use) because it is that much more difficult to locate a desired item among the
contents. Having said that, it is better to run one freezer moderately full than two almost
empty, so occasionally there may be scope to redistribute contents and turn one off.
Certainly there is no point in deliberately filling a freezer with loaves of bread (or plastic
bags of crumpled newspaper: I have heard both recommended).

Assessor training manual on energy management
46
2-8 Compressed air The main use of compressed air is as a medium for delivering mechanical power,
although there are other applications such as pneumatic controls (as a safe alternative to
electrical actuators in hazardous environments), for sorting and separating small items on
production lies, blowing dust or swarf in manufacturing workshops, transporting powder,
atomising water in humidifcation systems and agitating the contents of tanks and vats – to
name but a few.
What every application has in common is compressors (be they reciprocating piston
types, screw, vane or centrifugal), ancillary driers and filters, receivers (storage cylinders)
and distribution pipework. This supply infrastructure may consist of small local units or
be centralised.
Air leaks are the most obvious aspect of energy waste. Because it is not always possible
or convenient to repair them as soon as they are found, some organisations have a regime
whereby staff have a supply of serial-numbered tags that they can hang on leaking pipes,
joints, fittings or equipment, each with a tear-off counterfoil they can send to the
maintenance office. This facilitates a coordinated assault on the problem during the next
shutdown or other opportunity. Remember, however, that some air loss can be stopped
immediately, for example when it arises because a drain valve has been left open or
excessive pressure is lifting safety valves. At one establishment I even found they were
deliberately (and quite unnecessarily) emptying the air receiver at the end of each day.
Reducing the supply pressure (of which more later), minimising service hours, and
fitting automatically-controlled zone isolation valves will all limit the loss through leaks
that have not yet been attended to; even better is removing and capping-off redundant
branches of pipework.
It can be quite instructive to measure or estimate the air consumption during quiet hours
and compare it to working hours. Even if the factory lacks air meters, the compressors
probably have hours-run counters which will give an indication of the difference. I did
this at one factory and found that the compressors ran as long on a stock-taking day as
they did on a normal working day, implying that the bulk of the air consumption was
uncontrolled.
In that instance, some of the air was being used to agitate tanks of liquid. Using costly
dry filtered air piped at high pressure from a central system is not always appropriate for
agitation, air knives, blow guns, and other such low-grade duties; it may be economical to
supply these from local blowers which (furthermore) can be run on demand.
Whenever you eliminate a use of central compressed air by substituting an alternative
solution, you may create an opportunity to eliminate sections of distribution pipework,
reduce the daily service hours, or reduce the central supply pressure. Supply pressure
may also be reducible if its level is dictated by one or two critical uses. Consider
providing local boosters for these so that general pressures can be taken down.
Once the consumption of compressed air has been minimised, attention can turn to the
efficiency of centralised air supply. This has several aspects, one of the most important
being how multiple compressors are controlled to share the load. A ready assessment can
be made again with the use of their built-in run-hours counters; simple arithmetic will

Assessor training manual on energy management
47
show to what extent more capacity was on-line than was strictly needed. Some
compressors are designed to run continuously but switch between loaded and unloaded
modes. these will usually have separate run-hours counters for loaded and unloaded
running, which is important because they are wasteful at low load factor, using a
substantial percentage of their rated power while producing no air. Considerable savings
in both energy and maintenance costs can sometimes be achieved by improving the
control of compressor sequencing such that (as far as possible) each unit runs close to its
rated output or not at all, rather than cycling on and off in combination with the others.
Where air demand is very variable, one possibility may be to use a variable-speed
machine alongside a bank of fixed-output compressors.
One point worth mentioning is that it matters where the compressor draws its air from.
Outside is preferable, since you will get roughly a 1% increase in output for each 3C drop
in inlet temperature.
It is sometimes suggested that as compressed air is about ten times the price of electricity
when used as a source of motive power, it may pay to replace air tools with electric
equivalents. This assumes that the replacement tools are equally effective and not
attractive targets for theft. In practice replacement is not likely to be cost-effective unless
it enables compressed air to be dispensed with completely.
The recommended technique for monitoring a substantial compressed-air installation for
energy efficiency is to treat it as two processes:
1.. Track air quantity delivered against some suitable driving factor such as
production throughput (or other index of activity if that is not feasible);
2.. Track electricity used in each compressor against the quantity of air it delivers.
If compressors are not separately metered, they will need to be treated as a group, and
you will be less able to pick up faults and less able to pinpoint them. You will also be
unable to minimise costs by running the machines in order of merit.
If there is no air meter at all, you will have to track electricity used against the driving
factor for air consumption and if excess electricity consumption is detected you will not
be able to discriminate between the compressors and downstream uses as the cause of the
problem. If there is no dedicated electricity meter on the compressors it will not be
possible to manage them, nor to discriminate between the compressed-air system and
other users of power as the culprits if excess consumption occurs.
Figure 2-8-1
Location of a run-hours
counter on an air
compressor
Assessor training manual on energy management
48
2-9 Steam In thermal processes that need to operate up to say 200°C, such as drying and distillation,
steam is a convenient medium for transporting the heat. Water could be used
(pressurised, otherwise it would boil) but compared with steam it cannot carry anything
like the same amount of energy per kilogramme. This is because of water's relatively high
latent heat of evaporation: if you condense a given mass of steam in a heat exchanger at
atmospheric pressure, it yields about fifty times as much heat as the same quantity of
liquid water delivered at 100°C and leaving at 90°C. Steam at different pressures
condenses at different temperatures (170°C at eight times atmospheric pressure, for
instance) and controlling the steam supply pressure effectively controls the temperature
of operation very tightly. This is in contrast to the use of hot water, which falls in
temperature as it gives up its heat (meaning that at high loads the average heat-exchange
temperature is reduced). Added to which, surface heat transfer from water is poorer than
is achieved by condensing steam.
The typical steam installation consists of a tank (the 'hotwell') containing hot treated
feedwater which is pumped into one or more boilers. The boilers generate steam at the
desired pressure and this is distributed via pipework (possibly through pressure-reducing
stations for some users) to the dryers, tanks, vats, presses, air heaters or other heated
equipment. The steam condenses back to liquid water within the heated equipment --
giving up its latent heat -- and the condensate passes out through steam traps whose job is
to prevent steam escaping but to allow the free passage of water. The condensate then
returns to the hotwell. Ideally, the steam system is a closed loop, but this is not always the
case; for example, in some plants steam may be directly injected into tanks and vats,
while in others the condensate may be diverted because of the risk that it contains
contaminants that could compromise product quality. In such cases (and in the more
common cases where there are steam leaks or condensate is lost en route back to the
boiler) makeup water has to be added to top up the system. This makeup water requires
expensive chemical treatment. Steam leaks cause a gradual increase in the amount of
dissolved solids in the boiler water, since the chemical treatment of it just converts one
form of impurity into another necessitating periodic 'blowdown' to regulate their
concentration. Blowdown, which is also necessary to remove sludge and scale from the
bottom of the boiler, inevitably entails energy loss.

Assessor training manual on energy management
49
Figure 2-9-1
Steam leak
Steam will not only be lost in leaks. Condensate is generated at the prevailing steam
pressure and temperature (potentially around 170C or more) and therefore when released
at atmospheric temperature it finds itself well above boiling point. Inevitably, some of it
must boil off to leave liquid water at 100C. What boils off is called 'flash' steam. Flash
steam can potentially be utilised (albeit for lower-temperature applications) and for some
factories its recovery and use represents an energy-saving opportunity.
Even just the way condensate is piped back to the hotwell could be significant.
Delivering it through a submerged sparge pipe will prevent the vapour loss that occurs if
it drops through the open air. It may pay to review the steam supply pressure and reduce
it, because this will reduce the amount of flash steam, the rate of loss through leaks, and
the temperature of the distribution peipework.
Even in cases where it is felt to be necessary to dump condensate, heat could potentially
be extracted, for example by passing it through a heating coil in the cold feedwater
supply. A fuel saving of about 1% will result from increasing the feedwater temperature
by 6C.
Steam leaks are costly not just because of the energy lost in the steam. There is the
additional cost of treating the makeup water to replace it. Faulty steam traps may also
cause losses by allowing steam to escape through the condensate return system (itself a
potentially hazardous situation). The other way steam traps can fail is by not letting
condensate pass out. This wastes energy because the retained condensate will form an
insulating layer in the heat exchanger, reducing the efficiency of heat transfer. Routine
checking of traps by means of sight glasses, three-way test cocks, or specialist devices is
part of effective energy-conscious maintenance. If traps are fitted with bypass valves it is
important to ensure that they are not accidentally left open. Such bypasses are sometimes
justified on the grounds that they assist air removal during startup (air in the system is
bad because it reduces heat-exchanger efficiency) but a better solution is to fit
thermostatic air vents which will close automatically once all the air has been purged. If
two or more pieces of equipment share one trap, that is also a recipe for problems. Very
rarely the problem may be that the trap is too small.

Assessor training manual on energy management
50
Figure 2-9-2
Bypass valve on a steam trap
Blowdown needs to be monitored to ensure that it is not excessive. The risk here is either
that automatic regulation is fitted, but malfunctions or is incorrectly set, or that manual
blowdown valves are opened too often, or for too long, or -- worse still -- left open.
Another route for water loss is condensate overflowing at the collection point during
startup when the rate of condensate return will be at its peak.
Distribution pipework should be reviewed to see if it is still appropriate for current
conditions, given that steam loads may have been significantly reduced over the years
and the system might originally have been conservatively designed. Oversized pipes and
those that take circuitous routes lose more heat than necessary; the worst offenders (and
those that may be easiest to deal with) are dead lengths of pipework, or long runs of
pipework with very small users at the end which could be provided with heat by some
other means. Even if it is not possible to replace or reroute pipework, its insulation can be
kept in good order. Check for wet or missing sections; look for opportunities to fit jackets
to valves, flanges and other fittings. A flange can be reckoned equivalent to about a third
of a metre of pipe and a valve considerably more. Getting steam pipework right is
something of an art. For example, because some steam will condense in the pipes, they
themselves need to be fitted with collection pockets and steam traps, and laid to slope
towards these collection points in the direction of steam flow.
One inexpensive way to save steam, although it requires a little experimentation and
investigation, is reducing warm-up times to the minimum. Often a conservative policy
will have been inherited which leaves the plant in hot standby for too long. Worries about
startup times may also inhibit operators from standing the plant down at all during
protracted idle periods. As in many similar situations, attention to one or two minor
technical constraints (air venting is an obvious example here) can facilitate a beneficial
change to operating practice.

Assessor training manual on energy management
51
It will be evident that steam technology is a highly specialised subject where expertise is
needed even for routine operation, let alone for improving performance. The engineer
who wishes to improve his or her knowledge should visit the web site of the
Cheltenham-based equipment supplier Spirax Sarco (www.spiraxsarco.com ), and follow
the 'Resources' link.
Recommended practice for monitoring steam systems starts with providing feedwater
meters and steam meters on each boiler. This at least facilitates a mass balance by means
of which excessive blowdown can be detected, and in combination with individual fuel
metering gives very good visibility of most aspects of boiler performance. A makeup
water meter meanwhile, even if shared by all boilers, will enable monitoring for changes
in condensate and steam losses throughout the steam system. Next it will be beneficial to
monitor major branches or groups of steam-using plant items. The key is to group items
as far as possible according to what drives the variation in steam consumption, so that a
meaningful targeting model can be developed. Thus for example a group of dryers used
interchangeably for the same product stream could be grouped together, as might the
space-heating system.

Assessor training manual on energy management
52
2-10 Process thermal insulation Unwanted heat transfer not only wastes money but can prevent things from working
properly. Uninsulated buildings are uncomfortable even with the heating turned up
(because of the physiological effect of cold surfaces). Kilns would be unable to reach
their required operating temperature, and unlagged steam systems would be perpetually
water-logged with condensate. For each application there is a range of technical solutions
and sometimes it may pay to add insulation beyond the minimum required for effective
operation, or to change the insulating material for one with superior characteristics. An
example of this last point is where heavy refractory lining is used in an intermittent
furnace. It may be possible to replace the inner face with ceramic-fibre insulation blanket
or tiles which, since their own heat capacity is lower, allow the furnace to heat up more
rapidly and thereby reduce preheat times.
Let us think about pipework. Ten metres of uninsulated 50mm-diameter pipe at 190°C
emits about 6kW, for example, which at 2009 fuel prices would cost something of the
order £1,500 per year to supply continuously. Adding thermal insulation not only saves
money and improves the operation of equipment, it also reduces the discomfort that can
be caused by excessive heat release into occupied spaces. Generally speaking, the more
insulation the better, but there are diminishing returns. Each additional percentage-point
of energy saving costs more to achieve, there are trade-offs between thermal performance
of different materials and their installation costs, and as a result the calculation of the
economic optimum thickness is not straightforward. To simplify things I would suggest
using standard recommended thicknesses such as those from BS EN 5422:2009, an
abstract of which is shown in Table 2-10-1. In the example cited above, the reduction in
heat loss would exceed 90%.
Table 2-10-1: Recommended pipe insulation thicknesses (mm)
Insulation thermal conductivity (W/mK)
0.025 0.035 0.045 0.055
Diameter (mm)
Pipe temperature
(C)
17 100 10 19 31 51
42 100 15 24 37 54
89 100 19 29 42 57
219 100 23 34 45 58
17 200 20 33 54 85
42 200 28 43 63 90
89 200 36 51 70 94
219 200 44 60 78 99
17 300 30 47 73 112
42 300 41 59 84 116

Assessor training manual on energy management
53
89 300 51 70 94 122
219 300 64 83 105 130
17 400 39 59 89 131
42 400 53 73 101 136
89 400 66 87 113 145
219 400 83 104 129 156
17 500 46 67 96 137
42 500 62 83 110 145
89 500 77 99 125 157
219 500 98 120 145 173
17 600 52 73 102 141
42 600 71 92 120 155
89 600 88 111 137 168
219 600 113 136 161 189
17 700 56 76 103 138
42 700 76 97 123 155
89 700 95 117 143 173
219 700 123 146 170 192
Insulation for process plant, pipes and fittings can be obtained in both rigid and flexible
formats in a wide range of foam and fibrous materials suitable for different applications.
Valves, flanges, strainers orifice plates and other fittings will need to be insulated as well
and this can be achieved either with preformed kits for standard components or with
flexible jackets. Good installation contractors will be able to advise you and will have
methods of estimating the reduction in heat loss that you can expect. When specifying the
installation, allow for protective cladding to protect the insulation from mechanical
damage and water ingress, paying particular attention to the insulation on fittings where
access for maintenance may be needed: if the insulation is not easy to remove and refit
properly, it is likely not to get replaced after being taken off.
Figure 2-10-1
A valve insulated with a flexible
jacket
Open water surfaces in process vats or boiler feedwater tanks are a route for heat loss. At
60°C water temperature in typical ambient conditions the loss is about 3kW per square
metre. The loss can be reduced by fitting a lid or using a blanket of floating plastic balls.
This can be important even for a low-temperature fluid surface like a swimming pool.
The main mechanism for heat loss from a liquid surface is evaporation (latent heat). A lid

Assessor training manual on energy management
54
has two effects: it reduces air movement over the surface and it allows the vapour
pressure of water above the surface to rise. Both these effects reduce the evaporation rate.
A ball blanket reduces the exposed surface area through which evaporation can occur but
anything which causes the balls to roll will have an adverse effect by increasing the
wetted surface. This includes current induced by agitator paddles or things being dipped
in the fluid. When designing a lid for a dipping tank, make sure that it is easy to remove
and replace and that operators understand the importance of using it.
The effectiveness of new or additional process-plant or pipework insulation ought to be
easy to verify because it is likely in the majority of cases to result in a fixed weekly
reduction in fuel consumption regardless of production throughput or other variables.
Even the weather will not be a factor if the process is not exposed to the elements, and
where it is, you would expect to see a reduction which is partly to prevailing degree-day
values. Ongoing monitoring should reveal any substantial deterioration in insulation
performance. For high-temperature process plant such as kilns and melting furnaces
regular measurement of external surface temperature will indicate loss of insulation
effectiveness. Spot checks with a surface-temperature thermocouple or non-contact
thermometer may suffice but thermal imaging will reveal isolated hot spots that isolated
checks could miss. Localised insulation failure is not necessarily a big problem in terms
of energy saving but of course it could have a dramatic impact on reliability and
availability.

Assessor training manual on energy management
55
2-11 Motor driven equipment In an industrial plant a very substantial fraction of electricity demand will be due to
electric motors. The first thing to check is that all the driven equipment is doing a useful
job: cases have been known, for example, of circulation pumps which were found not to
be necessary. A more subtle aspect is the mechanical efficiency of the driven equipment.
In stirring and mixing applications, for instance, there may be low-loss paddle designs
which do the same job with less power.
Then there is the ever-present risk of intermittent unnecessary running, for example in
conveyor systems; an unloaded motor may still draw about a third of its rated power, and
it will also adversely affect the supply power factor, increasing the peak demand current.
Sometimes operators are reluctant to switch off ancillary equipment because they fear,
perhaps with some justification, that it will not start again when required. A classic case
occurred at a plant making wide rolls of plastics film. A number of 90 kW chopper fans
were provided for disposing of the scrap film that was generated when there were
problems on the line. It transpired that these fans would indeed sometimes fail to start,
and they were therefore left running. The reason was traced to accumulations of scrap
plastic in the fan casing. However, when one of the operators remarked that fouling
increased the current drawn by the fan motor when it was running idle, the management
realised that the ammeter could be used as a condition check. They instituted a regime
whereby the fans would be opened up and cleaned when their minimum current draw
exceeded a certain threshold. This ensured that they never got into such a state that they
might not start reliably.
Oversized motors operate less efficiently (and at worse power factor) than ones
well-matched to the intended duty. If permanently lightly-loaded, it may be possible to
switch to permanent star connection or fit a smaller motor.
The transmission of mechanical power can also cause losses. The engineer needs to look
for unusually hot or noisy gearboxes, worn or slack V-belts, individual belts broken on
multi-belt drives, misaligned pulleys or couplings, and worn bearings in motors, driven
equipment, or intermediate drive train. When V-belt pulleys need replacing, opt for
wedge belts (2% improvement) or flat or ribbed belts (5-6% improvement). Consider
high-performance lubricants for gearboxes, while on part-loaded multi-belt drives,
consider removing one or more belts to leave only the minimum required for the power
actually being transmitted.
In some circumstances it may pay to introduce time switching, or to fit automatic
stop/start control which might include motor load sensing.
It is often possible to substitute a high-efficiency motor, when replacement is necessary;
the lifetime cost of the motor is dominated by the electricity it uses. Rewinds reduce
efficiency and may be a false economy. Standards for the efficiency of motors have
recently been tightened with the introduction of IEC 60034-30, replacing the EFF1, EFF2

Assessor training manual on energy management
56
and EFF3 bandings which some readers may be familiar with. IE1 (standard efficiency)
corresponds to the old EFF2, IE2 (high efficiency) to EFF1, while IE3 (premium
efficiency) exceeds any previous standard. A super premium rating, IE4, which will have
15% lower losses than IE3, is expected.
In some circumstances where output is variable (typically with pumps and fans)
variable-speed drives (VSD) are economical. Take for example a motor driving a fan. If it
is necessary to reduce flow to 50%, a damper might typically be used to restrict the air
flow; but the motor will still be drawing 80-90% of its rated power. Using speed control
instead of a damper reduces the motor power requirement to one-eighth of its rated
power. It also reduces noise, which may be an important consideration if the fan is part of
a building ventilation system. Some applications which do not initially appear to offer
this potential, because they have always been run at fixed outputs, may in fact turn out to
lend themselves to variable-speed control. For example with a central chilled water
supply you could sense the return temperature, which will tend to drop when demand is
low but rise when it is high: by varying the pump speed to hit a target return temperature
you could reduce the pumping power drawn during periods of low cooling demand.
Fully variable speed is not always the answer. Multi-speed motors provide substantial
savings where stepwise changes in speed are acceptable. Where a fixed (but lower) speed
is appropriate, a change of pulley ratios may be all that is needed, and could pay for itself
in days.

Assessor training manual on energy management
57
3-1 Managing energy saving opportunities When you have a healthy energy-management programme, you will be faced with a
continual stream of opportunities. Increased awareness and motivation will generate
suggestions from staff; exceptions detected by your monitoring and targeting scheme will
expose instances of avoidable waste which will need to be attended to; and the reports
from any energy audits that you commission will include recommendations that need to
be evaluated and maybe pursued further. This is without including your own ideas and
initiatives prompted by reading your way into the subject, using common sense, or
responding to sales pitches.
Given that they usually have other duties and conflicting priorities, energy managers
understandably sometimes fail to follow up on energy-saving opportunities. They just get
sidelined or forgotten, which is particularly bad if they originate from staff suggestions,
as failure to get a response is a major demotivator. So EN 16001 s 3.3.1 calls for a
register of energy-saving opportunities to be maintained.
There is no hard-and-fast rule about what the register should comprise but here are some
suggestions:
• A descriptive title
• Which energy aspect the opportunity comes under
• How it originated: if as a staff suggestion, from whom?
• Who is responsible for resolving it
• Its status: is it just an idea? Has it been costed and evaluated? Has it become a
project, and if so what stage has the project reached?
• What it is worth (either in annual cash terms or net present value)
• Who is responsible for doing what next, and by when
• If resolved the outcome, including if possible an objective cost/benefit report
Opportunities which have been resolved should remain on the register for two simple
reasons. Firstly the energy manager needs to be able to justify his or her existence, and
having a library of achievements readily to hand is important. Secondly, the organisation
needs to retain knowledge of what works and what doesn’t.
Identifying which energy aspect an opportunity belongs to is more important than it
might seem. If you discover that it does not naturally fit in any of your existing aspects,
you are then obliged to add a new one. This in turn may prompt the realisation that there
may be a whole family of similar opportunities. The example I give is of an organisation
that had already recognised heating, lighting, large motors, and staff awareness and
training as significant energy aspects. It subsequently emerged that poor maintenance of

Assessor training manual on energy management
58
combustion plant was wasting money. This gave them an insight: that maintenance was
an energy aspect, and once they looked at their operations from that perspective they
began to uncover further opportunities. One in particular was significant, namely that by
rewriting one of their contract specifications they could achieve energy-conscious repair
and maintenance.
Prioritising follow-up on opportunities becomes easier if you have a tracking system
which does two things: list the unresolved opportunities in descending order of cash
value; and list outstanding actions in chronological order, identifying the person
responsible. If time is pressing, these strategies enable you to focus on the things which
most need attention. You can chase the people whose tasks are most overdue, and in
progress meetings you can order the agenda with the big prizes first.

Assessor training manual on energy management
59
3-2 Energy audits and surveys An energy survey is one method of finding opportunities for energy cost reductions.
Although primarily thought of as being concerned with technical opportunities, surveys
can be made more valuable by addressing the issues of staff awareness and motivation.
The traditional energy survey revolves around a physical inspection of buildings, plant,
processes and systems, augmented by key measurements. The usual output is a report
recommending a package of improvements, with costs and paybacks assigned to each
recommended measure. Although often carried out by outside consultants (discussed in
the next chapter) energy surveys can be conducted in-house by the energy manager if he
or she feels confident to try it. The advantage is that the home-grown survey does not
have to generate definite solutions and can be more open-ended. The other benefits of
home-grown surveys are:
1. Greater site familiarity makes the process more efficient
2. Easier access to sensitive or hazardous areas
3. Possibility of spreading the survey over an extended period
4. Possibility of parcelling out aspects of the survey to better-qualified colleagues
5. More leverage to extract data not readily available to outsiders
6. Discretion to omit whole topics or areas
7. No obligation to report in a prescribed format
8. Ability to experiment, for example with alternative operating strategies
9. Greater cooperation from potential suppliers when seeking project budget estimates
With some assistance from suppliers anxious to sell energy-saving solutions, and from
maintenance contractors keen to provide value-added extras, the energy manager is often
in a better position to carry out an effective energy survey than he or she might think.
Whoever carries it out, the effectiveness of an energy survey can be enhanced by using
M&T analysis as a precursor. By exposing anomalies in patterns of consumption, such
analysis can point the surveyor in profitable directions.
Because energy surveys often result in spend-to-save opportunities, they call for
financial viability to be calculated. The raw material for such a calculation is:
1. An estimate of the energy savings expected
2. Projected unit prices of saved energy
3. An estimate of the project capital cost (and ongoing operation/maintenance costs, if
applicable)
Project costs can be estimated by consulting appropriate suppliers. Projected unit prices
normally have to be guessed at, unless the energy manager or consultant subscribes to an
energy market information service. Estimated energy savings can be speculative as well,

Assessor training manual on energy management
60
but the key requirement is to be able to quantify the existing consumption incurred in a
particular zone, service, or piece of equipment. Some of the commonly-used methods of
estimation are as follows:
1. Nameplate rating methods can be used on any equipment which has a fixed power
demand, and which either runs continuously or runs intermittently for measurable
periods. Look for run hours counters which allow the annual running time to be
estimated from readings taken at a few days’ interval, or use a stopwatch to gauge
the percentage of time for which the equipment runs. The annual kilowatt-hour
consumption is then simply the nameplate rating multiplied by the estimated
annual running hours.
On three-phase electrical equipment where the instantaneous power requirement
is not known, but an ammeter is fitted in the supply distribution board, the power
in kilowatts can be calculated from the indicated current and nominal voltage. As
before, the power figure should be multiplied by the estimated annual running
hours to arrive at an annual energy figure.
2. Direct estimates of power requirement can be arrived at, where it is practicable to
do so, by deliberately switching the equipment in question on and off, and
observing the effect on the supply meter. This is most conveniently done by two
people in radio or telephone communication: one switching and the other taking
spot meter readings. The rate of meter advance during the test will differ from that
immediately before and after, and the difference indicates the power requirement
of the switched load.
3. For those occasions where steam-heated equipment or heating systems are to be
assessed, steam consumption can be estimated by diverting its condensate into a
barrel on weighing scales and registering the rate of increase of weight. This is a
process which should only be undertaken by experienced and competent
personnel working to an agreed method statement.
4. Temporary metering can be installed. For electricity, oil and water it is possible to
use non-invasive clamp-on metering.

Assessor training manual on energy management
61
What equipment will you need?
For the purposes of energy surveys, it is not usually necessary to have traceable
calibrated instruments because approximate measures usually suffice.
• Digital thermometers with type K thermocouple probes. You will need one
instrument operating in the range –50 to 200°C, ideally with 0.1 °C resolution, and
another for 0-500 °C with 1 °C precision. For high-temperature applications a robust
probe is needed. For lower-temperature work, a ‘band’ probe designed for surface
measurements makes a good general-purpose instrument capable also of measuring
air temperatures. Even a bare thermocouple junction can be used. Thermocouples
can be left in place and read manually by connecting the instrument when required.
Compensating extension cable is necessary if the probe will need to be used at a
distance (on the end of a pole), for instance.
Figure 3-2-1
Digital thermometer with
thermocouple probe
• A sling hygrometer enables a spot check to be made on wet and dry bulb air
temperatures. Alternatively, use a digital relative humidity probe, especially if
moisture contents of product need to be measured.
• Non-contact thermometers can be useful to give approximate temperatures of
inaccessible surfaces, or to scan for hot spots.
• An infra-red camera can be hired if large areas need to be assessed in detail.
Results of infra-red thermography must be interpreted with caution.
• Miniature data loggers which record temperature, relative humidity, voltage, or
pulses, may be useful for extended tests. Pulses may be logged from a variety of
sources including PIR sensors (logging occupancy levels) or even improvised
temporary contacts on valve linkages and other moving equipment.
• A light meter. An inexpensive unit will suffice, capable of working over the
100-2000 lux range. Photographic light meters are not suitable.
• Plug-in power meters* can be used to check the consumption of appliances under
3kW rating.

Assessor training manual on energy management
62
• An electrical demand profile analyser would normally be used for assessing the
total intake to a building. Domestic power displays such as the Efergy, Electrisave
Owl or Wattson may be used for spot checks in smaller premises or on subcircuits
where there is safe access to separate supply conductors.
Figure 3-2-2
Portable power logger with flexible
current transformers
Photo: Kane International
• A digital camera
• Pressure/vacuum gauges
• Combustion analysis kit. This is one instrument which ought to be calibrated
against a traceable standard. Although relatively expensive, this is a good long-term
investment because it enables poor combustion to be detected through regular
checks. Always choose one with carbon monoxide measurement. If using oil or solid
fuel, you will also need a smoke pump.
Figure 3-2-3
Combustion analyzer
Photo: Elcomponent
• Anemometer to measure air velocities especially in supply and extract ducts
• Smoke generator to detect air leaks. Alternatively, improvise with tissue-paper
tell-tales or a child’s bubble maker.

Assessor training manual on energy management
63
• Torch (for reading meters and equipment rating plates)
• Stopwatch
• Pocket tape measure
• Manhole lid lifter (for access to water meter)
• Meter compartment keys
• Walkie-talkie radio or mobile telephones to coordinate ‘drop tests’ when one party
is reading meters while another starts and stops equipment.
Lastly, do not forget your own eyes and ears. There is often a great deal to be gleaned by
talking to, and more importantly listening to, people within the organization. They will
not necessarily be able to articulate their ideas in technically rigorous terms, but the fact
is that they do know what is going on, and what they say can be full of useful clues.

Assessor training manual on energy management
64
3-3 Selecting and briefing consultants If you do not feel confident about conducting your own energy audit, or you lack the
time, you may want to consider bringing in a consultant to help and advise you. An
outside specialist should enjoy a number of advantages anyway:
1. Broader experience of similar installations;
2. Greater technical knowledge, essential if you are pursuing a specific project in depth;
3. Disinterested viewpoint (compared with what you would get by way of free advice
from a technology supplier)
4. A fresh pair of eyes and ears
Energy-management consultants can of course help with things other than energy audits.
They can design and conduct attitude and awareness studies, motivation campaigns, and
training courses.
If you need outside help, one of your first problems will be knowing where to find it.
Other than word-of-mouth recommendations from contacts in similar businesses, you
could consider asking your trade body or industry research association; such
organisations often use one or more energy consultants who will enjoy the advantage of
knowing your industry. However, bearing in mind that industry-specific knowledge is not
always essential (many opportunities are generic - take for example space heating,
lighting, or compressed air) another avenue would be an organisation such as the Energy
Institute (EI) or the Energy Services and Technology Association (ESTA), whose contact
details are given under the 'further information' section. In both cases, membership is
selective, giving reassurance as to quality and independence; the EI furthermore has an
explicit code of conduct for consultants. Some will be members of both.
While there are a few larger energy-management practices (including my own employer,
NIFES) the majority of consultants in energy operate as sole practitioners. Do not be put
off by this: many of these are extremely well-qualified and experienced in particular
aspects of the subject, and it is relatively rare for an energy survey to be such a big
undertaking that one person could not carry it out. Even if the assignment is very general
and wide-ranging, when you hire a sole practitioner you know exactly who will be doing
the work and you will be assured of continuity. Larger firms are always an option but
they come into their own particularly when you are starting with a general survey to find
opportunities, but expect this to progress to one or more technically-specialised follow-on
projects. The bigger the consultancy, the wider its staff's experience will be and the more
likely it will be able to estimate the likely capital costs of projects based on their own
recent experience. A larger practice will also have the edge for motivation, awareness and
training campaigns which call for intense bursts of activity from a specialist team
embracing two or more disciplines, including for example those where there is spill-over
into related topics such as environmental management or maintenance improvement.

Assessor training manual on energy management
65
Needless to say, you should check the credentials of any consultant that you are
considering. Ask for recent relevant references, but only if it really is important that they
have worked in your industry should you make that a criterion. Follow the references up.
Ask for proof of professional indemnity insurance, and find out what professional
qualifying body he or she belongs to, and whether membership requires adherence to a
code of conduct. The EI's code of conduct for example stipulates that the consultant must
not offer advice outside his or her sphere of competence, must respect cofidentiality, and
must declare any commercial interest at the outset. Commercial links are not necessarily
bad, but they must be in the open.
It is prudent to ask the consultant to sign a confidentiality agreement, all the more so if he
or she is a specialist in your industry. Consultants inevitably see sensitive information
and analysis of energy data can reveal things about your operations that perhaps even you
did not know, as in one instance where I discovered that shift workers in a factory were
under-declaring production during the week so that they could pretend to be working full
shifts on Sundays.
How much is it worth spending on an initial energy survey? We can work this out
roughly by saying that we would like to recoup the cost in six months through measures
which cost little or nothing to implement, and which might save, say, 5% of your energy
costs. This sets a budget limit for the preliminary survey of 2.5% of annual energy spend.
Thus if your spend is £50,000 a year, the budget would be £1,250 or about two days of a
consultant's time -- just enough for a half-day survey and a report. Over the years there
have been a succession of government-funded schemes which subsidise energy surveys,
but a subsidy is a mixed blessing:
1. The funding body usually has its own agenda and a proportion of the work will be to
satisfy their requirements, not yours.
2. The scope of work may be prescriptive and wider than you really need; in particular, it
may call for a certain minimum number of recommendations, but the consultant acting
independently may think that there are only one or two things worth pursuing.
3. The consultant may have to spend longer than is strictly necessary producing a report
that meets the funder's specification when something simpler or different may be needed.
4. The funding body may have a for-profit arm to which it is feeding commercial
information.
Finally, be cautious about entering arrangements in which the savings are shared between
you and the consultant. There are ethical companies operating in this manner but the
history of shared-savings schemes is littered with litigation, ill feeling and resentment.
The consultant is the more powerful party in such contracts because they are on familar
territory. You will not be: do not take the risk.

Assessor training manual on energy management
66
3-4 Making the case for capital projects EN 16001 tries to place an obligation on the top management of organisations to provide
the necessary resources for the energy-saving programme, and while they may vote funds
to support the essential sustaining activities, they are not likely to support proposals for
energy-saving projects regardless of the strength of the business case. In fact, quite the
opposite. Because energy projects are (a) somewhat technical and (b) unfamiliar territory,
they suffer from being perceived as risky. They are also not business-critical, but fall into
the discretionary category of investment which will always be trumped by projects such
as those supporting environmental compliance (keeping directors out of jail) or marketing
(maintaining or extending market share). It does not matter that a marketing campaign
might be vastly more costly and more risky than an energy project, because a successful
ad campaign has a huge up-side benefits.
So what are the ingredients for success against such odds? The first is to recognise that
making the case for a project is not a one-off activity but is better viewed as part of a
continuous ongoing process. Developing your reputation is key. A good way to start is to
find one project that can be executed with complete certainty with the minimum or
resources and a good return. People-based initiatives such as awareness-raising and
training are usually excellent in this regard and are among the things you need to start
with anyway; but sometimes there is an obvious technical project (one small
pharmaceutical packing company saved £12,000 a year by putting a £250 hood over their
shrink-wrapping machine). Use your monitoring and targeting scheme to confirm the
savings that this first project achieves, and use it as an example of what you can do.
Learn up about relevant legislation and regulation (which EN 16001 obliges you to track
anyway) and about the world energy scene, climate change, emissions trading, and
anything else that will help to make you the organisation's energy guru. Develop a view
on the future of energy prices.
You should cultivate an ally among your top management. Find a director who is likely
to see a successful energy-saving campaign as a feather in his or her personal cap, and
involve them in your plans. This person will be able to act as your advocate, and give you
guidance as to how best to position and present your ideas. It may be that they, rather
than you, would make any final presentation of your request to the board.
Be very cautious about evaluating the cost-effectiveness of the projects you put forward.
A dud project will quickly damage your hard-won reputation. Use appropriate evaluation
tools such as discounted cash flow techniques (details of which can be found in
management-accounting textbooks and on the web) with conservative assumptions, and
pay particular attention to risk. Risks include not only price risk (the project costing more
than anticipated) but the risk that it does not yield the expected savings. There may also
be incidental risks like interruption to service or an adverse impact on quality, and
circumstantial risks, such as impending closure of the facility which you are not aware of.
You need to show that you have at least understood what the risks are, quantified them as

Assessor training manual on energy management
67
much as possible, and developed strategies for minimising their impact. Thorough
treatment of risk will help to offset the board's possible negative perceptions.
Take care about how you present your proposals, both in written form and as a live pitch.
Preface your written proposal with a half-page summary (few board members have the
time or inclination to read everything they receive for consideration) and, most important
of all, give a single clear recommendation or request which they can accept or reject.
Giving choices is to invite delay. If there were other options, describe them and explain
why you rejected them. If appropriate, use pictures, models, or even samples of
equipment to illustrate your suggested project. Find out what interests and motivates the
people you are trying to influence, and align your request with their interests.
Once you have been given the go-ahead for your project, get on with it. Few things could
be worse for your reputation and your relationship with your mentor than failing to
implement an idea for which you were given support and resources.
Successful energy managers not only find it easy to get support for projects, but often
find themselves being asked to suggest more. When you get there, it is a great position to
be in, so always have additional plans in the pipeline.

Assessor training manual on energy management
68
3-5 Evaluating savings achieved In chapter 1-2 I introduced the concept of having a model -- a mathematical formula --
for calculating expected consumption from known values of production, degree-day
value or other driving factor ('energy factor' in EN 16001). One simple but
widely-applicable model is the straight-line relationship between consumption E and
driving factor P:
E = c + mP ------(i)
For simplicity and clarity this chapter will refer exclusively to straight-line models and I
will call the straight line the 'performance characteristic'. But do bear in mind that other
more complex models could be used.
In chapter 1-3, I showed how the performance characteristic is used to compute the size
and hence the cost of deviations from expected behaviour, evaluating all monitored
streams across the board for an individual week. It was implicit, but now needs to be
stated explicitly, that the performance characterictics used for overspend calculations are
set at an aggressive-but-achievable level. This is because we want to assess every
consumption stream against its best past performance. It follows that as time goes by and
improvements are achieved (by whatever means) these target performance characteristics
must continually be revised downwards to make sure they continue to represent best
achieved performance.
Now in order to evaluate the savings that have been achieved we need to answer the
question 'how much less have I used than I would have used in the absence of my
energy-saving measures?'. The easiest way to answer this is first to calculate an expected
consumption using not the target performance characteristic but the characteristic that
applied before the measure were taken. This we designate as the historical baseline
performance characteristic. A numerical example may help. Suppose a process
historically used to operate on a characteristic of 1,000 kWh per week plus 30 kWh per
unit of production. Let us say that in the last week production throughput were 100 units
and energy consumption 3,500 kWh. How much energy was saved that week?
Expected consumption on the basis of the historical baseline would have been 1,000 +
30x100 = 4,000 kWh; thus the saving that week was 4,000-3,500 = 500 kWh.
Of course we usually need to compute the aggregate savings over an extended period,
often 52 weeks. The mathematics is easy: we just need to account for the fact that there
will be 52 lots of fixed consumption (c in equation (i) above). More generally, over an
interval of t weeks, we would write the equation for expected consumption as
E = tc + mP ----------(ii)

Assessor training manual on energy management
69
Where c is the intercept and m the slope of the historical baseline characteristic. Let me
illustrate this with another numerical example based on the same hypothetical process as
before. This time I want an assessment for a 13-week period. Suppose that total
production over the whole period had been 1,100 units and energy consumption 42,500
kWh. Substituting in equation (ii) we get an expected consumption of 13 x 1,000 + 30 x
1,100 = 46,000 kWh and the aggregate saving is thus 46,000 - 42,500 = 3,500 kWh.
Sometimes the energy manager wants to forecast, soon after implementation, the future
savings that will accrue from a project. This is not a problem because as soon as the new
target performance characteristic can be established with reasonable certainly, we can use
a formula like equation (ii) to estimate the new expected consumption over any period of
t weeks. If the new performance characteristic has an intercept of k (originally c) and a
slope of n (originally m) the saving S over a year (t = 52) would be given by S = 52(c-k)
+ (m-n)P where P represents the budgeted total production for the year.
Figure 3-5-2 shows an actual case where a heating system's boilers and controls were
replaced. Weekly fixed consumption dropped from 9,867 to 2,480 kWh, the slope of the
line changed from 107 to 154 kWh per degree day and as the typical annual degree-day
count in their region is 2,300, their annual gas saving is (9,867-2,480) x 52 plus
(107-154) x 2,300 = 276,024 kWh.
Figure 3-5-1
Showing
performance
characteristic
lines before and
after an energy-
saving project
Finally a word of warning. There is a lingering tradition of trying to use parameters called
energy performance indicators (EPI) which are usually the simple ratio of kWh per unit
of output or kWh per degree day. There are various reasons why EPIs cannot be used for
assessing savings.

Assessor training manual on energy management
70
• They are only ratios: the change in an EPI from one date to another tells you nothing
about the absolute quantity of energy saved.
• Whenever there is a fixed element of consumption (that is, in almost all cases) the
EPI will vary with changes in the driving factor as well as with energy efficiency,
and it is impossible to disentangle the two without complex corrections. Periods of
high output flatter the EPI of an energy-intensive process while cold weather flatters
the EPI of a heating system and vice versa.
• An EPI cannot even be calculated at all if more than one factor influences
consumption.
For these reasons EN 16001 does not require EPIs to be calculated (and although one
mention of them leaked into the Standard's explanatory annex, it carries a health
warning). My advice is simple: do not try to use them. You may reply that your senior
management like them ‘because they are simple and easy to understand’, or you may be
under the yoke of a government reporting scheme that requires them. Fine: continue
reporting them if that is what you have been told to do. It does not matter that they never
really meant anything and never will; regardless of that, with the advice contained in this
book you will be much better equipped, on a day-to-day basis, to manage energy.

Assessor training manual on energy management
71
Further information Organisation How they can help Contact details
Association for the
Conservation of Energy
Trade body for suppliers
of some energy-saving
products
www.ukace.org
Degree Days Direct Summarised data
relating to outside air
temperature
www.DegreeDaysDirect.com
Energy in Buildings and
Industry
Free journal 01889 577222
Energy Institute Register of energy
consultants
www.EnergyInst.org
Energy Management Register Free on-line advice,
guidance and
information on the
practicalities of energy
management
www.vesma.com
Energy Services and
Technology Association
Trade body for (a)
energy consultants and
(b) suppliers of some
energy-saving
technologies and
services
www.ESTA.org.uk
NIFES Consultancy specialising
in energy training,
surveys, audits, and
related engineering
design and project
management
www.NIFES.co.uk
Spirax Sarco Learning resources on
every aspect of steam
generation and
utilisation
www.SpiraxSarco.com/resources
Water, Energy and
Environment
Free journal 01342 316390
Wolters Kluwer Publisher of Croner's
Energy Management, a
loose-leaf technical
manual on the subject
www.croner.co.uk


![Energy Losses in Cross Junctions - [email protected] | Utah State](https://img.pdfslide.net/doc/110x75/613d5b38736caf36b75c5c42/energy-losses-in-cross-junctions-emailprotected-utah-state.jpg)