Embed Size (px)
Citation preview
Energy Management’sAnnual Report
Board of Regents Facilities CommitteeFebruary 7, 2013

What we plan to communicate today:• TC Energy Management Principles:
– Reliable• Steam• Electricity• Chilled Water
– Sustainable– Cost Effective
• Coordinate Campus Updates• Questions
Agenda:
2
Energy Management Principles • Reliable• Sustainable• Cost-effective
Twin Cities, University of Minnesota
3

Total Utility Cost Summary:
• FY 2014 Steam $43,141,000 Electric $39,338,000 Chilled Water $8,232,000 Water $6,987,000 Gas $1,411,000 Total $99,109,000
Rates include:Purchased Fuel/ElectricityDebt ServiceCapital InvestmentOperations/RepairEngineering & Tech Support
4
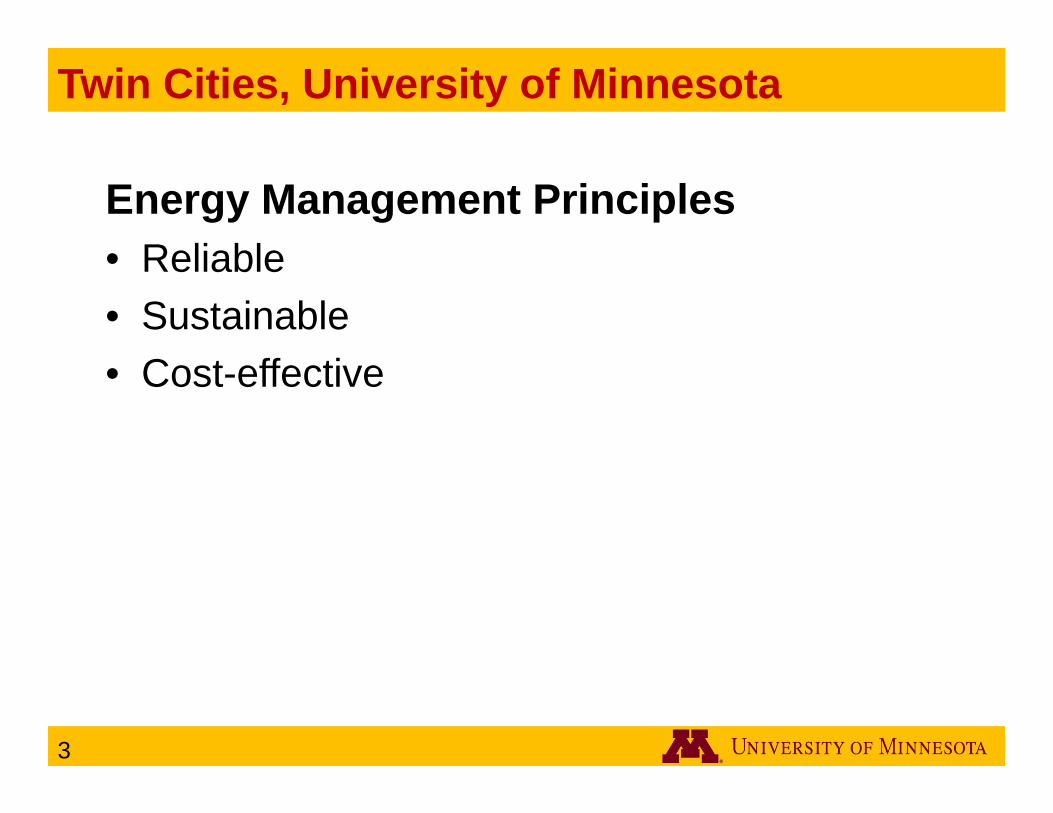
Reliable Utilities:
Steam Utility
5

Electric Utility
6
Reliable Utilities:

Year Date Time Who TotalTime Feeders Buildings Cause
2013 09/08/128:50:00
AM U of M 655
Como main 13.8kV feeder CO-2
Partial to all Como area buildings
At approximately 8:50 AM on Saturday, September 8, 2012, there was an unscheduled power outage in the Como area. There was a cable failure on the CO-2 circuit near Printing Services. We "single-phased" the main 13.8 kV feeder "CO-2," which means one of three fuses blew, thus leaving two legs of the circuit hot and one leg dead. This had the effect of leaving buildings with partial power, but not a complete loss of power. All Como area buildings were affected. At approximately 5:00 PM, Electric Utilities was notified of the problem. We were able to switch over to our backup feeder at approximately 7:45 PM to restore power.
2013 09/09/121:30:00
PM Other 210
SAFL -overhead 13.8 kV feeder Partial to SAFL
At approximately 1:30 PM on Sunday, September 9, 2012, there was a partial electrical outage at the St. Anthony Falls Lab. Based on the furry evidence at the crime scene, a squirrel managed to step in the wrong spot in the overhead 13.8 kV feeder and caused a flash. This blew some fuses in the overhead switches which directly feed the SAFL facility. Electric Utilities was called in to investigate the outage. Power was restored by approximately 5:00 PM.
2013 10/25/123:03:00
PM Xcel 12 MST 78XY SE Steam Plant
At approximately 3:03 PM on Thursday, October 25, 2012 there was an unplanned electrical outage at the SE Steam Plant. Power was lost on the Xcel feeder to the plant (MST 78XY) which caused the boilers to trip. The cause of the outage appeared to be within the Xcel substation and not on the MST 78XY feeder to the plant. Power was restored to the plant at approximately 3:15 PM by Xcel Energy. No other campus buildings were directly impacted by the electrical outage. Several buildings on the Minneapolis campus were impacted by the loss of steam pressure.
Reliable Utilities : Incident Tracking
7

Reliable Utilities :
Chilled Water Utility
8
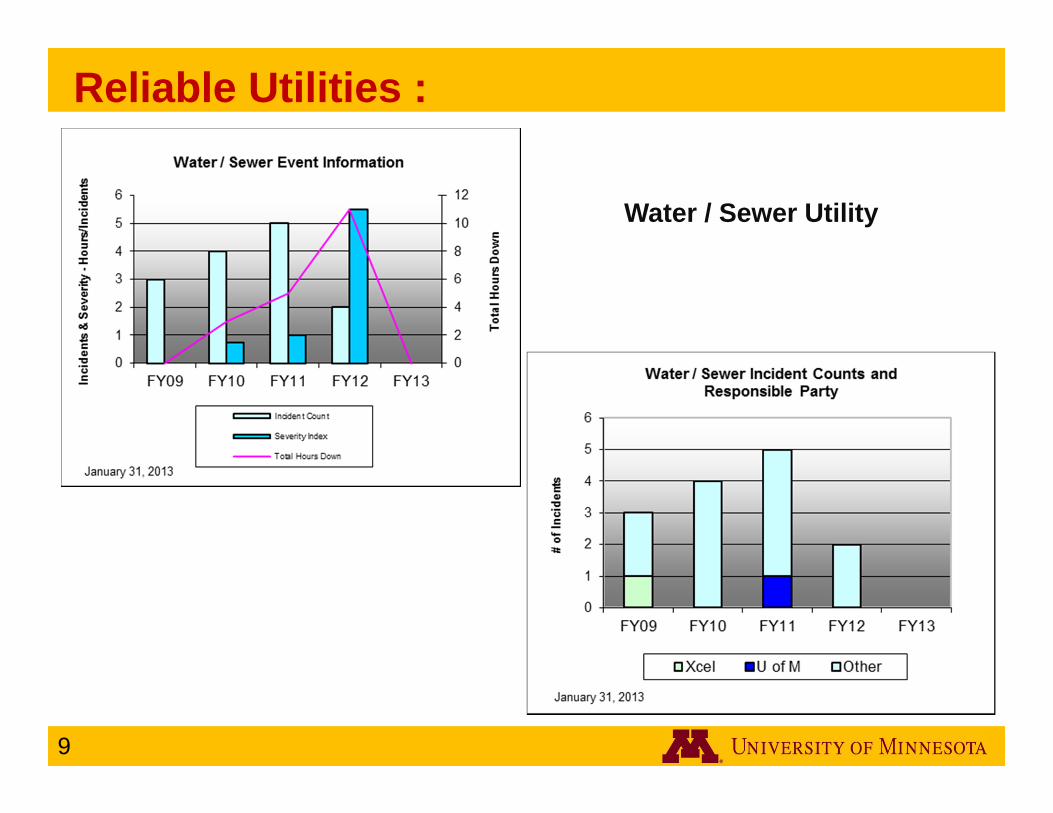
Reliable Utilities :
Water / Sewer Utility
9

Reliable: VFW Switch Gear Replacement
1960’s Primary air-gap switch gear:failed due to phase-phase flashover and age driven insulator breakdown(example of many locations)
2012 Replacement switch gear - compact gas switch gear
10

Reliable: St. Paul Tunnel Rebuild
1940 Construction Steam Tunnel:Crumbling block walls under a St. Paul roadway
2012 Complete tunnel and piping system replacement
11

Reliable: Gortner Tunnel Rebuild
St. Paul Campus: Failing steam tunnel structure with planned replacement summer 2013
12
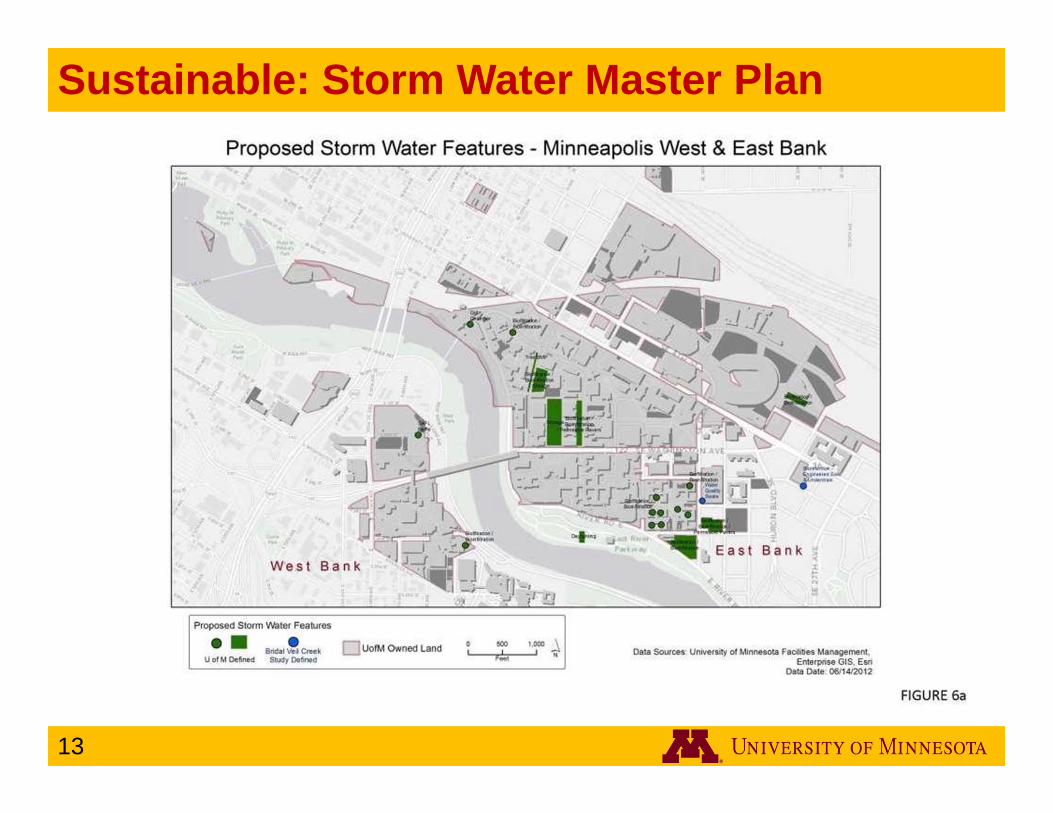
Sustainable: Storm Water Master Plan
13
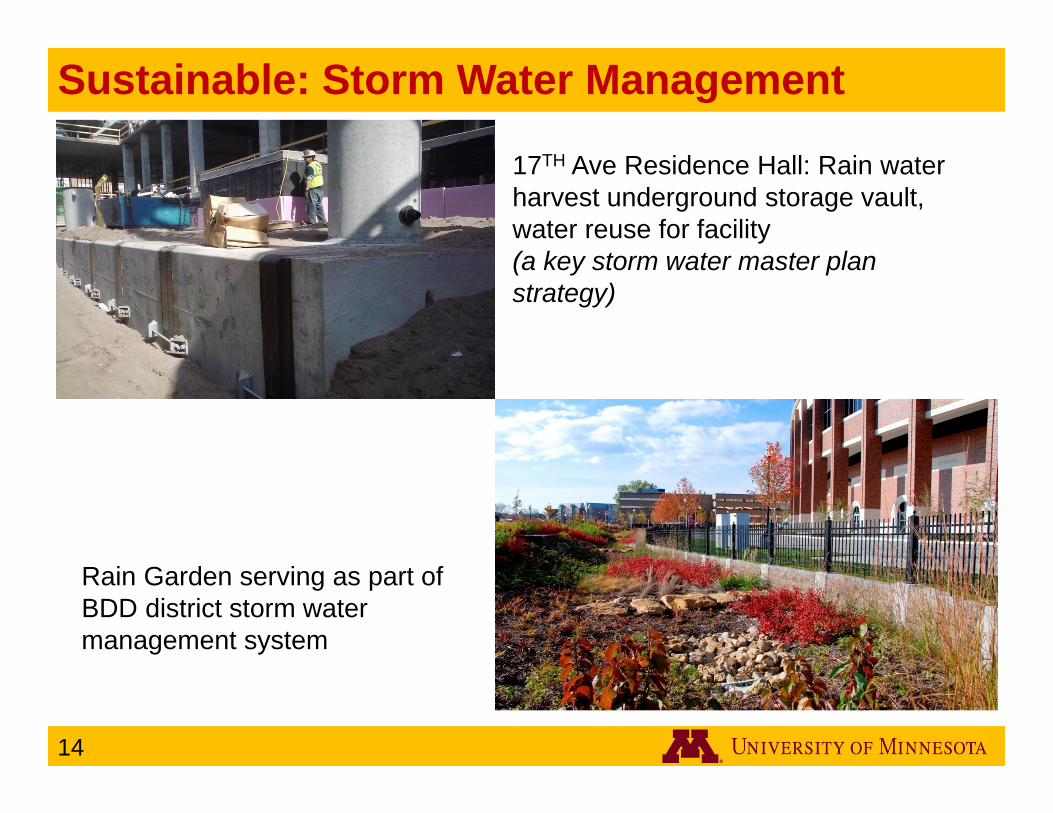
Sustainable: Storm Water Management
17TH Ave Residence Hall: Rain water harvest underground storage vault, water reuse for facility(a key storm water master plan strategy)
Rain Garden serving as part of BDD district storm water management system
14
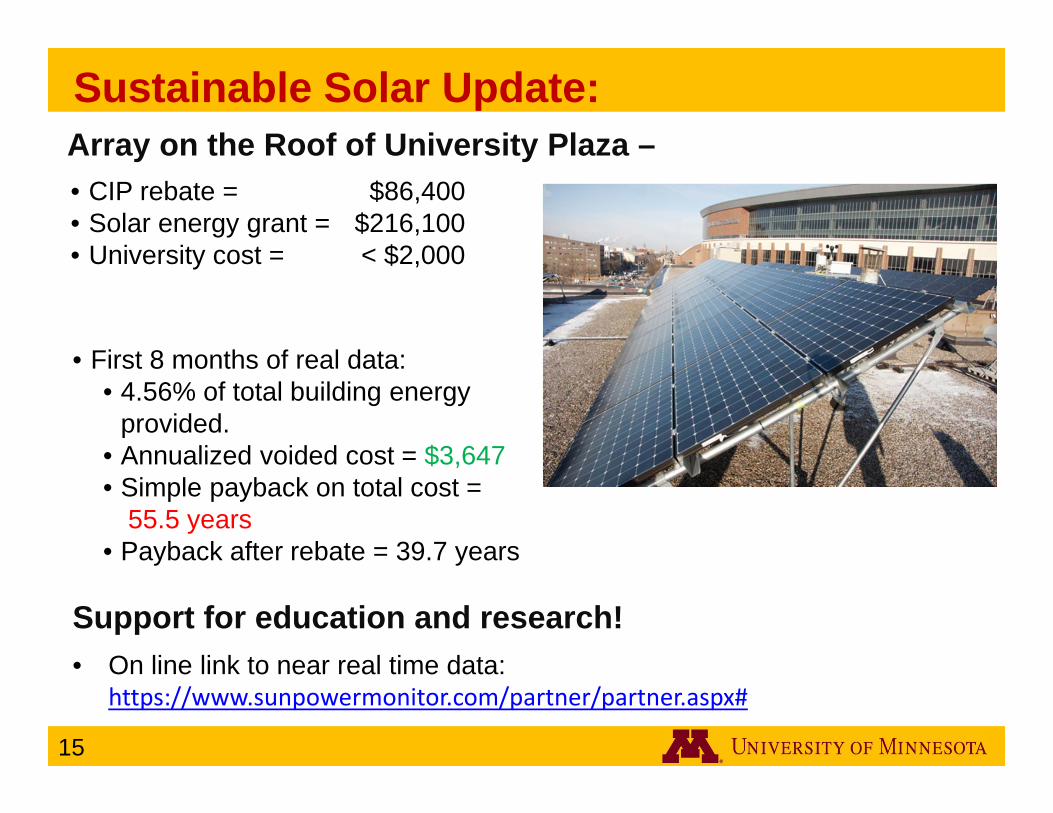
Sustainable Solar Update:
• CIP rebate = $86,400.• Solar energy grant = $216,100.• University cost = < $2,000.
• First 8 months of real data:• 4.56% of total building energy
provided.• Annualized voided cost = $3,647• Simple payback on total cost =
55.5 years• Payback after rebate = 39.7 years
Array on the Roof of University Plaza –
Support for education and research!• On line link to near real time data:
https://www.sunpowermonitor.com/partner/partner.aspx#
15
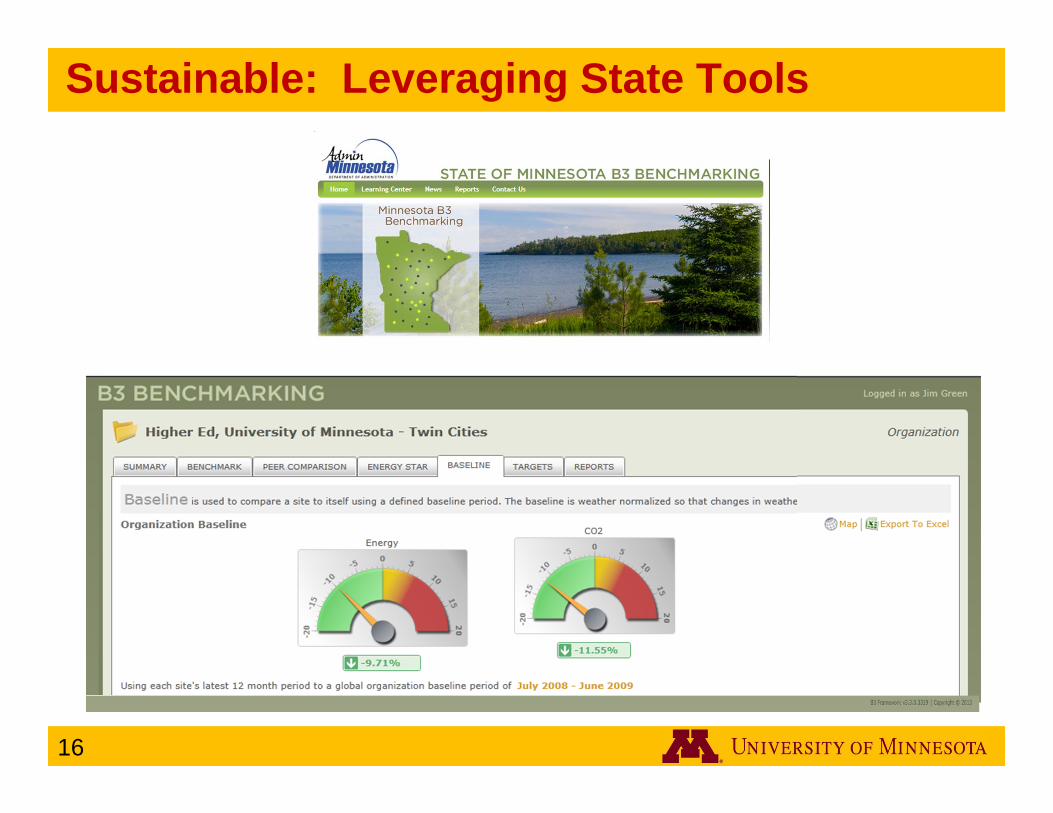
Sustainable: Leveraging State Tools
16
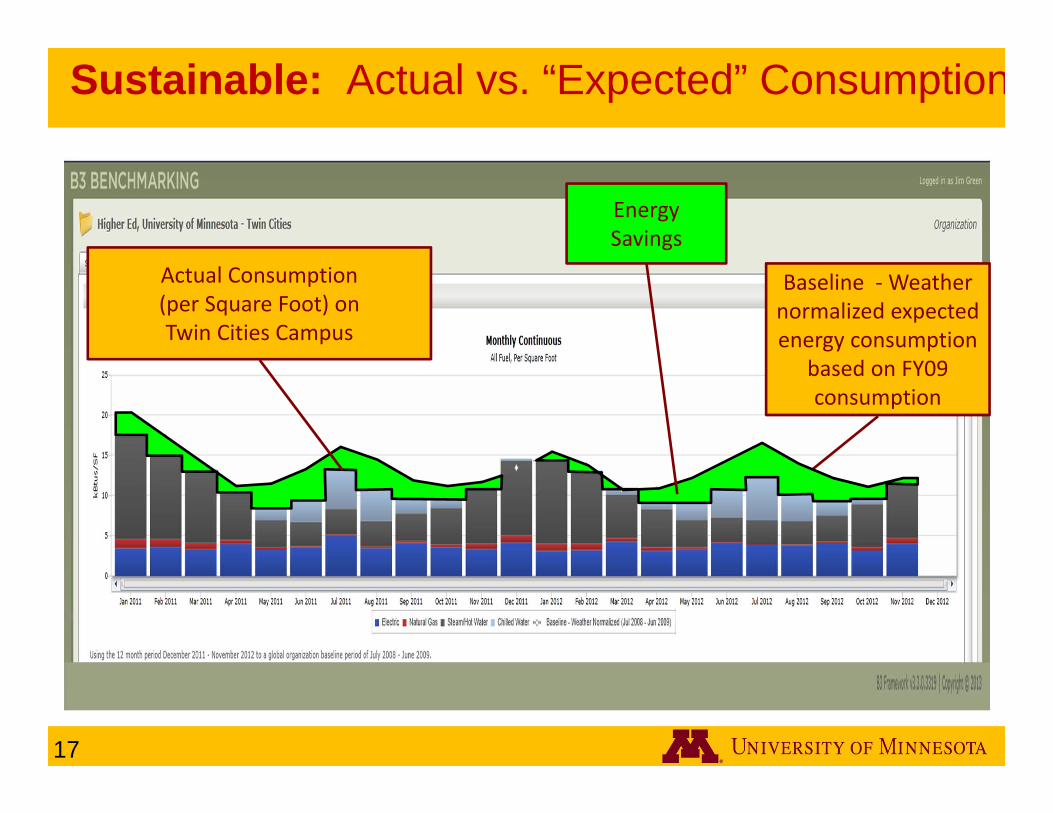
Sustainable: Actual vs. “Expected” Consumption
Baseline ‐Weather normalized expected energy consumption
based on FY09 consumption
Actual Consumption (per Square Foot) on Twin Cities Campus
Energy Savings
17
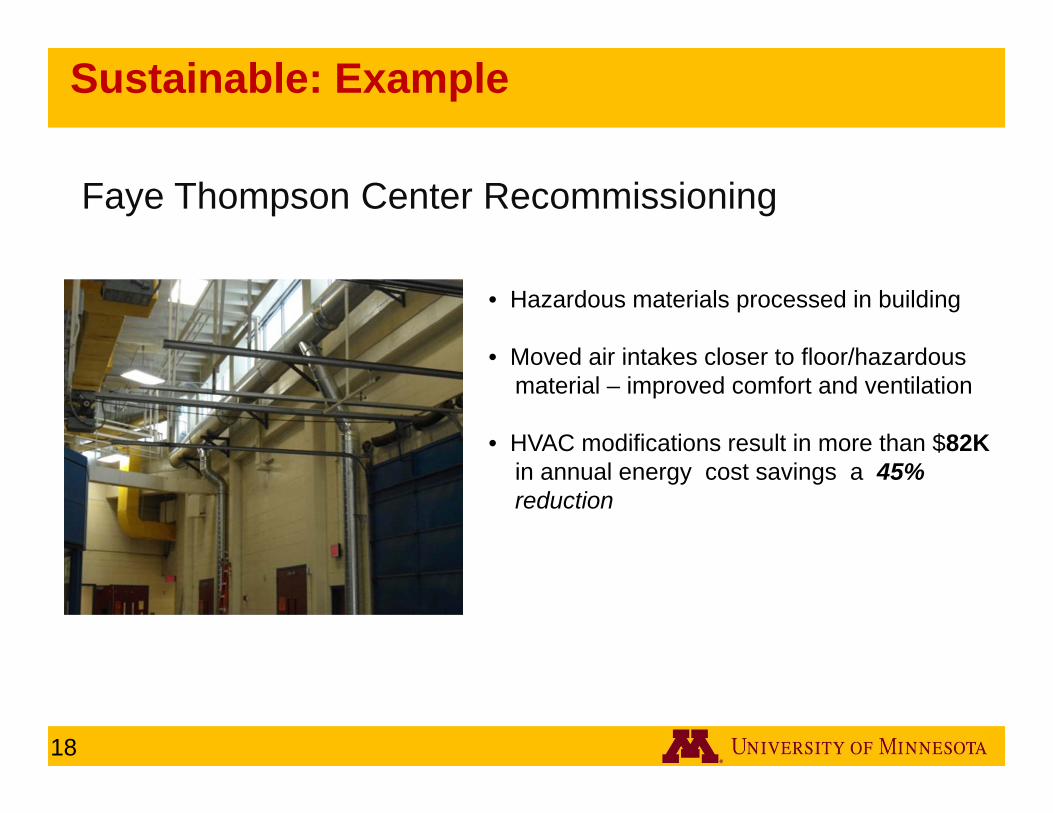
Sustainable: Example
• Hazardous materials processed in building
• Moved air intakes closer to floor/hazardousmaterial – improved comfort and ventilation
• HVAC modifications result in more than $82Kin annual energy cost savings a 45% reduction
Faye Thompson Center Recommissioning
18

Sustainable: Example
• Retrofit ramps with LED Fixtures
• Three ramps save more than $50k annuallywith a payback of less than 5 years
• PTS has programmed 3-4 parking structuresretrofits each year until all 15 are complete
Parking Structure Lighting Retrofits
19
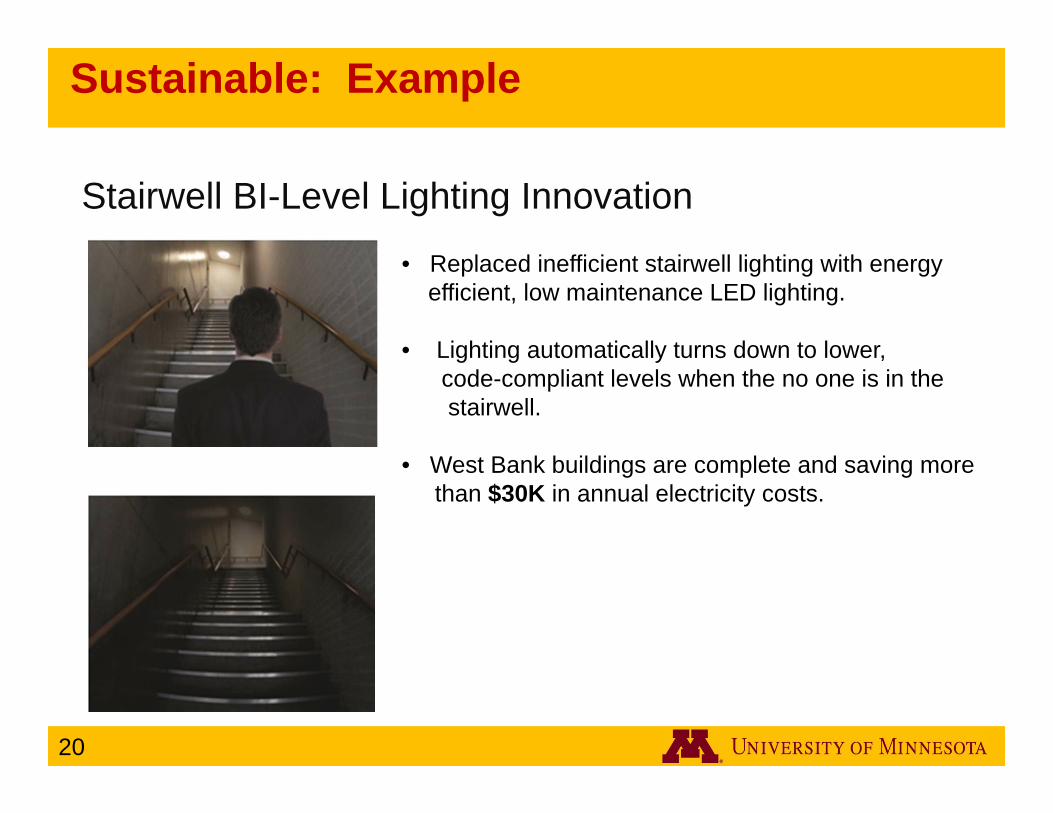
Sustainable: Example
• Replaced inefficient stairwell lighting with energyefficient, low maintenance LED lighting.
• Lighting automatically turns down to lower, code-compliant levels when the no one is in the stairwell.
• West Bank buildings are complete and saving morethan $30K in annual electricity costs.
Stairwell BI-Level Lighting Innovation
20

Sustainable: Involving Campus Community
• The effort to eliminate incandescent and other …..inefficient lighting on campus has resulted in …..annual savings of over $55K.
• Over 50 old, inefficient refrigerators & freezers . have been replaced with ENERGY STAR models
….through our “Cash for Clunkers” program.
21
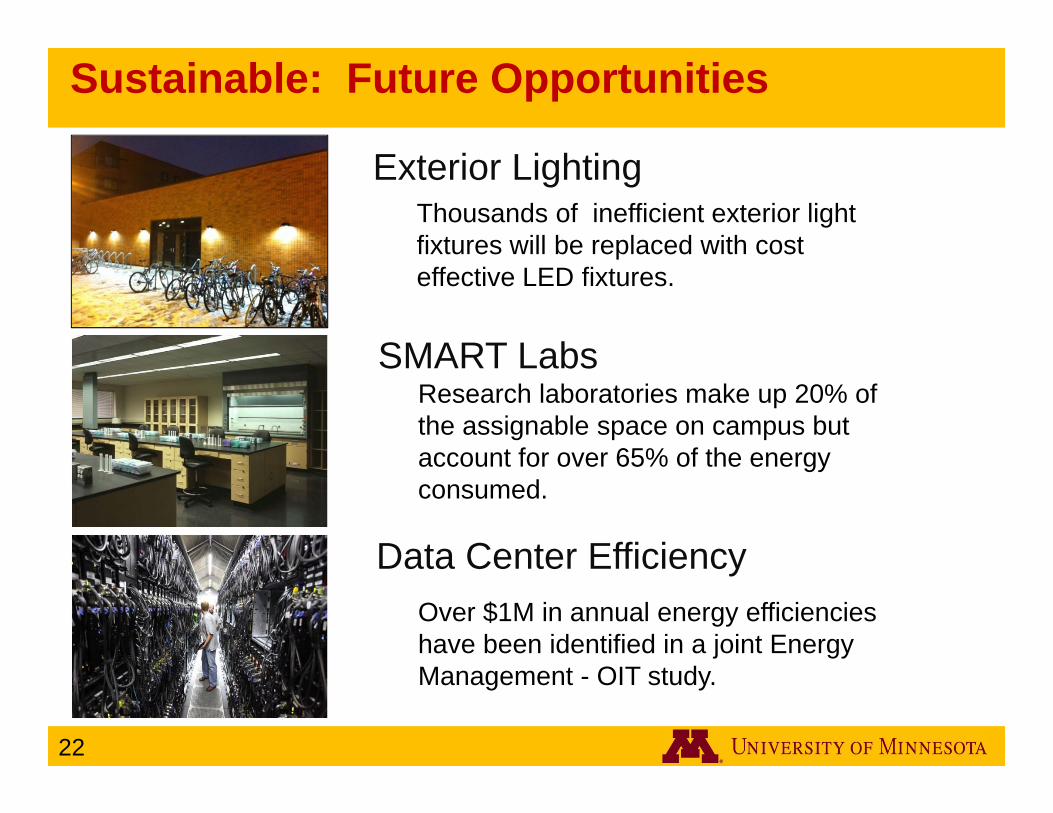
Sustainable: Future Opportunities
22
Exterior Lighting
SMART Labs
Data Center Efficiency
Thousands of inefficient exterior light fixtures will be replaced with cost effective LED fixtures.
Research laboratories make up 20% of the assignable space on campus but account for over 65% of the energy consumed.
Over $1M in annual energy efficiencies have been identified in a joint Energy Management - OIT study.
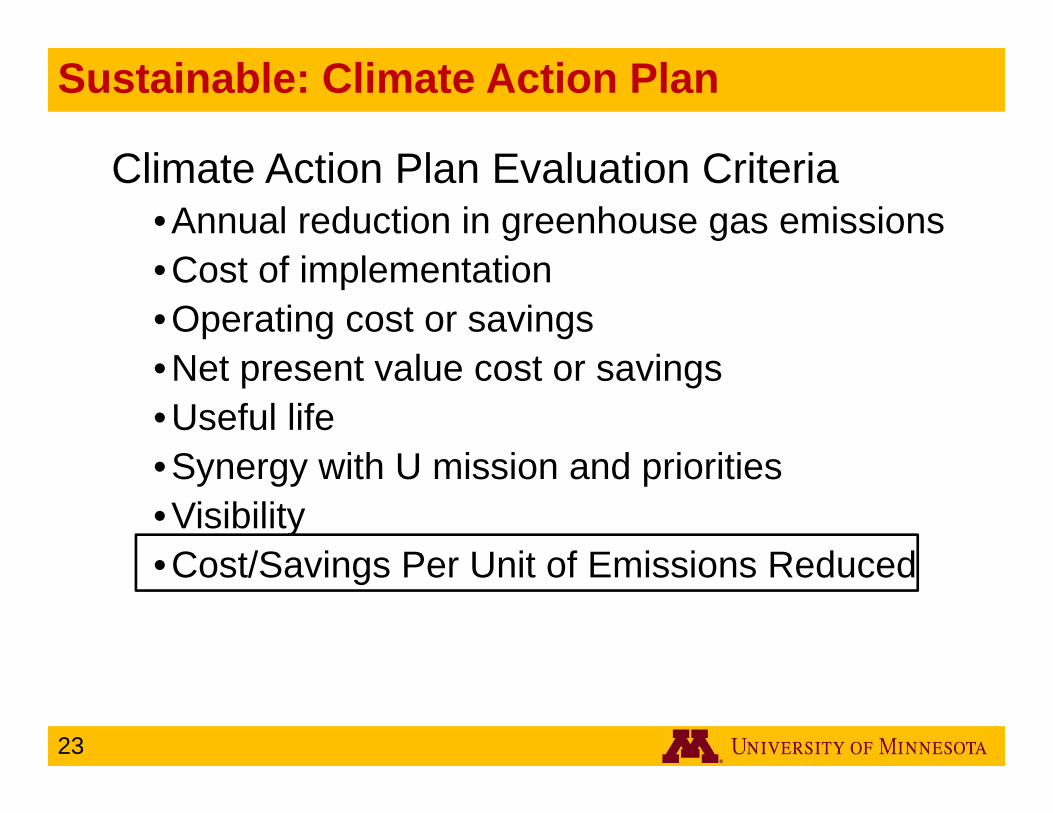
Climate Action Plan Evaluation Criteria•Annual reduction in greenhouse gas emissions•Cost of implementation•Operating cost or savings•Net present value cost or savings•Useful life•Synergy with U mission and priorities•Visibility•Cost/Savings Per Unit of Emissions Reduced
Sustainable: Climate Action Plan
23
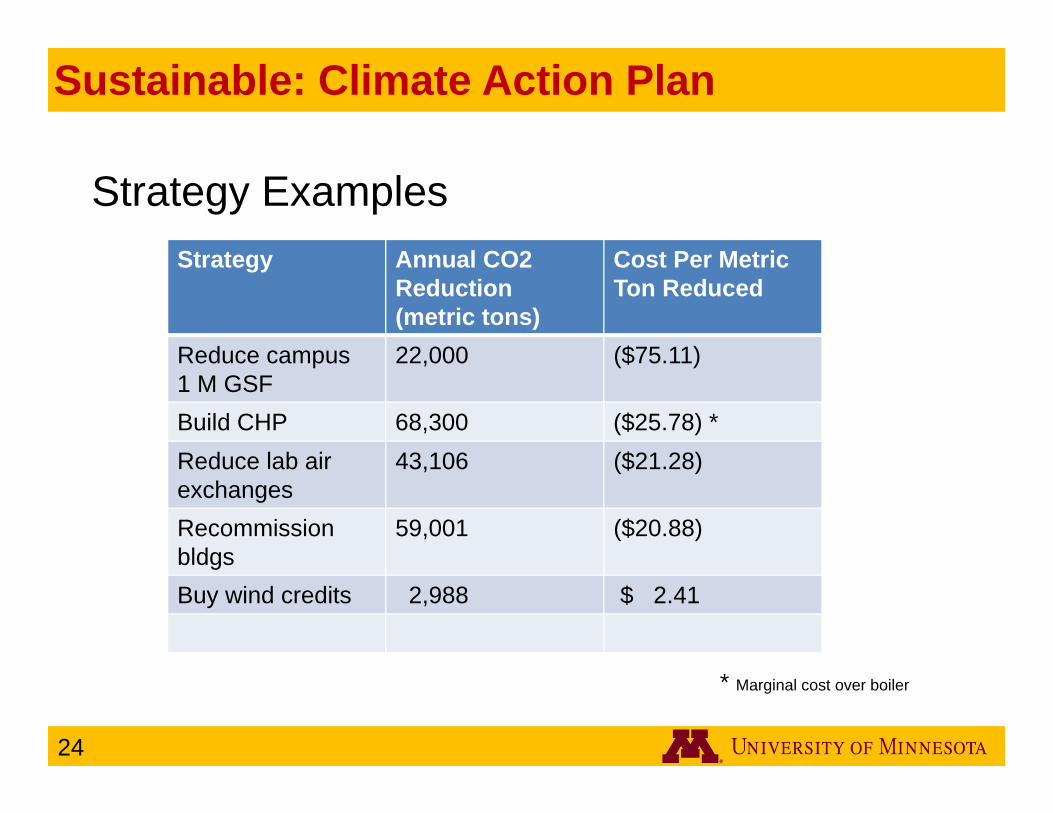
Strategy Examples
Sustainable: Climate Action Plan
24
Strategy Annual CO2Reduction (metric tons)
Cost Per Metric Ton Reduced
Reduce campus 1 M GSF
22,000 ($75.11)
Build CHP 68,300 ($25.78) *Reduce lab air exchanges
43,106 ($21.28)
Recommissionbldgs
59,001 ($20.88)
Buy wind credits 2,988 $ 2.41
* Marginal cost over boiler
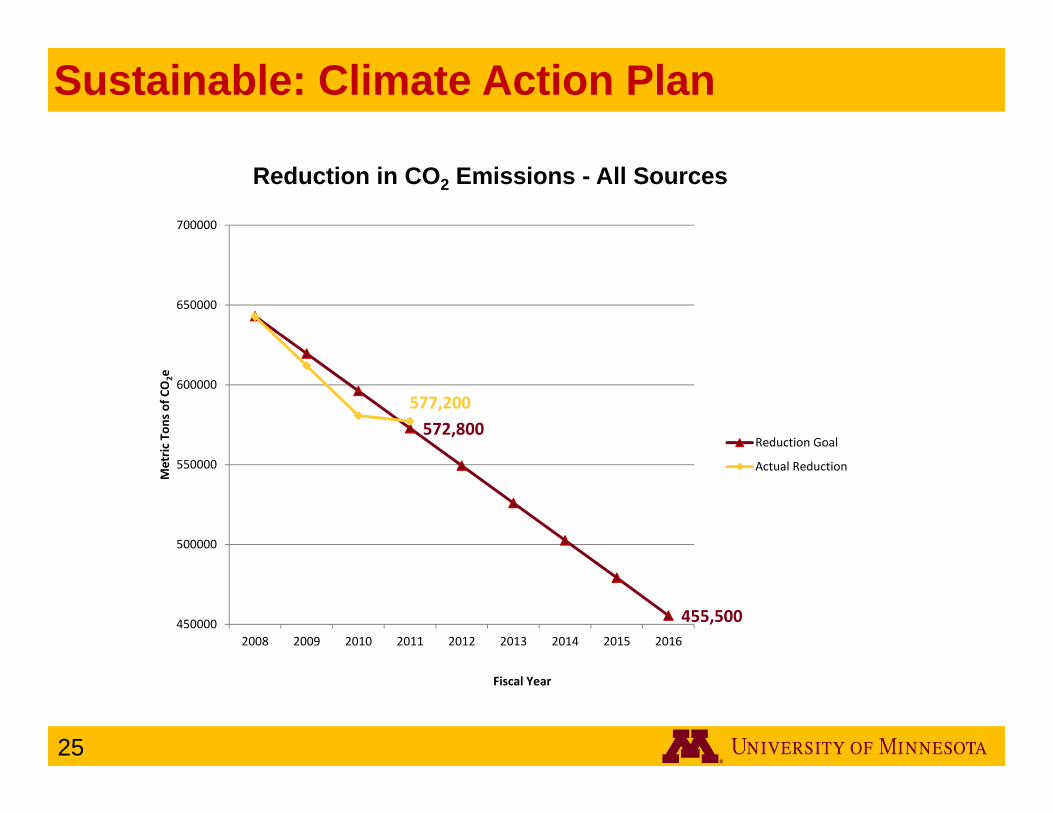
Sustainable: Climate Action Plan
25
572,800
455,500
577,200
450000
500000
550000
600000
650000
700000
2008 2009 2010 2011 2012 2013 2014 2015 2016
Metric
Ton
s of C
O2e
Fiscal Year
Reduction in CO2 Emissions - All Sources
Reduction Goal
Actual Reduction

Sustainable: Carbon Footprint
Source: Energy Management
15
20
25
0.0
5.0
10.0
15.0
20.0
25.0
30.0
Million GSF
Metric
Ton
s per 100
0 GSF
UMTC CO2 (Metric Ton Equivalent) Emissions per 1000 GSF
Xcel GeneratedElectricityU of M Generated Steam
GSF
Since 1999: Campus
increased by 2.5M SqFt
CO2 emissionshave been reduced by 5M metric tons
20% drop
26
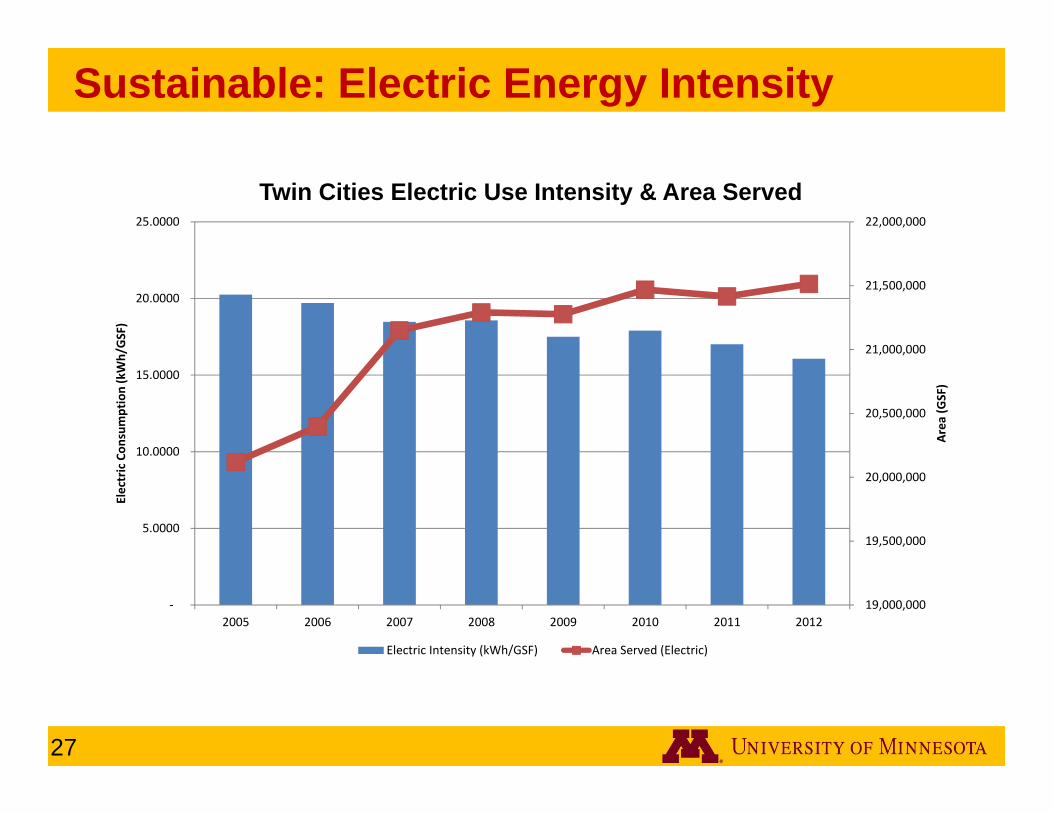
19,000,000
19,500,000
20,000,000
20,500,000
21,000,000
21,500,000
22,000,000
‐
5.0000
10.0000
15.0000
20.0000
25.0000
2005 2006 2007 2008 2009 2010 2011 2012
Area
(GSF)
Electric Con
sumption (kWh/GSF)
Twin Cities Electric Use Intensity & Area Served
Electric Intensity (kWh/GSF) Area Served (Electric)
Sustainable: Electric Energy Intensity
27

Steam Energy Intensity
• Since 1996:– Campus increased
by 3.7M SqFt– Steam Efficiency
increased by 49%– Cumulative savings
due to efficiency gains = $167M (annualized for 2012 = $12.2M) ‐
2,000
4,000
6,000
8,000
10,000
12,000
14,000
16,000
17
18
19
20
21
22
23
1996
1997
1998
1999
2000
2001
2002
2003
2004
2005
2006
2007
2008
2009
2010
2011
2012
MMBT
U/G
SF
Twin City
Cam
pus: M
illion Gross Squ
are Feet
Millions
Steam Efficiency
Gross Sq Feet (000's) MMBtu/GSF
28

Cost Control: Energy Consumption vs. Peers
FM Peers (Sightlines) Industry (IFMA)
Energy $/GSF $2.31 $3.81 $2.38
Consumption BTU/GSF 179,000 217,000 94,000
TC Campus Average
Peer Average
29

Component $ %Fuel Cost $7.71 35%Debt Service $3.77 17%Plant Ops $5.46 25%Other $5.04 23%Total $21.98 100%
FY Rate Consumption Total $ 12 $21.95 1,920 $42,138,00013 $21.98 1,866 $41,004,000
14 $21.98 1,963 $43,141,000Proforma Including CHP 14 $22.39 1,963 $43,947,726
History of Rates: $/MMBTU Components of $21.98/Mlb Rate
Other: renewal, debt, admin, conservation
30
Steam Rates
$15.00
$16.00
$17.00
$18.00
$19.00
$20.00
$21.00
$22.00
$23.00
2006 2007 2008 2009 2010 2011 2012 2013 2014 CHP2014

Component $ %
Xcel Cost $0.0827 83%
Less Refund -$0.0033 -3%
Other $0.0197 20%
Total $0.0991 100%
FY Rate/KWhr Consump./Mlb Support $12 $0.0991 390,979 $38,743,00013 $0.0991 375,806 $37,255,00014 $0.0991 396,828 $39,338,000ProformaIncluding CHP14
$0.0919 396,828 $36,481,017
History of Rates: $/Kwhr Components of $0.0991/KWhr Rate
Other: distribution, renewal, admin, debt,
31
Electricity Rates
$0.05
$0.06
$0.07
$0.08
$0.09
$0.10
$0.11
2006 2007 2008 2009 2010 2011 2012 2013 2014 CHP2014

Cost-effective: EB Dist. Cooling Expansion2012 System Expansion: Supply both new and exiting buildings; Physics-Nano and 17th
Ave Residence Hall, Shepard Labs, Civil Eng, Rec Center
District energy service provides greater energy efficiency, lower O&M expense and life cycle cost then standalone building heating & cooling equipment
32

Cost-effective: WBOB Heat Recovery
Energy conservation - Capture waste heat, reducing winter heating energy demand (5.5 year pay-back project)
Spring 2013 installation: 130 ton capacity screw heat recovery chiller & plant controls

Working with Coordinate Campuses
34
Crookston, University of Minnesota
The Crookston Campus has worked collaboratively with Energy Management on several projects:
• Study of the central heating plant to prepare for the Area source boiler MACT 2014 compliance requirements.
• Commissioning and assessment of new buildings and energy efficiency projects.
• Study and assessment of the campus high voltage distribution network.
35
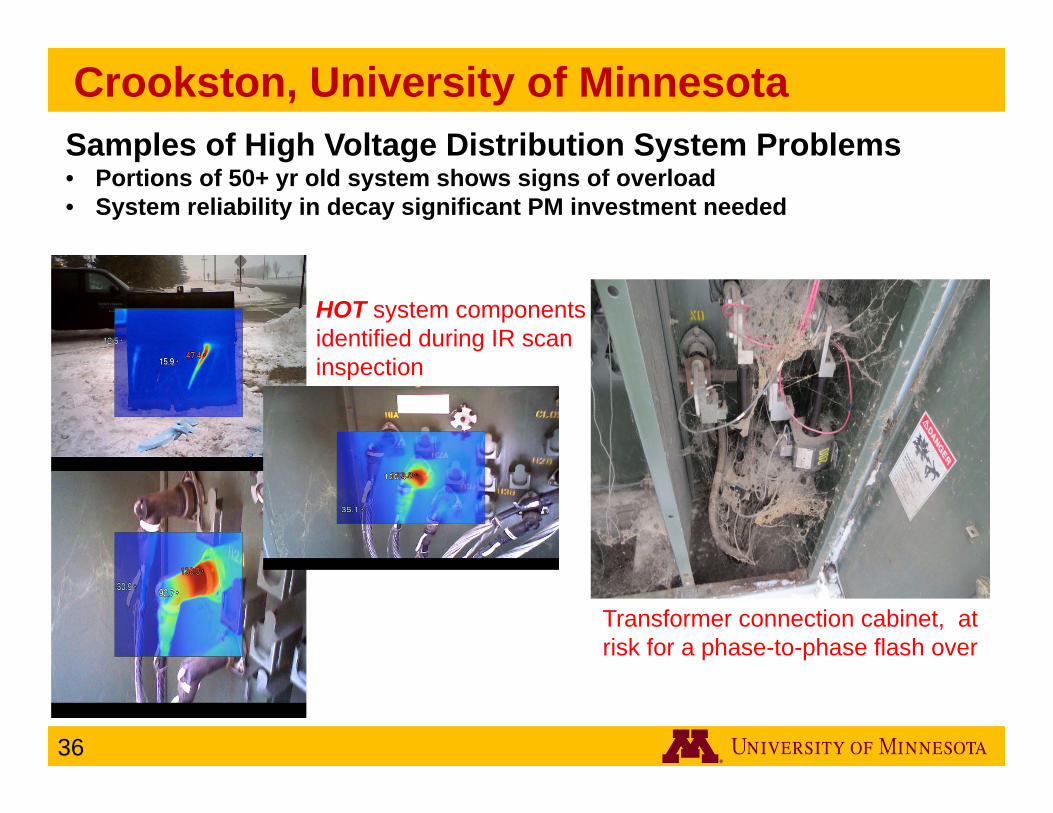
Crookston, University of Minnesota
HOT system components identified during IR scan inspection
Samples of High Voltage Distribution System Problems• Portions of 50+ yr old system shows signs of overload• System reliability in decay significant PM investment needed
Transformer connection cabinet, at risk for a phase-to-phase flash over
36
Current Utility Upgrades: Replace Main Steam Header Piping to Increase Capacity – 2012
Expand Chilled Water Piping Network – 2012
Complete Chilled Water System Modeling Study – 2012
Upgrade Metering and Control Systems – 2012/2013
Replace Campus High Voltage Switches – Continuing
OSHA Arc Flash Safety Analysis – Continuing
Campus Fire Alarm Code Upgrades – Continuing
Duluth, University of Minnesota
37

Duluth, University of Minnesota
Planned Utility Upgrades
New Campus Utility Building with Additional Chiller Plant – 2012/2013
Upgrade Combustion Control Systems for all Boilers – 2012/2013
Increase Heating Plant Capacity with Additional Boiler – 2015
Replace Campus High Voltage Switches – Continuing
OSHA Arc Flash Safety Analysis – Continuing
Campus Fire Alarm Code Upgrades – Continuing
38

Duluth, University of MinnesotaEnergy Efficiency Projects:
Building Controls Upgrades – Continuing
RhiZone Predictive Energy Modeling -2012/2013
Field House Lighting Upgrade – 2012
LED Lighting Upgrades – Continuing
Lighting Control Systems – 2012
Window Replacement Projects – Continuing
Roof Replacement Projects – Continuing
Sustainable Agriculture Project Wind Turbine – In planning
39

Morris, University of Minnesota

Energy Management - University of Minnesota
Questions?