Embed Size (px)
Citation preview
Bio
logy
Ope
n •
Adv
ance
art
icle
Energy metabolic state in hypothermically stored boar spermatozoa using a
revised protocol for efficient ATP extraction
Quynh Thu Nguyen1,2, Ulrike Wallner1, Marion Schmicke3, Dagmar Waberski1*,
Heiko Henning1,4*
1 Unit for Reproductive Medicine of Clinics / Clinic for Pigs and Small Ruminants,
University of Veterinary Medicine Hannover, Buenteweg 15, 30559 Hannover,
Germany
2 Department of Animal Sciences, University of Göttingen, Albrecht- Thaer- Weg 3,
37075 Göttingen
3 Clinic for Cattle, Endocrinology Laboratory, University of Veterinary Medicine
Hannover, Hannover, Bischofsholer Damm 15, 30173 Hannover, Germany
4 Department of Equine Sciences, Faculty of Veterinary Medicine, Utrecht
University, Yalelaan 112, 3584 CM Utrecht, The Netherlands
Email address:
Quynh Thu Nguyen: [email protected]
Ulrike Wallner: [email protected]
Marion Schmicke [email protected]
Dagmar Waberski [email protected]
Heiko Henning [email protected]
*Authors for correspondence:
[email protected]; [email protected]
Summary statement
A revised protocol for efficient extraction of ATP from boar spermatozoa is
presented which consistently yields high ATP contents and energy charge
values from fresh and frozen samples.
by guest on July 8, 2020http://bio.biologists.org/Downloaded from
Bio
logy
Ope
n •
Adv
ance
art
icle
Abstract
Mammalian spermatozoa utilize ATP as the energy source for key functions on the
route to fertilization. ATP and its precursor nucleotides ADP and AMP are determined
in many sperm physiology studies, mostly by bioluminescence assays. Assay results
vary widely, mainly due to different efficiency in nucleotide extraction and prevention
of their enzymatic degradation. Here, we describe a revised, validated protocol for
efficient phosphatase inhibition and adenine nucleotide extraction resulting in
consistently high ATP concentrations exceeding previously reported values for boar
spermatozoa up to twenty-fold. The revised assay is applicable for determining ATP
concentrations and adenylate energy charge in extracts from fresh and frozen
samples, thereby allowing simultaneous assessment of semen samples from long-
term storage experiments. After validation, the assay was applied to liquid preserved
boar spermatozoa stored at 17°C and 5°C for 24 and 72h. Cooling to 5°C, but not
storage duration, reduced ATP concentration in spermatozoa (P<0.05), which was
accompanied by the appearance of AMP and ADP in the preservation medium. ATP
and energy charge were highly correlated to the proportion of membrane intact
spermatozoa supporting the idea of nucleotides leaking through disrupted membranes
in cold-shocked cells. The present assay allows highly standardized studies of energy
metabolism in spermatozoa.
Keywords : ATP, energy charge, spermatozoa
by guest on July 8, 2020http://bio.biologists.org/Downloaded from
Bio
logy
Ope
n •
Adv
ance
art
icle
Introduction
ATP is the energy source for key functions of spermatozoa on the route to fertilization.
Spermatozoa specifically utilize ATP in energy dependent cellular activities such as
motility (Mukai and Okumo, 2004), capacitation (Travis et al. 2001), hyperactivation,
and acrosome reaction (reviewed in Du Plessis et al., 2015). Due to the essential role
of ATP for maintenance and regulation of cellular function, the determination of ATP
concentration is included in many sperm physiology studies. ATP content in
spermatozoa is commonly determined by bioluminescence using the firefly luciferin-
luciferase assay in a wide variety of species including fish (Perchec et al., 1995), boar
(Long and Guthrie, 2006), bull (Guminska et al., 1997), domestic poultry (Wishart,
1982; Long and Guthrie, 2006), and human (Blerkom et al., 1995).
Protocols vary widely between reports and evidence for assay accuracy is often
lacking. Studies on fresh and stored boar semen using variants of the bioluminescence
method report variable ATP contents ranging between 5 and 152 pmol/106 sperm
(Long and Guthrie, 2006; Dziekońska and Strzeżek, 2011; Dziekońska et al., 2013).
Ideally, an ATP assay should allow detection of all intracellular ATP. Maximal detection
of ATP depends on efficient phosphatase inhibition to prevent ATP degradation and
an effective ATP extraction step. The immediate use of a phosphatase inhibitor
cocktail containing acidic and alkaline phosphatases as well as tyrosine protein
phosphatases in aqueous solution prior to ATP release was found to increase the
amount of detectable ATP in sperm samples of turkey, rooster and boar (Long and
Guthrie, 2006). A simple method for extraction of ATP and other nucleotides is boiling
of the sample in the presence or absence of deionized water or a boiling buffer (Ford
and Leach, 1998; Yang et al., 2002; Yi et al. 2008). Other commonly used reagents
for ATP extraction, e.g. perchloric acid or Tris-borate buffer have been suggested to
interfere with the luciferin-luciferase reaction or (Lyons et al., 1986; Yang et al., 2002).
In spermatology research, long-term preservation experiments for several days
require storing of samples for later assessment, ideally without changing the measured
ATP content. Reliable ATP values of frozen ATP extracts would allow the analysis of
stored samples on the same assay run thereby excluding inter-assay variation.
Only few spermatology studies consider the concentration of the ATP precursor
nucleotides ADP and AMP. The relative available concentrations of ATP, ADP and
by guest on July 8, 2020http://bio.biologists.org/Downloaded from
Bio
logy
Ope
n •
Adv
ance
art
icle
AMP allow the calculation of energy charge (EC) as first defined by Atkinson and
Walter (1967). Surprisingly, only little information is available in the literature about the
EC of spermatozoa, although the EC is regarded as a more distinct indicator of the
metabolic energy status of living cells than ATP concentrations alone (Du Toit et al.,
1993).
The objective of the present study was to develop and validate a revised protocol for
efficient nucleotide extraction and measurement of ATP levels and energy charge from
diluted boar spermatozoa which allows frozen storage of the samples without
compromising nucleotide concentrations. Protocol revision was based on the ATP and
adenylate energy charge assay from Ford and Leach (1998) and key features of the
ATP quantification assay described by Long and Guthrie (2006) for spermatozoa. The
revised assay was applied to determine ATP content and energy charge in boar
spermatozoa preserved at 17°C and 5°C with consideration of the nucleotide
concentration in semen extender media.
Results
Assays development
Experiment 1
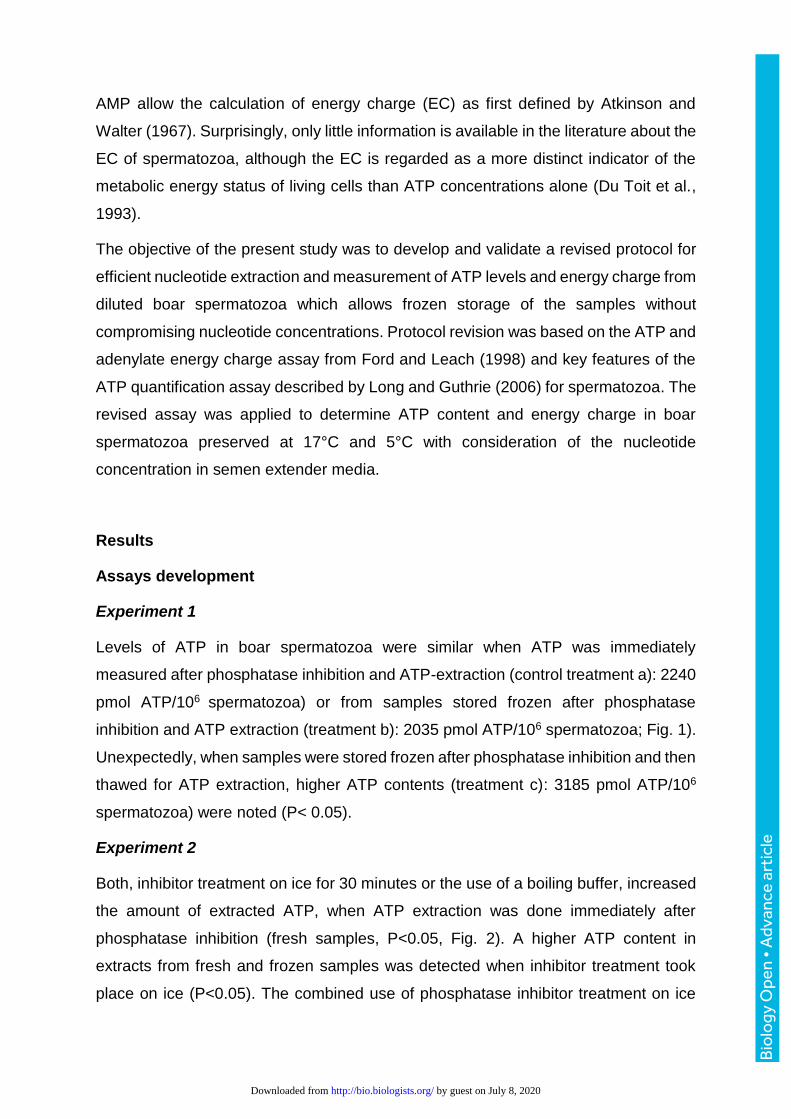
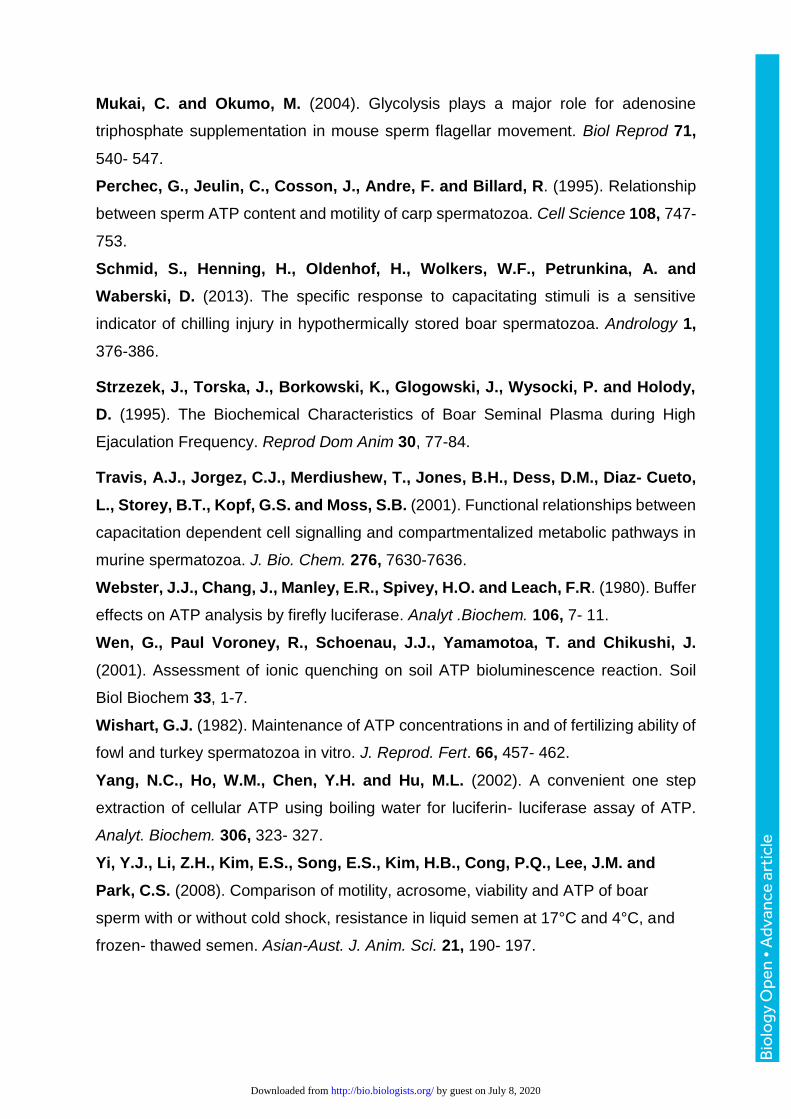
Levels of ATP in boar spermatozoa were similar when ATP was immediately
measured after phosphatase inhibition and ATP-extraction (control treatment a): 2240
pmol ATP/106 spermatozoa) or from samples stored frozen after phosphatase
inhibition and ATP extraction (treatment b): 2035 pmol ATP/106 spermatozoa; Fig. 1).
Unexpectedly, when samples were stored frozen after phosphatase inhibition and then
thawed for ATP extraction, higher ATP contents (treatment c): 3185 pmol ATP/106
spermatozoa) were noted (P< 0.05).
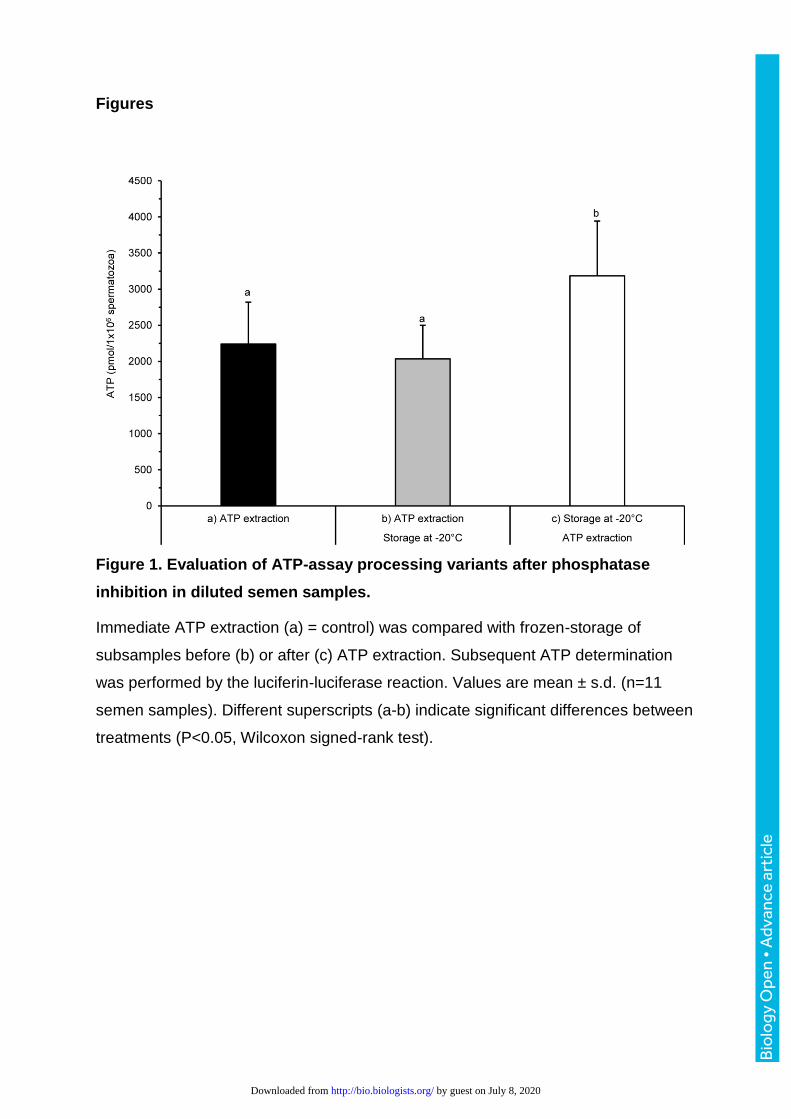
Experiment 2
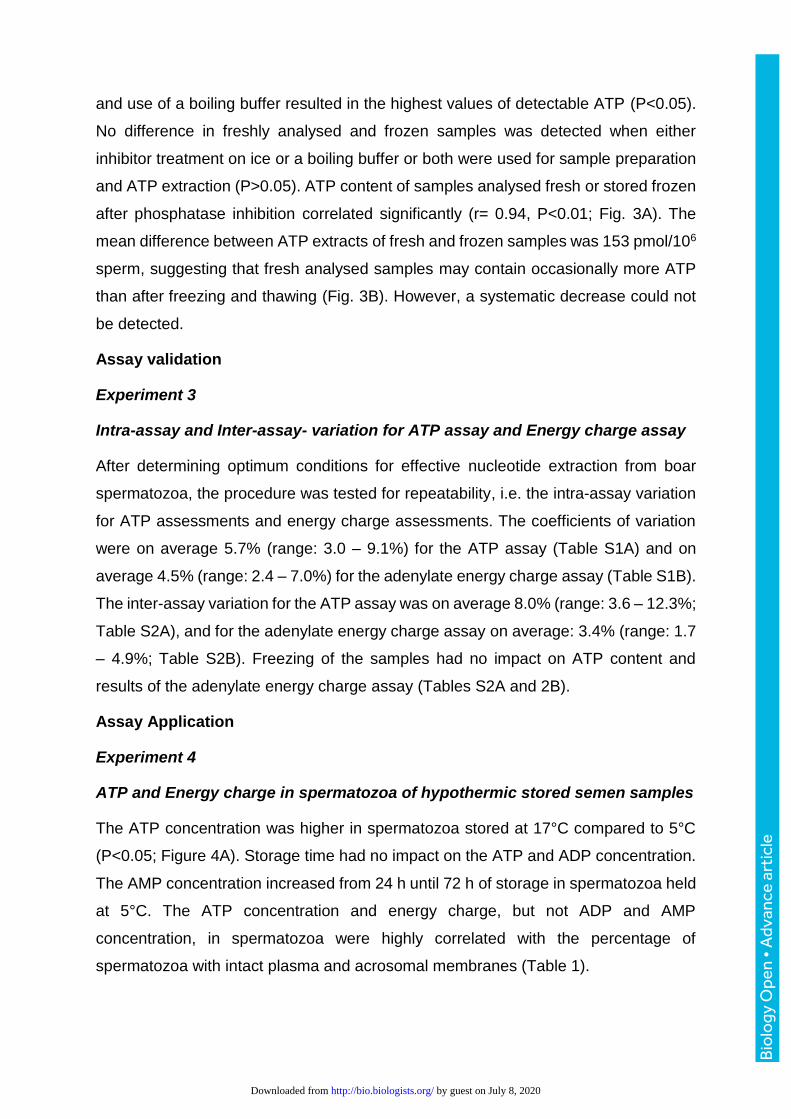
Both, inhibitor treatment on ice for 30 minutes or the use of a boiling buffer, increased
the amount of extracted ATP, when ATP extraction was done immediately after
phosphatase inhibition (fresh samples, P<0.05, Fig. 2). A higher ATP content in
extracts from fresh and frozen samples was detected when inhibitor treatment took
place on ice (P<0.05). The combined use of phosphatase inhibitor treatment on ice
by guest on July 8, 2020http://bio.biologists.org/Downloaded from
Bio
logy
Ope
n •
Adv
ance
art
icle
and use of a boiling buffer resulted in the highest values of detectable ATP (P<0.05).
No difference in freshly analysed and frozen samples was detected when either
inhibitor treatment on ice or a boiling buffer or both were used for sample preparation
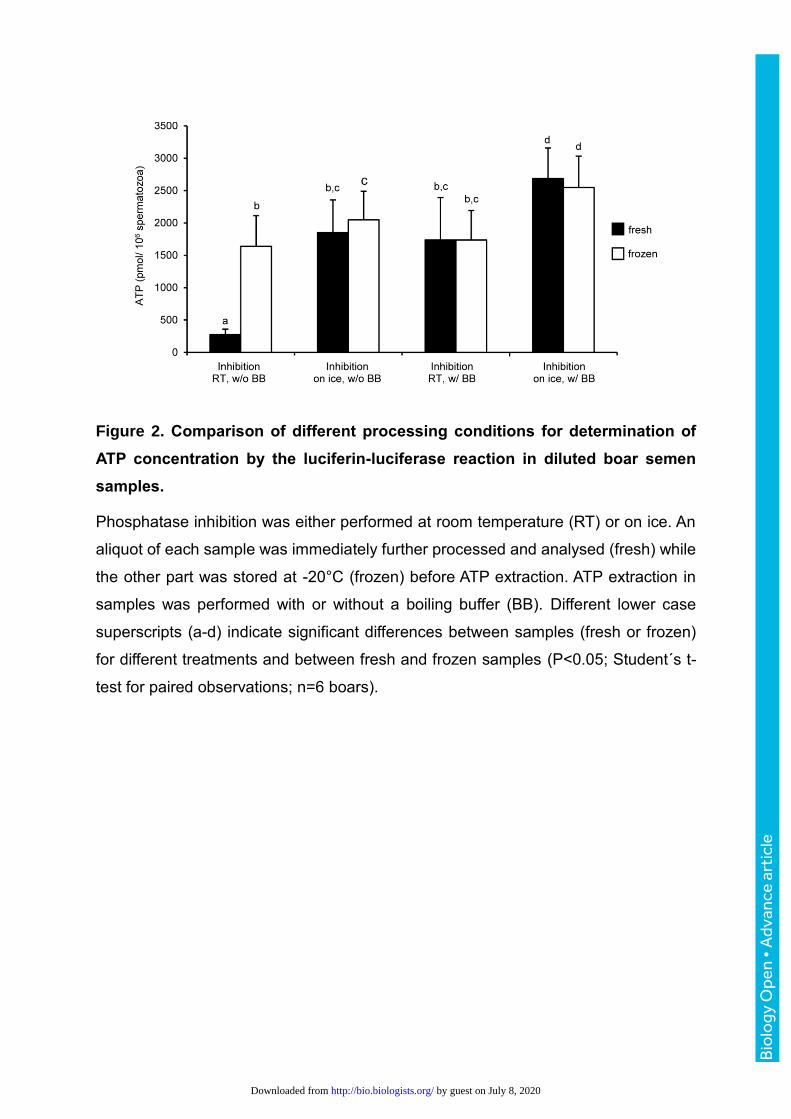
and ATP extraction (P>0.05). ATP content of samples analysed fresh or stored frozen
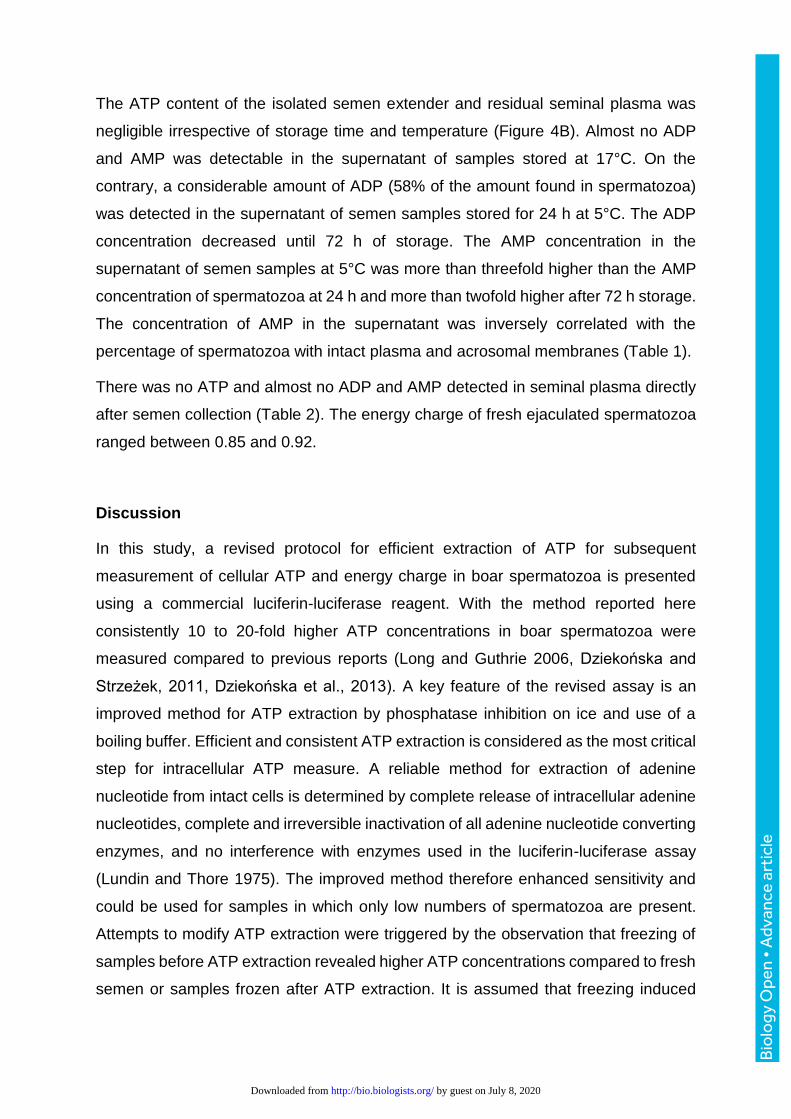
after phosphatase inhibition correlated significantly (r= 0.94, P<0.01; Fig. 3A). The
mean difference between ATP extracts of fresh and frozen samples was 153 pmol/106
sperm, suggesting that fresh analysed samples may contain occasionally more ATP
than after freezing and thawing (Fig. 3B). However, a systematic decrease could not
be detected.
Assay validation
Experiment 3
Intra-assay and Inter-assay- variation for ATP assay and Energy charge assay
After determining optimum conditions for effective nucleotide extraction from boar
spermatozoa, the procedure was tested for repeatability, i.e. the intra-assay variation
for ATP assessments and energy charge assessments. The coefficients of variation
were on average 5.7% (range: 3.0 – 9.1%) for the ATP assay (Table S1A) and on
average 4.5% (range: 2.4 – 7.0%) for the adenylate energy charge assay (Table S1B).
The inter-assay variation for the ATP assay was on average 8.0% (range: 3.6 – 12.3%;
Table S2A), and for the adenylate energy charge assay on average: 3.4% (range: 1.7
– 4.9%; Table S2B). Freezing of the samples had no impact on ATP content and
results of the adenylate energy charge assay (Tables S2A and 2B).
Assay Application
Experiment 4
ATP and Energy charge in spermatozoa of hypothermic stored semen samples
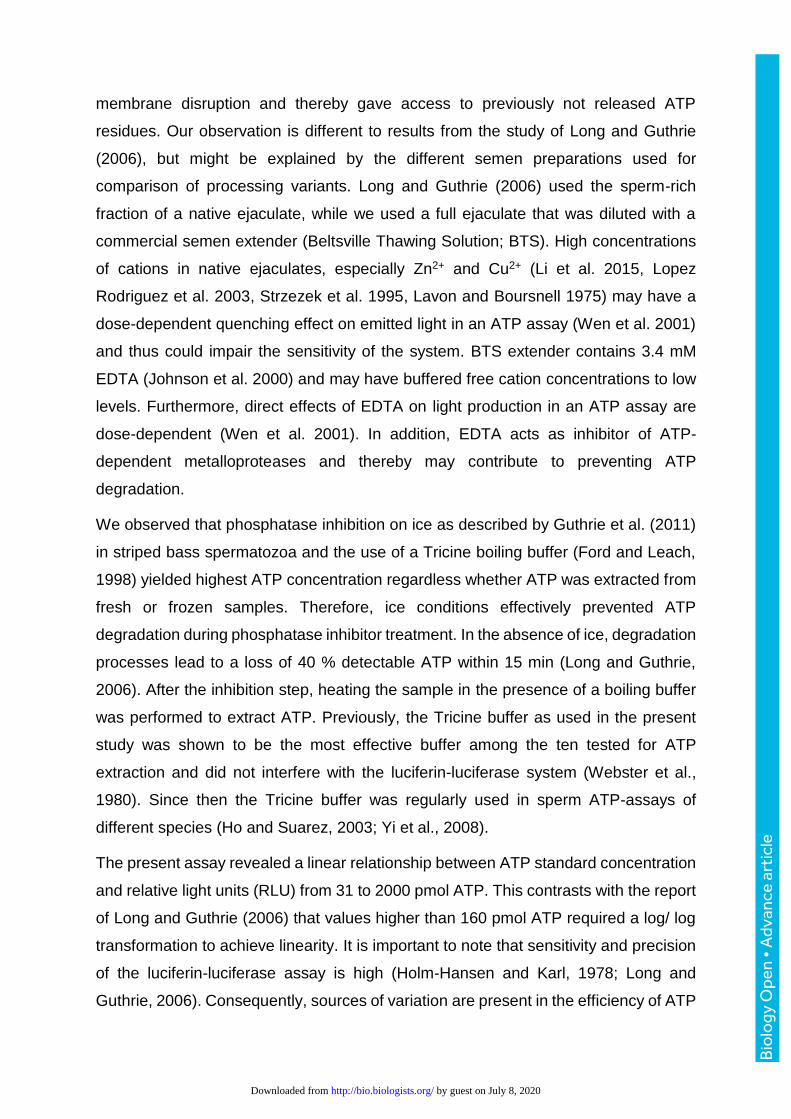
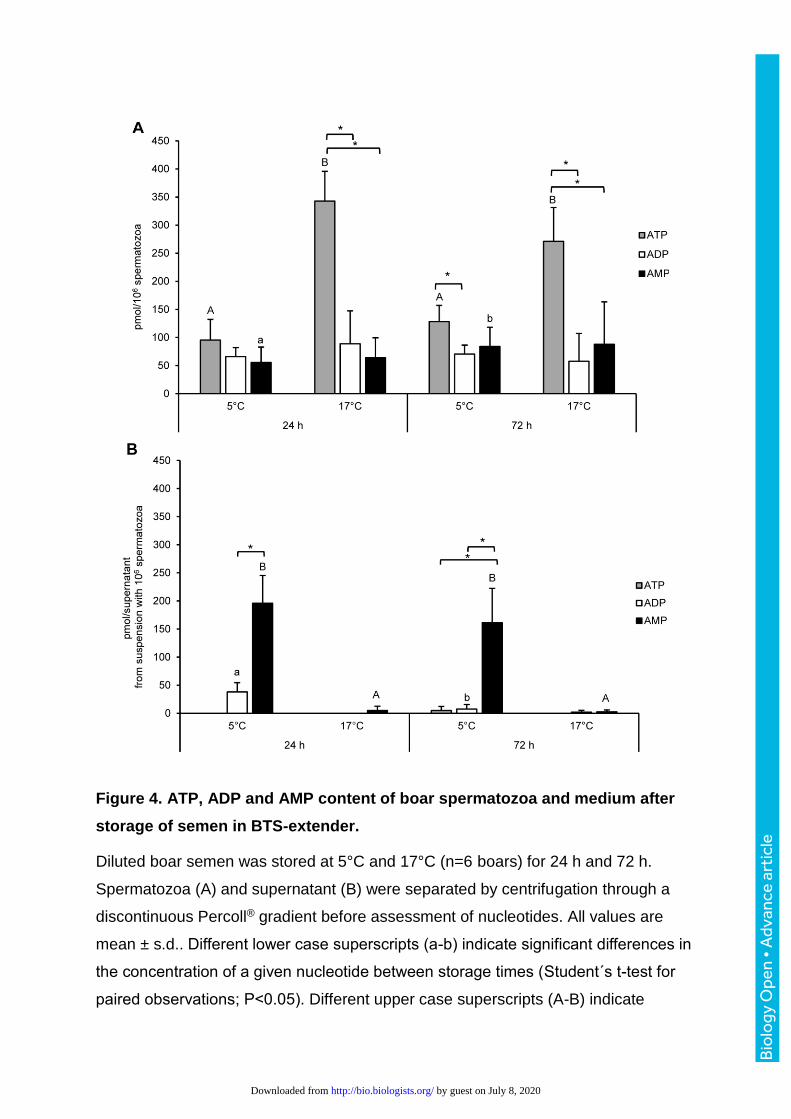
The ATP concentration was higher in spermatozoa stored at 17°C compared to 5°C
(P<0.05; Figure 4A). Storage time had no impact on the ATP and ADP concentration.
The AMP concentration increased from 24 h until 72 h of storage in spermatozoa held
at 5°C. The ATP concentration and energy charge, but not ADP and AMP
concentration, in spermatozoa were highly correlated with the percentage of
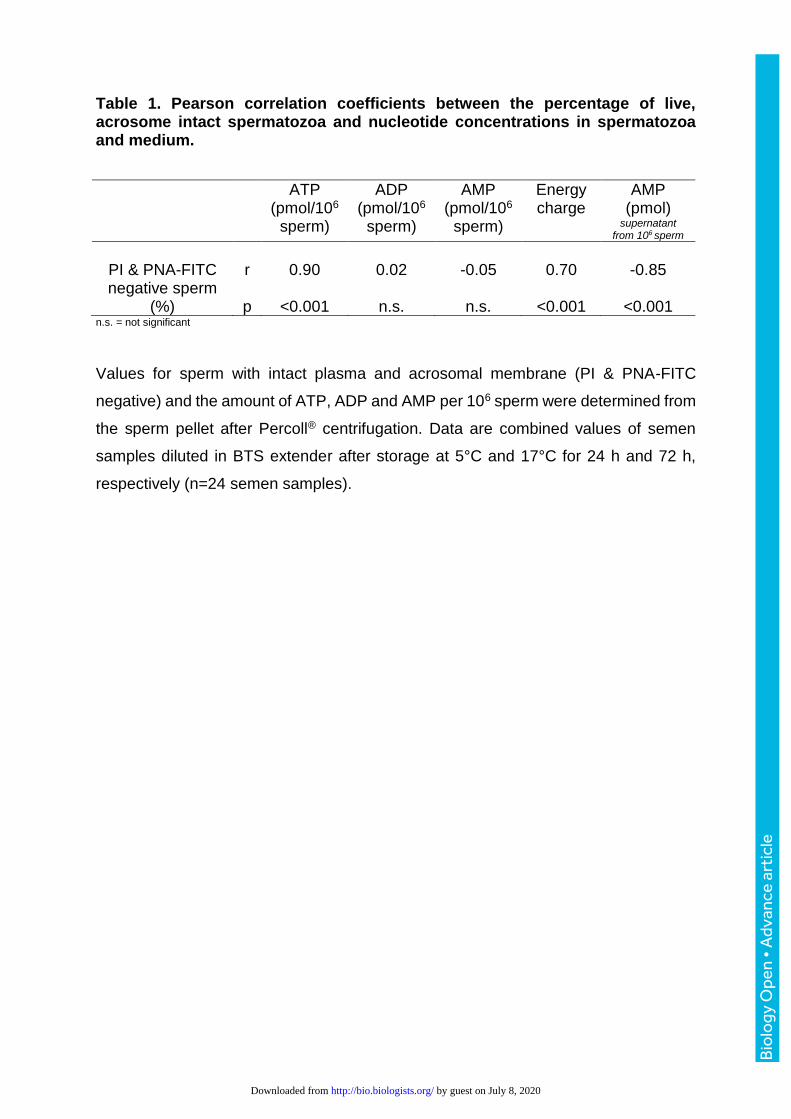
spermatozoa with intact plasma and acrosomal membranes (Table 1).
by guest on July 8, 2020http://bio.biologists.org/Downloaded from
Bio
logy
Ope
n •
Adv
ance
art
icle
The ATP content of the isolated semen extender and residual seminal plasma was
negligible irrespective of storage time and temperature (Figure 4B). Almost no ADP
and AMP was detectable in the supernatant of samples stored at 17°C. On the
contrary, a considerable amount of ADP (58% of the amount found in spermatozoa)
was detected in the supernatant of semen samples stored for 24 h at 5°C. The ADP
concentration decreased until 72 h of storage. The AMP concentration in the
supernatant of semen samples at 5°C was more than threefold higher than the AMP
concentration of spermatozoa at 24 h and more than twofold higher after 72 h storage.
The concentration of AMP in the supernatant was inversely correlated with the
percentage of spermatozoa with intact plasma and acrosomal membranes (Table 1).
There was no ATP and almost no ADP and AMP detected in seminal plasma directly
after semen collection (Table 2). The energy charge of fresh ejaculated spermatozoa
ranged between 0.85 and 0.92.
Discussion
In this study, a revised protocol for efficient extraction of ATP for subsequent
measurement of cellular ATP and energy charge in boar spermatozoa is presented
using a commercial luciferin-luciferase reagent. With the method reported here
consistently 10 to 20-fold higher ATP concentrations in boar spermatozoa were
measured compared to previous reports (Long and Guthrie 2006, Dziekońska and
Strzeżek, 2011, Dziekońska et al., 2013). A key feature of the revised assay is an
improved method for ATP extraction by phosphatase inhibition on ice and use of a
boiling buffer. Efficient and consistent ATP extraction is considered as the most critical
step for intracellular ATP measure. A reliable method for extraction of adenine
nucleotide from intact cells is determined by complete release of intracellular adenine
nucleotides, complete and irreversible inactivation of all adenine nucleotide converting
enzymes, and no interference with enzymes used in the luciferin-luciferase assay
(Lundin and Thore 1975). The improved method therefore enhanced sensitivity and
could be used for samples in which only low numbers of spermatozoa are present.
Attempts to modify ATP extraction were triggered by the observation that freezing of
samples before ATP extraction revealed higher ATP concentrations compared to fresh
semen or samples frozen after ATP extraction. It is assumed that freezing induced
by guest on July 8, 2020http://bio.biologists.org/Downloaded from
Bio
logy
Ope
n •
Adv
ance
art
icle
membrane disruption and thereby gave access to previously not released ATP
residues. Our observation is different to results from the study of Long and Guthrie
(2006), but might be explained by the different semen preparations used for
comparison of processing variants. Long and Guthrie (2006) used the sperm-rich
fraction of a native ejaculate, while we used a full ejaculate that was diluted with a
commercial semen extender (Beltsville Thawing Solution; BTS). High concentrations
of cations in native ejaculates, especially Zn2+ and Cu2+ (Li et al. 2015, Lopez
Rodriguez et al. 2003, Strzezek et al. 1995, Lavon and Boursnell 1975) may have a
dose-dependent quenching effect on emitted light in an ATP assay (Wen et al. 2001)
and thus could impair the sensitivity of the system. BTS extender contains 3.4 mM
EDTA (Johnson et al. 2000) and may have buffered free cation concentrations to low
levels. Furthermore, direct effects of EDTA on light production in an ATP assay are
dose-dependent (Wen et al. 2001). In addition, EDTA acts as inhibitor of ATP-
dependent metalloproteases and thereby may contribute to preventing ATP
degradation.
We observed that phosphatase inhibition on ice as described by Guthrie et al. (2011)
in striped bass spermatozoa and the use of a Tricine boiling buffer (Ford and Leach,
1998) yielded highest ATP concentration regardless whether ATP was extracted from
fresh or frozen samples. Therefore, ice conditions effectively prevented ATP
degradation during phosphatase inhibitor treatment. In the absence of ice, degradation
processes lead to a loss of 40 % detectable ATP within 15 min (Long and Guthrie,
2006). After the inhibition step, heating the sample in the presence of a boiling buffer
was performed to extract ATP. Previously, the Tricine buffer as used in the present
study was shown to be the most effective buffer among the ten tested for ATP
extraction and did not interfere with the luciferin-luciferase system (Webster et al.,
1980). Since then the Tricine buffer was regularly used in sperm ATP-assays of
different species (Ho and Suarez, 2003; Yi et al., 2008).
The present assay revealed a linear relationship between ATP standard concentration
and relative light units (RLU) from 31 to 2000 pmol ATP. This contrasts with the report
of Long and Guthrie (2006) that values higher than 160 pmol ATP required a log/ log
transformation to achieve linearity. It is important to note that sensitivity and precision
of the luciferin-luciferase assay is high (Holm-Hansen and Karl, 1978; Long and
Guthrie, 2006). Consequently, sources of variation are present in the efficiency of ATP
by guest on July 8, 2020http://bio.biologists.org/Downloaded from
Bio
logy
Ope
n •
Adv
ance
art
icle
extraction and prevention of ATP degradation rather than in the luciferin-luciferase
reaction. High correlations between ATP concentration in fresh and frozen-stored
samples together with low intra-assay variation for both ATP and EC values
demonstrate that the present method is suitable for routine assessment of cellular
energy metabolism in stored samples. Application of this assay for measurement of
ATP concentrations and energy charge in extracts from fresh and frozen aliquots from
the same semen samples was highly repeatable with low intra- and inter-assay
variation. In order to minimize assay variation, we recommend to perform the
phosphatase inhibition (on ice with a boiling buffer) and freezing of all samples of an
experimental unit at -20°C. Later, extraction of ATP from frozen-thawed samples
should be performed on one day and all samples that need to be compared should be
analyzed in the same luciferin-luciferase assay run. EC in native boar semen was high
level (0.9) and corresponds to EC measured in freshly ejaculated boar spermatozoa
after determination of adenine nucleotides by a fluorometric enzymatic assay (Kamp
et al., 2003). Similarly high EC levels (0.8-0.9) are considered as physiological in
freshly ejaculated human spermatozoa (Chulavatnatol and Haesungchatern, 1977). It
is important to note that the presence of spermatozoa with altered membranes may
influence ATP and EC values in semen samples. Leakage of adenine nucleotide
through disrupted membranes into the surrounding medium may result in low
ATP/ADP/AMP concentration in a sub-population of cells with defect membranes. In
fact, the present study revealed a high positive correlation between the proportion of
membrane intact sperm and ATP and EC levels, respectively, whereas AMP in the
supernatant was negatively correlated to the energy measures. Consequently, in
samples with distinct amounts of membrane damaged cells, ATP and EC values are
expected to reflect the proportion of viable (membrane intact) cells in the sample rather
than the energy status of living cells. Any determination of energy status of
spermatozoa therefore should include information on the integrity of the plasma
membranes. In accordance with observations of Long and Guthrie (2006), the ATP
content of seminal plasma was negligible in raw semen samples. In the present study
membrane disruption was induced by lowering the storage temperature of the semen
to 5°C. Under these conditions when boar spermatozoa were cooled below lipid phase
transition temperatures (between 30°C and 10°C; Drobnis et al., 1993; Schmid et al.,
2013), increased ADP and AMP concentration were found in the extender medium
regardless of the storage period. The hypothesis that cooling-induced rearrangement
by guest on July 8, 2020http://bio.biologists.org/Downloaded from
Bio
logy
Ope
n •
Adv
ance
art
icle
of lipid domains increases membrane permeability (Drobnis et al., 1993) and thus
leads to leakage of intracellular nucleotides through disrupted membranes was
confirmed. The lower intracellular ATP concentrations in samples stored at 5°C may
partially result from loss of the precursor nucleotides AMP and ADP and partially from
impaired activity of ATP-generating enzymes.
In conclusion, a revised protocol for an efficient and highly repeatable ATP extraction
in boar spermatozoa is presented which allows freezing of samples at -20°C prior to
extraction without affecting the ATP content and energy charge. The revised ATP
assay is suitable for studies of the energy metabolism in boar spermatozoa,
particularly when only low sperm numbers are available or samples need to be stored
for later assessment. In any case, cell membrane integrity of the original semen
sample should be considered to avoid misleading data interpretation.
Materials and methods
Reagents
Unless otherwise stated, chemicals were obtained from Sigma-Aldrich (Steinheim,
Germany), Merck (Darmstadt, Germany), and Roth (Karlsruhe, Germany).
Animals and semen collection
Semen was collected from a total of six healthy, mature and fertile boars (sus scrofa
domesticus Linnaeus, 1758) housed at the Unit for Reproductive Medicine of Clinics,
University of Veterinary Medicine Hannover. The boars (age range: 1.5 to 5 years)
belonged to the breed Piétrain, German Large White or were crossbred animals.
Housing and management of the animals complied with the national laws and
guidelines. The ejaculates were collected by the gloved hand method into disposable
semen collection bags with integrated filter (Minitüb GmbH Tiefenbach, Germany),
which were enclosed in insulated plastic thermos cups pre-heated to 38°C.
Immediately after collection, semen was transferred to the laboratory and
isothermically (33°C) diluted with Beltsville Thawing solution (BTS; Minitüb). Sperm
concentration was assessed by the “Thoma neu” counting chamber with phase-
contrast microscope (Zeiss, Jena, Germany) at 400x magnification. Only
normospermic ejaculates were used for the experiments i.e. ejaculates with ≥ 100 ml
volume, ≥ 160x106 sperm ml-1 concentration, ≥ 70% motile spermatozoa, ≤ 25%
by guest on July 8, 2020http://bio.biologists.org/Downloaded from
Bio
logy
Ope
n •
Adv
ance
art
icle
morphological abnormal sperm. Diluted semen with a final concentration of 20 x 106
sperm ml-1 was kept at room temperature and used on the day of collection to develop
and validate the ATP and EC assay. In experiments utilizing diluted semen
(Experiment 4), 100 ml samples were kept for 90 min at room temperature. Then,
samples were transferred to a storage unit (17°C). Cooling to 5°C was achieved by
holding semen for 60 min at 17°C, followed by 60 min at 10°C before samples were
stored at 5°C.
ATP assay
The ATP assay included the following steps:
1) Preparation of an ATP standard curve
2) Phosphatase inhibition
3) ATP extraction
4) ATP detection with luciferin/luciferase reaction
Variations of the single steps were tested as described in the respective experiment
section.
Assay development
Experiment 1: Sample storage after phosphatase inhibition
Experiment 1 was based on the protocol of Long and Guthrie (2006) and had the aim
to test two methods which have been suggested as having optimal processing steps
to store samples in a frozen state for later ATP assessment without affecting the ATP
content. In the control procedure, 100 µl diluted semen samples were treated with 1
µl phosphatase inhibitor cocktail (P5726, Sigma-Aldrich, Steinheim, Germany) at room
temperature (RT) for 30 min. Thereafter, ATP was extracted from the samples and
subsequently analysed with a commercial firefly luciferin-luciferase assay (Sigma-
Aldrich, Steinheim, Germany). In the two test treatments, either the supernatant after
ATP extraction was stored for three days at -20°C before thawing and used in the ATP
assay or, the semen sample was frozen after treatment with phosphatase inhibitor
cocktail and extraction of ATP was accomplished at post-thawing. ATP extraction was
by guest on July 8, 2020http://bio.biologists.org/Downloaded from
Bio
logy
Ope
n •
Adv
ance
art
icle
always performed without the use of a boiling buffer. The experiment was carried out
twice. One sample was lost during processing, resulting a total number of 11 samples.
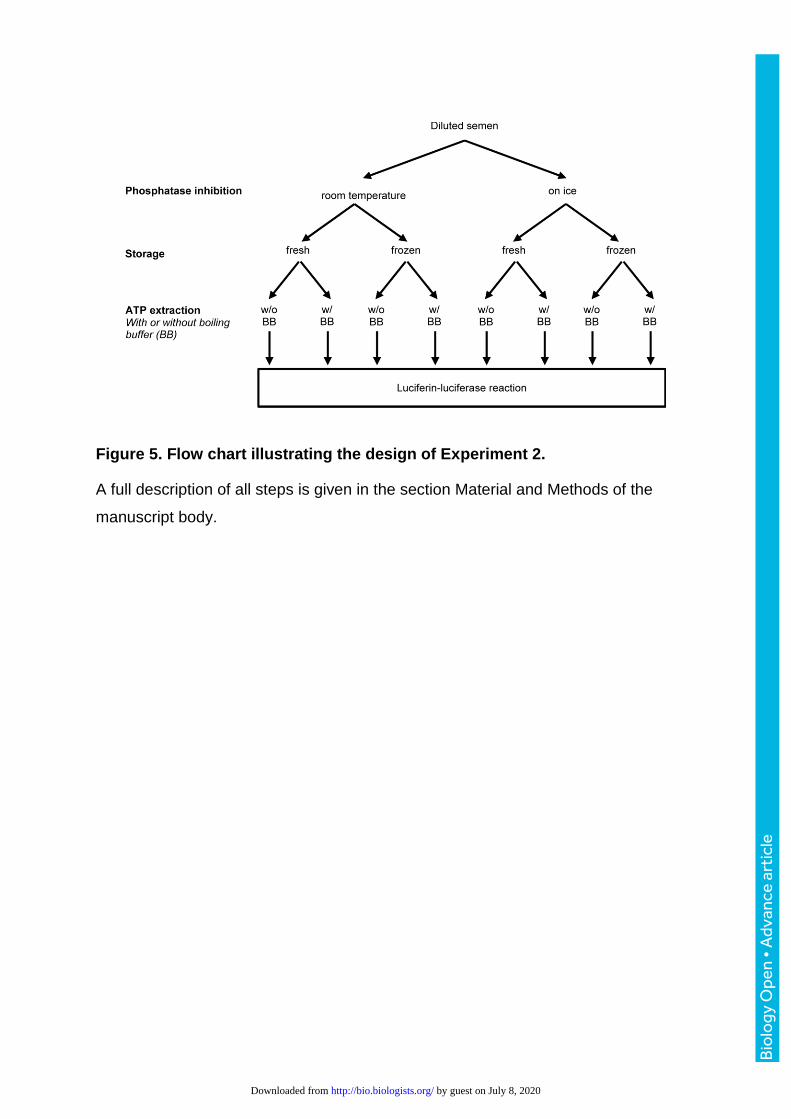
Experiment 2: Phosphatase inhibition and ATP extraction
Results from Experiment 1 indicated that ATP extraction from samples treated with
inhibitor at room temperature is suboptimal and that a small volume of the supernatant
after ATP extraction is inconvenient for further processing. Therefore, Experiment 2
focussed on optimizing the ATP extraction procedure. A 2 x 2 -factorial experiment
was designed (Fig. 5) to evaluate first, how the temperature during a 30 minute
phosphatase inhibitor treatment (RT or on ice) and the use of a boiling buffer during
ATP extraction would affect the amount of extractable ATP and second, whether the
amount of extractable ATP differs between directly processed samples and
frozen/thawed aliquots after three days of storage at -20°C.
Assay validation
Experiment 3: Intra-assay and inter-assay variation for ATP and energy charge
assay
The optimum conditions for effective ATP extraction from boar spermatozoa required
a phosphatase inhibitor treatment on ice for 30 min before sample freezing. A boiling
buffer was used during nucleotide extraction (c.f. Experiment 2). Using these
conditions, the repeatability of ATP and energy charge assessments was determined.
Intra-assay variation was assessed by calculating the coefficient of variation of six
different assay runs from aliquots of the same diluted semen samples. Inter-assay
variation was determined by comparing results of aliquots from fresh and
frozen/thawed samples at different days.
ATP standard curve preparation
An ATP standard solution was prepared by dissolving the content (1 mg) of one vial
(2 x 10⁶ µmol) of ATP standard (FLAAS, Sigma Aldrich, St. Louis, MO, USA) with 1 ml
AMPUWA water (Fresenius Kabi, Bad Homburg, Germany). From this stock solution
a serial dilution with concentrations of 62.5, 125, 250, 500, 1000, 2000 pmol ml-1 was
prepared. A standard dilution series was prepared for each day. Aliquots of the stock
solution were stored at -20°C until use.
by guest on July 8, 2020http://bio.biologists.org/Downloaded from
Bio
logy
Ope
n •
Adv
ance
art
icle
A volume of 25 µl of ATP standard concentrations (62.5, 125, 250, 500, 1000, and
2000 pmol ATP ml-1) and a blank sample (AMPUWA water) were added to the wells
of a 96 wells microtiter plate with white walls and clear bottoms (Greiner Bio-One,
Frickenhausen, Germany). Then, the ATP assay mix solution (FLAAM, Sigma-Aldrich
Steinheim, Germany) was diluted 1:25 with dilution buffer (FLAAB, Sigma-Aldrich
Steinheim, Germany). A volume of 100 µl of the diluted ATP assay mix was added to
each well by using an automatic pipette (Biohit eLine E 1000, Biohit, Rosbach,
Germany). The plate was briskly swirled and the amount of produced light immediately
measured with a Tecan GENios Pro plate reader (Tecan Group Ltd., Männedorf,
Switzerland) controlled by "Magellan" software (Version V5.03, Tecan Group Ltd.,
Männedorf, Switzerland). All standards and blank samples were prepared and
measured in duplicate.
The RLU obtained from the blank sample were subtracted from the light units
measured for each ATP standard concentration. The corrected values for the RLU are
proportional to the amount of ATP in the standard samples. A linear regression
between RLU and ATP concentrations was established (c.f. Figure 6A).
Phosphatase inhibition and ATP extraction
Unless otherwise indicated, 100 µl of a semen sample were mixed with 1 µl
phosphatase inhibitor cocktail (P5726, Sigma-Aldrich, Steinheim, Germany) and kept
for 30 min at room temperature (RT) or on ice. After inhibitor treatment, fresh or frozen
samples were boiled either with or without a boiling buffer solution (50 mM Tricine, 10
mM MgSO4, 2 mM EDTA, pH = 7.8) for nucleotide extraction. Samples without addition
of boiling buffer were directly heated for 10 min in a Thermomixer 5436 (Eppendorf,
Hamburg, Germany). When a boiling buffer was used, tubes containing 900 µl boiling
buffer were heated for 5 min at 95°C before the samples were added. After addition of
samples, the mixture was heated for 10 min at 95°C. Thereafter, the tubes were chilled
on ice for 10 min and then centrifuged at 5000 x g for 30 min at 4°C (Universal 30 RF,
Hettich, Tuttlingen, Germany). The supernatant was used for determination of ATP
and EC.
by guest on July 8, 2020http://bio.biologists.org/Downloaded from
Bio
logy
Ope
n •
Adv
ance
art
icle
ATP detection with luciferin-luciferase reaction
ATP was measured using a commercial firefly luciferin-luciferase assay (FL-AA,
Sigma- Aldrich, Steinheim, Germany). A volume of 25 µl of each sample was added
to a well of a 96 well microtiter plate. Then, 100 µl of the diluted ATP reaction mix were
added by an automatic pipette. The plate was swirled briskly and the amount of light
produced was immediately measured. Each assay run included a `blank´ sample and
ATP standard sample. All samples were prepared and analysed in duplicate. After
correction of all RLU values for background light as assessed by the blank sample, the
standard sample was used to calculate a correction factor for each assay run. Light
production in samples and ATP standards increases over time and any delay between
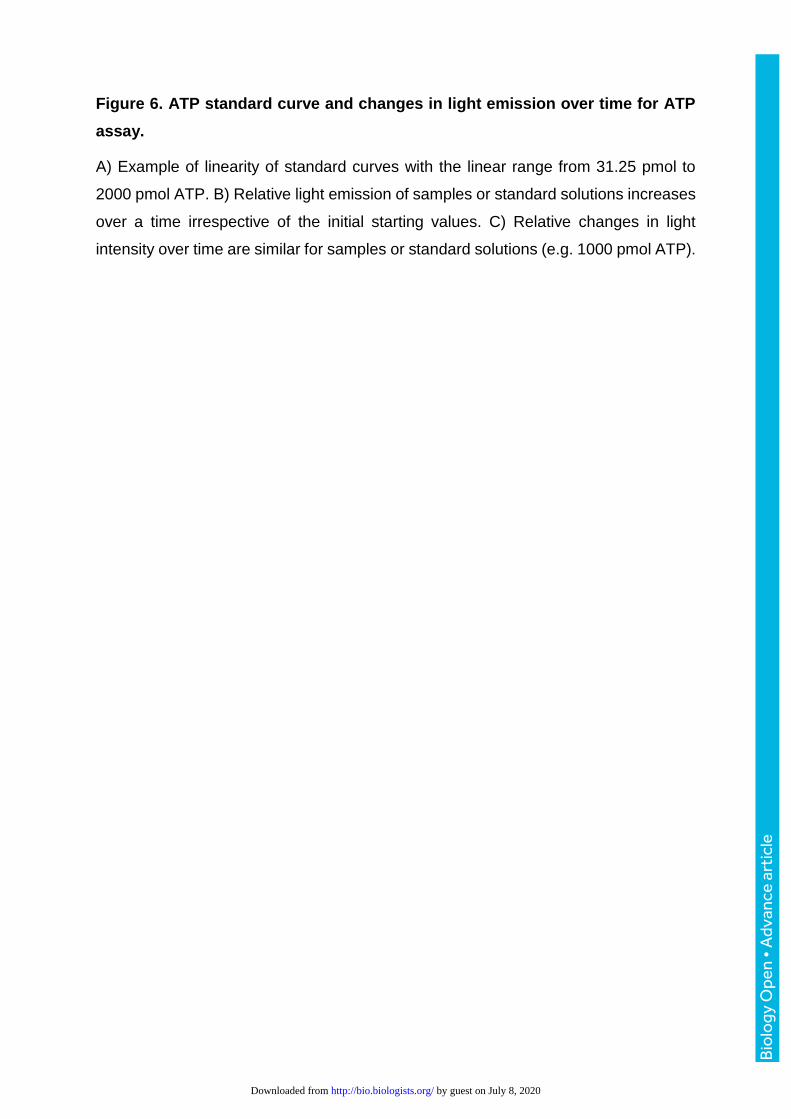
start of the reaction and reading the emitted light may lead to a bias in the data (Fig. 6B
and 6C). The correction factor for each assay run was calculated by dividing the light
units for the standard sample in a given assay run by the light units obtained during
preparation of the standard curve for a given ATP concentration. The correction factor
was applied to calculate the corrected value of relative light units for each sample.
Relative light units were averaged for each sample and the ATP concentration
determined by using the linear equation of the ATP standard curve (y = a*x + b), where
“y” is RLU and “x” is the ATP concentration.
Energy charge measurement
The energy charge was determined by modification of procedures described by Ford
and Leach (1998). The modifications are described below. Three aliquots (100 µl each)
of the samples to be analyzed for nucleotides were each incubated with 25 µl of one
of three different buffers (Buffer A, B, and C). Reaction Buffer A was used for
determination of ATP and contained 75 mM Tricine, 5 mM MgCl2 and 0.0125 mM KCl
(pH 7.5). Reaction Buffer B was used for determining the combined amount of ATP
and ADP. In addition to reaction buffer A, buffer B contained 0.1 mM
phosphoenolpyruvate (P7002, Sigma-Aldrich) and 0.08 µg µl-1 of pyruvate kinase
(P1506, Sigma-Aldrich). Phosphoenolpyruvate and pyruvate kinase stock solutions
were centrifuged for 5 min at 10,000 x g, the pellet diluted 1:3 in 20 mM Tris and 0.1%
bovine serum albumin (A2153, Sigma-Aldrich; pH = 7.5) before addition to Buffer B.
Phosphoenolpyruvat (PEP) reacts with ADP to form ATP. The reaction is catalysed by
pyruvate kinase (equation 1).
by guest on July 8, 2020http://bio.biologists.org/Downloaded from
Bio
logy
Ope
n •
Adv
ance
art
icle
ADP + PEP Pyruvate kinase→ ATP + Pyruvate (1)
Tubes containing Reaction Mix A and B were incubated at 30°C for 30 min.
Reaction buffer C was used for determining the combined amount of ATP, ADP, and
AMP. In addition to reaction Buffer B, Buffer C contained 0.1 µg µl-1 of adenylate (myo)
kinase (Sigma M 3003). The adenylate (myo) kinase stock solution was centrifuged
for 5 min at 10,000 x g, the pellet diluted 1: 12 in 20 mM Tris and 0.1% bovine serum
albumin, pH = 7.5) before addition to Buffer C. The adenylate kinase converts AMP in
the sample to ADP (equation 2) and subsequently phosphoenolpyruvate and pyruvate
kinase convert ADP to ATP (equation 1).
AMP + ATP adenylate kinase→ 2 ADP (2)
Tubes containing reaction mix C were incubated at 30°C for 90 min. All three tubes
were boiled at 95°C for 3 min to stop reactions and then chilled on ice until assayed
for ATP content. Measurement and calculation of the ATP content was similar to the
procedure described for the ATP assay. Concentrations of ADP and AMP were
obtained by subtracting the results from the appropriate measurements. The energy
charge was calculated as described by Ball and Atkinson (1975; equation 3).
Adenylate energy charge (EC) =[ATP]+ 0.5 [ADP]
[ATP]+ [ADP]+ [AMP] (3)
Assay application
Experiment 4: ATP and Energy charge in spermatozoa of hypothermic stored
semen samples
Boar spermatozoa are usually preserved in the liquid state at 17°C. During processing
and storage, molecules from membrane-damaged spermatozoa may diffuse from the
intracellular compartment to the medium. The presence of nucleotides in the liquid
phase may be a confounding factor for the determination of ATP content and energy
charge in diluted spermatozoa. Diluted semen samples (n=6) were stored at 17°C and
5°C for 24 h and 72 h. At each time of storage, extender and spermatozoa were
separated by centrifugation of samples through a discontinuous Percoll® gradient with
layers of 70% and 35% Percoll® working solution. Working solutions of Percoll® were
prepared as detailed previously (Henning et al., 2015) While spermatozoa are
by guest on July 8, 2020http://bio.biologists.org/Downloaded from
Bio
logy
Ope
n •
Adv
ance
art
icle
enriched in the pellet of the tube, semen extender stays on top of the 35% Percoll®
layer. The concentration of nucleotides for calculation of the adenylate energy charge
(ATP, ADP and AMP) determined from the pelleted spermatozoa and from the
extender. In addition, the percentage of sperm with intact plasma and acrosome
membranes was determined of pelleted sperm.
After ejaculation, spermatozoa are mixed with the secretions of the accessory sex
glands. Semen and seminal plasma from three of the six boars were assayed for
nucleotide concentrations after isothermic (36°C) separation on a discontinuous
Percoll®.
Percoll® centrifugation
Aliquots of 4 mL extended semen stored at 5 and 17°C or ejaculated semen were
carefully layered over the two step Percoll® gradients (35% and 70%), and tubes were
centrifuged at 300 x g for 10 min followed by 15 min at 750 x g without stopping the
centrifuge. After centrifugation, the supernatants were centrifuged again for 3 min at
3360 x g and checked microscopically to be free of spermatozoa and collected for ATP
and energy charge measurement. The pelleted spermatozoa were gently
resuspended in BTS extender to a final concentration of 20 x 106 sperm ml-1 for
assessment of the percentage of sperm with intact plasma and acrosome membranes,
and measurements of ATP and energy charge.
Assessment of plasma and acrosome membrane integrity
Integrity of plasma and acrosomal membranes was assessed using combined staining
with propidium iodide (PI), FITC-PNA, and Hoechst 33342, respectively. Briefly,
aliquots of 5 µl sample of diluted semen after storage at 5°C and 17°C or from pellets
after Percoll® centrifugation were mixed with 980 μl pre-warmed Hepes-buffered saline
solution (HBS; 137 mM NaCl, 20 mM HEPES, 10 mM glucose, 2.5 mM KOH, 1mg ml-
1 BSA, pH 7.4 at 20°C, 300 ± 5 mOsmol kg-1), 5 μl PI stock solution (1 mg ml-1), 5 μl
FITC-PNA stock solution (600 μg ml-1) and 5 μl Hoechst 33342 stock solution (150 μg
ml-1) and incubated for 5 minutes at 38°C in an incubator. Flow cytometric analysis of
stained samples was performed on a DAKO Galaxy flow cytometer (Dako Cytomation
GmbH, Hamburg, Germany), equipped with a 488 nm blue argon laser (20 mW) and
an HBO-lamp for excitation of the dyes. The HBO excitation spectrum was restricted
with filters to wavelengths between 270 nm and 405 nm (main peak: 365 nm). The
by guest on July 8, 2020http://bio.biologists.org/Downloaded from
Bio
logy
Ope
n •
Adv
ance
art
icle
cytometer was equipped with filters for green (BP 537.5/22.5 nm; FITC), red (LP 630
nm; PI) and blue (BP 465 nm; Hoechst 33342) fluorescence, respectively. The sperm
population was identified by characteristic forward and side scatter distribution
patterns of Hoechst 33342 positive, i.e. DNA-containing, events. Fluorescence
intensities (in logarithmic mode) were collected for 10,000 events per sample, at a rate
of 400 to 800 events s-1. Data were analyzed using FloMax software (Partec GmbH,
Münster, Germany). Spectral overlap was compensated post acquisition.
Statistical analysis
Data were analyzed using Excel (Microsoft Office 2007, Microsoft Corporation,
Washington, United States) and the Statistic Analysis Software (SAS, Version 9.2,
Cary, NC, USA). The sample size was n=6 boars, unless otherwise stated. Data were
tested for normal distribution with a Shapiro-Wilk test. Logarithmic transformation was
applied to nucleotide concentrations in supernatant from semen extender (Experiment
4) to achieve normal distribution. The Student’s t-test for paired observations was used
to compare treatments with normally distributed data (Experiment 2, Experiment 4). If
data could not be transformed into a normal distribution, comparisons were performed
using the Wilcoxon’s signed-rank test (Experiment 1). Measuring agreement between
subsamples processed fresh and frozen after phosphatase inhibition was evaluated
by Bland-Altman-Plot (results for semen samples from experiment 2 and experiment
3 (inter-assay variation) were combined; n=12). Data from semen samples in
experiment 4 were pooled and Pearson’s correlation coefficient was calculated for
selected parameters (n=24). All data in this study are reported as mean ± standard
deviation (s.d.). The significance level was set at P<0.05.
by guest on July 8, 2020http://bio.biologists.org/Downloaded from
Bio
logy
Ope
n •
Adv
ance
art
icle
Acknowledgements
The authors thank Prof. W. Holtz and Prof. M. Gauly for their supervising activities at
the University of Göttingen.
Competing and financial interests
The authors have no competing or financial interests to declare.
Author contributions
HH designed the study with contribution of DW and MS; QTN, UW, and HH performed
the experiments, QTN and HH analysed the data. The manuscript was written by HH,
QTN and DW.
Funding
This study was funded by the Lotus-Erasmus Mundus Action 2 Project (QTN) and the
Association for Bioeconomy Research (FBF e.V., Bonn).
by guest on July 8, 2020http://bio.biologists.org/Downloaded from
Bio
logy
Ope
n •
Adv
ance
art
icle
References
Atkinson, D.E. and Walton, G.M. (1967). Adenosine triphosphate conservation in
metabolic regulation. Rat liver citrate cleavage enzyme. J. Biol. Chem. 242, 3239–
3241.
Ball, W.J. Jr, Atkinson, D.E. (1975). Adenylate energy charge in Saccharomyces
cerevisiae during starvation. J. Bacteriol. 121, 975-982.
Blerkom, J.V., Davis, P.W. and John, L. (1995). ATP content of human oocytes and
developmental potential and outcome after in-vitro fertilization and embryo transfer.
Human Reproduction 10, 415- 424.
Chulavatnatol, M. and Haesungchatern, A. (1977). Stabilization of adenylate energy
charge and its relation to human sperm motility. J. Bio. Chem. 252, 8088- 8091.
Drobnis, E.Z., Crowe, L.M., Berger, T., Anchordoguy, T.J., Overstreet, J.W. and
Crowe, J.H. (1993). Cold shock damage is due to lipid phase transitions in cell
membranes: a demonstration using sperm as a model. J. Exp. Zool. 265, 432–437.
Du Plessis, S.S., Agarwal, A., Mohanty, G. and Van Der Linde, M. (2015). Oxidative
phosphorylation versus glycolysis: what fuel do spermatozoa use? Asian J. Androl.17,
230- 235.
Du Toit, D., Bornman, M.S., Van Der Merwe, M.P., Du Plessis, D.J. and
Oosthuizen, J.M. (1993). Differential sperm motility scoring and sperm ATP
concentrations. Andrology 30, 69- 71.
Dziekońska, A. and Strzeżek, J. (2011). Boar variability affects sperm metabolism
activity in liquid stored semen at 5°. Pol. J. Vet. Sci. 14, 21- 27.
Dziekońska, A., Fraser, L., Majewska, A., Lecewicz, M., Zasiadczyk, L. and
Kordan, W. (2013). Effect of commercial long-term extenders on metabolic activity
and membrane integrity of boar spermatozoa stored at 17°C. Pol. J. Vet. Sci. 16, 517-
525.
Ford, S.R. and Leach, F.R. (1998). Bioluminescent assay of the adenylate energy
charge. Method. Mol. Biol. 102, 69- 81.
Guminska, M., Kedryna, T., Laszczka, A., Godlewski, M., Slawinski, J.,
Fabianczyk, B.S., Kwiecinska, T., Rajfur, Z. and Wierzuchowska, D. (1997).
Changes of ATP level and iron- induced ultra- weak photon emission in bull
by guest on July 8, 2020http://bio.biologists.org/Downloaded from
Bio
logy
Ope
n •
Adv
ance
art
icle
spermatozoa, caused by membrane peroxidation during thermal stress. Quarterly 2,
131- 138.
Guthrie, H.D., Welch, G.R., Theisen, D.D. and Woods, L.C. 3rd. (2011). Effects of
hypothermic storage on intracellular calcium, reactive oxygen species formation,
mitochondrial function, motility, and plasma membrane integrity in striped bass
(Morone saxatilis) sperm. Theriogenology 15, 951-956.
Henning, H. Ngo, T.T., Waberski D. (2015). Centrifugation stress reduces the
responsiveness of spermatozoa to a capacitation stimulus in in vitro-aged semen.
Andrology 3, 834–842.
Ho, H.C. and Suarez, S.S. (2003). Characterization of the intracellular calcium store
at the base of the sperm flagellum that regulates hyperactivated motility. Biol Repro
68, 1590- 1596.
Holm-Hansen, O and Karl, D.M. (1978). Biomass and adenylate energy charge
determination in microbial cell extracts and environmental samples. Methods Enzymol
57, 73- 85.
Johnson, L.A., Weitze K.F., Fiser, P. and Maxwell, W.M.C. (2000). Storage of boar
semen. Anim. Reprod. Sci. 62, 143–172.
Kamp, G., Busselmann, G., Jones, B., Wiesner, N. and Lauterwein, J. (2003).
Energy metabolism and intracellular pH in boar spermatozoa. Reproduction 126, 517-
525.
Lavon, U. and Boursnell, J.C. (1975). The split ejaculate of the boar: Contributions
of the epididymides and seminal vesicles. J. Reprod. Fert. 42, 541-552.
Li, Y., Wang, A., Taya, K. and Li, C.M. (2015). Declining semen quality and steadying
seminal plasma ions in heat-stressed boar model. Reprod Med Biol 14, 171–177.
Long, J.A. and Guthrie, H.D. (2006). Validation of a rapid, large-scale assay to
quantify ATP concentration in spermatozoa. Theriogenology 65, 1620- 1630.
Lopez Rodriguez, A, Rijsselaere, T., Beek, J., Vyt, P., Van Soom, A. and Maes, D.
(2013) Boar seminal plasma components and their relation with semen quality.
Systems Biology in Reproductive Medicine 59, 5-12.
Lundin, A. and Thore, A. (1975). Comparison of methods for extraction of bacterial
adenine nucleotides determined by firefly assay. Appl Microbiol. 30, 713-721.
Lyons, G., Bilgeri, Y.R., Zanzinger, A., Berzin, M. and Mendelsohn, D. (1986).
Extraction and estimation of ATP from human spermatozoa. Andrologia 18, 455-460.
by guest on July 8, 2020http://bio.biologists.org/Downloaded from
Bio
logy
Ope
n •
Adv
ance
art
icle
Mukai, C. and Okumo, M. (2004). Glycolysis plays a major role for adenosine
triphosphate supplementation in mouse sperm flagellar movement. Biol Reprod 71,
540- 547.
Perchec, G., Jeulin, C., Cosson, J., Andre, F. and Billard, R. (1995). Relationship
between sperm ATP content and motility of carp spermatozoa. Cell Science 108, 747-
753.
Schmid, S., Henning, H., Oldenhof, H., Wolkers, W.F., Petrunkina, A. and
Waberski, D. (2013). The specific response to capacitating stimuli is a sensitive
indicator of chilling injury in hypothermically stored boar spermatozoa. Andrology 1,
376-386.
Strzezek, J., Torska, J., Borkowski, K., Glogowski, J., Wysocki, P. and Holody,
D. (1995). The Biochemical Characteristics of Boar Seminal Plasma during High
Ejaculation Frequency. Reprod Dom Anim 30, 77-84.
Travis, A.J., Jorgez, C.J., Merdiushew, T., Jones, B.H., Dess, D.M., Diaz- Cueto,
L., Storey, B.T., Kopf, G.S. and Moss, S.B. (2001). Functional relationships between
capacitation dependent cell signalling and compartmentalized metabolic pathways in
murine spermatozoa. J. Bio. Chem. 276, 7630-7636.
Webster, J.J., Chang, J., Manley, E.R., Spivey, H.O. and Leach, F.R. (1980). Buffer
effects on ATP analysis by firefly luciferase. Analyt .Biochem. 106, 7- 11.
Wen, G., Paul Voroney, R., Schoenau, J.J., Yamamotoa, T. and Chikushi, J.
(2001). Assessment of ionic quenching on soil ATP bioluminescence reaction. Soil
Biol Biochem 33, 1-7.
Wishart, G.J. (1982). Maintenance of ATP concentrations in and of fertilizing ability of
fowl and turkey spermatozoa in vitro. J. Reprod. Fert. 66, 457- 462.
Yang, N.C., Ho, W.M., Chen, Y.H. and Hu, M.L. (2002). A convenient one step
extraction of cellular ATP using boiling water for luciferin- luciferase assay of ATP.
Analyt. Biochem. 306, 323- 327.
Yi, Y.J., Li, Z.H., Kim, E.S., Song, E.S., Kim, H.B., Cong, P.Q., Lee, J.M. and
Park, C.S. (2008). Comparison of motility, acrosome, viability and ATP of boar
sperm with or without cold shock, resistance in liquid semen at 17°C and 4°C, and
frozen- thawed semen. Asian-Aust. J. Anim. Sci. 21, 190- 197.
by guest on July 8, 2020http://bio.biologists.org/Downloaded from
Bio
logy
Ope
n •
Adv
ance
art
icle
Figures
Figure 1. Evaluation of ATP-assay processing variants after phosphatase
inhibition in diluted semen samples.
Immediate ATP extraction (a) = control) was compared with frozen-storage of
subsamples before (b) or after (c) ATP extraction. Subsequent ATP determination
was performed by the luciferin-luciferase reaction. Values are mean ± s.d. (n=11
semen samples). Different superscripts (a-b) indicate significant differences between
treatments (P<0.05, Wilcoxon signed-rank test).
by guest on July 8, 2020http://bio.biologists.org/Downloaded from
Bio
logy
Ope
n •
Adv
ance
art
icle
Figure 2. Comparison of different processing conditions for determination of
ATP concentration by the luciferin-luciferase reaction in diluted boar semen
samples.
Phosphatase inhibition was either performed at room temperature (RT) or on ice. An
aliquot of each sample was immediately further processed and analysed (fresh) while
the other part was stored at -20°C (frozen) before ATP extraction. ATP extraction in
samples was performed with or without a boiling buffer (BB). Different lower case
superscripts (a-d) indicate significant differences between samples (fresh or frozen)
for different treatments and between fresh and frozen samples (P<0.05; Student´s t-
test for paired observations; n=6 boars).
by guest on July 8, 2020http://bio.biologists.org/Downloaded from
Bio
logy
Ope
n •
Adv
ance
art
icle
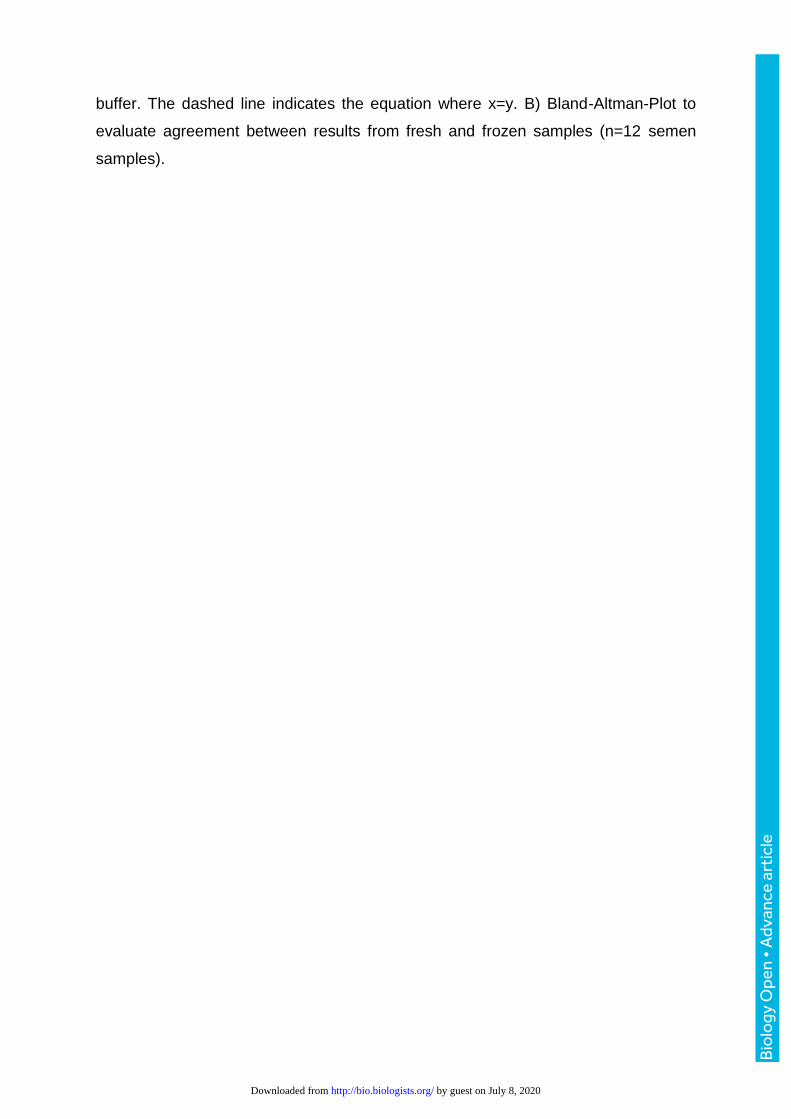
Figure 3. Comparison of ATP content from fresh analysed and frozen-stored
samples.
A) Correlation between the ATP concentration in subsamples of diluted boar semen
after phosphatase inhibition and either immediate ATP extraction (fresh) or ATP
extraction after storage at -20°C (frozen; n=12 semen samples; Pearson´s correlation
coefficient). For all samples, phosphatase inhibition was done on ice with a boiling
by guest on July 8, 2020http://bio.biologists.org/Downloaded from
Bio
logy
Ope
n •
Adv
ance
art
icle
buffer. The dashed line indicates the equation where x=y. B) Bland-Altman-Plot to
evaluate agreement between results from fresh and frozen samples (n=12 semen
samples).
by guest on July 8, 2020http://bio.biologists.org/Downloaded from
Bio
logy
Ope
n •
Adv
ance
art
icle
Figure 4. ATP, ADP and AMP content of boar spermatozoa and medium after
storage of semen in BTS-extender.
Diluted boar semen was stored at 5°C and 17°C (n=6 boars) for 24 h and 72 h.
Spermatozoa (A) and supernatant (B) were separated by centrifugation through a
discontinuous Percoll® gradient before assessment of nucleotides. All values are
mean ± s.d.. Different lower case superscripts (a-b) indicate significant differences in
the concentration of a given nucleotide between storage times (Student´s t-test for
paired observations; P<0.05). Different upper case superscripts (A-B) indicate
by guest on July 8, 2020http://bio.biologists.org/Downloaded from
Bio
logy
Ope
n •
Adv
ance
art
icle
significant differences in the concentration of a given nucleotide between storage
temperatures at a given storage time (Student´s t-test for paired observations;
P<0.05). An asterisk indicates significant differences in ATP, ADP, and AMP
concentration within a sample at a given storage time and temperature (Student´s t-
test for paired observations; P<0.05).
by guest on July 8, 2020http://bio.biologists.org/Downloaded from
Bio
logy
Ope
n •
Adv
ance
art
icle
Figure 5. Flow chart illustrating the design of Experiment 2.
A full description of all steps is given in the section Material and Methods of the
manuscript body.
by guest on July 8, 2020http://bio.biologists.org/Downloaded from

Bio
logy
Ope
n •
Adv
ance
art
icle
by guest on July 8, 2020http://bio.biologists.org/Downloaded from
Bio
logy
Ope
n •
Adv
ance
art
icle
Figure 6. ATP standard curve and changes in light emission over time for ATP
assay.
A) Example of linearity of standard curves with the linear range from 31.25 pmol to
2000 pmol ATP. B) Relative light emission of samples or standard solutions increases
over a time irrespective of the initial starting values. C) Relative changes in light
intensity over time are similar for samples or standard solutions (e.g. 1000 pmol ATP).
by guest on July 8, 2020http://bio.biologists.org/Downloaded from
Bio
logy
Ope
n •
Adv
ance
art
icle
Table 1. Pearson correlation coefficients between the percentage of live, acrosome intact spermatozoa and nucleotide concentrations in spermatozoa and medium.
ATP (pmol/106
sperm)
ADP (pmol/106
sperm)
AMP (pmol/106
sperm)
Energy charge
AMP (pmol)
supernatant from 106 sperm
PI & PNA-FITC negative sperm
(%)
r
p
0.90
<0.001
0.02
n.s.
-0.05
n.s.
0.70
<0.001
-0.85
<0.001 n.s. = not significant
Values for sperm with intact plasma and acrosomal membrane (PI & PNA-FITC
negative) and the amount of ATP, ADP and AMP per 106 sperm were determined from
the sperm pellet after Percoll® centrifugation. Data are combined values of semen
samples diluted in BTS extender after storage at 5°C and 17°C for 24 h and 72 h,
respectively (n=24 semen samples).
by guest on July 8, 2020http://bio.biologists.org/Downloaded from
Bio
logy
Ope
n •
Adv
ance
art
icle
Table 2. Nucleotide content of native sperm and seminal plasma directly after collection.
ATP (pmol/106
sperm)
ADP (pmol/106
sperm)
AMP (pmol/106
sperm)
Total nucleotide content
(pmol/106 sperm)
Energy charge
Sperm
Boar 1 938.5 112.6 34.8 1086.0 0.92
Boar 2 952.7 180.4 45.7 1178.9 0.88
Boar 3 625.2 20.9 98.1 744.3 0.85
Seminal plasma
Boar 1 0 0 20.9 20.9
Boar 2 0 0 0 0
Boar 3 0 4.3 37.2 41.5
by guest on July 8, 2020http://bio.biologists.org/Downloaded from
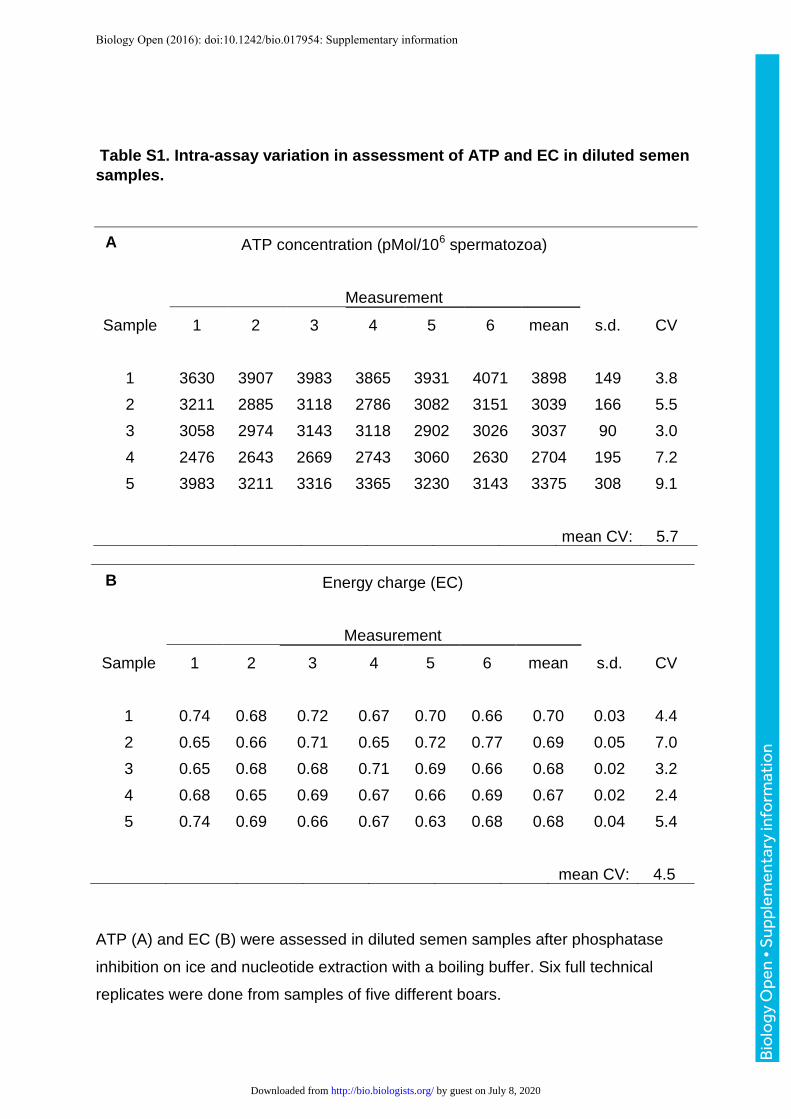
Table S1. Intra-assay variation in assessment of ATP and EC in diluted semen
samples.
ATP concentration (pMol/106 spermatozoa)
Measurement
Sample 1 2 3 4 5 6 mean s.d. CV
1 3630 3907 3983 3865 3931 4071 3898 149 3.8
2 3211 2885 3118 2786 3082 3151 3039 166 5.5
3 3058 2974 3143 3118 2902 3026 3037 90 3.0
4 2476 2643 2669 2743 3060 2630 2704 195 7.2
5 3983 3211 3316 3365 3230 3143 3375 308 9.1
mean CV: 5.7
Energy charge (EC)
Measurement
Sample 1 2 3 4 5 6 mean s.d. CV
1 0.74 0.68 0.72 0.67 0.70 0.66 0.70 0.03 4.4
2 0.65 0.66 0.71 0.65 0.72 0.77 0.69 0.05 7.0
3 0.65 0.68 0.68 0.71 0.69 0.66 0.68 0.02 3.2
4 0.68 0.65 0.69 0.67 0.66 0.69 0.67 0.02 2.4
5 0.74 0.69 0.66 0.67 0.63 0.68 0.68 0.04 5.4
mean CV: 4.5
ATP (A) and EC (B) were assessed in diluted semen samples after phosphatase
inhibition on ice and nucleotide extraction with a boiling buffer. Six full technical
replicates were done from samples of five different boars.
A
B
Bio
logy
Ope
n •
Sup
plem
enta
ry in
form
atio
n
Biology Open (2016): doi:10.1242/bio.017954: Supplementary information
by guest on July 8, 2020http://bio.biologists.org/Downloaded from
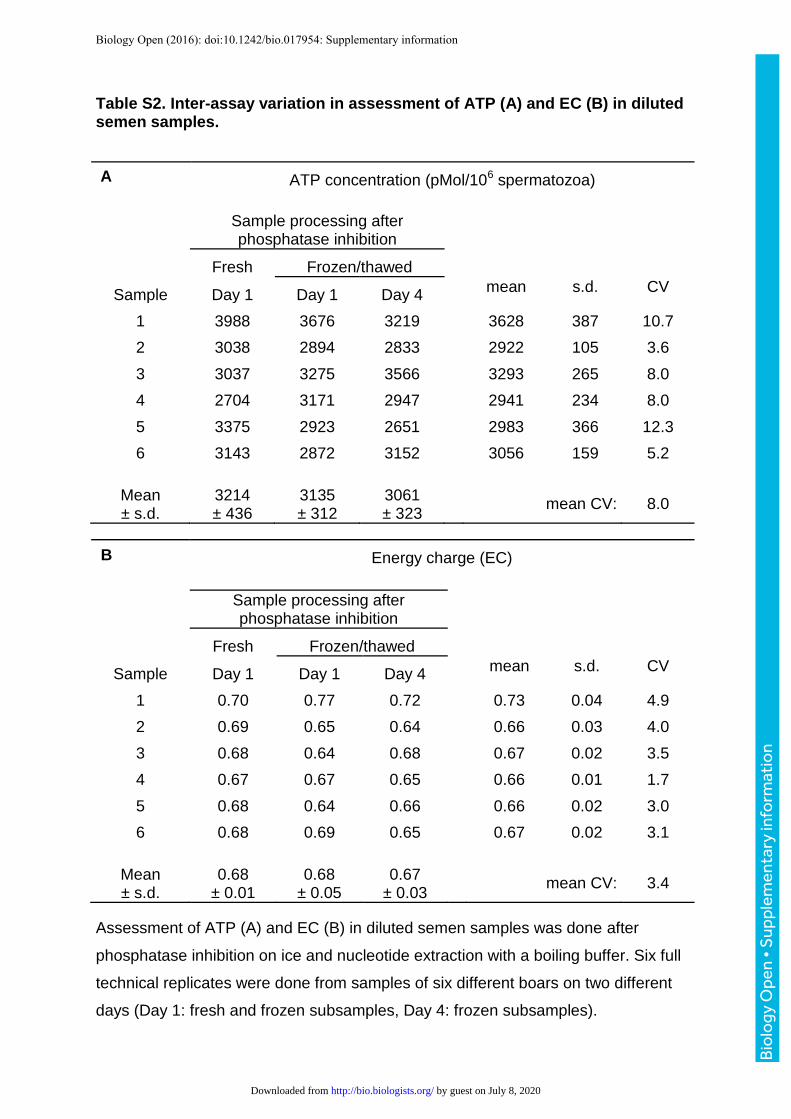
Table S2. Inter-assay variation in assessment of ATP (A) and EC (B) in diluted semen samples.
ATP concentration (pMol/106 spermatozoa)
Sample processing after phosphatase inhibition
Fresh Frozen/thawed
Sample Day 1 Day 1 Day 4 mean s.d. CV
1 3988 3676 3219
3628 387 10.7
2 3038 2894 2833
2922 105 3.6
3 3037 3275 3566
3293 265 8.0
4 2704 3171 2947
2941 234 8.0
5 3375 2923 2651
2983 366 12.3
6 3143 2872 3152
3056 159 5.2
Mean ± s.d.
3214 ± 436
3135 ± 312
3061 ± 323
mean CV: 8.0
Energy charge (EC)
Sample processing after phosphatase inhibition
Fresh Frozen/thawed
Sample Day 1 Day 1 Day 4 mean s.d. CV
1 0.70 0.77 0.72
0.73 0.04 4.9
2 0.69 0.65 0.64
0.66 0.03 4.0
3 0.68 0.64 0.68
0.67 0.02 3.5
4 0.67 0.67 0.65
0.66 0.01 1.7
5 0.68 0.64 0.66
0.66 0.02 3.0
6 0.68 0.69 0.65
0.67 0.02 3.1
Mean ± s.d.
0.68 ± 0.01
0.68 ± 0.05
0.67 ± 0.03
mean CV: 3.4
Assessment of ATP (A) and EC (B) in diluted semen samples was done after
phosphatase inhibition on ice and nucleotide extraction with a boiling buffer. Six full
technical replicates were done from samples of six different boars on two different
days (Day 1: fresh and frozen subsamples, Day 4: frozen subsamples).
A
B
Bio
logy
Ope
n •
Sup
plem
enta
ry in
form
atio
n
Biology Open (2016): doi:10.1242/bio.017954: Supplementary information
by guest on July 8, 2020http://bio.biologists.org/Downloaded from