Embed Size (px)
Citation preview
February 2009
ENERGY MODELING REPORT
Energy Performance Comparison of
Warehouse Heating Systems
Prepared for Cambridge Engineering, Inc.
By Roger L. Hedrick Principal Engineer
GARD Analytics, Inc. Arlington Heights, IL
February 2009
Contents GARD Analytics Cover Page Introduction 1 Approach 1-2
Warehouse Description 2-7 HVAC Systems 7-11 EnergyPlus Modeling 11-14 Results 14-18 Conclusions 18
Consulting Firm GARD Analytics is an experienced consulting and testing service. They do evaluations of technologies for providing energy efficient heating services to buildings. GARD was on the team that helped the U.S. Dept. of Energy (DOE) develop and test the internationally recognized EnergyPlus energy simulation software used for this project. Roger L. Hedrick – Report Author - GARD Principal Engineer - B.S. Mechanical Engineering - Master of Environmental Engineering - ASHRAE 62.1 Standing Standards Subcommittee member
Energy Modeling Software EnergyPlus energy modeling software meets the requirements of the U.S Green Building Council (USGBC) for determining LEED energy credit points. It conforms to the modeling requirements of ASHRAE Standard 90.1 and is an IRS approved energy modeling software for obtaining Energy Policy Act (EPAct) federal tax deductions.
Objective Use energy modeling to determine what type of warehouse heating system is the most energy efficient for both LEED and Non-LEED warehouse facilities. Provide an energy modeling basis for obtaining energy points on LEED projects and EPAct federal tax deductions for warehouse heating equipment.
Problem Statement Heating and ventilating large warehouses and other large industrial-type spaces require heating systems which are quite distinct from those used in typical commercial or institutional buildings. There was no known published energy modeling information that compares all six commonly used warehouse heating systems to the system prescribed by Appendix G of ASHRAE 90.1 which is the baseline used to obtain LEED energy points and tax deductions for warehouse buildings.
Solution Use EnergyPlus energy modeling software to analyze the energy performance of each different heating system in a generic warehouse, modeled to comply with the requirements of ASHRAE 90.1-2004 and ASHRAE 62.1-2007.
Summary Energy modeling results from this analysis found the high temperature rise, direct gas-fired “blow-thru” type space heating system used the least amount of total energy for all cases. Results for a typical LEED warehouse were 23.9% to 59.0% annual gas savings versus all other warehouse heating systems. This is attributed to its high combustion efficiency and dual 160°F maximum temperature rise/discharge temperature capability.
Energy Performance of Warehouse Heating Systems
Simulation Analysis Using EnergyPlus
Prepared by
Roger L. Hedrick
GARD Analytics, Inc.
115 S. Wilke Road, Ste 105
Arlington Heights, IL 60005-1500
GARD Project No. CAM365
For
Cambridge Engineering, Inc.
760 Long Road Crossing Dr.
Chesterfield, MO 63005
February 2009
GARD Analytics, Inc. 1 February 2009
Energy Performance of Warehouse Heating Systems
Simulation Analysis Using EnergyPlus
By For
Roger Hedrick Cambridge Engineering
GARD Analytics, Inc. February 2009
Introduction
The heating/ventilating of warehouses and other large industrial-type spaces usually
requires systems which are quite distinct from the equipment used in typical commercial
or institutional buildings. Commonly, these spaces use dedicated heating equipment, of
which there are several competing types. This report describes an analysis of the energy
performance of six different heating system types used in a generic warehouse. The
warehouse and the heating systems were modeled to comply with the requirements of
ASHRAE Standard 90.1-2004 and ASHRAE Standard 62.1-2007 as required by LEED-
NC 2.2 and LEED-CS 2.0. In addition, a seventh heating system, that prescribed by
Appendix G of ASHRAE Standard 90.1-2004 is analyzed, as this is the baseline heating
system used for obtaining LEED energy credits for a warehouse facility. This system is a
VAV system with hot water reheat coils served by natural gas boilers.
The goal of this analysis is to determine which heating system is the most energy
efficient for both LEED and non-LEED warehouse facilities. Energy modeling results
from this study found the direct gas fired blow-thru type heating system used the least
amount of total energy in all the cases included in the analysis.
Approach
The energy performance of various heating systems was modeled using the EnergyPlus
energy modeling software (version 3.0.0.013). This software has been developed by the
Department of Energy (DOE), and offers simultaneous calculation of envelope and space
loads and simulation of the HVAC equipment. EnergyPlus meets the requirements of the
U.S. Green Building Council (USGBC) as energy modeling software that is appropriate
for determining LEED energy credit points.
A 200,000 ft generic warehouse located in Columbus, Ohio was developed for this
study. Additional details of the modeled warehouse are provided below. The six heating
systems to be modeled were selected as being representative of the systems typically used
in warehouse applications. Cambridge Engineering, a leading manufacturer of warehouse
heating equipment, was used as a resource for this project.
For these building types, cooling is normally not provided, at least in the northern tier of
the United States. Additionally, this study was focused on heating systems. For these
reasons, therefore, cooling was not included in the energy analysis.
Simulation Analysis of Warehouse Heating Systems
GARD Analytics, Inc. 2 February 2009
A complicating issue for this analysis is that obtaining a LEED certification of any level
requires that the provisions of ASHRAE Standard 62.1 be met. The primary difficulty
here is that the standard requires a continuous supply of ventilation air (at 0.06 cfm/ft )
during periods of occupancy. An additional LEED credit (point) can also be obtained by
increasing ventilation air another 30% (to 0.78 cfm/ft ). This differs from common
practice in warehouses, where ventilation air is provided through infiltration, open
overhead doors, and as an adjunct to the operation of some heating system types. This
study therefore includes modeling for the following three ventilation requirements:
1. 100% minimum ventilation of 0.06 cfm/ft per ASHRAE Standard 62.1;
2. 130% (0.78 cfm/ft ) for additional LEED credit;
3. Zero minimum mechanical ventilation with outdoor air provided to simulate
common practice for non-LEED certified buildings.
Warehouse Description
Geometry
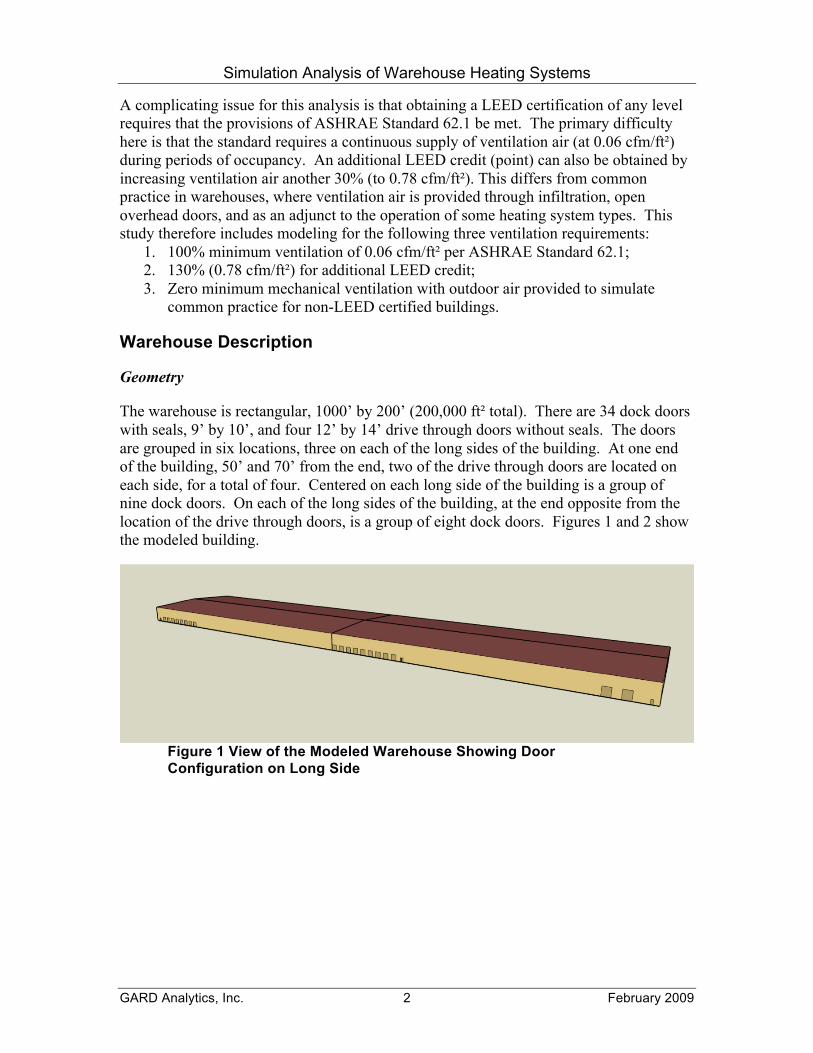
The warehouse is rectangular, 1000’ by 200’ (200,000 ft total). There are 34 dock doors
with seals, 9’ by 10’, and four 12’ by 14’ drive through doors without seals. The doors
are grouped in six locations, three on each of the long sides of the building. At one end
of the building, 50’ and 70’ from the end, two of the drive through doors are located on
each side, for a total of four. Centered on each long side of the building is a group of
nine dock doors. On each of the long sides of the building, at the end opposite from the
location of the drive through doors, is a group of eight dock doors. Figures 1 and 2 show
the modeled building.
Figure 1 View of the Modeled Warehouse Showing Door
Configuration on Long Side
Simulation Analysis of Warehouse Heating Systems
GARD Analytics, Inc. 3 February 2009
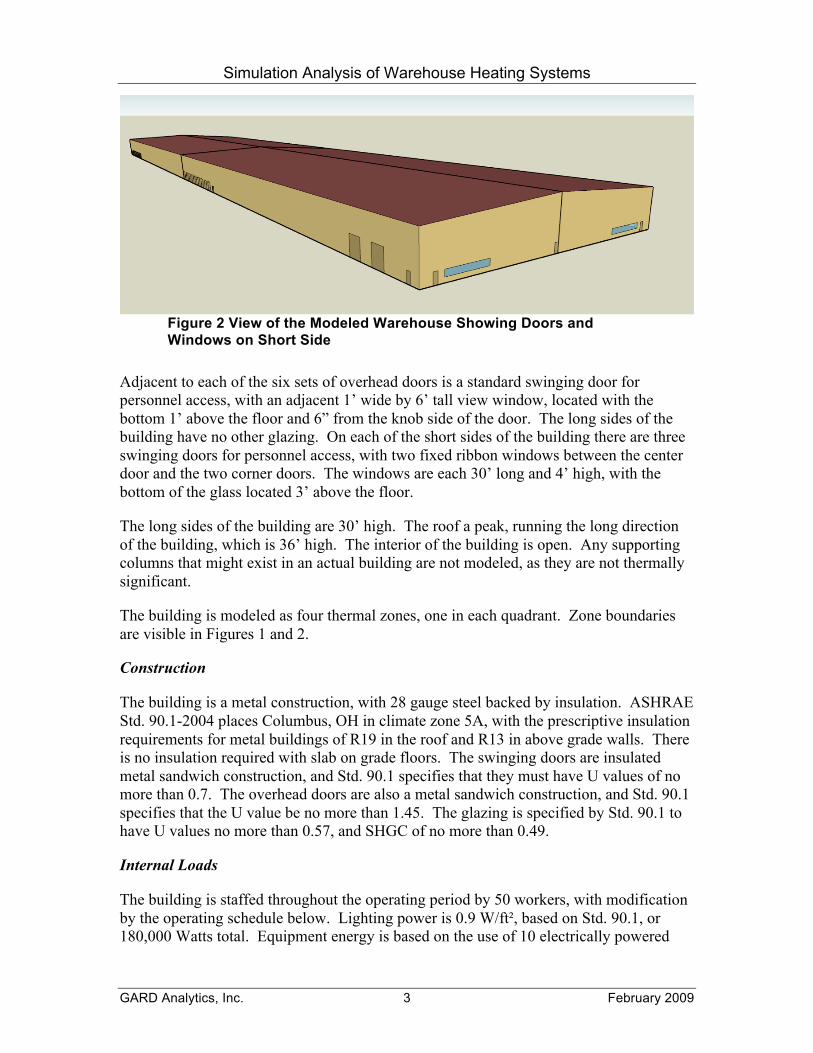
Figure 2 View of the Modeled Warehouse Showing Doors and
Windows on Short Side
Adjacent to each of the six sets of overhead doors is a standard swinging door for
personnel access, with an adjacent 1’ wide by 6’ tall view window, located with the
bottom 1’ above the floor and 6” from the knob side of the door. The long sides of the
building have no other glazing. On each of the short sides of the building there are three
swinging doors for personnel access, with two fixed ribbon windows between the center
door and the two corner doors. The windows are each 30’ long and 4’ high, with the
bottom of the glass located 3’ above the floor.
The long sides of the building are 30’ high. The roof a peak, running the long direction
of the building, which is 36’ high. The interior of the building is open. Any supporting
columns that might exist in an actual building are not modeled, as they are not thermally
significant.
The building is modeled as four thermal zones, one in each quadrant. Zone boundaries
are visible in Figures 1 and 2.
Construction
The building is a metal construction, with 28 gauge steel backed by insulation. ASHRAE
Std. 90.1-2004 places Columbus, OH in climate zone 5A, with the prescriptive insulation
requirements for metal buildings of R19 in the roof and R13 in above grade walls. There
is no insulation required with slab on grade floors. The swinging doors are insulated
metal sandwich construction, and Std. 90.1 specifies that they must have U values of no
more than 0.7. The overhead doors are also a metal sandwich construction, and Std. 90.1
specifies that the U value be no more than 1.45. The glazing is specified by Std. 90.1 to
have U values no more than 0.57, and SHGC of no more than 0.49.
Internal Loads
The building is staffed throughout the operating period by 50 workers, with modification
by the operating schedule below. Lighting power is 0.9 W/ft , based on Std. 90.1, or
180,000 Watts total. Equipment energy is based on the use of 10 electrically powered
Simulation Analysis of Warehouse Heating Systems
GARD Analytics, Inc. 4 February 2009
forklifts. Energy consumption is based on an NPGA case study which says that a 33 lb
propane tank (for propane powered forklifts) lasts up to 8 hours, therefore an average of
about 6 hours, or approximately 5 lbs/hr is assumed. Propane has a heat value of
approximately 20,000 Btuh/lb, so each propane unit consumes 100,000 Btuh. For electric
units, the efficiency is assumed to be 85%, compared to about 40% for the propane units.
Therefore the electric units consume about 47,058 Btuh (100,000 x 40%/85%), which is
rounded to 50,000 Btuh per unit, or 500,000 Btuh total. This translates to 2.5 Btuh/ft .
Equipment energy consumption is adjusted by the schedule below.
Schedules
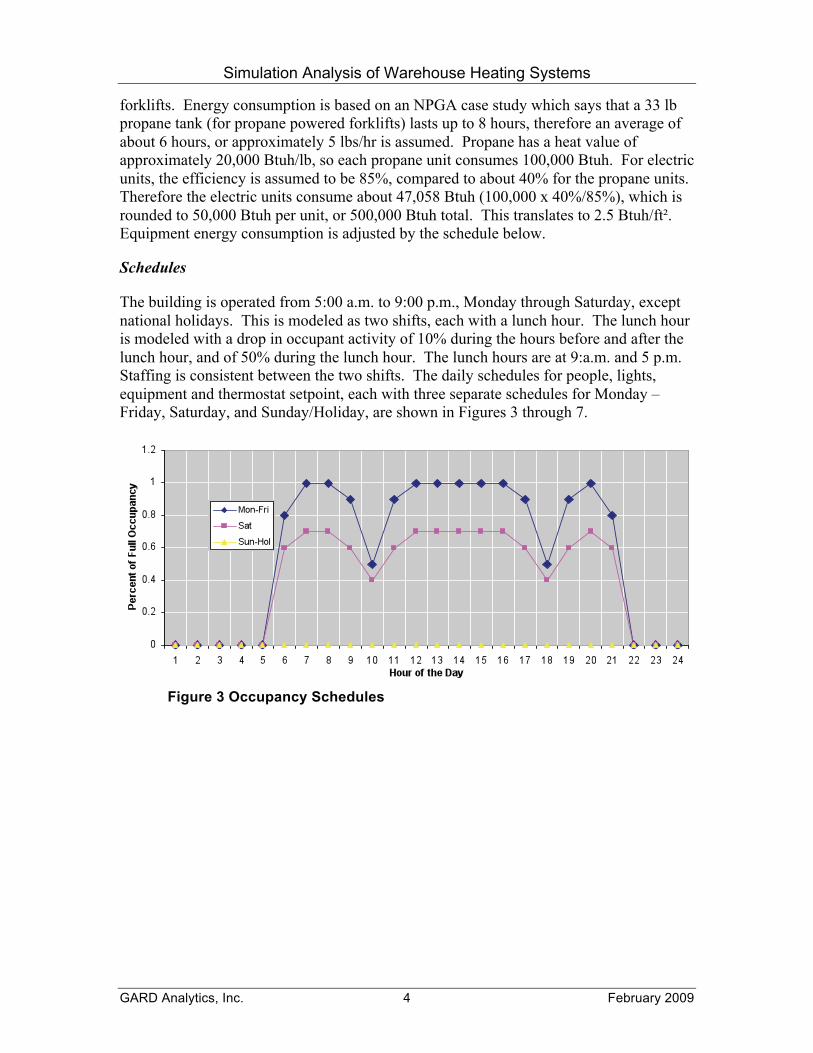
The building is operated from 5:00 a.m. to 9:00 p.m., Monday through Saturday, except
national holidays. This is modeled as two shifts, each with a lunch hour. The lunch hour
is modeled with a drop in occupant activity of 10% during the hours before and after the
lunch hour, and of 50% during the lunch hour. The lunch hours are at 9:a.m. and 5 p.m.
Staffing is consistent between the two shifts. The daily schedules for people, lights,
equipment and thermostat setpoint, each with three separate schedules for Monday –
Friday, Saturday, and Sunday/Holiday, are shown in Figures 3 through 7.
Figure 3 Occupancy Schedules
Simulation Analysis of Warehouse Heating Systems
GARD Analytics, Inc. 5 February 2009
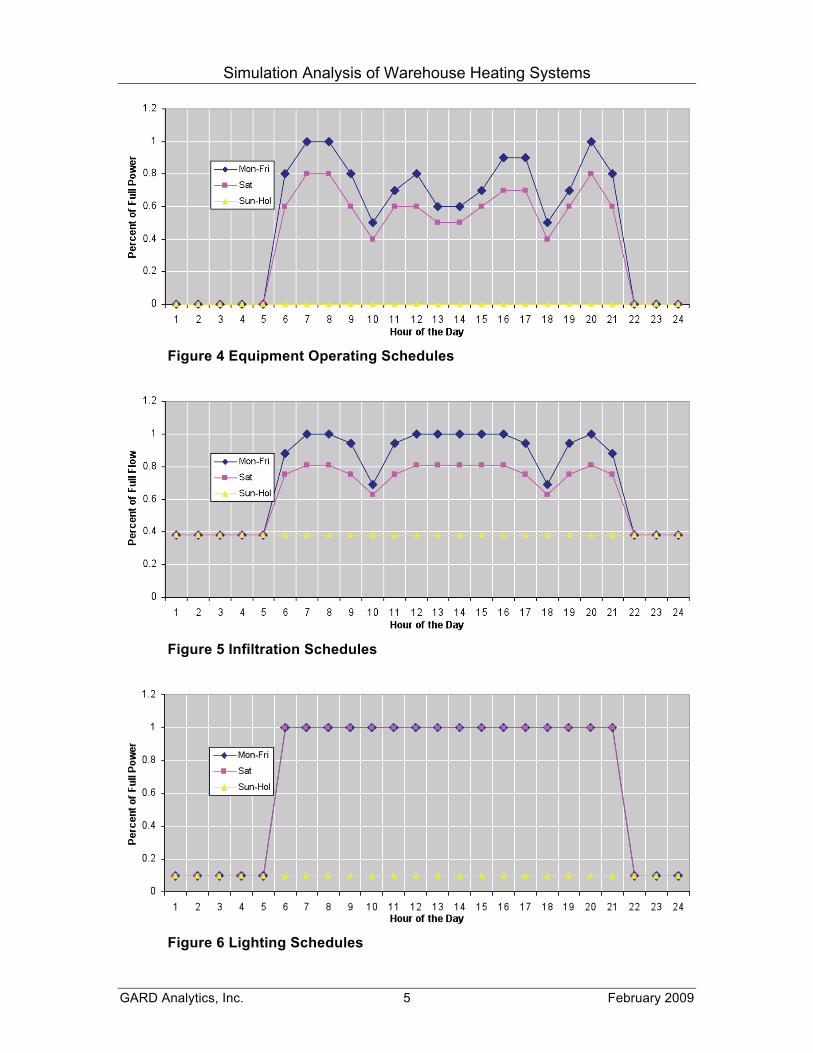
Figure 4 Equipment Operating Schedules
Figure 5 Infiltration Schedules
Figure 6 Lighting Schedules
Simulation Analysis of Warehouse Heating Systems
GARD Analytics, Inc. 6 February 2009
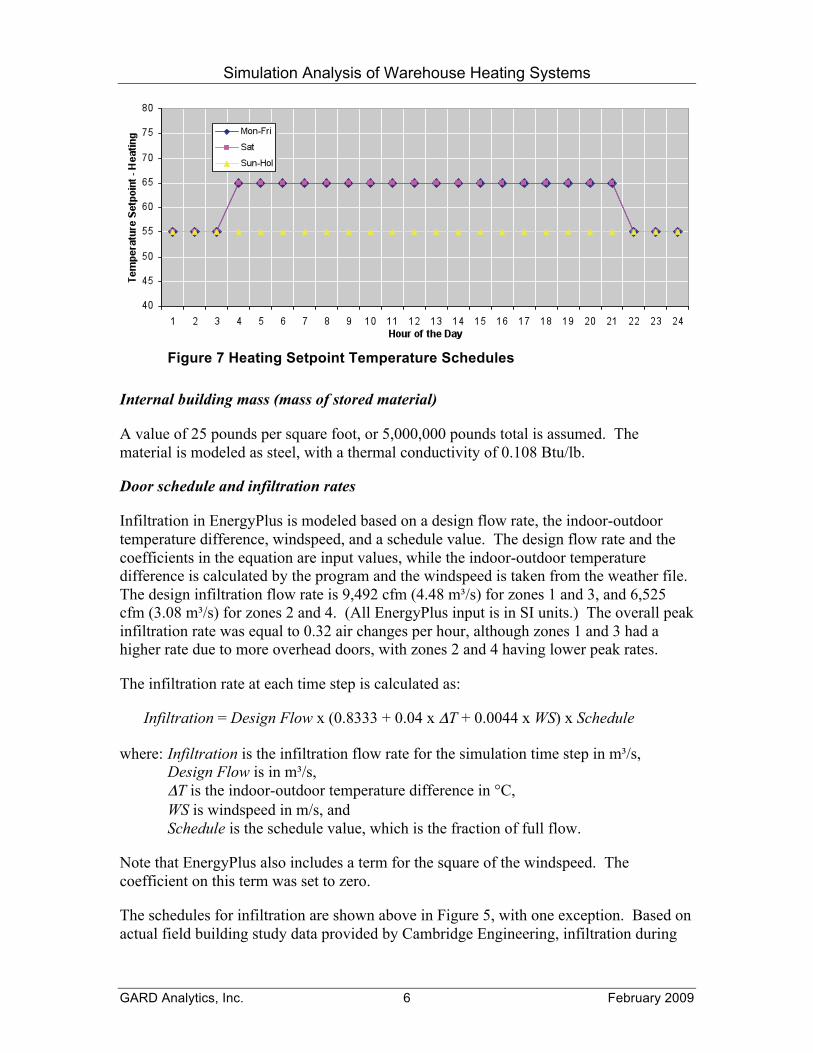
Figure 7 Heating Setpoint Temperature Schedules
Internal building mass (mass of stored material)
A value of 25 pounds per square foot, or 5,000,000 pounds total is assumed. The
material is modeled as steel, with a thermal conductivity of 0.108 Btu/lb.
Door schedule and infiltration rates
Infiltration in EnergyPlus is modeled based on a design flow rate, the indoor-outdoor
temperature difference, windspeed, and a schedule value. The design flow rate and the
coefficients in the equation are input values, while the indoor-outdoor temperature
difference is calculated by the program and the windspeed is taken from the weather file.
The design infiltration flow rate is 9,492 cfm (4.48 m /s) for zones 1 and 3, and 6,525
cfm (3.08 m /s) for zones 2 and 4. (All EnergyPlus input is in SI units.) The overall peak
infiltration rate was equal to 0.32 air changes per hour, although zones 1 and 3 had a
higher rate due to more overhead doors, with zones 2 and 4 having lower peak rates.
The infiltration rate at each time step is calculated as:
Infiltration = Design Flow x (0.8333 + 0.04 x T + 0.0044 x WS) x Schedule
where: Infiltration is the infiltration flow rate for the simulation time step in m /s,
Design Flow is in m /s,
T is the indoor-outdoor temperature difference in °C,
WS is windspeed in m/s, and
Schedule is the schedule value, which is the fraction of full flow.
Note that EnergyPlus also includes a term for the square of the windspeed. The
coefficient on this term was set to zero.
The schedules for infiltration are shown above in Figure 5, with one exception. Based on
actual field building study data provided by Cambridge Engineering, infiltration during
Simulation Analysis of Warehouse Heating Systems
GARD Analytics, Inc. 7 February 2009
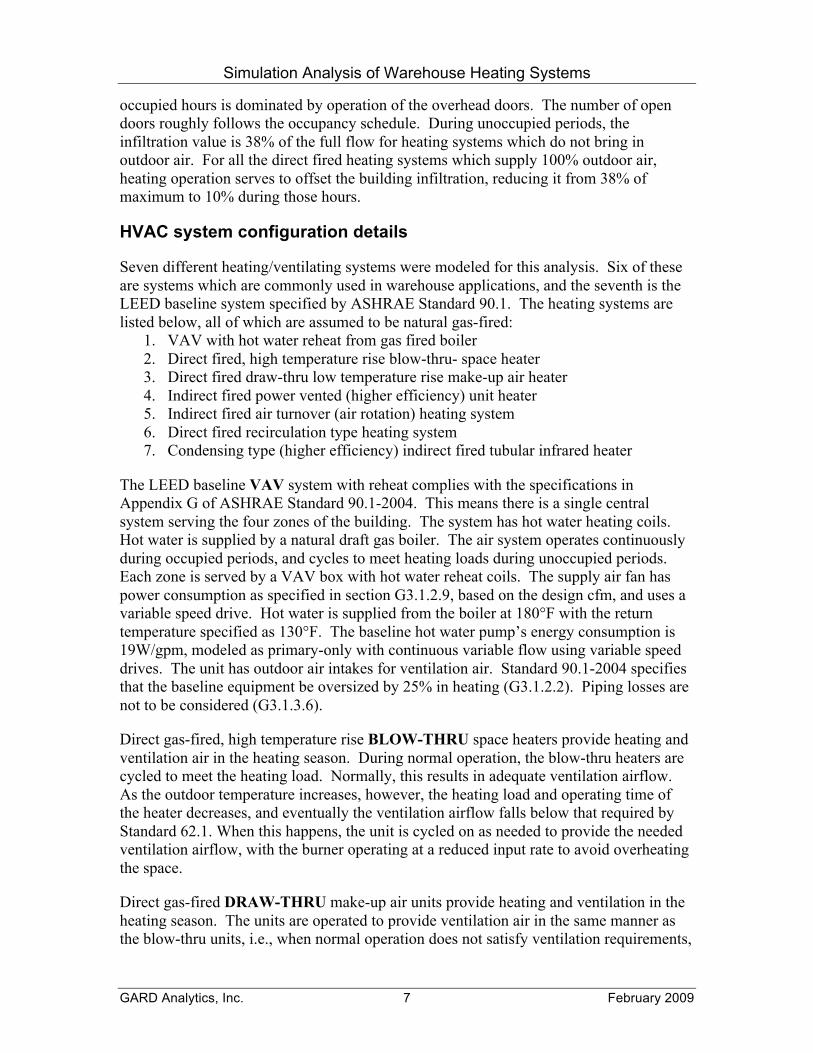
occupied hours is dominated by operation of the overhead doors. The number of open
doors roughly follows the occupancy schedule. During unoccupied periods, the
infiltration value is 38% of the full flow for heating systems which do not bring in
outdoor air. For all the direct fired heating systems which supply 100% outdoor air,
heating operation serves to offset the building infiltration, reducing it from 38% of
maximum to 10% during those hours.
HVAC system configuration details
Seven different heating/ventilating systems were modeled for this analysis. Six of these
are systems which are commonly used in warehouse applications, and the seventh is the
LEED baseline system specified by ASHRAE Standard 90.1. The heating systems are
listed below, all of which are assumed to be natural gas-fired:
1. VAV with hot water reheat from gas fired boiler
2. Direct fired, high temperature rise blow-thru- space heater
3. Direct fired draw-thru low temperature rise make-up air heater
4. Indirect fired power vented (higher efficiency) unit heater
5. Indirect fired air turnover (air rotation) heating system
6. Direct fired recirculation type heating system
7. Condensing type (higher efficiency) indirect fired tubular infrared heater
The LEED baseline VAV system with reheat complies with the specifications in
Appendix G of ASHRAE Standard 90.1-2004. This means there is a single central
system serving the four zones of the building. The system has hot water heating coils.
Hot water is supplied by a natural draft gas boiler. The air system operates continuously
during occupied periods, and cycles to meet heating loads during unoccupied periods.
Each zone is served by a VAV box with hot water reheat coils. The supply air fan has
power consumption as specified in section G3.1.2.9, based on the design cfm, and uses a
variable speed drive. Hot water is supplied from the boiler at 180°F with the return
temperature specified as 130°F. The baseline hot water pump’s energy consumption is
19W/gpm, modeled as primary-only with continuous variable flow using variable speed
drives. The unit has outdoor air intakes for ventilation air. Standard 90.1-2004 specifies
that the baseline equipment be oversized by 25% in heating (G3.1.2.2). Piping losses are
not to be considered (G3.1.3.6).
Direct gas-fired, high temperature rise BLOW-THRU space heaters provide heating and
ventilation air in the heating season. During normal operation, the blow-thru heaters are
cycled to meet the heating load. Normally, this results in adequate ventilation airflow.
As the outdoor temperature increases, however, the heating load and operating time of
the heater decreases, and eventually the ventilation airflow falls below that required by
Standard 62.1. When this happens, the unit is cycled on as needed to provide the needed
ventilation airflow, with the burner operating at a reduced input rate to avoid overheating
the space.
Direct gas-fired DRAW-THRU make-up air units provide heating and ventilation in the
heating season. The units are operated to provide ventilation air in the same manner as
the blow-thru units, i.e., when normal operation does not satisfy ventilation requirements,
Simulation Analysis of Warehouse Heating Systems
GARD Analytics, Inc. 8 February 2009
the units are cycled as necessary to provide the required ventilation air, with the burner
cycling as needed to meet the heating load without overheating the space.
Indirect gas-fired UNIT HEATERS cycle to meet the heating load during the heating
season, with indirect fired make-up air heaters operating continuously during occupied
periods to meet the required ventilation airflow. The make-up air heaters are sized to
provide the required ventilation air flow, with the burner sized at the same Btuh/cfm as
the unit heaters. The efficiency of the two units is identical. At low heating loads, the
make-up air heaters’ burners are cycled to just meet the load.
Indirect gas-fired AIR TURNOVER (air rotation) system cycles to meet the heating load
during the heating season. As with the unit heater system, indirect fired make-up air
heaters operate continuously during occupied periods to meet the required ventilation
airflow. Again, the efficiency of the air turnover and make-up air units are identical.
Direct gas-fired RECIRCULATION system provides heating and ventilation in the
heating season. The fan operates continuously during occupied periods, with the gas
input to the burner modulated as appropriate to the heating load. The system in this study
supplies 20% outdoor air and 80% re-circulated air. The continuous fan operation of the
units provides ventilation air in excess of the Standard 62.1 minimum requirement.
Indirect gas-fired, condensing tube INFRARED heaters cycle to meet the heating load
during the heating season, with direct fired make-up air heaters operating continuously
during occupied periods to meet the required ventilation airflow, with the burner cycling
as needed. The heating capacity of the make-up air units is based on bringing the outdoor
air to room neutral temperature at design outdoor temperature.
Warehouses have a minimum ventilation requirement of 0.06 cfm/ft , as set by ASHRAE
Standard 62.1-2007. This translates to a total ventilation requirement of 12,000 cfm
during periods the building is occupied, i.e., 5:00 a.m. to 9:00 p.m., Monday through
Saturday.
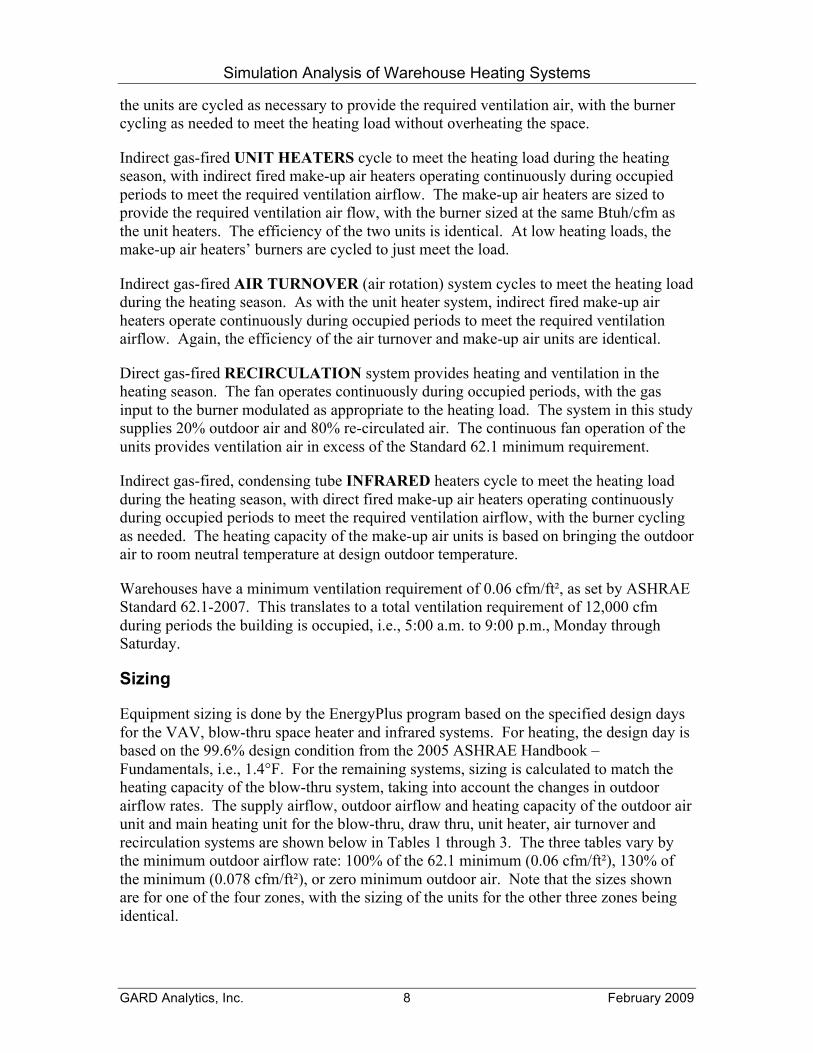
Sizing
Equipment sizing is done by the EnergyPlus program based on the specified design days
for the VAV, blow-thru space heater and infrared systems. For heating, the design day is
based on the 99.6% design condition from the 2005 ASHRAE Handbook –
Fundamentals, i.e., 1.4°F. For the remaining systems, sizing is calculated to match the
heating capacity of the blow-thru system, taking into account the changes in outdoor
airflow rates. The supply airflow, outdoor airflow and heating capacity of the outdoor air
unit and main heating unit for the blow-thru, draw thru, unit heater, air turnover and
recirculation systems are shown below in Tables 1 through 3. The three tables vary by
the minimum outdoor airflow rate: 100% of the 62.1 minimum (0.06 cfm/ft ), 130% of
the minimum (0.078 cfm/ft ), or zero minimum outdoor air. Note that the sizes shown
are for one of the four zones, with the sizing of the units for the other three zones being
identical.
Simulation Analysis of Warehouse Heating Systems
GARD Analytics, Inc. 9 February 2009
Table 1 Equipment Sizing, 62.1 Minimum Outdoor Airflow
(OA)
Blow-Thru Draw-Thru Unit Heater Air Turnover Recirculation
Minimum OA Units Supply CFM 3,000 3,000 3,000 3,000 15,000 OA CFM 3,000 3,000 3,000 3,000 3,000 Heating Capacity (Btuh) 518,400 307,800 210,600 210,600 777,600
Main Heating Units Supply CFM 13,000 47,667 30,400 43,429 28,429 OA CFM 13,000 47,667 0 0 5,686 Heating Capacity (Btuh) 2,246,400 4,890,600 1,641,600 1,641,600 1,473,737
Table 2 Equipment Sizing, 130% of 62.1 Minimum Outdoor
Airflow (OA)
Blow-Thru Draw-Thru Unit Heater Air Turnover Recirculation
Minimum OA Units Supply CFM 3,900 3,900 3,900 3,900 19,500 OA CFM 3,900 3,900 3,900 3,900 3,900 Heating Capacity (Btuh) 673,920 400,140 273,780 273,780 1,010,880
Main Heating Units Supply CFM 12,100 46,767 30,400 43,429 23,929 OA CFM 12,100 46,767 0 0 4,786 Heating Capacity (Btuh) 2,090,880 4,798,260 1,641,600 1,641,600 1,240,457
Table 3 Equipment Sizing, Zero Minimum Outdoor Airflow
(OA)
Blow-Thru Draw-Thru Unit Heater Air Turnover Recirculation
Minimum OA Units Supply CFM 0 0 0 0 0 OA CFM 0 0 0 0 0 Heating Capacity (Btuh) 0 0 0 0 0
Main Heating Units Supply CFM 16,000 50,667 30,400 43,429 43,429 OA CFM 16,000 50,667 0 0 8,686 Heating Capacity (Btuh) 2,764,800 5,198,400 1,641,600 1,641,600 2,251,337
For certain systems, ventilation airflow is based on the heating load. EnergyPlus does not
contain a specific object for direct fired make-up air heaters. However, they can be
simulated by modifying the Packaged Terminal Heat Pump and Packaged Terminal Air
Conditioner objects.
Equipment efficiency and operating characteristics
VAV System:
• Output – max discharge temperature 120°F
• Boiler – efficiency 80%
Simulation Analysis of Warehouse Heating Systems
GARD Analytics, Inc. 10 February 2009
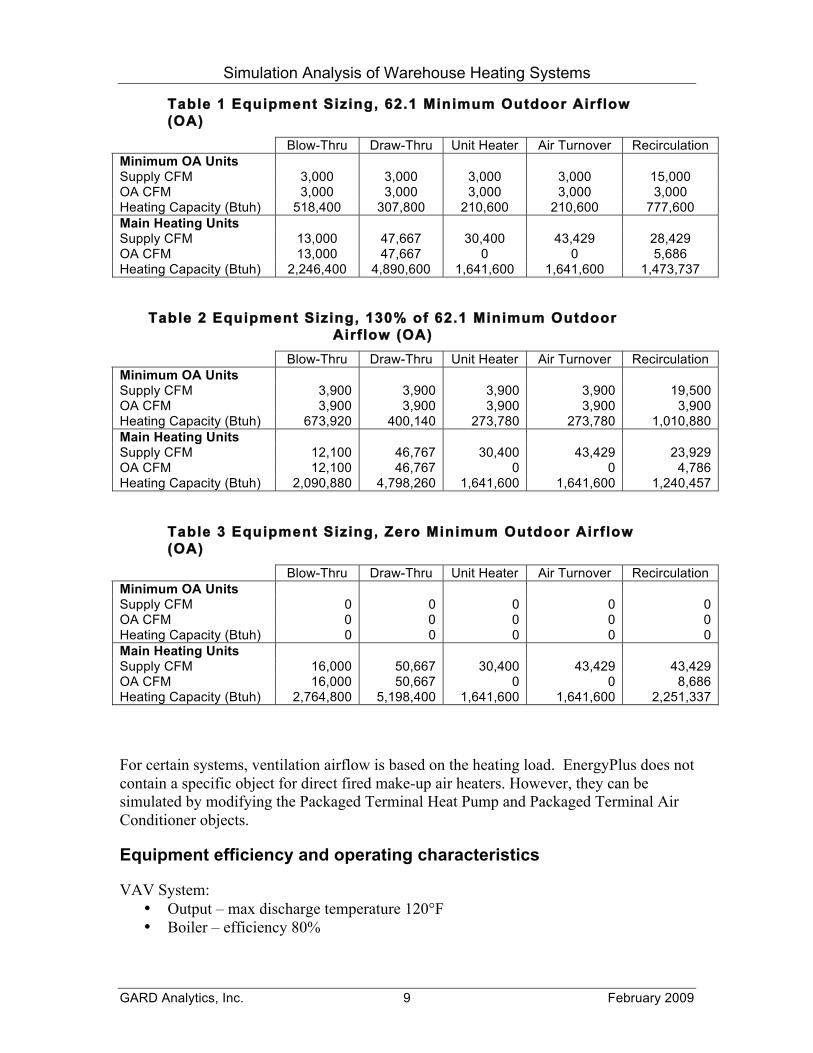
• Blower – Variable speed, modulating control, fan efficiency 52%, motor
efficiency 95%
Direct fired, high temperature rise blow-thru space heaters:
• Output – max discharge temperature 160°F
max temperature rise 160°F
• Burner – variable capacity, modulating control, efficiency 92%
• Blower – single speed, on/off control, fan efficiency 55%, motor efficiency 95%
Direct fired, draw-thru makeup air heaters (lower temperature rise):
• Output – max discharge temperature 95°F
max temperature rise 120°F
• Burner – variable capacity, modulating control, efficiency 92%
• Blower – single speed, on/off control, fan efficiency 55%, motor efficiency 95%
Indirect fired power vented unit heaters:
• Output – max discharge temperature 115°F
max temperature rise 50°F
• Burner – single capacity, on/off control, efficiency 80%
• Blower – single speed, on/off control, fan efficiency 45%, motor efficiency 80%
Indirect fired make-up heater providing ventilation air:
• Output – max temperature rise 65°F
• Burner – single capacity, on/off control, efficiency 80%
• Blower – single speed, on/off control, fan efficiency 45%, motor efficiency 80%
Indirect fired air turnover system:
• Output – max discharge temperature 100°F
max temperature rise 35°F
• Burner – single capacity, on/off control, efficiency 80%
• Blower – single speed, on/off control, fan efficiency 55%, motor efficiency 95%
Indirect fired make-up heater providing ventilation air:
• Output – max temperature rise 65°F
• Burner – single capacity, on/off control, efficiency 80%
• Blower – single speed, on/off control, fan efficiency 45%, motor efficiency 80%
Direct fired recirculation system:
• Output – max discharge temperature 100°F
max equivalent temperature rise 49°F (required by ANSI Safety
Standard Z83.18)
• Burner – variable capacity, modulating control, efficiency 92%
• Blower – single speed, on/off control, fan efficiency 55%, motor efficiency 95%
Indirect fired, condensing infrared tube heaters:
• Output – autosized by EnergyPlus program to meet heating load
• Burner – single capacity, on/off control, efficiency 92% (higher efficiency is due
to condensing design)
• Blower – none
Simulation Analysis of Warehouse Heating Systems
GARD Analytics, Inc. 11 February 2009
Direct fired make-up air heater providing ventilation air:
• Output – max temperature rise 65°F
• Burner – single capacity, on/off control, efficiency 92%
• Blower – single speed, on/off control, fan efficiency 55%, motor efficiency 95%
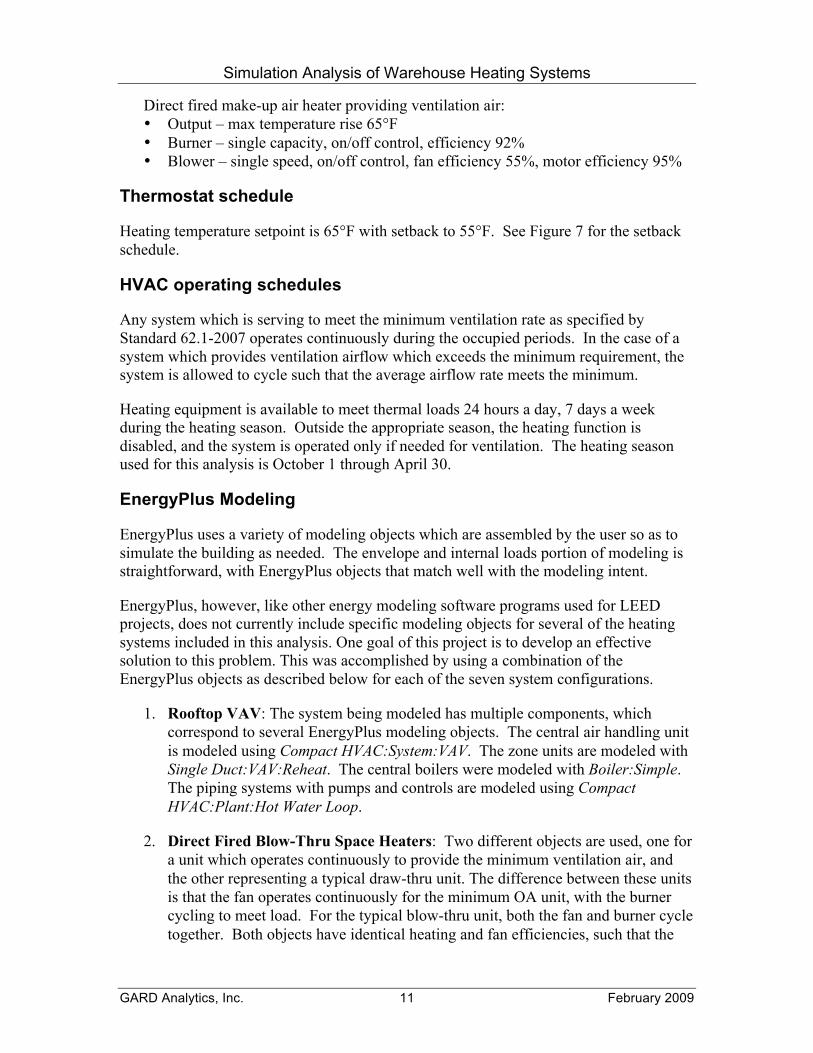
Thermostat schedule
Heating temperature setpoint is 65°F with setback to 55°F. See Figure 7 for the setback
schedule.
HVAC operating schedules
Any system which is serving to meet the minimum ventilation rate as specified by
Standard 62.1-2007 operates continuously during the occupied periods. In the case of a
system which provides ventilation airflow which exceeds the minimum requirement, the
system is allowed to cycle such that the average airflow rate meets the minimum.
Heating equipment is available to meet thermal loads 24 hours a day, 7 days a week
during the heating season. Outside the appropriate season, the heating function is
disabled, and the system is operated only if needed for ventilation. The heating season
used for this analysis is October 1 through April 30.
EnergyPlus Modeling
EnergyPlus uses a variety of modeling objects which are assembled by the user so as to
simulate the building as needed. The envelope and internal loads portion of modeling is
straightforward, with EnergyPlus objects that match well with the modeling intent.
EnergyPlus, however, like other energy modeling software programs used for LEED
projects, does not currently include specific modeling objects for several of the heating
systems included in this analysis. One goal of this project is to develop an effective
solution to this problem. This was accomplished by using a combination of the
EnergyPlus objects as described below for each of the seven system configurations.
1. Rooftop VAV: The system being modeled has multiple components, which
correspond to several EnergyPlus modeling objects. The central air handling unit
is modeled using Compact HVAC:System:VAV. The zone units are modeled with
Single Duct:VAV:Reheat. The central boilers were modeled with Boiler:Simple.
The piping systems with pumps and controls are modeled using Compact
HVAC:Plant:Hot Water Loop.
2. Direct Fired Blow-Thru Space Heaters: Two different objects are used, one for
a unit which operates continuously to provide the minimum ventilation air, and
the other representing a typical draw-thru unit. The difference between these units
is that the fan operates continuously for the minimum OA unit, with the burner
cycling to meet load. For the typical blow-thru unit, both the fan and burner cycle
together. Both objects have identical heating and fan efficiencies, such that the
Simulation Analysis of Warehouse Heating Systems
GARD Analytics, Inc. 12 February 2009
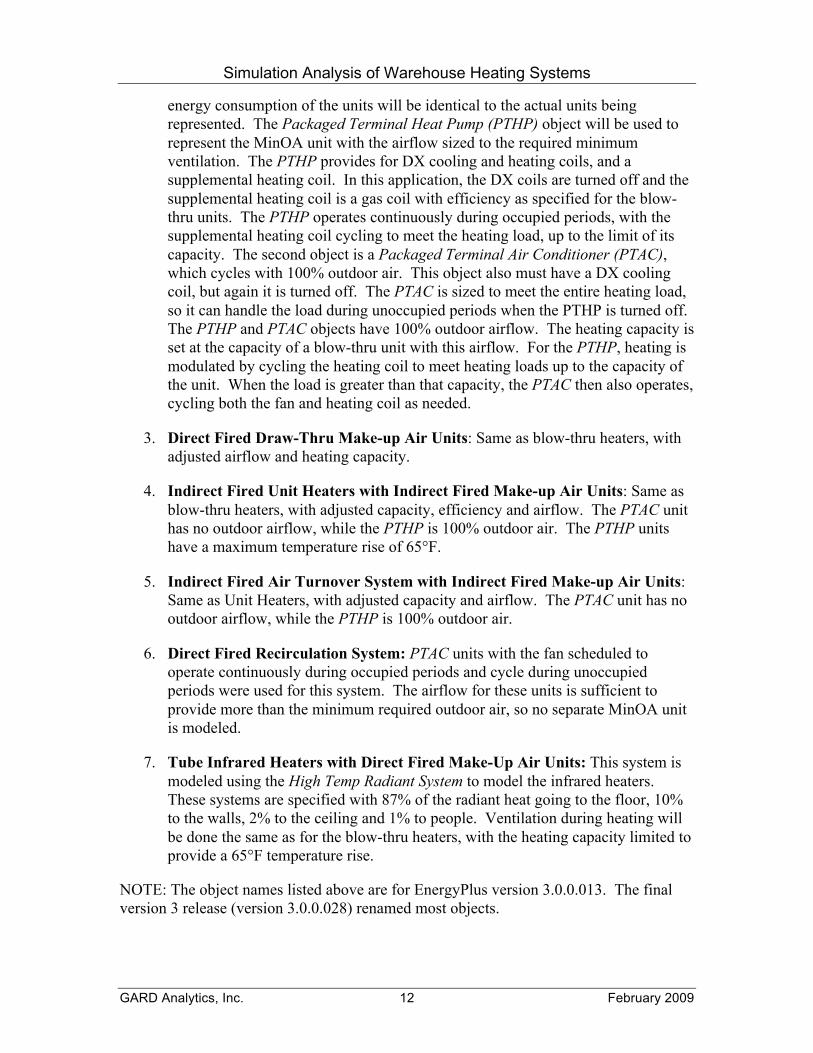
energy consumption of the units will be identical to the actual units being
represented. The Packaged Terminal Heat Pump (PTHP) object will be used to
represent the MinOA unit with the airflow sized to the required minimum
ventilation. The PTHP provides for DX cooling and heating coils, and a
supplemental heating coil. In this application, the DX coils are turned off and the
supplemental heating coil is a gas coil with efficiency as specified for the blow-
thru units. The PTHP operates continuously during occupied periods, with the
supplemental heating coil cycling to meet the heating load, up to the limit of its
capacity. The second object is a Packaged Terminal Air Conditioner (PTAC),
which cycles with 100% outdoor air. This object also must have a DX cooling
coil, but again it is turned off. The PTAC is sized to meet the entire heating load,
so it can handle the load during unoccupied periods when the PTHP is turned off.
The PTHP and PTAC objects have 100% outdoor airflow. The heating capacity is
set at the capacity of a blow-thru unit with this airflow. For the PTHP, heating is
modulated by cycling the heating coil to meet heating loads up to the capacity of
the unit. When the load is greater than that capacity, the PTAC then also operates,
cycling both the fan and heating coil as needed.
3. Direct Fired Draw-Thru Make-up Air Units: Same as blow-thru heaters, with
adjusted airflow and heating capacity.
4. Indirect Fired Unit Heaters with Indirect Fired Make-up Air Units: Same as
blow-thru heaters, with adjusted capacity, efficiency and airflow. The PTAC unit
has no outdoor airflow, while the PTHP is 100% outdoor air. The PTHP units
have a maximum temperature rise of 65°F.
5. Indirect Fired Air Turnover System with Indirect Fired Make-up Air Units:
Same as Unit Heaters, with adjusted capacity and airflow. The PTAC unit has no
outdoor airflow, while the PTHP is 100% outdoor air.
6. Direct Fired Recirculation System: PTAC units with the fan scheduled to
operate continuously during occupied periods and cycle during unoccupied
periods were used for this system. The airflow for these units is sufficient to
provide more than the minimum required outdoor air, so no separate MinOA unit
is modeled.
7. Tube Infrared Heaters with Direct Fired Make-Up Air Units: This system is
modeled using the High Temp Radiant System to model the infrared heaters.
These systems are specified with 87% of the radiant heat going to the floor, 10%
to the walls, 2% to the ceiling and 1% to people. Ventilation during heating will
be done the same as for the blow-thru heaters, with the heating capacity limited to
provide a 65°F temperature rise.
NOTE: The object names listed above are for EnergyPlus version 3.0.0.013. The final
version 3 release (version 3.0.0.028) renamed most objects.
Simulation Analysis of Warehouse Heating Systems
GARD Analytics, Inc. 13 February 2009
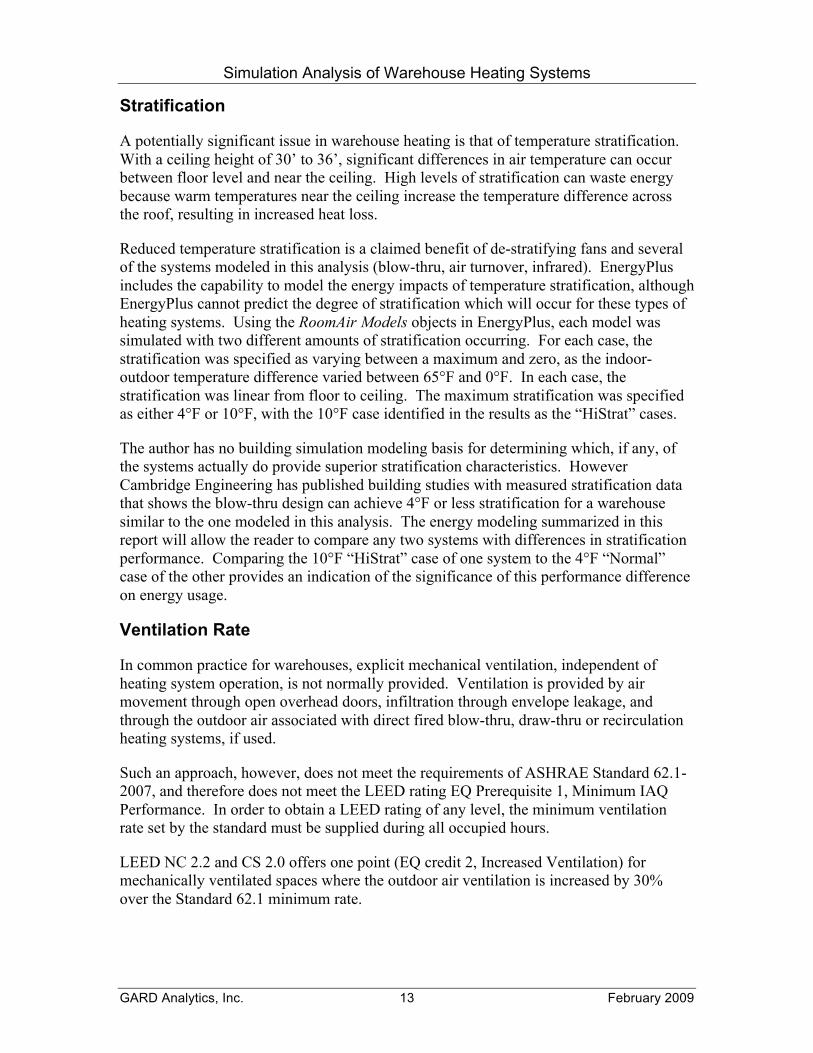
Stratification
A potentially significant issue in warehouse heating is that of temperature stratification.
With a ceiling height of 30’ to 36’, significant differences in air temperature can occur
between floor level and near the ceiling. High levels of stratification can waste energy
because warm temperatures near the ceiling increase the temperature difference across
the roof, resulting in increased heat loss.
Reduced temperature stratification is a claimed benefit of de-stratifying fans and several
of the systems modeled in this analysis (blow-thru, air turnover, infrared). EnergyPlus
includes the capability to model the energy impacts of temperature stratification, although
EnergyPlus cannot predict the degree of stratification which will occur for these types of
heating systems. Using the RoomAir Models objects in EnergyPlus, each model was
simulated with two different amounts of stratification occurring. For each case, the
stratification was specified as varying between a maximum and zero, as the indoor-
outdoor temperature difference varied between 65°F and 0°F. In each case, the
stratification was linear from floor to ceiling. The maximum stratification was specified
as either 4°F or 10°F, with the 10°F case identified in the results as the “HiStrat” cases.
The author has no building simulation modeling basis for determining which, if any, of
the systems actually do provide superior stratification characteristics. However
Cambridge Engineering has published building studies with measured stratification data
that shows the blow-thru design can achieve 4°F or less stratification for a warehouse
similar to the one modeled in this analysis. The energy modeling summarized in this
report will allow the reader to compare any two systems with differences in stratification
performance. Comparing the 10°F “HiStrat” case of one system to the 4°F “Normal”
case of the other provides an indication of the significance of this performance difference
on energy usage.
Ventilation Rate
In common practice for warehouses, explicit mechanical ventilation, independent of
heating system operation, is not normally provided. Ventilation is provided by air
movement through open overhead doors, infiltration through envelope leakage, and
through the outdoor air associated with direct fired blow-thru, draw-thru or recirculation
heating systems, if used.
Such an approach, however, does not meet the requirements of ASHRAE Standard 62.1-
2007, and therefore does not meet the LEED rating EQ Prerequisite 1, Minimum IAQ
Performance. In order to obtain a LEED rating of any level, the minimum ventilation
rate set by the standard must be supplied during all occupied hours.
LEED NC 2.2 and CS 2.0 offers one point (EQ credit 2, Increased Ventilation) for
mechanically ventilated spaces where the outdoor air ventilation is increased by 30%
over the Standard 62.1 minimum rate.
Simulation Analysis of Warehouse Heating Systems
GARD Analytics, Inc. 14 February 2009
Potentially, warehouses may be built under any of these scenarios. Accordingly, each of
the heating systems described have been simulated with three ventilation rate scenarios:
0% of the minimum ventilation rate, 100%, and 130%. The exceptions are for the VAV
system and the recirculation system. The VAV system is included in this analysis
because it forms the baseline for energy comparison for meeting EA Prerequisite 2,
Minimum Energy Performance, and obtaining any of the points available under EA
Credit 1, Optimize Energy Performance. Accordingly, it would be nonsensical to apply a
VAV system without meeting the Standard 62.1 ventilation requirements. The
recirculation system, on the other hand, operates the fan continuously during occupied
periods, and provides ventilation which exceeds all three minimum levels.
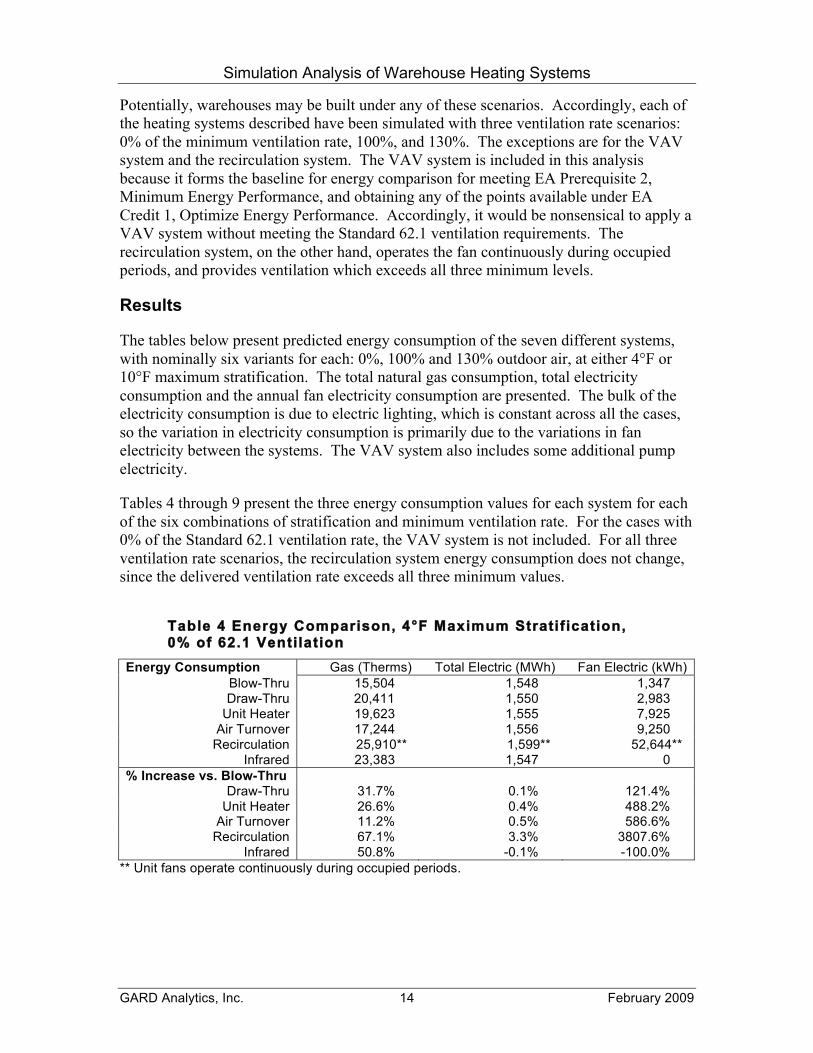
Results
The tables below present predicted energy consumption of the seven different systems,
with nominally six variants for each: 0%, 100% and 130% outdoor air, at either 4°F or
10°F maximum stratification. The total natural gas consumption, total electricity
consumption and the annual fan electricity consumption are presented. The bulk of the
electricity consumption is due to electric lighting, which is constant across all the cases,
so the variation in electricity consumption is primarily due to the variations in fan
electricity between the systems. The VAV system also includes some additional pump
electricity.
Tables 4 through 9 present the three energy consumption values for each system for each
of the six combinations of stratification and minimum ventilation rate. For the cases with
0% of the Standard 62.1 ventilation rate, the VAV system is not included. For all three
ventilation rate scenarios, the recirculation system energy consumption does not change,
since the delivered ventilation rate exceeds all three minimum values.
Table 4 Energy Comparison, 4°F Maximum Stratification, 0% of 62.1 Ventilation
Energy Consumption Gas (Therms) Total Electric (MWh) Fan Electric (kWh)
Blow-Thru 15,504 1,548 1,347 Draw-Thru 20,411 1,550 2,983
Unit Heater 19,623 1,555 7,925 Air Turnover 17,244 1,556 9,250
Recirculation 25,910** 1,599** 52,644** Infrared 23,383 1,547 0
% Increase vs. Blow-Thru Draw-Thru 31.7% 0.1% 121.4%
Unit Heater 26.6% 0.4% 488.2% Air Turnover 11.2% 0.5% 586.6%
Recirculation 67.1% 3.3% 3807.6% Infrared 50.8% -0.1% -100.0%
** Unit fans operate continuously during occupied periods.
Simulation Analysis of Warehouse Heating Systems
GARD Analytics, Inc. 15 February 2009
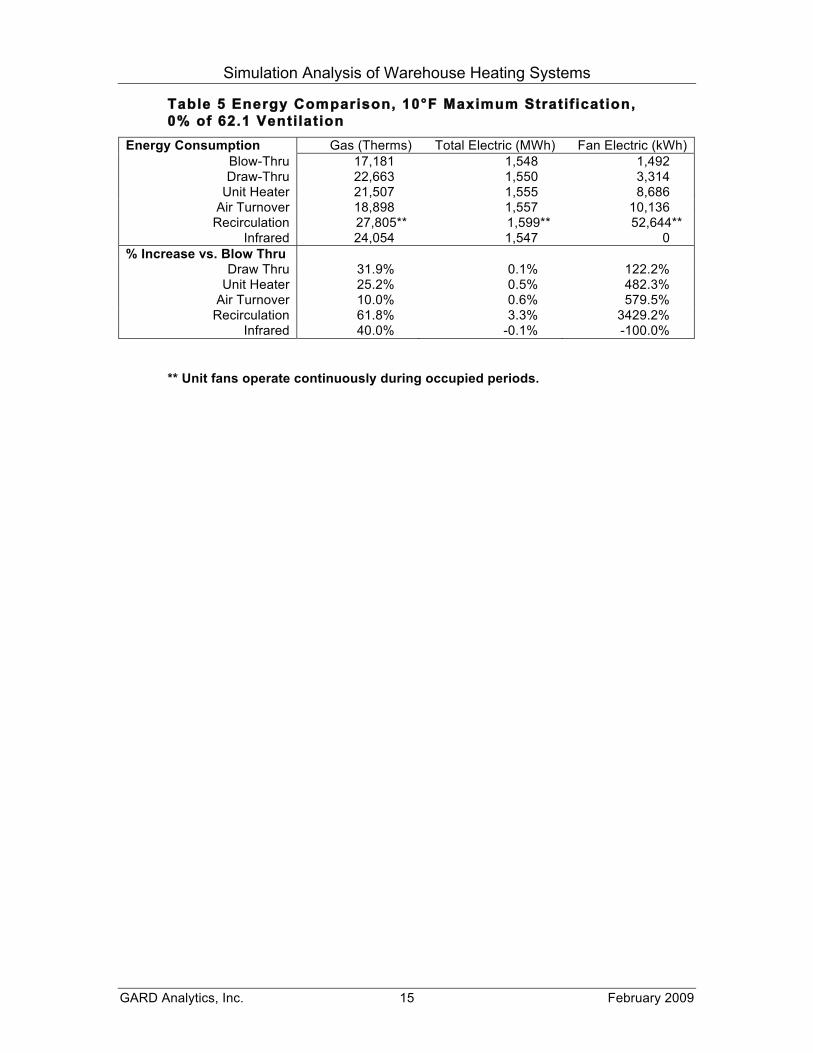
Table 5 Energy Comparison, 10°F Maximum Stratification,
0% of 62.1 Ventilation
Energy Consumption Gas (Therms) Total Electric (MWh) Fan Electric (kWh)
Blow-Thru 17,181 1,548 1,492 Draw-Thru 22,663 1,550 3,314
Unit Heater 21,507 1,555 8,686 Air Turnover 18,898 1,557 10,136
Recirculation 27,805** 1,599** 52,644** Infrared 24,054 1,547 0
% Increase vs. Blow Thru Draw Thru 31.9% 0.1% 122.2%
Unit Heater 25.2% 0.5% 482.3% Air Turnover 10.0% 0.6% 579.5%
Recirculation 61.8% 3.3% 3429.2% Infrared 40.0% -0.1% -100.0%
** Unit fans operate continuously during occupied periods.

Simulation Analysis of Warehouse Heating Systems
GARD Analytics, Inc. 16 February 2009
Table 6 – Typical LEED Warehouse Case - Energy
Comparison 4°F Maximum Stratification, 100% of 62.1 Ventilation
Energy Consumption Gas (Therms) Total Electric (MWh) Fan Electric (kWh)
VAV (90.1 baseline) 30,907 1,645 76,733 Blow-Thru 20,220 1,552 5,758 Draw-Thru 25,052 1,554 7,317
Unit Heater 30,481 1,563 16,289 Air Turnover 26,822 1,564 17,153
Recirculation 25,910** 1,599** 52,644** Infrared 32,156 1,558 11,164
% Savings vs. VAV Blow-Thru 34.6% 5.6% 92.5% Draw-Thru 18.9% 5.5% 90.5%
Unit Heater 1.4% 5.0% 78.8% Air Turnover 13.2% 4.9% 77.6%
Recirculation 16.2% 2.8% 31.4% Infrared -4.0% 5.3% 85.5%
% Increase vs. Blow-Thru Draw-Thru 23.9% 0.1% 27.1%
Unit Heater 50.7% 0.7% 182.9% Air Turnover 32.6% 0.7% 197.9%
Recirculation 28.1% 3.0% 814.2% Infrared 59.0% 0.3% 93.9%
** Unit fans operate continuously during occupied periods.
Table 7 Energy Comparison, 10°F Maximum Stratification, 100% of 62.1 Ventilation
Energy Consumption Gas (Therms) Total Electric (MWh) Fan Electric (kWh)
VAV (90.1 baseline) 32,563 1,647 78,594 Blow-Thru 21,974 1,553 5,806 Draw-Thru 27,506 1,554 7,589
Unit Heater 32,833 1,564 16,875 Air Turnover 28,886 1,565 17,833
Recirculation 27,805** 1,599** 52,644** Infrared 33,375 1,558 11,164
% Savings vs. VAV Blow-Thru 32.5% 5.8% 92.6% Draw-Thru 15.5% 5.7% 90.3%
Unit Heater -0.8% 5.1% 78.5% Air Turnover 11.3% 5.0% 77.3%
Recirculation 14.6% 2.9% 33.0% Infrared -2.5% 5.4% 85.8%
% Increase vs. Blow-Thru Draw-Thru 25.2% 0.1% 30.7%
Unit Heater 49.4% 0.7% 190.7% Air Turnover 31.5% 0.8% 207.2%
Recirculation 26.5% 3.0% 806.8% Infrared 51.9% 0.3% 92.3%
** Unit fans operate continuously during occupied periods.
Simulation Analysis of Warehouse Heating Systems
GARD Analytics, Inc. 17 February 2009
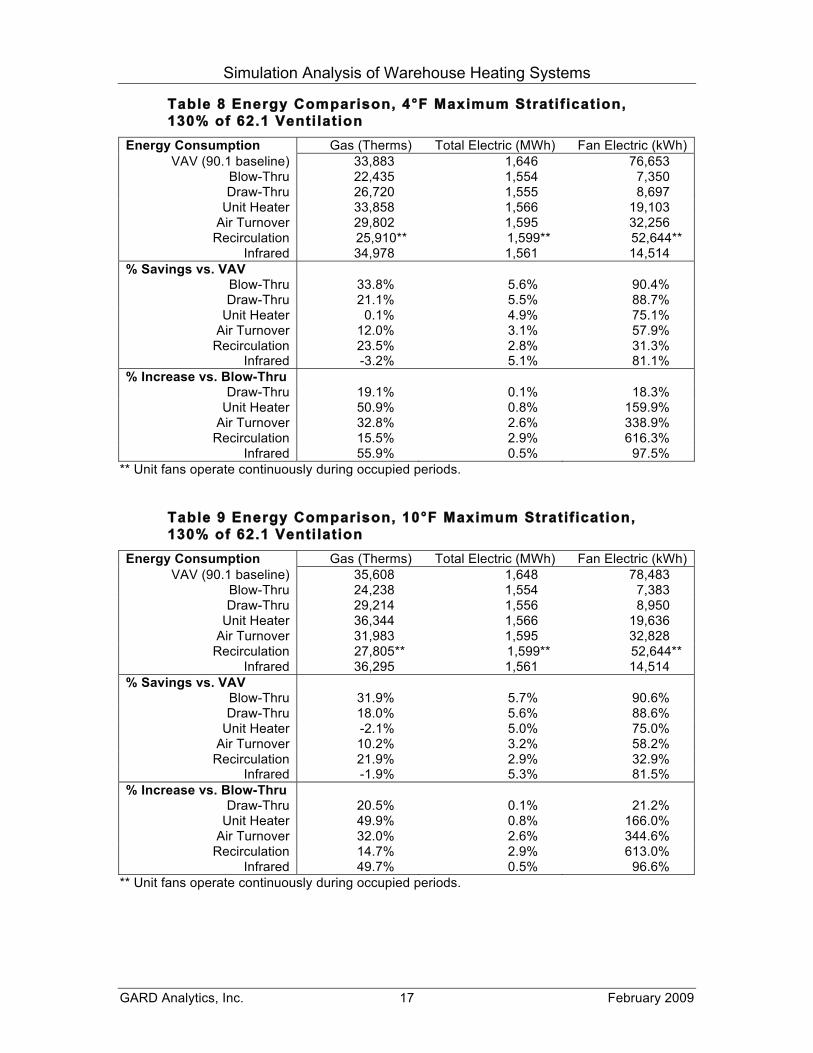
Table 8 Energy Comparison, 4°F Maximum Stratification,
130% of 62.1 Ventilation
Energy Consumption Gas (Therms) Total Electric (MWh) Fan Electric (kWh)
VAV (90.1 baseline) 33,883 1,646 76,653 Blow-Thru 22,435 1,554 7,350 Draw-Thru 26,720 1,555 8,697
Unit Heater 33,858 1,566 19,103 Air Turnover 29,802 1,595 32,256
Recirculation 25,910** 1,599** 52,644** Infrared 34,978 1,561 14,514
% Savings vs. VAV Blow-Thru 33.8% 5.6% 90.4% Draw-Thru 21.1% 5.5% 88.7%
Unit Heater 0.1% 4.9% 75.1% Air Turnover 12.0% 3.1% 57.9%
Recirculation 23.5% 2.8% 31.3% Infrared -3.2% 5.1% 81.1%
% Increase vs. Blow-Thru Draw-Thru 19.1% 0.1% 18.3%
Unit Heater 50.9% 0.8% 159.9% Air Turnover 32.8% 2.6% 338.9%
Recirculation 15.5% 2.9% 616.3% Infrared 55.9% 0.5% 97.5%
** Unit fans operate continuously during occupied periods.
Table 9 Energy Comparison, 10°F Maximum Stratification,
130% of 62.1 Ventilation
Energy Consumption Gas (Therms) Total Electric (MWh) Fan Electric (kWh)
VAV (90.1 baseline) 35,608 1,648 78,483 Blow-Thru 24,238 1,554 7,383 Draw-Thru 29,214 1,556 8,950
Unit Heater 36,344 1,566 19,636 Air Turnover 31,983 1,595 32,828
Recirculation 27,805** 1,599** 52,644** Infrared 36,295 1,561 14,514
% Savings vs. VAV Blow-Thru 31.9% 5.7% 90.6% Draw-Thru 18.0% 5.6% 88.6%
Unit Heater -2.1% 5.0% 75.0% Air Turnover 10.2% 3.2% 58.2%
Recirculation 21.9% 2.9% 32.9% Infrared -1.9% 5.3% 81.5%
% Increase vs. Blow-Thru Draw-Thru 20.5% 0.1% 21.2%
Unit Heater 49.9% 0.8% 166.0% Air Turnover 32.0% 2.6% 344.6%
Recirculation 14.7% 2.9% 613.0% Infrared 49.7% 0.5% 96.6%
** Unit fans operate continuously during occupied periods.
Simulation Analysis of Warehouse Heating Systems
GARD Analytics, Inc. 18 February 2009
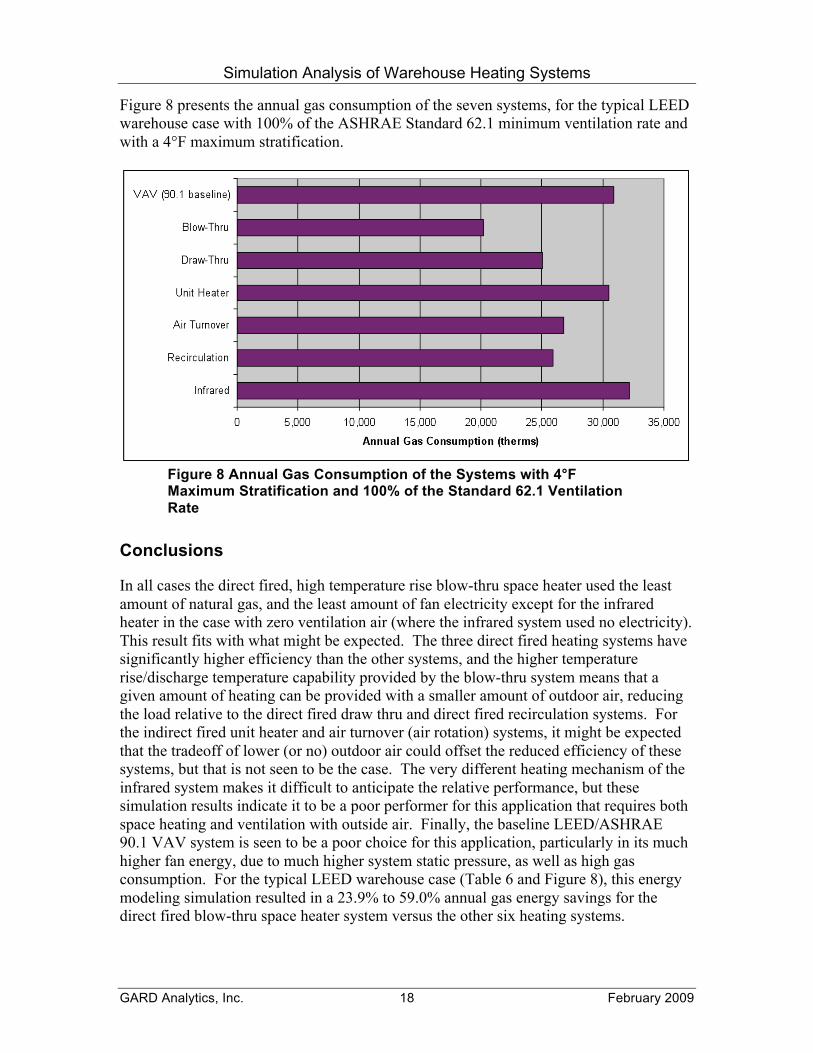
Figure 8 presents the annual gas consumption of the seven systems, for the typical LEED
warehouse case with 100% of the ASHRAE Standard 62.1 minimum ventilation rate and
with a 4°F maximum stratification.
Figure 8 Annual Gas Consumption of the Systems with 4°F Maximum Stratification and 100% of the Standard 62.1 Ventilation
Rate
Conclusions
In all cases the direct fired, high temperature rise blow-thru space heater used the least
amount of natural gas, and the least amount of fan electricity except for the infrared
heater in the case with zero ventilation air (where the infrared system used no electricity).
This result fits with what might be expected. The three direct fired heating systems have
significantly higher efficiency than the other systems, and the higher temperature
rise/discharge temperature capability provided by the blow-thru system means that a
given amount of heating can be provided with a smaller amount of outdoor air, reducing
the load relative to the direct fired draw thru and direct fired recirculation systems. For
the indirect fired unit heater and air turnover (air rotation) systems, it might be expected
that the tradeoff of lower (or no) outdoor air could offset the reduced efficiency of these
systems, but that is not seen to be the case. The very different heating mechanism of the
infrared system makes it difficult to anticipate the relative performance, but these
simulation results indicate it to be a poor performer for this application that requires both
space heating and ventilation with outside air. Finally, the baseline LEED/ASHRAE
90.1 VAV system is seen to be a poor choice for this application, particularly in its much
higher fan energy, due to much higher system static pressure, as well as high gas
consumption. For the typical LEED warehouse case (Table 6 and Figure 8), this energy
modeling simulation resulted in a 23.9% to 59.0% annual gas energy savings for the
direct fired blow-thru space heater system versus the other six heating systems.


![Data Modeling [Comparison of data modeling techniques ] By Renjini Sindhuri](https://img.pdfslide.net/doc/110x75/5517cb1555034616658b4aae/data-modeling-comparison-of-data-modeling-techniques-by-renjini-sindhuri.jpg)