Embed Size (px)
Citation preview

Energy Northwest and Bonneville
Power Administration Commercial
Aggregator Demonstration
Final Report
Published: October, 2016

BPA-EN Demonstration Final Report 2
Contents
Executive Summary ....................................................................................................................................... 4
Introduction .................................................................................................................................................. 5
Project Team - Bonneville Power Administration ..................................................................................... 5
Project Team – Energy Northwest ............................................................................................................ 5
Load-Response Contributors to Energy Northwest Team ........................................................................ 6
Other Contributors to Energy Northwest Team ....................................................................................... 6
Background and Contracting .................................................................................................................... 6
Demonstration Objectives ........................................................................................................................ 8
Project Design and Implementation ............................................................................................................. 9
Load Response Asset Overview ................................................................................................................ 9
BPA Systems ............................................................................................................................................ 11
Demand Response Aggregated Control System (DRACS) ....................................................................... 13
Event Signaling .................................................................................................................................... 13
Reporting............................................................................................................................................. 13
Measurement & Verification Approach .................................................................................................. 14
Baseline Methodology by Asset Type ................................................................................................. 14
Outages, Timelines, and Outage Penalties ............................................................................................. 15
Settlement Process ................................................................................................................................. 15
Performance Results ................................................................................................................................... 16
Scheduled Outages/Availability .............................................................................................................. 20
Load Asset Performance ......................................................................................................................... 21
Energy Northwest Lessons Learned ............................................................................................................ 22
Utility Engagement ................................................................................................................................. 22
DRACS Development & Deployment ...................................................................................................... 22

BPA-EN Demonstration Final Report 3
Outage Notification ................................................................................................................................. 23
Performance Criteria & Data Retention Requirements .......................................................................... 23
Participant Lessons Learned ....................................................................................................................... 24
BPA Lessons Learned .................................................................................................................................. 25
Contracting .............................................................................................................................................. 25
Operations .............................................................................................................................................. 26
Systems ................................................................................................................................................... 26
Go Live Process ....................................................................................................................................... 26
Communications ..................................................................................................................................... 28
Slice Customer Billing and Scheduling .................................................................................................... 28
The Issue ............................................................................................................................................. 29
Solution ............................................................................................................................................... 29
Conclusion ................................................................................................................................................... 29
Appendix A – Event Summaries .................................................................................................................. 30
Appendix B – DRACS Functional Schematic ................................................................................................ 30
Appendix C: Project Recognition and News ................................................................................................ 31
Appendix D – Deep Dive Data Analysis: City of Richland DVR ................................................................... 32
Introduction ............................................................................................................................................ 32
Calculation Methodology ........................................................................................................................ 32
Data Anomalies ....................................................................................................................................... 33
Statistical Analysis ................................................................................................................................... 35
Limits of this Sample ............................................................................................................................... 38
Conclusions ............................................................................................................................................. 40
Appendix E: Summary of Cleaned Data for All Events ................................................................................ 41

BPA-EN Demonstration Final Report 4
Executive Summary From 2009 through 2012, Bonneville Power Administration (BPA) engaged in focused
evaluation of demand response (DR) entailing field tests, demonstrations, modeling, and
analysis. These efforts tested commercial and public building load control, residential and
commercial space heating energy storage, water heater energy storage and load control,
industrial process load control and energy storage, large farm water management system load
control and storage, small scale battery energy storage, and load shifting utilizing aquifer
recharge opportunities. From these efforts, BPA learned that DR is diverse, available in
predicable and reliable quantities and time periods, available from many end users, and variable
in cost.
Moving forward with these learnings, in March 2013, BPA solicited interest among its customer
utilities for multiple new DR projects to “prove the availability and reliability of DR as a tool for
addressing multiple needs in the region.” The 2-year (FYs 2014-2015) projects, expected to
total greater than 50MW, were intended to “address multiple regional issues including utility
peaks and distribution system constraints, whole system peaks, within-hour balancing, over-
generation, and non-wires transmission and distribution investment deferral opportunities.”
Energy Northwest (EN), a Richland Washington, based joint operating agency providing cost-
based generation and services to regional public power, assembled a team of public power
utilities, technology providers, and other technical resources and advisors and responded with a
conceptual-level proposal to the BPA solicitation. Upon review and consideration of the
proposal, in May 2013, BPA invited the EN Team to prepare a more complete proposal which
was submitted in July 2013. The proposal included 46 MW “INC” (load reduction) and 30 MW
“DEC” (load increase) DR resources in the “fast” (<10 minute), hour-ahead, and day-ahead
response regimes. In August 2013, BPA notified EN its proposal had been accepted and invited
EN to engage in contract negotiations.
Subsequent to its invitation, BPA refined its goals for the project and provided EN a term sheet
in December 2013 contemplating a much smaller resource, a shorter project period, and the use
of fast INC resources only. Negotiations ensued and an agreement for the “Aggregated
Demand Response Demonstration Project” (Demonstration Agreement) was executed between
BPA and EN in September 2014.
On February 4, 2015, BPA formally accepted EN’s Demand Response Aggregated Control
System (DRACS) as functional. On February 9, 2015, EN’s DR Demonstration resource, 17.88
MW under Dispatch Group A (DG-A), entered service. The resource size was increased over
the course of the Demonstration to 35 MW in Dispatch Groups A & B. On January 13, 2016,
Demonstration operations terminated under project agreement.
A total of 85 events were called over the course of the Demonstration with successful response
being achieved 94.1% of the time.

BPA-EN Demonstration Final Report 5
Introduction
Project Team - Bonneville Power Administration This demonstration required team members from across the organization. The BPA core team
included:
Name Role
John Wellschlager Account Executive (Contract Signer)
Jason Weinstein Account Specialist and Settlement Lead
Fran Halpin Power Operations – Event Scheduling
Yvonne Johnson Power Operations – Software & Event Process Oversight
Tony Koch Metering and Settlement
Melanie Smith Demand Response Operations
Frank Brown Demand Response Advisor
Chris Sanford Transmission - Dittmer Dispatch
Tom Brim (Contractor) Project Manager
Cara Ford (Contractor) Project Manager & Information Systems Lead
Eva Urbatsch (Contractor) Data Analyst
Project Team – Energy Northwest The primary project team from Energy Services and Development included the following:
Name Role
John Steigers Project Manager/Applied Technology & Innovation
Leo Quiachon Technical Lead
Jim Gaston Project Oversight
Jennifer Harper Project Specialist

BPA-EN Demonstration Final Report 6
Load-Response Contributors to Energy Northwest Team • City of Richland, a full requirements distribution utility customer of BPA, serves 25,300
customers in and near the community of Richland, Washington. It operates a total of 15
load tap changing (LTC) transformers in 10 substations.
• Public Utility District No. 1 of Cowlitz County, or Cowlitz PUD, is a “slice/block” customer
of BPA serving 48,200 customers in Cowlitz County, Washington. It serves the
Longview, Washington, Weyerhaeuser complex within which Northern Pacific Paper
Company (NORPAC) operates.
• Public Utility District No. 1 of Pend Oreille County, or Pend Oreille PUD, a BPA “slice”
customer that operates under the Avista Utilities balancing authority, serves 8,800
customers in NE Washington state. Its largest load is the Ponderay Newsprint Company
(PNC) near the community of Usk.
• Powin Energy, headquartered in Tualatin, Oregon, is a developer and manufacturer of
integrated lithium ion Battery Energy Storage Systems (BESS).
Other Contributors to Energy Northwest Team Resource Associates International (RAI) of Spokane, Washington, offers integrated turn-key
data collection and control solutions to energy utilities, industry, and others.
Pacific Northwest National Laboratory is one of ten federal Department of Energy managed
national laboratories. A research institution contributing innovation and leadership to the fields
of energy, national security, and others, it hosts and operates the Electric Industry Operations
Center (EIOC) within its Richland, Washington, campus.
Others making significant contributions to the EN team but were not able to field load assets in
the Demonstration as it was eventually configured included: City of Milton-Freewater, Franklin
County PUD, Kootenai Electric Cooperative, and the Northwest Food Processors Association.
Background and Contracting Requirements for Demonstration Events and Contract Performance – While not comprehensive,
significant requirements of EN’s performance under the Demonstration Agreement included:
• Events may be called anytime, no restrictions on time of day or day of week.
• Starting from minute 00, event notification, EN reported aggregated net load response,
by dispatch group, via its DRACS to BPA’s Demand Response Optimization
Management System (DROMS).
• The contractual “required capacity” obligation, a combination of measured and verified
load reduction and incremental discharge increases by the Powin BESS, must be
accomplished by minute 10 following notification and sustained each minute through the
event’s duration.

BPA-EN Demonstration Final Report 7
• Event duration, as measured from minute 10, may not exceed 90 minutes. BPA may
signal for an early event termination.
• BPA may not call another event on that dispatch group until 24 hours after termination of
the prior event.
• No more than 2 events may be called on a dispatch group within any calendar week.
• No more than 6 events may be called on a dispatch group in any calendar month.
The prime contract of the Demonstration was the agreement between BPA and EN which
defined the specific products and performance criteria. The Demonstration Agreement
contemplated:
• A nominal 12-month operating term with, at BPA’s option, two 6-month term extensions;
which, ultimately, BPA did not elect to exercise.
• A fixed capacity fee paid to EN by BPA on a per kilowatt-month (kW-month) basis for
contracted load-response provided. No event-based or “energy” charge or compensation
was made.
• EN assembled, managed, and prepared transaction settlement records and invoicing for
the Demonstration.
• Contractually-prescribed penalties for failure to meet event load response performance
criteria and provision for scheduled Demonstration resource outages.
EN, in turn, contracted individually with participant utilities and/or responding “assets” to acquire
the cumulative load response they were contracted to provide. A fixed capacity “incentive” fee
was paid by EN to the utilities or assets. Terms, penalties for non-performance, and outages
largely mirrored the EN-BPA Demonstration Agreement. Each asset contract differed from one
another but accomplished similar ends. Specifically:
• City of Richland, as the load-responding asset itself, accomplished its load response by
directing its system LTCs to lower distribution voltage by a set increment thus reducing its
served peak load.
• Cowlitz PUD, in turn, contracted with its served load Weyerhaeuser to shut down portions
of NORPAC’s cellulose fiber production facilities to effect load reduction.
• Pend Oreille PUD’s load, PNC, very similar to NORPAC in many respects, reduced its
fiber production. EN contracted directly with PNC as Pend Oreille PUD elected to not be
a direct party to the asset contract, choosing instead to support and observe the
Demonstration transaction within the scope of its existing contractual relationship with
PNC. As Pend Oreille PUD is not in BPA’s balancing authority, BPA, Avista Utilities, and
Pend Oreille PUD agreed informally on system transmission management practices that
allowed PNC’s load response to effectively flow in real time between the two balancing
BPA-EN Demonstration Final Report 8
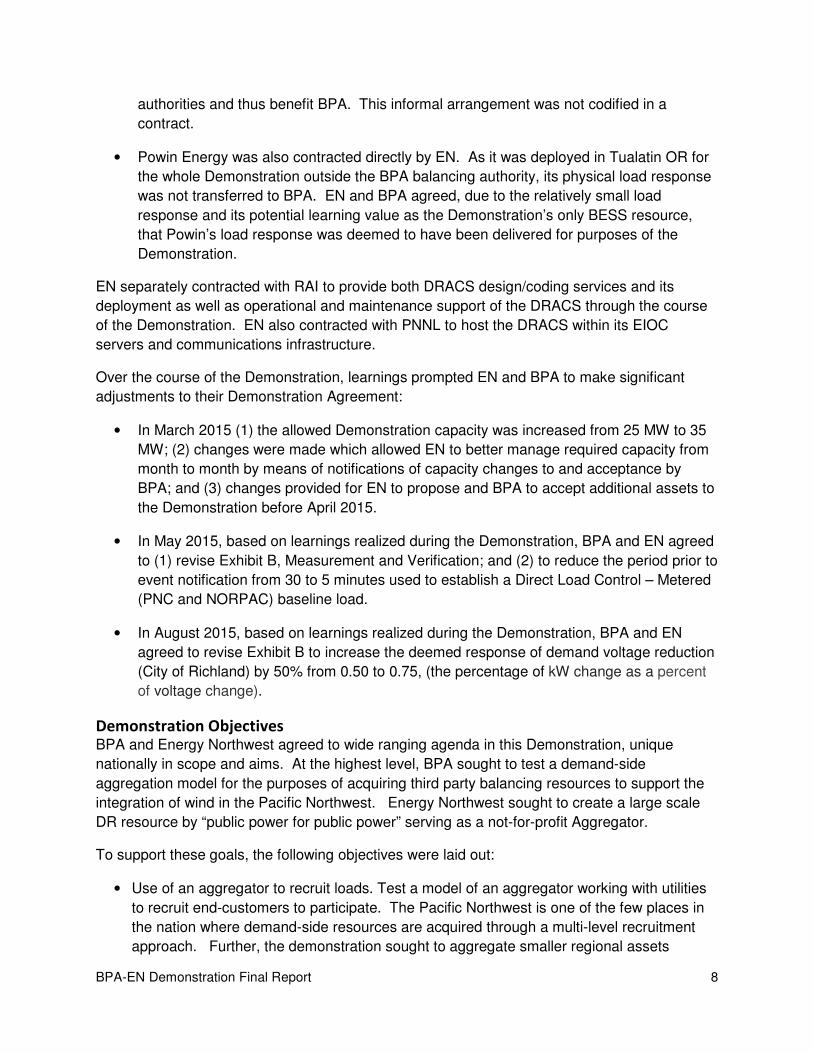
authorities and thus benefit BPA. This informal arrangement was not codified in a
contract.
• Powin Energy was also contracted directly by EN. As it was deployed in Tualatin OR for
the whole Demonstration outside the BPA balancing authority, its physical load response
was not transferred to BPA. EN and BPA agreed, due to the relatively small load
response and its potential learning value as the Demonstration’s only BESS resource,
that Powin’s load response was deemed to have been delivered for purposes of the
Demonstration.
EN separately contracted with RAI to provide both DRACS design/coding services and its
deployment as well as operational and maintenance support of the DRACS through the course
of the Demonstration. EN also contracted with PNNL to host the DRACS within its EIOC
servers and communications infrastructure.
Over the course of the Demonstration, learnings prompted EN and BPA to make significant
adjustments to their Demonstration Agreement:
• In March 2015 (1) the allowed Demonstration capacity was increased from 25 MW to 35
MW; (2) changes were made which allowed EN to better manage required capacity from
month to month by means of notifications of capacity changes to and acceptance by
BPA; and (3) changes provided for EN to propose and BPA to accept additional assets to
the Demonstration before April 2015.
• In May 2015, based on learnings realized during the Demonstration, BPA and EN agreed
to (1) revise Exhibit B, Measurement and Verification; and (2) to reduce the period prior to
event notification from 30 to 5 minutes used to establish a Direct Load Control – Metered
(PNC and NORPAC) baseline load.
• In August 2015, based on learnings realized during the Demonstration, BPA and EN
agreed to revise Exhibit B to increase the deemed response of demand voltage reduction
(City of Richland) by 50% from 0.50 to 0.75, (the percentage of kW change as a percent
of voltage change).
Demonstration Objectives BPA and Energy Northwest agreed to wide ranging agenda in this Demonstration, unique
nationally in scope and aims. At the highest level, BPA sought to test a demand-side
aggregation model for the purposes of acquiring third party balancing resources to support the
integration of wind in the Pacific Northwest. Energy Northwest sought to create a large scale
DR resource by “public power for public power” serving as a not-for-profit Aggregator.
To support these goals, the following objectives were laid out:
• Use of an aggregator to recruit loads. Test a model of an aggregator working with utilities
to recruit end-customers to participate. The Pacific Northwest is one of the few places in
the nation where demand-side resources are acquired through a multi-level recruitment
approach. Further, the demonstration sought to aggregate smaller regional assets

BPA-EN Demonstration Final Report 9
normally too constrained to serve in any grid balancing role within an effective DR
Resource.
• Asset diversity. Test a variety of distributed energy resources including but not limited to
traditional load reduction in the commercial, industrial, and residential sectors. As such,
the demonstration also included Dispatchable Voltage Regulation (DVR) and a Battery
Energy Storage System.
• Meter Strategy. Test strategies for baselining and measuring the kW delivered via direct
load control, battery storage (discharge during events), DVR and electric water heaters
(later removed from scope).
• Systems. Design and develop an integrated system to send dispatch events from BPA to
Energy Northwest to end-loads, and receive back real-time data of event performance in
the BPA Power Operations room.
• Integration into BPA Operations. Train and build comfort with BPA staff in Power and
Transmission Operations in using, monitoring and triggering events for a non-federal, non-
hydro resource.
• Settlement. Build an efficient process to settle monthly payments to Energy Northwest
based on participating MW capacity, penalties for non-performance, and reductions for
outages.
• Reliability. Demonstrate the performance rate (# of successful events / # of total events
called) of the aggregated assets in meeting events calls that simulate system balancing
needs.
• Transition Plan. Define the conditions under which BPA and Energy Northwest could
transition to an on-going commercial DR relationship after the conclusion of this proposed
Project.
• Coordination across balancing areas. In the spring of 2015, Energy Northwest
approached BPA with adding an asset (Ponderay Newsprint) served by a BPA preference
customer but outside of the BPA Balancing Authority. Ponderay was added to the
demonstration, and this allowed BPA and Energy Northwest to test how to coordinate
across balancing authorities and to test tagging procedures to ensure reductions appear
on the BPA system.
Project Design and Implementation
Load Response Asset Overview The City of Richland installed an RAI SCADA Nexus gateway at each of its 10 substations. The
substation-installed hardware consisted of a weatherproof enclosure which was mounted on the
side of the LTC which included: SCADA Nexus Gateway, DL05 Power Line Carrier (PLC), Cell
Modem, Interposing control relays, power supply to accept 120 VAC and fused DC power

BPA-EN Demonstration Final Report 10
distribution board, AC breaker, terminal blocks and wiring diagram to connection to up to three
LTCs in the substation. The PLC output used a dry contact signal through the interposing relays
to each LTC to run in Voltage Reduction Mode. There were ten enclosures, one for each City of
Richland substation.
The DataCatcher (SCADA Nexus Cloud Server Application) was installed on a cloud-based
server and configured to communicate with the following: (1) Energy Northwest DRACS server:
for communicating the Demand Response status and control and reporting the real-time and/or
historical data for real-time feedback and auditing purposes of the Demand Response Events.
(2) City of Richland Metering System FTP Server: for communicating the current and near past
metering values on a one-minute basis for voltage and power values to provide feedback that
the system is operational when called upon. (3) SCADA Nexus Gateway devices transmitted
current/changed values back to the Central Data server using “push” or “pitch” technology over
an SSL secured connection. (4) City of Richland users and system administrators had a web
interface based upon the user’s credentials and role. Each user that was authorized for any
given task was able to view dashboards which consisted of single line diagrams or other views
to show the current system status including Demand Response status, historical charts, alarm
limit checking and notifications via email and text messaging.
NORPAC installed both a secure hosted firmware-based gateway to replace the functionality of
an old style masters and secure hardware-based energy management system for installation in
the field near the ION meters in the motor control center. Both gateways had functionality for
interfacing to the various meters within the plant operations using both industry standard and
custom protocols. The hardware gateway pitched data from the data site to RAI’s SCADA
Nexus Cloud Server using industry-standards-based, NERC secure, and NIST interoperability
compliant Web-based Client/Server communication methods. The gateway polled for load data
from a remote location next to the meter. NORPAC personnel had access rights to the SCADA
using login and password security.
PNC installed a single gateway which replaced the functionality of a previous style, using a
TCP/IP Modbus. The hardware gateway pitched data from the data site to RAI’s SCADA Nexus
Cloud Server using IEEE Standards-based, NERC secure, and NIST interoperability compliant
Web-based Clint/Server communication methods. The gateway polled for PNC PLC data from a
remote location next to the IED/PLS/Meter. The gateway also wrote to the specified PLC
memory to command the DRACS initiated DR event. All metering and IED SCADA status and
analog data was available as web pages served from a cloud-based SCADA Nexus Cloud
Server. PNC personnel had accessed the SCADA using login and password security.
A gateway and DataCatcher were installed on Powin’s SCADA Nexus site. The MODBUS
“poller” defined messages and tags were configured. All required users and logins for the
SCADA nexus Cloud Server were installed. Dashboards on the SCADA nexus Cloud Server
were built based upon available data from the MODBUS map. The DRACS Dispatchable
resource was developed. A “State Machine” was developed for Powin within the SCADA Nexus
DataCatcher to allow dispatch during the Demand Response events. This application was
controlled by the DRACS server hosted at PNNL.

BPA-EN Demonstration Final Report 11
BPA Systems BPA System Description: BPA partnered with AutoGrid to utilize their Demand Response
Optimization Management System (DROMS) for management of their demand response
programs and products.
• Communications: DROMS communicates with EN’s DRAC’s via OpenADR2.0b. The
integration allows for event signaling, 1 minute interval reporting, and outage scheduling.
DROMS manages product availability and shows available products to BPA operators
on a dashboard. Operators can dispatch or modify already scheduled events directly
from the dashboard.
• Reporting: During an event, operators are able to view performance in near real time.
DRACS’s sends load shed totals using OpenADR’s EiReport payload. These intervals
are then displayed on the AutoGrid dashboard.
• Product Management: DROMS allows for creation of products and manages availability
of the product based on constraints such as number of events allowed per week, and
days of the week.
• Product Outages: EN DRACS was able to send maintenance and outage windows to
DROMS via OpenADR. During those windows the product was unavailable to operators
for dispatch.
• Event Scheduling: DROMS enabled BPA operations the flexibility to schedule events
ahead of time or enter them in real time.

BPA-EN Demonstration Final Report 12
System Architecture Diagram:

BPA-EN Demonstration Final Report 13
AutoGrid Operator Dashboard:
Demand Response Aggregated Control System (DRACS) Energy Northwest contracted with Resource Associates International (RAI) to develop the
Demand Response Aggregated Control System (DRACS) which is a comprehensive data
gathering, monitoring, control and communications infrastructure. Communication devices are
installed by participating utilities to report to and receive direction from the DRACS via secure
cloud-based data paths. DRACS is hosted within Pacific Northwest National Laboratory’s
Electricity Infrastructure Operations Center, a DOE-funded incubator facility built and operated
for such roles.
Event Signaling
Event initiation by BPA operations action: Energy Northwest receives signals from BPA’s
DROMS system via OpenADR2.0b. Upon receipt of the signal, DRACS acknowledges and
forwards the signal to multiple demand response assets. Upon receipt of the forwarded signal,
each asset begins to reduce its loads. The load changes must be complete within 10 minutes
and sustained through the event, up to 90 minutes in duration.
Reporting
During events, DRACS collects detailed metering information from each of the assets and
reports total capacity response to BPA. Once an event ends, DRACS sends terminating signals
to the Assets which can then resume normal operations.

BPA-EN Demonstration Final Report 14
Upon event termination, DRACS made available CSV files for each asset’s performance. The
data was collected as average one minute load reductions, measured in kilowatts. Each asset’s
performance was recorded in a time frame beginning 30 minutes prior to event through 30
minutes after event termination, regardless of event duration. For each event, a data file was
produced for each asset in addition to a data file produced for each dispatch group. A log file
was also produced, which recorded the date and time of each log event which occurred during
the time of the event.
DRACS allowed access for each registered user to not only download settlement data, which
was applied to templates to measure asset performance during each event, but also allowed
users to download “raw data” for each event. The raw data report would be produced in CSV
format, and would allow a 3 hour maximum of the “raw” data. The raw data file contains every
read for every device that makes up each asset. The included raw data file has the following
columns:
• Gateway Timestamp – this is the actual time when the data was captured in the field.
• Client DC Timestamp – This is the time when the data arrived at the client DataCatcher.
• DRACS Timestamp – This is the time when the data arrived at the DRACS
• Measurable – This is the description or label of the data point being measure. For
example, kW_tot, or Vin_avg
• Value – Actual data point value.
The assets (end loads) have access in DRACS to the same settlement interface that Energy
Northwest and BPA use, but it is filtered to only allow the asset to see data for their specific
assets. They are also able to see a summary of the events and assets for their dispatch group.
Measurement & Verification Approach
Baseline Methodology by Asset Type
Direct Load Control – The original contract language for the baseline for Direct Load Control
loads was calculated as the metered power (kW) averaged over the 30 minutes prior to the time
of Event notification. Capacity delivered on a minute by minute basis was calculated as the
difference between the Event Baseline and each one minute average power (kW) measured
during the Event. This “meter before/meter after” baseline method can be challenging to apply
(in order to produce an equitable delivered capacity) when a participant is in the process of
ramping demand up or down just prior to the demand response Event dispatch. BPA and EN
explored using a different baseline. Effective April 2015, BPA and EN agreed to use a 5 minute
average kW prior to Event notification.
Demand Voltage Reduction - Capacity delivered on a minute by minute basis from demand
voltage reduction is the product of measured load (kW), the % change in voltage for that minute
(expressed as a fractional change), and a deemed demand voltage reduction (DVR) load

BPA-EN Demonstration Final Report 15
response factor of 0.5 (%kW I% voltage change). The % voltage change for each minute of an
Event was calculated as the difference between the voltage set point one minute prior to the
start of the DR event and the voltage set point for the particular minute within an Event. It is
anticipated that the voltage set point may change within an Event. During the initial months of
the demonstration a DVR load response factor of 0.5 was used. Data from the initial months
was analyzed and BPA determined than the DVR load response factor should be increased to
0.75 to more accurately reflect the actual load reduction provided by DVR. The change in DVR
factor was effective April 2015.
Battery Energy Storage System (BESS) - The battery energy storage system from Powin
provides a unique set of conditions because a BESS is capable of consuming kW from the grid
like a traditional load, operating at a neutral state without net in/out flow of kW to the grid, and
delivering kW to the grid like a generator. If the BESS is receiving power from the grid when the
Event notification occurs, the actual load reduction is the difference between the metered
demand during charging and the metered output to the grid. If the BESS is in a neutral state the
actual load reduction is measured as the kW discharged back to the grid. If the BESS is
discharging kW to the grid when the Event is dispatched the load reduction is the difference
between the incremental kW discharged back to the grid during the demand response Event
and the kW discharged to the grid prior to the demand response Event.
Outages, Timelines, and Outage Penalties The EN-BPA Demonstration Agreement included an outage notification requirement. EN outage
notifications delivered 48 hours in advance of the outage reduced EN’s exposure to
unsuccessful event penalties. The Outage penalty was 1/31 of the monthly capacity payment for
each 24 hour period of the outage. The Unsuccessful event penalty was 1/6 of the monthly
capacity payment. The structure encouraged EN to accurately report outages instead of taking
a chance that an event would be dispatched when the participating facility was unable to
respond. This provision has some challenges as EN often does not receive 48 hours advance
notice of the outage from the participating facility. During some time periods when outages
occurred in the project there was an unexpected malfunction in the production equipment at the
participating facility. This provision did not provide any incentive or relief for EN when the outage
notice was provided with less than 48-hours advance notice. An alternative to this provision may
be to use two different time horizons and penalty rates, for example an outage with 25 hours
advance notice would result in a penalty of 1/31 of the monthly capacity payment and an outage
with less than 24 hours’ notice results in a penalty of 1/15 of the monthly capacity payment.
Unsuccessful event penalties for future agreements will be tied to the number of load drops
allowed per month and other deployment limitations.
Settlement Process The settlement process and reporting and invoicing document templates were developed over
the course of November 2014 through January 2015 in collaboration with, and ultimately
accepted by, BPA.
As events occurred over a month, EN staff prepared an event-specific document set consisting
of: (1) graphical & numeric summaries for the Dispatch Group and each contributing load asset

BPA-EN Demonstration Final Report 16
and (2) the 1-minute data tables generated by DRACS supporting those summaries. EN
elected to provide those summaries to BPA and load assets within, generally, 1-2 working days
after the event. The summary documents for all contract events are provided as Appendix A.
At the end of each month, EN assembled the event summaries and data tables for the month’s
events, documentation detailing outages, prepared a combined invoice summary, and provided
to BPA by the 5th working day of the subsequent month.
BPA staff reviewed the invoice package, worked collaboratively with EN staff to resolve
questions and needed clarifications, and approved the invoice generally by about the 12th day of
the subsequent month. Payment was made by BPA to EN by the 20th day.
Once BPA had indicated its acceptance of a month’s invoice, EN staff prepared a similar
document set for each of its participant assets and paid out incentives by the 28th day.
Performance Results Background - When first placed in service mid-January 2015, the DRACS documented all
events it had initiated. The Demonstration was placed into service at 00:00am February 9,
2015, with 48 events having been “called” in the course of DRACS and DROMS system
development and functional demonstrations. The first event called under the contract was
1502-049 on February 10th. Note event numbering convention follows: “1502” indicating year
2015 and February, the 2nd month. Through the project’s termination, 85 events were called on
the Demonstration for contractual purposes ending with event 1601-141 on January 31, 2016.
The 7 “missing” events (056, 060-064, & 118) were expended in testing and other non-contract
performance activity.
Successful Events - 80 Demonstration events were contractually successful, yielding an overall
success performance rate of 94.1%.
Unsuccessful Events - Five Demonstration events were unsuccessful for contract performance
purposes:
• June 28, 2015 – DG-A event 1506-083 failed due to contingency shutdown conditions of
an industrial load asset (NORPAC).
• June 29, 2015 – DG-A event 1506-084 failed due to DRACS not fully resetting after a
canceled June 28th outage.
• July 17, 2015 – DG-B event 1507-089 failed due to contingency shutdown conditions of
an industrial load asset (PNC).
• December 9, 2015 – DG-A event 1512-131 failed due to an operator error in applying
established operating practices at an industrial load asset. (NORPAC)
• December 17, 2015 – DG-A event 1507-133 failed due to contingency shutdown
conditions of an industrial load asset. (NORPAC)

BPA-EN Demonstration Final Report 17
Event 1502-053 on February 26, 2015, was initially measured as unsuccessful but EN and BPA
subsequently agreed the event was successful. This event demonstrated a learning (discussed
in more detail Paragraph 3.4 of this report) regarding use of baselines for industrial loads prone
to rapid ramping.
Load Change Response Performance
• The Demonstration assets achieved sustained required capacity response typically in
less than 5 minutes from minute 00 notification. Table 1 summarizes response by
minutes taken to achieve sustained required load reduction:
Table 1, Event Response Times
• The 85 contractual events are listed in Figure 1. The 5 unsuccessful events are
highlighted in bold red font.
Dispatch Group 2 3 4 5 6 7 8 9 10 >10
A 2 12 26 12 5 4 2 0 1 4
B 0 0 0 4 10 2 0 0 0 0
Response Time (Minutes)

BPA-EN Demonstration Final Report 18
Figure 1 – Demonstration Event List
DG notification duration DG notification duration
[mm/dd hh:mm] [minutes] [mm/dd hh:mm] [minutes]
A 1502 049 02/10 10:04 90 A 1508 099 08/07 10:59 90
A 1502 050 02/18 14:34 90 A 1508 100 08/10 12:09 90
A 1502 051 02/20 11:16 33 A 1508 101 08/19 13:09 90
A 1502 052 02/24 07:10 85 B 1508 102 08/22 16:19 90
A 1502 053 02/26 19:04 26 B 1508 103 08/23 17:49 90
A 1503 054 03/02 02:13 47 B 1508 104 08/25 15:49 90
A 1503 055 03/11 15:32 73 A 1508 105 08/26 15:09 90
A 1503 057 03/14 10:07 90 A 1508 106 08/28 11:19 90
A 1503 058 03/16 17:22 50 A 1509 107 09/03 10:19 90
A 1503 059 03/19 10:26 83 B 1509 108 09/10 21:19 90
A 1503 065 03/27 06:14 65 A 1509 109 09/10 13:19 90
A 1504 067 04/08 09:23 86 A 1509 110 09/11 15:19 90
B 1504 068 04/16 09:04 45 B 1509 111 09/14 07:49 4
A 1504 069 04/16 09:04 55 A 1509 112 09/14 07:49 90
A 1504 070 04/21 12:04 75 A 1509 113 09/17 17:11 90
A 1504 071 04/23 12:19 90 B 1509 114 09/23 08:19 90
A 1504 072 04/30 11:34 90 A 1509 115 09/23 08:19 90
B 1504 073 04/30 11:34 90 B 1509 116 09/26 07:19 90
A 1505 074 05/03 07:10 39 B 1509 117 09/29 09:34 90
A 1505 075 05/06 03:38 71 A 1510 119 10/08 15:00 90
A 1505 076 05/19 00:28 82 A 1510 120 10/20 13:59 90
A 1505 077 05/22 17:07 80 A 1510 121 10/22 10:04 90
A 1505 078 05/25 05:09 90 A 1510 122 10/27 08:04 90
A 1505 079 05/26 09:45 33 A 1510 123 10/29 15:49 90
A 1506 080 06/06 17:09 52 A 1511 124 11/06 06:20 90
A 1506 081 06/26 02:10 60 A 1511 125 11/13 21:24 90
A 1506 082 06/27 03:24 50 A 1511 126 11/16 11:19 90
A 1506 083 06/28 04:29 45 A 1511 127 11/17 15:49 90
A 1506 084 06/29 16:41 0 A 1511 128 11/23 14:49 90
A 1507 085 07/06 15:49 90 A 1511 129 11/27 07:49 90
B 1507 086 07/06 15:49 90 A 1512 130 12/08 06:49 90
A 1507 087 07/07 17:34 90 A 1512 131 12/09 16:49 90
B 1507 088 07/07 17:34 90 A 1512 132 12/14 23:49 90
B 1507 089 07/14 12:59 90 A 1512 133 12/17 11:49 90
A 1507 090 07/14 12:59 90 A 1512 134 12/26 16:49 90
A 1507 091 07/15 02:44 90 A 1512 135 12/30 15:49 90
B 1507 092 07/15 02:44 90 A 1601 136 01/06 16:49 90
B 1507 093 07/26 16:49 90 A 1601 137 01/12 16:49 90
A 1507 094 07/26 16:49 90 A 1601 138 01/18 01:49 90
B 1507 095 07/31 03:49 90 A 1601 139 01/22 07:49 90
A 1507 096 07/31 03:49 90 A 1601 140 01/25 20:49 90
B 1508 097 08/03 16:49 90 A 1601 141 01/29 17:49 90
A 1508 098 08/04 13:09 90
event event
BPA-EN Demonstration Final Report 19
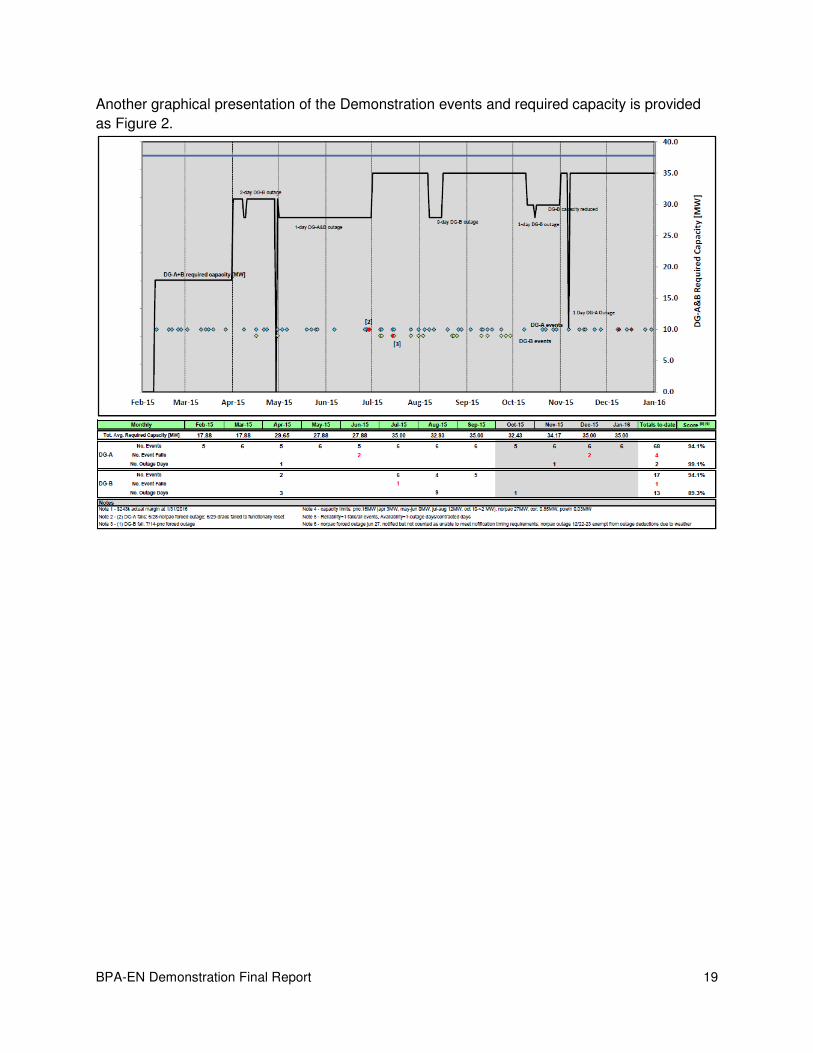
Another graphical presentation of the Demonstration events and required capacity is provided
as Figure 2.

BPA-EN Demonstration Final Report 20
A graphic showing cumulative energy contributed, contracted and actual is provided as Figure
3.
Scheduled Outages/Availability The Demonstration Agreement provided for EN to call scheduled outages on a minimum 48
hours notice, delivered by OpenADR signal via DRACS and DROMS. A return to service from
outage required minimum 24 hour notice, also by OpenADR signal.
For purposes of contractual performance, DG-A declared an outage on 1 day of the 356 in-
service days for an availability of 99.7%. A number of additional forced outages occurred
attributable to BPA regional system disruptions, forced outages at NORPAC that would have
precluded DG-A performance but occurred within 24 hours of a prior event (contractual
“recovery” period when further events may not be called), and in one case a NORPAC forced
outage too short to have called for an outage but no event was called. Even if all the above
exceptional circumstances were counted, DG-A availability exceeded 97%.
For contractual purposes, declared DG-B outages totaled 13 days of 163 in-service days for an
availability of 92%.
With advance notice by EN to BPA, the Demonstration Agreement provided for a single 2-hour
outage per calendar month to accommodate routine installation of security patches at the PNNL

BPA-EN Demonstration Final Report 21
EIOC servers hosting the DRACS. In practice, these patches never resulted in the DRACS
unavailability but were provided for as a precaution.
Load Asset Performance City of Richland DVR – City of Richland’s performance rate was 97%, successfully responding
to 66 out of 68 events.
Event 1502-059 was unsuccessful on March 19th due to three transformers in two substations
having been taken off-line for troubleshooting. This resulted in 742 kW of 850 kW delivered.
Event 1512-135 was unsuccessful on 12/30. It was determined the regional transmission
system, supplying City of Richland, likely experienced a short-duration voltage spike which in
turn was interpreted by the DRACS as a reduction in load response. The spike appeared near
simultaneously across all monitored voltage points (over 60) with no corresponding voltage
control change signals, thus no reduction in response occurred. This incident resulted in a
lesson learned for future implementation of DVR-based demand response assets.
Cowlitz PUD/NORPAC – Cowlitz PUD and NORPAC’s performance rate was 95.59%,
successfully responding to 65 out of 68 events.
Event 1506-083 was called on June 28th, and was unsuccessful. The waste water treatment
facility that serves Weyerhaeuser’s Longview WA complex, which hosts the NORPAC facility,
incurred a contingency condition Saturday, 6/26, which limited its processing through put
capacity. Initial assessments by Weyerhaeuser site staff determined NORPAC would not be
impacted. As matters developed, however, NORPAC was asked to shut down just after
midnight on Sunday morning in order to preclude Weyerhaeuser from exceeding its waste water
discharge permit standards. As a result, when the event was called several hours later,
NORPAC did not respond, not having any dispatchable load available, and thus the
Demonstration failed the event.
Event 1512-131 failed due to NORPAC not achieving its obligated 27,880 kW capacity in the
10-minute ramp. Post-event findings indicated the crew was not clear of expected actions, and
secured only 3 of the 9 operating refiner lines to respond to the event signal. Remarkably, this is
arguably the only instance in the Demonstration where human actions or inactions, caused an
unsuccessful event.
Event 1512-133 was called on 12/17, and failed due to NORPAC having shut down earlier in the
morning to repair a steam leak that had developed overnight. The repair required all 9 refiner
lines to temporarily shut down.
Pend Oreille PUD/PNC – Pend Oreille PUD and Ponderay Newsprint’s performance rate was
94.12%, successfully responding to 16 out of 17 events.
Event 1507-089 was called on July 14 at 13:30. Ponderay happened to be engaged in
operations recovery, ramping up, so its load increased rather than decreased from 13:10 –
13:14, which contributed to the combined loads of Dispatch Groups A and B to fall below 35,000
kW during these minutes.

BPA-EN Demonstration Final Report 22
Powin Energy – Powin Energy’s performance rate was 70.59%, responding successfully to 48
out of 68 events.
Powin’s unsuccessful events were caused primarily by communication challenges on Powin’s
side of the interface which were resolved as they were identified. None of its failed events
contributed to any failures to Dispatch Group A.
Energy Northwest Lessons Learned
Utility Engagement Responding, in part, to feedback from multiple public utilities’ experience in demand side
programs elsewhere, the EN Team committed to a firm policy of engaging a prospective load’s
hosting utility. This policy came to be very strongly recognized and supported by regional public
utilities. Some further aspects:
• Recruiting of loads for demand side programs within a non-balancing authority host utility
introduces potentially disruptive influences to that utility’s system management. It can be
particularly adverse when the utility is not a participant to the transaction.
• A further concern identified was the utilities’ observation that the most cost-effective load
prospects available among a host utility’s customers were targeted for the demand side
programs. Should a utility subsequently find itself in need of demand side resources those
customers, having committed to other transactions or having made investment in
communications/control infrastructure, are less available for the utility’s own programs.
• Demand side programs are very much in use elsewhere in the US. Many regional
commercial and industrial utility customers participate, at a corporate level, in other markets
and thus can be very familiar with the practice. The incremental revenues earned as
incentives can contribute favorably to the bottom line. Host utilities, having no need for
demand side resources themselves, saw this Demonstration as an opportunity to meet their
customers’ interest while ensuring them a positive role in the transaction. Again, this was a
source of strong interest in and support for the Demonstration.
DRACS Development & Deployment The DRACS was absolutely key to the Demonstration’s functionality and operability and
performed very well throughout the course of the Demonstration. Some aspects might have
been improved however if circumstances had allowed.
• A more timely articulation of BPA’s requirements, specifications, and expectations for the
Demonstration’s communications, control, and reporting functionality, and particularly its
security aspects, would have substantially facilitated the design and implementation effort.
• Alignment of EN and BPA expectations “on the fly”, while more challenging than it might
have been, was accomplished nonetheless on the strength of superb efforts by both BPA
and EN’s development teams.

BPA-EN Demonstration Final Report 23
• The one event fail, on June 29, 2015, attributable to mis-operation of the DRACS occurred
after EN/ and RAI had undertaken to better align DRACS outage notification and
management functionality with BPA’s expectations. An unanticipated effect of the coding
changes resulted in the DRACS indicating its readiness to respond to events when it
remained in outage mode. Thus, when the subsequent event initiation signal was received
from DROMS, DRACS did not timely initiate load assets’ response and the event failed. The
lesson learned was that any changes made to coding potentially affecting core functionality
should be followed by a comprehensive full-spectrum system testing.
• Allen Bradley Device Accommodations – For both PNC and NORPAC, it was necessary to
interface the on-site SCADA Nexus communications gateway to the respective facilities’
Allen Bradley PLC based plant systems. Both sites required the use of a “Prosoft” card, a
relatively uncommon device, to make the connection and resulted in a substantial effort to
accommodate during deployment especially on the part of plant controls staff. Since then,
RAI has incorporated the Allen Bradley communication protocols directly into its SCADA
Nexus device, eliminating the need for the Prosoft card. Future installations should be
greatly facilitated.
Outage Notification The Demonstration Agreement provided for EN giving BPA a 48-hour minimum notification to
put the Demonstration resource into outage and proved to be adequate for scheduled outages
when they occurred. Forced outages though, when equipment casualties or failure of support
infrastructure and services (not under direct control of the load assets) resulted in unexpected
loss of the loads available for response, were not supported.
On numerous occasions through the Demonstration such forced outages occurred, were
resolved, and operations restored in timeframes, and with a degree of uncertainty, that a
Demonstration resource outage could not be timely implemented. EN timely communicated
with BPA project and operating staffs as circumstances developed but neither could truly
effectively manage the situations to either’s needs.
Forced outages are an inevitable aspect of industrial loads yet the reliability requirements of
meeting BPA’s system operational needs must be met. Potential accommodations to address
this challenge should be more completely explored for future demand side programs.
Performance Criteria & Data Retention Requirements One-Minute Compliance – The Demonstration Agreement required that the load response
required capacity be achieved each minute.
Industrial facilities are complex highly interdependent facilities. It was found by NORPAC and
PNC particularly that loads could be reasonably managed against unexpected circumstances.
An example of unexpected circumstances observed was a load starting up elsewhere in the
facility, not directly under control of the facility process operators. The one minute compliance
rule precluded a load increase from being identified and actions taken to compensate.

BPA-EN Demonstration Final Report 24
Alternative compliance criteria that might still meet BPA needs but provide a better opportunity
to manage loads should be explored. An example might be to use a rolling 5-minute or longer
load average compliance window, or to discard the highest and lowest 1-minute reads in a given
period.
The one-minute criteria required the industrial load asset to be much more conservative in its
load response offering in turn resulting in often significant over-response. More efficient
utilization of the load asset’s actual response could be beneficial to both the asset itself and the
asset customer’s (BPA) to rely on and thus benefit from the load response.
DVR Data Collection and Retention – The Demonstration performance criteria relied on 1-
minute average load response reporting. Generating those 1-minute data points relied on data
collected from field devices at 5 to 10-second intervals or less.
A Demonstration requirement was that all such “raw” data points be retained and archived.
Over the course of the 12-month Demonstration over 2 billion lines of data were generated. By
a substantial margin, most of that data was generated from the City of Richland’s DVR
installation.
Contemplating future programs, with likely multiple utility participants fielding DVR-based or
other data-intensive assets, consideration should be given to keeping the raw data at the “data
catcher” level, rather than at DRACS, such data can at need be retained and downloaded for
verification or research purposes but would not create such a substantial data management and
archiving burden.
Participant Lessons Learned City of Richland - An often expressed concern of host utilities when contemplating demand side
programs is the prospect of reducing energy sales due to the increased “downtime” of loads.
For the Demonstration, it is the consensus of participating utilities that, in this case, the feared
reductions did not occur. Arguably, energy sales may have increased at some nominal level. By
load asset type:
• Demand Voltage Response (DVR) Load Loss – City of Richland observed indications
that, subsequent to an event’s 90-minute duration load reduction, a load recovery period
occurred. While not confirmed, it seems reasonable that some resistive customer loads,
such as space heating which voltage reduction most effectively impact, tend to shift in
time rather than be displaced. This would not be true of, for example, lighting loads but
overall, the observation is DVR seems to have minimal to no impact on overall energy
sales for City of Richland.
• DVR Impacts on Service Quality – In implementing its DVR program, incremental voltage
reductions were set at 2.5% for 13 of its 15 LTCs. On two LTCs which served loads
potentially more sensitive to voltage fluctuations, the voltage change increment was set at
1.5%. During the Demonstration run City of Richland received no customer complaints
regarding power quality that might be attributed to DVR operations.

BPA-EN Demonstration Final Report 25
Cowlitz PUD/NORPAC – They were verifiably one of the more successful load asset
participants in the Demonstration, consistently performing at a high level in both reliability and in
large scale response. NORPAC shut down two of its “TMP Mill” refining lines, each with four
5,000 to 6,000 hp electric motors, plus associated support system loads. NORPAC relies on
close coordination of its nine refining lines to supply a steady supply of suitably graded cellulose
fiber in support of its three on-site paper manufacturing machines. To fulfil its paper customers’
needs, the operation is intended to operate 24/7 year-round with minimal plant-wide outages for
maintenance. Refiner lines are removed from and placed in service routinely as changes in
feedstock wood species, fiber grade, and paper production schedules occur.
• Routine refiner shut downs and subsequent restarts are accomplished in as little as three
to five minutes, with minimal operational impacts. A forced refiner shutdown, as occurred
on December 23, 2015, precipitated by weather-related disruptions in BPA’s regional
grid, require a much more convoluted refiner start up, under some conditions taking days
to fully recover.
• NORPAC found itself initially able to readily accommodate the further disruption caused
by the Demonstration’s 90-minute maximum duration events, relying on the 24-hour
event recovery period and its normal practices to ensure continuity in its operations and
product quality control. As the Demonstration progressed and NORPAC’s order book
improved, operational margins narrowed and NORPAC found itself at times in
circumstances that one additional disruption just before or after an event had potential to
adversely impact its production. Detailed discussion with NORPAC management and
operations staff indicated several encouraging means by which the concerns might be
effectively addressed should NORPAC be afforded the opportunity to continue in future
demand side programs.
BPA Lessons Learned
Contracting As stated earlier, the contract between BPA and Energy Northwest was very specific as to the
terms of the Demonstration. While it took a significant time investment to lay out each portion
of the Demonstration, BPA and EN found that this process ensured strong design, including the
metering plan by participants, clear performance criteria, system requirements, information
security and event parameters. When the 12 month event phase started, BPA and EN found
that the team was well prepared to execute.
Nonetheless, issues arose during event testing – e.g. how to measure accurately measure
dispatchable voltage regulation, whether a thirty minutes prior baseline methodology was
suitable for a ten minute notification product, how to add an asset that required a separate pre-
scheduled process. EN and BPA took a flexible approach to making contract modifications, in
the spirit of a learning demonstration, throughout the Demonstration to accommodate these
issues. This proved effective for all parties.

BPA-EN Demonstration Final Report 26
Operations 1. DR Operations Lead designated: Designating and having a member of the operations
team working closely with the project team through design, implementation, and testing
was critical to BPA’s operational engagement and success.
2. Processes: Clearly defining dispatch processes including all touch points and approvals
with the operations and management teams was important as well as documenting the
process and updating as needed.
3. Training: Operations staff work hours made a traditional group training approach
ineffective. The DR Operations Lead coordinated individual trainings for staff, ensuring
each dispatcher was trained before testing began. During early testing the DR
Operations Lead was present during event scheduling and dispatch to support
operators. As operators became more comfortable with the system and product they
transitioned from pre-scheduled events to events triggered based on system conditions.
Systems 1. Vendor Collaboration: Having a project kickoff and in person testing systems with BPA,
EN, EN’s system technology partner RAI, and AutoGrid was a key element in system
implementation and integration successes. They were able to build rapport that allowed
them to tackle challenges as a team. During onsite testing vendors were able to fix bugs
in real time and retest, saving repetitive testing cycles.
2. Virtual Private Network (VPN): Installation of the VPN and subsequent stability of the
VPN was challenging and took some time to figure out across all involved including the
Amazon cloud vendor, AutoGrid, EN, RAI, PNNL, and BPA IT resources. We learned
that having a backup VPN enabled and a working IP Service Level Agreement monitor
resulted in stability. We learned this by pushing the vendors and engaging the right
networking resources at BPA. There are maintenance windows for all involved which
impacted the ability to make rapid changes and they should be considered in the future.
3. User collaboration: The early involvement of schedulers and scheduling technical
support led to great success in user interface requirements and the end product.
Because of those efforts the system met users’ expectations and has been well adopted.
4. Software Customizations: BPA limited customizations and AutoGrid was able to
integrate a majority of our requirements that were new for them into their base product.
No code is being maintained especially for BPA.
Go Live Process The team was concerned about entering into the event demonstration phase with incentive
payments and not having criteria defined. As such, a formal set of criteria was set (see below)
and entrance into test events would not be contemplated until the conditions were satisfied and
signed off by project leaders from BPA and Energy Northwest.

BPA-EN Demonstration Final Report 27
Go Live Entrance Criteria
1. Contracting:
• EN and BPA contract is fully executed. Contracts are fully executed with utilities and/or end loads that will be participating in the EN Demonstration Phase I.
2. EN Communication Event Ready.
• EN to confirm DRACS is enabled for two way communications. All OpenADR 2.0b services implemented are validated as passing using the QualityLogic testing harness.
3. BPA Duty Scheduling personnel training.
• BPA has trained power schedulers in the Duty Scheduling Center (DSC) on the objectives of the Demonstration, the pre-event process, and how to execute events end-to-end.
4. Successful Integration with BPA DRMS Test.
• BPA and EN will conduct two successful system integration tests. These tests will necessitate load movement of a non-deemed resource to verify the ability to send back meter data using EiReport. See Interop testing plan.
5. Settlement.
• Measurement and settlement worksheets will be produced and reviewed (by each party) to agree on calculations and methodology. These will be the production templates to be used after the go live date. Will include an Event-by-Event summary details, and supporting graphs to show performance for each asset.
6. Successful End-to-end Test Runs, including Communications, Load Movement and Measurement and Verification. BPA and EN will conduct a dry run test (communications, load movement, and measurement and verification), tests to include all loads for Day One go-live.
a) Communications.
a. The BPA Demand Response Management System (DRMS) accurately
communicates event requests to the Energy Northwest DRACS.
b. EN DRACS accurately accepts and acts on DRMS-originated event request.
The Energy Northwest DRACS provides two-way communication between
the loads responding to Events under this contract and BPA’s DRMS.
c. The Energy Northwest DRACS is able to ingest BPA’s event requests,
communicate to end loads, and provide back to BPA the defined event data.
b) Load movement.
a. Loads move as requested from the BPA DRMS within the ramping period
(10 minutes) for each of the three participating loads.
b. Loads move to the degree (kW) agreed with Energy Northwest prior to the
dry run.
c) Data and Settlement.
a. The DRACS provides a central repository for all data associated with
response to events. Energy Northwest provide a CSV-formatted data file
with complete and accurate raw data as defined above for the period 700am

BPA-EN Demonstration Final Report 28
Go Live Entrance Criteria
through 1250pm on February 3rd.
b. Energy Northwest provides BPA with a settlement package (settlement and
worksheet file) in the pre-agreed template with accurate data for the dry-run
event.
7. Final Go-Live Meeting.
• Final check-off from stakeholder list that we are ready to enter payment phase.
• Formal sign-off authorized by project leads from BPA and Energy Northwest:
Communications The team held regular project calls (weekly, then bi-weekly) throughout the design,
implementation and event testing phases of the Demonstration. These calls were critical to
work through issues quickly and included representatives of BPA, AutoGrid, Energy Northwest,
and RAI.
Slice Customer Billing and Scheduling As a BPA Slice customer, Cowlitz is required to submit both energy and transmission schedules
to BPA no later than 30 minutes before the hour. Once those schedules are submitted they
may not be changed. For each monthly bill, after-the-fact accounting is done to quantify just
how accurate those schedules were. For actual loads that run higher than their scheduled load,
Slice customers are charged an indexed rate for any additional energy taken for that hour. For
actual loads that run lower than their scheduled load, Slice customers are credited an indexed
rate for any energy that was scheduled but not taken. These charges/credits are subject to
varying indexed rates depending upon how large the variance was from what was
scheduled. Below is a summary of those “bands” used under their BPA contract.
Band 1 – the greater of 1.5% of load or 2 MW whichever is larger – this is settled using physical
energy
Band 2 - between band 1 and 7.5% of load or 10 MW whichever is larger – this is settled as
paying the Slicer 90% of index for any energy scheduled but NOT taken or charging the Slicer
110% of index for any energy taken which wasn’t scheduled.
Band 3 – Greater than band 2 - this is settled as paying the Slicer 75% of index for any energy
scheduled but NOT taken or charging the Slicer 125% of index for any energy taken which
wasn’t scheduled.
A review of the Energy Imbalance (EI) worksheets for Cowlitz show that they almost never go
into Band 3 with their hourly scheduling variances.
BPA-EN Demonstration Final Report 29
The Issue
Under the Demonstration, Energy Northwest was asking Cowlitz to drop load within the hour
after their schedules were submitted. This created a situation where energy imbalance credits
resulted for Cowlitz as a result of BPAs request to drop load. This means that if BPA paid them
for the energy not taken when they deployed, then BPA would in essence be paying them twice
for responding to BPAs request to drop load.
Solution
Our solution was to simply leave the charges/credits as they occur including the load reductions
that resulted from BPA deployment requests for the Demonstration. This approach resulted in
Cowlitz getting a slightly higher energy credit during the periods in which they responded to
load. Cowlitz’s demand response, compared to their total load served by BPA, is on the order
of 4.86% (roughly 29MW/597MW), so about half of their variance would be within Band 1, with
the other half spilling over into Band 2. This means BPA would be paying them an energy credit
at less than index for the Band 2 portion of the energy not taken (reduced). The only down side
to this approach would be that BPA would in essence be paying Cowlitz for the energy not taken
(either in energy credits or payment), unlike the other participants in the Demonstration who
were not compensated at all. Given the relatively small amount of this credit compared to the
capacity payment, it seemed reasonable for this demonstration and was by far the easiest
approach to implement.
Conclusion This demonstration provided tremendous learnings around developing, contracting,
participating, utilizing and supporting a demand response aggregation model in the Pacific
Northwest, and in this case, a model of how a public entity works with public power utilities to
bring a wholesale service. As BPA continues to explore the use of demand response and
distributed energy resources these learnings and the platforms built during this demonstration
will be leveraged.
From the beginning, BPA recognized that demand response must meet several objectives to
succeed at BPA: it has to be highly reliable, it has to be cost-effective, and it has to be easy to
use and deploy. In each of these areas, the demonstration built a track record that shows
promise for the future. Energy Northwest built a comprehensive program working with BPA to
meet those objectives, as they were able to prove their ability to act as an aggregator, delivering
an automated, highly reliable, fast DR product. Both BPA and Energy Northwest were nationally
recognized for their efforts around this very successful ground breaking DR project. The team
was recognized nationally with the Peak Load Management Alliance Pacesetter award.
Additionally, this project received great interest from across the US from various publications
and news organizations. Details of the Pacesetter Award and the numerous interviews done on
this project can be found in Appendix E.
BPA will continue exploring what types of DR are going to best meet current and future needs,
whether it’s for supplementing the federal hydro system in the supply of balancing capacity,

BPA-EN Demonstration Final Report 30
reducing temporary transmission constraints or deferring transmission investments, meeting
winter or summer peak load events, or potentially increasing consumption when wind and hydro
power is generating more than the system needs.
Appendix A – Event Summaries
Appendix A-Event Summaries.pdf
Appendix B – DRACS Functional Schematic

BPA-EN Demonstration Final Report 31
Appendix C: Project Recognition and News
• PLMA PaceSetter Award
o BPA - EnergyNorthwest Demand Response Projects Wins National Award
• Forbes:
o 'Demand Response' Is How The Smart Grid Will Save Us Billions
• Greentech Media:
o How Bonneville is Tapping Demand Response to Balance Power from Dams, Wind and
Sun
• Utility Dive:
o Why BPA sees aggregation as the future of demand response
• Yahoo Finance, Power Engineering, Street Insider, Market Wired:
o Bonneville Power Implements Fast and Intelligent Demand Response Demonstrations
With AutoGrid
• Clearing Up:
o Demand Response Gathering Momentum (3/6/2015)
o Council Find EE DR Best Short Term Options for Regional Capacity (6/12/15)
o DR Deployed in Phase 3 of BPA-ENW Aggregation Pilot (11/6/15)

BPA-EN Demonstration Final Report 32
Appendix D – Deep Dive Data Analysis: City of Richland DVR
Introduction Demand voltage reduction (DVR) is a demand response (DR) measure which involves reducing
the substation bus voltage in order to achieve a reduction in power load (kW) for some period of
time. In this project, the maximum event window was 90 minutes. Although DVR is believed to
be an effective capacity reduction measure it is challenging to measure the actual kW reduction.
This is because the effective load reduction is about the same as the naturally occurring minute-
by-minute change in load. That is, a 100 MW substation load may be changing by 1-2 MW from
one minute to the next on its own accord, which is approximately the same capacity reduction
expected from 2-3% change in voltage setting.
BPA-dispatched DVR is a new DR measure for BPA, (BPA had implemented several past utility-
dispatched DVR pilots, field tests, and R&D projects, going back to 1984.). Part of the
motivation to accept the measure into this project was to allow the opportunity to record data on
the measure and study it further. Because of this challenge and lack of recent experience with
DVR, the project contractually used a constant DVR factor method to calculate capacity
reduction (kW). The DVR factor is a ratio of percent kW reduction per percent voltage change.
Contractually, DVR factor was set to 0.5 until mid-June, then increased 0.75. Capacity
reduction using DVR factor was calculated by multiplying the substation power by the DVR
factor by the voltage change percent reduction, on a minute-by-minute basis, using one minute
average load profiling substation data. In this project, the capacity delivered for the event was
the minimum one minute number during the event, which is consistent with a balancing capacity
product.
The study portion of the project deployed a strategy to attempt to measure DVR factor by
assuming the capacity reduction in kW is the observed reduction in load in the first minute of
voltage change. This load change is a mixture of the voltage change effect and the naturally
occurring change in load for the substation. It was hoped that a statistically significance could
be observed in this method. If the observed change in load in that first minute is assumed to the
caused voltage reduction then a DVR factor can be calculated, and thus compared to the ones
used contractually.
Calculation Methodology Because DVR measurement and verification (M&V) is still in its infancy, and the subtleties are
not widely understood even by practitioners, this simplified model was compared to a more
traditionally calculated DVR factor. Minute-by-minute information about substation bus voltage,
voltage regulator setting, and substation load for fifteen substations was provided for a window
of time around each voltage control event. All voltage data was converted to 120V basis. For
each event, a DVR factor was calculated for each substation using the equation:

BPA-EN Demonstration Final Report 33
(Pt-1 - Pt+1)/Pt-1
_______________________________________________________________________________
(Vt-1 - Vt+1)/Vt-1
Where:
P = Power
V = Voltage (120V basis)
t=0 Event start minute (minute during which voltage regulator setting was changed)
Or, to put that in words: (Power/Load (in kW) at t-1 minus Load (in kW) at t+1 divided by Load
(in kW) at t-1) divided by (Voltage t-1 minute minus voltage t+1 min) divided by Voltage t-1).
The first minute of voltage transition was omitted from the calculation. This is the minute when
we first see a change in the voltage regulator setting. The reason for omitting this data point is
to allow time for the regulator to establish a new steady-state voltage.
Although straightforward, this equation can run into trouble if the voltages happen to be equal
before and after the event. While there are many solutions to this problem, for this analysis any
substation where this happened in a given event was ignored for that event. This should only
happen when the substation voltage setting didn’t change, but it is possible this may throw out a
viable substation and may lead to underreporting. This question was not reviewed.
The first methodological question to arise was how to derive an overall DVR factor for each
event. Originally, the calculated DVR factors were simply averaged across all 15 substations,
but because the substations did not have an evenly distributed load, it was decided a weighted
average (based on substation load percentage of total city load the minute before the voltage
setting change �Pt-1 (time = t-1) would be used.
This led to some DVR factor numbers far outside of the expected values of 0.5-1.5. These
events were reviewed, and in most cases a single substation was throwing the numbers off. In
most of those cases, it was because some substations were not involved in some events. This
highlights a problem with applying the calculated factor to load across substations; it is more
logically sound to apply the factor only to participating substations. In most cases this does not
change the results much, but it seems prudent to include this in any M&V strategy going
forward. In this analysis, peak load reductions were reported based on participating substations
only.
Appendix E contains a summary table of analysis results for the 62 events for which data was
provided and analyzed.
Data Anomalies Events that had data anomalies are highlighted in bold in Appendix E. Events highlighted in blue
were removed from analysis.
The nature of each anomaly is summarized in Table 1, below.

BPA-EN Demonstration Final Report 34
Table 1: Anomalous Events
Description Count Event #s Used in Analysis
Total events 62
1 No voltage change occurred 2 84, 105 No
2 Event broke across minute 2 50, 107 No
3 Manual adjustment due to large load
change on one substation (SH1)
2 120, 127 Yes
4 One minute voltage setting reversion
in the middle of the event
2 130, 135 Yes
5 Event duration less than 15 minutes 8 106, 107, 110,
112, 132, 135,
136, 138
Yes
The first category of anomaly is fairly straightforward – voltage setting was not changed during
that event. Category 2 anomalies occurred in instances when the voltage setting change for
some substations occurred in one minute appeared during the next on other feeders.
Presumably this is due to bad luck; communication is not quite instantaneous and signals may
have arrived seconds apart, but our data granularity is insufficient for this to be visible. While it
would be possible to calculate DVR factors based on the different minutes when the command
was reached, this added analytical challenge was not tackled during this analysis.
Category 3 problems are ones where the DVR factor came up above 2 even when corrected for
substation participation. In both cases, investigation revealed that one factor had a very large
load drop over the 2 minute period (8.6% and 4.0%). In consultation with a demand response
(DR) subject matter expert (Mr. Tony Koch), it was decided that this substation should be left
out of the calculation. In both cases the same substation (SH1) was at issue, leading to the
hypothesis that it feeds a large industrial load that is sensitive to voltage changes, or has
naturally occurring large swings in load. It should be noted that in the statistical analysis, this
substation was considered to be not-participating and the load drop on this substation was not
included in the reported savings (to be consistent across events). This substation was heavily
loaded, so this may skew the results slightly, implying that less load reduction was achieved.
Categories 4 & 5 represent issues that were discovered during the deep dive analysis that may
or may not be issues in future DR projects. No explanation was developed for these issues;
they may be artefacts of the data received, communication errors, or have other causes. They
are reported here for awareness purposes. During two events, for one minute during the event,
the reported voltage setting reverted to its pre-event setting, then went back the next minute

BPA-EN Demonstration Final Report 35
(Category 4). During several events in the latter half of the project, voltage settings were
changed for less than 15 minutes (Category 5), rather than the called for event duration.
Statistical Analysis After resolving the issues as described in the Calculation Methodology section, events with
Category 1 & 2 errors were removed from the data set. This left 58 events for statistical
analysis. Several factors that might affect DVR factor or load reduction were hypothesized.
These included season, time of day (minutes past midnight), weekday vs weekend, and outdoor
air temperature during event. Dummy variables were created for calendar seasons, where
summer =the three hottest months of the Typical Meteorological Year (TMY3) (June, July,
August) and winter = the three coldest (December through February); and two specific periods
of interest for peak shaving, namely: Morning Peak (6-9 AM) and Afternoon Peak (15-19:00).
Table 2: Monthly Temperature by Month (TMY3 Data, Pasco, WA, Site: 727845)
Average Monthly
Temperature (deg
F)
Season
Jan 35 Winter
Feb 38 Winter
Mar 46
Apr 55
May 62
Jun 70 Summer
Jul 76 Summer
Aug 72 Summer
Sep 61
Oct 50
Nov 42
Dec 37 Winter
It should be noted that events were not randomly distributed. The following histograms illustrate
the distribution of events by month, time of day, and outdoor air temperature.

BPA-EN Demonstration Final Report 36
Table 3: Event Frequency by Month
Table 4: Event Frequency by Time of Day

BPA-EN Demonstration Final Report 37
Table 5: Event Frequency by Outdoor Air Temperature
Table 6: Regression Results for DVR Factor
Coefficient
s
Standar
d Error t Stat
P-
value
Lower
95%
Upper
95%
Intercept 1.147 0.11 10.85 0.000 0.93 1.36
Morning Peak (6-9 AM) 0.031 0.07 0.46 0.651 -0.11 0.17
Afternoon Peak -0.058 0.08 -0.75 0.457 -0.21 0.10
Season (Summer) 0.022 0.08 0.29 0.771 -0.13 0.17
Season (Winter) 0.115 0.07 1.76 0.084 -0.02 0.25
weekend -0.083 0.08 -1.05 0.298 -0.24 0.08
Time of Day 0.179 0.15 1.22 0.228 -0.12 0.47
Temp during Event -0.007 0.00 -3.48 0.001 -0.01 0.00
The classical way to determine whether a value is significant is to look at the p-value, where a
variable with a p-value below 0.2 is significant (the null hypothesis is rejected). For this
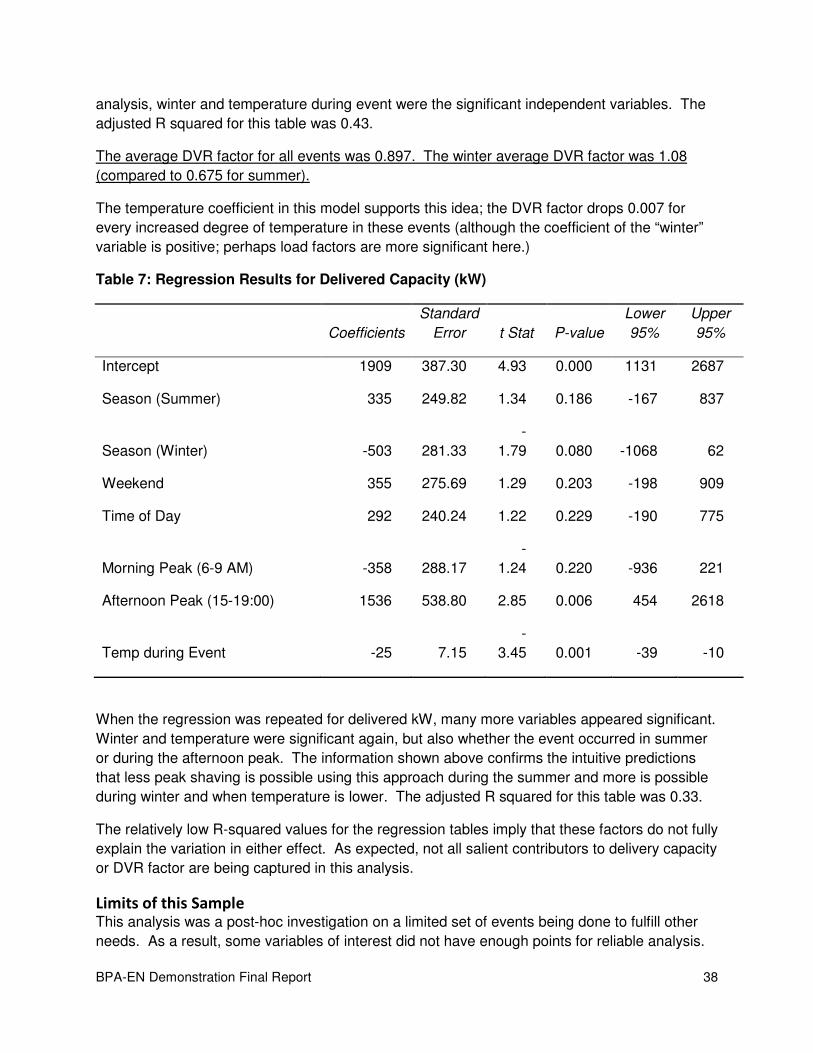
BPA-EN Demonstration Final Report 38
analysis, winter and temperature during event were the significant independent variables. The
adjusted R squared for this table was 0.43.
The average DVR factor for all events was 0.897. The winter average DVR factor was 1.08
(compared to 0.675 for summer).
The temperature coefficient in this model supports this idea; the DVR factor drops 0.007 for
every increased degree of temperature in these events (although the coefficient of the “winter”
variable is positive; perhaps load factors are more significant here.)
Table 7: Regression Results for Delivered Capacity (kW)
Coefficients
Standard
Error t Stat P-value
Lower
95%
Upper
95%
Intercept 1909 387.30 4.93 0.000 1131 2687
Season (Summer) 335 249.82 1.34 0.186 -167 837
Season (Winter) -503 281.33
-
1.79 0.080 -1068 62
Weekend 355 275.69 1.29 0.203 -198 909
Time of Day 292 240.24 1.22 0.229 -190 775
Morning Peak (6-9 AM) -358 288.17
-
1.24 0.220 -936 221
Afternoon Peak (15-19:00) 1536 538.80 2.85 0.006 454 2618
Temp during Event -25 7.15
-
3.45 0.001 -39 -10
When the regression was repeated for delivered kW, many more variables appeared significant.
Winter and temperature were significant again, but also whether the event occurred in summer
or during the afternoon peak. The information shown above confirms the intuitive predictions
that less peak shaving is possible using this approach during the summer and more is possible
during winter and when temperature is lower. The adjusted R squared for this table was 0.33.
The relatively low R-squared values for the regression tables imply that these factors do not fully
explain the variation in either effect. As expected, not all salient contributors to delivery capacity
or DVR factor are being captured in this analysis.
Limits of this Sample This analysis was a post-hoc investigation on a limited set of events being done to fulfill other
needs. As a result, some variables of interest did not have enough points for reliable analysis.

BPA-EN Demonstration Final Report 39
Thus, some factors could not be reliably investigated. Weekday summer afternoon peaks are of
particular interest to utilities, but only two events with these characteristics occurred. The
events for each variable are summarized in Table 8.
Table 8: Distribution of Variables
Observations Mean Standard
Deviation Minimum Maximum
Weighted DVR Factor 58 0.85 0.23 0.41 1.34
Season (Summer) 58 0.26 0.44 0 1
Season (Winter) 58 0.22 0.42 0 1
Weekend 58 0.10 0.31 0 1
Time of Day 58 11:33:48
AM
306
minutes
12:39:00
AM 9:35:00 PM
Morning Peak (6-9 AM) 58 0.17 0.38 0 1
Afternoon Peak (15-
19:00) 58 0.17 0.38 0 1
Temp during Event 58 59.8 20.7 18.5 100.0

BPA-EN Demonstration Final Report 40
Conclusions Overall, this analysis seemed to validate a DVR factor of 0.5. It pointed to the idea that a
simplified DVR factor might be raised in the winter (possibly 0.8) and lowered for the summer
(possibly 0.6). It is important to note that DVR factor is reflective of the type of load being
controlled, so this analysis may not be universally applicable. Constant impedance loads
produce the highest DVR factors, whereas constant current loads produce lower DVR factors,
and constant power loads produce DVR factors of zero1.
It also showed a few areas where oversight might be warranted, in order to ensure reliable peak
shaving, namely whether voltage setting remains constant during the entire event and whether
the voltage setting is changed for the entire duration of event called.
It also points to a few areas that could use further discussion, namely the proper method for
dealing with large load changes within a substation during an event and event persistence – the
peak reduction was considered at a single point in time, and any decay effects during the event
were not considered. Further analysis should include a comparison to DVR factors based on
voltage setting rather than actual voltage to compare the results.
1 Examples of constant impedance loads are electric resistance heating or regular AC motors. An
example of a constant current load is LED lighting, and a variable frequency drive (VFD) is a constant power load.

OAT = Outdoor Air Temperature
Reduction = Capacity Reduction BPA-EN Demonstration Final Report 41
VS = Voltage Setting
Appendix E: Summary of Cleaned Data for All Events
# Event date Event Start
(Time of
Day)
OAT
(deg F)
Start
kW
Start kW
Participating
Delta End kW End kW
Participating
Weighted Avg
DVR Factor
Participating
Avg DVR
Factor
Participating
All Subs
Reduction
(kW)
Reduction
Participating
(kW)
Delta Avg VS
Change
49 Tue 2/10/2015 10:15 AM 56 98,500 98,500 - 93,400 93,400 0.86 0.91 2039 2039 - 2.30%
50 Wed 2/18/2015 2:45 PM 54 97,700 97,700 - 98,700 98,700 #N/A 1.05 2180 2180 - 2.29%
51 Fri 2/20/2015 11:27 AM 57 96,800 96,800 - 96,100 96,100 1.04 0.85 1526 1526 - 2.29%
52 Tue 2/24/2015 7:21 AM 31 142,100 142,100 - 128,600 128,600 0.97 1.21 3629 3629 - 2.29%
53 Thu 2/26/2015 7:20 PM 48 99,900 99,900 - 102,900 102,900 1.30 0.75 2001 2001 - 2.29%
54 Mon 3/2/2015 2:24 AM 31 86,900 71,300 15,600 90,300 74,500 0.76 0.98 872 924 (52) 2.35%
55 Wed 3/11/2015 3:43 PM 66 87,000 87,000 - 89,400 89,400 0.81 0.80 1380 1380 - 2.29%
58 Mon 3/16/2015 5:33 PM 60 91,500 91,500 - 93,300 93,300 0.75 0.93 1451 1451 - 2.29%
65 Fri 3/27/2015 6:25 AM 41 85,000 85,000 - 92,500 92,500 0.79 1.05 699 699 - 2.35%
67 Wed 4/8/2015 9:34 AM 56 94,800 94,800 - 92,200 92,200 0.73 0.87 1176 1176 - 2.35%
69 Thu 4/16/2015 9:15 AM 50 100,400 100,400 - 97,600 97,600 0.79 0.54 1721 1721 - 2.35%
70 Tue 4/21/2015 12:15 PM 76 97,100 97,100 - 100,300 100,300 0.49 1.03 40 40 - 2.35%
71 Thu 4/23/2015 12:30 PM 51 88,000 88,000 - 85,500 85,500 0.76 0.71 454 454 - 2.35%

OAT = Outdoor Air Temperature
Reduction = Capacity Reduction BPA-EN Demonstration Final Report 42
VS = Voltage Setting
# Event date Event Start
(Time of
Day)
OAT
(deg F)
Start
kW
Start kW
Participating
Delta End kW End kW
Participating
Weighted Avg
DVR Factor
Participating
Avg DVR
Factor
Participating
All Subs
Reduction
(kW)
Reduction
Participating
(kW)
Delta Avg VS
Change
74 Sun 5/3/2015 7:21 AM 50 74,100 72,700 1,400 79,000 77,500 0.78 0.84 -56 -97 41 2.33%
75 Wed 5/6/2015 3:49 AM 40 69,000 69,000 - 74,300 74,300 0.58 1.06 314 314 - 2.35%
76 Tue 5/19/2015 12:39 AM 59 73,800 68,300 5,500 71,200 65,600 0.92 0.77 1109 1057 52 2.36%
77 Fri 5/22/2015 5:18 PM 80 114,300 114,300 - 107,600 107,600 0.80 1.13 1992 1992 - 2.30%
78 Mon 5/25/2015 5:20 AM 59 68,300 68,300 - 71,700 71,700 0.88 0.76 1068 1068 - 2.30%
79 Tue 5/26/2015 7:27 AM 61 86,700 72,000 14,700 89,700 74,700 0.76 0.60 440 426 14 2.27%
80 Sat 6/6/2015 5:20 PM 93 139,000 139,000 - 134,900 134,900 0.55 0.71 904 904 - 2.29%
81 Fri 6/26/2015 2:21 AM 60 84,100 77,800 6,300 81,900 75,800 0.66 0.71 1079 985 94 2.35%
82 Sat 6/27/2015 3:35 AM 66 90,400 90,400 - 91,100 91,100 0.70 0.70 1422 1422 - 2.29%
83 Sun 6/28/2015 4:40 AM 72 100,400 100,400 - 92,200 92,200 0.66 0.49 928 928 - 2.29%
84 Mon 6/29/2015 4:49 PM 99 171,300 - - 170,600 - #N/A 0.48 -739 0 (739)
85 Mon 7/6/2015 4:00 PM 100 169,100 169,100 - 173,300 173,300 0.47 0.50 627 627 - 2.29%
87 Tue 7/7/2015 5:45 PM 99 173,000 138,800 34,200 165,200 130,900 0.54 0.92 986 1203 (217) 2.25%
90 Tue 7/14/2015 1:10 PM 87 140,000 112,700 27,300 146,300 117,700 0.41 0.76 877 929 (52) 2.32%
91 Wed 7/15/2015 2:55 PM 90 150,200 128,700 21,500 148,100 126,400 0.91 0.82 1032 1270 (238) 2.25%

OAT = Outdoor Air Temperature
Reduction = Capacity Reduction BPA-EN Demonstration Final Report 43
VS = Voltage Setting
# Event date Event Start
(Time of
Day)
OAT
(deg F)
Start
kW
Start kW
Participating
Delta End kW End kW
Participating
Weighted Avg
DVR Factor
Participating
Avg DVR
Factor
Participating
All Subs
Reduction
(kW)
Reduction
Participating
(kW)
Delta Avg VS
Change
94 Sun 7/26/2015 5:00 PM 79 104,000 78,300 25,700 106,700 81,500 0.67 0.76 363 512 (149) 2.30%
96 Fri 7/31/2015 4:00 AM 56 77,200 63,400 13,800 77,400 63,400 0.93 0.98 923 894 29 2.23%
98 Tue 8/4/2015 1:20 PM 91 130,800 114,800 16,000 138,100 121,200 0.67 0.85 937 884 53 2.32%
99 Fri 8/7/2015 11:10 AM 80 104,200 104,200 - 113,100 113,100 0.90 0.47 402 402 - 2.27%
100 Mon 8/10/2015 12:20 PM 86 116,000 70,500 45,500 126,100 75,900 0.82 1.01 773 672 101 2.25%
101 Wed 8/19/2015 1:20 PM 94 140,100 140,100 - 151,800 151,800 0.48 0.60 131 131 - 2.29%
105 Wed 8/26/2015 3:20 PM 93 147,100 - XXX 153,100 - #N/A 0.57 -178 0 (178)
106 Fri 8/28/2015 11:30 AM 81 120,900 120,900 - 121,400 121,400 0.75 0.74 1406 1406 - 2.29%
107 Thu 9/3/2015 10:30 AM 66 101,800 89,800 12,000 106,100 94,100 #N/A 0.63 630 563 67 2.33%
109 Thu 9/10/2015 1:30 PM 84 117,400 117,400 - 128,300 128,300 0.57 1.10 513 513 - 2.29%
110 Fri 9/11/2015 3:30 PM 90 139,400 139,400 - 142,400 142,400 0.58 1.03 1209 1209 - 2.29%
112 Mon 9/14/2015 8:00 AM 60 93,400 68,300 25,100 97,300 71,200 0.83 1.13 669 594 75 2.23%
113 Thu 9/17/2015 5:22 PM 72 103,800 61,600 42,200 98,000 60,700 0.66 0.82 160 947 (787) 2.38%
115 Wed 9/23/2015 8:30 AM 59 95,400 95,400 - 96,000 96,000 0.95 0.85 1720 1720 - 2.29%
119 Thu 10/8/2015 3:11 PM 70 94,900 70,000 24,900 95,200 70,900 1.01 0.70 1282 1122 160 2.33%

OAT = Outdoor Air Temperature
Reduction = Capacity Reduction BPA-EN Demonstration Final Report 44
VS = Voltage Setting
# Event date Event Start
(Time of
Day)
OAT
(deg F)
Start
kW
Start kW
Participating
Delta End kW End kW
Participating
Weighted Avg
DVR Factor
Participating
Avg DVR
Factor
Participating
All Subs
Reduction
(kW)
Reduction
Participating
(kW)
Delta Avg VS
Change
120 Tue 10/20/2015 2:10 PM 71 95,500 95,500 - 96,800 96,800 1.05 1.27 1929 1349 580 2.29%
121 Thu 10/22/2015 10:15 AM 58 81,500 81,500 - 86,100 86,100 0.72 1.07 1166 1166 - 2.35%
122 Tue 10/27/2015 8:15 AM 41 94,600 94,600 - 89,300 89,300 0.83 1.30 1618 1618 - 2.35%
123 Thu 10/29/2015 4:00 PM 67 85,400 85,400 - 88,200 88,200 0.73 1.16 745 745 - 2.35%
124 Fri 11/6/2015 6:30 AM 32 106,400 106,400 - 110,300 110,300 1.19 1.15 2184 2184 - 2.35%
125 Fri 11/13/2015 9:35 PM 60 84,100 84,100 - 74,300 74,300 0.94 1.09 1678 1678 - 2.35%
126 Mon 11/16/2015 11:30 AM 49 94,300 94,300 - 92,200 92,200 1.28 1.14 2457 2457 - 2.35%
127 Tue 11/17/2015 4:00 PM 61 88,000 62,600 25,400 97,100 69,600 0.93 0.77 2175 811 1,363 2.30%
128 Mon 11/23/2015 3:00 PM 30 121,000 121,000 - 129,300 129,300 1.12 1.03 2734 2734 - 2.35%
129 Fri 11/27/2015 8:00 AM 19 147,100 147,100 - 138,700 138,700 1.20 1.11 2628 2628 - 2.35%
130 Tue 12/8/2015 7:00 AM 52 113,100 113,100 - 101,600 101,600 1.24 0.99 2073 2073 - 2.35%
131 Wed 12/9/2015 5:00 PM 50 101,400 95,500 5,900 108,200 102,000 0.76 0.92 750 725 25 2.33%
132 Mon 12/14/2015 12:00 PM 48 97,500 97,500 - 96,300 96,300 1.01 1.34 1535 1535 - 2.35%
133 Thu 12/17/2015 12:00 PM 31 127,300 127,300 - 132,600 132,600 1.18 0.97 2934 2934 - 2.35%
134 Sat 12/26/2015 5:00 PM 31 124,700 109,400 15,300 128,800 113,200 1.05 1.24 1856 1836 20 2.42%
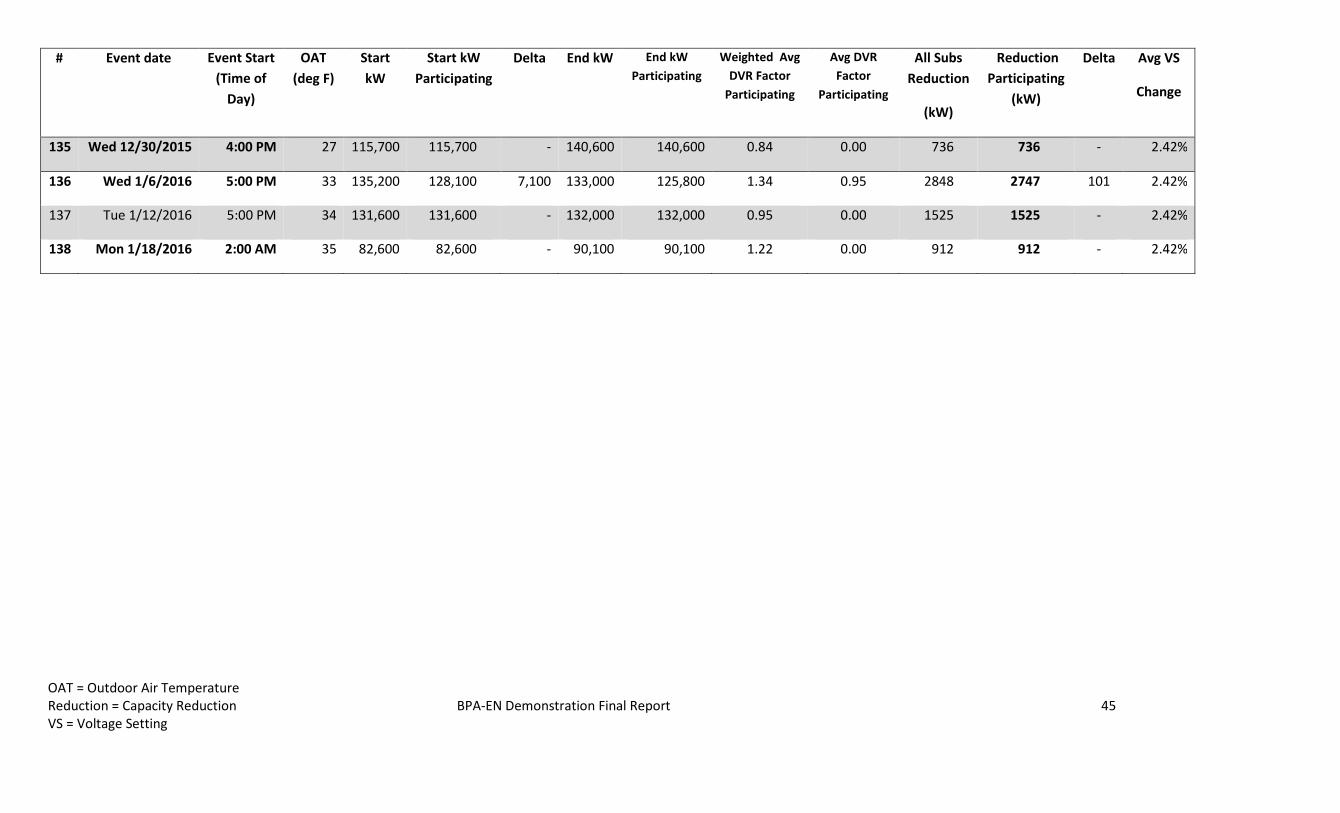
OAT = Outdoor Air Temperature
Reduction = Capacity Reduction BPA-EN Demonstration Final Report 45
VS = Voltage Setting
# Event date Event Start
(Time of
Day)
OAT
(deg F)
Start
kW
Start kW
Participating
Delta End kW End kW
Participating
Weighted Avg
DVR Factor
Participating
Avg DVR
Factor
Participating
All Subs
Reduction
(kW)
Reduction
Participating
(kW)
Delta Avg VS
Change
135 Wed 12/30/2015 4:00 PM 27 115,700 115,700 - 140,600 140,600 0.84 0.00 736 736 - 2.42%
136 Wed 1/6/2016 5:00 PM 33 135,200 128,100 7,100 133,000 125,800 1.34 0.95 2848 2747 101 2.42%
137 Tue 1/12/2016 5:00 PM 34 131,600 131,600 - 132,000 132,000 0.95 0.00 1525 1525 - 2.42%
138 Mon 1/18/2016 2:00 AM 35 82,600 82,600 - 90,100 90,100 1.22 0.00 912 912 - 2.42%