Embed Size (px)
DESCRIPTION
On September 15, 2011 the Economic Development Alliance of Southeast Alberta invited Janet Annelsy, VP of Communications for the Canadian Association of Petroleum Producers (CAPP) to talk about the energy outlook in Canada and more specifically in Alberta and the southeast region.
Citation preview
Janet Annesley – Vice President, CAPP
Outlook for Canadian Oil & Gas Industry
Medicine Hat
September 15, 2011
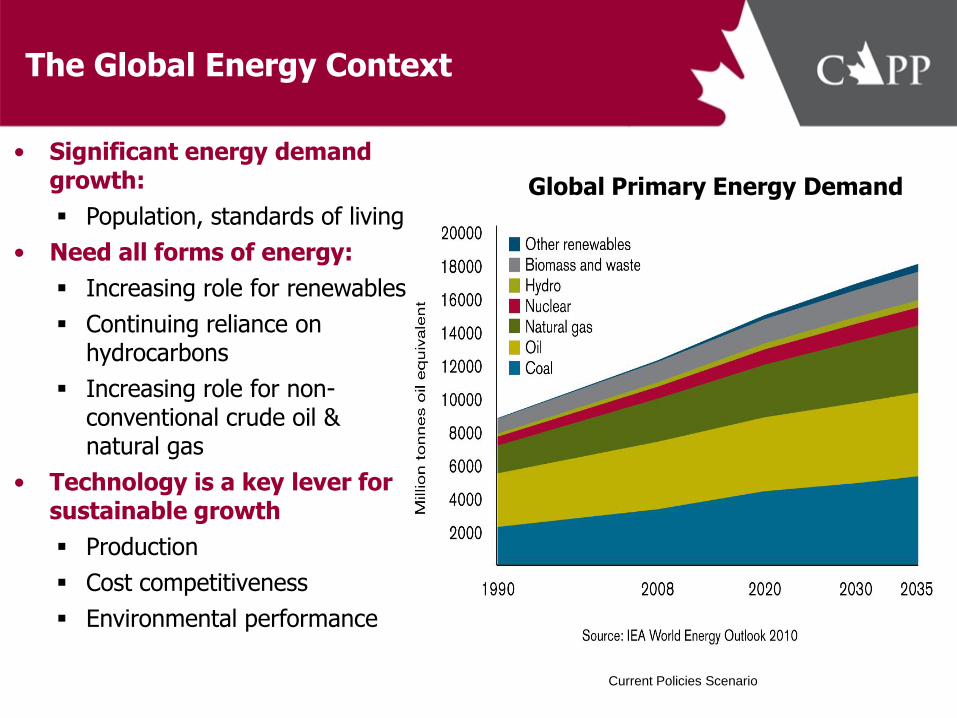
The Global Energy Context
• Significant energy demand growth:
Population, standards of living
• Need all forms of energy:
Increasing role for renewables
Continuing reliance on hydrocarbons
Increasing role for non- conventional crude oil & natural gas
• Technology is a key lever for sustainable growth
Production
Cost competitiveness
Environmental performance
Current Policies Scenario
Global Primary Energy Demand
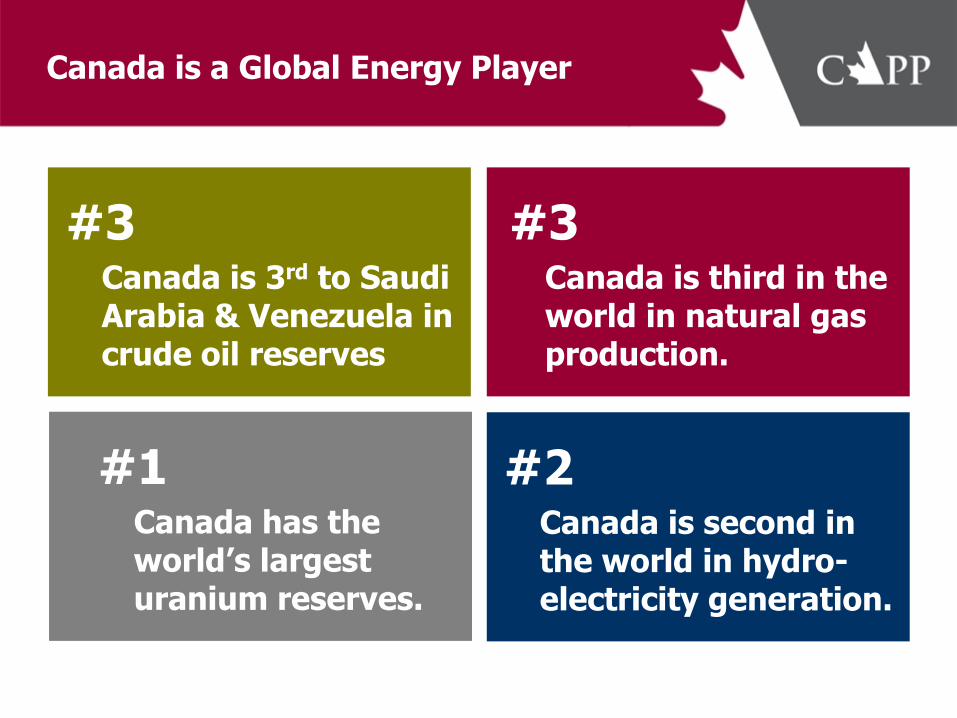
Canada is a Global Energy Player
#3 Canada is third in the
world in natural gas production.
#1 Canada has the
world’s largest uranium reserves.
#2 Canada is second in
the world in hydro-electricity generation.
#3 Canada is 3rd to Saudi
Arabia & Venezuela in crude oil reserves
4
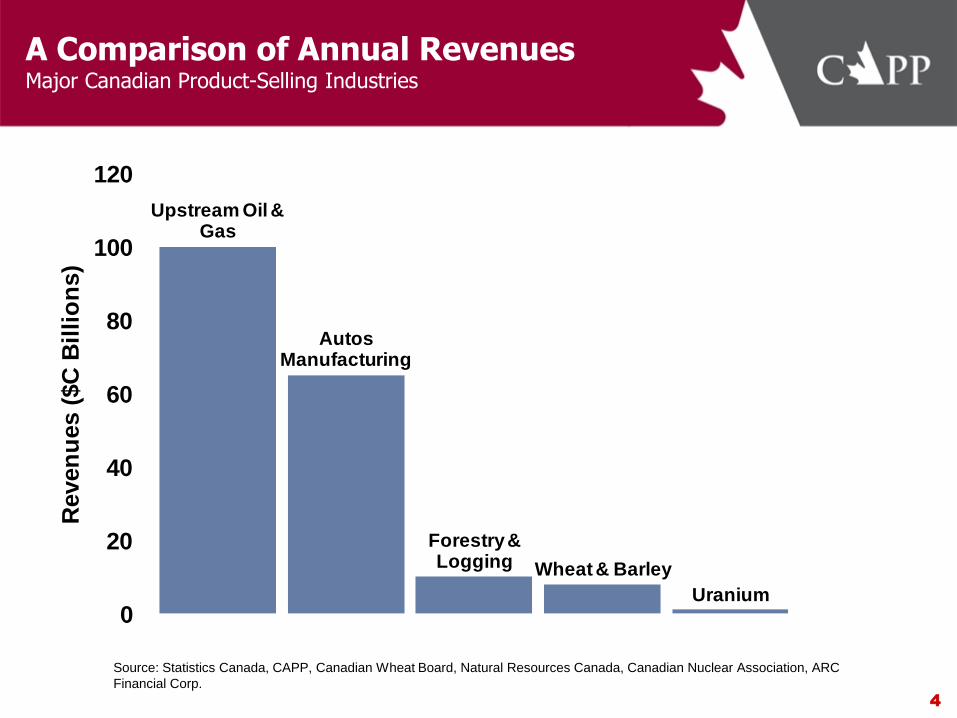
A Comparison of Annual Revenues Major Canadian Product-Selling Industries
Upstream Oil & Gas
Autos Manufacturing
Forestry & Logging Wheat & Barley
Uranium0
20
40
60
80
100
120
Reven
ues (
$C
Bil
lio
ns)
Source: Statistics Canada, CAPP, Canadian Wheat Board, Natural Resources Canada, Canadian Nuclear Association, ARC
Financial Corp.
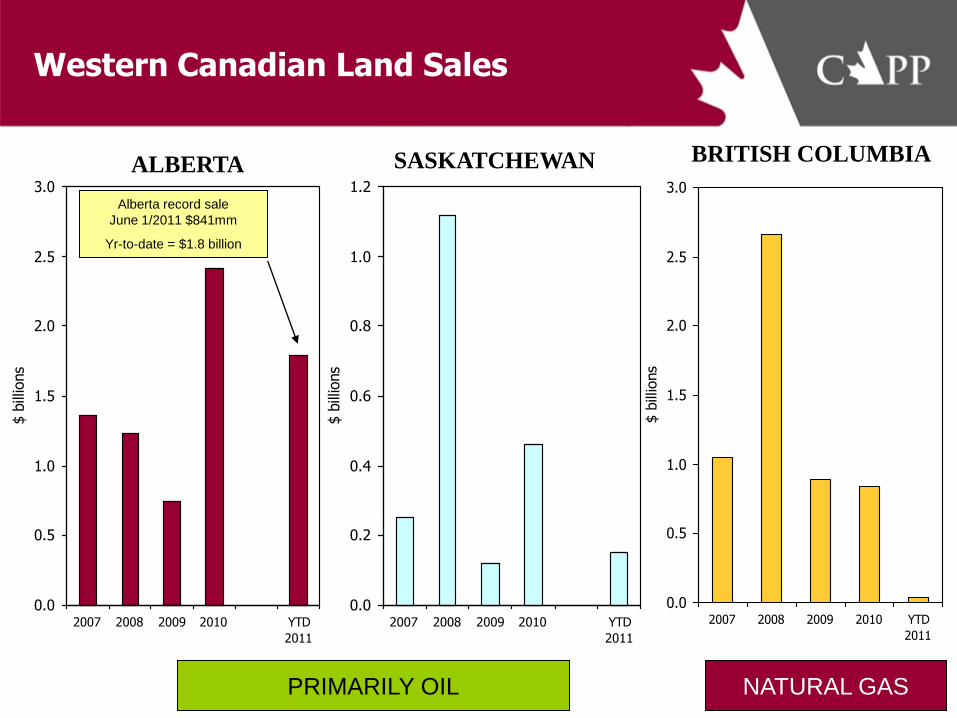
Western Canadian Land Sales
0.0
0.5
1.0
1.5
2.0
2.5
3.0
2007 2008 2009 2010 YTD
2011
$ b
illio
ns
ALBERTA
0.0
0.5
1.0
1.5
2.0
2.5
3.0
2007 2008 2009 2010 YTD
2011
$ b
illio
ns
BRITISH COLUMBIA
0.0
0.2
0.4
0.6
0.8
1.0
1.2
2007 2008 2009 2010 YTD
2011
$ b
illio
ns
SASKATCHEWAN
PRIMARILY OIL NATURAL GAS
Alberta record sale
June 1/2011 $841mm
Yr-to-date = $1.8 billion
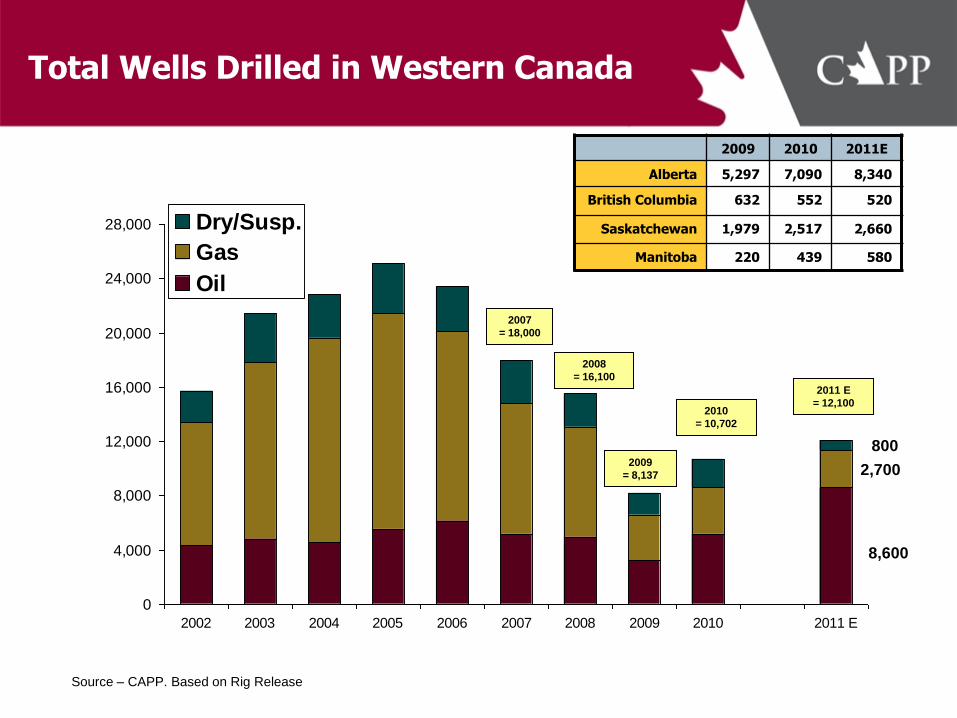
Total Wells Drilled in Western Canada
Source – CAPP. Based on Rig Release
0
4,000
8,000
12,000
16,000
20,000
24,000
28,000
2002 2003 2004 2005 2006 2007 2008 2009 2010 2011 E
Dry/Susp.
Gas
Oil
2007
= 18,000
2008
= 16,100
2009
= 8,137
2010
= 10,702
2011 E
= 12,100
8,600
2,700
800
2009 2010 2011E
Alberta 5,297 7,090 8,340
British Columbia 632 552 520
Saskatchewan 1,979 2,517 2,660
Manitoba 220 439 580
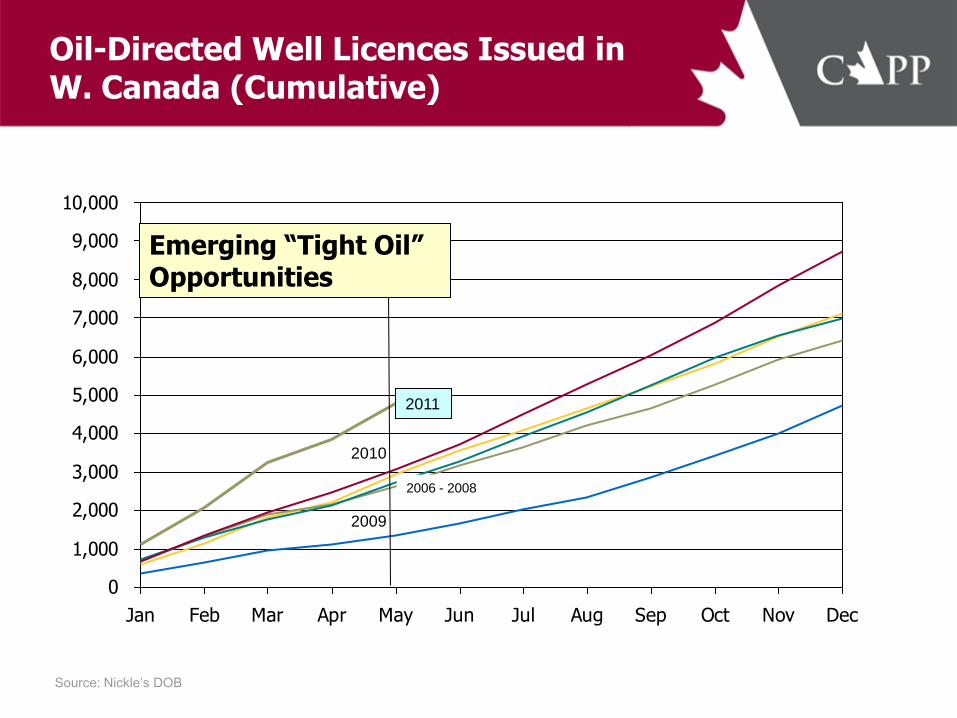
Oil-Directed Well Licences Issued in W. Canada (Cumulative)
Source: Nickle’s DOB
0
1,000
2,000
3,000
4,000
5,000
6,000
7,000
8,000
9,000
10,000
Jan Feb Mar Apr May Jun Jul Aug Sep Oct Nov Dec
2009
2006 - 2008
2010
Emerging “Tight Oil” Opportunities
2011
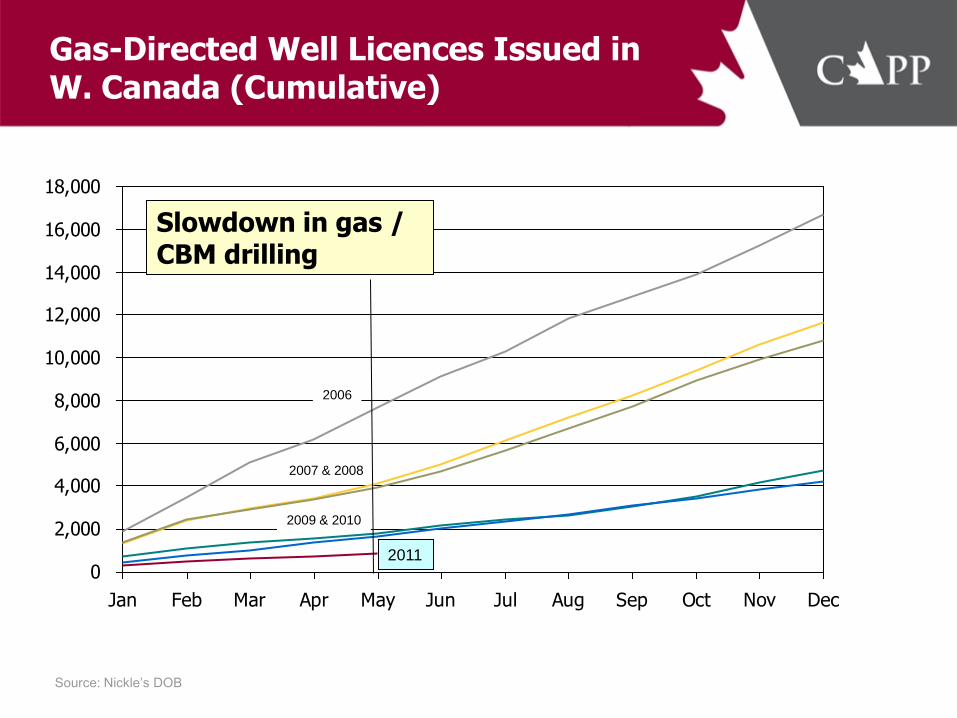
Gas-Directed Well Licences Issued in W. Canada (Cumulative)
Source: Nickle’s DOB
0
2,000
4,000
6,000
8,000
10,000
12,000
14,000
16,000
18,000
Jan Feb Mar Apr May Jun Jul Aug Sep Oct Nov Dec
2007 & 2008
2011
2006
2009 & 2010
Slowdown in gas / CBM drilling
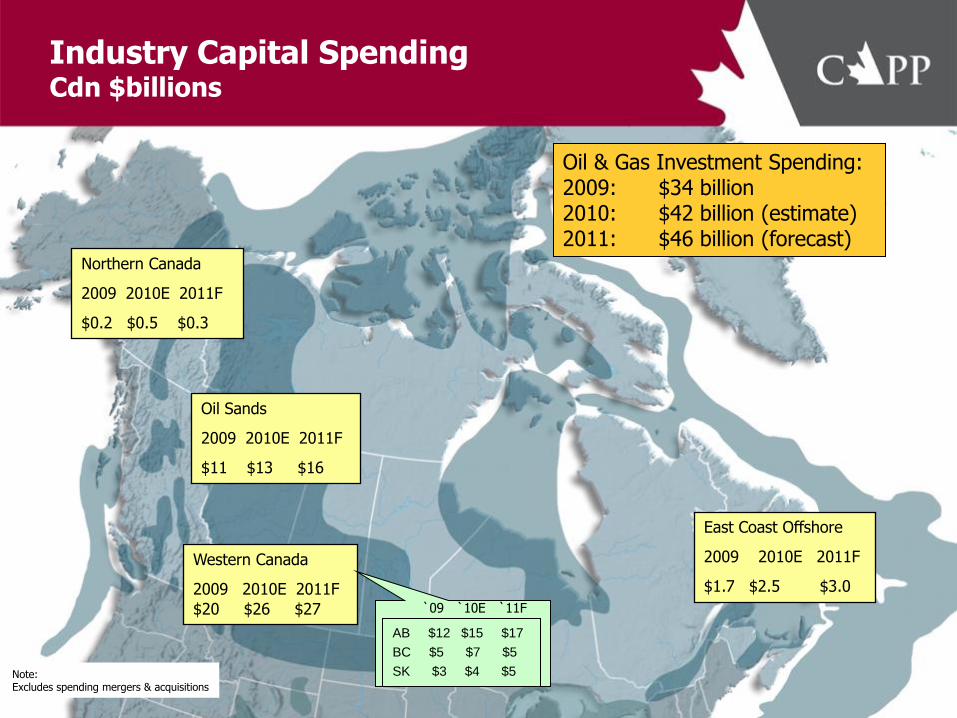
Industry Capital Spending
Cdn $billions
Northern Canada
2009 2010E 2011F
$0.2 $0.5 $0.3
Oil Sands
2009 2010E 2011F
$11 $13 $16
Western Canada
2009 2010E 2011F
$20 $26 $27
East Coast Offshore
2009 2010E 2011F
$1.7 $2.5 $3.0
Note: Excludes spending mergers & acquisitions
Oil & Gas Investment Spending: 2009: $34 billion 2010: $42 billion (estimate) 2011: $46 billion (forecast)
AB $12 $15 $17
BC $5 $7 $5
SK $3 $4 $5
`09 `10E `11F
10
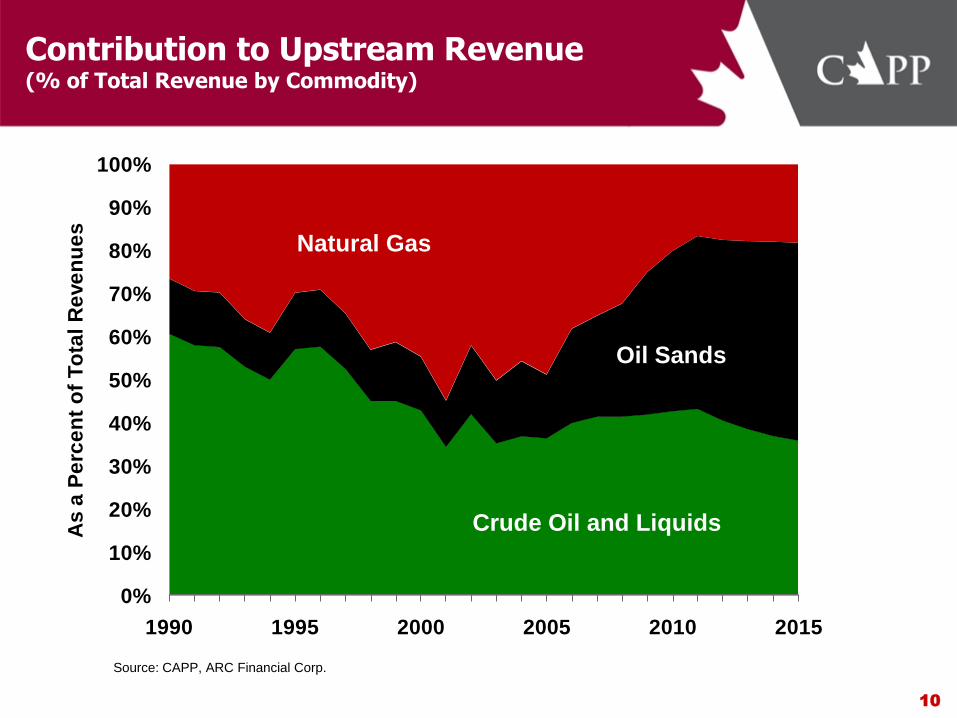
Contribution to Upstream Revenue (% of Total Revenue by Commodity)
0%
10%
20%
30%
40%
50%
60%
70%
80%
90%
100%
1990 1995 2000 2005 2010 2015
As
a P
erc
en
t o
f T
ota
l R
eve
nu
es
Natural Gas
Oil Sands
Crude Oil and Liquids
Source: CAPP, ARC Financial Corp.
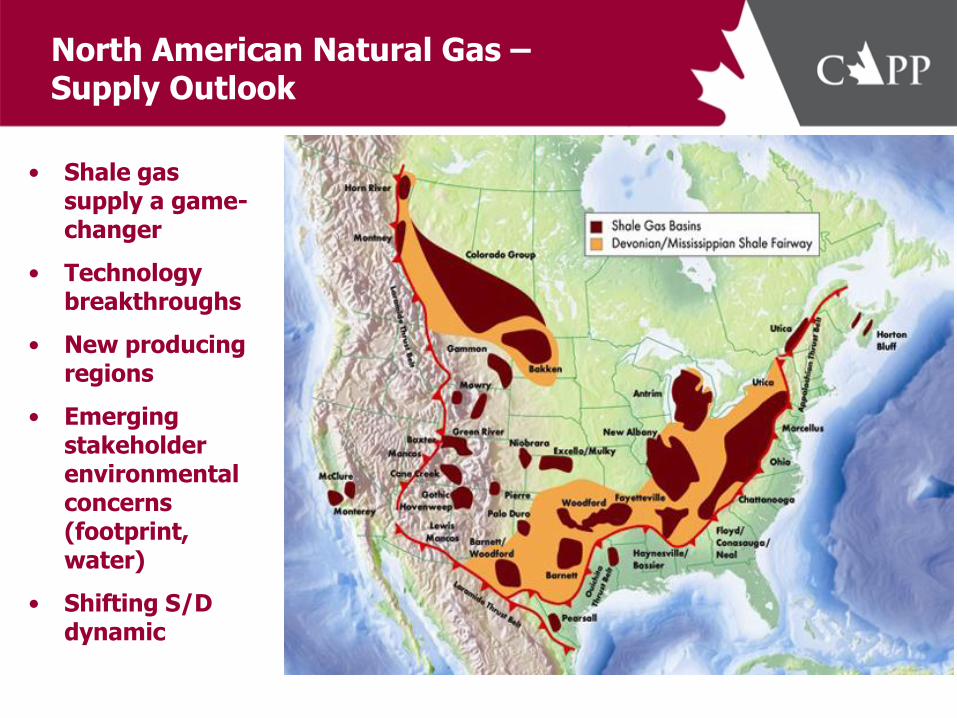
North American Natural Gas – Supply Outlook
• Shale gas supply a game-changer
• Technology breakthroughs
• New producing regions
• Emerging stakeholder environmental concerns (footprint, water)
• Shifting S/D dynamic
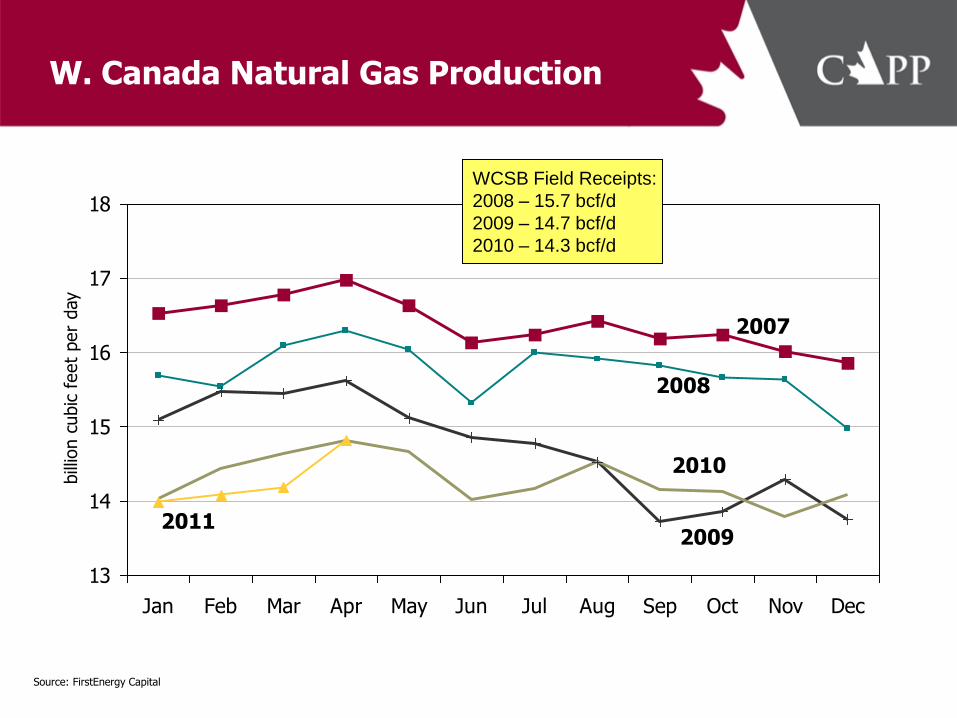
W. Canada Natural Gas Production
13
14
15
16
17
18
Jan Feb Mar Apr May Jun Jul Aug Sep Oct Nov Dec
bill
ion c
ubic
feet
per
day
Source: FirstEnergy Capital
2007
WCSB Field Receipts:
2008 – 15.7 bcf/d
2009 – 14.7 bcf/d
2010 – 14.3 bcf/d
2008
2009
2010
2011
0
2
4
6
8
10
12
14
16
18
20
2005 2008 2011 2014 2017 2020
Bcfd
0
2
4
6
8
10
12
14
16
18
20
2005 2008 2011 2014 2017 2020
Bcf
d
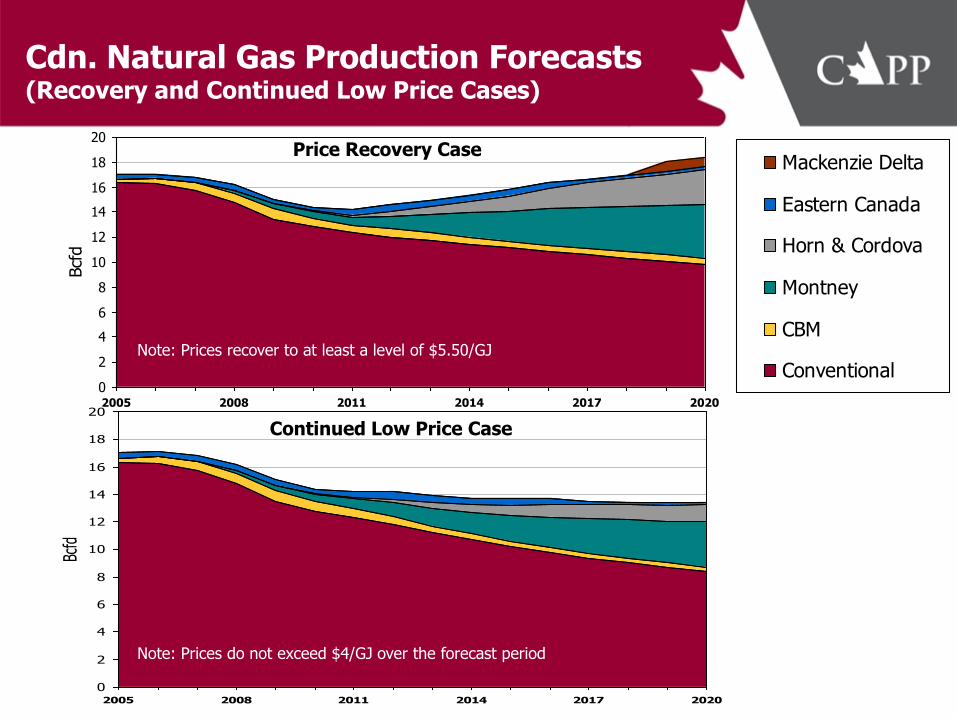
Mackenzie Delta
Eastern Canada
Horn & Cordova
Montney
CBM
Conventional
Cdn. Natural Gas Production Forecasts (Recovery and Continued Low Price Cases)
Price Recovery Case
Continued Low Price Case
Note: Prices do not exceed $4/GJ over the forecast period
Note: Prices recover to at least a level of $5.50/GJ
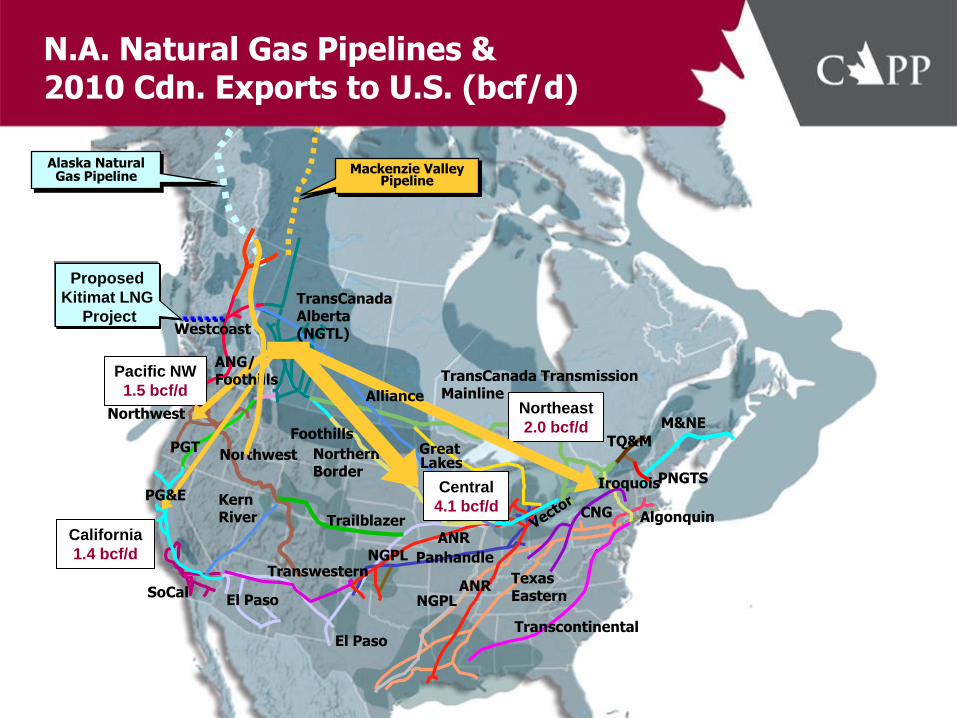
N.A. Natural Gas Pipelines & 2010 Cdn. Exports to U.S. (bcf/d)
TransCanada Transmission Mainline
TQ&M
Westcoast
Kern River
Northwest Northern Border
TransCanada Alberta (NGTL)
NGPL
ANR
ANR El Paso
SoCal
PGT
Texas Eastern
Panhandle
Algonquin
Transcontinental
NGPL
Northwest
Foothills
El Paso
Transwestern
Trailblazer
M&NE
CNG
Iroquois PNGTS Lakes Great
Pacific NW
1.5 bcf/d
California
1.4 bcf/d
Central
4.1 bcf/d
Northeast
2.0 bcf/d
Alliance
ANG/ Foothills
PG&E
Mackenzie Valley Pipeline
Alaska Natural Gas Pipeline
Proposed
Kitimat LNG
Project
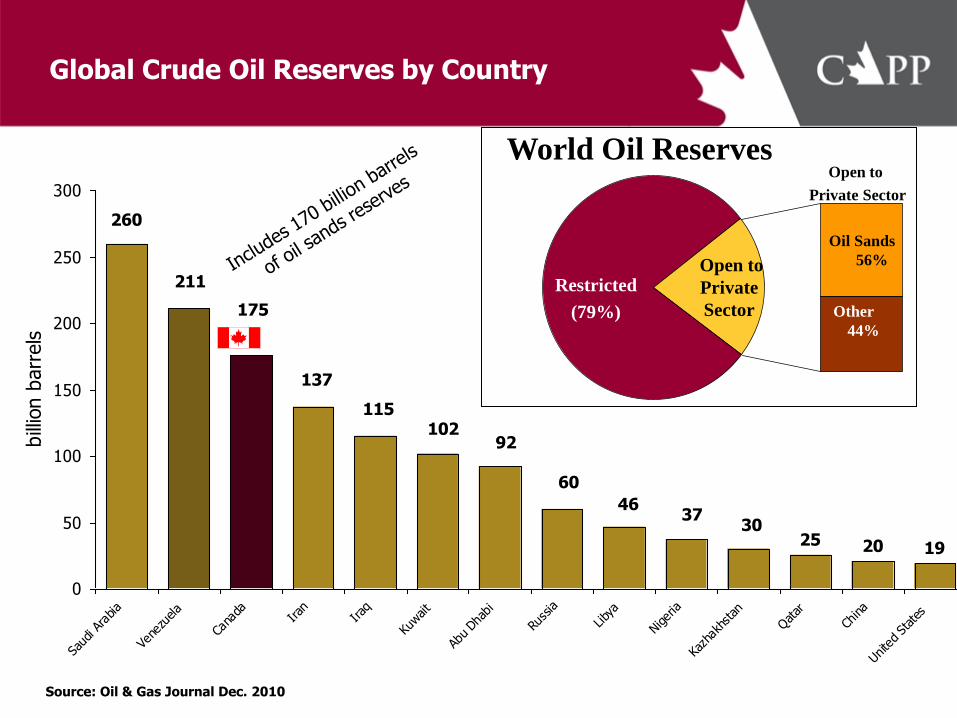
Global Crude Oil Reserves by Country
Source: Oil & Gas Journal Dec. 2010
25 20 19
3037
46
60
92102
115
137
175
211
260
0
50
100
150
200
250
300
Saud
i Ara
bia
Vene
zuela
Cana
daIran
Iraq
Kuwait
Abu Dha
bi
Russ
ia
Liby
a
Niger
ia
Kazh
akhs
tan
Qatar
China
Unite
d St
ates
bill
ion b
arr
els
Restricted
(79%)
Open to
Private
Sector
Oil Sands
56%
Other
44%
World Oil Reserves Open to
Private Sector
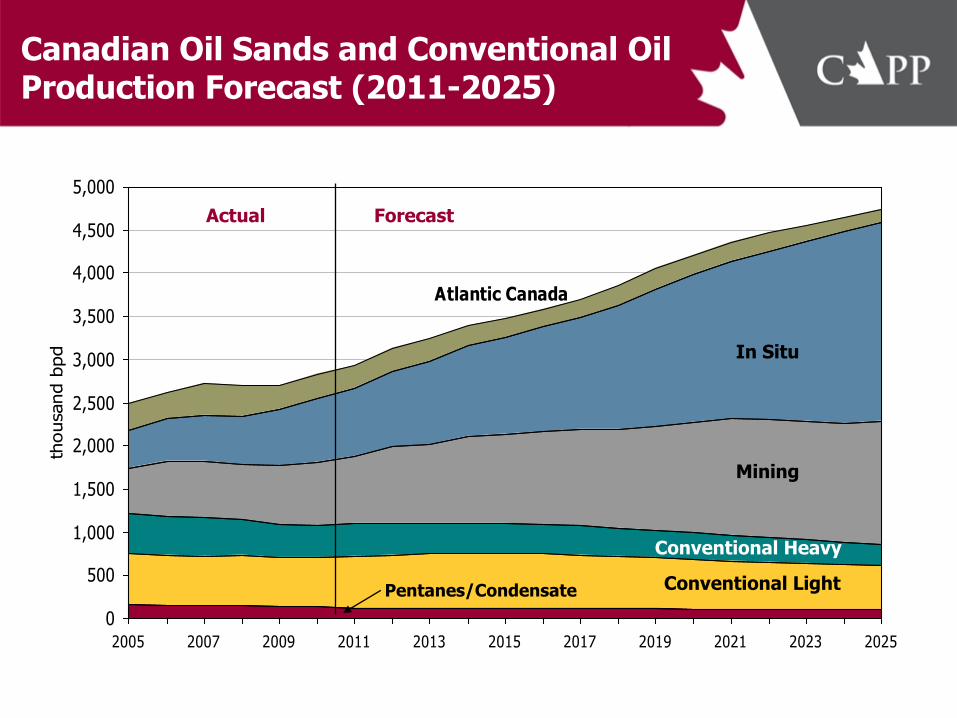
Canadian Oil Sands and Conventional Oil Production Forecast (2011-2025)
Atlantic Canada
0
500
1,000
1,500
2,000
2,500
3,000
3,500
4,000
4,500
5,000
2005 2007 2009 2011 2013 2015 2017 2019 2021 2023 2025
thousand b
pd
Actual Forecast
In Situ
Mining
Conventional Heavy
Conventional Light Pentanes/Condensate
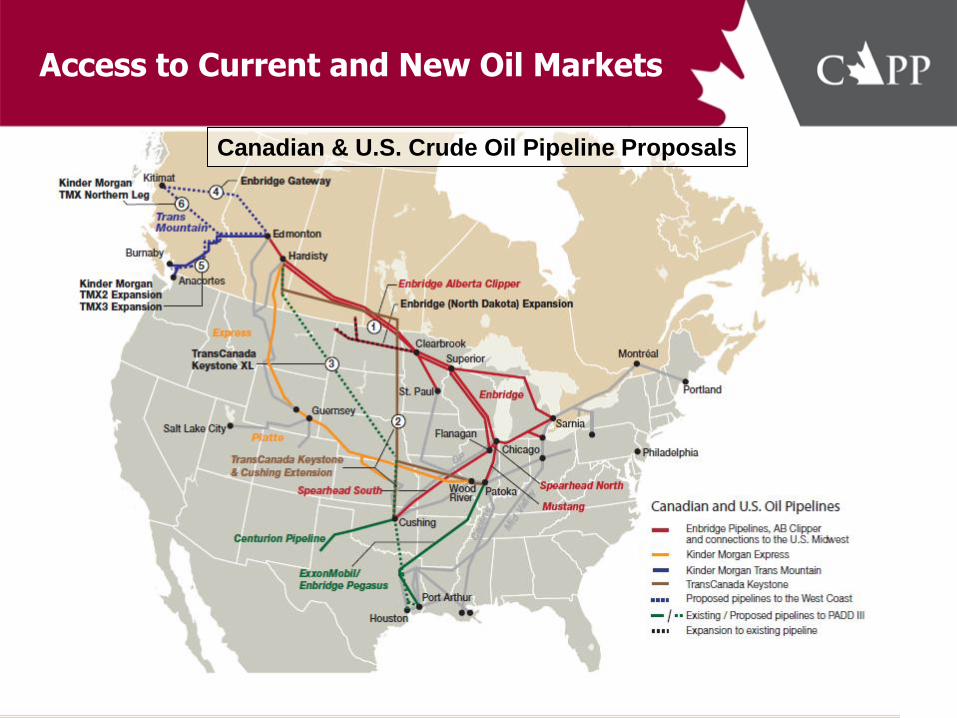
Access to Current and New Oil Markets
Canadian & U.S. Crude Oil Pipeline Proposals
Environmental & Social Performance
• Focus on both crude oil / oil sands & natural gas
• Reputation = Performance + Communication
Continuous performance improvement
More effective messaging (breadth, channels, transparency)
Improved industry collaboration
• Key concerns expressed regarding oil & gas development:
Local / regional environmental & social impacts (air, land, water, biodiversity)
Global climate change
Role of fossil fuels in future energy system
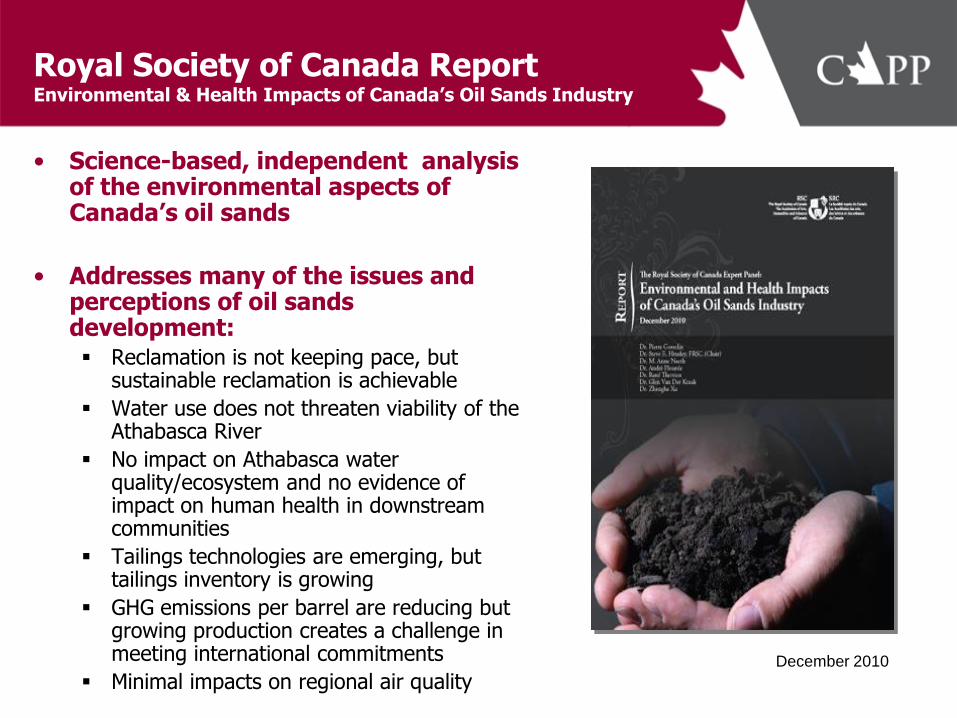
Royal Society of Canada Report Environmental & Health Impacts of Canada’s Oil Sands Industry
• Science-based, independent analysis of the environmental aspects of Canada’s oil sands
• Addresses many of the issues and perceptions of oil sands development: Reclamation is not keeping pace, but
sustainable reclamation is achievable
Water use does not threaten viability of the Athabasca River
No impact on Athabasca water quality/ecosystem and no evidence of impact on human health in downstream communities
Tailings technologies are emerging, but tailings inventory is growing
GHG emissions per barrel are reducing but growing production creates a challenge in meeting international commitments
Minimal impacts on regional air quality December 2010
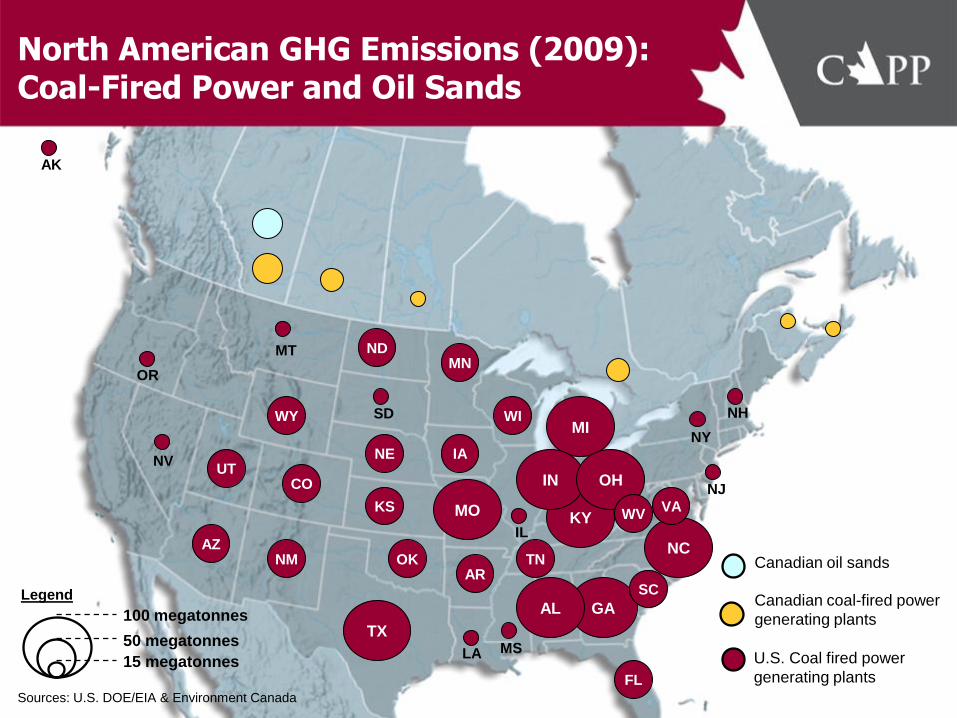
North American GHG Emissions (2009): Coal-Fired Power and Oil Sands
15 megatonnes
50 megatonnes
100 megatonnes
FL
GA
TX
NC
MI
AL
MO KY
IN OH
NE
NM
ND
CO
SC
KS
IA
TN
WV
WY
VA
MN
UT
OK
WI
AZ
AR
AK
LA
IL
NV
OR
MT
SD
NJ
NY
NH
MS
Legend
U.S. Coal fired power
generating plants
Canadian coal-fired power
generating plants
Canadian oil sands
Sources: U.S. DOE/EIA & Environment Canada
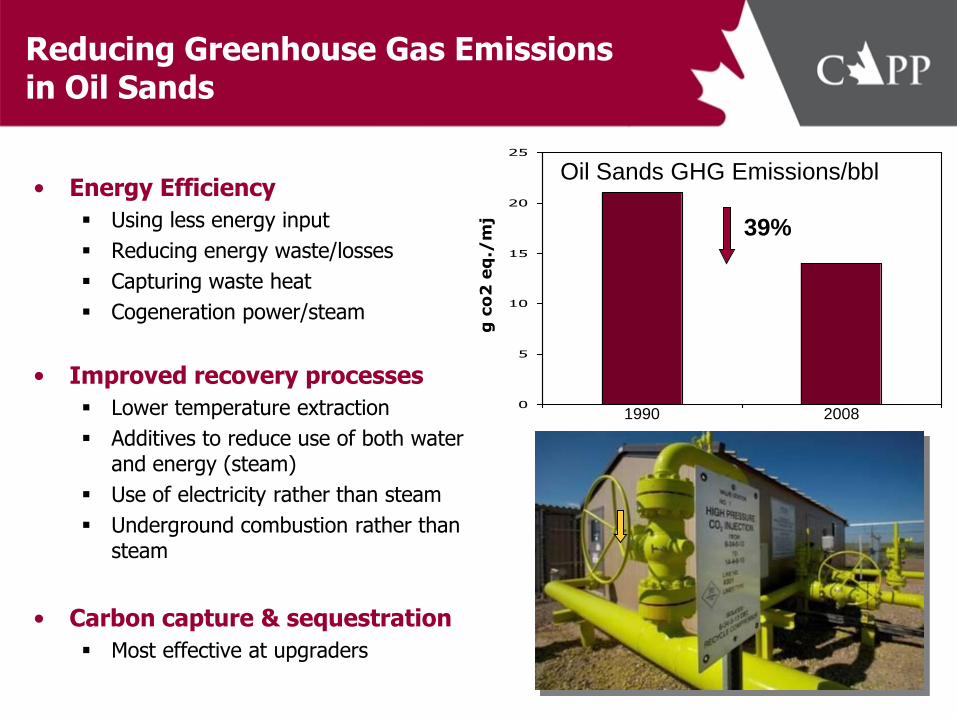
Reducing Greenhouse Gas Emissions in Oil Sands
• Energy Efficiency
Using less energy input
Reducing energy waste/losses
Capturing waste heat
Cogeneration power/steam
• Improved recovery processes
Lower temperature extraction
Additives to reduce use of both water and energy (steam)
Use of electricity rather than steam
Underground combustion rather than steam
• Carbon capture & sequestration
Most effective at upgraders
0
5
10
15
20
25
Oil Sands GHG Emissions/bbl
39%
g c
o2
eq
./m
j
1990 2008
Industry Communications & Engagement - A Portfolio of Activity
• Communications & outreach:
Advertising
Media – mainstream, social
Speeches & presentations
National Oil Sands Dialogues
Meetings & tours
Responsible Canadian Energy Report
Employees
Educational materials (fact books, etc.)
• Directly by industry and via 3rd parties
• Canada, U.S., Europe, Asia
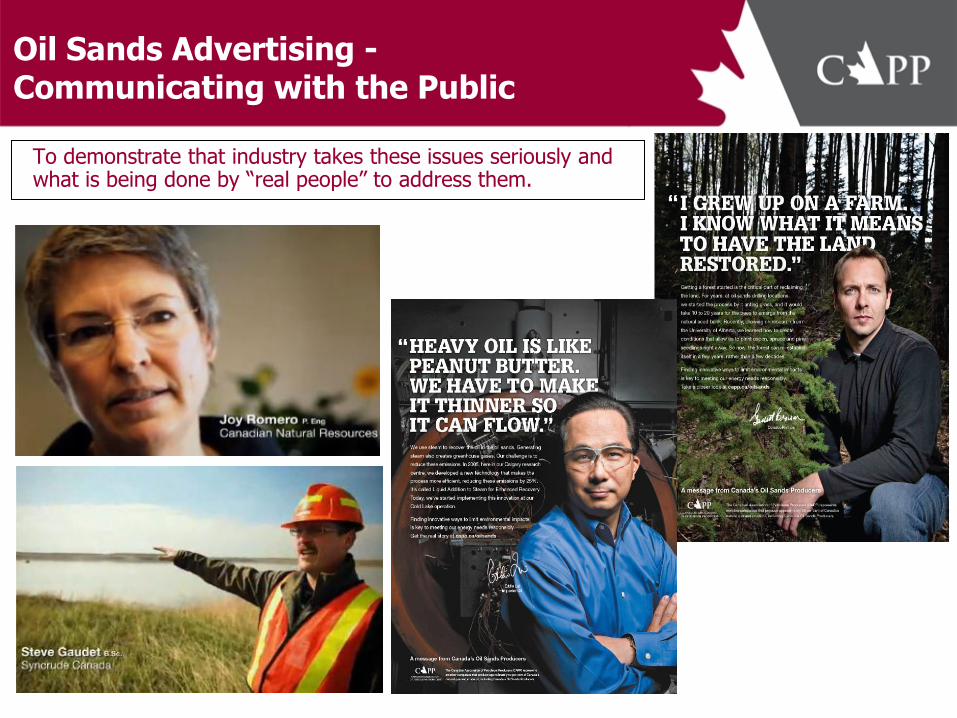
Oil Sands Advertising - Communicating with the Public
To demonstrate that industry takes these issues seriously and what is being done by “real people” to address them.

CAPP TV – Success Stories
A Canadian Energy Strategy
• CAPP supports a Canadian Energy Strategy – clarify and communicate objectives, align resources, implement enabling policy.
• Proposed strategy: Growth in increasingly sustainable hydrocarbon production Growth in renewable energy Shifts in energy demand arising largely from energy efficiency and conservation.
• Market forces are key determinant in decisions on energy supply, transportation and use
• Governments have an important role to play in developing and implementing enabling public policy: Fiscal competitiveness
Regulatory reform
Diversification of markets
Policy to encourage continuous improvement in environmental and social performance
Lower carbon domestic energy supply and use
Technology & innovation
Energy efficiency and conservation
Energy education
Workforce of future
• Recent CEMM at Kananaskis established positive momentum.
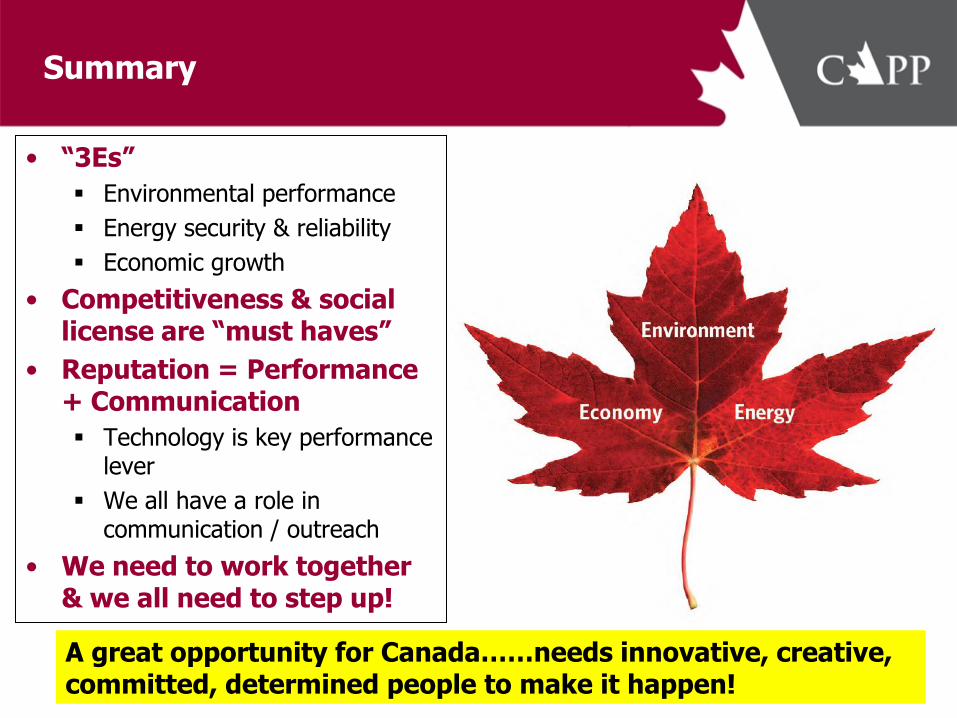
Summary
• “3Es”
Environmental performance
Energy security & reliability
Economic growth
• Competitiveness & social license are “must haves”
• Reputation = Performance + Communication
Technology is key performance lever
We all have a role in communication / outreach
• We need to work together & we all need to step up!
A great opportunity for Canada……needs innovative, creative, committed, determined people to make it happen!