Embed Size (px)
Citation preview
Energy Performance Study of Endura Flap Pet Door and Comparison to
Two Competitors
by
Daniel J. Keene Glen E. Thorncroft
Andrew J. Kean
Mechanical Engineering Department California Polytechnic State University
San Luis Obispo
August 12, 2005
Submitted to: Patio Pacific, Inc.
874 via Esteban #D San Luis Obispo, CA 93401
Table of Contents 1. Introduction.................................................................................................................................1 2. Heat Transfer Analysis ...............................................................................................................2
2.1 Background...................................................................................................................2 2.2 One-Dimensional Analysis of Ideal and Pet Safe Classic Doors .................................3 2.3 One-Dimensional Analysis of Patio Pacific Endura Flap.............................................5 2.4 Two-Dimensional Analysis of Endura Flap .................................................................7 2.5 Summary of Analysis Results.....................................................................................10 2.6 Conclusions.................................................................................................................12
3. Infiltration (Air Leakage) Study ..............................................................................................13
3.1 Simulation of Impinging Wind ...................................................................................14 3.2 Experimental Apparatus..............................................................................................15 3.3 Calibration Procedure .................................................................................................17 3.4 Air Leak Testing Procedure ........................................................................................17 3.5 Ultimate Seal Failure Test ..........................................................................................20
4. Testing Results..........................................................................................................................21
4.1 Peripheral Leakage......................................................................................................21 4.2 Door Leakage..............................................................................................................22
4.2.1 Individual Door Performances...................................................................23 4.2.2 Door Performance Comparisons................................................................25
4.3 Ultimate Seal Failure ..................................................................................................26 4.4 Flow Visualization ......................................................................................................27 4.5 Summary .....................................................................................................................29
5. Conclusions...............................................................................................................................30 References......................................................................................................................................31 ON CD-ROM: Appendix A: Outline of the Thermal Models and Analysis: A.1 Ideal Pet Door .................................................................................................Appendix A1.pdf A.2 Pet Safe Classic...............................................................................................Appendix A2.pdf A.3 Patio Pacific ....................................................................................................Appendix A3.pdf Excel Spreadsheet Files: Wind Impingement Calculations .......................................................... Wind Load on Pet Door.xls Thermal Model Solutions ...................................................................Thermal Model Solutions.xls Test Data: Test Data at Low Temp.xls; Test Data at Room Temp.xls; Test Data at High Temp.xls
i
1. Introduction This report describes an analytical and experimental energy study of the Patio Pacific Endura Flap Pet Door. The purpose of the study is to assess the pet door’s heat transfer characteristics (i.e., its resistance to energy loss due to conduction heat transfer), and its resistance to air leakage (infiltration). The performance of the Endura Flap Pet Door is also compared to that of two leading competitors, the Pet Safe Classic and the Ideal pet doors. One aim of the analysis and experimental study is to identify and quantify some of the leading mechanisms that control energy loss through the pet doors.
The first mechanism of energy transfer is when heat conducts through the door, neglecting any air that may be leaking across the door seal. We refer to this mechanism as conduction, although the movement of air along the inside and outside surfaces (convection) also influences the energy transfer across the door. (In fact, in the case of the Endura Flap, air trapped in the chambers of the door could also circulate within the chamber, although this study will show that the effect is negligible.) This mechanism can be modeled effectively using standard heat transfer analysis and empirical correlations, and so this portion of the study does not require experiments.
The second mechanism of energy loss occurs when the pet door is subjected to winds or a
pressure difference across the door that causes air to leak along its perimeter. This leakage expends energy because the outside air that leaks in must now be brought to the temperature of the air inside the home. This mechanism is not accurately predicted using analytical techniques, and so an experimental method has been developed to quantify this effect. The objectives of this work are therefore as follows:
1. To predict the energy losses occurring as a result of the heat transfer across the door. This is accomplished using a detailed analytical model for each of the pet doors.
2. To determine the leakage through the perimeter that occurs as a result of wind or
pressure difference. This is accomplished experimentally; an apparatus has been developed to test each door over a range of pressure differences that correspond to typical wind loads.
3. To determine the sealing ability of each pet door by measuring when the flap
completely breaks its seal with the frame as the pressure difference across the door is increased.
1
2. Heat Transfer Analysis 2.1 Background Heat transfer occurs whenever a finite temperature difference exists. This means that when a home is maintained at a comfortable temperature while it is relatively cold outside, energy will transfer out of the home through the walls. A greater difference between the inside and outside temperatures leads to a greater rate of energy loss. For the simplest case of one-dimensional heat transfer, the following relationship describes the energy loss:
RTq ∆
= , (2.1)
where q is the heat transfer rate (W),
∆T is temperature difference (ºC or K), and R is the resistance to heat transfer (K/W). Neglecting air leakage through the door, the energy loss is due to the heat that transfers through the walls. The resistance to heat transfer, R, measures the insulating ability. As seen in Equation 2.1, high values of R are indicative of good insulation, while low values are indicative of poor insulation. These values depend on factors such as the material properties and the geometry.
Another form of this relationship deals with the quantities on a per unit area basis:
RTq′′
∆=′′ , (2.2)
where is the heat transfer rate per unit area: (W/mq ′′ Aq / 2),
A is the cross-sectional area through which the heat transfers (m2), and R ′′ is the resistance to heat flux (K·m2/W). This form is often used to report the insulating performance of common building materials because it is not dependent on the area of heat transfer, making it easier to compare the performance of different components. It is the quantity R ′′ that is often referred to when an R-value is being reported. In order to gauge the different insulating abilities, a resistance for each door must be obtained. However, for the purpose of comparing the pet doors, it makes more sense to report the value for R rather than R ′′ . This is because the area of the doors does vary from model to model, and this variation in the area will have an impact on the energy loss. If the customary R-value is desired, it can be easily calculated using the following equation:
ARR ×=′′ (2.3)
2
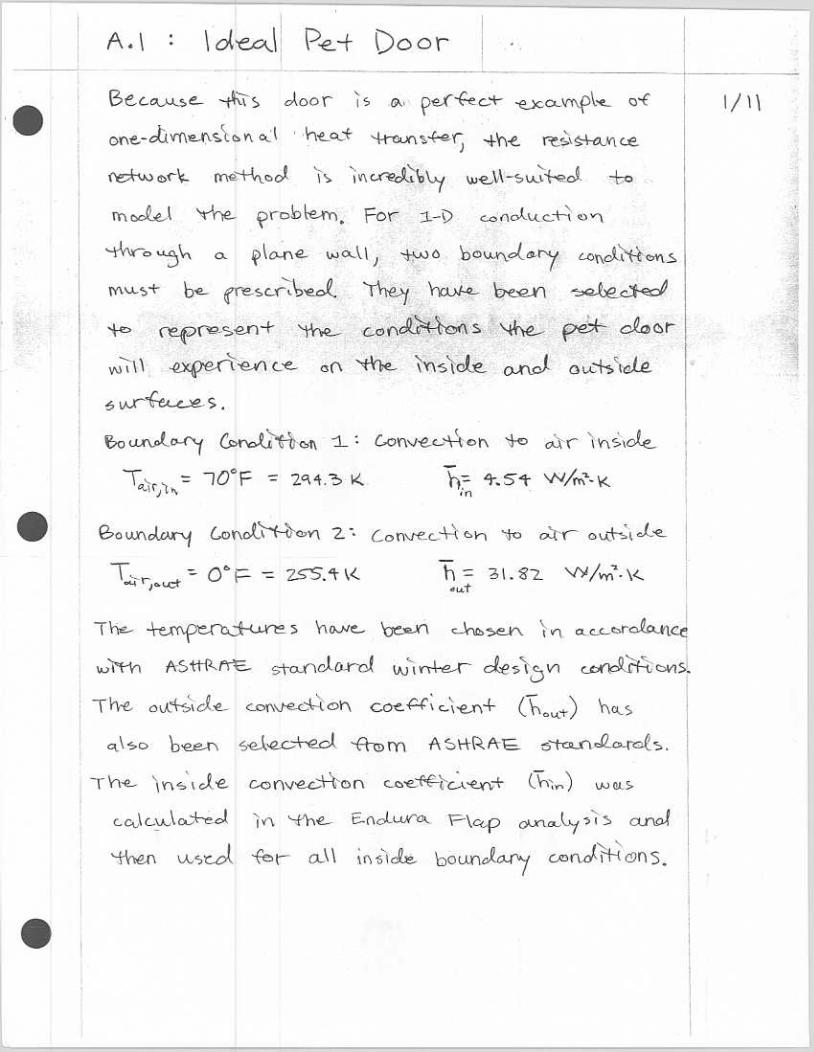
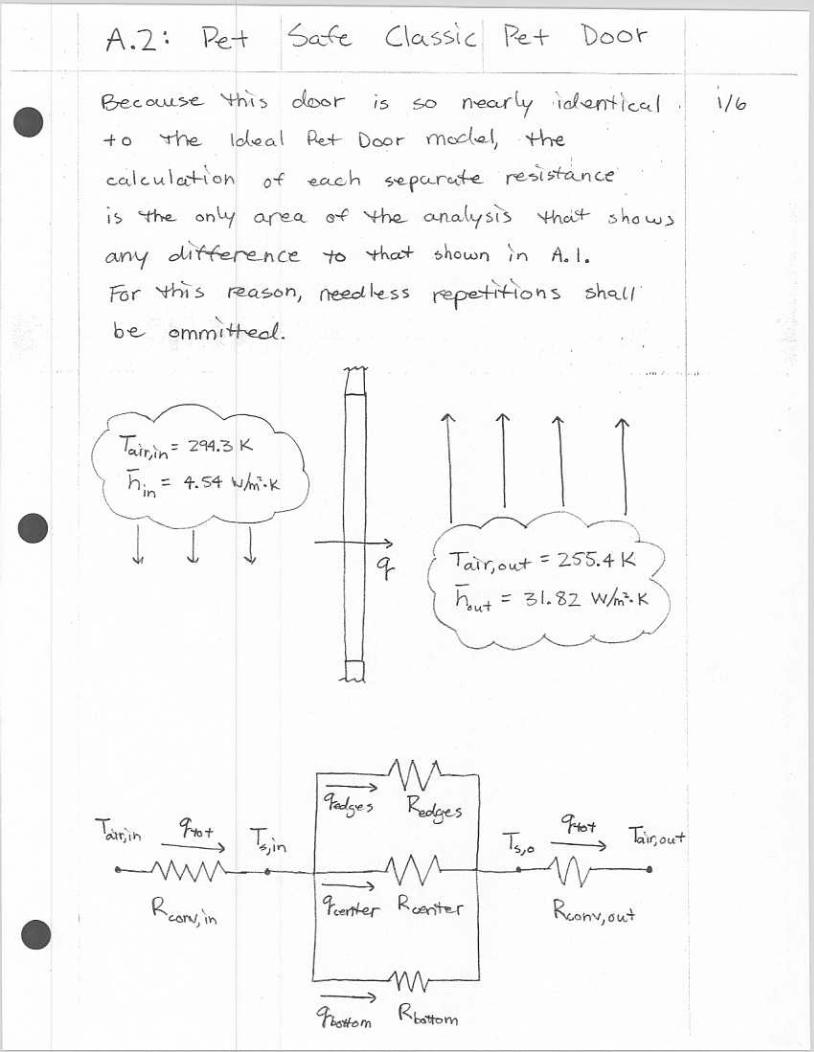
2.2 One-Dimensional Analysis of Ideal and Pet Safe Classic Doors At this point, it is important to understand the fundamental aspects of how the heat transfer is being modeled without dealing too heavily with the intricacies of the analysis. To see the details omitted here, the reader is referred to Appendix A.
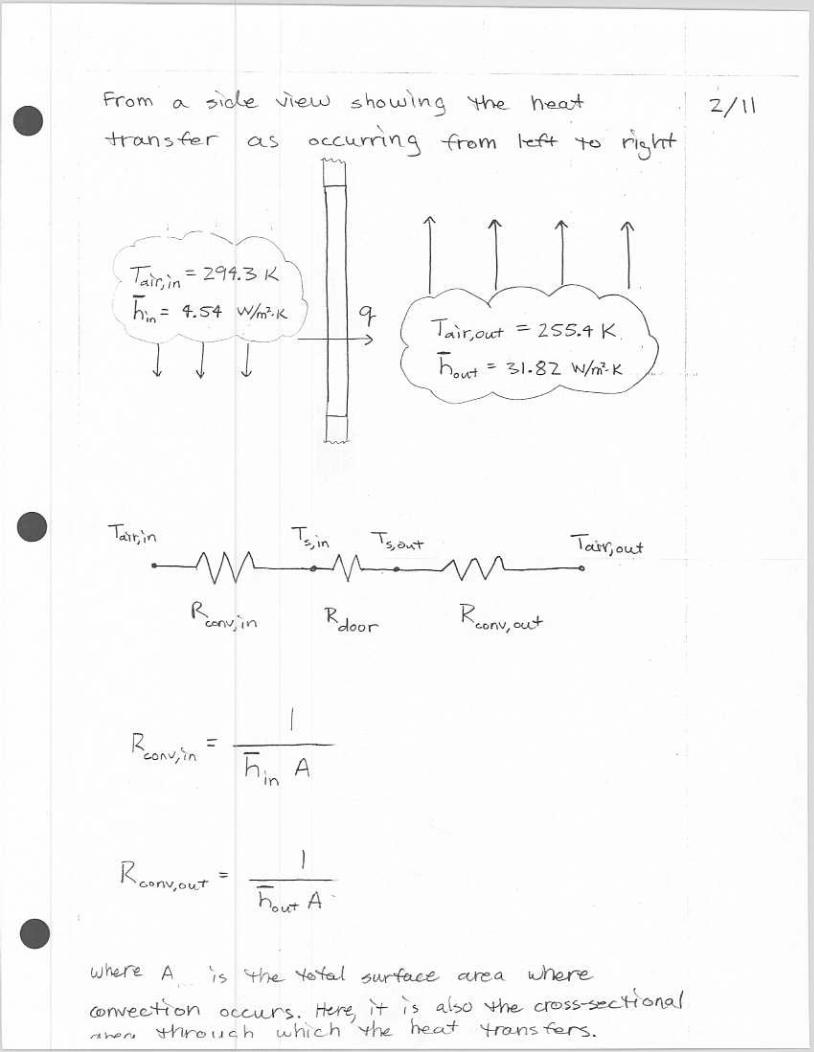
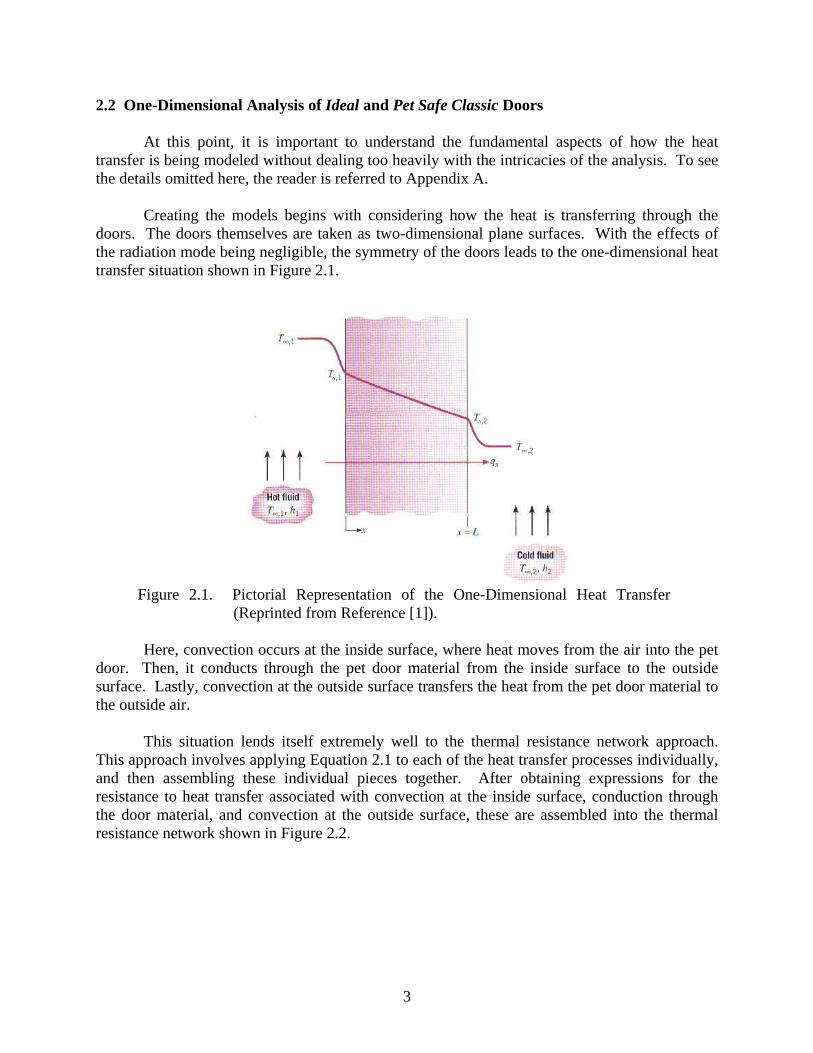
Creating the models begins with considering how the heat is transferring through the doors. The doors themselves are taken as two-dimensional plane surfaces. With the effects of the radiation mode being negligible, the symmetry of the doors leads to the one-dimensional heat transfer situation shown in Figure 2.1.
Figure 2.1. Pictorial Representation of the One-Dimensional Heat Transfer
(Reprinted from Reference [1]).
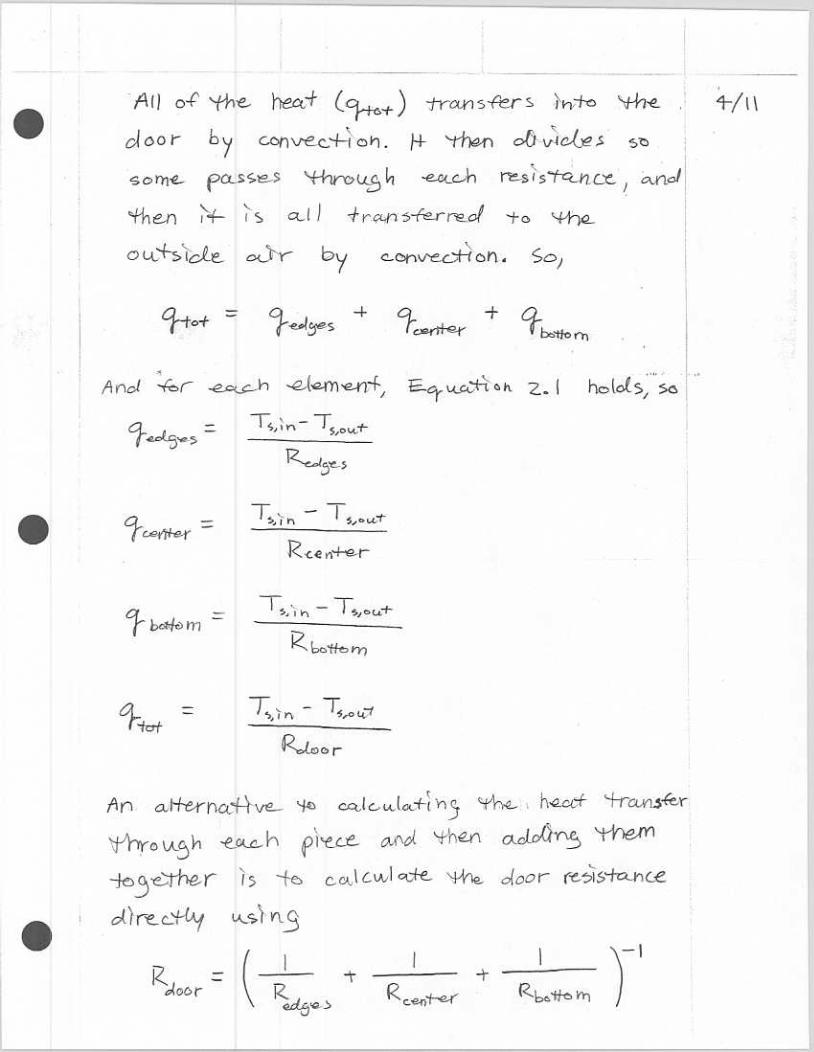
Here, convection occurs at the inside surface, where heat moves from the air into the pet door. Then, it conducts through the pet door material from the inside surface to the outside surface. Lastly, convection at the outside surface transfers the heat from the pet door material to the outside air. This situation lends itself extremely well to the thermal resistance network approach. This approach involves applying Equation 2.1 to each of the heat transfer processes individually, and then assembling these individual pieces together. After obtaining expressions for the resistance to heat transfer associated with convection at the inside surface, conduction through the door material, and convection at the outside surface, these are assembled into the thermal resistance network shown in Figure 2.2.
3
q
Tsurface, in Tsurface, out Tair, outTair,in
Rconv, inside Rdoor Rconv, outside
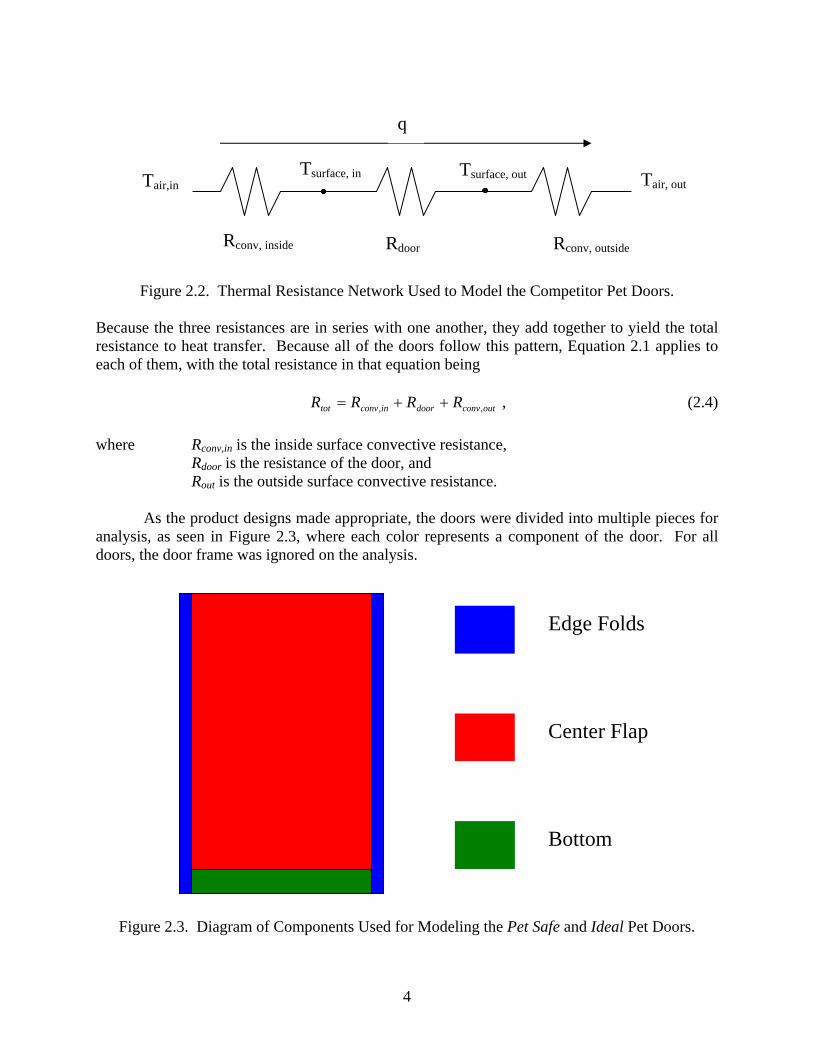
Figure 2.2. Thermal Resistance Network Used to Model the Competitor Pet Doors. Because the three resistances are in series with one another, they add together to yield the total resistance to heat transfer. Because all of the doors follow this pattern, Equation 2.1 applies to each of them, with the total resistance in that equation being
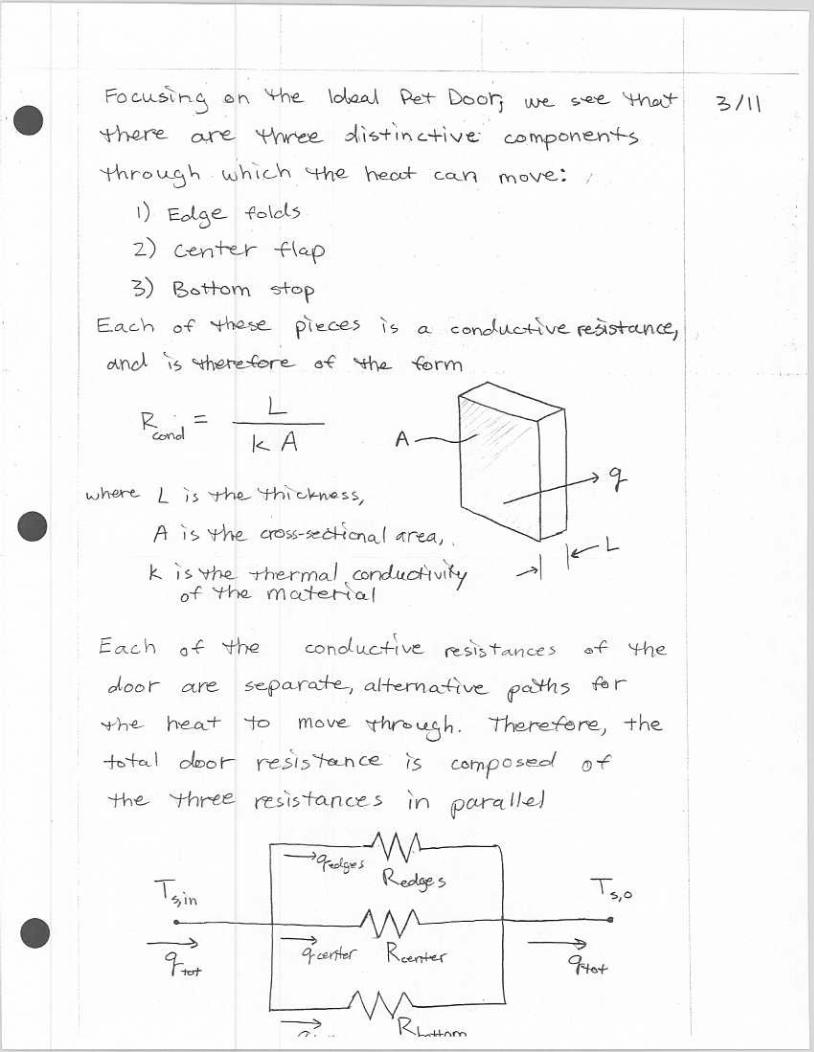
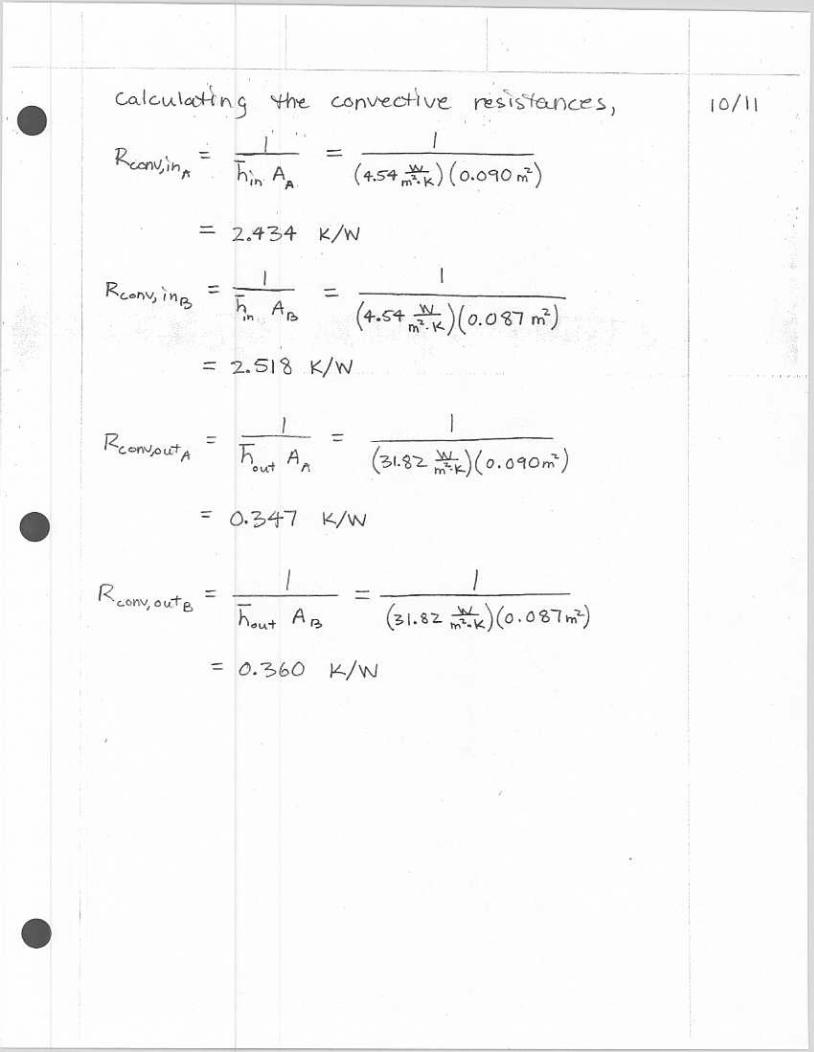
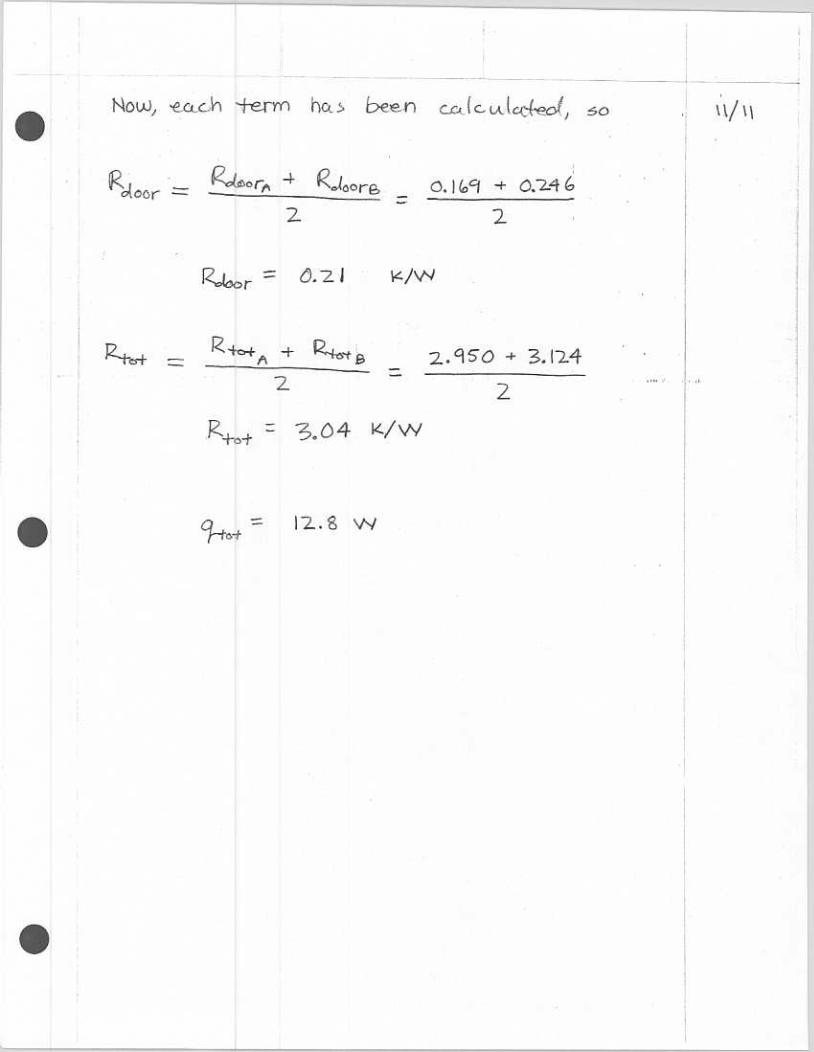
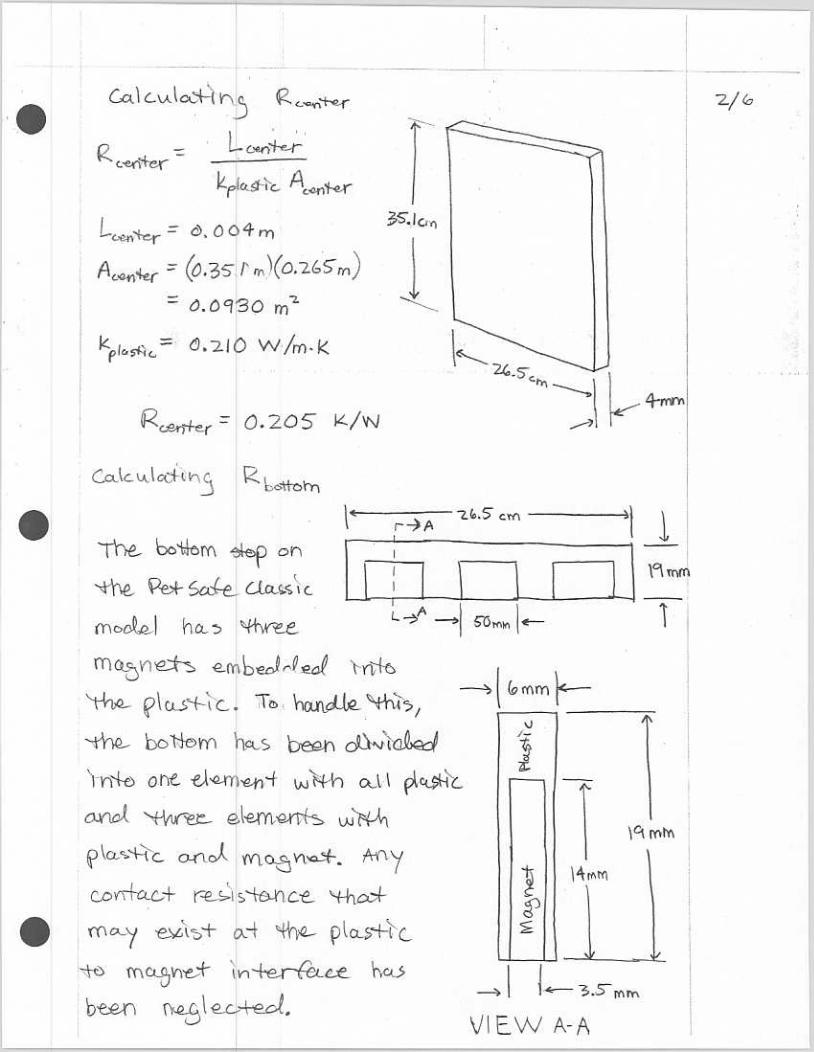
outconvdoorinconvtot RRRR ,, ++= , (2.4) where Rconv,in is the inside surface convective resistance, Rdoor is the resistance of the door, and Rout is the outside surface convective resistance. As the product designs made appropriate, the doors were divided into multiple pieces for analysis, as seen in Figure 2.3, where each color represents a component of the door. For all doors, the door frame was ignored on the analysis.
Edge Folds
Center Flap
Bottom
Figure 2.3. Diagram of Components Used for Modeling the Pet Safe and Ideal Pet Doors.
4
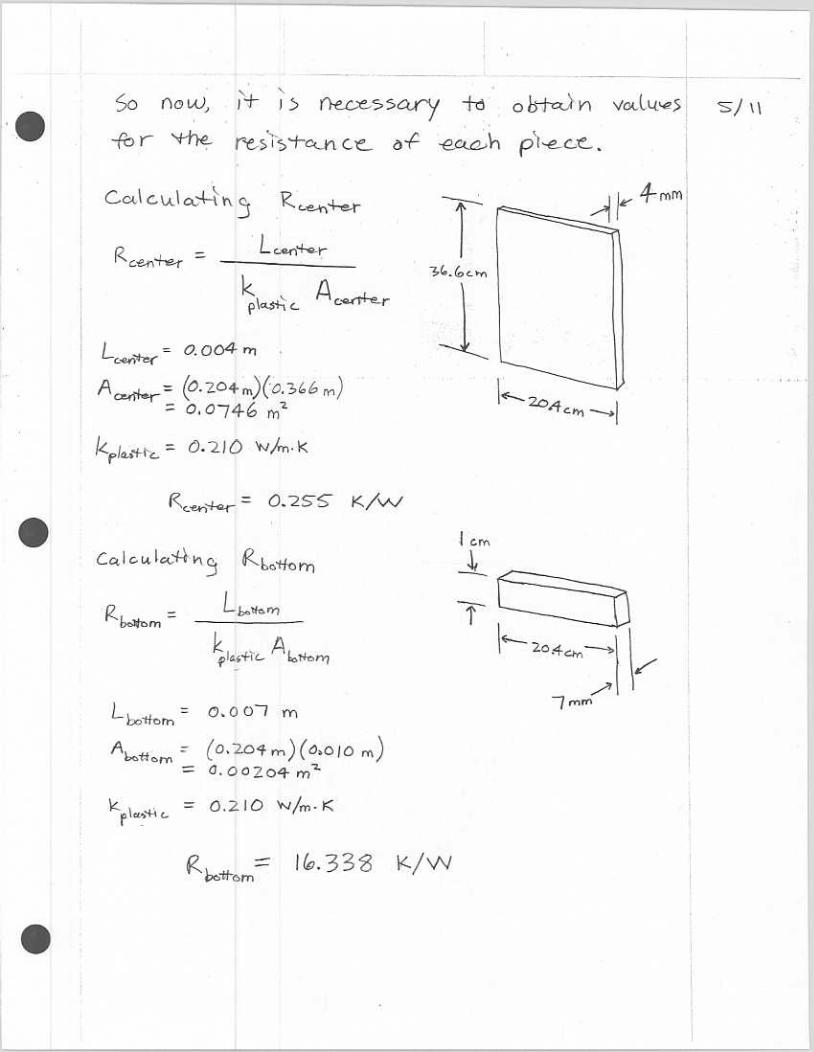
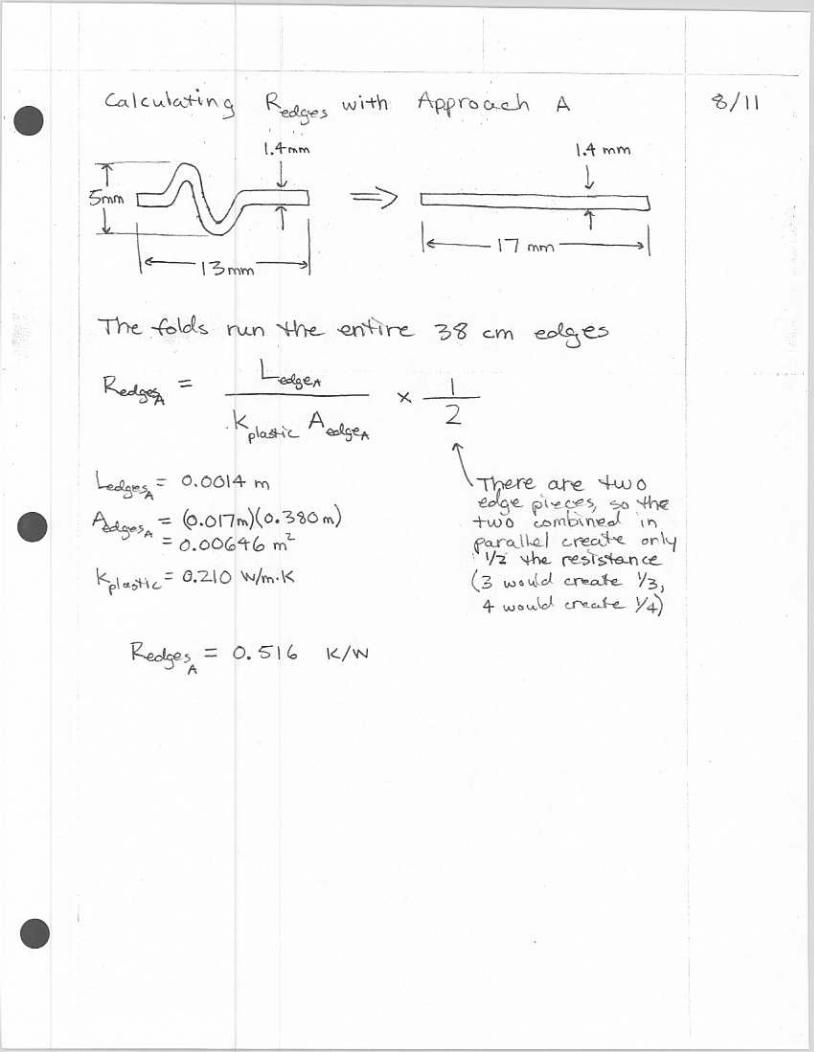
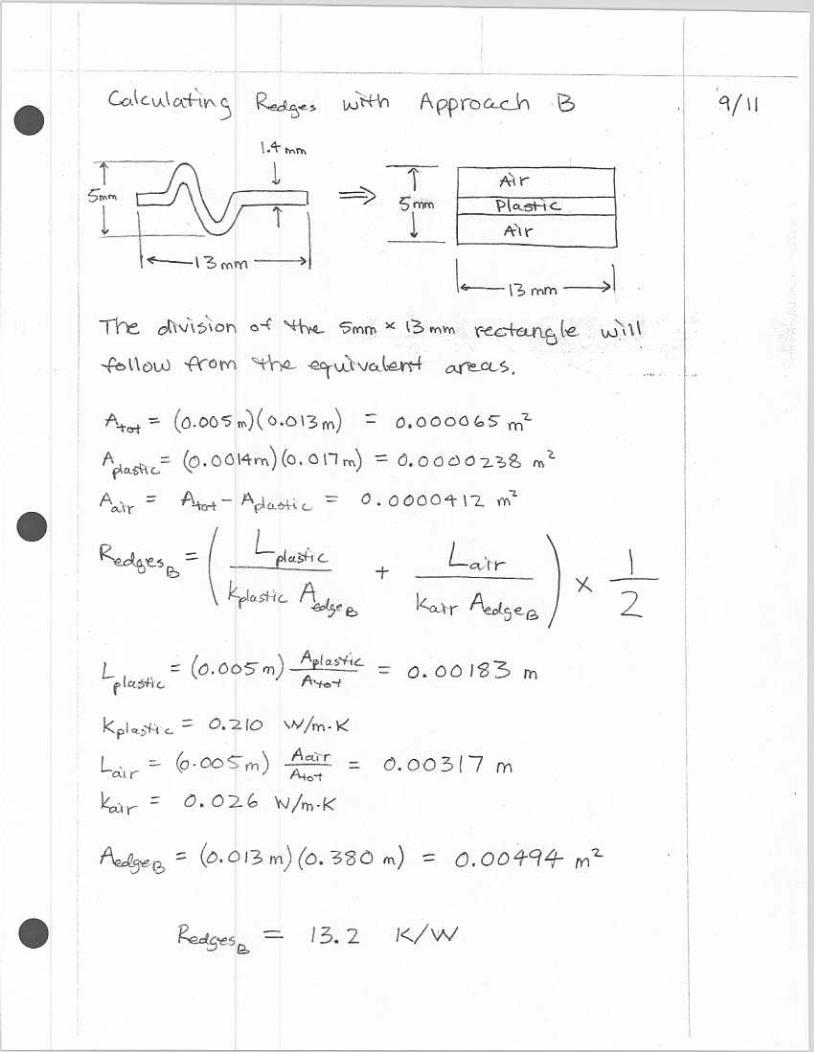
This allowed individual expressions to be obtained for the conduction through the center, edges,
.3 One-Dimensional Analysis of Patio Pacific Endura Flap
The method outlined above works quite well for both the Ideal and the Pet Safe Classic models
To begin, the Endura Flap was divided into separate components in a manner similar to
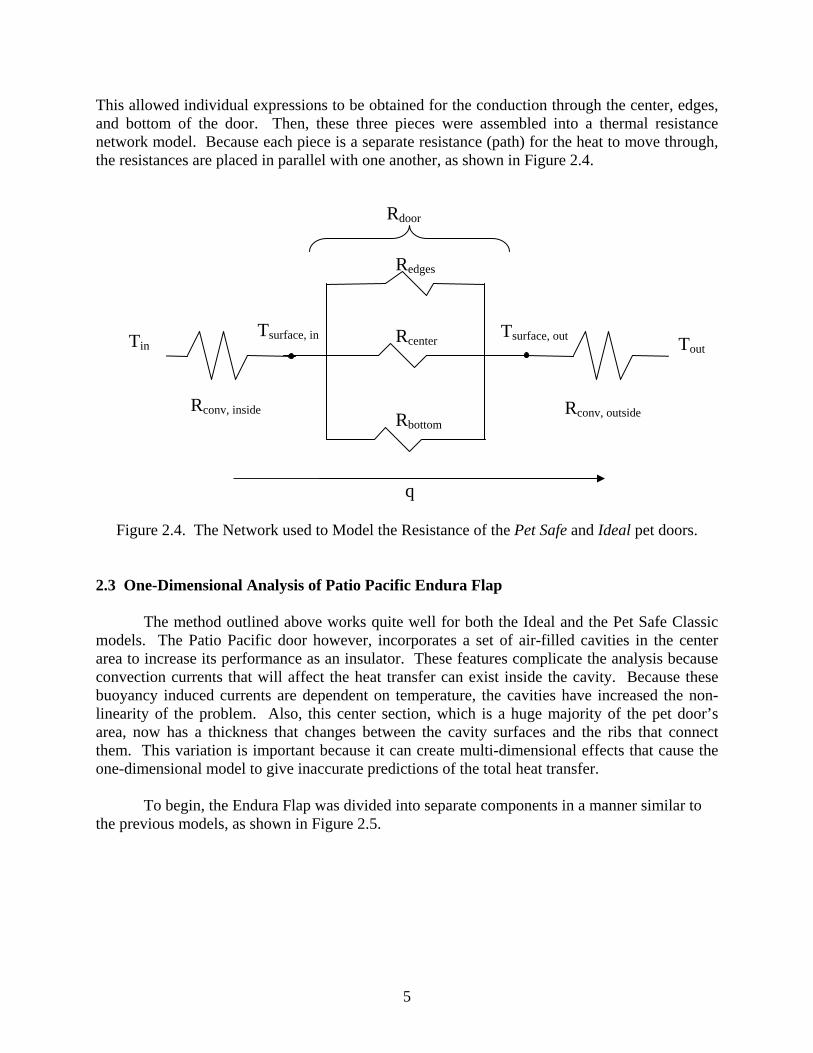
and bottom of the door. Then, these three pieces were assembled into a thermal resistance network model. Because each piece is a separate resistance (path) for the heat to move through, the resistances are placed in parallel with one another, as shown in Figure 2.4.
Redges
R
Figure 2.4. The Network used to Model the Resistance of the Pet Safe and Ideal pet doors.
2
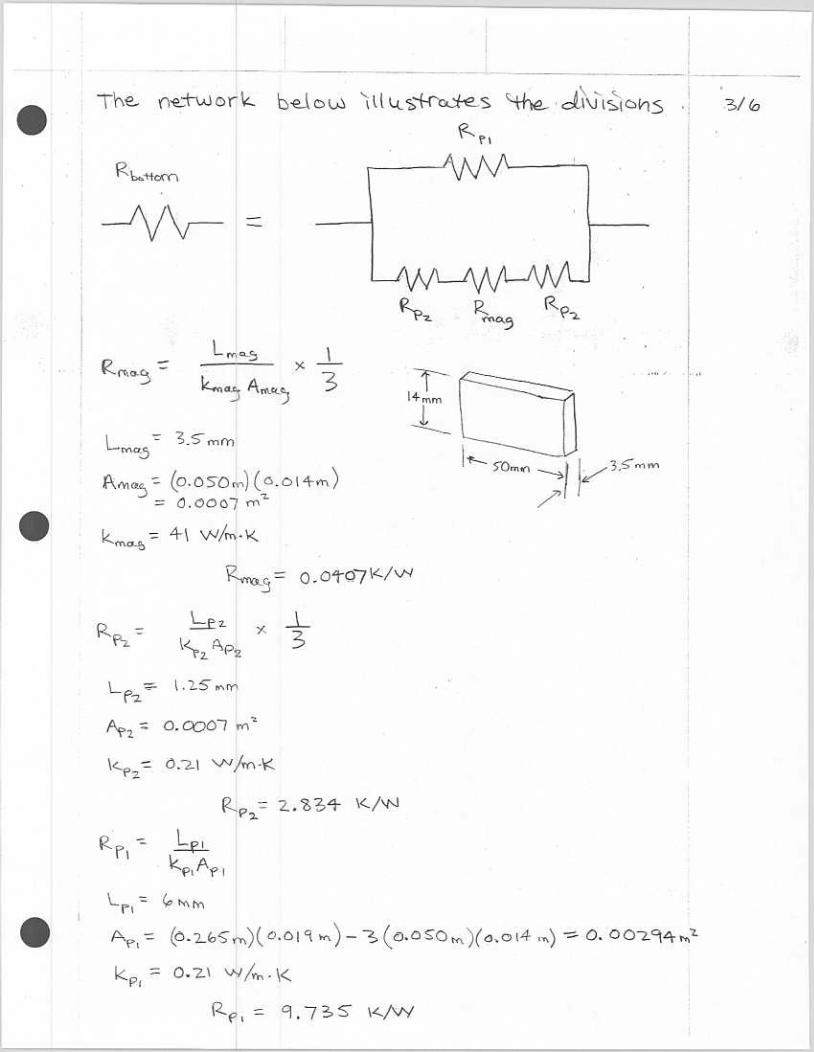
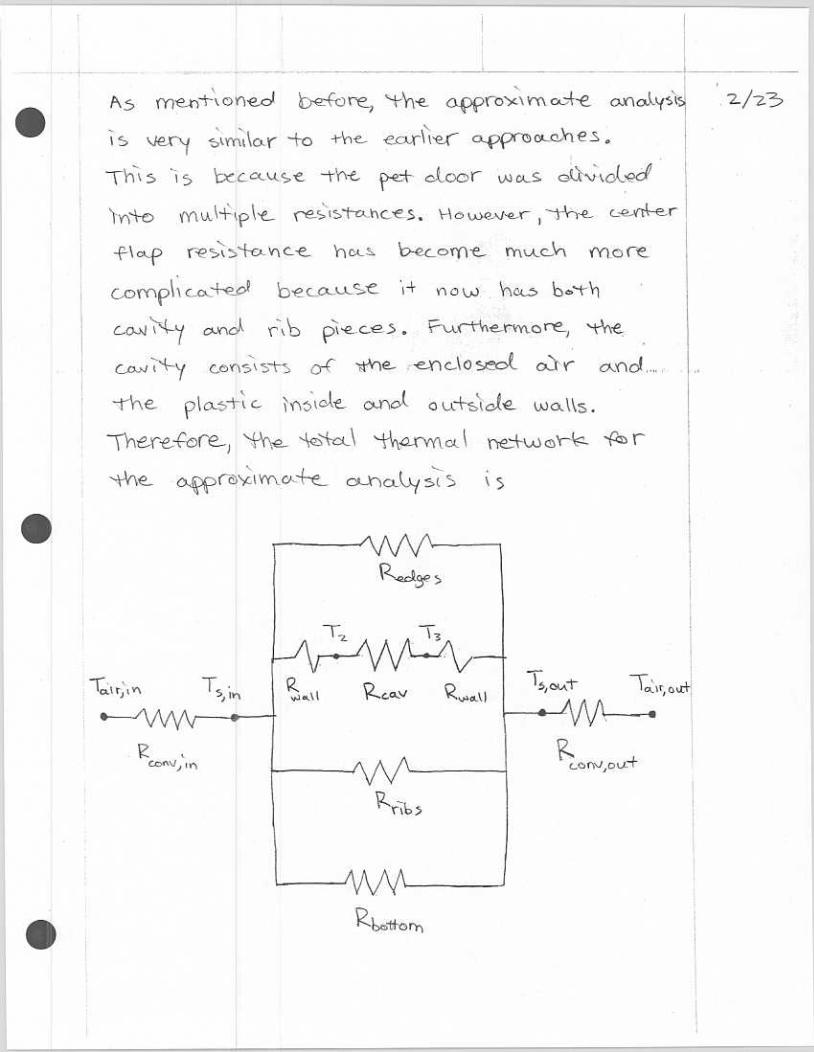
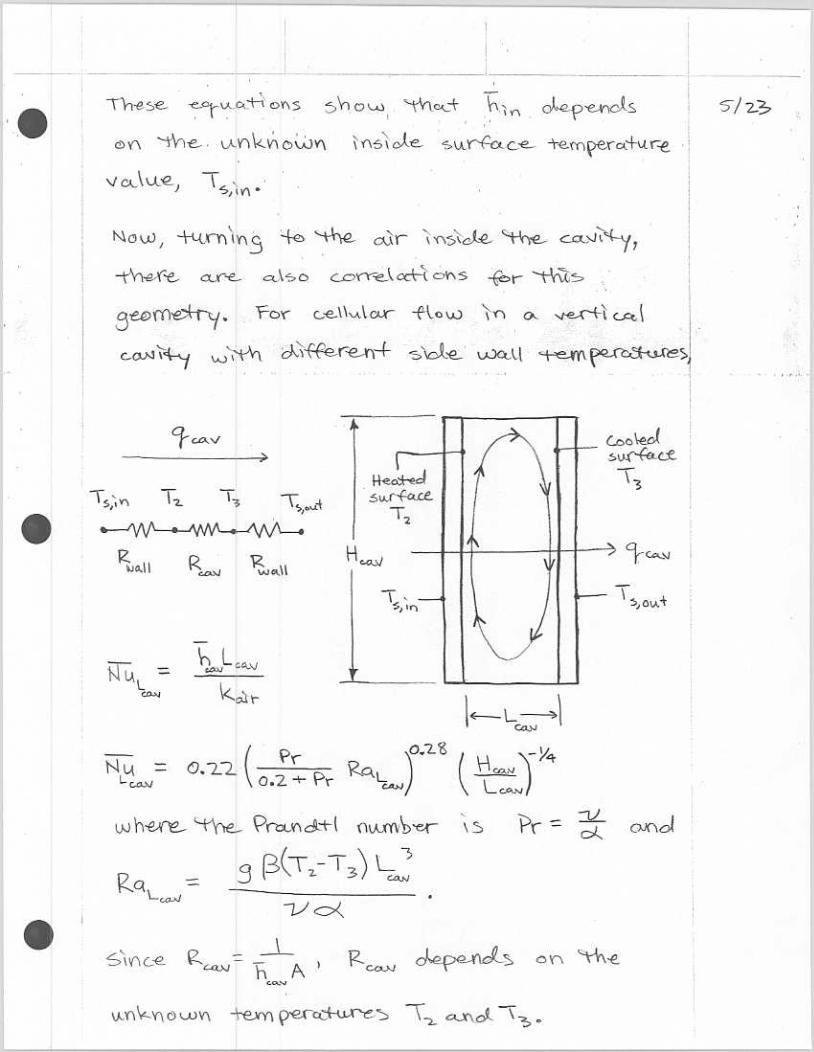
. The Patio Pacific door however, incorporates a set of air-filled cavities in the center area to increase its performance as an insulator. These features complicate the analysis because convection currents that will affect the heat transfer can exist inside the cavity. Because these buoyancy induced currents are dependent on temperature, the cavities have increased the non-linearity of the problem. Also, this center section, which is a huge majority of the pet door’s area, now has a thickness that changes between the cavity surfaces and the ribs that connect them. This variation is important because it can create multi-dimensional effects that cause the one-dimensional model to give inaccurate predictions of the total heat transfer. the previous models, as shown in Figure 2.5.
Rbottom
center
R econv, insid R econv, outsid
q
Tsurface, in Tsurface, out
Rdoor
T Tin out
5
Edge Folds
Air-filled Cavities
Ribs
Bottom
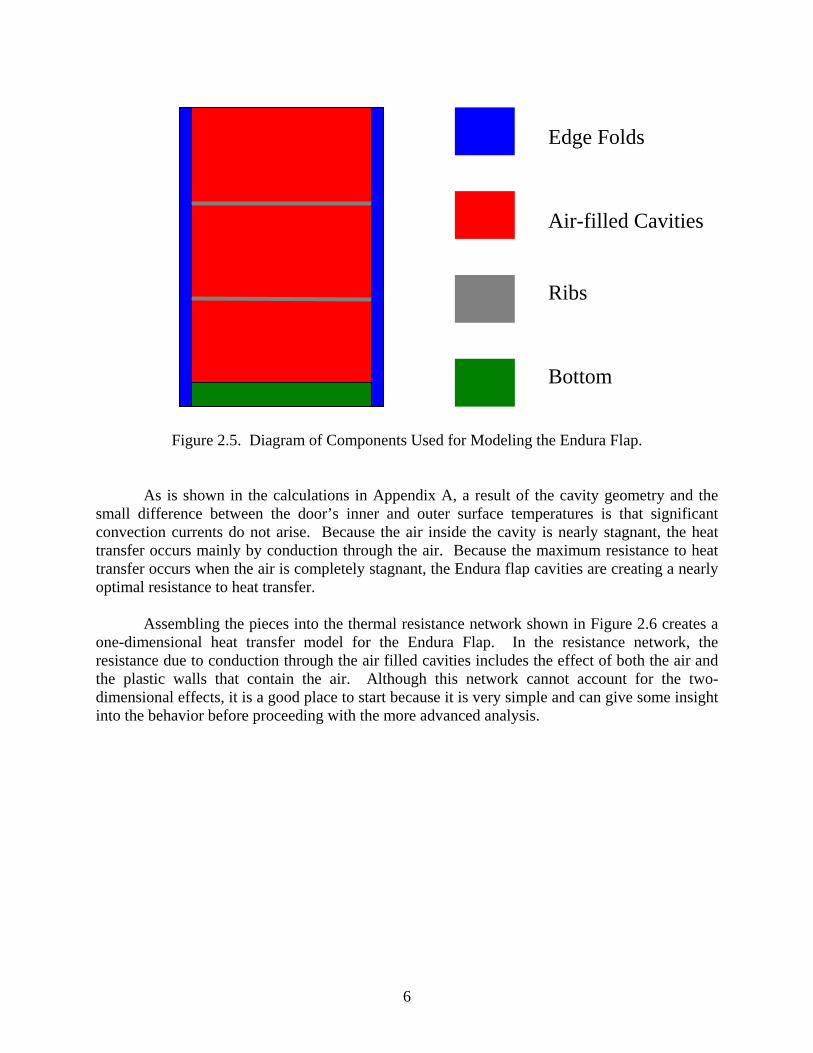
Figure 2.5. Diagram of Components Used for Modeling the Endura Flap.
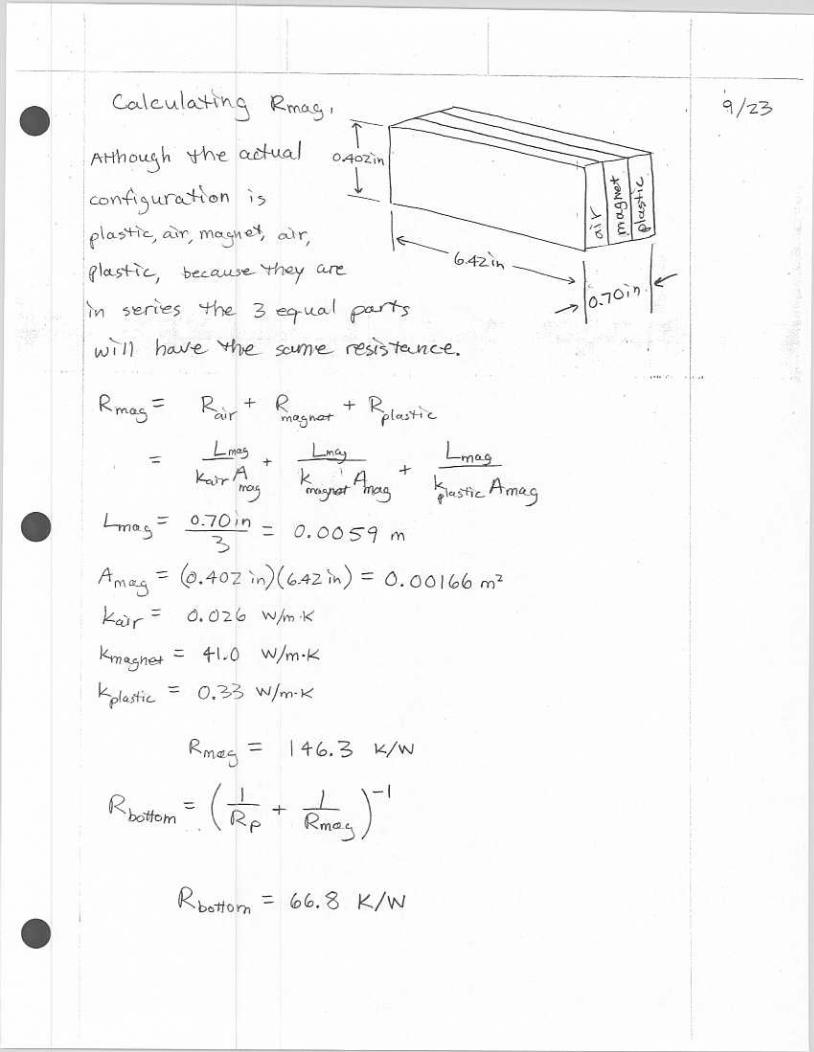
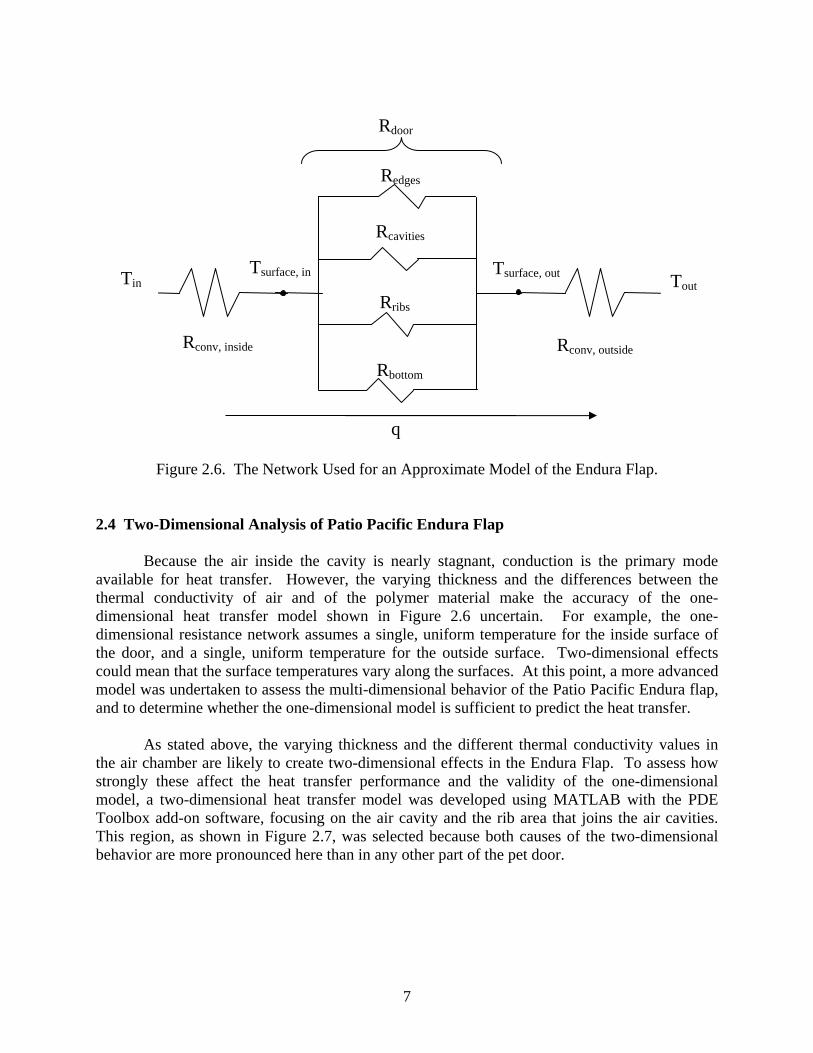
As is shown in the calculations in Appendix A, a result of the cavity geometry and the small difference between the door’s inner and outer surface temperatures is that significant convection currents do not arise. Because the air inside the cavity is nearly stagnant, the heat transfer occurs mainly by conduction through the air. Because the maximum resistance to heat transfer occurs when the air is completely stagnant, the Endura flap cavities are creating a nearly optimal resistance to heat transfer. Assembling the pieces into the thermal resistance network shown in Figure 2.6 creates a one-dimensional heat transfer model for the Endura Flap. In the resistance network, the resistance due to conduction through the air filled cavities includes the effect of both the air and the plastic walls that contain the air. Although this network cannot account for the two-dimensional effects, it is a good place to start because it is very simple and can give some insight into the behavior before proceeding with the more advanced analysis.
6
Redges
Rcavities
Figure 2.6. The Network Used for an Approximate Model of the Endura Flap.
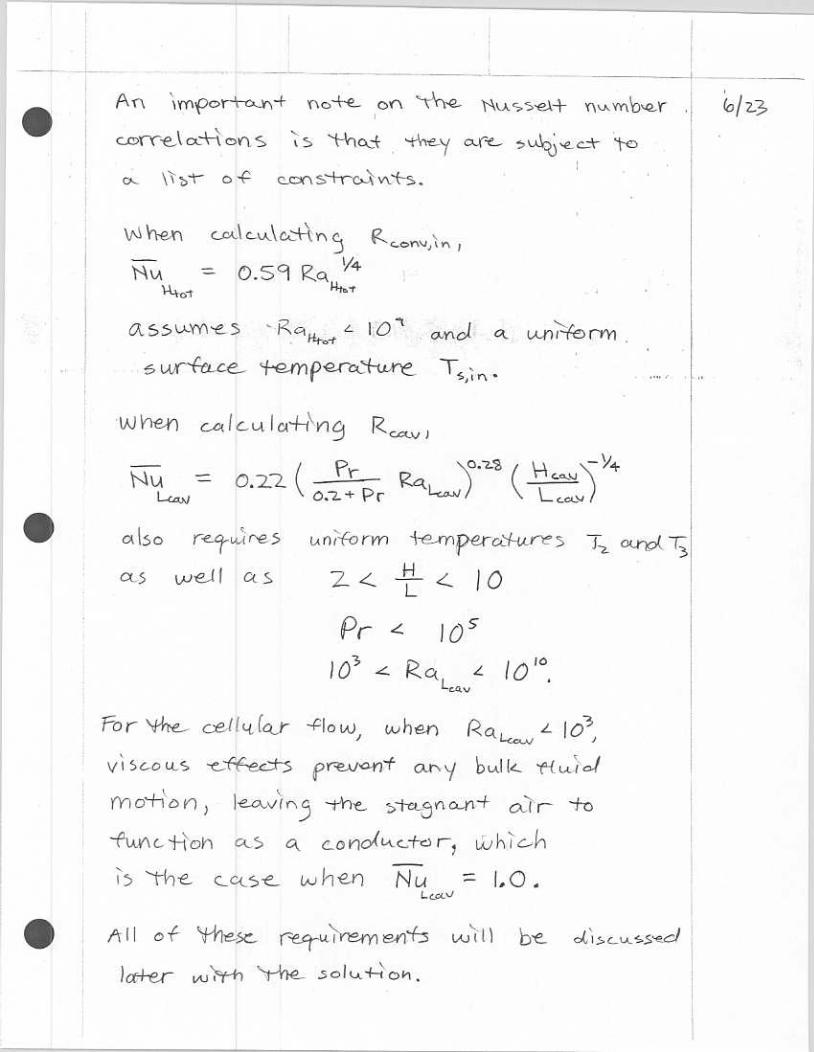
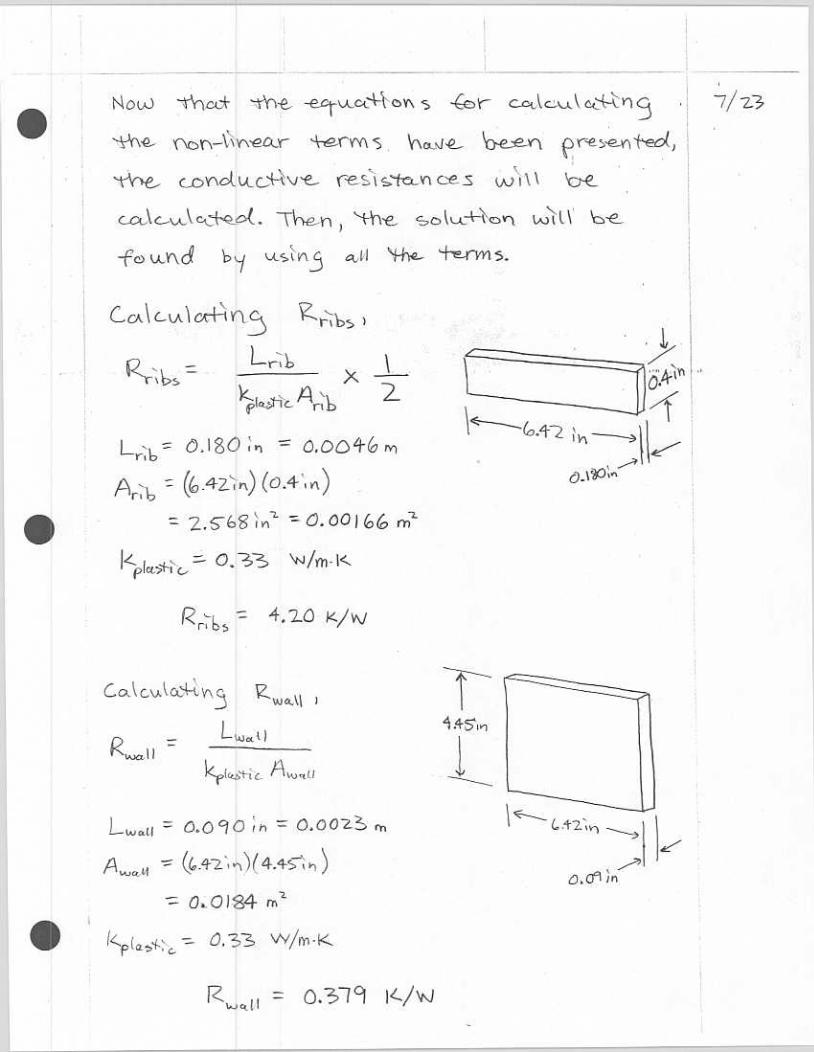
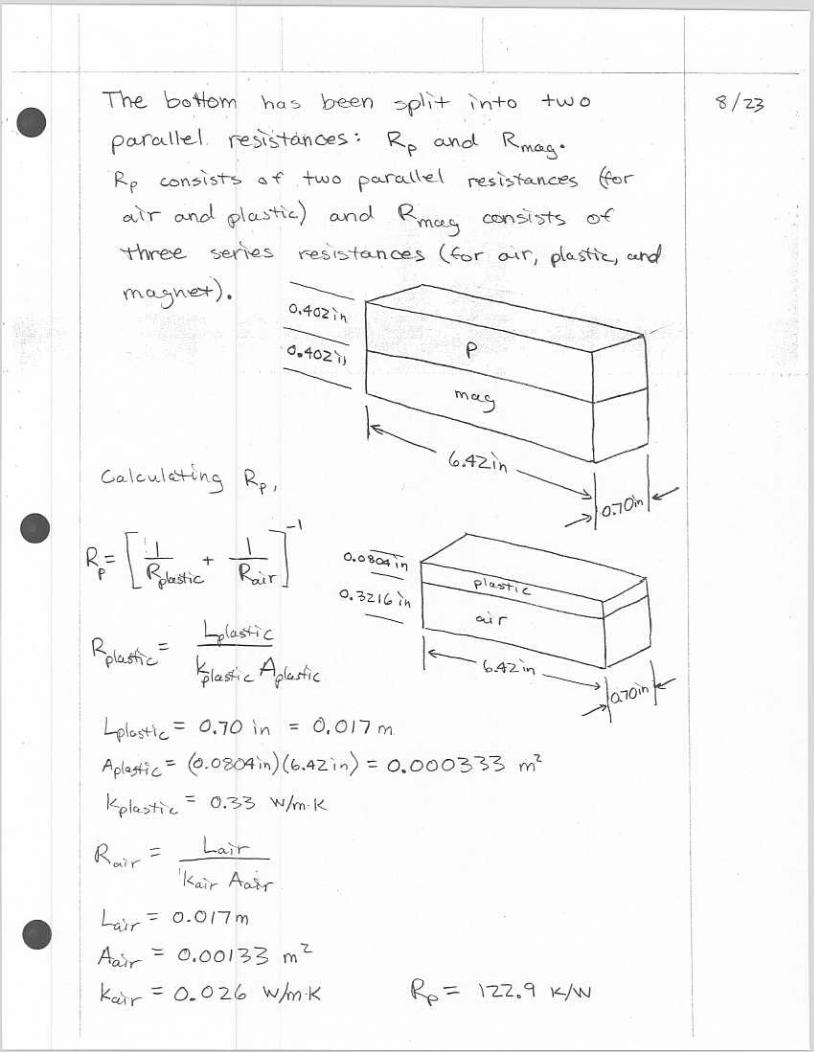
2.4 Two-Dimensional Analysis of Patio Pacific Endura Flap Because the air inside the cavity is nearly stagnant, conduction is the primary mode available for heat transfer. However, the varying thickness and the differences between the thermal conductivity of air and of the polymer material make the accuracy of the one-dimensional heat transfer model shown in Figure 2.6 uncertain. For example, the one-dimensional resistance network assumes a single, uniform temperature for the inside surface of the door, and a single, uniform temperature for the outside surface. Two-dimensional effects could mean that the surface temperatures vary along the surfaces. At this point, a more advanced model was undertaken to assess the multi-dimensional behavior of the Patio Pacific Endura flap, and to determine whether the one-dimensional model is sufficient to predict the heat transfer. As stated above, the varying thickness and the different thermal conductivity values in the air chamber are likely to create two-dimensional effects in the Endura Flap. To assess how strongly these affect the heat transfer performance and the validity of the one-dimensional model, a two-dimensional heat transfer model was developed using MATLAB with the PDE Toolbox add-on software, focusing on the air cavity and the rib area that joins the air cavities. This region, as shown in Figure 2.7, was selected because both causes of the two-dimensional behavior are more pronounced here than in any other part of the pet door.
Rribs
Rbottom
Rdoor
Tsurface, in Tsurface, outTin Tout
Rconv, inside Rconv, outside
q
7
Symmetry line
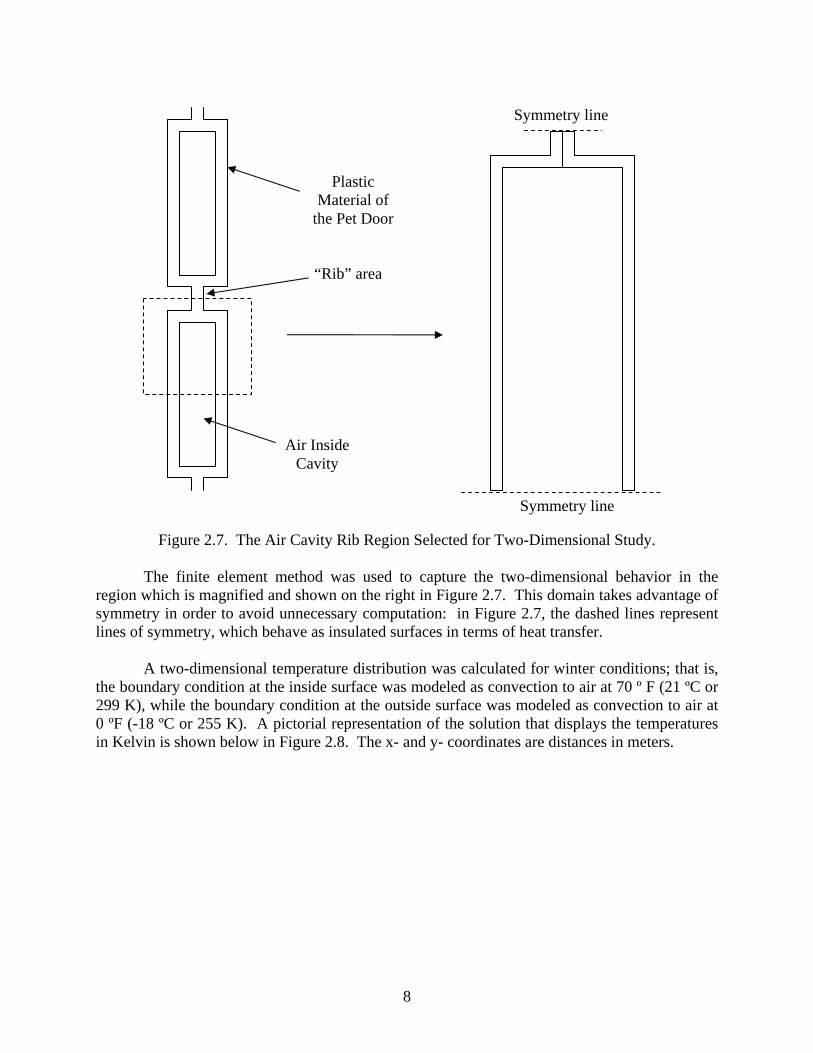
Figure 2.7. The Air Cavity Rib Region Selected for Two-Dimensional Study.
The finite element method was used to capture the two-dimensional behavior in the region which is magnified and shown on the right in Figure 2.7. This domain takes advantage of symmetry in order to avoid unnecessary computation: in Figure 2.7, the dashed lines represent lines of symmetry, which behave as insulated surfaces in terms of heat transfer.
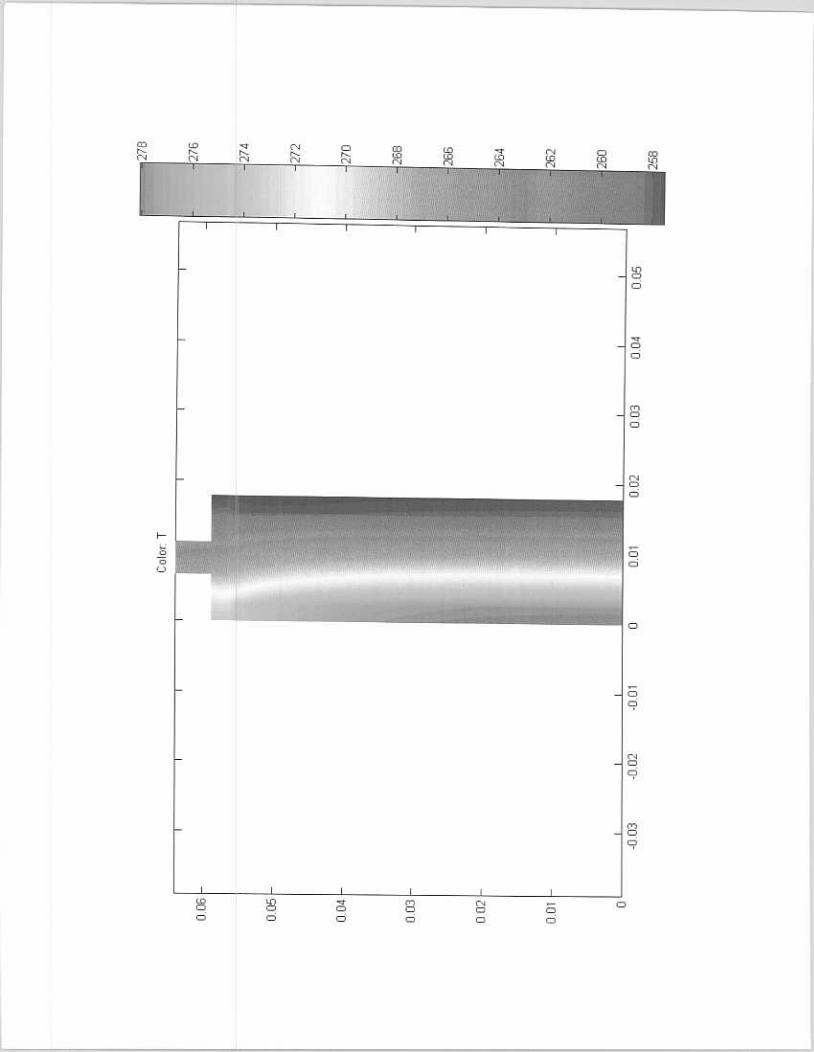
A two-dimensional temperature distribution was calculated for winter conditions; that is, the boundary condition at the inside surface was modeled as convection to air at 70 º F (21 ºC or 299 K), while the boundary condition at the outside surface was modeled as convection to air at 0 ºF (-18 ºC or 255 K). A pictorial representation of the solution that displays the temperatures in Kelvin is shown below in Figure 2.8. The x- and y- coordinates are distances in meters.
Air Inside Cavity
Plastic Material of
the Pet Door
“Rib” area
Symmetry line
8
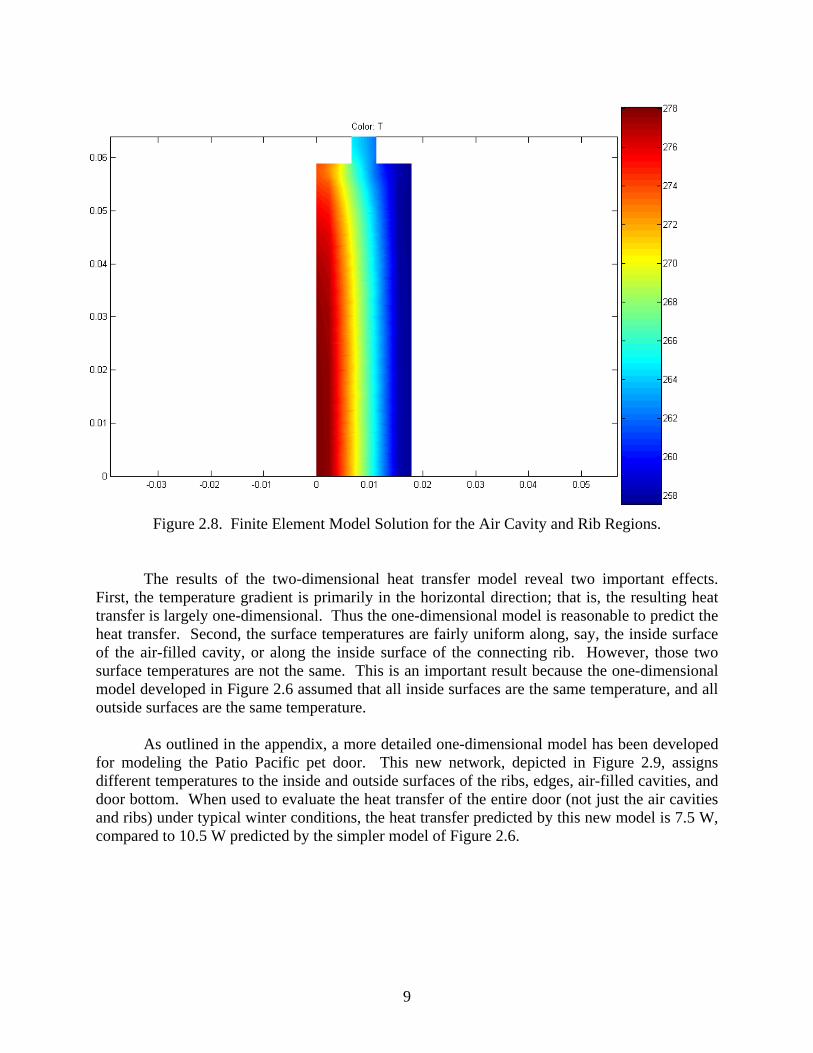
Figure 2.8. Finite Element Model Solution for the Air Cavity and Rib Regions.
The results of the two-dimensional heat transfer model reveal two important effects.
First, the temperature gradient is primarily in the horizontal direction; that is, the resulting heat transfer is largely one-dimensional. Thus the one-dimensional model is reasonable to predict the heat transfer. Second, the surface temperatures are fairly uniform along, say, the inside surface of the air-filled cavity, or along the inside surface of the connecting rib. However, those two surface temperatures are not the same. This is an important result because the one-dimensional model developed in Figure 2.6 assumed that all inside surfaces are the same temperature, and all outside surfaces are the same temperature.
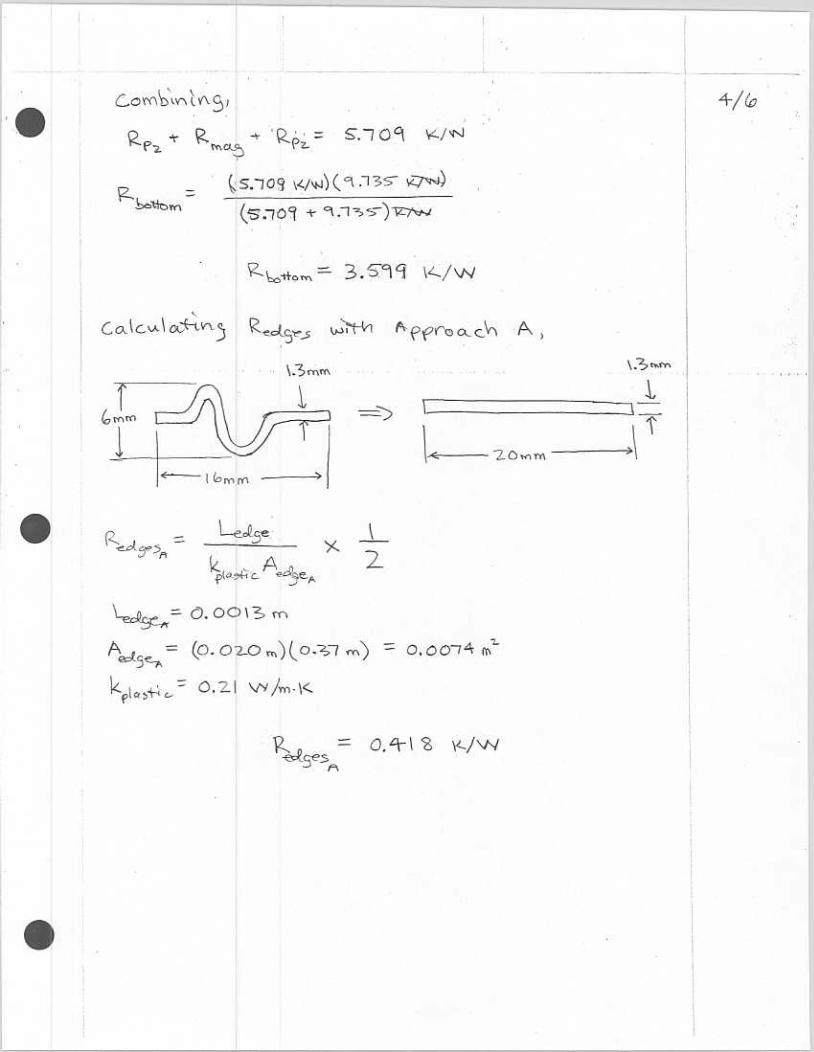
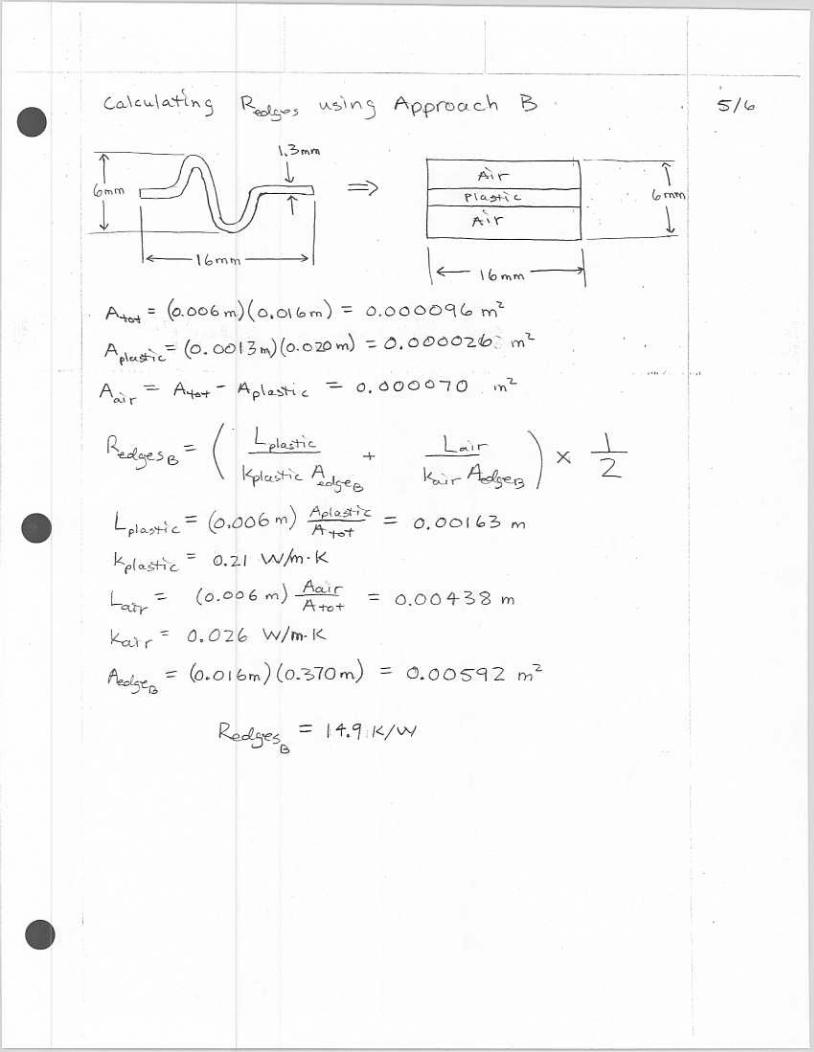
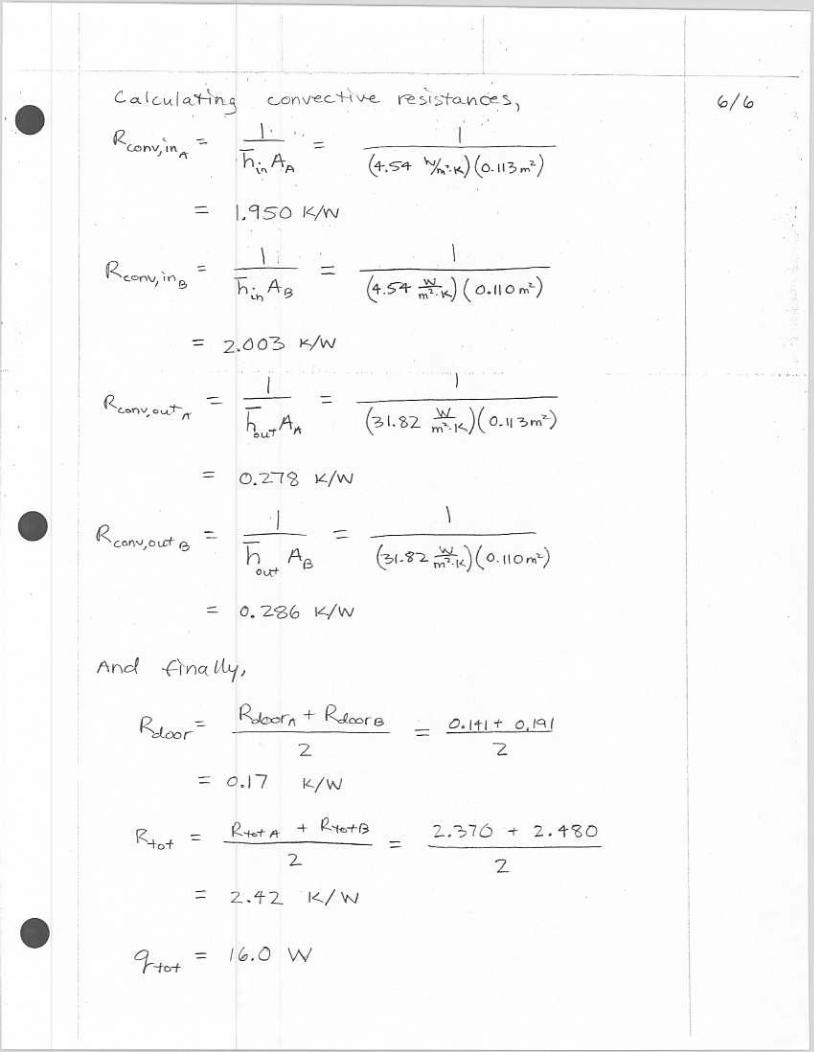
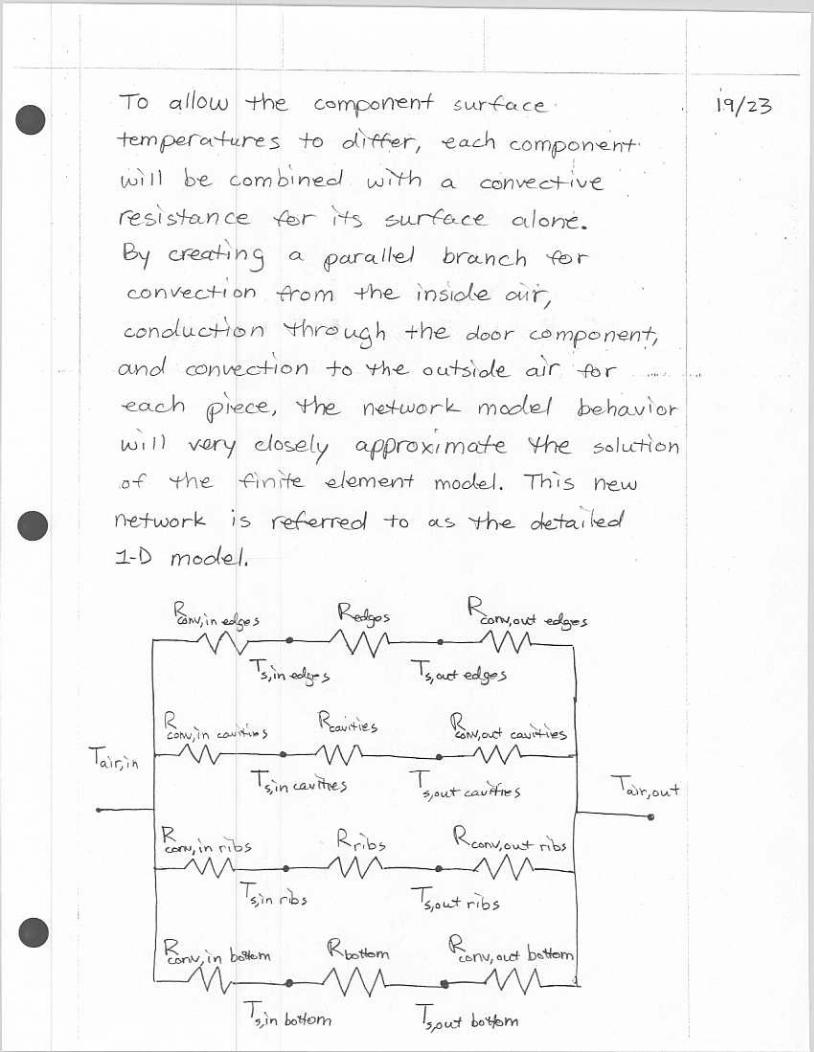
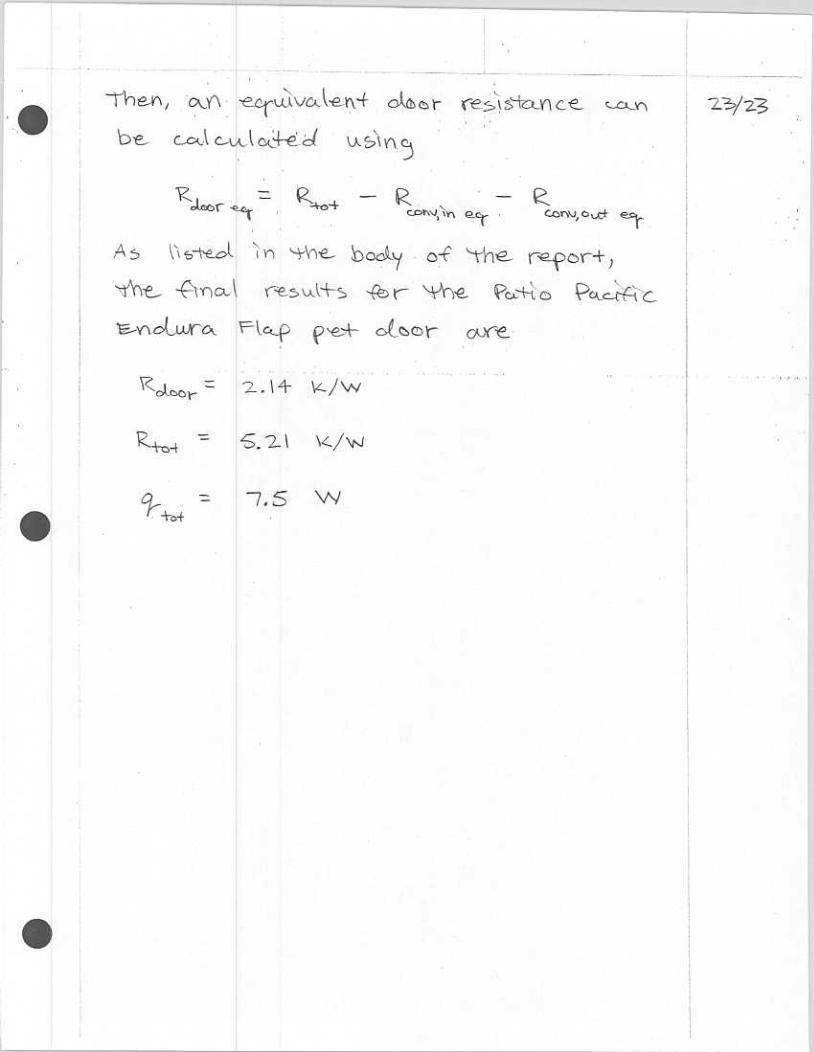
As outlined in the appendix, a more detailed one-dimensional model has been developed
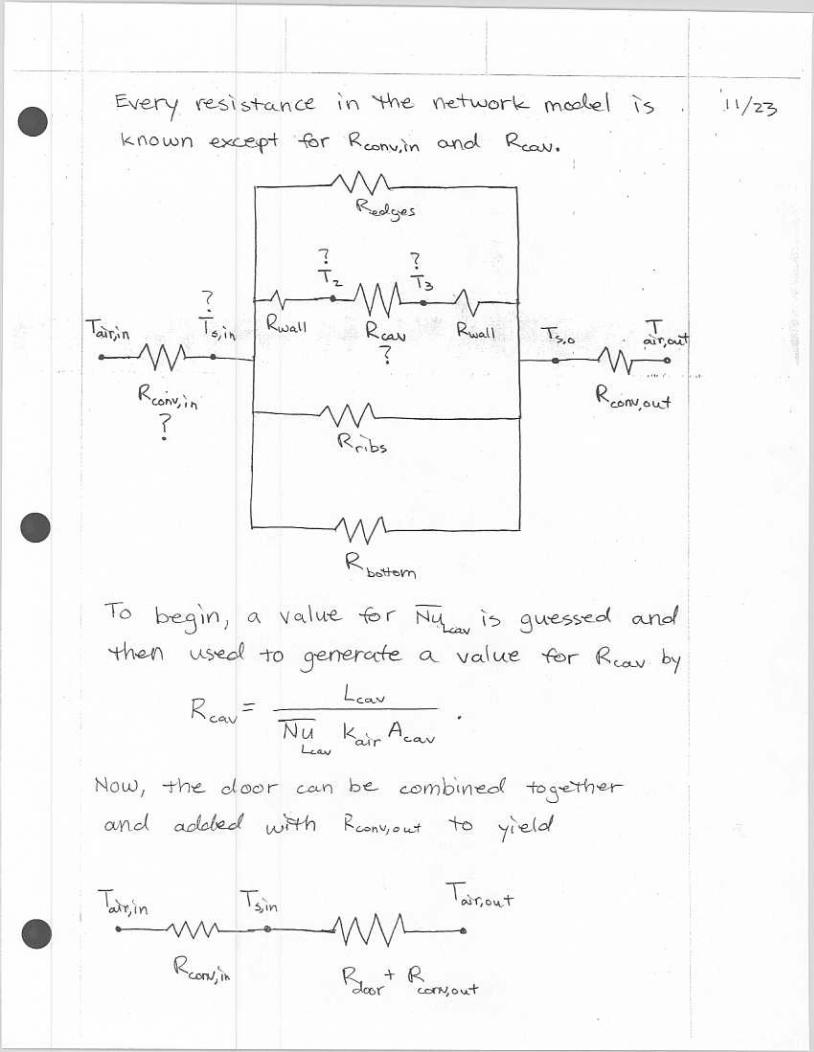
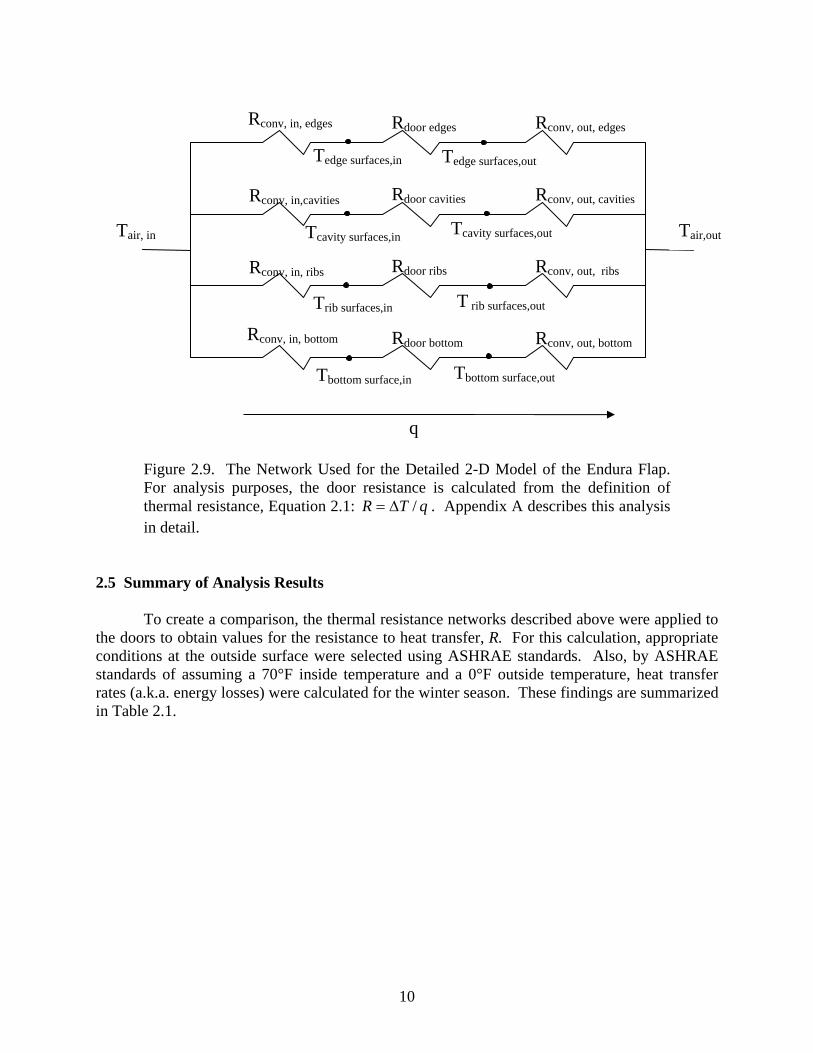
for modeling the Patio Pacific pet door. This new network, depicted in Figure 2.9, assigns different temperatures to the inside and outside surfaces of the ribs, edges, air-filled cavities, and door bottom. When used to evaluate the heat transfer of the entire door (not just the air cavities and ribs) under typical winter conditions, the heat transfer predicted by this new model is 7.5 W, compared to 10.5 W predicted by the simpler model of Figure 2.6.
9
Rconv, in, edges Rdoor edges Rconv, out, edges
Figure 2.9. The Network Used for the Detailed 2-D Model of the Endura Flap. For analysis purposes, the door resistance is calculated from the definition of thermal resistance, Equation 2.1: qTR /∆= . Appendix A describes this analysis in detail.
2.5 Summary of Analysis Results To create a comparison, the thermal resistance networks described above were applied to the doors to obtain values for the resistance to heat transfer, R. For this calculation, appropriate conditions at the outside surface were selected using ASHRAE standards. Also, by ASHRAE standards of assuming a 70°F inside temperature and a 0°F outside temperature, heat transfer rates (a.k.a. energy losses) were calculated for the winter season. These findings are summarized in Table 2.1.
Tair, in
Rconv, in,cavities
Rconv, in, ribs
Rconv, in, bottom
Rconv, out, cavities
Rconv, out, ribs
Rconv, out, bottom
Rdoor ribs
Rdoor bottom
Rdoor cavities
Tedge surfaces,in
Tair,outTcavity surfaces,in
Tedge surfaces,out
Tcavity surfaces,out
T rib surfaces,outTrib surfaces,in
Tbottom surface,outTbottom surface,in
q
10
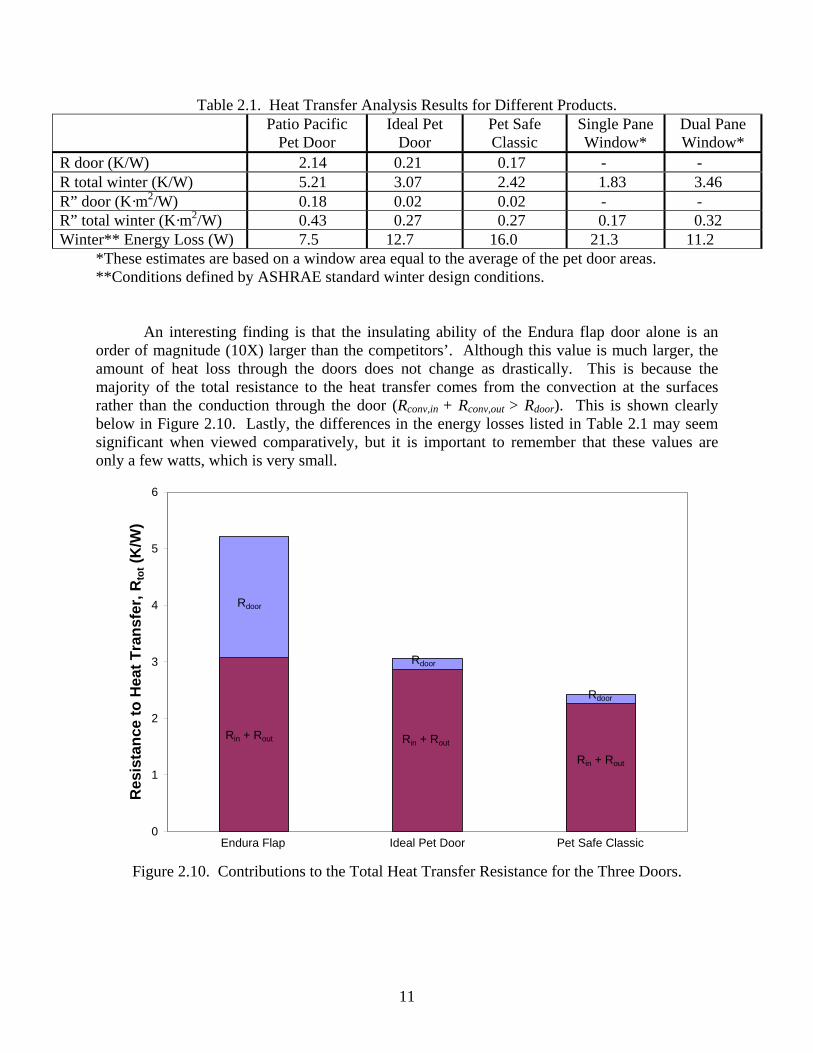
Table 2.1. Heat Transfer Analysis Results for Different Products. Patio Pacific
Pet Door Ideal Pet
Door Pet Safe Classic
Single Pane Window*
Dual Pane Window*
R door (K/W) 2.14 0.21 0.17 - - R total winter (K/W) 5.21 3.07 2.42 1.83 3.46 R” door (K·m2/W) 0.18 0.02 0.02 - - R” total winter (K·m2/W) 0.43 0.27 0.27 0.17 0.32 Winter** Energy Loss (W) 7.5 12.7 16.0 21.3 11.2
*These estimates are based on a window area equal to the average of the pet door areas. **Conditions defined by ASHRAE standard winter design conditions. An interesting finding is that the insulating ability of the Endura flap door alone is an order of magnitude (10X) larger than the competitors’. Although this value is much larger, the amount of heat loss through the doors does not change as drastically. This is because the majority of the total resistance to the heat transfer comes from the convection at the surfaces rather than the conduction through the door (Rconv,in + Rconv,out > Rdoor). This is shown clearly below in Figure 2.10. Lastly, the differences in the energy losses listed in Table 2.1 may seem significant when viewed comparatively, but it is important to remember that these values are only a few watts, which is very small.
0
1
2
3
4
5
6
Res
ista
nce
to H
eat T
rans
fer,
Rto
t (K
/W)
Rin + Rout Rin + Rout
Rin + Rout
Rdoor
Rdoor
Rdoor
Endura Flap Ideal Pet Door Pet Safe Classic
Figure 2.10. Contributions to the Total Heat Transfer Resistance for the Three Doors.
11
2.6 Conclusions At the completion of the analytical study of each pet door’s heat transfer performance under winter conditions, the following conclusions can be made. 1. The Endura Flap’s resistance to heat transfer, Rdoor, is approximately 10 times greater than the competitors’. However, the total resistance to heat transfer for this product, R, which determines the rate of energy loss is only approximately 2 times greater. 2. Although the cavity design of the Endura Flap has clearly decreased the heat transfer, the energy losses from heat transfer are very small for all three doors. Furthermore, these energy losses are much smaller than the values associated with air leakage, as will be shown in Chapter 4. 3. Placing a material into the cavities is not likely to improve the heat transfer performance of the Endura Flap pet door because the minimal convection currents that develop inside the cavities allow the air to serve as the excellent insulator that it is.
12
3. Infiltration (Air Leakage) Study While the heat diffusing through the pet doors can be modeled and predicted quite accurately with an analytical approach, the energy losses associated with infiltration (air leakage) is much more complicated. Consequently, an accurate measure of each door’s leakages under different conditions can only be obtained through experimentation. The air leakage consumes energy because the air that enters the home must be brought to the temperature of the dwelling by either heating or cooling. The amount of energy associated with this process can be calculated using TQcq p∆= ρ , (3.1) where q is the energy required to heat or cool the air (kWh or BTU) ρ is the density of air (lbm/ft3 or kg/m3),
Q is the volumetric flow rate of air from the leakage (CFM or m3/s), cp is the specific heat at constant pressure for air (kJ/kg K or BTU/lbm R), and ∆T is the difference between the inside and outside temperatures (ºC or ºF). Of the terms in Equation 3.1, the physical properties of air (ρ, cp) and the temperature difference (∆T) can be thought of as independent variables, meaning they do not depend on the door model. It is the leakage flow rate, Q, which is most dependent on the pet door design. Air leakage occurs when the air flows past seals or gaps along the perimeter of the pet door. This air flow is driven by a difference in pressure. For example, when the pressure inside the home is slightly less than that outside, air will be forced into the home through the seals or gaps. So, for each door, the amount of leakage will depend on the pressure difference across the door. This pressure difference across the door is typically caused by wind that impinges upon the door. These two relationships reveal that the air leakage flow rate will depend on the velocity of the impinging wind.
This is an important result that is rather intuitive, but it is also incomplete, because there is also a dependence on temperature. Because of the pet door material’s coefficient of thermal expansion, as the temperature increases or decreases, the pet door expands or contracts, respectively. At low temperatures, the pet doors contract, causing the cracks along the perimeter of the doors to become larger, which can lead to greater leakage. At high temperatures, the pet doors expand, possibly to the point of becoming too large for the frame they are to seal with. This would cause the doors to remain ajar after use, which could also lead to an increased amount of leakage.
The final result of this discussion can be expressed in functional form as
),( TVQQ = (3.2)
where Q is the volumetric flow rate of air leakage (CFM or m3/s), V is the speed of the impinging wind (mph or m/s), and
13
T is the temperature of the air (ºC or ºF). Equation 3.2 states that the air leakage volumetric flow rate depends on both the impinging wind speed and the air temperature. This result is important because it is a concise and exact statement of what parameters need to be varied in order to capture all of the air leakage behavior of each pet door model. The infiltration study performed in this work is comprised of three parts:
1. Effect of wind speed. In order to determine the effect of the wind speed, the leakage flow rate is measured for each door as it is subjected to different pressure differences that simulate head-on (perpendicular to the door) wind speeds ranging from zero to about 25 miles per hour.
2. Effect of temperature. In order to determine whether temperature has an effect on pet door performance, the above tests were conducted at three temperatures: low temperature (approximately -5 ºF), room temperature (approx. 70 ºF), and high temperature (approx. 110 ºF).
3. Ultimate seal failure. In addition to the above tests where the leakage flow rate is being measured, there is another test to determine the strength of each doors’ seal. This ultimate seal failure test does not measure the leakage flow rate, but rather determines the pressure difference necessary to break the seal and blow the door open.
It is important to note that, given the extensive testing required, only one of each door model was tested. It is assumed that each door is representative of the performance of the model; i.e., that each door’s results are “typical” for that model. 3.1 Simulation of Impinging Wind In this work, the effect of the wind on the pet doors was not tested directly; that is, air was not forced onto the doors with a fan or any similar method. Directly imposing a wind on the door was not feasible, since the effect of the wind changes with the wall size and shape, as well as the wind direction. Instead, the effect of the wind was simulated by imposing a pressure difference across the door. Following McQuiston et al. [2], wind impinging on a door or window changes the pressure felt on the outside of the door. The effect is related to Bernoulli’s equation, and is presented as
2
2wp
w
VCP
ρ=∆ , (3.3)
where is the pressure difference across the door (inHwP∆ 2O or psi), ρ is the density of the air (lbm/ft3),
wV is the average wind speed (mph), and
pC is the pressure coefficient.
14
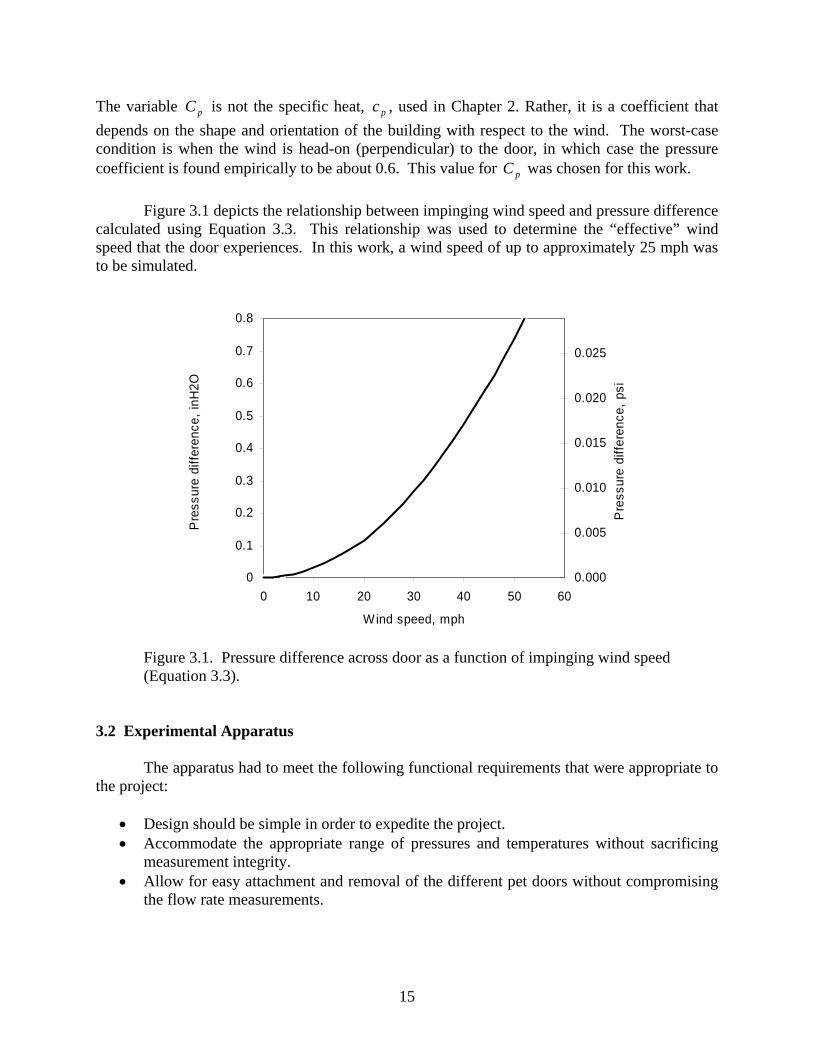
The variable is not the specific heat, , used in Chapter 2. Rather, it is a coefficient that depends on the shape and orientation of the building with respect to the wind. The worst-case condition is when the wind is head-on (perpendicular) to the door, in which case the pressure coefficient is found empirically to be about 0.6. This value for was chosen for this work.
pC pc
pC Figure 3.1 depicts the relationship between impinging wind speed and pressure difference calculated using Equation 3.3. This relationship was used to determine the “effective” wind speed that the door experiences. In this work, a wind speed of up to approximately 25 mph was to be simulated.
0
0.1
0.2
0.3
0.4
0.5
0.6
0.7
0.8
0 10 20 30 40 50 60
Wind speed, mph
Pre
ssur
e di
ffere
nce,
inH
2O
0.000
0.005
0.010
0.015
0.020
0.025
Pre
ssur
e di
ffere
nce,
psi
Figure 3.1. Pressure difference across door as a function of impinging wind speed (Equation 3.3).
3.2 Experimental Apparatus The apparatus had to meet the following functional requirements that were appropriate to the project:
• Design should be simple in order to expedite the project. • Accommodate the appropriate range of pressures and temperatures without sacrificing
measurement integrity. • Allow for easy attachment and removal of the different pet doors without compromising
the flow rate measurements.
15
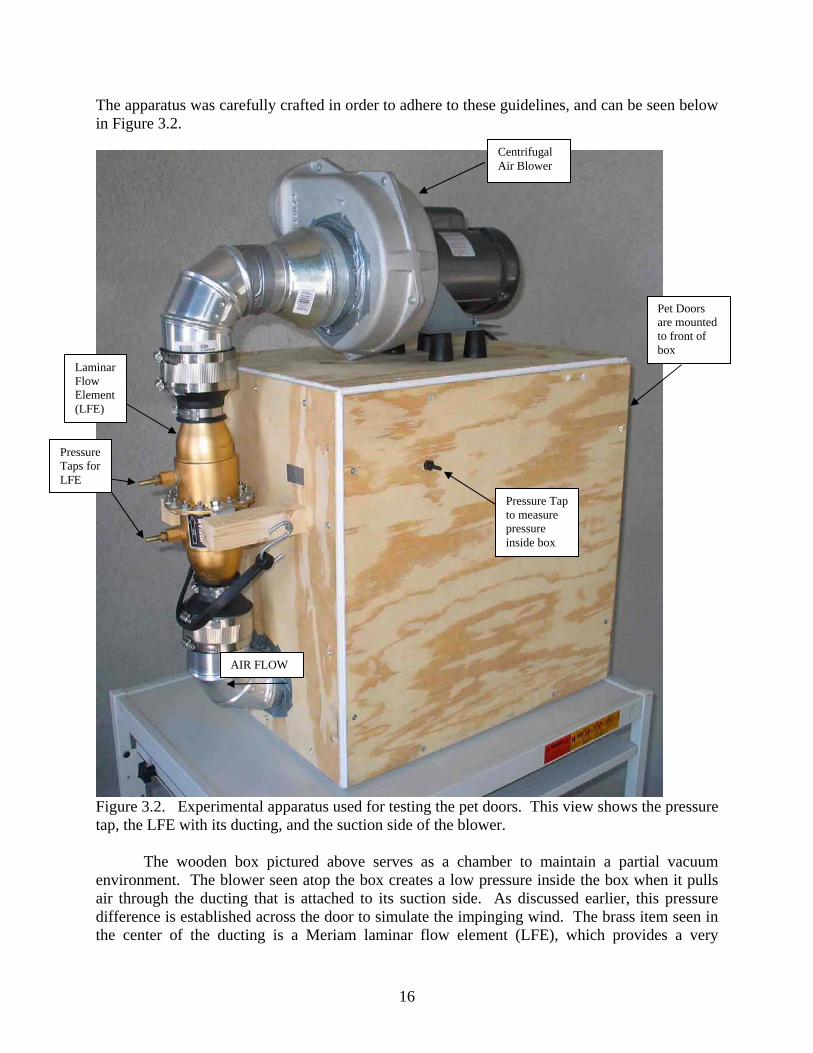
The apparatus was carefully crafted in order to adhere to these guidelines, and can be seen below in Figure 3.2.
Centrifugal Air Blower
Pet Doors are mounted to front of box
Laminar Flow Element (LFE)
Pressure Taps for LFE
Pressure Tap to measure pressure inside box
AIR FLOW
Figure 3.2. Experimental apparatus used for testing the pet doors. This view shows the pressure tap, the LFE with its ducting, and the suction side of the blower.
The wooden box pictured above serves as a chamber to maintain a partial vacuum environment. The blower seen atop the box creates a low pressure inside the box when it pulls air through the ducting that is attached to its suction side. As discussed earlier, this pressure difference is established across the door to simulate the impinging wind. The brass item seen in the center of the ducting is a Meriam laminar flow element (LFE), which provides a very
16
17
boxtotaldoor QQQ
accurate measure of the air flow rate, calibrated as a function of the pressure drop across the LFE. 3.3 Calibration Procedure Because the inside of the box is maintained at a partial vacuum to simulate the impinging wind, the box itself leaks air. Physically, it is not possible to completely eliminate this leakage; however, this leakage can be calibrated and then subtracted from the experimental data as follows: −= (3.4) where Qdoor is the leakage flow rate through the pet door, Qtotal is the leakage flow rate from both the pet door and the box, and Qbox is the leakage flow rate through the box. Equation 3.4 shows how the desired quantity, Qdoor, is found indirectly by measuring two other quantities. These two quantities are determined by their respective tests. These tests are necessary because the two quantities are both subject to change. In addition to depending on the pressure difference and the temperature, they can change each time a new door is attached to the box for testing.
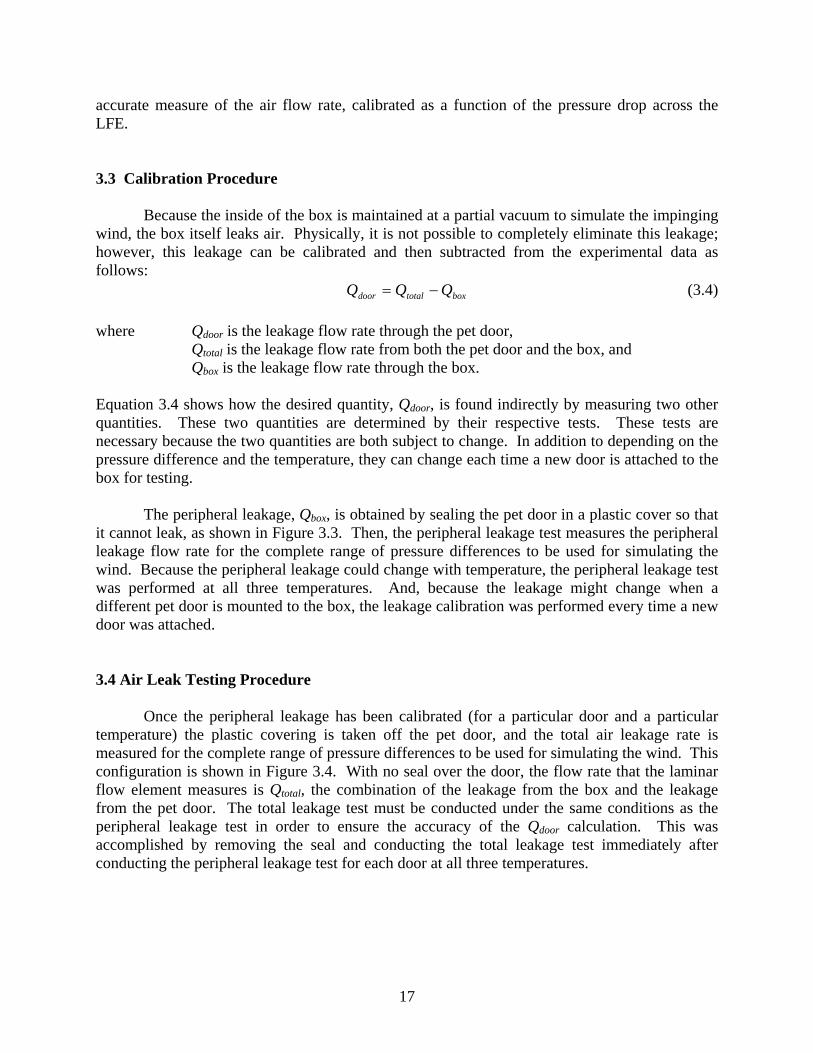
The peripheral leakage, Qbox, is obtained by sealing the pet door in a plastic cover so that it cannot leak, as shown in Figure 3.3. Then, the peripheral leakage test measures the peripheral leakage flow rate for the complete range of pressure differences to be used for simulating the wind. Because the peripheral leakage could change with temperature, the peripheral leakage test was performed at all three temperatures. And, because the leakage might change when a different pet door is mounted to the box, the leakage calibration was performed every time a new door was attached. 3.4 Air Leak Testing Procedure
Once the peripheral leakage has been calibrated (for a particular door and a particular temperature) the plastic covering is taken off the pet door, and the total air leakage rate is measured for the complete range of pressure differences to be used for simulating the wind. This configuration is shown in Figure 3.4. With no seal over the door, the flow rate that the laminar flow element measures is Qtotal, the combination of the leakage from the box and the leakage from the pet door. The total leakage test must be conducted under the same conditions as the peripheral leakage test in order to ensure the accuracy of the Qdoor calculation. This was accomplished by removing the seal and conducting the total leakage test immediately after conducting the peripheral leakage test for each door at all three temperatures.
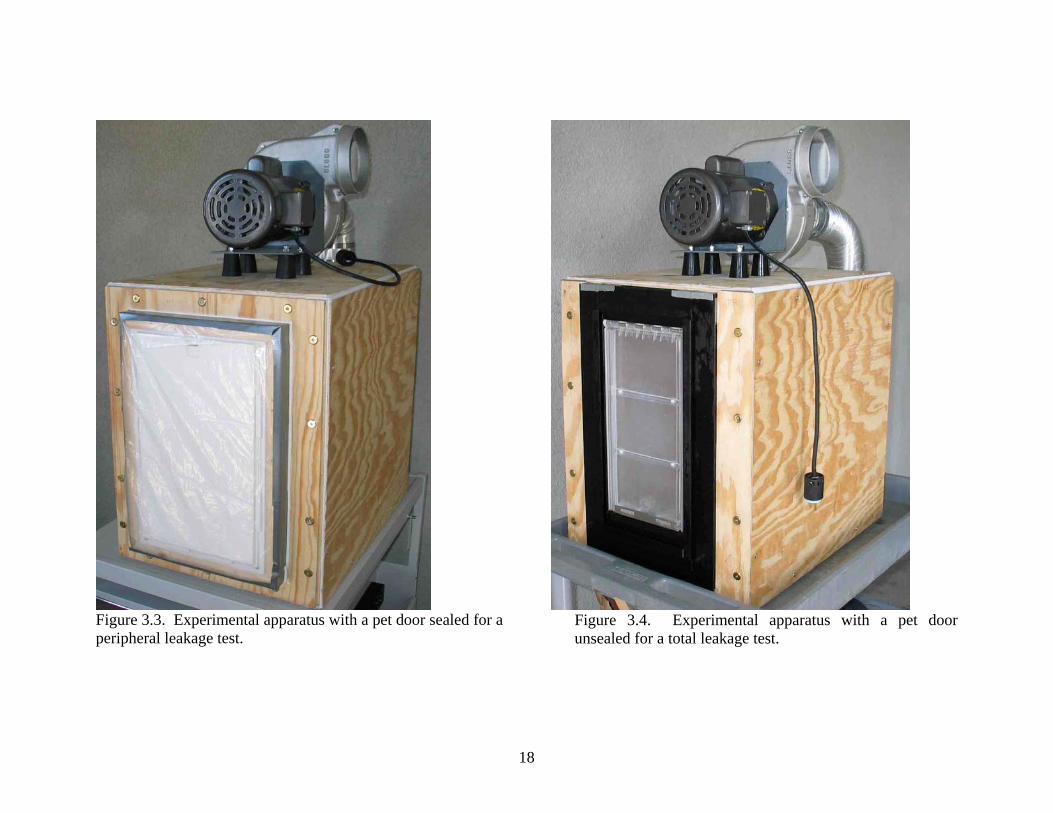
Figure 3.4. Experimental apparatus with a pet door unsealed for a total leakage test.
18
Figure 3.3. Experimental apparatus with a pet door sealed for a peripheral leakage test.
For each of the leakage tests, it is necessary to measure the flow rate for a range of pressure differences in order to simulate an appropriate range of wind speeds. To obtain a range of pressure differences across the door, a variac (variable transformer) controlled the power to the blower’s motor. This altered how much power the blower received, which in turn determined how much of a vacuum existed inside the box.
The pressure difference across the door simulating an impinging wind was measured using a micromanometer. This instrument was selected for its high resolution so that multiple measurements could be made through the appropriate range. It measures the pressure difference by connecting one column to the pressure tap on the box while leaving the other column open to the atmosphere, as shown in Figure 3.5.
Figure 3.5. Experimental apparatus with the micromanometer used to measure the pressure difference across the door, shown here with the flexible ducting installed for the ultimate seal failure test.
19
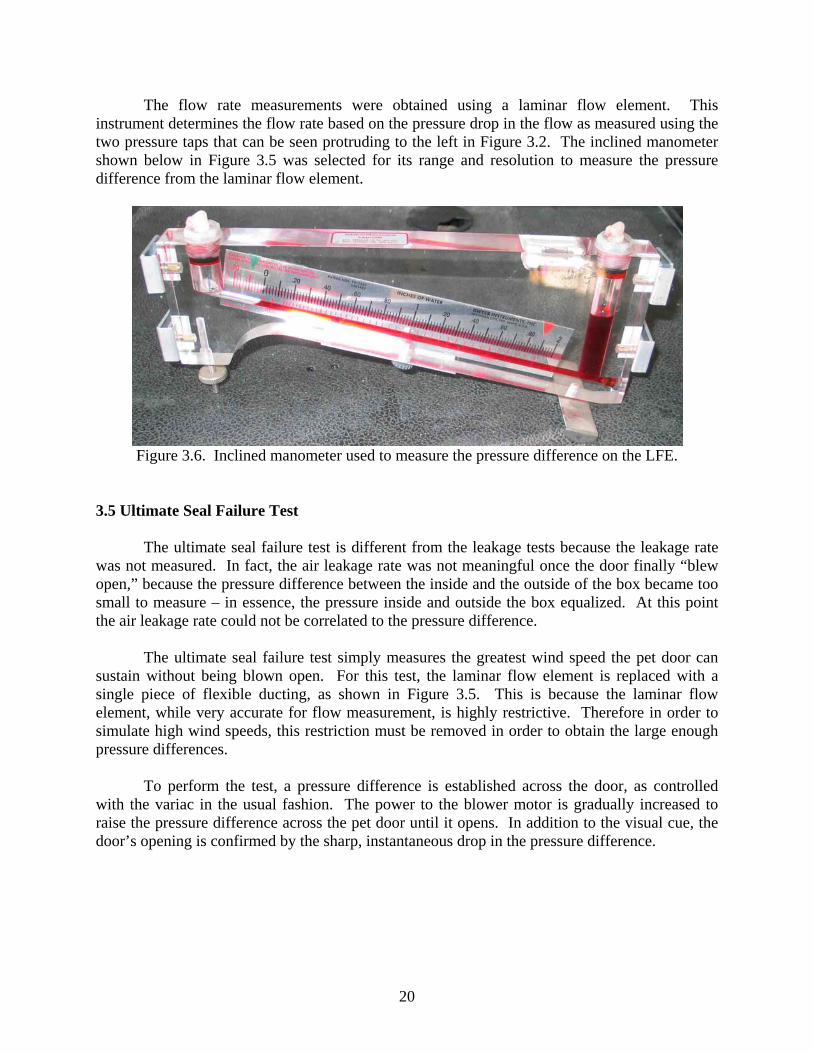
The flow rate measurements were obtained using a laminar flow element. This instrument determines the flow rate based on the pressure drop in the flow as measured using the two pressure taps that can be seen protruding to the left in Figure 3.2. The inclined manometer shown below in Figure 3.5 was selected for its range and resolution to measure the pressure difference from the laminar flow element.
Figure 3.6. Inclined manometer used to measure the pressure difference on the LFE.
3.5 Ultimate Seal Failure Test The ultimate seal failure test is different from the leakage tests because the leakage rate was not measured. In fact, the air leakage rate was not meaningful once the door finally “blew open,” because the pressure difference between the inside and the outside of the box became too small to measure – in essence, the pressure inside and outside the box equalized. At this point the air leakage rate could not be correlated to the pressure difference.
The ultimate seal failure test simply measures the greatest wind speed the pet door can sustain without being blown open. For this test, the laminar flow element is replaced with a single piece of flexible ducting, as shown in Figure 3.5. This is because the laminar flow element, while very accurate for flow measurement, is highly restrictive. Therefore in order to simulate high wind speeds, this restriction must be removed in order to obtain the large enough pressure differences.
To perform the test, a pressure difference is established across the door, as controlled with the variac in the usual fashion. The power to the blower motor is gradually increased to raise the pressure difference across the pet door until it opens. In addition to the visual cue, the door’s opening is confirmed by the sharp, instantaneous drop in the pressure difference.
20
4. Testing Results This chapter summarizes the data collected for all air infiltration tests performed on the Ideal, Pet Safe Classic, and Endura pet doors. The data are provided in Excel files in the attached CD-ROM. The leakage depends on both the wind speed and the temperature. Therefore, the results have been used to generate plots that display how both variables affect the behavior. Each door has a plot showing how the air leakage volumetric flow rate changes with the wind speed. Also, each plot includes separate curves to show the behavior at each of the three temperatures. In addition to understanding how each door performs individually, the more important goal of this study is to compare the performances of the different models. In order to compare the doors, plots have been generated that show how each door’s leakage flow rate changes with wind speed. This door comparison is made at all three temperatures, so there is a separate plot for each. Lastly, the results of the ultimate seal failure test have been assembled into a table listing the wind speed that each door sustained at each of the three temperatures. 4.1 Peripheral Leakage
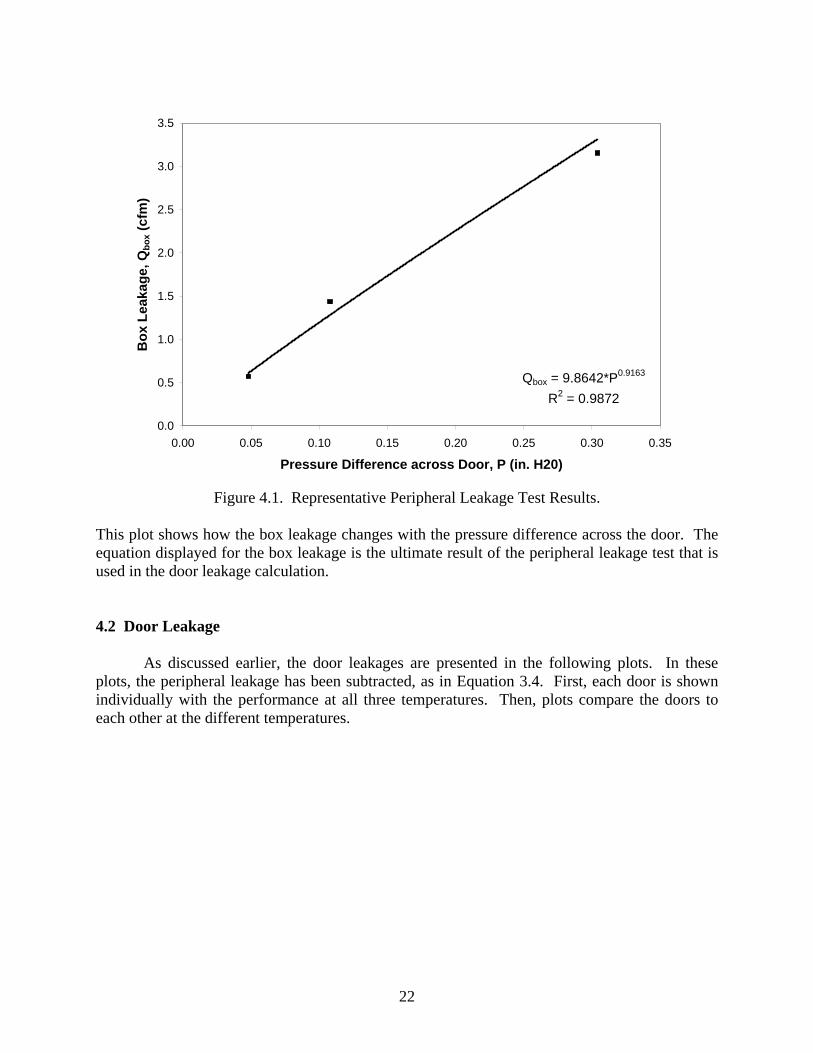
The peripheral leakage (air leaking through the box) interferes with the ability to directly measure the door leakage. Generally, the leakage through the box is much less than that through the door. Nevertheless, peripheral leakage was calibrated as described in Section 3.3, and was subtracted out from the total leakage test data to yield the door leakage via Equation 3.4. A power law function was chosen to fit the peripheral leakage data. A typical result of this process is shown below in Figure 4.1.
21
Qbox = 9.8642*P0.9163
R2 = 0.9872
0.0
0.5
1.0
1.5
2.0
2.5
3.0
3.5
0.00 0.05 0.10 0.15 0.20 0.25 0.30 0.35
Pressure Difference across Door, P (in. H20)
Box
Lea
kage
, Qbo
x (cf
m)
Figure 4.1. Representative Peripheral Leakage Test Results.
This plot shows how the box leakage changes with the pressure difference across the door. The equation displayed for the box leakage is the ultimate result of the peripheral leakage test that is used in the door leakage calculation. 4.2 Door Leakage
As discussed earlier, the door leakages are presented in the following plots. In these plots, the peripheral leakage has been subtracted, as in Equation 3.4. First, each door is shown individually with the performance at all three temperatures. Then, plots compare the doors to each other at the different temperatures.
22
4.2.1 Individual Door Performances
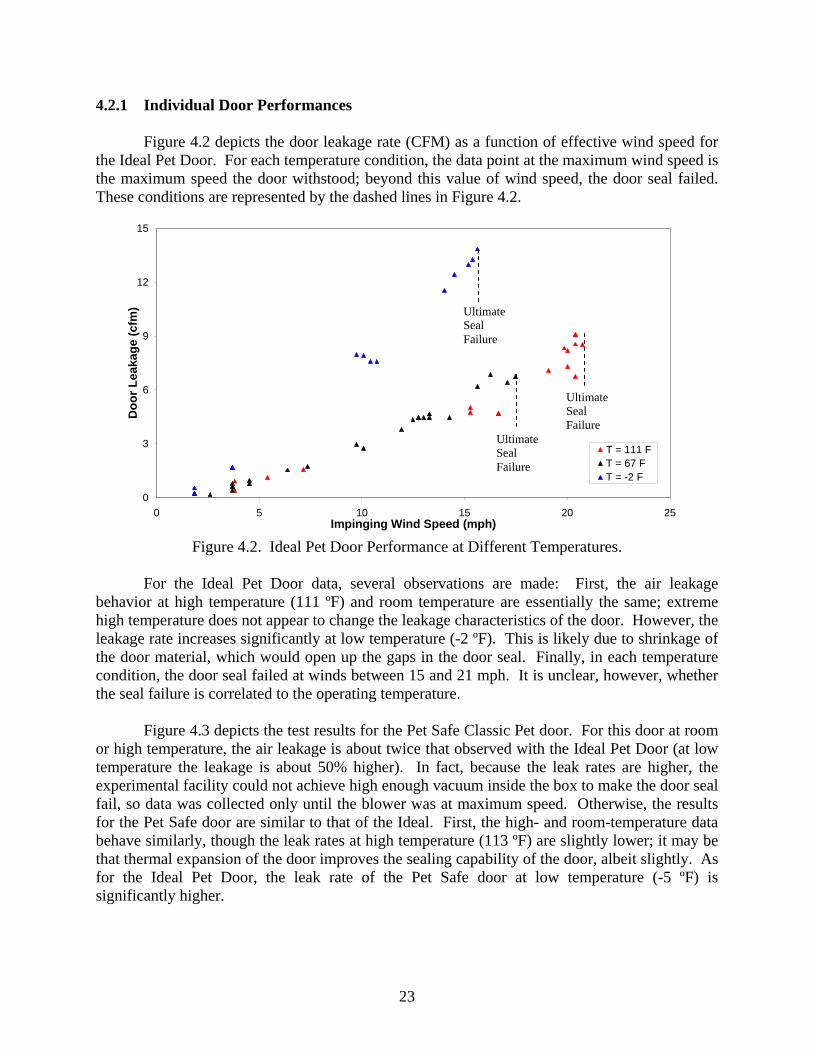
Figure 4.2 depicts the door leakage rate (CFM) as a function of effective wind speed for the Ideal Pet Door. For each temperature condition, the data point at the maximum wind speed is the maximum speed the door withstood; beyond this value of wind speed, the door seal failed. These conditions are represented by the dashed lines in Figure 4.2.
0
3
6
9
12
15
0 5 10 15 20 25Impinging Wind Speed (mph)
Doo
r Lea
kage
(cfm
)
T = 111 FT = 67 FT = -2 F
Ultimate Seal Failure
Ultimate Seal Failure
Ultimate Seal Failure
Figure 4.2. Ideal Pet Door Performance at Different Temperatures.
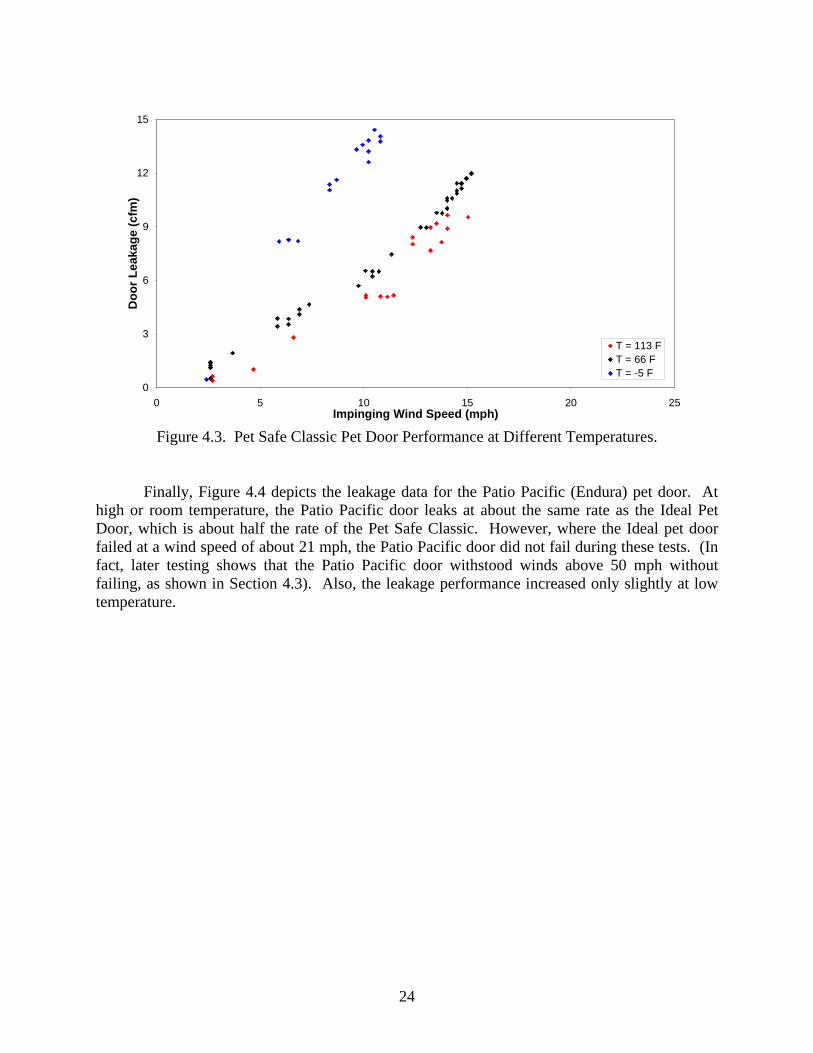
For the Ideal Pet Door data, several observations are made: First, the air leakage behavior at high temperature (111 ºF) and room temperature are essentially the same; extreme high temperature does not appear to change the leakage characteristics of the door. However, the leakage rate increases significantly at low temperature (-2 ºF). This is likely due to shrinkage of the door material, which would open up the gaps in the door seal. Finally, in each temperature condition, the door seal failed at winds between 15 and 21 mph. It is unclear, however, whether the seal failure is correlated to the operating temperature. Figure 4.3 depicts the test results for the Pet Safe Classic Pet door. For this door at room or high temperature, the air leakage is about twice that observed with the Ideal Pet Door (at low temperature the leakage is about 50% higher). In fact, because the leak rates are higher, the experimental facility could not achieve high enough vacuum inside the box to make the door seal fail, so data was collected only until the blower was at maximum speed. Otherwise, the results for the Pet Safe door are similar to that of the Ideal. First, the high- and room-temperature data behave similarly, though the leak rates at high temperature (113 ºF) are slightly lower; it may be that thermal expansion of the door improves the sealing capability of the door, albeit slightly. As for the Ideal Pet Door, the leak rate of the Pet Safe door at low temperature (-5 ºF) is significantly higher.
23
0
3
6
9
12
15
0 5 10 15 20 25Impinging Wind Speed (mph)
Doo
r Lea
kage
(cfm
)
T = 113 FT = 66 FT = -5 F
Figure 4.3. Pet Safe Classic Pet Door Performance at Different Temperatures.
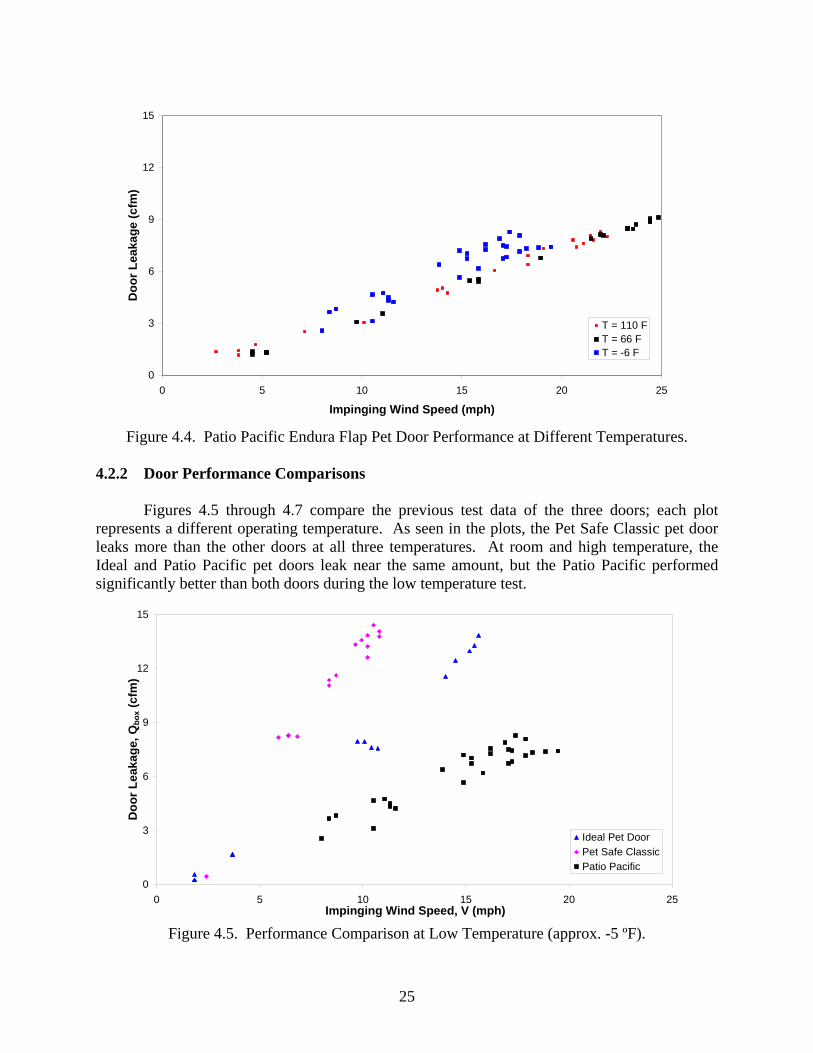
Finally, Figure 4.4 depicts the leakage data for the Patio Pacific (Endura) pet door. At high or room temperature, the Patio Pacific door leaks at about the same rate as the Ideal Pet Door, which is about half the rate of the Pet Safe Classic. However, where the Ideal pet door failed at a wind speed of about 21 mph, the Patio Pacific door did not fail during these tests. (In fact, later testing shows that the Patio Pacific door withstood winds above 50 mph without failing, as shown in Section 4.3). Also, the leakage performance increased only slightly at low temperature.
24
0
3
6
9
12
15
0 5 10 15 20 25
Impinging Wind Speed (mph)
Doo
r Lea
kage
(cfm
)
T = 110 FT = 66 FT = -6 F
Figure 4.4. Patio Pacific Endura Flap Pet Door Performance at Different Temperatures.
4.2.2 Door Performance Comparisons
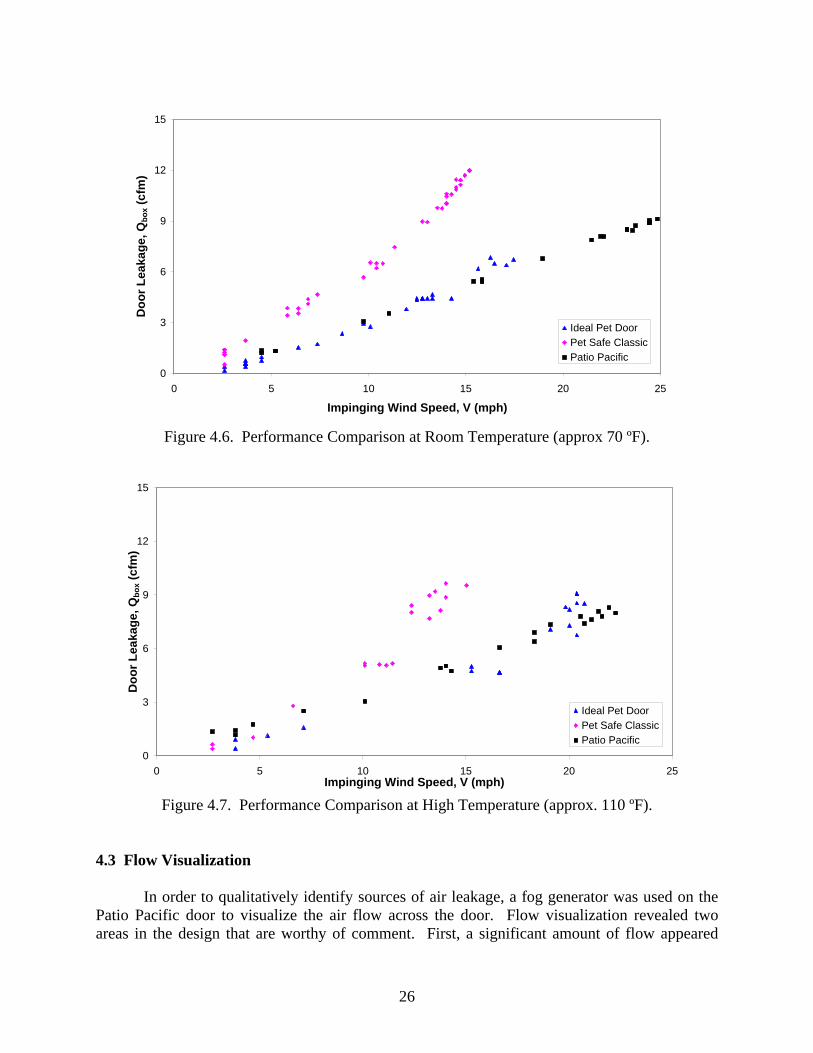
Figures 4.5 through 4.7 compare the previous test data of the three doors; each plot represents a different operating temperature. As seen in the plots, the Pet Safe Classic pet door leaks more than the other doors at all three temperatures. At room and high temperature, the Ideal and Patio Pacific pet doors leak near the same amount, but the Patio Pacific performed significantly better than both doors during the low temperature test.
0
3
6
9
12
15
0 5 10 15 20 25Impinging Wind Speed, V (mph)
Doo
r Lea
kage
, Qbo
x (cf
m)
Ideal Pet DoorPet Safe ClassicPatio Pacific
Figure 4.5. Performance Comparison at Low Temperature (approx. -5 ºF).
25
0
3
6
9
12
15
0 5 10 15 20 25
Impinging Wind Speed, V (mph)
Doo
r Lea
kage
, Qbo
x (cf
m)
Ideal Pet DoorPet Safe ClassicPatio Pacific
Figure 4.6. Performance Comparison at Room Temperature (approx 70 ºF).
0
3
6
9
12
15
0 5 10 15 20 25Impinging Wind Speed, V (mph)
Doo
r Lea
kage
, Qbo
x (cf
m)
Ideal Pet DoorPet Safe ClassicPatio Pacific
Figure 4.7. Performance Comparison at High Temperature (approx. 110 ºF).
4.3 Flow Visualization In order to qualitatively identify sources of air leakage, a fog generator was used on the Patio Pacific door to visualize the air flow across the door. Flow visualization revealed two areas in the design that are worthy of comment. First, a significant amount of flow appeared
26
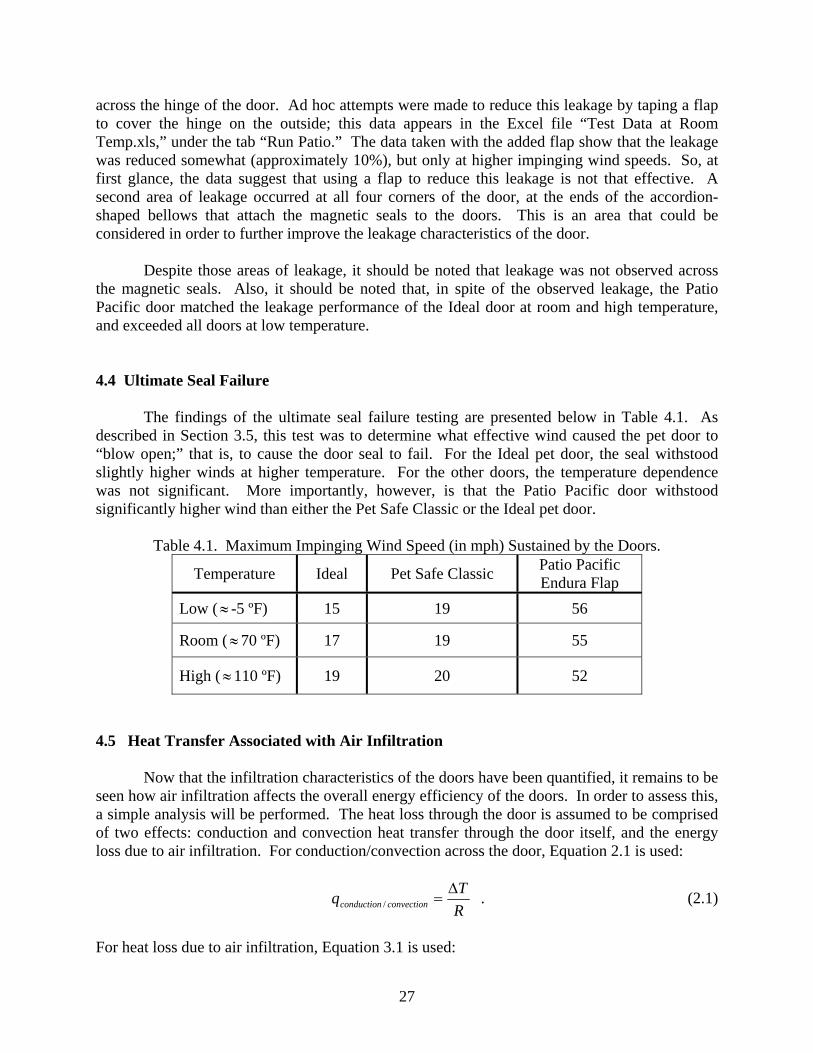
across the hinge of the door. Ad hoc attempts were made to reduce this leakage by taping a flap to cover the hinge on the outside; this data appears in the Excel file “Test Data at Room Temp.xls,” under the tab “Run Patio.” The data taken with the added flap show that the leakage was reduced somewhat (approximately 10%), but only at higher impinging wind speeds. So, at first glance, the data suggest that using a flap to reduce this leakage is not that effective. A second area of leakage occurred at all four corners of the door, at the ends of the accordion-shaped bellows that attach the magnetic seals to the doors. This is an area that could be considered in order to further improve the leakage characteristics of the door. Despite those areas of leakage, it should be noted that leakage was not observed across the magnetic seals. Also, it should be noted that, in spite of the observed leakage, the Patio Pacific door matched the leakage performance of the Ideal door at room and high temperature, and exceeded all doors at low temperature. 4.4 Ultimate Seal Failure
The findings of the ultimate seal failure testing are presented below in Table 4.1. As described in Section 3.5, this test was to determine what effective wind caused the pet door to “blow open;” that is, to cause the door seal to fail. For the Ideal pet door, the seal withstood slightly higher winds at higher temperature. For the other doors, the temperature dependence was not significant. More importantly, however, is that the Patio Pacific door withstood significantly higher wind than either the Pet Safe Classic or the Ideal pet door.
Table 4.1. Maximum Impinging Wind Speed (in mph) Sustained by the Doors.
Temperature Ideal Pet Safe Classic Patio Pacific Endura Flap
Low ( -5 ºF) ≈ 15 19 56
Room (≈70 ºF) 17 19 55
High ( 110 ºF) ≈ 19 20 52
4.5 Heat Transfer Associated with Air Infiltration
Now that the infiltration characteristics of the doors have been quantified, it remains to be seen how air infiltration affects the overall energy efficiency of the doors. In order to assess this, a simple analysis will be performed. The heat loss through the door is assumed to be comprised of two effects: conduction and convection heat transfer through the door itself, and the energy loss due to air infiltration. For conduction/convection across the door, Equation 2.1 is used:
RTq convectionconduction
∆=/ . (2.1)
For heat loss due to air infiltration, Equation 3.1 is used:
27
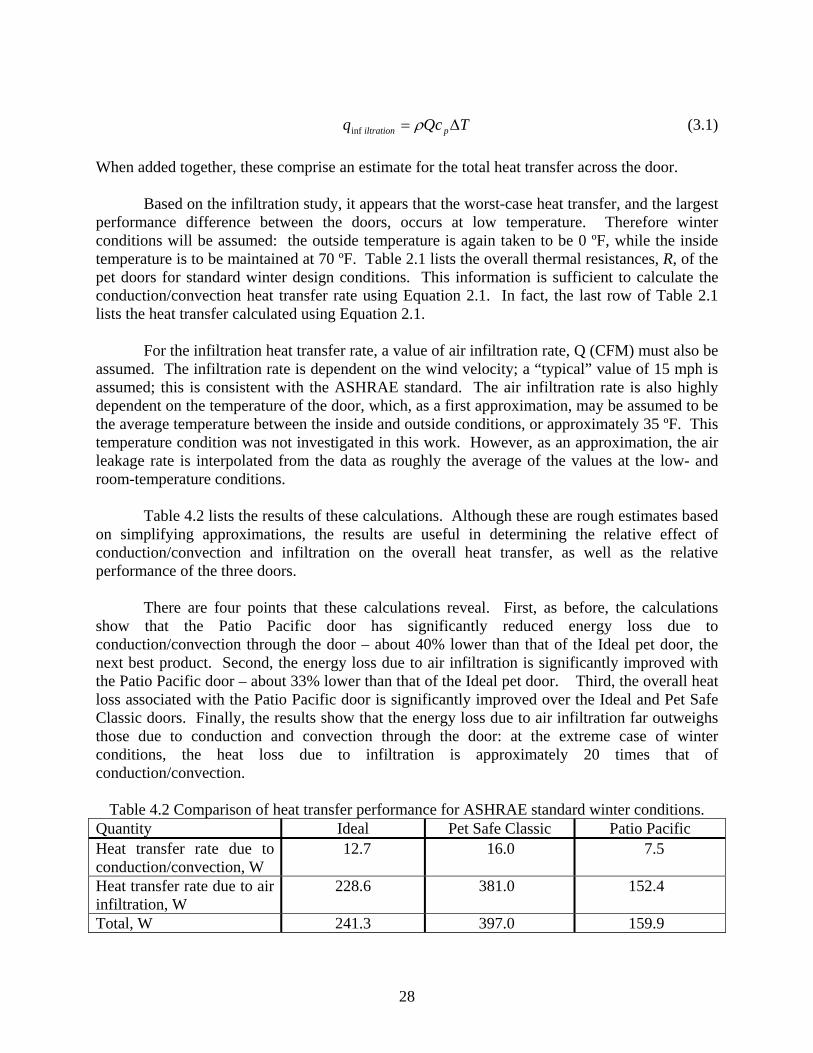
TQcq piltration ∆= ρinf (3.1) When added together, these comprise an estimate for the total heat transfer across the door.
Based on the infiltration study, it appears that the worst-case heat transfer, and the largest performance difference between the doors, occurs at low temperature. Therefore winter conditions will be assumed: the outside temperature is again taken to be 0 ºF, while the inside temperature is to be maintained at 70 ºF. Table 2.1 lists the overall thermal resistances, R, of the pet doors for standard winter design conditions. This information is sufficient to calculate the conduction/convection heat transfer rate using Equation 2.1. In fact, the last row of Table 2.1 lists the heat transfer calculated using Equation 2.1.
For the infiltration heat transfer rate, a value of air infiltration rate, Q (CFM) must also be
assumed. The infiltration rate is dependent on the wind velocity; a “typical” value of 15 mph is assumed; this is consistent with the ASHRAE standard. The air infiltration rate is also highly dependent on the temperature of the door, which, as a first approximation, may be assumed to be the average temperature between the inside and outside conditions, or approximately 35 ºF. This temperature condition was not investigated in this work. However, as an approximation, the air leakage rate is interpolated from the data as roughly the average of the values at the low- and room-temperature conditions.
Table 4.2 lists the results of these calculations. Although these are rough estimates based
on simplifying approximations, the results are useful in determining the relative effect of conduction/convection and infiltration on the overall heat transfer, as well as the relative performance of the three doors.
There are four points that these calculations reveal. First, as before, the calculations
show that the Patio Pacific door has significantly reduced energy loss due to conduction/convection through the door – about 40% lower than that of the Ideal pet door, the next best product. Second, the energy loss due to air infiltration is significantly improved with the Patio Pacific door – about 33% lower than that of the Ideal pet door. Third, the overall heat loss associated with the Patio Pacific door is significantly improved over the Ideal and Pet Safe Classic doors. Finally, the results show that the energy loss due to air infiltration far outweighs those due to conduction and convection through the door: at the extreme case of winter conditions, the heat loss due to infiltration is approximately 20 times that of conduction/convection.
Table 4.2 Comparison of heat transfer performance for ASHRAE standard winter conditions. Quantity Ideal Pet Safe Classic Patio Pacific Heat transfer rate due to conduction/convection, W
12.7 16.0 7.5
Heat transfer rate due to air infiltration, W
228.6 381.0 152.4
Total, W 241.3 397.0 159.9
28
Again, it should be noted that these calculations are based on rough approximations and winter operating conditions. The improved thermal performance of the Patio Pacific door would not be present at higher operating temperatures, since the infiltration characteristics of the Patio Pacific and Ideal pet doors are similar near and above room temperature. However, the calculations do provide some useful information on the magnitude of the energy losses and the relative performance of the doors. 4.6 Summary of Air Infiltration Testing
1. Air infiltration rates were found to be dependent on the effective speed of the wind impinging on the door, as well as the operating temperature of the door. 2. Operating temperatures above room temperature do not seem to affect the infiltration characteristics of any of the doors significantly. However, both the Ideal and the Pet Safe Classic pet doors had low temperature leakage rates that were about double their room temperatures values. This increased leakage is probably the result of an increased crack size along the perimeter as caused by the material’s contraction at low temperatures. The Patio Pacific pet door model did not experience this increase in its leakage because its magnetic strips along the sides were able to maintain a consistent seal. 3. Air leakage across the Patio Pacific door was observed in two major locations: across the hinge, and in the four corners of the door, where the magnet attaches to the accordion-shaped bellows on the door. 4. An order-of-magnitude heat transfer analysis shows that air infiltration under winter conditions accounts for about 20 times more energy loss than that due to conduction and convection heat transfer through the door. However, this is an extreme result; at higher outside temperatures, and depending on the door model, the infiltration losses are not likely to be as great. 5. Under approximate winter operating conditions, the Patio Pacific pet door experiences about 40% less energy loss due to conduction/convection, and about 33% lower energy loss by infiltration than the next best performing door, the Ideal pet door. However, such improved performance is not likely at temperatures above room temperature, since the Patio Pacific door’s infiltration characteristics are similar to the Ideal pet door’s at higher temperatures. 6. The ultimate seal strength – the effective wind that causes the door to blow open – is significantly better with the Patio Pacific pet door.
29
5. Conclusions In this work, thermal models were created for each pet door to predict the heat losses that will occur while in use during the winter season. Also, the problem of infiltration was studied through experimental investigations into the effects of impinging winds and large temperature variation. The results of the above support the following conclusions. 1. The thermal resistance of the Patio Pacific Endura Flap pet door is about ten times greater than that of the Ideal and Pet Safe Classic pet doors, considering heat transfer through the door only. When air convection is also considered, the overall resistance of the Patio Pacific door is about one and a half to two times that of the other doors. The overall resistance of the Patio Pacific door is better than that experienced even for a dual pane window. The primary reason for the better thermal resistance is the cavity design, which greatly increases the resistance to heat transfer. 2. The geometry of the cavity causes only minimal convection currents to arise, which allows the air to function as an excellent insulator. In fact, because air has such a low thermal conductivity, pursuing options to insert insulation material into the airspace of the cavity will not only increase the complexity, but will increase the energy loss as well. 3. Although the thermal resistance is clearly improved with the Endura Flap, the heat transfer across all the doors is small when compared to the heat loss associated with air leakage. Energy losses due to air infiltration can be as high as 20 times those due to conduction/convection across the door. 4. The Patio Pacific Endura Flap’s magnetic strips along the vertical edges maintain good protection against leakage in all of the temperature environments. These magnetic strips set the pet door apart from its competitors because they depend on dimension tolerances for a good seal. As a result of this dependence, the competitors suffer at low temperatures when the cracks increase in size from thermal contractions. This is particularly important because it is occurring when leakage will cause the greatest energy losses. 5. The hinge across the top is the Endura Flap pet door’s primary opening through which air can infiltrate the home. While the competitors’ cantilever designs without a hinge would therefore seem desirable, a problem with this design is that the doors become difficult to open at low temperatures because the flap material loses its flexibility. A second important leak location is at the edge of the magnetic strips, along the accordion-shaped baffles that attach the magnetic seal to the door. 6. The primary advantages of the Patio Pacific door are two-fold: (1) The door resists air infiltration better than the two competitors’ doors at lower operating temperatures, (2) The door resists seal failure (“blow open”) at significantly higher effective wind loads – above 50 mph. As mentioned in the body of the report, all infiltration testing was performed only on one sample of each door model. That is, the testing results are assumed to be typical of the model, and therefore no statistical analysis was performed.
30
References [1] Incropera, F.P. and DeWitt, D.P., Introduction to Heat Transfer, 4th Edition, John Wiley
and Sons, 2002. [2] McQuiston, F.C., Parker, J.D., and Spitler, J.D., Heating, Ventilating, and Air
Conditioning, 6th Edition, John Wiley and Sons, 2005. [3] Callister, W.D., Materials Science and Engineering, An Introduction, 5th Edition, John
Wiley and Sons, 2000.
31