Embed Size (px)
Citation preview

Energy Policiesof IEA Countries
Please note that this PDF is subject to specific restrictions that limit its use and distribution. The terms and conditions are available online at www.iea.org/about/copyright.asp
ITALY2009 Review
Energy Policies of IEA Countries
-:HSTCQE=UYXYXZ:
(61 2009 33 1 P1) €75ISBN 978-92-64-04343-5
ITALY 2009 Review
The Italian government has made substantial progress in a number of sectors since the last IEA in-depth energy policy review in 2003. The success of the green certificate and white certificate schemes and continued reform of the electricity and natural gas supply markets are just a few examples and build on the recommendations contained in the previous review. Nonetheless, many challenges remain.
Italy recognises the need to diversify its energy supply portfolio to reduce its heavy dependence on fossil fuels and electricity imports, and to decrease its growing greenhouse gas emissions. In 2008, the government announced its intention to recommence the country's nuclear power programme and start building a new nuclear power plant by 2013. To do so, Italy must first develop an efficient process for identifying critical energy infrastructure, including nuclear power, and subjecting it to an effective, streamlined siting and permitting process.
Italy will face another major challenge in complying with Europe’s new climate and energy package, particularly in relation to renewable energy and
emissions targets. The government must step up efforts to comply with its new responsibilities, specifically by developing and putting in place a
comprehensive climate change strategy for the years until 2020.
In mid-2009, the legislature enacted a wide-ranging new law that will facilitate the emergence of a robust long-term energy policy.
The government must respond to this opportunity and elaborate, with industry, a long-term strategy for the development of
the energy sector.
This review analyses the energy challenges facing Italy and provides sectoral critiques and recommendations
for further policy improvements. It is intended to help guide Italy towards a more sustainable energy future.
Energy Policiesof IEA Countries
ITALY2009 Review

INTERNATIONAL ENERGY AGENCY
The International Energy Agency (IEA), an autonomous agency, was established in November 1974. Its mandate is two-fold: to promote energy security amongst its member countries through collective response to physical disruptions in oil supply and to advise member
countries on sound energy policy.
The IEA carries out a comprehensive programme of energy co-operation among 28 advanced economies, each of which is obliged to hold oil stocks equivalent to 90 days of its net imports. The Agency aims to:
n Secure member countries’ access to reliable and ample supplies of all forms of energy; in particular, through maintaining effective emergency response capabilities in case of oil supply disruptions.
n Promote sustainable energy policies that spur economic growth and environmental protection in a global context – particularly in terms of reducing greenhouse-gas emissions that contribute to climate change.
n Improve transparency of international markets through collection and analysis of energy data.
n Support global collaboration on energy technology to secure future energy supplies and mitigate their environmental impact, including through improved energy
efficiency and development and deployment of low-carbon technologies.
n Find solutions to global energy challenges through engagement and dialogue with non-member countries, industry,
international organisations and other stakeholders. IEA member countries:
Australia
Austria
Belgium
Canada
Czech Republic
Denmark
Finland
France
Germany
Greece
Hungary
Ireland
Italy
Japan
Korea (Republic of)
Luxembourg
Netherlands
New Zealand
Norway
Poland
Portugal
Slovak Republic
Spain
Sweden
Switzerland
Turkey
United Kingdom
United States
The European Commission
also participates in
the work of the IEA.
Please note that this publication is subject to specific restrictions that limit its use and distribution.
The terms and conditions are available online at www.iea.org/about/copyright.sp
© OECD/IEA, 2009International Energy Agency
9 rue de la Fédération 75739 Paris Cedex 15, France

3
TABLE OF CONTENTS
1 EXECUTIVE SUMMARY AND KEY RECOMMENDATIONS . . . . . 9
Executive Summary . . . . . . . . . . . . . . . . . . . . . . . . . . . . . . . . . . . . . . . . . . . . . . . . . . . . . 9Key Recommendations . . . . . . . . . . . . . . . . . . . . . . . . . . . . . . . . . . . . . . . . . . . . . . . . . 12
PART I: POLICY ANALYSIS
2 GENERAL ENERGY POLICY . . . . . . . . . . . . . . . . . . . . . . . . . . . . . . . . . 15Country Overview. . . . . . . . . . . . . . . . . . . . . . . . . . . . . . . . . . . . . . . . . . . . . . . . . . . . . . . 15The Economy . . . . . . . . . . . . . . . . . . . . . . . . . . . . . . . . . . . . . . . . . . . . . . . . . . . . . . . . . . . 15Energy Supply And Demand . . . . . . . . . . . . . . . . . . . . . . . . . . . . . . . . . . . . . . . . . . . 16Institutions . . . . . . . . . . . . . . . . . . . . . . . . . . . . . . . . . . . . . . . . . . . . . . . . . . . . . . . . . . . . . . 17Key Policies . . . . . . . . . . . . . . . . . . . . . . . . . . . . . . . . . . . . . . . . . . . . . . . . . . . . . . . . . . . . . 19Security of Supply . . . . . . . . . . . . . . . . . . . . . . . . . . . . . . . . . . . . . . . . . . . . . . . . . . . . . . 21Market Reform . . . . . . . . . . . . . . . . . . . . . . . . . . . . . . . . . . . . . . . . . . . . . . . . . . . . . . . . . . 21Energy Taxes . . . . . . . . . . . . . . . . . . . . . . . . . . . . . . . . . . . . . . . . . . . . . . . . . . . . . . . . . . . . 22Critique . . . . . . . . . . . . . . . . . . . . . . . . . . . . . . . . . . . . . . . . . . . . . . . . . . . . . . . . . . . . . . . . . . 22Recommendations . . . . . . . . . . . . . . . . . . . . . . . . . . . . . . . . . . . . . . . . . . . . . . . . . . . . . . 27
3 CLIMATE CHANGE . . . . . . . . . . . . . . . . . . . . . . . . . . . . . . . . . . . . . . . . . . 29Overview . . . . . . . . . . . . . . . . . . . . . . . . . . . . . . . . . . . . . . . . . . . . . . . . . . . . . . . . . . . . . . . . 29Emissions Profile . . . . . . . . . . . . . . . . . . . . . . . . . . . . . . . . . . . . . . . . . . . . . . . . . . . . . . . . 30Climate Change Policy . . . . . . . . . . . . . . . . . . . . . . . . . . . . . . . . . . . . . . . . . . . . . . . . . 33Critique . . . . . . . . . . . . . . . . . . . . . . . . . . . . . . . . . . . . . . . . . . . . . . . . . . . . . . . . . . . . . . . . . . 38Recommendations . . . . . . . . . . . . . . . . . . . . . . . . . . . . . . . . . . . . . . . . . . . . . . . . . . . . . . 39
4 ENERGY EFFICIENCY . . . . . . . . . . . . . . . . . . . . . . . . . . . . . . . . . . . . . . . 41Overview . . . . . . . . . . . . . . . . . . . . . . . . . . . . . . . . . . . . . . . . . . . . . . . . . . . . . . . . . . . . . . . . 41Policies and Measures . . . . . . . . . . . . . . . . . . . . . . . . . . . . . . . . . . . . . . . . . . . . . . . . . . 43Policies by Sector . . . . . . . . . . . . . . . . . . . . . . . . . . . . . . . . . . . . . . . . . . . . . . . . . . . . . . . 46Cross-Cutting Measures . . . . . . . . . . . . . . . . . . . . . . . . . . . . . . . . . . . . . . . . . . . . . . . . 50Critique . . . . . . . . . . . . . . . . . . . . . . . . . . . . . . . . . . . . . . . . . . . . . . . . . . . . . . . . . . . . . . . . . . 55Recommendations . . . . . . . . . . . . . . . . . . . . . . . . . . . . . . . . . . . . . . . . . . . . . . . . . . . . . . 57
PART II: SECTOR ANALYSIS
5 RENEWABLE ENERGY . . . . . . . . . . . . . . . . . . . . . . . . . . . . . . . . . . . . . . 61Overview . . . . . . . . . . . . . . . . . . . . . . . . . . . . . . . . . . . . . . . . . . . . . . . . . . . . . . . . . . . . . . . . 61Legal Framework . . . . . . . . . . . . . . . . . . . . . . . . . . . . . . . . . . . . . . . . . . . . . . . . . . . . . . . . 65Electricity Generated from Renewables . . . . . . . . . . . . . . . . . . . . . . . . . . . . . . . 67Heat Generation from Renewables . . . . . . . . . . . . . . . . . . . . . . . . . . . . . . . . . . . . 71
© O
EC
D/IE
A, 2
010
4
Transport Fuels from Renewables . . . . . . . . . . . . . . . . . . . . . . . . . . . . . . . . . . . . . . 71Critique . . . . . . . . . . . . . . . . . . . . . . . . . . . . . . . . . . . . . . . . . . . . . . . . . . . . . . . . . . . . . . . . . . 71Recommendations . . . . . . . . . . . . . . . . . . . . . . . . . . . . . . . . . . . . . . . . . . . . . . . . . . . . . . 73
6 ELECTRICITY . . . . . . . . . . . . . . . . . . . . . . . . . . . . . . . . . . . . . . . . . . . . . . . 75Overview . . . . . . . . . . . . . . . . . . . . . . . . . . . . . . . . . . . . . . . . . . . . . . . . . . . . . . . . . . . . . . . . 75Supply and Demand . . . . . . . . . . . . . . . . . . . . . . . . . . . . . . . . . . . . . . . . . . . . . . . . . . . 75Regulation . . . . . . . . . . . . . . . . . . . . . . . . . . . . . . . . . . . . . . . . . . . . . . . . . . . . . . . . . . . . . . 77Industry Structure . . . . . . . . . . . . . . . . . . . . . . . . . . . . . . . . . . . . . . . . . . . . . . . . . . . . . . 78Electricity Market Design . . . . . . . . . . . . . . . . . . . . . . . . . . . . . . . . . . . . . . . . . . . . . . . 85Security of Electricity Supply . . . . . . . . . . . . . . . . . . . . . . . . . . . . . . . . . . . . . . . . . . . 88Prices and Taxes . . . . . . . . . . . . . . . . . . . . . . . . . . . . . . . . . . . . . . . . . . . . . . . . . . . . . . . . 90Critique . . . . . . . . . . . . . . . . . . . . . . . . . . . . . . . . . . . . . . . . . . . . . . . . . . . . . . . . . . . . . . . . . . 94Recommendations . . . . . . . . . . . . . . . . . . . . . . . . . . . . . . . . . . . . . . . . . . . . . . . . . . . . . . 97
7 NATURAL GAS . . . . . . . . . . . . . . . . . . . . . . . . . . . . . . . . . . . . . . . . . . . . . 99Overview . . . . . . . . . . . . . . . . . . . . . . . . . . . . . . . . . . . . . . . . . . . . . . . . . . . . . . . . . . . . . . . . 99Supply and Demand . . . . . . . . . . . . . . . . . . . . . . . . . . . . . . . . . . . . . . . . . . . . . . . . . . . 99Gas Production . . . . . . . . . . . . . . . . . . . . . . . . . . . . . . . . . . . . . . . . . . . . . . . . . . . . . . . . . 101Imports . . . . . . . . . . . . . . . . . . . . . . . . . . . . . . . . . . . . . . . . . . . . . . . . . . . . . . . . . . . . . . . . . . 102Natural Gas Networks . . . . . . . . . . . . . . . . . . . . . . . . . . . . . . . . . . . . . . . . . . . . . . . . . . 104Market Design . . . . . . . . . . . . . . . . . . . . . . . . . . . . . . . . . . . . . . . . . . . . . . . . . . . . . . . . . . 109Prices and Taxes . . . . . . . . . . . . . . . . . . . . . . . . . . . . . . . . . . . . . . . . . . . . . . . . . . . . . . . . 111Infrastructure Development . . . . . . . . . . . . . . . . . . . . . . . . . . . . . . . . . . . . . . . . . . . . 114Natural Gas Emergency Response Policy . . . . . . . . . . . . . . . . . . . . . . . . . . . . . . 117Critique . . . . . . . . . . . . . . . . . . . . . . . . . . . . . . . . . . . . . . . . . . . . . . . . . . . . . . . . . . . . . . . . . . 119Recommendations . . . . . . . . . . . . . . . . . . . . . . . . . . . . . . . . . . . . . . . . . . . . . . . . . . . . . . 121
8 OIL . . . . . . . . . . . . . . . . . . . . . . . . . . . . . . . . . . . . . . . . . . . . . . . . . . . . . . . . 123Overview . . . . . . . . . . . . . . . . . . . . . . . . . . . . . . . . . . . . . . . . . . . . . . . . . . . . . . . . . . . . . . . . 123Supply and Demand . . . . . . . . . . . . . . . . . . . . . . . . . . . . . . . . . . . . . . . . . . . . . . . . . . . 123Domestic Production . . . . . . . . . . . . . . . . . . . . . . . . . . . . . . . . . . . . . . . . . . . . . . . . . . . 124Refining and Infrastructure . . . . . . . . . . . . . . . . . . . . . . . . . . . . . . . . . . . . . . . . . . . . 125Legislation and Policy . . . . . . . . . . . . . . . . . . . . . . . . . . . . . . . . . . . . . . . . . . . . . . . . . . 128Oil Markets . . . . . . . . . . . . . . . . . . . . . . . . . . . . . . . . . . . . . . . . . . . . . . . . . . . . . . . . . . . . . . 129Emergency Response Policy and Organisation . . . . . . . . . . . . . . . . . . . . . . . . 130Critique . . . . . . . . . . . . . . . . . . . . . . . . . . . . . . . . . . . . . . . . . . . . . . . . . . . . . . . . . . . . . . . . . . 137Recommendations . . . . . . . . . . . . . . . . . . . . . . . . . . . . . . . . . . . . . . . . . . . . . . . . . . . . . . 139
9 COAL . . . . . . . . . . . . . . . . . . . . . . . . . . . . . . . . . . . . . . . . . . . . . . . . . . . . . . 141Overview . . . . . . . . . . . . . . . . . . . . . . . . . . . . . . . . . . . . . . . . . . . . . . . . . . . . . . . . . . . . . . . . 141Domestic Production . . . . . . . . . . . . . . . . . . . . . . . . . . . . . . . . . . . . . . . . . . . . . . . . . . . 141Industry Structure . . . . . . . . . . . . . . . . . . . . . . . . . . . . . . . . . . . . . . . . . . . . . . . . . . . . . . 142Clean Coal Development. . . . . . . . . . . . . . . . . . . . . . . . . . . . . . . . . . . . . . . . . . . . . . . 143Critique . . . . . . . . . . . . . . . . . . . . . . . . . . . . . . . . . . . . . . . . . . . . . . . . . . . . . . . . . . . . . . . . . . 144Recommendation . . . . . . . . . . . . . . . . . . . . . . . . . . . . . . . . . . . . . . . . . . . . . . . . . . . . . . . 145
© O
EC
D/IE
A, 2
010

5
NUCLEAR ENERGY . . . . . . . . . . . . . . . . . . . . . . . . . . . . . . . . . . . . . . . . . 147Overview . . . . . . . . . . . . . . . . . . . . . . . . . . . . . . . . . . . . . . . . . . . . . . . . . . . . . . . . . . . . . . . . 147Policy and Framework . . . . . . . . . . . . . . . . . . . . . . . . . . . . . . . . . . . . . . . . . . . . . . . . . . 148Regulatory Bodies and Nuclear Safety . . . . . . . . . . . . . . . . . . . . . . . . . . . . . . . . 149Critique . . . . . . . . . . . . . . . . . . . . . . . . . . . . . . . . . . . . . . . . . . . . . . . . . . . . . . . . . . . . . . . . . . 150Recommendations . . . . . . . . . . . . . . . . . . . . . . . . . . . . . . . . . . . . . . . . . . . . . . . . . . . . . . 151
PART III: ENERGY TECHNOLOGY
ENERGY TECHNOLOGY, RESEARCH AND DEVELOPMENT . . 155Overview . . . . . . . . . . . . . . . . . . . . . . . . . . . . . . . . . . . . . . . . . . . . . . . . . . . . . . . . . . . . . . . . 155Institutional Framework . . . . . . . . . . . . . . . . . . . . . . . . . . . . . . . . . . . . . . . . . . . . . . . . 156Private Sector R&D . . . . . . . . . . . . . . . . . . . . . . . . . . . . . . . . . . . . . . . . . . . . . . . . . . . . . 159Funding . . . . . . . . . . . . . . . . . . . . . . . . . . . . . . . . . . . . . . . . . . . . . . . . . . . . . . . . . . . . . . . . . 162International Collaboration and Partnership . . . . . . . . . . . . . . . . . . . . . . . . . 163Key Projects and Research Areas . . . . . . . . . . . . . . . . . . . . . . . . . . . . . . . . . . . . . . 165Critique . . . . . . . . . . . . . . . . . . . . . . . . . . . . . . . . . . . . . . . . . . . . . . . . . . . . . . . . . . . . . . . . . . 169Recommendations . . . . . . . . . . . . . . . . . . . . . . . . . . . . . . . . . . . . . . . . . . . . . . . . . . . . . . 170
PART IV: ANNEXES
A ORGANISATION OF THE REVIEW . . . . . . . . . . . . . . . . . . . . . . . . . . . . 173Review Criteria . . . . . . . . . . . . . . . . . . . . . . . . . . . . . . . . . . . . . . . . . . . . . . . . . . . . . . . . . . 173Review Team . . . . . . . . . . . . . . . . . . . . . . . . . . . . . . . . . . . . . . . . . . . . . . . . . . . . . . . . . . . . 173Organisations Visited . . . . . . . . . . . . . . . . . . . . . . . . . . . . . . . . . . . . . . . . . . . . . . . . . . 174
B ENERGY BALANCES AND KEY STATISTICAL DATA . . . . . . . . . . . . . 177
C INTERNATIONAL ENERGY AGENCY “SHARED GOALS” . . . . . . . . . . 181
D GLOSSARY AND LIST OF ABBREVIATIONS . . . . . . . . . . . . . . . . . . . . 183
10
11
© O
EC
D/IE
A, 2
010

6
List of Figures, Tables and Boxes
FIGURES 1. Total Primary Energy Supply, 1973 to 2030. . . . . . . . . . . . . . . . . . . . . . . . . 16 2. Energy Production by Source . . . . . . . . . . . . . . . . . . . . . . . . . . . . . . . . . . . . . . . . . 17 3. Total Final Consumption by Source, 1973 to 2030 . . . . . . . . . . . . . . . . . 20 4. Total Final Consumption by Sector, 1973 to 2030 . . . . . . . . . . . . . . . . . . 20 5. OECD Unleaded Gasoline Prices and Taxes, Second Quarter 2009 . . 23 6. Fuel Prices, 2008 . . . . . . . . . . . . . . . . . . . . . . . . . . . . . . . . . . . . . . . . . . . . . . . . . . . . . . 24 7. Energy-Related CO2 Emissions per GDP in Italy and in Other Selected
IEA Member Countries, 1973 to 2010 . . . . . . . . . . . . . . . . . . . . . . . . . . . . . . . 30 8. CO2 Emissions by Sector, 1973 to 2007 . . . . . . . . . . . . . . . . . . . . . . . . . . . . . 31 9. Energy Intensity in Italy and in Other Selected IEA Member Countries,
1973 to 2010 . . . . . . . . . . . . . . . . . . . . . . . . . . . . . . . . . . . . . . . . . . . . . . . . . . . . . . . . . 4110. Total Final Consumption by Sector and by Source, 1973 to 2030 . . . . 4211. Renewable Energy as a Percentage of Total Primary Energy Supply,
1973 to 2008 . . . . . . . . . . . . . . . . . . . . . . . . . . . . . . . . . . . . . . . . . . . . . . . . . . . . . . . . . 6312. Renewable Energy as a Percentage of Total Primary Energy Supply
in IEA Member Countries, 2008 . . . . . . . . . . . . . . . . . . . . . . . . . . . . . . . . . . . . . 6413. Electricity Generation by Source, 1973 to 2030 . . . . . . . . . . . . . . . . . . . . 7614. Final Consumption of Electricity by Sector, 1973 to 2030 . . . . . . . . . 7715. Share of Electricity Output by Generator, 2006 and 2007 . . . . . . . . . 7916. Gross Generating Capacity of the Five Largest Generators, 2007 . . 8017. Map of the High-Voltage Electricity Grid . . . . . . . . . . . . . . . . . . . . . . . . . . . . 8118. Retail Supply Companies Operating on the Free Market, 2007 . . . . 8519. Electricity Imports by Origin, 2007 . . . . . . . . . . . . . . . . . . . . . . . . . . . . . . . . . . . 9020. Electricity Prices in Italy and in Other Selected IEA Member Countries,
1980 to 2008 . . . . . . . . . . . . . . . . . . . . . . . . . . . . . . . . . . . . . . . . . . . . . . . . . . . . . . . . . 9121. Electricity Prices in IEA Member Countries, 2008 . . . . . . . . . . . . . . . . . . . 9222. Natural Gas Imports and Production, 1973 to 2007 . . . . . . . . . . . . . . . 10023. Natural Gas Supply by Sector, 1973 to 2030 . . . . . . . . . . . . . . . . . . . . . . . 10024. Gross Natural Gas Imports by Country of Origin, 2008 . . . . . . . . . . . . 10325. Natural Gas Infrastructure . . . . . . . . . . . . . . . . . . . . . . . . . . . . . . . . . . . . . . . . . . . . 10526. Percentage Breakdown of the Average Reference Natural Gas Price
as at 1 April 2008 . . . . . . . . . . . . . . . . . . . . . . . . . . . . . . . . . . . . . . . . . . . . . . . . . . . 11127. Gas Prices in Italy and Spain, 1980 to 2008 . . . . . . . . . . . . . . . . . . . . . . . 11228. Gas Prices in IEA Member Countries, 2008 . . . . . . . . . . . . . . . . . . . . . . . . . 11329. Oil Supply by Sector, 1973 to 2030 . . . . . . . . . . . . . . . . . . . . . . . . . . . . . . . . . 12430. Oil Pipelines . . . . . . . . . . . . . . . . . . . . . . . . . . . . . . . . . . . . . . . . . . . . . . . . . . . . . . . . . . . 12731. Coal Supply by Sector, 1973 to 2030 . . . . . . . . . . . . . . . . . . . . . . . . . . . . . . . . 14232. Government RD&D Spending on Energy, 1990 to 2008 . . . . . . . . . . . 16033. Government RD&D Budgets in IEA Member Countries, 2008 . . . . . . 161
© O
EC
D/IE
A, 2
010
7
TABLES
1. Total Amount of Quotas to be Assigned for the Second CommitmentPeriod . . . . . . . . . . . . . . . . . . . . . . . . . . . . . . . . . . . . . . . . . . . . . . . . . . . . . . . . . . . . . . . . . . 36
2. Sectoral Assigned Average Quotas for 2008-2012 . . . . . . . . . . . . . . . . . . 36 3. Summary of the Main Energy Trends in Italy from 2002 to 2007 . 43 4. National Energy Efficiency Action Plan 2007 . . . . . . . . . . . . . . . . . . . . . . . 45 5. Trades on the White Certificate Market as of 31 March 2008 . . . . . 51 6. Basic Elements of the White Certificate Scheme before the Changes
Introduced in December 2007 . . . . . . . . . . . . . . . . . . . . . . . . . . . . . . . . . . . . . . . 52 7. Renewable Electricity Targets 2001 -2010 . . . . . . . . . . . . . . . . . . . . . . . . . . . 68 8. Transactions on the GME Green Certificate Market, 2007 to Q1 2008 . 69 9. Distribution of Electricity 2007 . . . . . . . . . . . . . . . . . . . . . . . . . . . . . . . . . . . . . . 8310. Storage Concession Petitions as at March 2008 . . . . . . . . . . . . . . . . . . . . 10811. Average Monthly Cost of Oil Stocks . . . . . . . . . . . . . . . . . . . . . . . . . . . . . . . . . . 13412. Status of Nuclear Power Plants . . . . . . . . . . . . . . . . . . . . . . . . . . . . . . . . . . . . . . . 147
BOXES 1. IEA G8 Energy Efficiency Recommendations . . . . . . . . . . . . . . . . . . . . . . . . 54 2. Gestore dei Servizi Elettrici . . . . . . . . . . . . . . . . . . . . . . . . . . . . . . . . . . . . . . . . . . . 70 3. Smart Metering . . . . . . . . . . . . . . . . . . . . . . . . . . . . . . . . . . . . . . . . . . . . . . . . . . . . . . . . 93
© O
EC
D/IE
A, 2
010

© O
EC
D/IE
A, 2
010
9
9
EXECUTIVE SUMMARYAND KEY RECOMMENDATIONS
EXECUTIVE SUMMARY
The Italian government has made substantial progress in a number of sectors since the last in-depth energy policy review in 2003. The success of the green certificate and white certificate schemes, the reorganisation and continued reform of the electricity and natural gas sectors and the implementation of incentive schemes for renewable energy are notable achievements. Other accomplishments include new investment in carbon capture and storage (CCS) research, development and deployment schemes and the adoption of simplified planning procedures for essential new energy infrastructure. Each of these significant steps builds on the recommendations contained in the 2003 review.
The government has gone a large way towards addressing some of Italy’s considerable energy challenges, thus strengthening the country’s energy security. It has developed a framework to implement an energy market policy that is consistent with European requirements. It has also succeeded in diversifying gas supply routes, at least in terms of pipeline gas, added significant amounts of electricity generating capacity, and is in the process of further diversifying fuels for electricity generation. In addition, a European Union Emissions Trading Scheme (EU-ETS) Allocation Plan has been implemented and the independence of the sectoral regulator, the Regulatory Authority for Electrical Energy and Gas (AEEG), has been enhanced and strengthened. An offshore liquefied natural gas (LNG) terminal has been commissioned, more LNG facilities are being built, and a law aimed at allowing the construction of a number of nuclear power plants after a moratorium of more than twenty years was approved in mid-2009. The IEA commends Italy for its continued progress.
Notwithstanding the success of the white certificate scheme and other tax-based tools, Italy needs to take greater steps to develop a more comprehensive and consistent, evidence-based energy efficiency strategy. While the first National Energy Efficiency Action Plan represents good progress in this regard, weaknesses remain; it is unclear how many of the proposed savings will be achieved or if the plan can deliver the significant levels of savings intended. Following the enactment of Law no. 99/2009 the government is elaborating on a new plan of action on energy efficiency, which has the capability to address many of the weaknesses identified in present policy.
1
© O
EC
D/IE
A, 2
010
10
Italy, the only member of the Group of Eight (G8) nations without nuclear power, has recognised the need to diversify its energy portfolio to reduce the heavy dependence on imports of fossil fuels and electricity and also to reduce, at least in the long term, emission levels. The country had one of the earliest nuclear energy programmes in Europe but abandoned it in 1987 following a referendum. In May 2008, the newly elected government announced its intention to recommence the country’s nuclear power programme and to start building a new nuclear power plant by 2013. The government’s intention became law in July 2009. This new law provides a legislative basis to address concerns in relation to plant siting, waste disposal, risk management and plant decommissioning. The new law will also allow Italy to reactivate the relevant regulatory institutions and train the human resources needed to support and regulate nuclear power installations.
Despite struggling during the initial stages of liberalisation and market reform of the electricity market, good progress has been made in recent years, which lays a solid framework for development of a competitive Italian energy market and the secure and efficient provision of electricity for the long term. Italy has set in place the necessary institutions and market design for a competitive electricity market to develop, and has already gained many of the benefits of such a framework, including new entry into the generation market, enhanced competition levels, better long-term planning of network infrastructure and sound incentives to develop new capacity in the locations where it is most needed. This progress, however, cannot mask the fact that some work remains to be completed, particularly in the retail market where there is little sign of real competition emerging or of final consumers being any better off.
The natural gas market has also evolved and matured since the previous review. The government has undertaken a series of ongoing compulsory changes to the structure of the gas market in order to ensure fair access to pipelines and effective competition in supply. The previously vertically integrated gas incumbent has been legally unbundled into separate transmission, supply and storage businesses. Excellent progress has been made in relation to import pipelines and new capacity is being built or is at an advanced phase in its development. Conversely, and despite some recent successes, some LNG import facilities remain at the planning phase and expansion of pipeline export capacity remains limited. Furthermore, much work remains to be done in the retail market before consumers feel the full benefits of market reform.
Whereas the government invests in technology research and development and various measures are introduced at different times by different government institutions, the overall energy research and development strategy appears unclear owing to devolution of authority and fragmentation of responsibilities, which sometimes complicates decision making and potentially reduces national impacts of policies. Nonetheless, the government is to be commended for increasing funding available to energy-related research and development programmes.
© O
EC
D/IE
A, 2
010

11
MAJOR CHALLENGES REMAIN
The European Union’s (EU) climate and energy package greatly increases the challenge facing Italian policy makers. The 2020 targets relating to greenhouse gas (GHG) mitigation, renewable energy and energy efficiency will strongly influence energy policy in Italy and other EU member states in the coming decade. On the basis of the climate and energy package, Italy will have to reduce emissions from the sectors outside of the EU-ETS by 13% below 2005 levels. With regard to the Kyoto Protocol target, Italy’s emissions at present are 12% higher than in 1990, leading to an 18.5% gap with no reversal in the trend expected in the medium term. Even if Italy rapidly prepares and implements a comprehensive strategy of domestic measures, complemented by an increased use of Kyoto flexible mechanisms, there remains a strong possibility that it will be unable to meet its 2012 obligations.
A common theme that emerges in the various sectors reviewed is the difficulties faced by energy infrastructure providers in bringing projects from the initial planning phase to completion. While numerous initiatives have been taken at central government level over recent years, fundamental problems remain as evidenced by the delays in the construction of new LNG facilities, upstream oil and gas production, electricity transmission infrastructure and renewable energy installations. Under present circumstances, it is likely that the recently adopted nuclear energy proposals may face similar obstacles. Law no. 99/2009 contains a series of provisions that have the capability to address many shortcomings. The government must continue to build on the potential offered by the new law, with a view to creating a streamlined, integrated and transparent process. The goal should be to highlight to all stakeholders, including the public, the costs and benefits of new infrastructure and involve all stakeholders in the process from the outset.
The government needs an integrated long-term vision that will translate into effective development of the energy sector. The Italian energy position remains vulnerable in several respects and, in the recent past, a consistent and well-balanced strategy to address these weaknesses was lacking, despite promising developments visible in many sectors. In particular, energy security remains a major concern. Growth in electricity generating capacity has been largely gas-fired, leading to increased dependence on imported gas. Conversely, this dependence has the potential to decline in the longer term should plans to develop nuclear capability succeed. The import capacity of natural gas pipelines has expanded but interconnections to other European natural gas markets remain limited. This has happened within the context of delays to the planned diversification from pipeline gas to LNG, partially due to the lengthy period it takes to permit and develop LNG terminals. Delays have also marked the development of renewable energy, the conversion of oil-fired to coal-fired electricity generating plants, as well as the issuing of hydrocarbon exploration and production licences, although many simplified procedures have been introduced by means of recent legislation.
© O
EC
D/IE
A, 2
010

12
KEY RECOMMENDATIONS
The government of Italy should:
Build a comprehensive long-term strategy for the development of the ◗
national energy sector consistent with the principles of a liberalised energy market.
Continue to implement an efficient process for identifying where critical ◗
energy infrastructure, including nuclear power, is needed and subject it to an effective, streamlined siting and permitting process.
Step up efforts to comply with its EU 2020 obligations, specifically by ◗
developing and putting in place a comprehensive climate change strategy for the years until 2020.
© O
EC
D/IE
A, 2
010

PART I
POLICY ANALYSIS
© O
EC
D/IE
A, 2
010

0 100 200
Km
Tib
er
PoAdige
Adda
Tyrrhenian
Sea
Ligurian
Sea
Gulf of
Venice
Mediterranean Sea
Strait of Sicily
Ionian
Golfo di
Taranto
Sea
Arno
Tanar
o
1
2
3
4
5
6
7
8
910
11
12
13
14
15
16
17
18
MONACO
FRANCE
Corsica
TUNISIA
MALTA
CROATIA
ITALY
BOSNIA &HERZEGOVINA
SLOVENIA
HUNGARY
AUSTRIALIECH.
SWITZERLAND
VATICAN CITY
SAN MARINO
(Fr.)
Palermo
Potenza
Campobasso
L'Aquila
Rome
Ancona
Perugia
Florence
Isole Eolie
Capri
Elba
Bologna
Venice
Trieste
Trento
MilanAosta
Turin
Genoa
Strait of Otranto
Naples
Bari
Catanzaro
Sardinia
Sicily
Cagliari
19
20
Adriatic
Sea
1
2
3
Val d'Aosta
Piemonte
Liguria
4
5
6
Lombardia
Trentino-AltoAdigeVeneto
7
8
9
Friuli-Venezia Giulia
Emilia Romagna
Toscana
10
11
12
Marche
Umbria
Lazio
13
14
15
Abruzzi
Molise
Campania
16
17
18
Puglia
Basilicata
Calabria
The boundaries and names shown and the designations used on maps included in this publication
do not imply official endorsement or acceptance by the IEA.
Map of Italy
© O
EC
D/IE
A, 2
010

0GENERAL ENERGY POLICY
COUNTRY OVERVIEW
Italy, with the exception of the Po plain in the north, is a largely mountainous country and runs from the Alps to the central Mediterranean Sea. It includes the large islands of Sicily, Sardinia and Elba, and about 70 smaller ones. Its surface area is 301 300 km² of which 165 200 km² is arable. Italy is home to almost 59 million inhabitants of whom 22 million are in active employment. Italian is the official language but there are German-, French- and Slovenian-speaking minorities in some regions.
The Italian Republic is governed by a bicameral national legislature, a Senate and a Chamber. The Council of Ministers is headed by the Prime Minister and appointed by the President on the basis of ability to form a government with parliamentary support. The most recent elections in April 2008 resulted in the formation of the present government led by Prime Minister Silvio Berlusconi. The government, an alliance of the main political parties in Parliament, Popolo della Libertà, is comprised of Forza Italia, Alleanza Nazionale, Democrazia Cristiana per le Autonomie and several other smaller parties. The next election is due to be contested in April 2013. The President of the Republic, elected for a seven-year term by an electoral college of the Senate, the Chamber of Deputies and regional representatives, has no executive powers. Elected in May 2006, the term of the current President, Giorgio Napolitano, runs until mid-May 2013.
The country is organised into 20 regions, including five autonomous regions, all of which are part of the constitutional structure of the country. In recent years Italy has experienced a rapid devolution of legislative and regulatory powers to the regions. In 2001, constitutional amendments provided a new framework for sharing regulatory competences, including energy, between the State and the regions, in particular in areas of concurrent legislation (between the State and the regions) and those that are now of the exclusive competence of the regions.
THE ECONOMY
Italy was a founding member of the European Union and is part of the G8 group of countries. It enjoys a GDP per capita just above the European average. The present global recession is projected to continue into late 2009, with a slow pick-up in 2010. Falling exports and deteriorating financial conditions have hit investment hard. After declining to quite low levels, investment should lead the recovery. Given Italy’s weak underlying fiscal position, the authorities have abstained from significant discretionary fiscal
02
15
© O
EC
D/IE
A, 2
010

16
expansion, while redirecting some spending within the existing budget envelope to better sustain domestic demand, notably private consumption. The budget deficit will nevertheless increase substantially in 2009 as the recession hits revenues, and may increase somewhat further in 2010 despite the planned fiscal consolidation.1
ENERGY SUPPLY AND DEMAND
Italy’s total primary energy supply (TPES) in 2008 was 174.5 million tonnes of oil equivalent (Mtoe).2 Between 1990 and 2008, TPES increased by 19%. Italy produces small volumes of natural gas and oil but most fossil fuels are imported and augmented by local production of energy from renewable sources. Import dependence is increasing and is particularly high for electricity (circa 15.4%).3 In 2008, imports net of exports accounted for 89% of TPES.
Figure 1
Total Primary Energy Supply, 1973 to 2030
0
50
100
150
200
250
1975 1980 1985 1990 1995 2000 2005 2010 2015 2020 2025 2030
Oil
Nuclear
Gas
Coal
Combustiblerenewablesand waste
Hydro
Solar*
Wind*
Geothermal
Mtoe
* negligible.Sources: Energy Balances of OECD Countries, IEA/OECD Paris, 2009 and country submission.
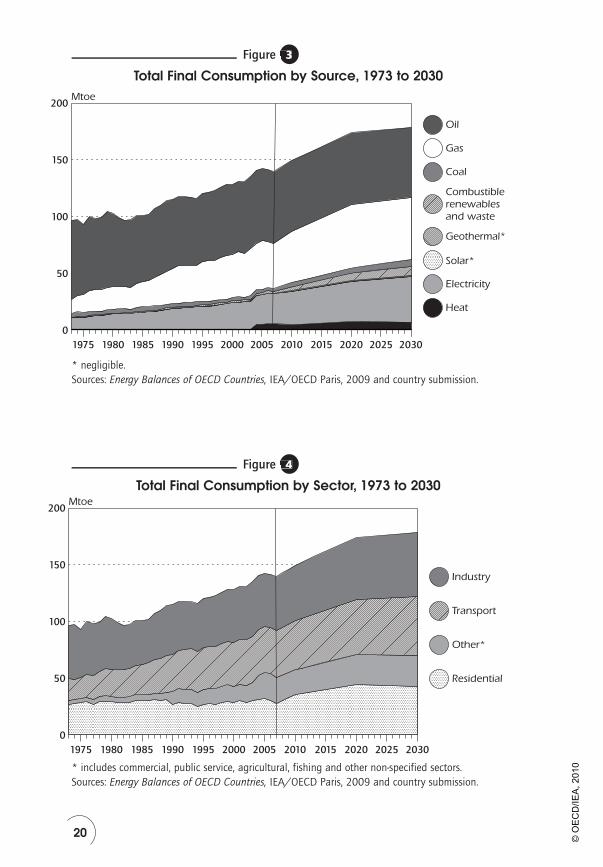
In 2007, total final consumption of energy (TFC) was 139.3 Mtoe, marginally lower than in the previous year. From 1990 to 2007, final consumption grew slightly more than GDP (23.4%). It grew at a slightly higher rate than TPES,
1. OECD Economic Outlook No. 85 – Italy, OECD Paris, 24 June 2009.2. Estimated energy supply balance for 2008 – Energy Balances of OECD Countries, IEA Statistics Paris,
2009.3. Electricity Information, IEA/OECD Paris, 2009.
1
© O
EC
D/IE
A, 2
010

17
implying some movements in energy efficiency. The transport sector was the largest consumer of energy in 2007, using 29.7% of energy or 41.4 Mtoe. The industry sector was the next largest consumer of energy, using 27.2% of energy or 37.8 Mtoe in 2007.
Compared to the OECD average, oil use in recent years is high (40% of TPES in 2008) while coal use is low (9.7% of TPES in 2008). Electricity production is far from CO2-free but this may change in the longer term if plans to renew the country’s nuclear programme come to fruition and the share of renewables grows as planned.
Figure 2
Energy Production by Source, 1973 to 2030
0
10
20
30
40
50
1975 1980 1985 1990 1995 2000 2005 2010 2015 2020 2025 2030
Oil
Nuclear
Gas
Coal*
Combustiblerenewablesand waste
Hydro
Solar*
Wind
Geothermal
Mtoe
* negligible.Sources: Energy Balances of OECD Countries, IEA/OECD Paris, 2009 and country submission.
INSTITUTIONS
MINISTRY OF ECONOMIC DEVELOPMENT
The Ministry of Economic Development (MSE), formerly the Ministry of Productive Activities, is responsible for national energy policy and the present government has devoted strategic importance to energy issues. Ministerial staff and resources have been increased. A new Department of Energy has been established under which three different Directorates-General (DG) operate: DG for Energy and Mineral Resources, DG for Security of Supply and Energy Infrastructures and DG for Nuclear and Renewable Energy. This latter DG has been tasked with leading Italy’s return to nuclear energy.
2
© O
EC
D/IE
A, 2
010

18
MINISTRY FOR THE ENVIRONMENT, LAND AND SEA
The Ministry for the Environment, Land and Sea is responsible for climate change policy co-ordination. Furthermore, in co-ordination with the Ministry of Economic Development, it is responsible for the promotion and the development of renewable energy and for energy efficiency.
THE REGIONS
In recent years Italy has experienced a rapid devolution of legislative and regulatory powers to the regions. These have now legislative powers for any matter not expressly reserved for the exclusive competence of the national Parliament. These include key economic sectors, such as retail trade, agriculture, tourism, transport and vocational education. The protection of the environment and cultural resources is listed among the exclusive competences of the State. In some other sectors specifically listed by the Constitution, as it is the case for energy production, transport and distribution, the State and the regions have concurrent legislative powers. This means that the regions have the power to enact legislation, provided that it does not conflict with the framework principles adopted at State level.
Furthermore, in the case of energy infrastructure, such as power plants, natural gas and electricity networks, and LNG regasification facilities, authorisation must be granted by the competent ministries in agreement with the relevant region.
REGULATORY AUTHORITY FOR ELECTRICITY AND GAS (AUTORITÀ PER L’ENERGIA ELETTRICA E IL GAS, AEEG)
The Regulatory Authority for Electricity and Gas is an independent body established under Law no. 481 of 14 November 1995 to regulate and maintain oversight of the electricity and natural gas sectors. The Authority is funded by means of an annual contribution paid by industry. Its judgements and evaluations enjoy a high degree of autonomy from the government. Present functions include retail tariff determination, defining service quality standards and determining the technical and economic conditions governing access and interconnections to the networks.
COMPETITION AUTHORITY (AUTORITÀ GARANTE DELLA CONCORRENZA E DEL MERCATO, AGCM)
The AGCM is an independent authority established by Law no. 287 of 10 October 1990 (the Competition and Fair Trading Act). The Authority has the status of a public agency whose decisions are taken on the basis of the act without the
© O
EC
D/IE
A, 2
010

19
possibility of interference from government. In the energy sector, its main tasks are to examine claims made against abuse of dominant position and to review possible mergers and acquisitions. The AGCM also makes recommendations to the government and the Parliament on the impacts of possible market restructuring on competition. In the past, the Authority has undertaken a number of investigations in relation to energy markets, including allegedly abusive practices in the wholesale electricity markets, abuse of dominant position in the electricity distribution market, in downstream markets for oil products, and mergers and takeovers. A decision of the AGCM can be subject to appeal by the regional administrative court of Lazio and the Council of State.
KEY POLICIES
In the recent past, Italian energy policy was marked by the absence of a clear integrated long-term vision for the development of the sector. This, however, has the potential to change following the mid-2009 introduction of Lawno. 99/2009.4 The new National Energy Strategy that will be developed as part of the implementation of Law no. 99/2009 can provide Italy with a means by which a clear integrated long-term vision can emerge. This new National Energy Strategy, when it emerges, has the capability to radically transform the energy policy outlook for the country. Law no. 99/2009 provides the legislative basis for a new policy and must attain the following objectives:
Diversification of energy sources and of geographical areas of supply; ●
Improvement of the national energy system’s competitiveness and development ●
of its infrastructures with a view to the common European internal market;Promotion of renewable sources of energy and of energy efficiency; ●
Construction of nuclear energy plants on the national territory, including ●
promotion of nuclear research on Generation IV and on fusion; Increase of investment in research and development in energy and ●
participation in international agreements on technological co-operation; Guarantees on adequate levels of health protection of the population and ●
of workers.
In order to draft the new National Energy Strategy, the Ministry of Economic Development (MSE) will convene a national conference on energy and the environment together with the Ministry for the Environment, Land and Sea. The MSE will then draft a plan to be included in the government’s three-year budget outlook document.
4. Legge 23 luglio 2009, no. 99 “Disposizioni per lo sviluppo e l’internazionalizzazione delle imprese, nonché in materia di energia” pubblicata nella Gazzetta Ufficiale n. 176 del 31 luglio 2009 - Supplemento ordinario no. 136 (Law 23 July 2009, no.99 “Provisions for the development and the internationalisation of enterprises, and in the field of energy” published in the Official Journal (of the Italian Republic) no. 176 of 31 July 2009 - Ordinary supplement no. 136.)
© O
EC
D/IE
A, 2
010
20
Figure 3
Total Final Consumption by Source, 1973 to 2030
0
50
100
150
200
1975 1980 1985 1990 1995 2000 2005 2010 2015 2020 2025 2030
Oil
Gas
Coal
Combustiblerenewablesand waste
Geothermal*
Electricity
Heat
Solar*
Mtoe
* negligible.Sources: Energy Balances of OECD Countries, IEA/OECD Paris, 2009 and country submission.
Figure 4
Total Final Consumption by Sector, 1973 to 2030
0
50
100
150
200
1975 1980 1985 1990 1995 2000 2005 2010 2015 2020 2025 2030
Industry
Transport
Other*
Residential
Mtoe
* includes commercial, public service, agricultural, fishing and other non-specified sectors.Sources: Energy Balances of OECD Countries, IEA/OECD Paris, 2009 and country submission.
3
4
© O
EC
D/IE
A, 2
010
21
SECURITY OF SUPPLY
A country-wide electricity blackout in 2003 coupled with a growing dependence on electricity imports and lack of entry into the generation market stimulated the government into taking additional measures to strengthen energy security in both the natural gas and electricity sectors. The development of new generating capacity was encouraged by simplifying and streamlining the processes for granting permits for new power plants and the introduction of new measures to attract investment into import infrastructure as well as internal transmission infrastructure. The design of the wholesale electricity market was enhanced and ownership unbundling of the previous incumbent was completed.
More recently, Law no 99/2009 will introduce a simplified procedure for the authorisation of electricity network infrastructure. The same law also provides for streamlined administrative procedures for the development of the national transmission grid and invests substitutive powers to the central administration in case of stalemate at local level. In addition, Decree no.103/2009 established a means by which government may appoint a “Special Commissioner” to accelerate authorisation procedures for the transmission and distribution of energy where the planning process has ground to a halt.
MARKET REFORM
ELECTRICITY SECTOR
Italy has made strong progress in reforming the electricity sector since the last review and all relevant EU market directives have been transposed into national law. Since July 2007 all electricity customers have been free to choose their supplier. Despite progressive changes, retail competition has been limited in the market for small and domestic consumers and retail prices are the highest in the OECD.
NATURAL GAS SECTOR
The gas sector has been open to competition since January 2003. However, despite these relatively advanced regulatory arrangements, there is still little competition, particularly on the supply side. The government is taking further steps to arrest this position, including the authorisation of new import infrastruture and a progressive gas release programme.
© O
EC
D/IE
A, 2
010
22
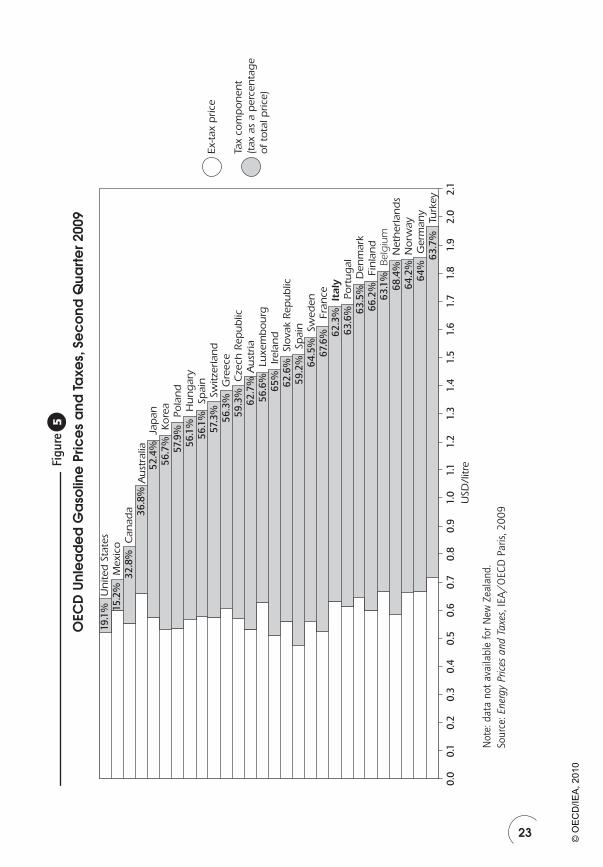
ENERGY TAXES
Energy prices in Italy are generally higher than in the rest of OECD Europe. Italy applies different rates of value-added tax (VAT) and excise tax on a national basis to all energies. The Ministry of Economy and Finance is responsible for taxation policy, while regional authorities are responsible for applying their own taxes.
Oil products are subject to excise tax and VAT. VAT is 20% for gasoline, diesel and liquefied petroleum gas (LPG). It is refunded on purchases for commercial purposes in industry, electricity generation and automotive diesel oil. Householders pay a general 20% VAT rate on purchases of light fuel oil and gasoline.
Natural gas is subject to excise tax and VAT and also to additional taxes at regional level. Since 2008, industrial users are subject to an excise tax of EUR 14.23/107 kcal for consumption up to 1.2 million cubic metres(mcm)/year and EUR 8.54/107 kcal above that consumption. There is an additional regional tax of up to EUR 7.11/107 kcal depending on the region.
From 2008 onwards, the VAT rate is 10% for users who consume less than 480 cubic metres (cm) a year, and 20% for the remaining consumption. Before 2008, domestic consumers’ VAT rate was 10% if the gas was used only for cooking and hot water up to 250 cm a year. The excise rate is EUR 0.75 per cubic metre for consumption greater than 1.2 mcm per year.
Households pay the 10% standard rate of VAT for electricity. Since May 1991, excise tax is not charged on the first 150 kWh per month of consumption (up to 3 kW). For consumption above that volume, excise tax is charged at EUR 0.0186 per kWh and EUR 0.0204 per kWh for second homes. For industrial consumers, excise tax is charged at EUR 0.0031 on consumption below 1 200 MWh per month and provincial taxes of EUR 0.0093 must be paid on consumption below 200 MWh per month.
CRITIQUE
Italy has made substantial progress in a number of sectors in the period since the last in-depth review: the success of the green and white certificate schemes; the reorganisation of the electricity and natural gas markets; the implementation of incentive schemes for renewable energy; investment in carbon capture and storage (CCS) research; development and deployment schemes; and simplified planning procedures for new essential infrastructure are all good examples. The EU-ETS National Allocation Plan has been implemented and the independence of the Authority for Electrical Energy and Gas (AEEG) has been enhanced.
© O
EC
D/IE
A, 2
010
23
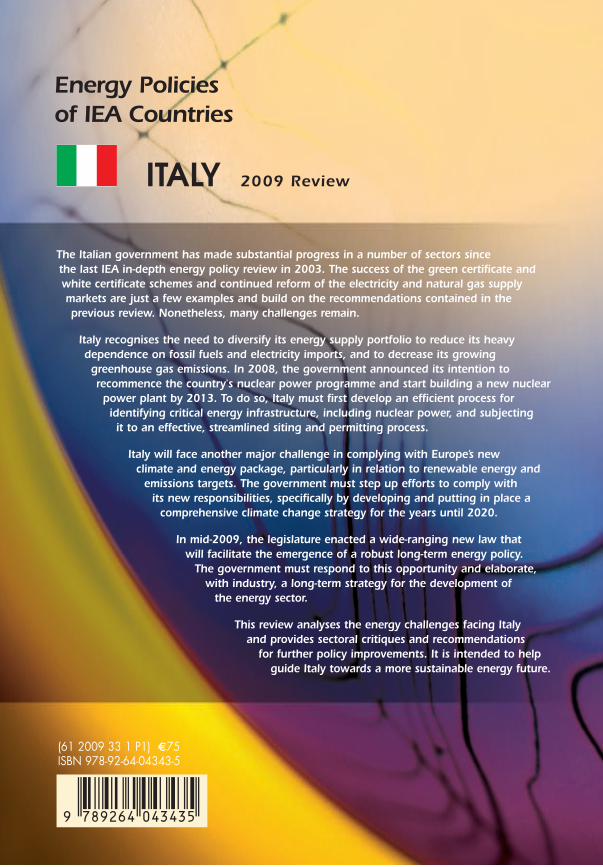
Fi
gure
5
OEC
D U
nle
ad
ed
Ga
solin
e P
rice
s a
nd Ta
xes,
Se
co
nd Q
uart
er 2
009
63.7
%
Turk
ey
64%
64.2
%68
.4%
63.1
%66
.2%
63.5
%63
.6%
62.3
%67
.6%
64.5
%59
.2%
62.6
%65
%56
.6%
62.7
% A
ust
ria
59.3
%56
.3%
57.3
%56
.1%
56.1
%57
.9%
56.7
%52
.4%
36.8
%A
ust
ralia
32
.8%
Ger
man
y N
orw
ay
Net
her
lan
ds
Bel
giu
m
Fin
lan
d
Den
mar
k Po
rtu
gal
It
aly
Fran
ce
Swed
en
Spai
n
Slo
vak
Rep
ub
lic
Irela
nd
Lu
xem
bo
urg
Cze
ch R
epu
blic
G
reec
e Sw
itzer
lan
d
Spai
n
Hu
ng
ary
Pola
nd
Ko
rea
Jap
an
Can
ada
15.2
%M
exic
o
19.1
%U
nite
d S
tate
s
0.0
0.1
0.2
0.3
0.4
0.5
0.6
0.7
0.8
0.9
1.0
1.1
1.2
1.3
1.4
1.5
1.6
1.7
1.8
1.9
2.0
2.1
USD
/litr
e
Tax
com
po
nen
t(t
ax a
s a
per
cen
tag
eo
f to
tal p
rice
)
Ex-ta
x p
rice
Not
e: d
ata
not
avai
labl
e fo
r New
Zea
land
.So
urce
: Ene
rgy
Pric
es a
nd T
axes
, IEA
/O
ECD
Par
is, 2
009
5
© O
EC
D/IE
A, 2
010

24
Figure 6
Fuel Prices, 2008Industry Sector
USD/toe
Taxcomponent
Household Sector
Taxcomponent
Electricity Diesel Low sulphur fuel oil
Naturalgas
Electricity Gasoline Diesel Lightfuel oil
Natural gas
0
500
1 000
1 500
2 000
2 500
3 000
3 500
4 000
0
500
1 000
1 500
2 000
2 500
3 000
3 500
4 000
Lightfuel oil
Coal
USD/toe
Source: Energy Prices and Taxes, IEA/OECD Paris, 2009.
At national level, the government has implemented many new laws and regulations and has developed an appropriate framework to implement an energy market policy that is consistent with European requirements. It has also succeeded in diversifying natural gas supply routes, in terms of pipelines,
6
© O
EC
D/IE
A, 2
010

25
and also the commissioning of an offshore LNG terminal in 2008. Italy has succeeded in attracting significant amounts of new electricity generating capacity, and is in the process of further diversifying fuels for electricity generation.
Despite recent policy successes, including the mid-2009 enactment of Law no. 99/2009, it is not clear if there is an integrated long-term vision for the development of the national energy sector or if Italy is adequately addressing the challenges posed by various national issues and international commitments. The Italian energy position remains vulnerable in several regards — energy security in particular is a major concern. Growth in electricity generating capacity has been largely gas-fired, leading to increased dependence on imported gas, and the planned diversification from pipeline gas to LNG has not been as successful as desired, partially because of long delays in the permitting of LNG terminals in the past. Delays have also marked the development of renewable energy, the conversion of oil-fired to coal-fired power stations, as well as the issuing of hydrocarbon exploration and production licences.
Gas demand has been increasing steadily at a rate of about 1.5% per year, leading to pressure on the natural gas system. While several infrastructure projects are expected to improve the supply situation, it is likely that local resistance and delays in permitting may continue to impact upon project completions despite the recent good progress in relation to LNG import facilities. Retail electricity and natural gas prices are also high by comparison with other European countries, leading to concerns about competitiveness of Italian industry. At the same time, the European climate and energy package raises significant concerns in Italy owing to a belief that there is low potential for renewable energy and an already good record of Italy concerning the ratio of energy intensity or CO2 emissions. Regardless of the actual foundation of these concerns, it is clear that present EU climate change policies will add to the challenge Italian policy makers face.
In the past, the development of energy scenarios for the country, followed by their publication and open debate, happened infrequently. The present Administration has within its means (Law no. 99/2009) an opportunity to address this position. Long-term scenarios endorsed by the government and looking at the possible shape of the Italian energy landscape in 2020 and beyond could be used as a solid empirical base upon which to support mid- and long-term energy policy. This process could galvanise debate, and identify new opportunities for energy policy and the energy sector, by developing a variety of pathways to a cleaner and more secure energy future. More importantly, scenarios may help to develop a sense of shared responsibility within the various levels of government, as well as with other stakeholders. The advantage of this approach is that it is not restricted to a single methodology, but several perspectives could be explored. The important link provided by a
© O
EC
D/IE
A, 2
010

26
consistent set of underlying data, as well as the policy debate that they could trigger, would be useful improvements to policy making in themselves.
One of the reasons attributed to the long lead time for the realisation of investments in the energy sector is a 2001 amendment to the Italian Constitution that gave additional competences in energy matters to regional authorities, who may not always have the necessary resources to assess licence or investment applications. Regional and provincial authorities have strong powers and can block investments that have the potential to serve the national interest, without being subject to the broader consequences of their actions. For example, before awarding exploration and production licences or licensing a renewable energy development, the Ministry of Economic Development has to wait for the advice of the relevant regional bodies, thereby lengthening the time-frame within which a decision can be taken. In theory, the decision of a region can be overruled by the Council of Ministers. However, this mechanism is rarely utilised and in practice regional administrations have a de facto veto on the allocation of hydrocarbon licences and other energy infrastructure developments. The government should consider addressing this matter to ensure that needed investment can take place.
Italy is not unique in struggling with the challenge of developing much-needed energy infrastructure, even though the process tends be more complicated than in some other countries because of the balance of power between the State, regions and local authorities. Nonetheless, the government has commendably taken a number of steps to streamline and improve the process of energy infrastructure development. Law no. 99/2009 contains a series of provisions that have the capability to address many shortcomings. The government must continue this process; build on the potential offered by the new law, with a view to creating a streamlined, integrated and transparent process. This process must highlight to all stakeholders, including the public, the costs and benefits of new infrastructure and involves all stakeholders in the process from the outset.
Renewable energy sources, as a share of the generation portfolio, are stable, with new renewables barely sufficient to balance the decline of hydropower, despite significant levels of investment. To realise the full potential of renewables, the government will have to prepare a detailed road-map, not only to increase the penetration of renewable energy, but also to guide Italy towards meeting its EU obligations. These obligations set out in the European climate and energy package, present Italy with a major challenge.
The government has commenced the process of reviving Italy’s nuclear energy programme. This decision was influenced by a number of factors, including the need to reduce the country’s growing dependence on imported fossil fuels, to reduce Italy’s relative dependence on imported electricity, to diversify the energy mix and also to reduce CO2 emissions. The government will have to tackle a number of challenges before nuclear power can become a reality.
© O
EC
D/IE
A, 2
010

27
To move ahead, the government will have to address public concerns about nuclear power by means of a thorough engagement with the public and identify an effective final storage solution for radioactive waste. The government will also have to provide investors and the public alike with full clarity on the legal and economic aspects of reintroducing Italy’s nuclear programme. Given the particular difficulties any energy infrastructure development in Italy faces, and notwithstanding future reforms, the Administration must involve at an early stage the regions and municipalities identified as potential locations for new nuclear power stations to enable public acceptance. This will have to be matched with the re-establishment of the relevant regulatory institutions and the training of the necessary human resources to support and regulate nuclear power installations. In this regard, Law no. 99/2009 has provided the government with a mandate to adopt a number of legislative provisions to discipline the siting of nuclear power plants, facilities for the production of fissile material, storage sites for spent fuel and radioactive waste, facilities for final disposal of radioactive material, definition of compensation measures for the local populations.
Although the government invests in technology research and development, there appears to be a lack of an overall policy framework, both within the technology and research sector and also in relation to overall economic and energy policy. Various measures are introduced at different times by different responsible government institutions, further complicated by the devolution of authority and fragmentation of responsibilities, which sometimes impedes decision making and potentially reduces national impacts of policies.
RECOMMENDATIONS
The government of Italy should:
Develop and make better use of energy scenarios as a basis for public ◗
debate and policy making, support the development of the new National Energy Strategy, and help address the country’s significant climate change commitments, while continuing to diversify energy supply and reducing costs to consumers.
Develop an efficient process for identifying critical energy infrastructure ◗
and subjecting it to an effective, streamlined location and permitting process involving all relevant authorities and including a fully informed and constructive public debate.
© O
EC
D/IE
A, 2
010
28
Seize the opportunity provided by the lifting of the moratorium on nuclear ◗
power and engage in a widespread public debate that includes all stakeholders, including the regional and provincial authorities.
Ensure that long-term energy R&D priorities of the National Research ◗
Programme reflect energy policy needs and are consistent with broader industrial, economic and educational policies.
© O
EC
D/IE
A, 2
010

CLIMATE CHANGE
OVERVIEW
Italy, a member of the European Union and a signatory to the United Nations Framework Convention on Climate Change (UNFCCC) and to the Kyoto Protocol, is committed to action on climate change. In 2008 the government published its Five Pillars for Action setting out its determination to reduce climate change damage by redirecting the energy mix towards lower carbon production. Reducing greenhouse gas emissions and greater energy efficiency are the cornerstones of Italian sustainable energy policy.
The UNFCCC was ratified by Italy in 1994 by means of Law no. 65 of 1994. The Kyoto Protocol, adopted in December 1997, was ratified in June 2002 by means of Law no. 120 of 2002. The ratification law also prescribed the preparation of a National Action Plan to reduce greenhouse gas emissions, which was adopted by the Inter-ministerial Committee for Economic Planning (CIPE, Resolution no. 123/2002) in December 2002. The Kyoto Protocol finally entered into force in February 2005. As a party to the UNFCCC and the Kyoto Protocol, Italy is committed to develop, publish and regularly update its national emissions inventory of greenhouse gases (GHGs) as well as formulate and implement programmes to reduce these emissions.
Under its obligations under the Kyoto Protocol and the EU Burden-Sharing Agreement, Italy has a target to reduce its greenhouse gas emissions by 6.5% below base-year levels over the first commitment period, from 2008 to 2012. The Kyoto target is therefore set at 483.3 MtCO2-equivalent. According to the latest available data5, the country’s emissions are 12.13% above this target, so firm action is needed to comply with the Kyoto Protocol by the first commitment period. Despite envisaged additional policies and measures, present trends indicate that the target will not be met domestically.
In January 2008 the European Commission put forward a far-reaching and ambitious package of proposals that aim to deliver on the European Union’s commitments to fight climate change and promote renewable energy up to 2020 and beyond. This was followed, in December 2008, by an agreement between the European Parliament and the European Council on the details of the package, which has the potential to transform Europe into a low-carbon economy while at the same time strengthening its energy security.
5. Italian Environment Protection and Technical Services Agency (APAT, Agenzia per la Protezione dell’Ambiente e per i Servizi Tecnici), 2007.
03
29
© O
EC
D/IE
A, 2
010

30
The EU has committed to reducing its overall emissions to at least 20% below 1990 levels by 2020, and is prepared to increase the size of this reduction to as much as 30% should a new global climate change agreement involve a comparable effort among other developed countries. The climate and energy package sets out the contribution expected from each member state to meeting these targets and proposes a series of measures to help achieve them. In the case of Italy, emissions reductions of 13% with respect to 2005 levels are required to come from the sectors outside of the EU-ETS.
EMISSIONS PROFILE
Italy has established a national system, which includes all institutional, legal and procedural arrangements for estimating emissions and reductions of greenhouse gases, and for reporting and archiving inventory information.
Figure 7
Energy-Related CO2 Emissions per GDP in Italy and in Other Selected IEA Member Countries, 1973 to 2010
(tonnes of CO2 emissions per thousand USD/GDP using 2000 pricesand purchasing power parities)
0.0
0.2
0.4
0.6
0.8
1975 1980 1985 1990 1995 2000 2005 2010
Italy
Spain
IEA Europe*
Greece
* excluding Luxembourg and Norway throughout the series, as forecast data are not available for these countries.Sources: Energy Balances of OECD Countries, IEA/OECD Paris, 2009; National Accounts of OECD Countries, OECD Paris, 2009 and country submissions.
7
© O
EC
D/IE
A, 2
010
31
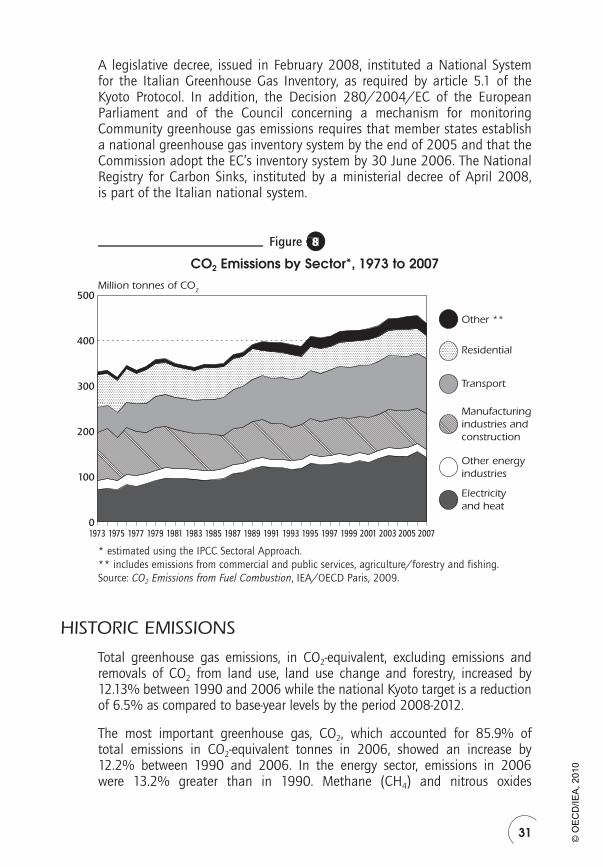
A legislative decree, issued in February 2008, instituted a National System for the Italian Greenhouse Gas Inventory, as required by article 5.1 of the Kyoto Protocol. In addition, the Decision 280/2004/EC of the European Parliament and of the Council concerning a mechanism for monitoring Community greenhouse gas emissions requires that member states establish a national greenhouse gas inventory system by the end of 2005 and that the Commission adopt the EC’s inventory system by 30 June 2006. The National Registry for Carbon Sinks, instituted by a ministerial decree of April 2008, is part of the Italian national system.
Figure 8
CO2 Emissions by Sector*, 1973 to 2007
0
100
200
300
500
400
Electricityand heat
Other energyindustries
Manufacturingindustries andconstruction
Residential
Other **
Transport
1973 1975 1977 1979 1981 1983 1985 1987 1989 1991 1993 1995 1997 1999 2001 2003 2005 2007
Million tonnes of CO2
* estimated using the IPCC Sectoral Approach.** includes emissions from commercial and public services, agriculture/forestry and fishing.Source: CO2 Emissions from Fuel Combustion, IEA/OECD Paris, 2009.
HISTORIC EMISSIONS
Total greenhouse gas emissions, in CO2-equivalent, excluding emissions and removals of CO2 from land use, land use change and forestry, increased by 12.13% between 1990 and 2006 while the national Kyoto target is a reduction of 6.5% as compared to base-year levels by the period 2008-2012.
The most important greenhouse gas, CO2, which accounted for 85.9% of total emissions in CO2-equivalent tonnes in 2006, showed an increase by 12.2% between 1990 and 2006. In the energy sector, emissions in 2006 were 13.2% greater than in 1990. Methane (CH4) and nitrous oxides
8
© O
EC
D/IE
A, 2
010
32
(N2O) emissions were equal to 6.7% and 6.2%, respectively, of the total CO2-equivalent greenhouse gas emissions in 2006. Both gases showed a decrease from 1990 to 2006, equal to 8.3% and 7.6% for CH4 and N2O, respectively. Other greenhouse gases, hydrofluorocarbons (HFCs), perfluorocarbons (PFCs) and sulphur hexafluoride (SF6), ranged from 0.05% to 1% of total emissions; at present, variations in these gases are not relevant to reaching the objectives for emissions reduction.
The energy sector is the largest contributor to national total GHG emissions. In 2006, its share was 83.4%, a 12.9% increase over 1990 levels. The highest level of increase was noted for CO2 which grew by 13.2% from 1990 to 2006 and accounts for 97% of the total in the energy sector.
PROJECTED EMISSIONS
The National Agency for New Technologies, Energy and the Environment (ENEA) forecasts, published in 2007, indicate that emissions will continue to grow in the period to 2020.6 Overall emissions post-2005 are expected to increase by 2% in the period to 2010, by 4% in the 2010 to 2015 period and by an additional 2% up to 2020. Those trends are considerably lower than the growth registered in the 2000 to 2005 period (5.8%) and, on the average, lower than the 1990 to 2000 historical trend (6.6%).
CO2 emissions are forecast to rise by 9.2% between 2000 and 2010. A significant share of CO2 emissions is generated by energy consumption. Methane emissions and, to a lower extent, nitrous oxide emissions, are decreasing. The increase in overall emissions between 2010 and 2020 is expected to continue, with CO2 emissions expected to increase by 6.9%.
The most recent greenhouse gas projections for Italy were presented in the May 2008 Monitoring Mechanism (MM) submission to the European Commission. Italy’s Kyoto commitment is a 6.5% reduction in greenhouse gas emissions relative to the base year, an implied target of 483.3 MtCO2-eq. Including the effect of additional measures, flexible mechanisms and carbon sinks, Italy’s emissions are projected to be 4.6% below the base year, meaning that it will not meet its Kyoto target of a 6.5% reduction. The 2008 figures represent an increase in the gap to target reported in 2006 and 2007. Italy states that the additional measures needed to close this gap are still under investigation by the competent institutions and that they will be included in the forthcoming national strategy to mitigate climate change. The greatest projected emissions increase is projected in the energy sector. The subsector that presents the biggest increase is transport, where CO2 emissions are projected to increase by between 27% and 30%.
6. Rapporto Energia e Ambiente – 2006, ENEA.
© O
EC
D/IE
A, 2
010

33
CLIMATE CHANGE POLICY
INSTITUTIONAL ARRANGEMENTS
Central government has overall responsibility for the implementation of the Kyoto Protocol and the delivery of the agreed emissions reductions, although a range of policies are also the responsibility of regions, provinces and municipalities.
At central level, the Ministry for the Environment, Land and Sea is responsible for overall climate policy co-ordination, while the Ministry of Economic Development is responsible for national energy policy. Legislative powers are divided between national and regional levels. In accordance with the provisions of the ratification law, an overall national strategy to meet the Kyoto target was developed and approved by the Inter-ministerial Committee for Economic Planning (CIPE). The purpose of this strategy was not only to reduce greenhouse gas emissions, but also to fulfil other commitments related to climate change policy, including the determination of administrative frameworks.
The National Action Plan 2003–2010 established an Inter-ministerial Technical Committee for Greenhouse Gas Emissions (CTE). It is chaired by the Minister for the Environment, Land and Sea. The Committee has responsibility to regularly monitor progress on the implementation of policies and measures, on the basis of indicators and sectoral-level emissions. It is also tasked with carrying out cost-effectiveness analyses to identify additional measures needed to meet the Kyoto target. The Technical Committee includes representatives of the regions and of various ministries; Economic Development; Agricultural and Forestry Policies; Infrastructures; Transport; Universities and Research; and Foreign Affairs.
Decree no. 112 of 25 June 2008, converted into Law no. 133 in August 2008, provided for the establishment of the Institute for Environmental Protection and Research (ISPRA). ISPRA was created by merging the Italian Environment Protection and Technical Services Agency (APAT); the National Institute for Wildlife (INFS); and the Central Institute for Scientific and Technological Research Applied to the Sea (ICRAM). Previously, APAT was the single entity in charge of the development and compilation of the national greenhouse gas emissions inventory. The Agency also collected data within the framework of the European Union Emissions Trading Scheme (EU-ETS), the National Pollutant Emission Register (EPER) and the Large Combustion Plants (LCPD) Directives. The Ministry for the Environment, Land and Sea is responsible for the endorsement of the inventory and for the communication to the IEA Secretariat of the different conventions.
In addition, there are different institutions responsible for statistical basic data gathering and publication, which are primary to APAT for carrying
© O
EC
D/IE
A, 2
010

34
out emission estimates. These institutions are part of a National Statistical System (Sistan), which provides national official statistics. The main basic data needed to draw up the inventory are the energy statistics published in the National Energy Balance by the Ministry of Economic Development, industrial and agricultural production data published by the National Institute of Statistics (ISTAT), statistics on transportation provided by the Ministry of Transport, and data supplied directly by the relevant industrial associations. The national forest inventory is supplied by the Ministry of Agriculture.
POLICIES AND OBJECTIVES
In its efforts to meet the commitments under the UNFCCC and the Kyoto Protocol, Italy has implemented a number of sectoral and cross-sectoral policies and measures that have had, or are expected to have, a direct or indirect effect on the reduction of greenhouse gas emissions. Policies currently in place or about to be implemented include:
The white certificate system, which is aimed at promoting energy ●
efficiency and delivering emissions reductions in all energy end-use sectors. The system is supported by further specific measures (i.e. tax credits) where targets are not sufficiently sustained by white certificates, such as the energy-efficient refurbishment of buildings (see White Certificates in Chapter 4).
Participation in the European Union Emissions Trading Scheme (EU-ETS) ●
and the flexible mechanisms of the Kyoto Protocol.
Implemented and planned policies and measures to increase the penetration ●
of renewable energy sources. The major policy mechanism through which the government supports the development of new renewables capacity is the green certificate scheme; together with specific feed-in tariffs for solar energy and small-scale generation supplied by other renewable energy sources (see Tradable Green Certificates in Chapter 5).
Co-generation is currently supported by means of a number of different ●
incentive schemes, rewarding both the production of heat and the production of electricity. Also, a new incentive scheme was introduced by Law no. 99/2009 and will soon be implemented.
Legislation introduced to improve the energy performance of buildings, ●
strengthening their thermal demand requirements. These include compulsory standards for new buildings and renovation of older buildings. Reducing the average emissions of the motor transport fleet, building new infrastructure for mass public transport and increasing the use of biofuels.
© O
EC
D/IE
A, 2
010
35
THE REGIONAL ENERGY PLANS (PER)
Following the implementation of Law no. 10/1991, the Italian regions were assigned the task of developing Regional Energy Plans (PERs) and other initiatives ro reduce energy consumption and to promote renewable energy sources. The PER is the main tool regions can utilise to plan and address interventions in energy sectors in their own territories and to regulate the functions of local agencies. PERs also facilitate the harmonisation of decision making at regional and local levels.
MEASURES TO ACHIEVE EMISSIONS REDUCTIONS
Emissions trading
The EU-ETS was established in 2003 by Directive 2003/87/EC and covers CO2 emissions by all medium and large installations in the fields of energy conversion, refinery processes, coke ovens, and the steel, cement, glass, ceramic, cellulose and paper industries. The EU-ETS and the flexible mechanisms of the Kyoto Protocol taken together are expected to deliver reductions of between 13.25 and 20.75 MtCO2 per year by 2010.
Installations in the EU-ETS can meet their obligations either by implementing emissions reduction measures of their own or by purchasing allowances, which might come from installations in other EU countries and credits from the Kyoto Protocol joint implementation project mechanisms. Since January 2005, operators of installations have been required to monitor their emissions and to ensure that they surrender allowances equivalent to their emissions in any calendar year.
Directive 2003/87/EC requires that each European Union member state submit a national allocation plan (NAP) for each trading period. The NAP is used to determine the total quantity of allowances to be issued and the number of allowances each installation will receive. In May 2007, the European Commission accepted Italy’s NAP for the period 2008-2012 on condition that certain changes were made, including a reduction in the total number of emission allowances proposed by 13.25 MtCO2-equivalent per year, to 195.8 million tonnes.
Italy has agreed to cut CO2 emissions from sectors covered by the EU-ETS by 13.65 million tonnes. The total cap for Italy for the period, with the addition of several new industrial processes, will average 201.63 million tonnes per year, of which 16.93 million tonnes per year for New Entrants Reserve. The share of emissions that can be offset by credits created in developing nations
© O
EC
D/IE
A, 2
010

36
is on average 15% of the total amount and varies depending on the sector (fuel-fired power plants up to 19.3%, refineries 13.2%, others 7.5%).7
Table
Total Amount of Quotas to be Assigned for the Second Commitment Period (in MtCO2)
2008 2009 2010 2011 2012
Assigned quotas to existing plants 199.1 191.04 183.88 179.35 176.24
Average values of quotas reserved for new entrants
15.65 15.65 15.65 15.65 15.65
Total of assigned quotas 214.75 206.69 199.53 195 191.89
Source: Decision Scheme allocation of quotas 2008-2012.
Table
Sectoral Assigned Average Quotas for 2008-2012
2008-2012 [MtCO2/year]
Energy activities
Thermoelectric 85.29
Other combustion activities 17.89
Gas pipeline compressors 0.88District heating 0.23Others 16.78
Refineries 19.06
Production and processing of ferrous metals 22.72
Mineral industry 34.65
Cement 27.63Lime 3.07Glasses 3.15Ceramic products and bricks 0.80
Other activities
Pulp and paper 5.09
Total 184.70
New entrants 16.93
Total 201.63
Source: Decision Scheme allocation of quotas 2008-2012.
7. The clean development mechanism (CDM), defined in Article 12 of the Kyoto Protocol, allows a country with an emissions reduction or emissions limitation commitment under the Kyoto Protocol (Annex B Party) to implement an emissions reduction project in developing countries. Such projects can earn saleable certified emissions reduction (CER) credits, each equivalent to one tonne of CO2, which can be counted towards meeting Kyoto targets.
1
2
© O
EC
D/IE
A, 2
010

37
Domestic measures from the non-trading sector
In the non-trading sector, the package of policies deployed aims at tackling energy efficiency by means of specific actions targeted both on existing and new buildings and on appliances. The most important regulatory measures affecting this sector are the white certificate system and legislation introduced to improve the energy performance of buildings, strengthening their thermal demand requirements. The combined effect of implemented and planned measures in the civil sector results in a reduction of 4.45, 24.25 and 30.54 MtCO2-eq per year by 2010, 2015 and 2020.
The transport sector is characterised by an important reduction potential and the task of tackling its emissions growth is challenging. The measures proposed, but not yet implemented, include reducing the average emissions of the transportation fleet, building new public transport infrastructure and increasing the use of biofuels. The estimated effect of implemented and planned measures is assessed at 5.35, 16.87 and 24.47 MtCO2-eq year by 2010, 2015 and 2020. Further results could also arise from European Union regulations setting emission performance standards for new passenger cars as part of the EU integrated approach to reduce CO2 emissions from light-duty vehicles.
As regards the non-energy sources of greenhouse gas emissions, the combined effect of the measures deployed in the industrial processes, agriculture and waste sectors can be assessed at 3.70, 9.31 and 9.65 MtCO2 per year by 2010, 2015 and 2020. The forestry sector is assessed only for the year 2010 and it is expected to deliver reductions of 25.3 MtCO2.
International purchases
Italy recognises that the Kyoto mechanisms play an essential role in meeting commitments under the Protocol. The contribution of the Kyoto mechanisms to the national emissions reduction target has been assessed at 20.75 MtCO2. Purchases of emission credits from the international market will be used to offset domestic emissions above the Kyoto target.
The credits, predominantly emissions reduction units (ERU) generated by joint implementation projects and certified emissions reductions (CER) generated from clean development mechanism projects, will be mainly purchased through the Italian Carbon Fund (ICF), which was established in 2003 following an agreement between the World Bank and the Italian Ministry for the Environment, Land and Sea. The ICF is open to the participation of the Italian private and public sectors; the minimum contribution from each additional participant is set at USD one million. The project portfolio of the Italian Carbon Fund is fairly diversified with support being provided to a wide range of technologies, and regions, including China, the Mediterranean region, the Latin and Central American regions, as well as the Balkans and Middle
© O
EC
D/IE
A, 2
010
38
Eastern countries. Italy also contributes to the Community Development Carbon Fund (CDCF) and to the BioCarbon Fund (BioCF).
The average price of the credits purchased so far is about USD 6.65 per tonne of CO2. Assuming the average price will remain stable in future years, by the end of the commitment period 2008 to 2012, Italy assumes that the economic resources already transferred to the World Bank will allow the purchase of about 3.42 MtCO2 per year. This assumption seems unrealistic, despite the economic downturn; prices are expected to vary between EUR 11 per tonne in 2009 and EUR 14 per tonne in 2010. Expectations for the last two years of the commitment period are forecast around EUR 18 per tonne in 2011 and 2012. Therefore, these prices will result in an equivalent purchase of a much lower amount.
CRITIQUE
Climate change is one of the greatest challenges facing Italian energy policy makers. Under the EU Burden-Sharing Agreement related to the Kyoto Protocol for the period 2008-2012, Italy is obliged to reduce its GHG emissions by 6.5% compared to 1990, somewhat below the overall EU target of -8%. In 2008 Italy’s emissions were around 12% above 1990 levels, leading to an 18.5% gap with no reversal in the trend expected at this time. Even if Italy rapidly prepares and implements a comprehensive strategy of domestic measures, complemented by an increased use of Kyoto flexible mechanisms, there remains a real possibility that it will default on its obligation, jeopardising its credibility in the Kyoto process and the EU Burden-Sharing Agreement as a whole. Therefore, as Italy moves towards 2012, the government needs to strengthen its efforts to reduce GHG emissions.
Measures that can be undertaken by EU member states are largely limited to the residual emissions in non-ETS sectors and to non-emitting activities, including buildings and transport as well as non-CO2 greenhouse gases. In Italy, the share of non-ETS emissions as regards CO2 stands at more than 60% and is high by EU comparison, thus leaving the majority of the responsibility to achieve reductions with the government. Consequently, measures to be taken should be targeted on reducing energy intensity even further by realising energy savings in these sectors.
To improve supply security in the electricity sector, Italy is strongly investing in power generation among which large new coal-fired capacities are planned, but this is likely to make any future target compliance even more difficult if carbon capture and storage (CCS) technologies are not included and other CO2-free generation technologies, such as renewable energy, do not increase rapidly. The government is planning new nuclear power plants and is also encouraging investment in CSS technology. It will have to consider that
© O
EC
D/IE
A, 2
010

39
these changes, however positive, will not be able to contribute in any way to achieving the 2012 target and are likely to have only a limited impact on the 2020 targets and, even then, only if active measures are implemented soon. In the period up to 2020, the Italian electricity sector therefore faces the prospect of having to purchase increasing volumes of emission credits, leading to a further increase in the already high costs of electricity in Italy.
Policy post-2012 is defined within the framework of the European Union 2020 targets. For the post-Kyoto period until 2020, the EU Commission’s effort-sharing proposal for Italy of -13% compared to 2005 levels (-21% in the ETS sector for the whole of Europe) is within the average of the obligations to be taken by comparable EU member states. By effectively introducing this new reference year 2005, the proposal is especially beneficial to member states that, like Italy, in 2005 have missed progress to their reduction target by a large margin. The government must take advantage of this opportunity and implement measures to place Italy on a credible path towards 2020. In this regard, the recent announcement that the Ministry for the Environment, Land and Sea is to prepare an extraordinary energy efficiency plan and the establishment of a National Emissions Trading Committee are a positive start. Improved energy efficiency policy has the potential, not only to reduce emissions, but also to lower costs and the growing dependence on fossils fuels, as well as to place a greater focus on the transport sector where progress to date has been limited.
RECOMMENDATIONS
The government of Italy should:
Rapidly step up efforts to comply with Kyoto obligations, specifically by ◗
developing and implementing a comprehensive short-term strategy for the years until 2012.
Place a strong emphasis on reducing emissions not covered by the EU-ETS ◗
and target policy on these areas. The government must also complement this policy with a plan for greater use of flexible mechanisms for expected shortfalls of domestic measures; establish a robust monitoring mechanism in order to be constantly aware of its performance against the target.
Establish and implement a policy framework in line with the agreed EU ◗
target of -20% by 2020; establish a favourable environment for the required investments and activities by assessing domestic emissions reduction potentials in all sectors; and make the necessary changes in the policy framework at all levels of government to involve sub-national government authorities.
© O
EC
D/IE
A, 2
010

© O
EC
D/IE
A, 2
010

ENERGY EFFICIENCY
OVERVIEW
Italy, when compared to other IEA countries, has traditionally had low energy intensity, (i.e. the ratio between overall energy demand and GDP), and also low CO2 emissions per GDP. While these indicators have constantly fallen in other IEA member countries over the last two decades, progress in Italy has slowed, and it now lies largely within the IEA Europe average. Despite this apparent long-term trend, energy intensity fell by 1.9% over the period 2002 to 2007. This decrease was most marked in the 2005 to 2007 period when energy intensity dropped by 4.8%.
Italy’s total final consumption of energy (TFC) in 2007 was 139.3 Mtoe. The transport sector was the largest consumer of energy in 2007, accounting for 30% of the total. Industry’s share was almost 26% while other sectors including residential accounted for 37% of the total. By way of comparison, the average OECD Europe equivalents in 2007 were 23% for industry, 33% for transport and 34% for other sectors including residential. The Italian government expects energy intensity to show a significant decrease in the period from the present to 2030, in line with the trends of other industrialised countries.
Figure 9
Energy Intensity in Italy and in Other Selected IEAMember Countries, 1973 to 2010
(toe per thousand USD at 2000 prices and purchasing power parities)
0.00
0.10
0.20
0.30
1975 1980 1985 1990 1995 2000 2005 2010
Italy
Spain
IEA Europe*
Greece
* excluding Luxembourg and Norway throughout the series, as forecast data are not available for these countries.Sources: Energy Balances of OECD Countries, IEA/OECD Paris, 2009; National Accounts of OECD Countries, OECD Paris, 2009 and country submissions.
9
04
41
© O
EC
D/IE
A, 2
010

42
Figure 10
Total Final Consumption of Energy by Sector and by Source,1973 to 2030
Industry SectorMtoe
Mtoe
0
Oil
Gas
Combustiblerenewablesand waste
Coal
Electricity
Heat
0
Residential/Commercial Sector Oil
Gas
Combustiblerenewablesand waste
Coal*
Electricity
Geothermal*
Solar*
Heat
Transport Sector
Oil
Gas
Combustiblerenewablesand waste
Coal*
Electricity
Mtoe
0
40
20
80
60
20
40
60
80
20
40
60
80
1975 1980 1985 1990 1995 2000 2005 2010 2015 2020 2025 2030
1975 1980 1985 1990 1995 2000 2005 2010 2015 2020 2025 2030
1975 1980 1985 1990 1995 2000 2005 2010 2015 2020 2025 2030
* negligible.Sources: Energy Balances of OECD Countries, IEA/OECD Paris, 2009 and country submission.
10
© O
EC
D/IE
A, 2
010

43
Table
Summary of the Main Energy Trends in Italy from 2002 to 2007
2007 2002/2007Growth rate, %
GDP (euro million 2000) 1.284.868 + 5.5 %
TPES (Mtoe) 194.45 + 3.4 %
Primary energy intensity (toe/euro million 2000) 151.4 –1.9 %
TFC (Mtoe): 144.1 + 5.7 %
– Industry– Transport– Households, commerce, public authorities, etc.
41.0
44.6
43.4
+ 2.5 %
+ 3.7 %
+ 8.5 %
Electricity intensity (toe/euro million 2000) 20.70 + 3,5 %
Sources: MSE, ISTAT and Gestore della rete di trasmissione nazionale (GRTN).
POLICIES AND MEASURES
The Italian Administration views energy efficiency as a policy priority. As a member of the G8 Group of countries, Italy has agreed to participate in the establishment of the International Partnership for Energy Efficiency Co-operation (IPEEC), which will create a forum for sharing best practices in energy efficiency among participating nations. While national policy is increasingly guided by EU directives and non-binding goals, Italy has some scope with which to meet its targets and how to implement them.
In recent years, the Italian Administration has put in place a number of amendments to energy efficiency policy, some of which have had a significant impact. In July 2007, the National Energy Efficiency Action Plan 2007 (NEEAP) was notified to the European Commission. In addition, the transposition of other relevant European directives has continued and many of these changes have been supported by changes in fiscal law. The white certificate scheme was amended by Inter-ministerial Decree late in December 2007. Significantly, the transposition of EU Directive 2006/32 on Energy End-Use Efficiency and Energy Services into domestic law has continued, commencing with Legislative Decree no. 115/2008, which designates ENEA, among its other tasks, as the national agency for energy efficiency. ENEA has been tasked with developing a means to co-ordinate policies and measures adopted by the State and regions. This is needed in order to avoid inefficient use of resources and, in particular, double funding of renewable energy incentives by leaving it to participants whether to take advantage of the national incentive schemes or, if appropriate, of regional incentive schemes.
3
© O
EC
D/IE
A, 2
010
44
Domestically, Italy’s Budget Laws of 2007 and 2008, as well as the National Energy Efficiency Action Plan (NEEAP) established a commendable shift towards strengthening energy efficiency policy. The NEEAP introduced an overall energy efficiency target of 9.6% to 2016 and the Budget Laws of 2007 and 2008 introduced a tax rebate of 55% for energy efficiency refurbishment works in the building sector. Other measures are currently being considered pursuant to European directives on energy labelling, on the promotion of co-generation, the eco-compatible design of products and energy end-use efficiency. Initiatives relating to technological innovation for energy efficiency in the Industry 2015 Programme for the development of competitiveness are also worth noting.
In addition, Directive 2005/32/EC Establishing a Framework for the Setting of Eco-design Requirements for Energy-Using Products will also improve the energy efficiency of all new products outside the transport sector. This directive – which Italy transposed by means of legislative decree 201/2007 – should have a particular impact by targeting the efficiency of air-conditioning systems. Indirectly, further efficiencies will also be achieved in heavy industry and in the heat and power sector as a result of the implementation of the EU-ETS.
NATIONAL ENERGY EFFICIENCY ACTION PLAN
In accordance with Article 14(2) of the Directive 2006/32/EC on Energy End-Use Efficiency and Energy Services, European Union member states were required to submit their first National Energy Efficiency Action Plan (NEEAP) to the European Commission by the end of June 2007.
These action plans present the national strategy on how each member state seeks to achieve its energy savings objective. In their NEEAPs, member states are required to demonstrate how they intend to reach their indicative energy savings target by 2016, which in the case of Italy is 9.6%. The NEEAPs must also describe how member states intend to comply with the provisions relating to the role of the public sector and the provision of information and advice to final consumers.
Italy’s NEEAP was notified to the European Commission in July 2007. The plan takes into account the measures already adopted under Law no. 296/2006 (the 2007 Finance Act) and other measures implemented in 2006 and 2007. The plan addressess the industrial, residential, tertiary and transport sectors. The Italian Administration maintains that the series of proposed measures and the 9.6% savings target set for 2016 seem reasonably achievable if measures previously adopted (white certificates, requalification of buildings, transport, biofuels, domestic electrical appliances, lighting, industrial motors) continue for the near term and the other measures now being considered or transposed are coherently implemented. The NEEAP also notes that greater efficiency can be achieved by more incisive measures in the urban and non-urban mobility sector but that these have yet to be considered in any detail.
© O
EC
D/IE
A, 2
010

45
Table
National Energy Efficiency Action Plan 2007Target 2010
GWhTarget 2016
GWh
1. Measures in the residential sector:
Thermal insulation improvements in pre-1980 residential buildings 3 489 1 280
Substitution of simple glazing of windows with double glazing 233 930
Replacement of incandescent light bulbs with CFL 1 600 4 800
Substitution of existing dishwasher stock with class A appliances 305 1 060Replacement of existing stock of refrigerators and freezerswith A+ and A++ rated appliances 1 210 3 860Substitution of existing stock of washing machineswith class A appliances 31 410
Installation of efficient electric water-heating equipment 700 2 200
Installation of efficient air-conditioning systems 180 540
Energy-efficient heating systems 8 150 2 675High-efficiency wood boilers and fireplaces 1 100 3 480
2. Measures in the tertiary sector: Energy-efficient heating systems 5 470 1 660
Installation of efficient air-conditioning systems 835 2 510
Efficient bulbs and digital control systems 1 400 4 300Efficient bulbs and digital control systems (public lighting) 425 1 290
3. Measures in the industry sector:
Efficient light bulbs and digital control systems 700 2 200Substitution of Eff2-class electric motors (1 to 90 kW)with Eff1 class
1 100 3 400
Inverters for electric motors (0.75 to 90 kWh) 2 100 6 400
High-efficiency co-generation 2 093 6 280Mechanical vapour compression 5 047 3 257
4. Measures in the transport sector:2009 introduction of energy consumption standards for vehicles (150g/km CO2 average for new vehicles)
3 490 2 326
Total expected energy savings 35 658 126 327
Source: Ministry of Economic Development, July 2007.
OTHER POLICIES
The Budget Laws of 2007 and 2008 provide for the pursuit and extension of fiscal measures to encourage energy efficiency of buildings and energy use equipment. Law no. 99/2009 provides for further measures to promote energy efficiency and proves additional instruments in order to accelerate Italy towards its 20% target. In particular:
4
© O
EC
D/IE
A, 2
010

46
An extraordinary action plan to promote energy efficiency will be put into ●
action by the government, having as time the 2020 targets;
The incentives for high-efficiency co-generation are raised, but a specific ●
ministerial decree is needed in order to fully define them and make them operational;
Administrative procedures for micro and small-scale co-generation plants ●
have been simplified.
LAW NO. 99/2009
The mid-2009 enactment of Law no. 99/2009 provides for an extraordinary energy efficiency plan to be prepared by the Ministry of Economic Development with the support of ENEA. The plan envisages:
Improved co-ordination among central and local administrations; ●
Promotion of sustainable construction and refurbishment of buildings; ●
Monitoring, evaluation and centralised data management systems; ●
Provisions for stimulating the supply of energy services; ●
Incentives for micro and small co-generation systems; ●
Mechanisms apt to boost the demand of white and green certificates; ●
Administrative streamlining for the development of the distributed ●
generation market;
Promotion of the installation of high-efficiency products, components and ●
processes in the building sector, in infrastructures and in the transport industry;
Encouraging autoproduction of energy in SMEs. ●
If successfully developed and implemented, this new plan has the potential to correct many of the perceived shortcomings of the original plan discussed previously. Of particular note are proposals in relation to improved co-ordination and greater efforts to boost the market for green and white certificates.
POLICIES BY SECTOR
HOUSEHOLDS AND BUILDINGS
Energy use in the residential sector accounted for 20% of TFC in 2007. From 1990 to 2005, the residential sector demonstrated the greatest improvements in terms of energy efficiency. The Italian authorities identified the increased
© O
EC
D/IE
A, 2
010
47
availability of higher-efficiency domestic appliances and the use of compact fluorescent lamp bulbs (CFL) as the prime drivers of these gains in energy savings. Further improvements are expected in coming years thanks to the increased use of thermal insulation in older buildings and more efficient air-conditioning systems8 as well as new regulations in relation to the sale of domestic electric appliances.
Measures provided in Budget Law 2007 relevant to energy-saving potential, and for which white certificates are either not suitable or insufficiently effective, include a tax deduction, available to both domestic and commercial consumers of energy, worth 55% of the total amount of expenditures sustained in 2007 to enhance the energy efficiency of buildings. Eligible expenditures include those aimed at reducing thermal losses, the installation of solar collectors for hot water production, the installation of condensing boilers and the construction of high-efficiency buildings. Small building renovations, with a building performance of less than 20% of the energy performance (EP) values, are also eligible.
Budget Law 2008 confirmed the aforementioned fiscal incentives and added further measures including the extension of the 55% tax deduction to 2010 and the expansion of the range of eligible measures to include expenditure related to the replacement of heating plants with heat pump and geothermal low enthalpy systems. The 55% tax rebate is fully monitored by ENEA, so that results in terms of costs, energy saving, number and variety of measures are documented.
A decree issued by the Ministry of Economic Development also provided funding (EUR 8.5 million), to be shared between the regions and autonomous provinces for the implementation of energy audits in public building (public schools, hydropower schemes, public lighting, public buildings or buildings for public use and hospitals), which are unable to benefit from tax deductions.
Directive on the Energy Performance of Buildings
Following its publication in the EU Official Journal in January 2003, the Directive 2002/91/EC on the Energy Performance of Buildings (EPBD) entered into EU law, allowing member states until January 2006 to transpose the directive into domestic building codes. In August 2005 the Italian Council of Ministers approved Legislative Decree no. 192/2005, producing a general framework for the transposition of all EPBD articles in national legislation with the exception of Article 9 (inspection of air-conditioning equipment) where a three-year derogation was requested.
The full enactment of Legislative Decree 192/2005 is the responsibility of the Ministry of Economic Development, in collaboration with the Ministry for the Environment and the Ministry of Infrastructures. Some regions, in
8. ENEA, ODYSSEE, Energy Efficiency database, October 2008.
© O
EC
D/IE
A, 2
010
48
anticipation of national measures, developed their own procedures on minimum requirements and the energy certification of buildings. At present, three regions have implemented an official certification scheme. Furthermore, some local authorities have introduced compulsory criteria for energy certification in their own building regulations.
Recently national guidelines for the energetic certification of buildings were published, in conjunction with two other decrees. Measures were introduced for a nearly complete implementation of the EPBD directive. In fact, the guidelines and the cited decrees provide a complete framework including methodologies for calculating the energy performance of buildings; application of performance standards on new and existing buildings; certification schemes for all buildings; and regular inspection and assessment of boilers, and heating and cooling installations.
In December 2006, the government, by means of Legislative Decree 311/06, revised Legislative Decree 192/05 redefining the minimum requirements for all new buildings. The EPBD requirements were implemented in three stages, corresponding to buildings whose permit requests were made after January 2006, January 2008 and January 2010. The State, the regions and the independent provinces pledged to co-operate within the bounds of their various competences to implement and manage these decrees.
In addition to the transposition of the EPBD directive, Italian law established further additional measures. These included a requirement for all existing and new buildings to produce an energy certificate before sale. Tax benefits related to the subsequent renovation or improvement of such buildings are contingent upon the production of an appropriate energy certificate. Further measures are planned to reduce the thermal demand of new buildings by strengthening the regulations in relation to insulation and an obligation in relation to solar heating.
Domestic electrical appliances
EU Directive 2002/40 made it mandatory for manufacturers to apply an energy label to all major household appliances. It covers lamps, ovens, refrigerators, freezers, washing machines, tumble-dryers and dishwashers. Appliances are classified from A to G, where class A is the most energy-efficient. In 2004, two new classes were introduced: class A+ where electricity use is 25% lower than in class A and class A++ where electricity use is 40% lower. The goal of energy labelling is to inform consumers of the amount of energy the various appliances use. This is in order to promote energy savings by making consumers aware of the real long-term economic advantage resulting from an energy-efficient appliance when compared to a less expensive but also less efficient one.
© O
EC
D/IE
A, 2
010

49
A new energy label is now being defined at European Union level. Moreover, many results are expected following the measures undertaken at European Union level, giving actuation to Directive 2005/32/EC on Eco-design.
INDUSTRY
Specific measures targeted on the industrial sector are found in Budget Law of 2007 including:
A 20% tax deduction of total costs for buying or substituting an electric ●
motor or inverter with a high-efficiency electric motor or inverter (the tax rebate is monitored by ENEA, so that results and costs are well known);
A provision to facilitate the establishment of a revolving fund of ●
EUR 200 million per year to provide financial assistance to the sector.This funding will be used to encourage the installation of higher performance micro co-generation plant, high-efficiency electric motor substitution (more than 45 kW), dinitrogen oxide abatement in industrial processes, and pilot projects for the research and the development of new low-emission or zero-emission energy sources and technologies.
TRANSPORT
Total final consumption of energy in the transport sector in 2007 was 41.36 Mtoe, or 29.7% of TFC, 95% of which was accounted for by road transport. In recent years the road transport sector has demonstrated significant progress. This improvement is due principally to the increased efficiency of motor cars, 10.3%, despite having an IEA Europe high of0.6 motor cars per capita and historically strong development of inter-city road infrastructure. This contrasts with the limited development of rapid urban transit rail systems, which has created a higher reliance on cars in Italy. Nonetheless, these improvements have been offset to some extent by a decrease in the efficiency of the road haulage fleet owing partly to lower load factors when compared to other IEA countries. Other modes of transport recorded greater levels of improvement but they form a much smaller part of the transportation balance.
Budget Law 2007 included provisions for the establishment of a Sustainable Mobility Fund of EUR 90 million per year for three years (2007-2009) to provide incentives for the enhancement of energy efficiency and the environmental sustainability of motor vehicles. These incentives are available in the form of a financial assistance for the replacement of polluting passenger cars and goods vehicles with new less polluting vehicles and incentives for the purchase of passenger cars and goods vehicles utilising natural gas or liquefied petroleum gas. The fund was also made available for the improvement of the efficiency of goods transport and delivery; the setting-up and/or improvement
© O
EC
D/IE
A, 2
010

50
of methane, hydrogen, electricity and LPG distribution networks; and the promotion of urban cycling paths.
A number of measures to reduce the share of individual road transport in urban areas have been adopted; some of them target traffic management in major towns, while others examine new mechanisms for funding the development of sustainable urban mobility. Examples include the restrictions on the use of private vehicles in some city centres and the funding of initiatives linked with the development of sustainable urban mobility. Budget Law 2008 foresees greater funding available for local public transport via an additional excise tax on motor fuels.
CROSS-CUTTING MEASURES
WHITE CERTIFICATES
The most relevant domestic cross-sectoral initiative in Italy is the Energy Efficiency Certificates scheme, more commonly known as the white certificate scheme. The scheme is an ambitious instrument to take advantage of Italy’s energy efficiency potential, aimed at promoting energy efficiency and delivering emissions reductions across all energy end-use sectors.
White certificates were established by a decree of the then Ministry of Productive Activities issued jointly with the Ministry of Environment and Land Protection, in July 2004.9 White certificates, which are issued by Gestore del Mercato Elettrico (GME), the electricity market operator, are valid for five years starting from the year of reference. The certificates have a value of one tonne of oil equivalent and are available in three forms:
Type I certifying the achievement of savings in primary energy through ●
actions aimed at reducing the final consumption of electricity.
Type II certifying the achievement of savings in primary energy through ●
actions aimed at reducing the consumption of natural gas.
Type III certifying the achievement of savings in primary energy through ●
actions other than those specified under Type I and Type II.
The certificates are issued by GME to distributors, their subsidiaries and to companies operating in the energy services sector (ESCOs – energy services companies), so as to provide certification of the reduction in consumption achieved through targeted interventions aimed at increasing energy efficiency.
9. Ministerial Decree of July 2004 on electricity, Ministerial Decree of July 2004 on gas, as amended and supplemented by a ministerial decree of December 2007.
© O
EC
D/IE
A, 2
010
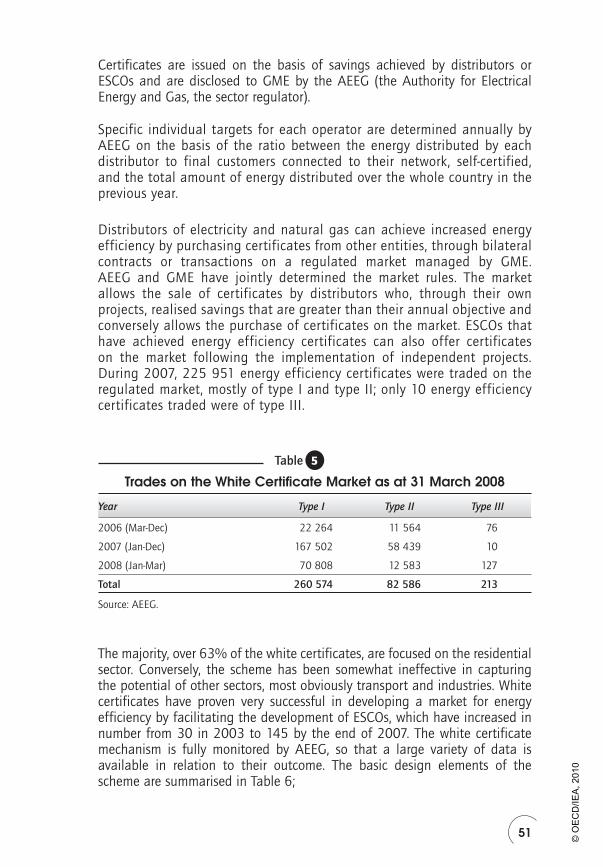
51
Certificates are issued on the basis of savings achieved by distributors or ESCOs and are disclosed to GME by the AEEG (the Authority for Electrical Energy and Gas, the sector regulator).
Specific individual targets for each operator are determined annually by AEEG on the basis of the ratio between the energy distributed by each distributor to final customers connected to their network, self-certified, and the total amount of energy distributed over the whole country in the previous year.
Distributors of electricity and natural gas can achieve increased energy efficiency by purchasing certificates from other entities, through bilateral contracts or transactions on a regulated market managed by GME. AEEG and GME have jointly determined the market rules. The market allows the sale of certificates by distributors who, through their own projects, realised savings that are greater than their annual objective and conversely allows the purchase of certificates on the market. ESCOs that have achieved energy efficiency certificates can also offer certificates on the market following the implementation of independent projects. During 2007, 225 951 energy efficiency certificates were traded on the regulated market, mostly of type I and type II; only 10 energy efficiency certificates traded were of type III.
Table
Trades on the White Certificate Market as at 31 March 2008
Year Type I Type II Type III
2006 (Mar-Dec) 22 264 11 564 76
2007 (Jan-Dec) 167 502 58 439 10
2008 (Jan-Mar) 70 808 12 583 127
Total 260 574 82 586 213
Source: AEEG.
The majority, over 63% of the white certificates, are focused on the residential sector. Conversely, the scheme has been somewhat ineffective in capturing the potential of other sectors, most obviously transport and industries. White certificates have proven very successful in developing a market for energy efficiency by facilitating the development of ESCOs, which have increased in number from 30 in 2003 to 145 by the end of 2007. The white certificate mechanism is fully monitored by AEEG, so that a large variety of data is available in relation to their outcome. The basic design elements of the scheme are summarised in Table 6;
5
© O
EC
D/IE
A, 2
010

52
Table
Basic Elements of the White Certificate Scheme beforethe Changes Introduced in December 2007
Subject Effect
National target 2.9 Mtoe/year in 2009 (*)Compliance period: annual – Regulatory period: 2005–2009 (*)Banded: at least 50% of savings have to be delivered via measures on electricity and natural gas uses (*)
Obliged parties Electricity and natural gas distributors; initially only those serving at least 100 000 customers as to 31 December 2001 (*)Apportionment rule: respective market share (*)
Eligible projects All end-use sectors plus small photovoltaic systems and some measures concerningand measures intermediate natural gas uses Only “hard” measures (i.e. technology change); information campaigns only if add-on to
specific “hard” measures Early actions: projects developed as early as 2001 provided they have not been granted
government, regional or local funding Other restrictions: some restrictions apply to projects that have access to other government
incentives (e.g. CHP plants with access to green certificates, PV plants with access to feed-in tariffs)
Minimum project size, but bundling of projects allowed with some restrictions
Eligible parties a) All electricity and natural gas distributors; (that can be b) Companies controlled by electricity and natural gas distributors;granted certificates) c) Energy service providers (including, but not limited to ESCOs) (*)Measurement Method of accreditation: savings are accredited ex post as opposed to lifetime-discountedand verification accreditationmethods (M&V) Crediting lifetime: generally 5 years; 8 years for heating and air-conditioning M&V methods: a) deemed savings; b) engineering methods (partially ex post);
c) Complete monitoring plans approved ex ante by the regulator (AEEG). Regularly updatedAdditionality: only savings achieved over and above market trends or legislative requirements are certified – Verification and accreditation body: regulator (AEEG)
Certificates Issuing body: electricity market operator upon AEEG authorisationTypes of certificates: a) for electricity savings (type I); b) for natural gas savings (type II); for savings of other fuels (type III)Unrestricted banking in the first regulatory period (*)
Trading On a specific spot market or over the counterMarket rules defined by the electricity market operator and approved by the regulatorWho can operate: eligible parties plus market intermediaries (i.e. traders)
Non-compliance Financial penalty for non-compliance with targets defined by AEEGregime General criteria governing the quantification of the penalty set in advance,
but no predefined unit penalty (e.g. euro/toe not saved). According to its institutional law (Law no. 481/95); for the purposes of carrying out its functions AEEG can levy fines ranging from a minimum of approximately EUR 25 000to a maximum of approximately EUR 155 million
Cost recovery Designed and administered by: AEEGLevel: EUR 100 per toe; can be updatedEligible parties: obliged distributorsEligible costs: costs related to electricity and natural gas savings; up to the occurrence of the target; including costs of purchased certificates
Elements marked (*) were modified as from January 2008.Source: Ministry of Economic Development, 2007.
6
© O
EC
D/IE
A, 2
010
53
DECEMBER 2007 REVISIONS TO THE SCHEME
In December 2007, in order to increase the transparency of over-the-counter (OTC) trading of white certificates, AEEG introduced an obligation for distributors to register the price at which each OTC trade is concluded, together with an obligation to provide the regulator with information on the main content of each bilateral contract concluded to meet their targets, e.g. overall contracted volumes, criteria for price formation and update mechanisms (in the case of multi-year contracts).
At the same time, the government introduced further revisions to the scheme with the aim of rebalancing the market and promoting the development of new investments in energy efficiency measures. The major changes introduced were:
The targets for the years 2008 and 2009 were increased and new targets ●
were set for the period 2010 to 2012.
The 50% constraint was removed. ●
A mechanism for “automatic adjustment” of future targets in case of ●
significant supply surplus was introduced.
The energy efficiency obligation was extended to all electricity and natural ●
gas distributors that serve at least 50 000 customers.
The apportionment rules were revised so as to allow the entire national ●
target to be allocated to obliged parties.
Certain industrial and non-industrial customers ( ● e.g. public bodies, commercial customers) have been granted access to white certificates for measures developed to reduce their own energy consumption and provided they have an energy manager.
A 2008 AEEG study into the effectiveness of the scheme concluded that its overall benefit greatly outweighed its cost. Taking into account only energy savings that were certified by the AEEG, savings are six to ten times higher than costs: in electricity savings can be measured in EUR 600 to 800 per toe and in liquid fuels, EUR 1 200 to 1 600 per toe; these figures compare to the current refund to obliged distributors (EUR 100 per toe) and tothe current price of energy efficiency certificates on the market (EUR 32 to 98 per toe).
Despite these revisions to the scheme, which demonstrated an ability from government to adapt to the previous shortfalls in the scheme, the government has not conducted a much needed cost-benefit evaluation of the mechanism although an evaluation of the scheme has been conducted in the private domain.
© O
EC
D/IE
A, 2
010

54
Box 1
IEA G8 Energy Efficiency RecommendationsAt the Group of Eight* (G8) Summit in 2005 in Gleneagles, Scotland, the G8 countries asked the IEA to assist in developing and implementing energy efficiency policies. Responding to this request, the IEA subsequently prepared a set of energy efficiency policy recommendations covering25 fields of action across seven priority areas: cross-sectoral activity, buildings, appliances, lighting, transport, industry and power utilities. These 25 recommendations were presented to the summit of the G8 in Hokkaido, Japan in July 2008. The fields of action are outlined below.
1. The IEA recommends action on energy efficiency across sectors. In particular, the IEA calls for action on:
Measures for increasing investment in energy efficiency. ●
National energy efficiency strategies and goals. ●
Compliance, monitoring, enforcement and evaluation of energy ●
efficiency measures.Energy efficiency indicators. ●
Monitoring and reporting progress with the IEA energy efficiency ●
recommendations themselves.
2. Buildings account for about 40% of energy used in most countries. To save a significant portion of this energy, the IEA recommends action on:
Building codes for new buildings. ●
Passive energy houses and zero-energy buildings. ●
Policy packages to promote energy efficiency in existing buildings. ●
Building certification schemes. ●
Energy efficiency improvements in glazed areas. ●
3. Appliances and equipment represent one of the fastest growing energy loads in most countries. The IEA recommends action on:
Mandatory energy performance requirements or labels. ●
Low-power modes, including stand-by power, for electronic and ●
networked equipment.Televisions and set-top boxes. ●
Energy performance test standards and measurement protocols. ●
4. Saving energy by adopting efficient lighting technology is very cost-effective. The IEA recommends action on:
Best-practice lighting and the phase-out of incandescent bulbs. ●
Ensuring least-cost lighting in non-residential buildings and the ●
phase-out of inefficient fuel-based lighting.
© O
EC
D/IE
A, 2
010
55
CRITIQUE
The National Energy Efficiency Action Plan (NEEAP) introduced an overall energy efficiency target of 9.6% to 2016, providing the policy framework for the non-EU-ETS sectors. The Budget Laws of 2007 and 2008 introduced, among other incentives, a tax rebate of 55% for energy efficiency refurbishment processes in the residential sector and a 20% tax rebate for high-efficiency electric motors and inverters. Finally, the white certificate scheme, introduced in 2001 and further amended in 2004 and 2007, successfully promotes the development of a market for energy efficiency products and services.
5. About 60% of world oil is consumed in the transport sector. To achieve significant savings in this sector, the IEA recommends action on:
Fuel-efficient tyres. ●
Mandatory fuel efficiency standards for light-duty vehicles. ●
Fuel economy of heavy-duty vehicles. ●
Eco-driving. ●
6. In order to improve energy efficiency in industry, action is needed on:Collection of high-quality energy efficiency data for industry. ●
Energy performance of electric motors. ●
Assistance in developing energy management capability. ●
Policy packages to promote energy efficiency in small and ●
medium-sized enterprises.
7. Energy utilities can play an important role in promoting energy efficiency. Action is needed to promote utility end-use energy efficiency schemes.
Implementation of IEA energy efficiency recommendations can lead to huge cost-effective energy and CO2 savings. The IEA estimates that, if implemented globally without delay, the proposed actions could save around 8.2 Gt CO2/yr by 2030. This is equivalent to one-fifth of global energy-related CO2 emissions in 2030 under the IEA Reference Scenario, in which no new policies are adopted or implemented. Taken together, these measures set out an ambitious road-map for improving energy efficiency on a global scale
* The Group of Eight is an international forum for the governments of Canada, France, Germany, Italy, Japan, Russia, the United Kingdom and the United States.
© O
EC
D/IE
A, 2
010

56
The tradable white certificate scheme, which Italy pioneered, is an ambitious instrument aimed at realising the country’s energy efficiency potential. The promotion of the scheme has proven successful in developing a market for energy efficiency. The majority of savings are realised in the residential sector, however, indicating that the scheme has not been fully effective in capturing the potential of the transport and industry sectors, while over 90% of savings originates from measures undertaken under the simplified approval stream, which are again heavily focused on the residential sector. It is likely that different incentives are needed in the industrial and transport sectors, and the government should consider developing them. Also, despite the recent revision to the scheme which demonstrated the ability of the government to improve its shortcomings, the government and AEEG should continue to carry out regular cost-benefit evaluations to ensure that the scheme continues to be the most efficient means of delivering its targets. The scheme would benefit further from the development of complementary, structural initiatives, aimed at facilitating the access of consumers to information on energy saving opportunities. Further efforts should be made to encourage the financial sector to play an active role in the development of energy-saving projects.
The commendable efforts by government and regulator to improve the working of the scheme are compromised by the absence of government action on the specific measures recommended both by the last in-depth review and the recent G8 recommendations, mainly in the transport sector (see Box 1). Progress on the monitoring and evaluation of policies has been made, in particular on tax rebate and white certificate mechanisms, but an overall knowledge of measures and results undertaken at various institutional levels is still lacking.
The NEEAP represents a large step for the promotion of energy efficiency in Italy. Nevertheless, it remains unclear how many of the proposed savings will be achieved in reality or if the plan can deliver the significant levels of savings, apart from those proposed by means of the white certificate scheme. The savings in the framework of the scheme have been certified by AEEG and exceed the 2010 target. Measures, such as the replacement of incandescent lamps, form the major part of the savings, but recently, more relevant projects, regarding industry and the public sector, have been implemented. Furthermore, the planned extraordinary energy efficiency plan outlined in Law no. 99/2009 should result in the development of a more comprehensive and consistent, evidence-based energy efficiency strategy and address many of the shortomings of existing arrangements.
One indicator for potential risks from the absence of such a strategy is the overlapping of incentives. In this regard, a provision of the recently introduced Legislative Decree 115/08 is a positive step. The provision means that, apart from white certificates, other national incentives cannot be added to regional incentives, unless specifically authorised by ministerial decree.
© O
EC
D/IE
A, 2
010

57
Given the nature of the Italian summer, it is important that the government consider and prepare to adopt measures aimed at improving the efficiency of air-conditioning systems. The forthcoming legislation to be completed at European level (i.e. Directive 2005/32/EC10) should contribute to improving the efficiency of air-conditioning equipment recently put on the market, but specific measures are still needed to speed up the replacement of the old and inefficient ones. The Italian government must consider what steps it can take in this regard. It should also place additional emphasis on reducing air-conditioning demand by, for example, encouraging the diffusion of passive cooling techniques and to continue the ongoing process of improvement of the energy performance of buildings.
To improve energy efficiency, the IEA also urges the government to continue its work in making the national and EU policies fully consistent with the policy recommendations the IEA presented to the Group of Eight (G8). The IEA energy ministers endorsed the initial 16 measures in 2007. Since then, nine new recommendations have been added (see Box 1).
RECOMMENDATIONS
The government of Italy should:
Designate ENEA as national energy efficiency monitoring agency in order to ◗
evaluate, monitor and assess the cost-effectiveness of all energy efficiency policies. The willingness to provide ENEA with this task should be fully implemented.
Conduct a cost-benefit analysis of the white certificate scheme as soon as ◗
possible, at the end of the first regulatory period as suggested by most stakeholders.
Progress with the implementation of the extraordinary energy efficiency plan ◗
set out in Law no. 99/2009.
10. Directive 2005/32/EC of the European Parliament and of the Council with regard to eco-design requirements for no-load condition electric power consumption and average active efficiency of external power supplies. The no-load condition is the condition in which the input of an external power supply is connected to the mains power source, but the output is not connected to any primary load.
© O
EC
D/IE
A, 2
010

© O
EC
D/IE
A, 2
010

PART II
SECTOR ANALYSIS
© O
EC
D/IE
A, 2
010

© O
EC
D/IE
A, 2
010
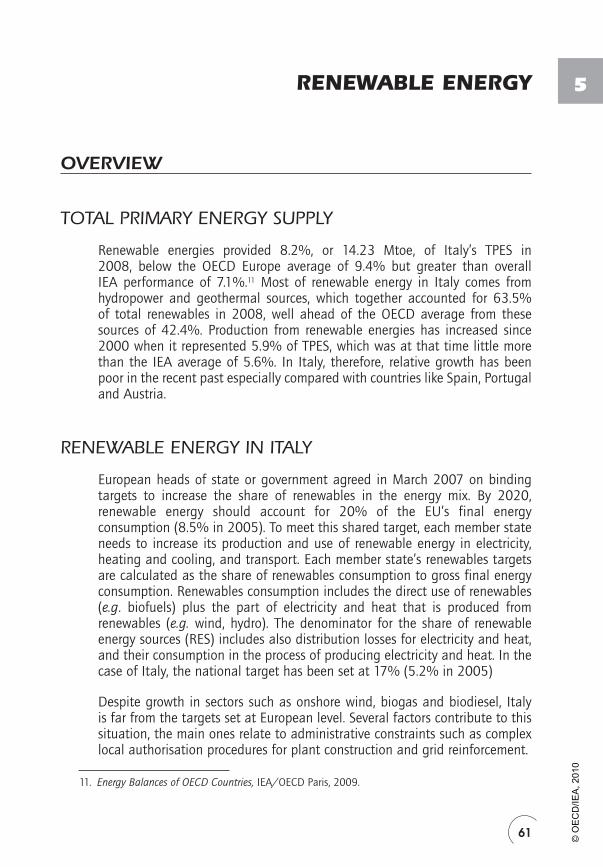
0
61
RENEWABLE ENERGY
OVERVIEW
TOTAL PRIMARY ENERGY SUPPLY
Renewable energies provided 8.2%, or 14.23 Mtoe, of Italy’s TPES in 2008, below the OECD Europe average of 9.4% but greater than overall IEA performance of 7.1%.11 Most of renewable energy in Italy comes from hydropower and geothermal sources, which together accounted for 63.5% of total renewables in 2008, well ahead of the OECD average from these sources of 42.4%. Production from renewable energies has increased since 2000 when it represented 5.9% of TPES, which was at that time little more than the IEA average of 5.6%. In Italy, therefore, relative growth has been poor in the recent past especially compared with countries like Spain, Portugal and Austria.
RENEWABLE ENERGY IN ITALY
European heads of state or government agreed in March 2007 on binding targets to increase the share of renewables in the energy mix. By 2020, renewable energy should account for 20% of the EU’s final energy consumption (8.5% in 2005). To meet this shared target, each member state needs to increase its production and use of renewable energy in electricity, heating and cooling, and transport. Each member state’s renewables targets are calculated as the share of renewables consumption to gross final energy consumption. Renewables consumption includes the direct use of renewables (e.g. biofuels) plus the part of electricity and heat that is produced from renewables (e.g. wind, hydro). The denominator for the share of renewable energy sources (RES) includes also distribution losses for electricity and heat, and their consumption in the process of producing electricity and heat. In the case of Italy, the national target has been set at 17% (5.2% in 2005)
Despite growth in sectors such as onshore wind, biogas and biodiesel, Italy is far from the targets set at European level. Several factors contribute to this situation, the main ones relate to administrative constraints such as complex local authorisation procedures for plant construction and grid reinforcement.
11. Energy Balances of OECD Countries, IEA/OECD Paris, 2009.
5
© O
EC
D/IE
A, 2
010

62
INCENTIVE MECHANISMS
In relation to electricity, the main supporting tool is the obligation, imposed on large electricity generators and importers, to produce, or buy the rights to, a certain amount of electricity produced from renewables (RES-E) by plants that entered into operation after 1 April 1999. Law no. 99/2009 establishes that, starting from 2011, the cited obligation must also be imposed on electricity traders.
In general, in order to promote RES-E, Italy has adopted the following schemes:
● Priority access to the grid system is granted to electricity from RES and CHP plants.
An obligation for large electricity generators and importers to feed a ●
given proportion of new RES-E into the power system. In 2008, the target was 3.8%. In case of non-compliance, sanctions are available, but in practice, enforcement is considered difficult owing to ambiguities in the legislation.
Tradable green certificates (tradable commodities proving that a certain ●
volume of electricity is generated from new RES) are used to fulfil theRES-E obligation.
Production from small plants (wind up to 200 kW and other sources, ●
except solar, up to 1 MW) benefits for 15 years from fixed feed-in tariffs or premium tariffs (lasting 20 years for PV, and concentrating solar power, lasting 25 years.)
Heating can participate in the white certificate scheme, which grants ●
tradable certificates to eligible energy savings. Moreover solar thermal and biomass heating plants can benefit, until 2010, from a 5-year shared tax deduction of up to 55% of total costs.
A fully operational scheme is in force for biofuels, including a minimum ●
quota obligation on petrol and diesel oil distributors. Subsidies are in place for bioethanol production and a number of tax exemptions on limited amounts of biodiesel and bioethanol production are available until 2010.
A number of regional and local governments have also introduced some measures to promote heating from RES. These have taken the form of incentives for solar thermal heating and compulsory installation of solar panels in new or renovated buildings (which was also introduced by means of Legislative Decree 192/2005 on buildings, but is not yet applicable).
Additional tools are available to support innovation, technology capability development and innovative infrastructures such as smart grids.
© O
EC
D/IE
A, 2
010

63
Fi
gure
11
Rene
wa
ble
Ene
rgy
as
a P
erc
ent
ag
e o
f To
tal P
rima
ry E
nerg
y Su
pp
ly, 1
973
to 2
008*
0
% 1973
1975
1977
1979
1981
1983
1985
1987
1989
1991
1993
1995
1997
1999
2001
2003
2005
2007
Co
mb
ust
ible
ren
ewab
les
and
was
te
Hyd
ro
Sola
r**
Geo
ther
mal
Win
d
369 * 20
08 =
est
imat
es.
** n
eglig
ible
.So
urce
: Ene
rgy
Bala
nces
of O
ECD
Cou
ntrie
s, IE
A/
OEC
D P
aris
, 200
9.
11
© O
EC
D/IE
A, 2
010

64
Fi
gure
12
Rene
wa
ble
Ene
rgy
as
a P
erc
ent
ag
e o
f To
tal P
rima
ry E
nerg
y Su
pp
ly in
IEA
Me
mb
er C
oun
trie
s, 2
008*
050 40 30 20 10
Win
d
Geo
ther
mal
Hyd
ro
Co
mb
ust
ible
ren
ewab
les
and
was
te
Sola
r, o
ther
**
Nor
way
New
Zea
land
Cana
da
Austr
ia
Denm
ark
Finl
and
Italy Fr
ance
Germ
any
Austr
alia
Belg
ium
Czec
h Re
publ
ic
Unite
d St
ates
Spain
Luxe
mbo
urg
Japa
n
Hunga
ry
Greec
e
Ireland
Net
herla
nds
Unite
d Ki
ngdo
mKo
rea
Portu
gal
Switz
erland
Turk
ey
Slova
k Re
publ
ic
Swed
en
%
Poland
* es
timat
es.
** o
ther
incl
udes
tid
e, w
ave
and
ambi
ent
heat
use
d in
hea
t pu
mps
.So
urce
: Ene
rgy
Bala
nces
of O
ECD
Cou
ntrie
s, IE
A/
OEC
D P
aris
, 200
9.
12
© O
EC
D/IE
A, 2
010
65
LEGAL FRAMEWORK
LEGISLATIVE DECREE 387/03
Legislative Decree 387/03 implementing Directive 2001/77/EC on the Promotion of Electricity Produced from Renewable Energy Sources (RES-E) entered into force in February 2004. It set out a national framework for the promotion of renewable energy sources, particularly for production from micro-generation plants. The decree adopted the definition of renewable energy sources and electricity produced from renewables as contained in Article 2 of the directive. The decree established a timetable for the periodic reporting, review and monitoring, by the Ministry of Productive Activities (now the Ministry of Econonmic Development), of progress towards the implementation of the objectives consistent with the directive. It also established, for the period 2005-2007, a 0.35% annual rate of increase of the minimum share of distributed electricity produced from renewable energy sources that should be exported to the national grid. Finance Law 2008 increased this share to 0.75% per year from 2007 to 2013, reaching 7.55% in 2013.
Sanctions were set down for non-compliance, to be applied by AEEG, on the basis of the reports from the electricity market operator GSE (Gestore dei Servizi Elettrici). The decree provided for the adoption of legislation and criteria (minimum requirements, possibility to accumulate incentives, preferential tariffs, capacity targets, and use of green certificates) for granting incentives to power produced from solar energy. The decree included specific provisions which favoured biomass and hybrid plants (i.e. those producing part of their power from renewables) over fossil fuel plants in dispatching.
A five-year programme on research and development measures to support renewables and energy efficiency was also established. Regional targets for renewables-based electricity were encouraged and regional governments were permitted to establish their own programmes to support renewables. The decree also addressed the issue of certification of origin for electricity produced from renewables, which can be requested from GSE for generation plants producing more than 100 MWh per year. Conditions under which the electricity produced can be sold in the power market or purchased by GSE were set out. Specific rules were set for the streamlining of authorisation procedures for plants and infrastructure devoted to power production from renewables.
BUDGET LAW 2007
Budget Law 2007 provided for various fiscal incentives and financial measures to encourage renewable energy, improve energy efficiency and reduce emissions. Measures included fiscal incentives for enhancing energy efficiency
© O
EC
D/IE
A, 2
010
66
and use of renewable energy in buildings. Solar thermal and, in some cases, biomass heating plants could benefit, during 2007, of a three-year shared tax deduction up to 55% of total costs
The same law introduced the minimum quota obligation for biofuels and a reduction of duty for a certain amount of biofuels used for transport. On the basis of this minimum quota obligation, petrol and diesel oil for transport must be blended with a quota of biofuels equal to 2% in 2008 and 3% starting from 2009. Moreover, some tax subsidies were introduced for limited quantities of bioethanol, which grant a reduction of 50% of excise tax, and biodiesel, granting an 80% reduction. The ministerial decrees needed to actuate the cited measures are all in force. Furthermore, because most part of the minimum quota obligation is being fulfilled using biodiesel, Lawno. 99/2009 introduced the possibility to increase the maximum amount of the biodiesel content in diesel oil used for transport from 5% to 7% in the retail distribution system.
A revolving fund applicable from 2007 to 2009, with an annual budget of EUR 200 million, was established to finance a number of GHG emissions reduction measures including high-performance micro co-generation plants; electricity and heat production from small-scale renewable energy sources; high-efficiency electric motors (more than 45 kW); improving end-use energy efficiency in the civil sector; research and development in new technologies; and low- or zero-emission energy sources. A ministerial decree actuating the law was approved in mid-2009.
BUDGET LAW 2008
The 55% fiscal incentive for enhancing energy efficiency and use of some RES-heating in buildings was maintained in Budget Law 2008 which also extended the deadline of expenditures from December 2007 to 2010 to give investors the chance to choose from three to ten the number of years for a 55% tax deduction. It also widened the range of eligible measures in the building sector, by adding measures concerning the replacement of heating plants with heat pumps and geothermal low-enthalpy systems. All measures have been confirmed by Law 2/2009.
Budget Law 2008 included a number of measures relating to the production of electricity from renewable energy sources. It provided for a review of the green certificate system applying to power plants of 1.0 MW or more of generating capacity and the introduction of feed-in tariffs for small-scale generation plants.
The revisions concerning green certificates were twofold. First, the incentive period was raised to 15 years. Secondly, the number of certificates issued may vary depending on the renewable source used, according to a coefficient,
© O
EC
D/IE
A, 2
010

67
multiplicative of energy produced. These coefficients are: 1.0 for wind plant, 1.1 for offshore wind generation, 0.9 for geothermal, 1.8 for tidal and wave, 1.0 for hydroelectric, 1.8 for biomass from short chain, 1.1 for other biomass and 0.8 for biogas. At the same time, the value of a green certificate was capped at EUR 180 per MWh (consisting of the combined value of the green certificate and average electricity market price).
Apart from solar, which retains premium tariffs, other small-scale renewable energy power plants (<200 kW for wind power; 1.0 MW for other sources) have the option to choose feed-in tariffs differentiated by energy source and available for 15 years. The feed-in tariffs vary by fuel source and are worth between EUR 180 and EUR 300 per MWh.
The same law tries to streamline authorisation procedures, help grid connections and give more responsibility to regions through burden-sharing of 2012 European targets. Though the latter provision was enforced by Law no.13/2009, which established a burden-sharing criterion based on the European 2020 target, this law, as well as that concerning authorisation procedures, is still to be actuated by ministerial decree. Conversely, in December 2008 the Minister of Economic Development, in agreement with the Minister for the Environment, Land and Sea approved a decree allowing full operation of the new incentives to electricity from renewables.
RECENT LEGISLATION
Law no. 99/2009, approved in mid-2009, introduced a variety of measures concerning renewables, among which:
With effect from 2011, the green certificate obligation will be transferred ●
from producers and importers to electricity traders;The green certificate coefficient for offshore wind was raised to 1.5; ●
The feed-in tariff for biomass up to 1.0 MW was raised from EUR 22 cents ●
per kWh to EUR 28 cents per kWh, while the green certificate coefficient for biomass greater than 1.0 MW was raised to 1.3; The government may also open the market for geothermal energy research ●
and exploitation for electricity production and simplify geothermal energy use for heating.
ELECTRICITY GENERATED FROM RENEWABLES
The share of renewables expressed as a percentage of total electricity consumption in Italy declined from 20% in 2002 to less than 18% in 2007. Over the same period, total electricity production increased by 9.2% to 314.4 GWh, with the bulk of incremental demand being met by gas-fired
© O
EC
D/IE
A, 2
010
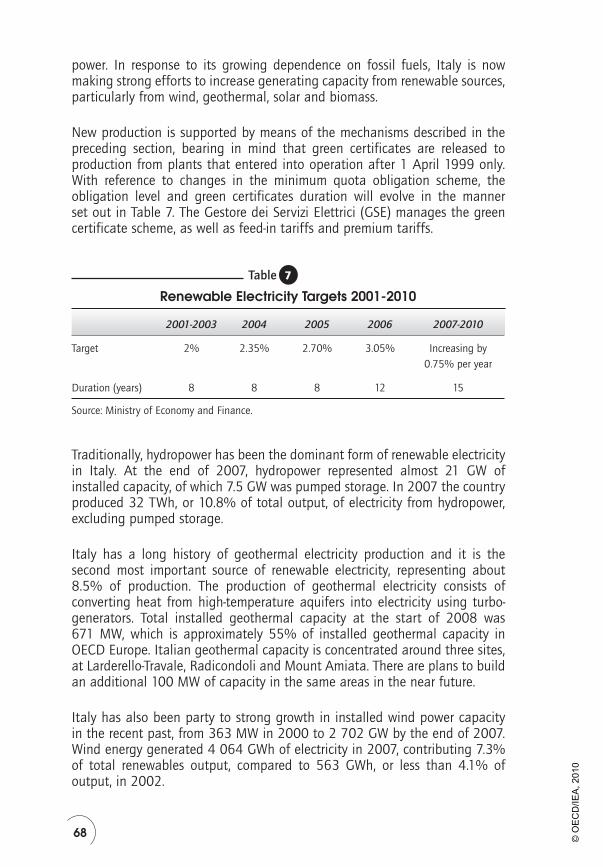
68
power. In response to its growing dependence on fossil fuels, Italy is now making strong efforts to increase generating capacity from renewable sources, particularly from wind, geothermal, solar and biomass.
New production is supported by means of the mechanisms described in the preceding section, bearing in mind that green certificates are released to production from plants that entered into operation after 1 April 1999 only. With reference to changes in the minimum quota obligation scheme, the obligation level and green certificates duration will evolve in the manner set out in Table 7. The Gestore dei Servizi Elettrici (GSE) manages the green certificate scheme, as well as feed-in tariffs and premium tariffs.
Table
Renewable Electricity Targets 2001-2010
2001-2003 2004 2005 2006 2007-2010
Target 2% 2.35% 2.70% 3.05% Increasing by0.75% per year
Duration (years) 8 8 8 12 15
Source: Ministry of Economy and Finance.
Traditionally, hydropower has been the dominant form of renewable electricity in Italy. At the end of 2007, hydropower represented almost 21 GW of installed capacity, of which 7.5 GW was pumped storage. In 2007 the country produced 32 TWh, or 10.8% of total output, of electricity from hydropower, excluding pumped storage.
Italy has a long history of geothermal electricity production and it is the second most important source of renewable electricity, representing about 8.5% of production. The production of geothermal electricity consists of converting heat from high-temperature aquifers into electricity using turbo-generators. Total installed geothermal capacity at the start of 2008 was 671 MW, which is approximately 55% of installed geothermal capacity in OECD Europe. Italian geothermal capacity is concentrated around three sites, at Larderello-Travale, Radicondoli and Mount Amiata. There are plans to build an additional 100 MW of capacity in the same areas in the near future.
Italy has also been party to strong growth in installed wind power capacity in the recent past, from 363 MW in 2000 to 2 702 GW by the end of 2007. Wind energy generated 4 064 GWh of electricity in 2007, contributing 7.3% of total renewables output, compared to 563 GWh, or less than 4.1% of output, in 2002.
7
© O
EC
D/IE
A, 2
010

69
Biomass plants, including CHP and non-CHP plants, generated 827 GWh in 2000 and by 2007 this had increased to 3 810 MWh. Italy has also invested in new technologies; solar thermal electricity generation that has the potential to use solar radiation at higher efficiency rates and more competitive costs when compared to fossil fuel generation and second-generation biomass technologies are just two examples.
Installed photovoltaic (PV) capacity grew by nearly 250% in the period from 1995 to 2007, producing 38 GWh of electricity in 2007. In 2005, the government issued a decree defining the criteria for promoting electricity generation by PV solar plants. The decree defined the PV projects that may benefit from special tariffs for a period of twenty years. This decree was revised and updated in February 2007.
TRADABLE GREEN CERTIFICATESThe tradable green certificate (TGC) system is a cap-and-trade mechanism to promote renewable energy sources. The system is based on the obligation, imposed on energy companies that export at least 100 GWh per year to the grid, to supply a given percentage (3.05% in 2007 of the energy produced in 2006) of renewable electricity. To certify this supply, generators must present a corresponding number of green certificates, each equivalent to 50 MWh of renewable energy production. The average price of the green certificates between 2003 and 2007 was EUR 101.1 per MWh. Green certificates are traded on a market organised by GME.
Table
Transactions on the GME Green Certificate Market, 2007 to Q1 2008
Trading period Year Green certificates traded (MWh)
Average price(EUR/MWh)
2004 450 129.51
2005 8 400 141.56
2006 376 950 145.96
2007 2007 24 300 118.45
2006 9 050 104.36
2007 344 147 98.78
2008 (January-March) 2008 2 390 87.97
Source: AEEG, 2008.
Green certificates can be issued both to the obligated generators and to other power producers. The obligated companies can decide to invest in renewable energy or to purchase green certificates from the market. A guarantee of
8
© O
EC
D/IE
A, 2
010
70
origin is issued on top of a green certificate. The guarantee of origin is not linked to the national green certificate system.
Renewable energy plants that came into operation before 31 December 2007 can obtain green certificates for 12 years. Those that came into operation after that date can obtain green certificates for 15 years, a provision contained in the Finance Act 2008.
Budget Law 2008 introduced a new evaluation system for green certificates that are assigned to each plant by applying technology-specific coefficients to annual electricity production. The enforcement of the scheme is a mandate of both GSE and AEEG. More specifically, the GSE verifies and certifies the amount of green certificates surrendered by each operator with a RES obligation. In case of negative findings, the operator has 30 days to integrate the amount of missing green certificates. In case of non-compliance, the GSE informs the AEEG. Further action, such as administrative sanctions (suspension or termination of the electricity licence), is possible and may be agreed by the Regulatory Authority and the competent ministry.
The GSE, by definition, has a strong influence on the green certificate market. It intervenes if the green certificate market is “short” or “long”. When the market is short, the GSE may sell green certificates produced at eligible RES plants from previous support schemes at a fixed price. In recent years the market has always been short although that shortfall is decreasing. In case of an excess of green certificates on the market (long market), the GSE is mandated to purchase excess certificates at the yearly averaged price of the previous year. In 2007 the price of green certificates was around EUR 130 per MWh.
Box 2
Gestore dei Servizi ElettriciThe Gestore dei Servizi Elettrici (GSE) plays a central role in encouraging, promoting and developing renewable energy sources in Italy. The company has a single shareholder, the Ministry of Economy and Finance, which exercises its shareholder rights together with the Ministry of Economic Development (that has responsibility for operational guidelines). GSE itself is the parent of two other companies: Gestore del Mercato Elettrico (GME) and Acquirente Unico (AU). GME is the body that organises and manages transactions in the electricity market, including trade in green certificates.Following the establishment of Terna as the transmission system operator (TSO) in 2004, GSE has become focused on managing, promoting and stimulating the production of electricity from renewable sources, an activity that it previously carried out in part. GSE is also responsible for issuing the guarantee of origin (European Directive 2001/77/EC on the promotion of electricity produced from renewable energy sources in the internal electricity market) and for the renewable energy certificate system (RECS). These certificates are international voluntary instruments giving evidence of electricity generation from renewable sources. To enhance the role of GSE in the promotion of renewable energy, AEEG designated it as “implementing body” for promoting electricity generation through photovoltaic conversion of the solar source.
© O
EC
D/IE
A, 2
010

71
HEAT GENERATION FROM RENEWABLES
As yet, no national policy framework exists to support the production of heat from renewable sources. Instead Italy has introduced an alternative instrument for its promotion by means of integrating renewable heat installations in the white certificate scheme. This scheme grants tradable certificates to eligible energy-saving and efficiency measures, such as solar thermal collectors, geothermal heat pumps, biomass systems, district heating and CHP plants, on the basis of specified saving factors. Renewable sources produced 9 828 terajoules (TJ) of heat in 2007, more than in 2006 (9 776 TJ) but well below the 2005 output of 13 338 TJ.
Also, VAT reductions, income tax credits, several programmes offering investment subsidies, particularly for solar-thermal technologies, and policy measures offering guidance in terms of renewable heat technology deployment are in place in Italy. The most effective measure is the income tax credit on any expenditure on renewables or energy efficiency installations in buildings.
TRANSPORT FUELS FROM RENEWABLES
Legislative Decree 128/2005, and the Budget Laws of 2007 and 2008, implemented Directive 2003/30/EC on the Promotion of the Use of Biofuels or Other Renewable Fuels for Transport. The decree set national targets for biofuels consumption evaluated as a share of total diesel and gasoline consumption in the transport sector. In 2008, Italy produced an estimated 634 000 tonnes of biodiesel, a 300% increase on 2007 production (202 000). Excise tax reduction and exemption apply to biodiesel, bioethanol and vegetable oil for energy use. The 2008 Budget Law set an indicative target of 3% by 31 December 2009. Target percentages for 2008 (2.5%) and 2010 (5.75%) are in line with the 2003 EU directive. The percentage for 2007 was set at 1%. A recent government report to the EU on the implementation of the directive noted that Italy had failed to meet the target.12 The ratio of biofuels to diesel and petrol combined in 2007 was 0.53% despite favourable tax incentives.
CRITIQUE
Italy has considerable renewable energy potential from a number of sources. Traditionally, it made good use of its resource potential, most notably the use of hydropower and geothermal energy to generate electricity. Nonetheless,
12. Directive 2003/30/EC of 8 May 2003 on the Promotion of the Use of Biofuels or Other Renewable Fuels for Transport. Fulfilment of information obligations pursuant to Article 4 (2007), Italy submission, 27 June 2008.
© O
EC
D/IE
A, 2
010

72
hydropower production, representing more than two-thirds of present renewable electricity output, has fallen from over 50 TWh in 1990 to 38 TWh in 2007, as a result of water regulation, ageing of plants, and reduced levels of precipitation. To fill the gap in production, output from other renewables, especially wind power and photovoltaics, has emerged since 2000 but growth remains behind other EU countries.
In the past, several factors have contributed to the lack of non-electricity renewables. First, obstacles such as complex authorisation procedures at local level and grid connection constraints often resulting in high costs have slowed growth. Secondly, geographic constraints due to the mountainous and unfertile terrain and demographic constraints due to vast, densely populated areas further complicate the deployment process. In relation to complex authorisation procedures, Law no. 99/2009 will require the Ministry of Economic Development to publish standardised procedures by which the competent administrations assess renewable resources and the needed authorisations for construction and operation of facilities.
Directive 2009/28/EC on the Promotion of the Use of Energy from Renewable Sources requires that 20% of EU energy supply must come from renewable sources by 2020. Compared with today’s renewable energy share of final energy consumption of circa 7%, the 17% share agreed by the EU Commission for Italy as part of the 2020 target-sharing mechanism is ambitious despite being set at a level below the average necessary increase in comparable EU member states. Furthermore, the target includes heating, cooling and the use of renewables in transport, and limited attention has been paid to these sectors in Italy to date.
Conversely, the existing financial incentive regime for investment in renewables in Italy is favourable by international comparison. It has been revised several times since the 1999 change from a feed-in tariff to a tradable green certificate (TGC) system for new renewables, with a minimum quota that has to be met by large electricity producers (and importers) and that will be, starting in 2007 and lasting until 2012, increased by 0.75% of gross electricity consumption per year. It stands at 5.3% in 2009 and will increase to 7.55 % in 2012. The estimated cost of the TGC system stood at EUR 306 million per year in 2007, EUR 400 million in 2008 and will pass the 1 billion mark in 2013. Adding to this, the former incentive scheme CIP 6/92, which is being phased out, adds a further EUR 2.4 billion per year to the electricity bill. The AEEG estimates that in the next 12 years, by the time the CIP 6/92 is completely phased out, the overall cost will be EUR 16 billion and possibly more if the newly planned municipal waste incinerators do, as foreseen, benefit from the scheme. In general, incentives seem to be excessive and if these estimates are borne out, they could risk public acceptance of renewable electricity in Italy.
While the TGC system is now technology-banded, it appears that levels of differentiation, especially with regard to the factors of 1.0 for onshore and of
© O
EC
D/IE
A, 2
010
73
1.1 for offshore wind, may be insufficient. (Recently enacted Law no. 99/2009 has made provisions for an amendment by increasing the multiple applicable for offshore wind to 1.5.) In 2008, the TGC incentive was capped at EUR 180 per MWh (consisting of the combined price from TGC and average electricity market price), reducing excessively high levels of compensation (TGC prices in 2008 are consistently below EUR 100 per TGC). In parallel, there is a separate feed-in premium regime for photovoltaics (with a premium of EUR 360 to 490 per MWh depending on size and building integration of the system) and a feed-in tariff for small installations (less than 200 kW for wind power; less than 1.0 MW for other sources) with technology-differentiated tariffs of between EUR 180 and EUR 300. Therefore, Italy is applying a mix of support systems which appears to fail to address the underlying causes of slow growth in RES-E provision.
The high levels of support for RES are the result of one of the major deficiencies in the Italian RES strategy, problems with spatial planning and authorisation procedures. These functions remain the responsibility of municipalities, provinces and regions, while the responsibility for achieving growth in renewable energy to meet the EU 2010 indicative target for the electricity sector (as well as a future mandatory target for renewable energy in final energy consumption in 2020) rests with central government and has not yet been shared with the lower administrative levels. The problems with authorisation procedures have been highlighted as a key reason for stalled investment and limited growth in renewable energy. Further changes in law, however, as a result of recent changes to budget law may address some of these concerns. High grid connection costs and cumbersome interconnection procedures constitute further barriers to renewable electricity deployment.
In relation to heating and cooling and biofuels, Italy has much work to do. There is significant potential for the large-scale conversion of solar radiation for heating and cooling purposes. Some support exists for heating by means of Decree Law no. 192/2005, which obliges private and public buildings to derive heating and power from renewable energy sources. Tax deduction for solar-thermal plants and biomass heating, even if very generous, will end on 31 December 2010 and no further effective measures have yet been defined for the next period, at present the white certificates not being sufficient. Given the increased use of air-conditioning systems in the summer period, there remains a considerable potential for the use of renewables for cooling. Pilot projects in Turin and Alessandria funded under the EU Concerto programme provide some indication as to the potential in Italy.
Policy makers must also consider developing mechanisms to stimulate demand and expand the availability and attractiveness of biofuels, for example by making use of biofuels in public vehicle fleets where public procurement laws allow, and greater incentives to private car users. Concerning biofuels, though the existing minimum quota system is, in principle, adequate to pursue
© O
EC
D/IE
A, 2
010
74
European targets, it needs a proper graduated quota update, with careful attention paid to food and industrial sector effects. Alternatively, stronger incentives for developing the production and distribution of biofuels and the removal of any barriers to the increased introduction of biofuels need to be encouraged, if necessary using fiscal means.
RECOMMENDATIONS
The government of Italy should:
Ensure that non-economic barriers to the development of renewables, such ◗
as lengthy and unpredictable local authorisation processes at local level, network constraints and high grid-connection costs are minimised and where possible removed.
Reform and simplify the tradable green certificate scheme and implement a ◗
coherent and consistent set of incentive mechanisms for renewable energies, including a review of the present structure of the feed-in tariffs to ensure that consumers are getting the best value for money in return for their investment.
Begin to focus greater effort on the non-electricity renewable sectors when ◗
meeting its targets.
© O
EC
D/IE
A, 2
010

0
75
ELECTRICITY
OVERVIEW
Italy is IEA Europe’s fourth-largest electricity consumer after Germany, France and the United Kingdom. Net domestic electricity production in 2007 was 301.3 TWh, an increase of approximately 1.2% over the previous year, while final consumption over the same period increased very marginally from 308.8 TWh to 309.3 TWh. In 2007, imports of 48.9 TWh, largely from France and Switzerland, bridged the shortfall between production and demand. A high level of import dependence, some 15.6% of final consumption in 2007, marks the Italian electricity market as being different from many other large European electricity markets. Gas-fired generation accounted for 52% of electricity output in 2007 and held a 48% share of generating capacity.
Severe blackouts in 2003 stimulated the government into taking steps to increase security of electricity supply and attract additional investment to the sector. This has resulted in significant investment in new generation plants and a gradual reduction in the share of the generation market held by Enel, the previous incumbent. While Enel still remains a major player in the market, the government-owned share has been greatly reduced, to 31.2% from more than 60% at the time of the last review in 2003. The transmission network is owned and operated by Terna, the independent transmission system operator.
The generation mix is likely to change over the coming years as plans to convert existing coal- and oil-fired power stations to alternative fuels, including cleaner coal-fired plants, emerge. Currently, an additional 7 GW of gas-fired capacity is under construction while another 5 GW is either authorised or planned. The conversion of almost 2.5 GW of oil-fired plant to coal is also planned in the short term.
SUPPLY AND DEMAND
Italy maintained close to 88.9 GW of installed capacity and at the end of 2007, oil- and gas-fired generation made up little over 63% of generating capacity, with the large share of gas, 42% or 38 GW, placing additional stress on an already tight gas system. Hydropower, although static in growth terms, still retains a large share of the generation portfolio, 21 GW or almost 24%. Likewise, coal maintains a small but stable share of 8 GW or 9%. The remaining balance comes from other renewable sources, mainly wind, geothermal and combustible renewables and waste.
6
© O
EC
D/IE
A, 2
010

76
Final consumption of electricity in Italy in 2007 was 309.3 TWh, a slight increase on 2006 consumption levels but less than half the rate of increaseof previous years. Seasonal peaks in 2007 reached 56 589 MWh in summer and 56 810 MWh in winter. Demand tends to peak in July owing to air-conditioning load and in winter because of space-heating demand in the north. Electricity consumption per capita in 2007 was 5 216 kWh, relatively unchanged from the previous year. This compares favourably with theOECD average of 7 802 kWh and slightly below the OECD Europe average of 5 640 kWh per capita. The industrial sector is the largest consumer of electricity, using 142.2 GWh in 2007, followed by the commercial and public services sector (79.9 TWh) and residential consumers (67.2 TWh). Small volumes are also consumed by the transport sector (10.4 GWh) and the agriculture and fisheries sector (5.7 TWh).
Imports from Europe supplement domestic output to meet the balance of demand. Imports in 2007 were 48.9 GWh, an increase of 5% on 2006 levels and almost 16% of final consumption, making Italy one of the most import-dependent IEA member countries. Imports come from Switzerland (59%), France (31%) and Slovenia (7%) and the remaining volumes from Austria and Greece. Conversely, Italy exported small volumes of electricity, 2 648 GWh in 2007, mainly to France, Greece, Switzerland and Slovenia.
Figure 13
Electricity Generation by Source, 1973 to 2030
0
100
200
300
400
600
500
1975 1980 1985 1990 1995 2000 2005 2010 2015 2020 2025 2030
Oil
Nuclear
Gas
Coal
Combustiblerenewablesand waste
Hydro
Solar*
Wind
Geothermal
TWh
Net imports
* negligible.Sources: Energy Balances of OECD Countries, IEA/OECD Paris, 2009 and country submission.
13
© O
EC
D/IE
A, 2
010
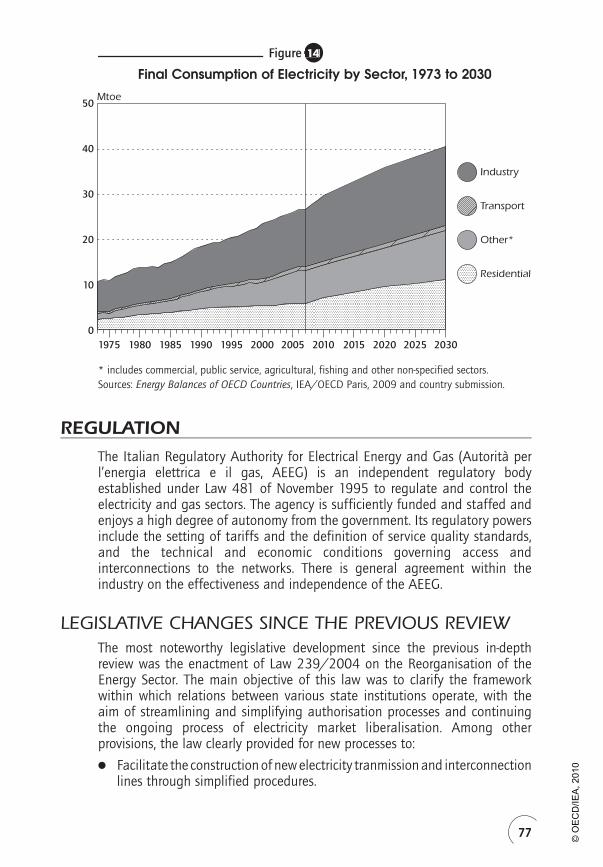
77
Figure 14
Final Consumption of Electricity by Sector, 1973 to 2030
0
20
10
30
40
50
1975 1980 1985 1990 1995 2000 2005 2010 2015 2020 2025 2030
Industry
Transport
Other*
Residential
Mtoe
* includes commercial, public service, agricultural, fishing and other non-specified sectors.Sources: Energy Balances of OECD Countries, IEA/OECD Paris, 2009 and country submission.
REGULATION
The Italian Regulatory Authority for Electrical Energy and Gas (Autorità per l’energia elettrica e il gas, AEEG) is an independent regulatory body established under Law 481 of November 1995 to regulate and control the electricity and gas sectors. The agency is sufficiently funded and staffed and enjoys a high degree of autonomy from the government. Its regulatory powers include the setting of tariffs and the definition of service quality standards, and the technical and economic conditions governing access and interconnections to the networks. There is general agreement within the industry on the effectiveness and independence of the AEEG.
LEGISLATIVE CHANGES SINCE THE PREVIOUS REVIEWThe most noteworthy legislative development since the previous in-depth review was the enactment of Law 239/2004 on the Reorganisation of the Energy Sector. The main objective of this law was to clarify the framework within which relations between various state institutions operate, with the aim of streamlining and simplifying authorisation processes and continuing the ongoing process of electricity market liberalisation. Among other provisions, the law clearly provided for new processes to:
Facilitate the construction of new electricity tranmission and interconnection ●
lines through simplified procedures.
14
© O
EC
D/IE
A, 2
010

78
Strengthen the rules for dealing with electricity emergencies. ●
Intensify actions to diversify energy sources, including through exploration ●
for, and exploitation of hydrocarbons.
Foster the increased use of renewable sources, distributed electricity ●
production and the clean use of coal.
In addition, significant arrangements to ensure greater co-ordination between the State, the regions and the autonomous provinces have been established within the framework of Law 239/2004. The law is intended to provide further clarification on the responsibilities of the regions and central government. The intention of the change is to facilitate timely investment in energy-related infrastructure by obliging the regions to respect a maximum 180 days delay in replying to applications for authorisation of new energy infrastructures. The law also provides additional authority to central government should the regional government not respect the above obligation.
A further change since 2003 was the introduction of Law no. 125/2007 completing the implementation of EU Directive 2003/54/EC. This law introduced a number of additional measures to complete the electricity market liberalisation process. Among other changes, the law enforced the mandatory legal unbundling of distributors and suppliers (for distribution companies with at least 100 000 end-users), established a framework for the regulation of merchant power lines and introduced a vulnerable customers service.
Law no. 99/2009, enacted in mid-2009, introduced many simplifications to procedures related to the construction of electricity grid infrastructure, concerning, in particular, the management of situations where a disagreement between State and regions is recognised. Moreover, the authorisation procedures for large power stations now include those grid enforcements needed to assure that the grid can accept the output of such plants. The same law introduced a process to accelerate greater integration of the Italian electricity market with Europe. Approximately 2 000 MW of new interconnector capacity will be constructed by Terna, involving direct connections to large electricity consumers. A subsequent law, Law no. 102 of 3 August 2009, intervenes where new grid and power station infrastructure are necessary for social and economic development. The Council of Ministers can nominate a superintendent appointed to complete all procedures needed to authorise the infrastructure construction.
INDUSTRY STRUCTURE
GENERATION
While the government has taken a number of measures to reduce the stature of Enel in the generation market, the company remains Italy’s largest power generator and is among Europe’s largest utilities when measured by installed capacity.
© O
EC
D/IE
A, 2
010
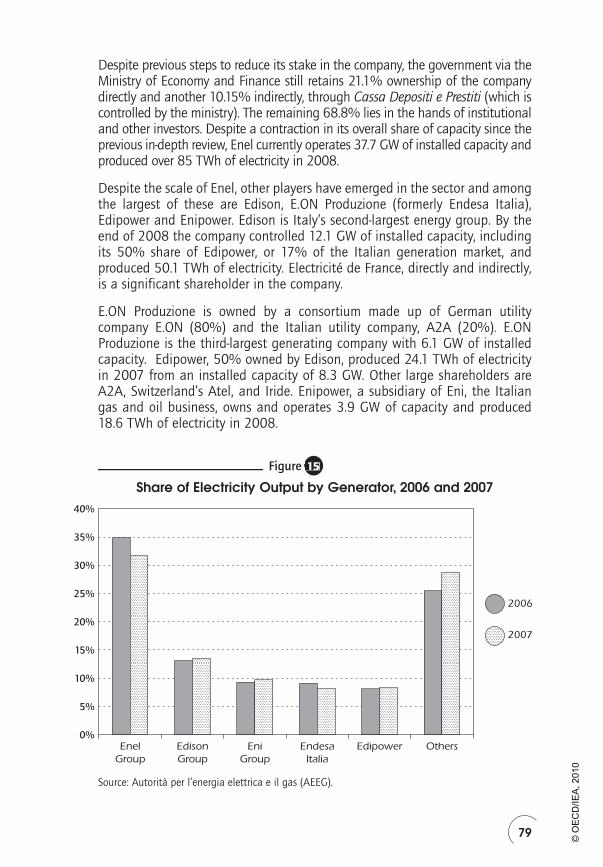
79
Despite previous steps to reduce its stake in the company, the government via the Ministry of Economy and Finance still retains 21.1% ownership of the company directly and another 10.15% indirectly, through Cassa Depositi e Prestiti (which is controlled by the ministry). The remaining 68.8% lies in the hands of institutional and other investors. Despite a contraction in its overall share of capacity since the previous in-depth review, Enel currently operates 37.7 GW of installed capacity and produced over 85 TWh of electricity in 2008.
Despite the scale of Enel, other players have emerged in the sector and among the largest of these are Edison, E.ON Produzione (formerly Endesa Italia), Edipower and Enipower. Edison is Italy’s second-largest energy group. By the end of 2008 the company controlled 12.1 GW of installed capacity, including its 50% share of Edipower, or 17% of the Italian generation market, and produced 50.1 TWh of electricity. Electricité de France, directly and indirectly, is a significant shareholder in the company.
E.ON Produzione is owned by a consortium made up of German utility company E.ON (80%) and the Italian utility company, A2A (20%). E.ON Produzione is the third-largest generating company with 6.1 GW of installed capacity. Edipower, 50% owned by Edison, produced 24.1 TWh of electricity in 2007 from an installed capacity of 8.3 GW. Other large shareholders are A2A, Switzerland’s Atel, and Iride. Enipower, a subsidiary of Eni, the Italian gas and oil business, owns and operates 3.9 GW of capacity and produced 18.6 TWh of electricity in 2008.
Figure 15
Share of Electricity Output by Generator, 2006 and 2007
2007
2006
0%
5%
10%
15%
20%
25%
30%
35%
40%
EnelGroup
EdisonGroup
EniGroup
EndesaItalia
Edipower Others
Source: Autorità per l’energia elettrica e il gas (AEEG).
15
© O
EC
D/IE
A, 2
010

80
Figure 16
Gross Generating Capacity of the Five Largest Generators,2007 (MW)
Hydro
Renewables
Thermal
0Enel
GroupEdisonGroup
EniGroup
EndesaItalia
Edipower
5 000
10 000
15 000
20 000
25 000
30 000MW
Source: Autorità per l’energia elettrica e il gas (AEEG).
There are over 2 500 producers embedded in the Italian electricity system,i.e. those connected directly to the distribution networks. Only a small portion of this generation is wind power and all generators less than 20 kW are unregulated.
TRANSMISSION
The electricity sector, historically dominated by the previous incumbent Enel, was unbundled in November 2005 following the implementation of Decree Law no. 239/03. This legislation resulted in the establishment of Rete Elettrica Nazionale SpA, now known as Terna, as the primary owner and operator of the Italian high-voltage transmission grid. Terna is responsible for the transmission and dispatching of energy throughout Italy. Terna is a public limited company listed on the Borsa Italiana (Italian stock exchange) since 2004. Currently, its major shareholder is Cassa Depositi e Prestiti, the largely state-owned Italian bank, with 29.99% of shares. 34% of the remaining capital is held by other Italian shareholders, while 36% is held by foreign funds.
The company owns 98.3% of the country’s electricity transmission infrastructure, with approximately 39 500 km of lines, 367 transformer and switching stations and 3 remote stations. The share of transmission infrastructure owned
16
© O
EC
D/IE
A, 2
010
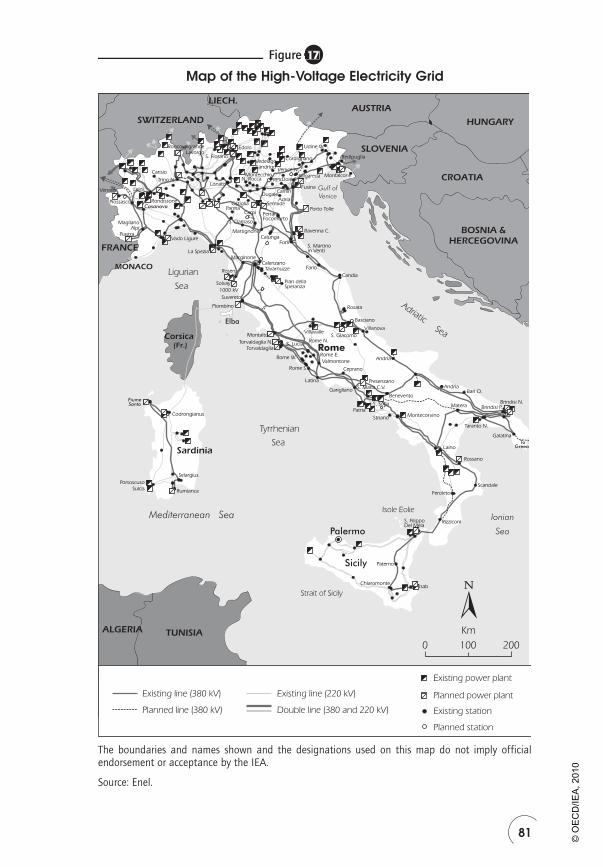
81
Figure 17
Map of the High-Voltage Electricity Grid
Adriatic
Strait of Sicily
Ionian
Sea
TUNISIAALGERIA
Isole Eolie
Sardinia
Corsica
Elba
(Fr.)
Tyrrhenian
Sea
Mediterranean Sea
Sea
Gulf of
Venice
Sea
Isab
Rizziconi
Feroleto
Scandale
Rossano
Laino
Galatina
Brindisi N.Brindisi P.
Taranto N.
Matera
Bari O.Andria
Montecorvino
BeneventoGarigliano
Andria
Latina
Rome W.
Torvaldaglia
Torvaldaglia N.
Montalto
ToGreece
Candia
Fano
S. Martinoin Venti
Ravenna C.
Porto Tolle
BOSNIA &HERCEGOVINA
SLOVENIA
HUNGARY
LIECH.AUSTRIA
CROATIA
SWITZERLAND
Monfalcone
Redipuglia
FiumeSanto
Codrongianus
Selargius
Rumianca
Portoscuso
Sulcis
0 100 200
Km
S. Lucia
Rome S.
Solvay
Suvereto
1000 kV
Udine W.
Salgareda
Fusina
MONACO
FRANCE
Ligurian Rosen TavarnuzzeCalenzano
MarginoneLa Spezia
ForliCalunga
Adria
FerraraFocomorto
Vado LigurePiastra
MaglianoAlpi
Trino N.
S. Fiorano
Lonato
VedelagoSandrigo
Montecchio
Sermide
Dugale
N. Rocca
Martignone
S. Damaso
CarpiParma
OstigliaRondissone
Edolo
Cordignano
RFX
Camin
Venice N.
Dole
Casanova
Leini
Piossasco
Carisio
Piombino
Pian dellaSperanza
Rome
Villanova
Valmontone
VillavalleS. Giacomo
Basciano
Rosara
Rome N.
Rome E.
Striano
S. Sofia
Patria
S. Maria C.V.
Presenzano
Ceprano
Palermo
Sicily Paterno
Chiaromonte
S. FilippoDel Mela
RoncovalgrandeLavorgo
Venaus
Existing line (380 kV)
Planned line (380 kV)
Existing line (220 kV)
Double line (380 and 220 kV)
Existing power plant
Planned power plant
Existing station
Planned station
The boundaries and names shown and the designations used on this map do not imply official endorsement or acceptance by the IEA.
Source: Enel.
17
© O
EC
D/IE
A, 2
010

82
by Terna increased further in 2006, following the acquisition, through a subsidiary company, Rete Trasmissione Locale SpA, of Edison Rete SpA; followed in October 2006 by the acquisition of 99.99% of the capital of AEM Trasmissione SpA. Both of these transactions were approved by the Italian Antitrust Authority. Previously, Edison Rete held approximately 2 800 km of high-voltage power lines and 29 electricity substations located in the north of Italy, while AEM Trasmissione was the owner of approximately 1 100 km of high-voltage power lines and 12 electricity substations, also located in the north. This takeover was consistent with Terna’s strategy of unification of the national transmission grid and in compliance with legislation guiding the restructuring of the energy sector.
In February 2009, the board of Terna approved its 2009–2013 strategic plan. The plan provides for new investment totalling EUR 3.4 billion, 77% of which is for grid development over the period from 2009 to 2013. The principal aim of the plan is to increase interconnection capacity with other countries and reduce grid congestion.
DISTRIBUTION
There are almost 170 electricity distribution companies in Italy, many of which operate at a municipal level only. Decree 79/1999 opened the distribution sector to a gradual rationalisation process, which is set to continue over the coming years. The decree envisaged just one distribution concession for each municipal area and gave local authority companies the option of asking former monopolist Enel to dispose of branches carrying out distribution activities in their municipal area.
Overall, from 2000 to 2005, the reorganisation process has seen the transfer of portions of the distribution network from Enel Distribuzione to 31 local authority companies in 295 municipal areas involving almost two million customers. In this regard, the sale by Enel, in 2006, of the distribution networks of 18 municipalities, or approximately 82 000 customers, to Hera was highly significant.
The reorganisation process has resulted in a reduction in the number of businesses operating in this segment of the market; in 2006 there were169 distribution network operators compared to approximately 200 in 2000. Enel is the largest distribution network operator, distributing approximately 86% of total distributed volumes. Four operators serve more than 500 000 customers: Enel, Electrabel/Acea, AEM Milano and Iride. Conversely, there are 52 operators with less than 1 000 customers and ten of these serve less than 100 withdrawal points.
Law no. 125 of August 2007 added further stimulus to the rationalisation of the sector by providing for the legal unbundling of distribution companies, the networks of which supply at least 100 000 consumers.
© O
EC
D/IE
A, 2
010

83
Table
Distribution of Electricity 2007
Group GWh Share of total (%)
Enel 254 671 86.35
Electrabel/Acea 10 616 3.60
AEM Milano 7 526 2.55
ASM Brescia 4 506 1.53
Iride 3 412 1.16
Trentino Servizi 2 263 0.77
Hera 2 237 0.76
AGSM Verona 1 928 0.65
Others 7 764 2.63
Source: AEEG.
The Single Buyer
Acquirente Unico (AU), or the Single Buyer, is the body the government has vested with the task of purchasing electricity in the wholesale market to meet demand from the protected and safeguarded market. Before retail market liberalisation in July 2007, the Single Buyer was assigned the task of ensuring the supply of electricity to customers in the captive market, in accordance with a decree of the Ministry of Productive Activities of December 2003. Following the full opening of the retail electricity market in July 2007 and pursuant to Legislative Decree no. 73 of 18 June 2007, the Single Buyer emerged as the entity that supplies customers who use the enhanced protection service. Therefore, the Single Buyer is tasked with purchasing power supplies for the protected market.
The Single Buyer is obliged to purchase electricity on the most favourable terms possible and sell it to distributors for supply to final customers, thereby minimising the procurement costs and risks associated with direct purchases on IPEX, the Italian power exchange. The Single Buyer resells purchased electricity to distributors in accordance with AEEG guidelines and revenues earned from such sales enable the Single Buyer to meet its costs. Acquirente Unico is 100% owned by the Ministry of Economy and Finance.
Retail market
The retail electricity market in Italy was fully liberalised in July 2007 with the elimination of the so-called captive or regulated market. Before July 2007, it was divided into two segments: the captive market (which included all household customers and eligible non-household customers who chose to
9
© O
EC
D/IE
A, 2
010

84
continue to purchase electricity at regulated tariffs), and the free market (which included those non-domestic customers who chose to change supplier). Previously, only eligible customers (i.e. all non-domestic customers from July 2004) were allowed access to the competitive market. Since July 2007, all users are free to choose supplier, while retaining the right to be supplied at regulated prices.
Law no. 125 of August 2007, which implemented measures set out in Directive 2003/54/EC, provided for the establishment of a protected or universal service for domestic customers and small businesses and also for the establishment of a safeguarding (or supplier of last resort) service for all customers. These measures were introduced to insulate and protect customers from the lack of immediate competition in the market.
The protection service is targeted on domestic customers and small companies that have not signed a contract with an alternative supplier in the open market. On the other hand, customers who, despite not having a supplier on the free market, are not covered by the enhanced protection service, are served through the safeguarding service.
In 2008, following full market opening, sales to domestic protected customers (mercato tutelato) represented 93% of the entire market segment in terms of volume (approximately 64 TWh) and included 82% of all meter points (approximately 17 million customers). Reference tariffs for these customers are determined by the AEEG. Switching activity in the domestic and small customer sector of the market has been very limited. In essence, customers simply moved from one form of regulated market to another.
Despite liberalisation, the market continues to display a high level of concentration. Supply to households and small businesses is dominated by Enel Distribuzione (now Enel Servizio Elettrico), which serves the vast majority of customers (around 80%). A second operator, Electrabel/Acea Elettricità, has a market share of 11% in terms of volumes and 9% in terms of meter points. Other operators have shares that are less than 4% each.
Supply to previously eligible customers is carried out by wholesalers and producers, and trading companies are often integrated with production. In 2007, the sales of the Enel group on the free market were approximately one-quarter of the total in terms of volumes, corresponding to approximately half of the meter points. Other large players are EGL Italia, Edison Energia, Eni Power Trading and Energy. The largest seven operators each reach a percentage in excess of 3% market share and together account for 63% of total sales. Large municipalities account for the remaining share of the market (in particular ACEA Distribuzione in Rome and AEM Elettricità in Milan). It is clear, therefore, that despite the ongoing process of liberalisation, a large proportion of the retail market remains in public hands.
© O
EC
D/IE
A, 2
010

85
Figure 18
Retail Supply Companies Operating on the Free Market,2007 (GWh)
Enel44 717
Edison20 844
Eni12 030
Other companies67 925
Ergon Energia7 566
CIR8 158
Axpo Group10 733
Electrabel/Acea9 706
Source: Autorità per l’energia elettrica e il gas (AEEG).
ELECTRICITY MARKET DESIGN
IPEX, the Italian power exchange operated by GME, was launched in April 2004. It introduced competitive price-setting in the physical spot market for power. Volumes traded grew from 231 TWh in 2004 to 329 TWh in 2007, while over the same period the number of participants in IPEX increased from 73 to 127. IPEX liquidity13 has increased from 29.1% in 2002 to 67.1% in 2007, driven largely by the increase in market participants.
Within the market, three bodies were established with separate distinctive functions:
Terna, the transmission system operator (TSO), is the main owner of the ●
national transmission grid and is also responsible for the safe transmission and dispatch of electricity throughout Italy and for safely managing the balance between electricity demand and supply. Terna is also responsible for grid planning, development activity, and maintenance.
Acquirente Unico (AU) is the single buyer. ●
Gestore del Mercato Elettrico (GME), the market operator, is responsible for ●
organising and managing the electricity market, where the clearing price is determined by the intersection of electricity demand bids with supply offers submitted by market participants.
13. Liquidity is defined by GME as the ratio of volumes of electricity traded by market participants in the day-ahead market to overall volumes of electricity traded in the market.
18
© O
EC
D/IE
A, 2
010
86
The market is also a physical market, where the schedules of electricity injections into and withdrawal from the grid are defined using an economic merit-order criterion.
IPEX can be divided into two sub-markets;
The day-ahead market (MGP), in which hour blocks of energy are exchanged ●
for the following day, is home to the majority of electricity purchase and sale transactions. The adjustment market (MA), which allows operators to make changes to the schedules defined within the MGP by means of further offers to buy or sell.
The balancing market (MSD) or ancillary services follows these two ●
markets; in this market, Terna provides the resources that are necessary to their transmission and dispatching activities and guarantee the security of the electricity system.
The regulations governing dispatching provide for the active participation of demand in all these markets over time, but provisional regulations for 2006 – extended to 2007 and 2008 — provide for the participation of MGP only.
In 2007 a new system, Energy Accounts Platform (Piattaforma Conti Energia), managed by GME on behalf of Terna for the registration of energy sold and acquired with forward energy contracts, was introduced. The system decouples the registration of energy traded (notification of forward energy contract volume) from injections and withdrawals, or the submission to GME of the production and consumption scheduling.
In 2008, two separate futures markets were introduced: on the first, managed by GME, monthly, weekly and daily futures contracts with physical delivery are traded. While on the second, managed by Borsa Italiana (the Italian stock exchange), yearly, quarterly and monthly futures with cash settlement are negotiated.
New rules have been established by means of Law no. 99/2009, in order to further develop existing futures markets for electricity. In particular, on the platform managed by GME new annual contracts will be traded starting from 31 October 2009. Furthermore, the law promotes the interaction between the two platforms in order for the operators to have the option to choose a physical delivery for their futures with cash settlement.
Moreover, Law no. 2/09 introduces an infra-day market (substituting and improving — through the provision of several sessions — the present adjustment market) to be managed by GME starting from 31 October 2009. New rules for a more efficient balancing market are to be implemented from January 2010.
The IPEX is a zonal market, namely, in case of congestion along the grid the Italian market splits into several zones (up to seven) and prices are determined for each zone. While producers receive the zonal price from the market, the
© O
EC
D/IE
A, 2
010

87
demand side of the market pays a single national price regardless of the zone where the withdrawals take place. This price is called prezzo unico nazionale (PUN) and is calculated as the average of zonal prices, weighted on zonal consumption.
Liquidity in Italy is an issue. It is possible to trade without the requirement of having to accept physical delivery, and it was felt that more market players are trying to enter the market. Market participants have raised three concerns: the system price, the limited number of market players and Italy’s growing dependence on gas-fired power generation. Transparency is also a concern as both the TSOs and the balancing market are reluctant to publish data. There is a transparent spot market, but there are few players, and a regulated price system, which is not transparent.
The main efforts to harmonise the Italian wholesale market with those of neighbouring countries are mainly centred in the Central-South electricity REM, the regional energy market launched by ERGEG in spring 2006 and led by the Italian energy regulator AEEG. The Central-South REM aims to integrate Austria, France, Germany, Greece and Slovenia into one electricity regional market: the harmonisation of congestion management rules and market coupling are among its priorities.
TRADE AND TRANSIT, CROSS-BORDER CAPACITYAND INTERCONNECTOR CONGESTION MANAGEMENT
The Italian transmission grid is interconnected to the rest of the European power grid by means of 18 interconnection lines, four with France; nine with Switzerland; one with Austria; two with Slovenia, one underwater direct-current cable with Greece and one underwater direct-current cable between Sardinia and Corsica. Through the interconnection lines along the northern border — seven lines at 380 kV and nine lines at 220 kV — Italy imported approximately 14% of its electricity requirements in 2008.
In view of the significant electricity transit from other countries, the development and improvement of interconnections is particularly important. At present, there are four new interconnection projects planned or under construction: Mendrisio-Cagno and Tirano-Campocologno (Edison) between Italy and Switzerland; Treviso-Lienz between Italy and Austria; and Udine-Okroglo between Slovenia and Italy.
The available transmission capacity (ATC) on each interconnection is offered by the respective auction operator (usually one of the TSOs) at each interconnection point in the form of physical transmission rights (PTRs) through explicit auctions. Separate auctions are held for yearly, monthly and daily PTRs, in each direction for each interconnection, i.e. from Austria, France,
© O
EC
D/IE
A, 2
010

88
Greece, Slovenia, and Switzerland to Italy and from Italy to each border. Auction rules are defined within the activities of ERGEG (Electricity Regional Initiative – Central-South Region).
SECURITY OF ELECTRICITY SUPPLYRegional blackouts in July 2003, followed by a country-wide electricity blackout in September, underlined the fragility of Italy’s electricity system, the growing dependence on imports and the lack of new domestic generating capacity. This stimulated the government into taking steps to encourage the development of new generation by simplifying and streamlining the processes for granting permits for new power plants and taking measures to attract investment in new import infrastructure as well as internal transmission infrastructure.
In response to the July blackouts, the government swiftly introduced Decree Law 158 of 3 July 2003 on “urgent measures to guarantee the secure and continuous supply of electric power”. The decree, in force on an extraordinary basis for 75 days, modified the thermal discharge temperature limits for thermoelectric power stations rated above 300 MW to allow them to stay in production if necessary.
In response to an extended dry spell and very high temperatures and fearing another blackout, the government intervened once again to alter the operating conditions of Italy’s thermoelectric plants and introduced further emergency legislation. Decree Law 239 of 29 August 2003 on “urgent measures for the security of the national electric system and for the recovery of electric power” provided that thermoelectric plants rated above 300 MW were allowed to operate until 31 December 2004 outside the emission and air quality standards laid down in their authorisation documents, although within the emission limits for plants smaller than 500 MW as set by European law.
While no further weather-induced blackouts occurred over the summer period, a system-wide outage happened on the night of 27-28 September 2003. In response, when Decree 239/03 was converted into law, the Cabinet was given special authorisation to ensure the achievement and maintenance (including for the medium term) of the economic conditions needed to guarantee the sufficient production of electric power. Specifically, within two months it had to come up with a competitive system for the remuneration of generating capacity, as well as measures to streamline, unify and simplify the procedures for building network infrastructures. In practice, the conversion of the decree into law was an opportunity to pass energy planning legislation as well.
In addition to extending the permission to exceed emission limits granted by Decree Law 239/03 until 30 June 2005, the conversion measure (Law 290 of 2003) gave the government broad authorisation with respect to:
Rescheduling production by hydroelectric plants, concentrating maintenance ●
on and reactivating moth-balled plants, and increasing interruptible capacity in order to reduce the risk of widespread outages;
© O
EC
D/IE
A, 2
010
89
Reunifying grid ownership and management, to be followed by privatisation ●
and guarantees of an independent grid.
In relation to the grid and the latter point above, the Cabinet was asked to establish the criteria, procedures and conditions for uniting the ownership and management of the national transmission grid (by means of a Prime Minister’s decree to be issued within 60 days of the enactment of Law 290/03), and to oversee the resulting body.
The new powers granted by this decree included guidelines for the development of the national electricity and gas transmission networks, the approval of the annual development plans submitted by network operators, the forfeiture of permits for the construction of new power stations and LNG regasification plants if work is not begun within 12 months, the exemption from third-party access of newly built interconnection networks and a simplification to the process for authorisation of electricity transportation networks and generation plants of over 300 MW capacity.
With Legislative Decree 379 of 19 December 2003, “Measures for the remuneration of electricity production capacity”, the government spelled out the need to design a system that would reward generators for making production capacity available, so as to ensure that domestic demand could be met while maintaining the necessary reserves. The system was to be based on competitive, transparent, non-discriminatory mechanisms that will not distort market prices and that will minimise the cost to consumers.
The decree also defines the TSO’s inspection and monitoring duties, and a system of penalties to be enforced by the Regulatory Authority (AEEG). Lastly, it establishes transitional measures for the period before the remuneration system takes effect. In that regard, the Authority established temporary compensation levels for capacity made available at dispatchable plants that are available on the days of the year that the TSO identifies as likely peak days.
In addition, the AEEG also developed a mechanism that offers an incentive for infrastructural investments in the form of extra remuneration of capital investments/development of the grid. This extra remuneration was reconfirmed in the recent review of the transmission tariffs for Regulatory Period III for 2008-2011.
Legislative Decree 55/2002 partly covers the standards contained in Law 239/2004 on the reorganisation of the energy sector. In particular, the decree simplified the authorisation procedure to build stations. Power stations over 300 MW may be declared public utilities and subject to the sole approval of the Ministry of Economic Development, rather than various approvals by other administration bodies.
Municipalities must, however, be consulted during the procedure, which is reduced to 180 days, after which authorisation by the Ministry of Economic Development is sufficient to proceed, if positive, and the agreement is issued by
© O
EC
D/IE
A, 2
010

90
the regions to build the station. Legislative Decree no. 387/2003 introduces a single, simplified procedure to issue authorisation by the regions to build plants powered by renewable sources.
The Conversion Law no. 290 of 27 October 2003 introduced further simplifications to build electrical plants and infrastructure. The Law no. 239/2004 to reorganise the energy sector completed the simplification and clarifies the State’s and the regions’ responsibilities on the matter.
Further simplifications and streamlining of the authorisation procedures for electricity transmission lines were introduced by means of Law 99/2009.
Provisions for identification and streamlining of procedures for strategic energy network infrastructure were introduced with Law Decree 79/2009, Article 4, paragraphs 1 to 4. Among other measures, the government is given a mandate to nominate special plenipotentiary commissioners for accelerating the implementation of selected transmission and distribution infrastructure.
Figure 19
Electricity Imports by Origin, 2007
Austria3%
France31%
Switzerland59%
Slovenia7%
Greece0%
Source: Electricity Information, IEA/OECD Paris, 2009.
PRICES AND TAXES
Electricity prices in Italy remain among the highest in IEA Europe and the European Union, especially for industrial consumers. Prices tend to vary considerably within each customer class depending on consumption levels and the impact of the taxation regime. Customers who use higher levels of electricity are charged at a higher tax rate making retail prices for them very high. Conversely, consumers of lower volumes of electricity pay less tax and therefore face lower prices.
19
© O
EC
D/IE
A, 2
010

91
According to the most recent Eurostat data, Italian families with an annual consumption lower than 2 500 kWh pay prices that are more than 20% lower, gross of taxes, than the European average. In general, Italian industry pays higher prices for electricity when compared to the European average for all consumption classes, both net and gross of taxes. The greatest variations, exceeding 35%, refer to the consumption of small and medium-sized businesses at consumption levels of 500 to 2 000 MWh and 2 000 to 20 000 MWh per year.
Figure 20
Electricity Prices in Italy and in Other Selected IEAMember Countries, 1980 to 2008
Greece
Italy
Spain
Greece
Italy
Spain
1980 1982 1984 1986 1988 1990 1992 1994 1996 1998 2000 2002 2004 20082006
Household SectorUSD/kWh
0.00
0.05
0.10
0.15
0.20
0.25
0.30
0.35
1980 1982 1984 1986 1988 1990 1992 1994 1996 1998 2000 2002 2004 20082006
Industry SectorUSD/kWh
0.00
0.05
0.10
0.15
0.20
0.25
0.30
0.35
Source: Energy Prices and Taxes, IEA/OECD Paris, 2009.
20
© O
EC
D/IE
A, 2
010

92
Figure 21
Electricity Prices in IEA Member Countries, 2008
Taxcomponent
Taxcomponent
Household Sector
Industry Sector
USD/kWh
Note: Tax information not available for Korea. Data not available for Australia, Belgium, Canada, Denmark, Germany, Greece, Luxembourg, the Netherlands and Sweden.
USD/kWh
Note: Tax information not available for Korea. Data not available for Australia, Belgium, Canada, Germany, Greece, Luxembourg and Sweden.
0.00 0.05 0.10 0.15 0.20 0.25 0.30 0.35 0.40 0.45 0.50
0.050.00 0.10 0.15 0.20 0.25 0.30 0.35 0.40 0.45 0.50
FranceKoreaNorwayUnited StatesNew Zealand
SwitzerlandFinland
PolandSpainPortugalTurkeyUnited KingdomJapanCzech RepublicAustria
HungarySlovak Republic
IrelandItaly
Korea United States
Switzerland Norway New Zealand Turkey France Finland
Czech Republic Poland
Japan Spain Portugal Slovak RepublicHungary United Kingdom
Netherlands Austria
Ireland Italy
Denmark
Source: Energy Prices and Taxes, IEA/OECD Paris, 2009.
21
© O
EC
D/IE
A, 2
010

93
Box 3
Smart MeteringSmart meters are sophisticated electricity consumption metering devices, which can replace existing electro-mechanical meters. They offer a range of benefits for both the customer and for the electricity system in general. They allow energy suppliers to communicate directly with their customers, removing the need for meter readings and ensuring entirely accurate bills with no estimates.
Smart meters contain a display unit, which can deliver a range of useful real-time information to customers regarding electricity consumption and prices. In particular, the installation of smart metering can allow for time-of-use tariffs, where the price of electricity varies at different times of the day to reflect changes in the costs of producing electricity over the day. Smart meters present customers with an opportunity to actively manage their consumption of electricity in line with price movements and demand patterns.
Italy was one of the first markets to see mass installations for domestic customers when Enel first tested smart meters in 2001 before the liberalisation of the energy market. Mass installation commenced in January 2002. Factors motivating Enel to make the substantial investment in new metering technology included the expected savings or revenues in the areas of purchasing and logistics, field operations, customer services and revenue protection. The regulator or government had little or no influence on Enel’s programme.
Enel invested more than EUR 2 billion in this project or the equivalent of EUR 70 per customer. Savings of EUR 500 million per year were projected from 2006, when full installation was completed. Enel reported that the savings expected in 2006 were close to the projected figures. Enel proceeded with this investment on the basis of the savings the programme could deliver.
Building on the success of the Enel programme, the AEEG made a decision (no. 292/06) in December 2006 to introduce the mandatory installation of smart meters, defined by minimum functional requirements, for all household and non-household customers connected to the low-voltage (LV) networks. The mandatory replacement of older meters started in 2008, will last four years and involves all distribution system operators (DSOs), regardless of the number of customers served.
Italian DSOs are obliged to install smart meters for all LV customers with contractual capacity higher than 50 kW by 31 December 2008. From1 January 2007, all customers with contractual capacity higher than 50 kW and equipped with interval meters or smart meters will be metered on an
© O
EC
D/IE
A, 2
010

94
CRITIQUE
After struggling during the initial stages of liberalisation and market reform, progress has been made in recent years. This progress lays a solid framework for the development of a competitive Italian and European power market and the secure and efficient provision of electricity for the long term. This progress, however, cannot mask the fact that much work remains to be done.
The Regulatory Authority for Electricity and Gas (Autorità per l’Energia Elettrica e il Gas, AEEG), which was established in 1995, was given enhanced powers in 2004 and 2008. It is fully independent from the government, has a highly competent staff, works collaboratively with the Competition Authority (Autorità Garante della Concorrenza e del Mercato, AGCM) and has sufficient powers and resources to adequately monitor and regulate the market. Furthermore, after the first experiment with an independent system operator, one which did not own the infrastructure, Italy took a bold step in November 2005. It fully unbundled the ownership of the transmission network and put in place a fully independent transmission system operator, Terna (Rete Elettrica Nazionale, formerly GRTN). It also developed locational marginal pricing – a zonal system that provides signals to the market about where power is most valuable and new plants should be built.
In short, Italy has in place the necessary institutions and market design for a competitive electricity market to emerge, and has already gained many of the benefits of such a framework, including new entry into the generation market and enhanced competition, better long-term planning of network infrastructure and sound incentives to develop new capacity in the places where it is most needed.
hourly basis. From 2008, financial penalties shall be applied to DSOs that do not reach the minimum yearly percentage of installation of electronic meters determined by the regulator.
ACEA is the distribution company serving Rome, with approximately1.5 million customers. ACEA also sells electricity. The area it serves extends beyond the city and includes rural areas, although 90% ofthe area covered is urban. ACEA ran a smart metering pilot project of40 000 meters from December 2004 to April 2005 and started a full installation programme in November 2005. By early 2006, 150 000 meters had been installed, around 10% of the customer base. ACEA has provided customer displays which could be used anywhere in the premises by plugging the unit into a socket. Customers could buy or lease this display. The total investment was expected to be around EUR 150 million, orEUR 100 per customer (excluding the display).
© O
EC
D/IE
A, 2
010
95
There are areas where the government, building on these successes, should focus action and improvements. The first is infrastructure development, where the government has already begun work to streamline and improve processes. Italy is not unique in struggling with the challenge of developing needed energy infrastructure – in the case of electricity transmission lines – though the process in Italy is more complicated than elsewhere because of the balance of power between the State and the regions. We urge the government to continue this process, with a view to creating a streamlined, integrated and transparent process that highlights to the public the costs and benefits of new infrastructure and power generation facilities and that brings all stakeholders into the development process from the outset. Again, the enactment of Law no. 99/2009 marks important progress in this regard with provisions for identification and streamlining of procedures for strategic energy network infrastructure.
While good progress has been made in the wholesale electricity market, more can be done. We note that the generation market share of Enel has been capped and continues to fall as new participants enter the market. Despite this, there still exists a strong belief that the previous incumbent has a dominant influence on the market and that transparency is weak. In any case, following the implementation of Law 2/2009, the government and AEEG have taken action to arrest this perception, increase transparency, and advancements are expected. It is also necessary to take steps to further reduce the share of the previous incumbent in the wholesale market for power; for example, it may be possible to establish mechanisms to reduce the share of price-setting plants in the Enel portfolio of generating stations.
Ownership is another matter where good progress has been made but there is room for more improvement. Through its shareholding, either directly or indirectly, the government retains a large stake in the ownership of all the key players in the electricity supply chain from generation, transmission, distribution to supply, as well as of the market operator. The government should evaluate if divesture of its assets in the competitive parts of the supply chain would help to successfully complete the process of liberalisation and continue to attract new entrants and investment in infrastructure.
It is notable that a significant price differential still remains between IPEX and the other EU power exchanges, in particular those interconnected with the Italian market. For example, in the period from January 2005 to June 2006, the IPEX produced the highest price for peak-load hours, with the average price as much as double that of the other European markets. Even in off-peak periods, the price in Italy was one of the highest over the period as a whole. As a result of these consistent price differentials, flow on the interconnectors tended to be dominated by imports with some very occasional exports in limited directions.
Despite high volumes of electricity trading with neighbouring countries, there is not yet true market integration, given the persisting congestion and transmission constraints preventing alignment between the Italian price and
© O
EC
D/IE
A, 2
010
96
prices in the other markets. Despite this, good progress has been made in recent years and we encourage the government and regulatory institutionsin this regard. A significant first step has been the enactment of Lawno. 99/2009, which provides the realisation of the single market for electricity through the development of interconnectors with energy-intensive clients. Furthermore, under the new law, Terna will call an open season for electricity interconnections with neighbouring states, especially in northern Italy, so as to realise an increase in interconnection capacity of 2 000 MW.
The balancing market also deserves closer scrutiny. The regulator should take steps to ensure that Terna, the transmission system operator, has sufficient incentives to minimise balancing market costs – while maintaining incentives to ensure transmission system reliability at all times.
While a sound framework is in place in the wholesale market and transmission, much can be done to improve the retail market. The decision to remove regulated tariffs must be commended, but the decision to replace it with a reference price-based default tariff for protected and safeguarded customers was a retrograde step. Most importantly, the default tariff that is currently in place does not create the right incentives for retail market development. First, the default tariff should apply only to a small subset of vulnerable and unattractive customers — it should be considered a supplier of last-resort contract, not one that is available to all customers.
In addition, streamlining of retail switching processes needs to be considered. Substantial problems have been reported in relation to the exchange of customer data needed for switching. For example, the European Commission Directorate-General for Competition reported that the information needed for connection and billing purposes was not provided by the relevant body, often the incumbent supplier, within the statutory deadlines or not at all, or was simply wrong in a significant number of cases.14
Italy is one of the leaders in the world in the deployment of smart meters, electricity meters that can be read remotely by utilities and where accurate tariff information and price signals can be sent to customers. Starting in 2003, smart meters were being installed for most customers, including small residential ones. All customers should be able to profit as soon as possible from time-of-use pricing, with the price of electricity varying by season and by peak and off-peak hours during the week. We urge the government and regulator to continue their efforts to introduce time-varying prices to as many classes of customers as possible. In case this could be combined with active energy efficiency measures, it would become a model for other IEA countries. Such introduction will create the right price signals to customers and give suppliers incentives to develop appropriate tariffs for different types of customers.
14. DG Competition report on energy sector inquiry (SEC(2006)1724, 10 January 2007).
© O
EC
D/IE
A, 2
010

97
RECOMMENDATIONS
The government of Italy should:
Build on the provisions contained in Law no. 99/2009 and continue ◗
to improve the infrastructure development process through engagement, dialogue and transparency with local communities and by continuing to streamline the permitting process.
Give stronger support to national grid development by means of a robust ◗
grid development plan.
Continue the electricity market liberalisation process, enforcing strict ◗
regulatory control to prevent abuse of dominant market position.
Work to develop the forward market for electricity, as this will encourage new ◗
entrants, long-term supply and infrastructure development.
Closely monitor the balancing market to ensure that the transmission system ◗
operator has incentives to lower these costs as much as possible, without sacrificing network security.
Focus on developing the retail market, most critically by revising the public ◗
service tariff level and system so that new suppliers are able to enter the market by offering market-based retail tariffs.
Take advantage of the state-of-the-art smart metering infrastructure being ◗
put in place to continue to develop demand participation from all classes of customers, including residential, as well as the creation of innovative contracts from competing suppliers.
© O
EC
D/IE
A, 2
010

© O
EC
D/IE
A, 2
010

0
99
NATURAL GAS
OVERVIEW
Italy has a well developed natural gas market and is IEA Europe’s third-largest after the United Kingdom and Germany. Natural gas demand has more than doubled over the past 25 years, and from what was in the 1960s a domestically supplied industry, the Italian natural gas market has become heavily import-dependent. Total consumption of natural gas almost doubled between 1990 and 2008, from 39 Mtoe to 69.5 Mtoe, increasing its 26% share of total energy consumption to just over 40% in the same period. Environmental and planning constraints, coupled with the country’s rejection of nuclear energy in 1987, have made natural gas the primary fuel for power generation investment.
SUPPLY AND DEMAND
In 2008, natural gas provided 37%, or 69.5 Mtoe, of Italy’s total primary energy supply (TPES). Gas supply as a share of TPES has remained relatively stable over the past four years; at between 36% and 40%, as total energy consumption in the same period has remained flat. Of the 84.8 bcm consumed in 2008, 9.2 bcm was produced domestically with the remainder imported and occasional small volumes exported. Imports represented almost 91% (76.8 bcm) of total supplies.
One-third of total gas demand comes from power generation: more than half of Italian power generation is gas-fired and notwithstanding the recent significant policy shift in relation to nuclear energy, this share is expected to grow. Gas demand in the industrial sector is stable, accounting for around one-quarter of total demand. A well-developed distribution grid takes natural gas to the homes of almost 90% of the population.
Growth in gas demand has come from the power generation sector and residential and commercial customers, which currently account for 38% and 37% of the gas demand, respectively. The bulk of natural gas demand growth over the last five years has been met by pipeline imports. The majority of 2008 pipeline imports (46.7 bcm or 62%) came from Algeria and Russia combined, with most of the remainder coming from Norway and the Netherlands. The Greenstream pipeline, completed in 2005, has a capacity of 9 bcm. Flows through the pipeline reached full capacity in thermal year 2006/07.15 In October 2007, Eni and the Libyan National Oil Corporation signed an agreement to extend the capacity of Greenstream by 3 bcm by 2010 and to build a 5 bcm LNG liquefaction terminal targeted on the global market.
15. 1 October 2006 to 30 September 2007.
7
© O
EC
D/IE
A, 2
010

100
Figure 22
Natural Gas Imports and Production, 1973 to 2007
Imports
Indigenousproduction
0
100 000bcm
20 000
40 000
60 000
80 000
1973 1975 1977 1979 1981 1983 1985 1987 1989 1991 1993 1995 1997 1999 2001 2003 2005 2007 Source: Energy Balances of OECD Countries, IEA/OECD Paris, 2009.
Figure 23
Natural Gas Supply by Sector*, 1973 to 2030
0
Mtoe
Transport
Powergeneration
Other**
Industry
Commercial20
40
60
80
100
120
1975 1980 1985 1990 1995 2000 2005 2010 2015 2020 2025 2030
* total primary energy supply by consuming sector. Other includes other transformation and energy sector consumption. Industry includes non-energy use. Commercial includes residential, commercial, public services, agriculture, forestry, fishing and other final consumption.** negligible.Sources: Energy Balances of OECD Countries, IEA/OECD Paris, 2009 and country submission.
22
23
© O
EC
D/IE
A, 2
010

101
Delays in developing LNG import infrastructure means that LNG imports from Algeria in 2008 continued to form a small part of supply: 1.5 bcm or 2%. This is likely to change in the near term: new LNG import capacity of 8 bcm will become operational in October 2009 with the commissioning of an LNG terminal off the coast near Rovigo in the northern Adriatic Sea; 80% of this new capacity will be reserved for deliveries of LNG from Qatar.
GAS PRODUCTION
In recent years, a small number of new natural gas discoveries were made in northern, central and southern Italy and offshore in the northern Adriatic Sea and in the Tyrrhenian Sea, west of Sicily. Domestic gas production decreased in 2007 when compared with 2006, from 10.8 bcm to 9.7 bcm, and decreased even further in 2008 to 9.3 bcm. With limited reserves (proven reserves were estimated at between 94 bcm and 82 bcm16), the outlook for Italian gas production is dark. Production of natural gas in Italy is dominated by the Eni group, which produced 85% of domestic gas. Other producers include the Edison group, Royal Dutch Shell and Gas Plus.
Notwithstanding declining reserves, the exploration and production outlook in Italy is hampered to some extent by the length of time it takes producers to move from the start of exploration activities to the commercial exploitation of production fields. Depending on the authorities involved, the length of time involved ranges from 90 to 120 months as compared with 36 to 48 months elsewhere in Europe. Law no. 239, enacted since the last in-depth review, amended existing legislation relating to upstream oil and gas activities. The purpose of this law, promoted by the Ministry of Economic Development, was to simplify the procedures for obtaining exploration and production permits.
In accordance with Law no. 239, all central and local authorities should take part in a conference, allowing the ministry to issue a single mining licence, which includes any other authorisations. However, after four years, the results appeared not to be entirely satisfactory. This administrative framework has proven to be inadequate to cope with the inherently unforeseeable nature of subsurface exploration. Following much debate, the Ministry of Economic Development promoted an advisory board composed of representatives from industry, the ministry and the regions. The suggestions expressed by the board were funneled into a law proposal aimed at improving the critical points of the current legislation. In this regard, new Law no.99/2009, approved by the Parliament on July 2009, established a simplified procedure for granting authorisations for exploration and exploitation of hydrocarbons.
16. Natural Gas Information, IEA/OECD Paris, 2009.
© O
EC
D/IE
A, 2
010

102
IMPORTS
Imported natural gas is injected into the Italian national gas pipeline network at six entry points, five of which are pipelines, and also at the LNG regasification terminal in Panigaglia. Domestically produced gas is injected at 67 entry points from the production fields or from their collection and processing centres. Storage sites are also connected to the transmission network (two virtual points of entry). The exit points of the national gas pipeline network are composed of 17 withdrawal areas generally coinciding with administrative borders.
The five pipeline import points are;
The Trans-European pipeline (TENP) and the Transitgas pipeline bring ●
natural gas from northern Europe (mostly from the Netherlands and Norway), entering the country at the Passo Gries entry point near Milan. The pipeline has an annual capacity of 21.2 bcm.
TAG pipeline transports gas from Russia via Austria into Italy where it ●
enters the Italian network at Tarvisio and also at Gorizia via Slovenia. The current capacity of this pipeline is 36.8 bcm per year.
Transmed or Enrico Mattei transports gas from Algeria via Tunisia to Italy ●
and enters the Italian network at Mazara del Vallo in Sicily. The current capacity of the pipeline is 35.3 bcm
Greenstream links the Italian natural gas system with Libya. This 9.3 bcm ●
per-year pipeline connects with the Italian system at Gela in Sicily.
The main sources of supply via natural gas pipelines, both non-EU, are Russia and Algeria. In 2008, Algeria was the largest source of imports, accounting for 25.9 bcm or 34% of total supply. Gas from Algeria arrives mainly via pipeline, at the Mazara del Vallo entry point and to a lesser extent by LNG shipments where the gas is regasified at the Panigaglia terminal in the Liguria region. Around 2% of import volumes, or 1.5 bcm, of gas was regasified and injected into the grid in 2008.
Imports from Russia are the second-largest source (22.3 bcm or 28.9%) and arrive in Italy via the Tarvisio entry point. The interconnection with Slovenia, the Gorizia interconnector, has a transit capacity of 0.7 bcm. A corresponding capacity is available to Slovenia at the Mazara entry point. However, since Slovenia rarely takes advantage of the full transit potential trough the Italian network, the equivalent amount is accounted for as a “virtual import” at the Gorizia entry point. Libya, 9.9 bcm (12.8%), is the third most important country of origin and in 2007 its share for the first time exceeded the shares of the Netherlands and Norway, taken separately. Total imports from northern European countries in 2007 accounted for 21.9% (16.9 bcm) of gas supply and originate from the Netherlands
© O
EC
D/IE
A, 2
010
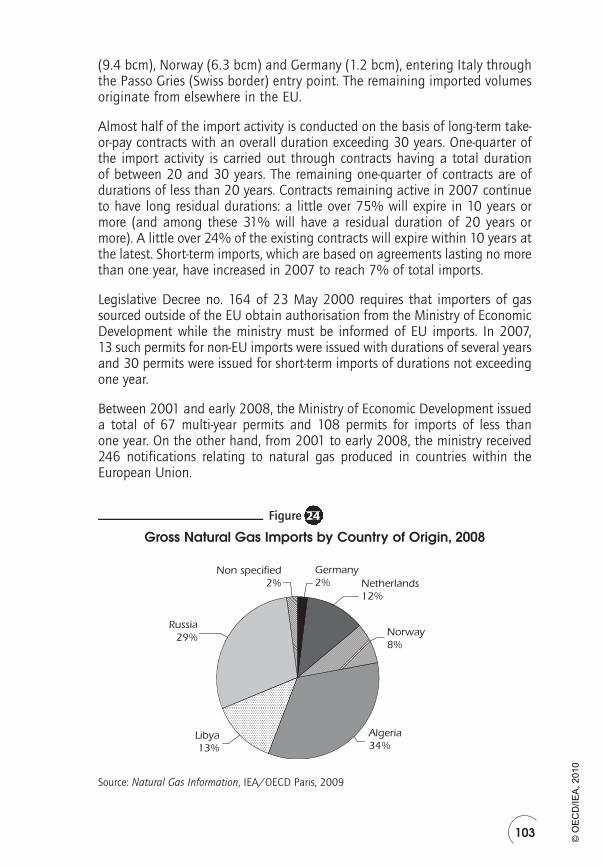
103
(9.4 bcm), Norway (6.3 bcm) and Germany (1.2 bcm), entering Italy through the Passo Gries (Swiss border) entry point. The remaining imported volumes originate from elsewhere in the EU.
Almost half of the import activity is conducted on the basis of long-term take-or-pay contracts with an overall duration exceeding 30 years. One-quarter of the import activity is carried out through contracts having a total duration of between 20 and 30 years. The remaining one-quarter of contracts are of durations of less than 20 years. Contracts remaining active in 2007 continue to have long residual durations: a little over 75% will expire in 10 years or more (and among these 31% will have a residual duration of 20 years or more). A little over 24% of the existing contracts will expire within 10 years at the latest. Short-term imports, which are based on agreements lasting no more than one year, have increased in 2007 to reach 7% of total imports.
Legislative Decree no. 164 of 23 May 2000 requires that importers of gas sourced outside of the EU obtain authorisation from the Ministry of Economic Development while the ministry must be informed of EU imports. In 2007, 13 such permits for non-EU imports were issued with durations of several years and 30 permits were issued for short-term imports of durations not exceeding one year.
Between 2001 and early 2008, the Ministry of Economic Development issued a total of 67 multi-year permits and 108 permits for imports of less than one year. On the other hand, from 2001 to early 2008, the ministry received 246 notifications relating to natural gas produced in countries within the European Union.
Figure 24
Gross Natural Gas Imports by Country of Origin, 2008
Germany2% Netherlands
12%
Norway8%
Algeria34%
Libya13%
Russia29%
Non specified2%
Source: Natural Gas Information, IEA/OECD Paris, 2009
24
© O
EC
D/IE
A, 2
010

104
NATURAL GAS NETWORKS
TRANSMISSION
The Italian gas transmission system is more than 33 000 kilometres-long, 31 081 kilometres of which are owned by Snam Rete Gas, the main transmission operator, a functionally and legally unbundled entity, owned by Eni. In accordance with Legislative Decree 164/2000, the Snam Rete Gas networkhas been separated into two parts: the first belonging to the National Gas Pipeline Network, for a total of 8 548 kilometres and the second to the Regional Gas Pipeline Network, for the remaining 22 533 kilometres. The National Gas Pipeline Network principally consists of high-pressure pipelines, which transport quantities of gas from entry points to the regional transmission network and storage facilities. The network also includes inter-regional pipelines used to connect key consumer areas. The Regional Gas Pipeline Network, consisting of the other parts of the Snam network, allows the transportation of natural gas in specific areas (generally within regions) to supply industrial consumers, electricity generators and urban distribution networks.
A second operator, Società Gasdotti Italia SpA, manages 1 263 kilometres of networks (of which 120 are on the national grid). There are also five smaller operators (Retragas, Metanodotto Alpino, Carbotrade, Consorzio della Media Valtellina per il Trasporto del Gas, and Netenergy Service) which each own small sections of the regional network.
Transmission activities are regulated by network codes drawn up by the transport companies and approved by the regulator. The codes have been in force since 1 October 2003 and are regularly updated.
DISTRIBUTION
The Italian natural gas distribution network reaches a total of 223 000 km and almost 90% of domestic consumers or 20.2 million households, an increase of 4.2 million (26%) from 1999.
The process of encouraging ownership rationalisation and concentration in gas distribution, which has characterised the sector in recent years, continued during 2007 and 2008. However, ownership of the distribution networks remains fragmented among approximately 275 active distributors (they were 430 in 2005 and 750 in 1999). Of the 275 operators active in 2007, only 7 were classified as very large (that is, with more than a half million customers supplied); there were 25 operators with between 100 000 and 500 000 customers and30 companies were medium-sized with between 50 000 and 100 000 customers. Less than one-eighth of the Italian distribution companies exceed the threshold of 100 000 customers, for which the regulatory authority requires functional separation of the distribution and supply activities, and for almost one-third
© O
EC
D/IE
A, 2
010

105
Figure 25
Natural Gas Infrastructure
Panigaglia
Cagliari
Catania
FRANCE
MONACO
Corsica
Sardinia
TUNISIA
CROATIA
BOSNIA &HERZEGOVINA
SLOVENIA
HUNGARY
AUSTRIALIECH.SWIT.
SAN MARINO
Rome
Tyrrhenian
Sea
Ligurian
Sea
Gulf of
Venice
Mediterranean Sea
Strait of Sicily
Ionian
Sea
Strait of Otranto
Adriatic
Sea
ALGERIA
Sassari
Imports from Lybia
Imports from
Algeria via Tunisia
Imports
from Algeria
Imports
from Russia
From Greece
From Greece
Transm
ed
TAG
TENP andTransitgas
MaseraMonza
Sergnano
RipaltaSettala
Cortemaggiore
Minerbio
Rimini
Corsini
Diana GaribaldiAnemone
BarbaraFratello
IesiBonaccia
Vongola
S. Giorgio
Emma
Squalo
S. SalvoS. Stefano
Candela
Ferrandina
Aquila
CiroTravisia
Luna
Tarsia
Messina
Gagliano
Mera-Lavinia
Cupello
Melizzano
GalleseCivita Cast.
Cellino
TerranuovaBracc.
Pineto
Istrana
Collalto
Tresigallo
Imports from Norwayand Netherlands
Livorno
Palermo
Campobasso
Venice
Ancona
Florence
Perugia
L’AquilaMontaltode Castro
Trento
Bologna
Trieste
Tarvisio
Milan
Turin
Genoa
Bari
Naples Potenza
Reggio Calabria
Catanzaro
Aosta
PassoGries
(Fr.)
La Spezia
CalderariMazara
Enna
Existing national pipelines Natural gas fields
Existing regional pipelines
Pipelines under construction/planned
Pipelines under study
Border crossing
Storage
Compressor stations
Operating
Authorised
LNG terminals
0 100 200
KmMALTA
The boundaries and names shown and the designations used on this map do not imply official endorsement or acceptance by the IEA.
Source: Natural Gas Information, IEA/OECD Paris, 2008.
25
© O
EC
D/IE
A, 2
010

106
of the companies the obligation to keep separate accounting records does not even apply, as there are 87 operators serving less than 5 000 customers.
An analysis of the volumes distributed by active businesses carried out by AEEG shows that the leading 32 medium or large companies distribute 75% of total volumes, while the remaining 243 small or very small companies distribute only one-quarter of the total volumes. At the same time, the Eni group controls, through its subsidiary Italgas, approximately 26% of the market in terms of 2006 volumes sold, more than double its nearest competitor. When compared with 2006, however, there has been an erosion of the incumbent’s market share.
In 2006, the AEEG approved, after a public consultation procedure with stakeholders, a distribution network code, containing the rules for access to the network and the delivery of the gas distribution service. The code is a key step for the development of the retail gas market since it acts as the contractual instrument which regulates and clarifies relations between the operators of the distribution networks and the retailers and wholesalers using them. The code guarantees that distribution companies provide service to their customers in a neutral and non-discriminatory manner. The majority of distribution operators have adopted this model.
Subsequently, the government, AEEG and the distribution industry have engaged in an ongoing process of reform and rationalisation of the gas distribution sector. Industry participants have argued that the length of distribution concessions offered by the government, 12 years as compared to a minimum of 20 years elsewhere, is too short to allow an adequate return and encourage investment in the sector. By the end of 2009, the Ministry of Economic Development will establish the minimal area for the rationalisation of the distribution concessions, with a limited number of concessions to be granted by means of public tenders.
STORAGE
The storage system, composed largely of depleted gas reservoirs, which in 2008 accounted for 12.87mcm of working capacity, is highly concentrated both in a geographic context and operationally.17 It includes ten onshore facilities, eight of which are owned and operated by Stoccaggi Gas Italia (Stogit), a functionally and legally unbundled entity wholly owned by Snam Rete Gas (part of the Eni group). The remaining two facilities, accounting for 2% of working gas, are owned and operated by Edison Stoccaggio, an Edison subsidiary. Both storage operators offer three basic types of service: modulation storage (including storage for TSO purposes), storage for production purposes, and 5.1 bcm of strategic storage.
17. Natural Gas Information 2009, IEA Statistics.
© O
EC
D/IE
A, 2
010

107
Given Italy’s dependence on gas imports from outside the EU, and the perceived supply risk, importers are obliged to pay a tariff, approved by the energy regulator, that covers costs to maintain strategic storage (the amount of the tariff is calculated as a share of 10% of the imported gas not produced in Europe). Suppliers are responsible for requesting modulation storage, while importers (of gas produced outside the EU) are responsiblefor booking strategic storage. Authorisation for imports of gas produced in non-EU countries and with duration of more than one year is conditional, inter alia, on the payment of strategic storage tariffs. Additional obligations are placed upon household suppliers, who are obliged to ensure supplyin case of an extreme “one in twenty” winter. Priority access to storage capacity is also conferred onto market players to satisfy this obligation. For LNG imports, 50% of the LNG terminal capacity can be deducted from strategic storage obligations.
The minimum volume of strategic storage is calculated yearly as the equivalent lost volume of imports in case of a 50% disruption of allocated daily capacity lasting 60 days at the main national entry point (currently Tarvisio where gas from Russia enters the Italian system); strategic storage requirements are then charged on all gas imports from outside the EU. Nonetheless, the ministry has always fixed the annual volume at 5.1 bcm.
The government, through the Ministry of Economic Development and the energy regulator, supervises storage activities, on the basis of licences issued by the ministry over a period of 20 years, with a possibility of two subsequent renewals of 10 years each. The regulator has responsibility to approve storage codes prepared by operators in consultation with customers. Access to storage facilities is based on regulated third-party access (TPA) and published tariffs established by the regulator AEEG, in line with criteria set by the government. The single national storage tariff is determined by the regulator and applied by both Stogit and Edison Stoccaggio. The tariff includes charges for volume, injection and withdrawal capacity, a commodity charge and a strategic storage fee.
In 2005, the ministry granted Stogit permits to convert two new reservoirs into storage facilities at Alfonsine (1.55 bcm) and Bordolano (1.44 bcm) and to expand its existing storage facility at San Salvo thereby allowing Stogit to increase its total active capacity by 3.7 bcm.
The principal government initiative to create storage-to-storage competition comes in the form of the allocation of future storage concessions to new entrants in order to let them exploit some depleted fields. Subsequent authorisation procedures for six new storage sites (five depleted reservoirs and an aquifer facility), for a total nominal capacity of about 5.85 bcm, were started by five companies: Ital Gas Storage, Edison Stoccaggio, Independent Gas Management, Gas Plus (two sites), and Geogastock. Permits have been granted for the Alfonsine and Bordolano sites while the remaining facilities are in the initial stages of the authorisation process.
© O
EC
D/IE
A, 2
010
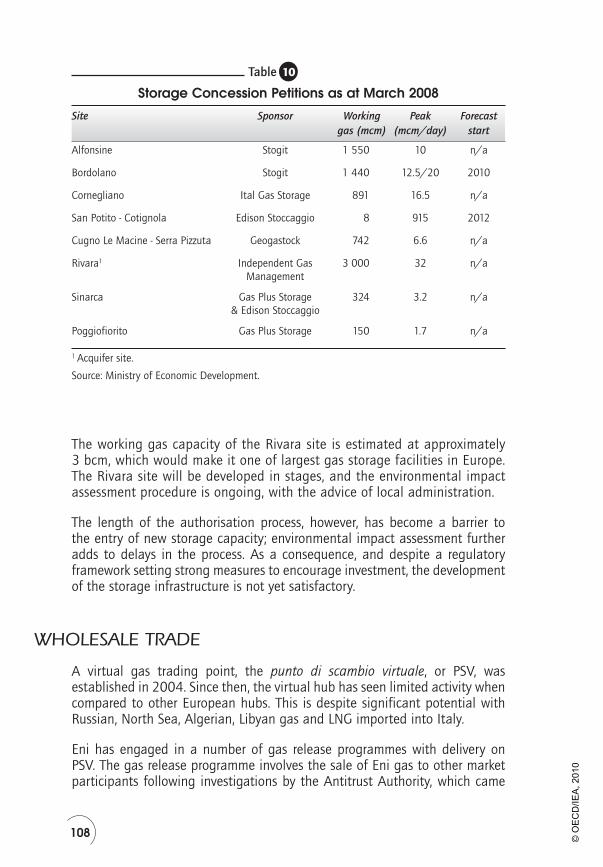
108
Table
Storage Concession Petitions as at March 2008
Site Sponsor Workinggas (mcm)
Peak(mcm/day)
Forecaststart
Alfonsine Stogit 1 550 10 n/a
Bordolano Stogit 1 440 12.5/20 2010
Cornegliano Ital Gas Storage 891 16.5 n/a
San Potito - Cotignola Edison Stoccaggio 8 915 2012
Cugno Le Macine - Serra Pizzuta Geogastock 742 6.6 n/a
Rivara1 Independent Gas Management
3 000 32 n/a
Sinarca Gas Plus Storage& Edison Stoccaggio
324 3.2 n/a
Poggiofiorito Gas Plus Storage 150 1.7 n/a
1 Acquifer site.
Source: Ministry of Economic Development.
The working gas capacity of the Rivara site is estimated at approximately 3 bcm, which would make it one of largest gas storage facilities in Europe. The Rivara site will be developed in stages, and the environmental impact assessment procedure is ongoing, with the advice of local administration.
The length of the authorisation process, however, has become a barrier to the entry of new storage capacity; environmental impact assessment further adds to delays in the process. As a consequence, and despite a regulatory framework setting strong measures to encourage investment, the development of the storage infrastructure is not yet satisfactory.
WHOLESALE TRADE
A virtual gas trading point, the punto di scambio virtuale, or PSV, was established in 2004. Since then, the virtual hub has seen limited activity when compared to other European hubs. This is despite significant potential with Russian, North Sea, Algerian, Libyan gas and LNG imported into Italy.
Eni has engaged in a number of gas release programmes with delivery on PSV. The gas release programme involves the sale of Eni gas to other market participants following investigations by the Antitrust Authority, which came
10
© O
EC
D/IE
A, 2
010
109
to the opinion that the company made improper use of its dominant position. Gas release sales have more than doubled in recent years to reach almostone-fifth of the total wholesale purchases domestically.
In a further step to boost liquidity, the Ministry of Economic Development (MSE) ordered producers with large concession licences to auction the equivalent volume of gas they previously would have paid as state royalties on the PSV. In addition, the ministry has approved a decree to force holders of new import contracts to offer a certain percentage of their gas volumes to PSV. The decree came into force in October 2008.
The decree, however, may have a limited impact on the market; most import contracts are not due for renewal for some time. For new import contracts, it is questionable whether the additional volume will be marketable: liquidity will grow only as a function of increased entry capacity.
Traded volumes increased in 2007 to 10.6 bcm, or by 63%, and physical volumes by 41% (to 6.3 bcm). Despite this, bringing gas onto the PSV is a major problem for new entrants, as most of the pipeline capacity is booked on existing contracts with Italian incumbents, who have shown a marked lack of enthusiasm to either expand capacity, or offer unused capacity to new entrants.
A recent review of European wholesale energy markets noted that in Italy, traders believed that transparency is significantly weak and so too are the ability to trade forward and the reliability of the spot market price. The study ranked the Italian natural gas market as the third-weakest of ten European markets in terms of market liquidity and efficiency, and the strongest in terms of the influence of the previous incumbent.18
MARKET DESIGN
The Italian transmission system is based on an entry-exit model both for capacity and tariffs. Transportation capacity booked by network users and the costs associated with the service do not depend on a specific transportation path.
Transportation service is undertaken on the basis of daily programmes defined by the network users. These programmes specify the quantity they intend to take in and off at each point of the network where capacity
18. Review and Analysis of EU Wholesale Energy Market Clients conducted on behalf of the European Commission, DG TREN, “Evaluation of Factors Impacting on Current and Future Market Liquidity and Efficiency, Research Findings and Conclusions”, 2 July 2008.
© O
EC
D/IE
A, 2
010
110
is booked. The quantities actually transported through the network are allocated to network users according to specific rules defined in the network code.
The Italian system has a daily balancing regime with storage and line pack19 representing the main balancing tools. Balancing (operational and commercial) is settled through Stogit storage rather than on the grid, with balancing charges – determined by AEEG with no correlation to gas prices – applied only where allocated flows overrun storage capacities.
RETAIL MARKET
In 2007 there were 312 suppliers authorised by the Ministry of Economic Development to engage in retail sales of natural gas. Despite this apparently large number of participants, the market remains highly concentrated. Eni remains the dominant player with a 43.9% market share, placing it far ahead of the Enel group with 16.4% (up from 15.3% in 2006). Edison, Energie Investimenti and Hera each follow with significantly lower shares. Regarding consumption in the regions, the major consuming region is Lombardy, which absorbs one-quarter of the retail market on its own. Emilia Romagna (14.4%), Piedmont (10.8%), Lazio (8.1%), Veneto (7.2%) and Tuscany (7%) also have significant shares.
The retail natural gas market, excluding self-consumption, is composed of approximately 20 million customers, of which 19 million are household customers. A little more than 1.1 million are commercial and service customers, 175 000 are industrial customers and 500 are power generators of various sizes. In terms of volumes sold, households consume approximately 25%, industrial customers 32%, power generators 35%, and 8% is sold to the commercial and services sector.
Small retail customers have yet to see the benefit of full competition; switching rates remain low despite the decision to end retail tariff regulation in 2007. Currently, switching is around 2% for both households and industrial users, and prices remain among the highest in IEA Europe for all categories of consumers. In the absence of regulated tariffs, the regulator has put in place a reference price for gas. This price is available to all domestic customers and small businesses and is based on the price of purchasing gas at the entry points. The presence of a public service reference price would appear to hamper other commercial offers and competition between operators in the sector.
19. Gas maintained in a gas transmission line at all times to maintain pressure and affect uninterrupted flow of gas to customers at off-take points.
© O
EC
D/IE
A, 2
010

111
Figure 26
Percentage Breakdown of the Average Reference Natural Gas Price as at 1 April 2008
Storage1.30%
Transport4.60%
Distribution10.00%
Taxes39.30%
Gas costs36.10%
Retail marketing3.90%
Wholesalemarketing4.80%
Other costs15.90%
Source: Autorità per l’Energia Elettrica e il Gas (AEEG).
PRICES AND TAXES
Retail prices in Italy remain among the highest in IEA Europe for some categories of consumer. Energy taxes are also relatively high. Switching for households is particularly unattractive: 42% of the end price is represented by taxes and duties while the cost of gas represents around 32%. Expected savings from switching are consequently low.
The 2007 Eurostat data comparison shows that the gas bills of Italian families were in line with the European averages for the lowest class of consumption (cooking and hot water) while for the higher classes (use of gas for heating as well) they were slightly higher than the European average, net of taxes, and 20% higher gross of taxes.
The gross prices paid by Italian companies (excluding non-energy and electricity generation) were fairly close to the European average for all consumption classes. Compared with the main European countries, Italian prices, net of taxes, for the three central consumption categories were midway between the lowest prices (United Kingdom and Spain and the highest prices (Sweden and Germany).
26
© O
EC
D/IE
A, 2
010

112
Figure 27
Gas Prices in Italy and Spain, 1980 to 2008
1980 1982 1984 1986 1988 1990 1992 1994 1996 1998 2000 2002 2004 20082006
1980 1982 1984 1986 1988 1990 1992 1994 1996 1998 2000 2002 2004 20082006
Industry Sector
Household Sector
USD/toe(GCV)
USD/toe(GCV)
Italy
Spain
Italy
Spain
0
200
400
600
800
1 000
1 200
1 400
0
200
400
600
800
1 000
1 200
1 400
Source: Energy Prices and Taxes, IEA/OECD Paris, 2009.
27
© O
EC
D/IE
A, 2
010

113
Figure 28
Gas Prices in IEA Member Countries, 2008
Taxcomponent
Taxcomponent
Household Sector
Industry Sector
USD/toe (GCV)
Note: Tax information not available for the United States. Data not available for Australia, Austria, Belgium, Denmark, Germany, Japan, Luxembourg, the Netherlands, New Zealand, Norway and Sweden.
USD/toe (GCV)
Note: Tax information not available for the United States. Data not available for Australia, Belgium, Denmark, Germany, Japan, Luxembourg, New Zealand, Norway and Sweden.
Canada
United States
Finland
United Kingdom
Spain
Korea
Poland
Portugal
Turkey
France
Czech Republic
Ireland
Slovak Republic
Greece
Italy Switzerland
Hungary
0 200 400 600 800 1 000 1 200 1 400
0 200 400 600 800 1 000 1 200 1 400
Canada Finland United States
Korea Turkey
Hungary Slovak Republic
United Kingdom Czech Republic
France Poland
Austria Spain Ireland
Portugal Switzerland
Italy Greece Netherlands
Source: Energy Prices and Taxes, IEA/OECD Paris, 2009.
28
© O
EC
D/IE
A, 2
010

114
INFRASTRUCTURE DEVELOPMENT
In recent winters, Italy has been threatened with gas shortages owing to lack of import and storage capacity and its vulnerability to a reduction of deliveries from Russia to contracted volumes only. In response, numerous ministerial decrees were issued to put in place measures to strengthen security of gas supply during the winter season and to approve emergency procedures to protect the gas system. Various decrees established emergency procedures for managing the potential failure of the system to meet natural gas demand in the event of severe adverse weather conditions.
While these measures carried the market through difficult problems, it is widely recognised that natural gas infrastructure in Italy is merely sufficient to meet existing domestic demand at standard conditions. In the winter 2005/06, because of low temperatures, high electricity consumption and supply problems from Russia through the Ukraine, the system had to resort to strategic storage and consumption containment measures to maintain balance. In the winters of 2006/07 and 2007/08 an emergency situation was avoided, thanks to preventive measures and favourable climatic conditions. As a consequence of the January 2009 Ukraine-Russia dispute, Italy lost almost 1.2 bcm of natural gas supply; volumes which were replaced by large stock-draws from storage, increased LNG imports and greater pipeline imports from Libya.
In response to the perceived risk of a crisis, a number of projects have been initiated largely to guarantee security of supply. New infrastructure is also needed to diversify the routes and areas of supply from abroad; to reduce exposure to geopolitical risks; to increase the possibility for competition between suppliers and wholesalers; and also to develop and to integrate the Italian system in the Euro-Mediterranean gas market. In addition, the country has ambitions to establish itself as the main hub for gas in the Mediterranean basin, and eventually the rest of Europe.
The main infrastructure projects currently under way relate to the upgrading of internal transmission infrastructure; the upgrading of existing pipeline, LNG import infrastructure; new gas storage facilities; and the construction of new pipeline and LNG infrastructure.
INVESTMENTS
In relation to the upgrading of internal transmission infrastructure, Snam Rete published a EUR 4.3 billion capital development plan for the 2008 to 2011 period, which set out proposals for:
© O
EC
D/IE
A, 2
010

115
Upgrading of the transportation network along the south-north line with ●
a planned third pipeline in Sicily and Calabria, the Tyrrhenian sealine and the Adriatic network. This project will include the construction of two new compressor stations in Sicily and Abruzzo, as well as the upgrading of the Enna compressor.
Upgrading of the Po valley infrastructure (east-west pipeline) aimed at ●
increasing supplies towards north-west Italy from the south and north-east.
Upgrading of the 380 km Trans-Tunisian Pipeline Company (TTPC) pipeline, ●
which transports Algerian gas to Italy via Tunisia. Eni increased the capacity of the pipeline by 6.5 bcm per year over two phases by April 2009.
An expansion of the TAG (Trans-Austria Gas) pipeline, which carries ●
Russian gas to Italy via Austria. The pipeline’s transport capacity has been increased by approximately 3.2 bcm per year by the construction of two additional compressor stations, which together provide an additional 6.5 bcm of capacity, increasing the total capacity of the pipeline to just below 40 bcm per year.
In addition, there are a number of proposals in place in relation to the upgrading of existing LNG and pipeline infrastructure including:
Increasing the capacity of the existing LNG regasification terminal at ●
Panigaglia from 3.5 bcm to 8 bcm per year. The plan faces environmental challenges but the owners, GNL Italia (an Eni subsidiary) expect construction to start in 2010.
A 3 bcm per year expansion of the Greenstream pipeline connecting Libya ●
with Italy. The 520 km Greenstream pipeline was inaugurated in 2004 and is at present the longest subsea pipeline in the Mediterranean. The joint operators, Eni and the Libyan National Oil Corporation, plan to make the new capacity available some time in 2010.
Since the last review, there has been considerable progress in relation to the permitting and authorisation of new LNG facilities and import pipelines. LNG infrastructure currently under construction includes:
The 8 bcm per year Adriatic LNG terminal, with start-up planned by October ●
2009, listed among the “strategic projects for the country’s modernisation and development“; 80% of the terminal capacity will be utilised by Edison to import LNG from Qatar. In September 2008, the terminal arrived at its final location off the Italian coast and is expected to become operational in October 2009.
The Offshore LNG Toscana (OLT) regasification facility. This 3.5 to 3.7 bcm ●
per year floating terminal is under construction at present and is expected to be operational by mid-2011.
© O
EC
D/IE
A, 2
010

116
Pipeline projects under way include:
The 8 bcm per year Galsi pipeline connecting Italy and Algeria via ●
Sardinia. Works on the 900 km pipeline are expected to commence in 2012. Sonatrach of Algeria, Edison and Enel and Hera Trading are among the major shareholders in the project.
The Interconnector Turkey-Greece-Italy corridor that will allow the ●
importation of natural gas from the Caspian region to Italy, via Turkey and Greece. The Turkey-Greece part of the pipeline was inaugurated in late 2007 and will have an initial capacity of approximately 3.5 bcm per year rising to 11.5 bcm per year by 2011. The Greece-Italy project, the Poseidon pipeline, which will commence in 2010, will have an initial capacity of 8 bcm per year and is expected to be operational by mid-2012.
The Trans-Adriatic pipeline (TAP), which will connect the Italian network to ●
Albania. TAP will then connect with existing gas pipelines in Greece and Turkey. The 520 km pipeline will have a capacity of 10 bcm per year when constructed.
There are many LNG terminal projects planned or proposed at present. Building onshore LNG terminals in Italy is difficult given the enduring local opposition to new infrastructure; therefore, the majority of these projects will be installed offshore. Of these projects, only two have received authorisation and are currently being built (at Rovigo and Livorno). Other projects are awaiting authorisation. However, some of them compete for location and could be merged or cancelled because of persisting local opposition and regulatory uncertainty.
One example is the BG project at Brindisi, which had received full authorisation in 2003. In February 2003, Enel joined the project, which was at that time expected to become operational in 2007. However, Enel withdrew from the project in June 2005 and the Ministry for the Environment, Land and Sea suspended the project development in 2007 on the grounds that more environmental impact assessments and local dialogue were needed. This uncertainty continued into 2008.
In 2002, it was estimated that an additional 30 bcm per year would be needed to meet demand by 2012. LNG projects were forecast to fill this gap with more than 20 bcm per year of new import capacity. Instead, the existing import capacities (Transmed and TAG pipelines) have been upgraded by 13 bcm per year in total and the regasification capacity has been increased by 8 bcm. A decree by the Ministry of Economy and Finance was published in November 2007; Law no. 99/2009 could now ease authorisation procedures for new LNG plants, and the majority of projects (Porto Empedocle, Rosignano, Priolo, Gioia Tauro, Taranto, Zaule-Trieste, and Monfalcone) could be positively affected by this new law.
© O
EC
D/IE
A, 2
010

117
NATURAL GAS EMERGENCY RESPONSE POLICY
POLICY
The basis of Italy’s natural gas emergency response policy was outlined in Directive 2004/67/EC, which was largely transposed by means of Decree no. 164/2000, and provides for:
dispatching rules, to be issued by the Ministry of Economic Development, ●
in case of emergency and mandatory security measures for the national gas system;
authorisation procedures for gas imports to Italy and requirements for ●
strategic and working gas storage;
mandatory modulation for shippers supplying civil customers; ●
the designation of the Ministry of Economic Development for matters ●
regarding security, economy and long-term programming of the national gas system; these goals are pursued by means of specific measures aimed at reducing price fluctuation and increasing supply security, co-ordinating the storage system and reducing the vulnerability of the gas system;
the adoption of temporary measures by the Ministry of Economic ●
Development in case of severe risks for collective security or the integrity of gas facilities;
institution of the Gas Emergency and Monitoring Committee within the ●
Ministry of Economic Development.
Nevertheless, Italy was severely affected by a disruption to its gas supplies from the Brotherhood pipeline, an important pipeline that carries Russian gas to Western Europe via Ukraine, over the winter 2006/07 and has taken significant measures in order to better prepare for another such disruption.
In order to deal with natural gas emergency situations, the Ministry of Economic Development has adopted and updated Decree no. 32 of November 2007 regarding specific emergency procedures. The update establishes the roles of the actors involved, the system monitoring procedures and the measures to be taken by the ministry in case of a crisis.
A specific “Technical Emergency Committee for the Gas System” within the ministry is designed to adopt the most appropriate measures. The committee is composed of the Director-General of the DG Security of Supply, one executive from the same DG, one representative of the energy regulator AEEG, one representative for each of the transport regasification companies (namely, Snam Rete Gas, Società Gasdotti Italia., Stogit SpA. and Terna SpA), and two experts. The committee may interact with other experts or with representatives of other administrations.
© O
EC
D/IE
A, 2
010

118
The emergency procedures list a series of measures for increasing gas imports and reducing gas consumption. These measures also include penalty fees for importers that do not comply with import maximisation obligations. Another measure outlines the use of alternative fuels in dual-fuel plants, or the maximisation of use of non-gas-fired plants.
By means of a decree, the Ministry of Economic Development has established some incentives for industrial clients directly connected to the national gas grid that effectively reduce gas consumption at times of emergency. These clients, along with those that voluntarily adhere to the gas consumption containment regime, benefit economically from compliance and are fined for non-compliance.
Fuel diversity is indirectly encouraged through incentives to adhere to a regulatory scheme aimed at reducing gas consumption of industrial and thermoelectric customers. The scheme provides for an option to use alternative fuels instead of gas (AEEG deliberations no. 277/07 and no. 323/07).
If necessary, the committee can also adopt further measures, including drawing on Italy’s strategic gas stocks. These stocks, located in the north of the country, currently stand at around 5.1 bcm.
Regarding electricity, import maximisation of electricity, although an effective measure to contain the use of gas, is very costly and is thus applied only in case of real necessity. Gas policy is strictly linked to arrangements for the electricity markets; emergency measures in the thermoelectric sector are based on the constant monitoring of gas consumption in that sector.
Unfortunately, however, no specific legislation has been passed to regulate electricity production from gas-fuelled plants in case of a crisis. Indeed, as Italian gas prices are less elastic than oil and electricity prices at a European level, the excess production of electricity by gas-fuelled plants significantly exacerbated the gas supply shortage during the 2005/06 winter. To reduce this risk, the AEEG issued regulations to assure that the gas storages during the winter are used for the household customers and not to produce electricity.
EMERGENCY GAS RESERVES
Each year strategic stock volumes are set by a communiqué from the Ministry of Economic Development; volumes are based on assumptions of a reduction of imports through the major system entry points. Strategic stocks belong to storage companies. As explained previously, the minimum volume of strategic storage is calculated yearly as the equivalent lost volume of imports in case of a 50% disruption of allocated daily capacity lasting 60 days at the main national entry point.
© O
EC
D/IE
A, 2
010
119
FUEL SWITCHING
Six percent of gas-fired power generation can also run on oil, albeit at higher production costs. Dual fuel plants are obliged to have oil stocks, but the quantity is not linked to a predetermined number of days, since switching will only occur following a specific governmental request, because of the inherently higher costs. Technically speaking, fuel switching can be achieved at short notice (from hours to days), depending on the technology.
Only 0.5% of the industrial load can operate on fuels other than gas. Furthermore, large industrial facilities are not required to have alternative fuel available. Fuel-switching abilities are very limited in the industrial sector.
The decree dated 11 September 2007 of the Ministry of Economic Development introduced a flexibility scheme for coping with supply crises, which applies to industrial customers directly connected to transport infrastructure and those that voluntarily adhere. Customers adhering to this scheme must reduce consumption at the request of the system operator, which can encourage such behaviour through a system of incentives and fines. If the total decrease in consumption of voluntarily adhering customers is lower than necessary, the scheme, including incentives and penalties, can be imposed upon all customers connected to transport infrastructure.
CRITIQUE
Italy has made progress in gas market reform since the previous review and has implemented a number of important recommendations. The Italian authorities have undertaken a series of ongoing compulsory changes to the structure of the gas market in order to ensure fair access to pipelines and effective competition in supply. Snam, the previously vertically integrated gas utility, has been legally unbundled into a transmission system operator (Snam Rete Gas), a separately managed storage business (Stogit, now part of Snam) and a supply business known simply as Eni.
Full third-party access (TPA) to the transmission network is governed by clear rules set out in a regulated network code. Similar arrangements are in place with regard to storage services and access to LNG facilities. There is a single distribution code, accepted by all distributors, and the government has commenced debate with the industry on future arrangements for gas distribution. These are commendable developments, and we encourage the government to continue its restructuring of the gas sector. Despite the large number of positive changes since the last review, however, much remains to be done before Italy can enjoy the full benefits of gas market liberalisation.
In relation to the dominant market position previously enjoyed by the incumbent, the Administration has developed a number of positive measures, including, notably, very precise and progressive gas release programmes
© O
EC
D/IE
A, 2
010

120
and ownership and market share limitations for the incumbents. However, the position of Eni is still an issue for the regulatory authorities. In 2007 the European Commission commenced antitrust proceedings against the gas incumbent in relation to the potential exclusion of new entrants from the Italian market. Eni is being accused of capacity hoarding and strategic underinvestment on the gas transmission network, intending market foreclosure which would threaten, not only the development of competition, but also security of supply for Italian customers.
Despite several measures aiming to restrain its dominant position in the Italian market, Eni sells nearly half of all end-user gas. Eni remains dominant throughout the value chain and still sells 60% of gas by volume to large customers and sells 90% of all gas consumed by power generators. While the 50% cap on sales in Italy has had some effect on the domestic market, it is possible that Eni can sell gas to other shippers at the border, thereby retaining its power in the wholesale market.
In 2003, Decree Law no. 239 established that, commencing from July 2007, any company operating in the production of electricity or natural gas, import, distribution and sale, as well as any state-owned company operating in the above sectors, may not hold, directly or indirectly, more than 20% of the shares of companies which own and manage national electricity/gas transmission networks. In this regard, we encourage the government to proceed with the complete implementation of the decree.
In the midstream market sector, Snam Rete Gas (still controlled by Eni) and Società Gasodotti Italia (affiliate of Edison) are the two main transmission system operators, and Snam Rete Gas retains ownership of the only operating LNG terminal. Other potential midstream players are developing new infrastructure but with marked difficulties, as outlined previously. Downstream, many districts and local governments control regional utilities and the segment remains very fragmented, despite ongoing concentration. The residential market is open to competition since 2003, but regulated domestic tariffs were ended only in 2007. Effective competition in this segment is practically non-existent (very low switching rates) and new entrants acquire residential customers only by buying local utilities.
Eni, via Snam Rete Gas and its wholly-owned affiliate Stogit, operates almost 98% of storage infrastructure in Italy while Edison owns and operates the remaining 2%. In the past, Eni has been accused by the regulator of not investing sufficiently in new underground storage facilities. Such investments are needed not only to ensure proper flexibility and security of supply for the Italian market, but also to enhance competition in a still uncompetitive market.
The Italian gas storage system is marked by structural and increasing deficiencies in the coverage of peak consumption in case of exceptionally cold weather conditions, and by the inadequacy of the destination of working
© O
EC
D/IE
A, 2
010

121
gas, determined by the regulator, mainly oriented to the modulation of residential consumption but not to commercial use. To preserve security of supply to residential consumers, a rather strong regulation has been put in place, encompassing precautionary reserve provisions, regulated TPA and favourable rules to foster investment in storage sites. However, the complex set of regulatory rules is not a panacea that solves the difficulty of balancing demand and supply as long as alternative flexibility tools, such as a large portfolio of interruptible customers or a spot market, are not adequately developed. A concentrated market structure does not help achieve an efficient usage of storage, nor does it reach a level of excess capacity that is the prerequisite to a fair and fully liberalised gas market.
Storage capacity could be deemed insufficient – 13 bcm per year of working volume, 5 bcm of which is dedicated to strategic storage, or a ratio to total demand of 15%, which is relatively low for the needs of the import-dependent Italian market. Insufficient storage capacity was a concern in 2007 for the regulatory authority that expressed fears of a potential winter shortage of available storage. This position encouraged the government to take emergency actions to optimise all supply and flexibility of infrastructure usage.
Regarding other physical infrastructure, a serious supply gap has failed to be addressed, and for the short term, partial solutions have been utilised, for example upgrading existing pipelines. However, new large-scale infrastructure is needed to bring additional volumes of gas to the Italian market. Much of this infrastructure is at an advanced phase of development. Supply contracts have been signed and could exceed expected actual supply needs; if so, gas will be rerouted to other European markets, but existing infrastructure is limited in its ability to do so.
RECOMMENDATIONS
The government of Italy should:
Develop a clear strategy for the natural gas supply infrastructure for the ◗
medium to long term, including a commitment to continue to improve the infrastructure development process through engagement, dialogue and transparency with local communities and by continuing to streamline the permitting process.
Continue the programme of unbundling of transportation, supply and ◗
storage businesses, reduce the share of public ownership in each, and improve gas storage access provisions to ensure appropriate investment signals to the market.
© O
EC
D/IE
A, 2
010

122
Continue to promote a liquid and competitive gas market, which will support ◗
the development of a virtual gas trading point (PSV) as a trading hub and facilitate the emergence of a gas futures market and new suppliers.
Take steps to reorganise the structure of the gas market at distribution level ◗
to increase the efficiency of the sector and achieve economies of scale.
Continue to pursue the regional integration of the Italian gas market ◗
through interconnection and harmonisation of networks and investment in reverse flow on transit pipelines in the north.
Keep developing the retail market, most critically by revising the reference ◗
price-based default system so that new suppliers will be able to enter the market by offering market-based retail tariffs.
© O
EC
D/IE
A, 2
010
0
123
OIL
OVERVIEW
Almost all of Italy’s energy supply is derived from fossil fuels, with limited diversification when compared to other European or IEA member countries. Italy’s energy supply is dominated by oil and gas which in 2008 represented almost 80% of the total primary energy supply of 174 Mtoe. In 2008, oil (net of exports of petroleum products) provided 70.5 Mtoe, gas 69.5 Mtoe and coal 16.9 Mtoe with the remaining balance met by renewables and electricity imports. The country is heavily dependent on imports, with approximately 92.8% of its energy supply imported.
SUPPLY AND DEMAND
Oil demand has declined by 18% over the past eighteen years, dropping from 90.1 million tonnes in 1990 to 76.2 million tonnes in 2008. Forecasts for 2009 and 2010 indicate that this trend is set to continue in the near future. Italy is highly dependent on external sources for its oil supply, importing some 92% of its needs. While oil supply sources are well diversified, including some 30 different countries, imports from Libya and the former Soviet Union are the dominant sources of oil, each accounting for almost a quarter of all crude oil imports. Saudi Arabia, Iraq and Iran are also significant sources of oil, together representing an additional quarter of all oil imports. Import dependence is expected to remain high in the long term.
As natural gas replaces oil in electricity generation, the use of oil is becoming more concentrated in the transport sector. As such, consumption of residual fuels (notably heavy fuel oil) has been halved over the last decade. In 1973, oil consumption for transportation accounted for 19% of all oil consumed. This percentage rose to 35% in 1990, and has continued to inch up over the last decade, reaching 55% in 2007 while at the same time the progressive dieselisation of the vehicle fleet has significantly altered the demand structure. Diesel demand has grown by 59% over the last decade, whereas motor gasoline has dropped by 31%.
The results of the decreased use in residual fuel oils for electricity generation and the dieselisation of the Italian car fleet become apparent in the breakdown of product demand. Since the peak level of 1995, total oil demand decreased by an annual average rate of 1.1% to 2007. Over the same period, diesel consumption grew by an annual average rate of 4% while motor gasoline and residual fuel oil use declined by 3% and 6.3% respectively.
8
© O
EC
D/IE
A, 2
010
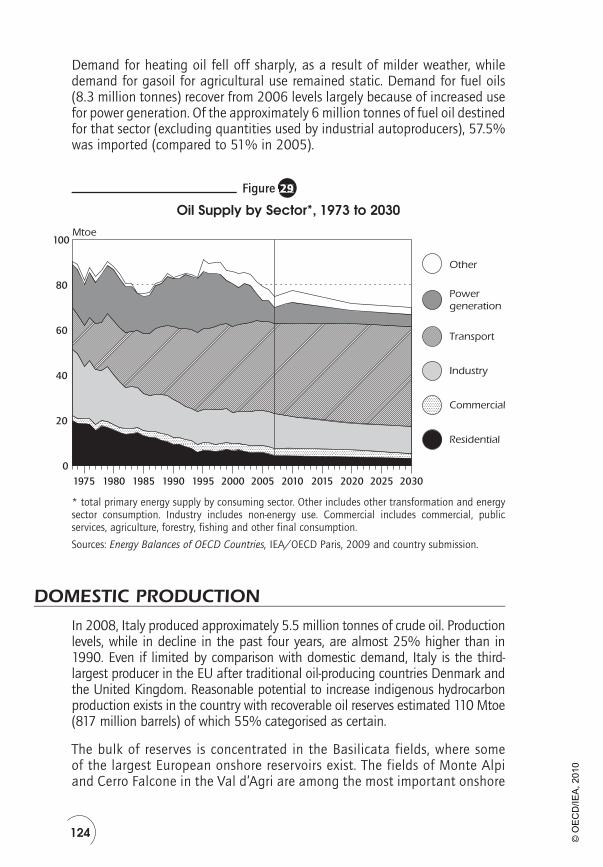
124
Demand for heating oil fell off sharply, as a result of milder weather, while demand for gasoil for agricultural use remained static. Demand for fuel oils (8.3 million tonnes) recover from 2006 levels largely because of increased use for power generation. Of the approximately 6 million tonnes of fuel oil destined for that sector (excluding quantities used by industrial autoproducers), 57.5% was imported (compared to 51% in 2005).
Figure 29
Oil Supply by Sector*, 1973 to 2030
0
Mtoe
Transport
Powergeneration
Other
Industry
Commercial
Residential
20
40
60
80
100
1975 1980 1985 1990 1995 2000 2005 2010 2015 2020 2025 2030 * total primary energy supply by consuming sector. Other includes other transformation and energy sector consumption. Industry includes non-energy use. Commercial includes commercial, public services, agriculture, forestry, fishing and other final consumption.
Sources: Energy Balances of OECD Countries, IEA/OECD Paris, 2009 and country submission.
DOMESTIC PRODUCTION
In 2008, Italy produced approximately 5.5 million tonnes of crude oil. Production levels, while in decline in the past four years, are almost 25% higher than in 1990. Even if limited by comparison with domestic demand, Italy is the third-largest producer in the EU after traditional oil-producing countries Denmark and the United Kingdom. Reasonable potential to increase indigenous hydrocarbon production exists in the country with recoverable oil reserves estimated 110 Mtoe (817 million barrels) of which 55% categorised as certain.
The bulk of reserves is concentrated in the Basilicata fields, where some of the largest European onshore reservoirs exist. The fields of Monte Alpi and Cerro Falcone in the Val d’Agri are among the most important onshore
29
© O
EC
D/IE
A, 2
010

125
fields in Western Europe. Production from these areas, which began in 2002, has more than made up for the irreversible decline from other regions.
In the neighbouring Valle del Sauro, the Tempa Rossa field is expected to start production shortly, following the signing of a Protocol of Understanding between the region of Basilicata and three companies participating in a joint venture (Total 50%, and Shell/ExxonMobil 25% each). Its reserves have been estimated at around 420 million barrels. At full capacity, it could be producing approximately 50 000 barrels of crude oil a day. Nevertheless, new upstream discoveries remain limited, and Italy’s reserves will progressively decline in the coming years.
The main barrier in accessing Italian reserves is administrative. Similar to natural gas exploration, the average time to market for exploration and production of oil is long. Depending on the authorities involved, the length of time involved ranges from 90 to 120 months as compared with 36 to 48 months elsewhere in Europe. This delay in getting oil to market discourages investors from carrying out exploration and production activity in Italy; on the other hand, the very low royalties are attractive.
In the coming period, from 2008 to 2011, domestic production of oil is expected to remain stable, due to the slightly increasing production of the Val d’Agri field. After 2011, production is expected to increase, following the full development of the Tempa Rossa field.
REFINING AND INFRASTRUCTURE
Italy has an important role as Europe’s largest refining centre, and is a net exporter of refined products, providing a large share of its finished products to other countries. There are 16 refineries operating in Italy, with a total crude distillation capacity of slightly more than 2.3 million barrels per day (mb/d). Total crude oil refining capacity stands at around 100 Mt annually, or roughly 2.1 million barrels per calendar day.
Four of these refineries are located in the northern part of the country (in the Po valley); the others are situated along the Mediterranean coast. The majority of crude and product pipelines are located in the north of the Italian peninsula and, as most refineries are situated along the coast, Italy has relatively few crude oil pipelines. The four inland refineries in the north receive crude by pipeline from Genova, Venezia and Vado Ligure.
The industry has made substantial investments to adapt the refineries to changing markets – particularly to the drop in demand for heavy fuel oil in the power sector and the growth of cleaner fuel consumption in the transport sector. All Italian refineries now comply with the EC directive on lower sulphur
© O
EC
D/IE
A, 2
010
126
content. However, further investment in desulphurisation capacity is necessary in light of ever-growing demand for diesel fuels of high-quality specifications coupled with greater availability of sour rather than sweet crude oils.
During 2006, existing structures of Italy’s main refineries were expanded and improved. Total effective capacity, understood as secondary refining for the production of petrol and gasoil according to specifications, reached 106.3 million tonnes, after remaining unchanged at 100.2 million tonnes since the end of the 1990s. At present, Eni plans to almost double the capacity of the Taranto refinery from 6.5 to 11 million tonnes. The project is in the authorisation process and investment is forecast at EUR 1 billion.
In order to meet the new standards for sulphur content, which took effect in January 2005; new plants capable of producing the new quality fuels were added to the refinery system. Desulphurisation capacity is currently 43.6 million tonnes compared to 25.8 million tonnes in 1996, an increase of 69%.
REFINERY OUTPUT
Refinery output in 2008 was 94.5 million tonnes, 5% lower than in 2007, 64% of which was either gasoline or gas/diesel oil products. Almost 26 million tonnes of oil products were exported in 2008 with Spain, Africa and non-OECD regions the main importers of Italian products. Gasoline and gas/diesel oils, 15 million tonnes, made up the bulk of the exported products. Italy imported 11.7 million tonnes of refined products largely from Europe and Africa, with the United Kingdom (2.5 million tonnes) and Libya (2.5 million tonnes) the largest suppliers.
Imports of crude oil in 2007 were 82 million tonnes, 7% lower than the previous year: 52.6 million tonnes were imported from OPEC members. The continent of Africa was the main source of imports accounting for 31 million tonnes, the bulk of which, 24.5 million tonnes, was sourced in Libya. Other significant exporters to Italy included Iraq (8.8 million tonnes), Iran (8 million tonnes), Saudi Arabia (7.7 million tonnes) and to a lesser extent, Norway (2.5 million tonnes). The remaining 27 million tonnes were largely sourced from former Soviet Union republics.
PIPELINES
Given the geographical location of most refineries along the Mediterranean coast, there are relatively few crude oil pipelines in Italy. In total, there are almost 1 200 km of crude oil pipelines and 1 700 km of product pipelines throughout the country, the majority of them located in the north of the country. The two major crude oil pipelines are:
© O
EC
D/IE
A, 2
010

127
Figure 30
Oil Pipelines
Isole Eolie
Sardinia
Sicily
(Fr.)
San Marino
Milan
CE
L1
00
0k
b/d
Busalla
Livorno
Tarento
Milazzo
Gela
Augusta
Priolo
Ravenna
Falconara
Cremona Mantova
PortoMarghera
TrecateBiella
Collombey
Pantano
Sarroch
Naples
Palermo
Cagliari
Gagliano
Sta Maria
Rospo
Rovesti
TempaRossa
Vega
MilaPerla
NildeNorma
Narciso
Gela
Elba
Sannazzaro
TAL
85
0k
b/d
Comiso
0 100 200
KmMALTA
MONACO
FRANCE
Corsica
TUNISIAALGERIA
CROATIA
SLOVENIA
HUNGARY
AUSTRIALIECH.
SWITZERLAND
Rome
Aoste
Volpiano
Turin
Genoa
Piombino
Civitavecchia
FiumicinoManfredonia
Brindisi
Porto Foxi
Venice
Trieste
Savona
Ancona
Timau
UdineVisco
Portogruaro
Porto Tolle
Florence
Pescara
Pomezia
GaetaFoggia
Bari
Rossano
Crotone
Reggio
Messina
Catania
Ragusa
Enna
Trapani
Marsala
Oristano
Sassari
SermideFlorenzuola
Villasanta
Crude oil pipeline
Oil products pipeline Refinery
Tanker terminal
Major oil fieldOil storage site
Oil rig
ITALY
The boundaries and names shown and the designations used on this map do not imply official endorsement or acceptance by the IEA.
Source: Emergency Oil Supply, IEA, OECD Paris, 2009.
30
© O
EC
D/IE
A, 2
010
128
1. The Central European Line (CEL), from Genoa (capacity of 1 mb/d), which supplies inland refineries in the north of Italy and the Swiss refinery of Collombey;
2. The Trans-Alpine pipeline (TAL), from Trieste, which supplies Germany, Austria and the Czech Republic. The trunk line, from Trieste to Ingolstadt (TAL-IG), has a diameter of 1 011 mm and a capacity of 850 kb/d.
There is, however, no connection between the eastern and western halves of the northern pipeline network, raising concerns for accessibility during a supply disruption. The government is considering possible projects to interconnect east and west coast refineries in the country, as well as a project to link Trieste by pipeline to the Black Sea.
The PEOP (pan-European oil pipeline) is one among several pipeline projects under consideration, with a view to diversifying and improving security of supply. The proposed oil pipeline would start at Constant,a in Romania and travel through Serbia and Croatia to a point near Rijeka, and then through Slovenia to Trieste in Italy. It would involve Energy Community and European Union member states alike, and would be over 1 300 km-long, with a transport capacity of more than 60 million tonnes per year of crude oil, mainly from the Caspian Sea.
STORAGE
There are just over 700 industrial and commercial depots across the country (with a storage capacity over 3 000 cubic metres) contributing to a total national storage capacity of at least 26 million cm, of which over 50% is located in just four regions in the north of the country. Storage capacity is roughly split into one-third crude and two-thirds finished products.
No significant additions of storage capacity are expected in the immediate future. The development of further storage facilities is hindered by the high costs of port activities (notably dredging problems, as ships are increasingly large – thus limiting ability to access storage easily), environmental constraints and regional planning issues. Difficulties in obtaining all the necessary authorisations are the greatest impediment to further storage development.
LEGISLATION AND POLICY
The national strategy for oil exploration and production has changed little over the past 50 years. A significant change in the legislation on oil and gas upstream activities since the last in-depth review has been Law no. 239, enacted in August 2004. This law aimed to simplify the procedures for obtaining permits of exploration and production.
© O
EC
D/IE
A, 2
010

129
There are no particular incentives for oil production; the royalties are set by Decree 25, no. 625 (Art. 18) of November 1996, to implement the EEC Directive 94/22. They are set at 7% for gas and oil production on land, 4% for oil at sea. Exceptions concern each granting of cultivation for the first 20 000 tonnes of oil annually produced on land and 50 000 tonnes of oil annually produced at sea.
Environmental concerns from local communities also present a barrier to development and in this regard the Ministry of Economic Development, together with the regions, is adopting a number of actions to overcome some of the difficulties that most frequently arise. These actions include:
Publishing more detailed information in relation to new projects; ●
Providing technical support to local authorities throughout the development ●
process;
Maintaining ongoing dialogue between investors and other public bodies ●
involved in granting exploration and production licences.
Law no. 133/08 gave new initiatives for the exploitation of small oil deposits, while Law no. 99/2009 speeds up the authorisation procedures, both for research and for exploitation.
OIL MARKETS
Former state oil company Eni maintains a dominant position in the Italian upstream oil and gas sector, although a number of privately owned Italian and foreign companies have also established a significant presence in the sector.
Until 1995, Eni was a fully state-owned company with a large number of subsidiaries created to supply the Italian energy market. The company was involved in the purchasing, refining, distribution and marketing of oil products. In 1992, a programme was launched to privatise Eni. Between 1995 and 2001, the government reduced its share in Eni to 30.3%. In parallel to its privatisation, Eni restructured its activities to focus on the oil, natural gas and petrochemicals businesses. Between 1997 and 2003, Eni absorbed in three divisions the functions of the main subsidiaries that were running the activities of exploration and production (Agip), natural gas supply and commercialisation (Snam) and refining and marketing (Agip Petroli).
The Italian oil market is fully liberalised and import, export, trade and prices are free. The government intervenes only to protect competition and to avoid abuse of dominant position. Companies willing to establish refineries and oil product storage facilities only need a concession to do so. Distribution is principally undertaken by integrated oil companies. Eni currently has the largest share of the market (30%) and it intends to increase retail market share in Italy.
© O
EC
D/IE
A, 2
010

130
There are three non-OECD companies operating in Italy: Libyan Tamoil Italia owns a refinery in Cremona; Kuwait Petroleum Italiana owns 50% of the Milazzo refinery, currently managed in a joint-venture with Eni; and as of June 2008, Russian-owned Lukoil owns a 49% stake in the Priolo refinery in Sicily. Their combined market share of the Italian retail distribution is around 18% and approximately 17% of the wholesale market. The three companies have refining and marketing operations, and are defined as Italian undertakings subject to the Italian petroleum legislation.
DOWNSTREAM MARKETSIn the downstream market for oil products, competition is hampered to some extent by the State. There are persistent restrictions on the entry conditions into the market for companies that are not vertically integrated and this has led to an unsatisfactory degree of modernisation of the distribution network (still characterised by a particularly large number of service stations, an average output per pump substantially inferior to the European average and a very low percentage of self-service facilities), high prices and more generally an insufficient degree of competition in the market, at the expense of consumers.
The Competition Authority has pointed out that the legal definitions of catchment areas, mandatory minimum distances between pumps and minimum areas designated for commercial activities are barriers to the opening of new retail outlets with modern and automated structures and discriminate against large-scale distributors that intend to install a service point in their commercial complex.
Law no. 133 of 6 August 2008 was a response to this shortcoming and it introduced reforms, such that Italy has fully responded to the notification received under infringement procedure 2004/4365 of the European Commission. The following commercial barriers have been eliminated:
Catchment areas; ●
Mandatory minimum distances between pumps; ●
Minimum areas designated for commercial activities; ●
Limits and obligations concerning the integration of oil and non-oil ●
business within the same filling station.
EMERGENCY RESPONSE POLICY AND ORGANISATION
POLICY
Responsibilities for energy policy design and implementation are shared between the government and regional authorities. The Ministry of Economic Development, formerly the Ministry of Productive Activities, is responsible for
© O
EC
D/IE
A, 2
010
131
energy policy and also for maintaining an operating handbook on emergency procedures and measures for oil supply disruptions.
Within the ministry, the Oil Office in the Energy and Mineral Resources Directorate functions as the permanent body of the National Emergency Sharing Organisation (NESO). Its role is to monitor data in relation to specific tasks, and, in case of an emergency, to prepare information, data and studies needed by the Conference of Services (see below), to assist in taking decisions and ensure liaison with the IEA Secretariat. As such, the Oil Office monitors the oil market and maintains contacts with industry and the IEA. This permanent body is also responsible for monitoring industry’s compliance with minimum stockholding requirements. Three employees are occupied with the calculation, reporting and control of emergency stocks held in Italy.
In the event of a disruption, the ministry convenes the full NESO body, called the Conference of Services. This includes representatives from several relevant ministries: the Ministry of Foreign Affairs; the Ministry of the Interior and its Department for the Civil Defence; the Ministry of Transport; the Ministry of Defence; the Ministry for the Environment; the Ministry of Health; and the Ministry for Communications. The Conference of Services also includes representatives from the oil industry and industry associations.
The Conference of Services, chaired by a representative of the Ministry of Economic Development, meets within 24 hours of an emergency to decide the measures that may be necessary in a supply disruption.
A NESO decision to use emergency reserves during a supply disruption would be announced in a ministerial decree authorising companies to reduce their mandatory stocks by a certain amount and to make these stocks available to the market. NESO would inform oil companies about the content of the ministerial decree through a direct and personalised communication to each company, which would include an indication of its share of stock draw-down.
Legislative Decree no. 22 of 31 January 2001 states that the then Ministry of Productive Activities draws up and updates an operating handbook (Handbook for the Management of Energy Emergencies) containing the measures to be adopted and the procedures to be followed in case of an oil emergency. The latest version of the handbook,20 from 2003, places emphasis on such measures as public appeals to reduce energy consumption; reduction in heating levels and hours; driving restrictions; stock draw-down; and fuel switching away from oil in electricity generation to other sources.
Directive 2006/67/EC is now the basis for the maintenance of compulsory stocks of crude oil and products, codifying all previous legislation on the matter into a single text. Oil companies continue to work with the Ministry of
20. Annex VI, 2003.
© O
EC
D/IE
A, 2
010

132
Economic Development by providing data on the transit and storage capacity available to third parties, as previously required by article 5 of Legislative Decree no. 32/98.
The Minister of Economic Development has all necessary powers to ensure that Italy meets its international obligations, including participation in an IEA co-ordinated emergency response to an oil supply disruption. The Administration has no plans to undertake any training sessions apart from those conducted by international bodies.
EMERGENCY RESERVES
Legislation
Legislative Decree no. 22 of 31 January 2001 established the legal basis for stockholding obligations on industry. The Ministry of Economic Development establishes on a yearly basis the total oil stocks to be held for the country overall, in accordance with the obligations of the European Community and the IEA.
All stocks in Italy are held by industry. Italian legislation requires that total compulsory stocks for the country as a whole must not be less than 90 days of internal consumption during the preceding calendar year. This applies to the three categories covered by EU obligations.
The total amount of stockholding obligations is distributed proportionally among the various companies present on the market on the basis of the amounts of products (for the three categories foreseen by the European Union) sold in the previous year. The holding requirements are then increased by the difference needed to meet the country’s obligations as an IEA member – i.e. to hold total oil stocks of at least 90 days of net imports.
Legislative Decree no. 32, of 11 February 1998, established a National Reserve Stock Agency (Agenzia Nazionale delle Scorte di Riserva). However, this agency never played a role in the holding or managing of emergency reserves. We understand that the current Administration has eliminated the National Reserve Stock Agency by submitting an amendment of the law to the Italian Parliament. The government plans to create a similar agency within the ministry, one which will achieve the aims that were laid out for the previously existing agency.
The Ministry of Economic Development determines how Italy’s overall minimum stockholding needs are allocated across all industry operators. There are approximately 100 companies with stockholding obligations in Italy. Refiners processing for third parties abroad or for export must hold stocks equivalent to 23 days of supply of the products obtained from such processing
© O
EC
D/IE
A, 2
010

133
arrangements. This amount is deducted from the national obligation calculated by the ministry. The balance is then allocated to all operators that delivered products (from EU Categories I, II and III) for domestic consumption in the preceding calendar year.
Secondary storage licence-holders (small products depots authorised by the local prefecture) are required to hold stocks equivalent to 10% of gross tank capacity. As these depots are distributed widely over the country, such a compulsory stock requirement ensures broad product availability in an emergency. Individual stockholding commitments of one company may be transferred to another through leasing or storage rental agreements. This is the case for roughly half of the companies with holding obligations, which are typically smaller companies that do not have storage facilities. All transfers of stockholding obligations must be communicated to the Ministry of Economic Development by 10 p.m. of the day before the transfer agreement’s start. Companies are obliged to report on a monthly basis to the ministry the exact location, product and quantity of stocks. In times of possible tensions on the international markets or in a supply crisis, the ministry can demand more frequent reporting (e.g. fortnightly or weekly). In collaboration with the Revenue Guard Corps and the Customs Agency, the ministry monitors each company’s compliance with the decree obligations. Companies are obliged to report stock movements and transfers on a daily basis.
The standard sanction for breaching stock obligations is a fine of EUR 5.165 per tonne per day, for each tonne by which the company falls short of its prescribed minimum for that specific location.
In a Coordinated Emergency Response Measure (CERM) type action, the ministry has the authority to impose a stock draw-down on industry, should the situation require. If the emergency-sharing system (ESS) were to be activated, the NESO would make emergency reserve draw-down obligation (ERDO) calculations and transmit this to each company. The time required from a government stock-draw decision until the physical deliveries is estimated to be less than 24 hours.
Reserves
In general, Italy stipulates that all compulsory stocks must be held as products. The exception is that companies with a holding obligation may hold crude oil to meet up to 40% of their light/middle distillate stocks obligations, and up to 50% of their fuel oil stock obligations, in line with European legislation.
As of October 2008, Italy’s overall stock cover equated to 105 days of net imports. This was composed of roughly one-third crude stocks and two-thirds refined product stocks. Some 40% of the refined product stocks were held in the form of middle distillates.
© O
EC
D/IE
A, 2
010

134
The compulsory and commercial stocks are commingled. No financial support is given to oil companies for holding stocks. An estimated breakdown of costs is listed in Table 11. Since oil stocks are held only by companies, they are delivered through normal market channels and no tests of stock draw-down are considered necessary by the Administration.
Table
Average Monthly Cost of Oil Stocks (in EUR per tonne)
Type of stock Stocks at company’sown plant
Stocks held at another company’s plant
in Italy abroad
Crude oil 3.25 2.33 1.50
Cat. I - Oil products 6.67 2.92 1.64
Cat. II - Oil products 4.23 3.51 3.60
Cat. III - Oil products 1.75 1.42 0.54
Source: Italian Administration.
In 2007, total Italian compulsory stocks, as defined by Legislative Decree no. 22/01, remained more or less the same as in 2006. Regarding EU obligations, there was a reduction in obligations for category I products (gasolines), but this was counterbalanced by an increase in obligations for category II products (middle distillates), while the obligation for category III products (fuel oils) remained stable.
Coverage of category II stocks, which represent more than 60 % of the total, became more critical after April 2007 once the possibility of substituting them with products from other categories was eliminated. Given this situation, efforts were made to provide greater flexibility to operators through the authorisation of new bilateral agreements for the maintenance of stocks abroad. Besides the initiative of simplifying the “gentlemen’s agreement” with the Netherlands and transforming it into an official one, initial contact was made with other countries such as Cyprus, Malta, Denmark and Hungary with a view to reaching agreements (see below for details).
Bilateral agreements and tickets
Decree no. 22/2001 also sets out the guidelines for intergovernmental agreements on stockholding with other EU member states, in order to facilitate the coverage of stock obligations for companies.
Italy has bilateral agreements (i.e. government to government) with Germany, Spain and Slovenia. An agreement was recently signed with the Netherlands but is still awaiting ratification by the Dutch Parliament; in the meantime,
11
© O
EC
D/IE
A, 2
010
135
Italy and the Netherlands are operating according to a previous “gentlemen’s agreement” that does not differ much from the tentatively definitive agreement. In addition, bilateral agreement with Malta and Cyprus are now close to conclusion, while the reciprocal contacts with Denmark and Hungary for the drawing-up of bilateral agreements are still at the preliminary steps.
With the exception of Germany, with whom an agreement already existed that had clearly limited bilateral ticket agreements to 10% of each country’s total reserves, Italy has no maximum ceiling for the amount of bilateral stocks which companies can hold in other countries in order to fulfil their reserve holding commitment. Most stocks held in other countries under bilateral agreements are in the form of tickets.
Some 2.3 million tonnes of compulsory stocks are held in other countries, accounting for around 13% of total stocks and around 12 days of net imports. Some 0.75 million tonnes on average are held in Italy on behalf of other European countries.
Both of these types of bilateral stocks are largely held in the form of short-term leasing contracts, referred to as tickets. Companies are allowed to meet some or all of their stockholding obligations in the form of tickets, either domestically or in other EU member countries. Companies are obliged to report the exact location, product and quantity of stocks to the ministry, and can only enter bilateral stockholding agreements for a minimum period of three months.
Compliance with the obligation by using tickets is rendered difficult by the low level of liquidity of the middle distillate ticket market.
Policy and legal instruments
In 2003, the approach to demand restraint was re-established by the preparation of the Italian Handbook for the Management of Energy Emergencies. The Conference of Services, once activated by the Minister of Economic Development, has the legal authority to decide upon and implement demand restraint measures, implementing them through its operational structures. The decision process has never been tested, but it is the same process as that followed in case of an emergency situation, going from the Minister of Economic Development to the Conference of Services.
Procedures and monitoring
The specific measures considered include appeals to the public for voluntary measures to limit consumption, reduction in domestic heating, and possibly also driving restrictions. During a crisis, monitoring activities would be intensified, including increased frequency of reporting of stock levels and
© O
EC
D/IE
A, 2
010
136
product deliveries to the market. Industry participants would also be required to submit forecasts of anticipated sales on a regional basis. The regional prefectures would become responsible for monitoring deliveries to vital sectors and making initial data verification of regional reporting.
If the crisis became more severe, the restraint measures would be tightened. Regional shortages of oil products could be addressed through a redistribution of supplies, subject to the approval by the Ministry of Economic Development.
The Italian Administration notably lists the following options as possible demand restraint measures:
Car-pooling (very limited impact); ●
Driving bans (experience regarding odd/even licence plate scheme); ●
Speed limits (this has never been done); ●
Free public transport (the dearth of good public transport services limits ●
effectiveness);
Telecommuting (at the pilot experimentation stage); ●
Compressed working week (impact limited by the fact that people drive ●
during their free time).
The Administration has indicated that the driving ban is the measure that would be prioritised if it resorted to demand restraint measures. Indeed, Italy has much experience in imposing odd/even licence plate schemes, mainly to reduce air pollution in metropolitan areas during the winter. On an average day of application, this measure can reduce by 10% to 15% normal gasoline and diesel consumption for transportation.
Costs and evaluation measures
No estimates of the cost of implementing each of the demand restraint measures are available nor have there been recent studies on volumetric savings from demand restraint measures.
As a consequence of the greater use of natural gas for heating, the use of oil is diminishing. This reduces the scope of oil savings possible through demand restraint measures on domestic heating. With the concentration of oil usage in the transport sector, the potential for short-term oil savings through demand restraint measures is decreased.
The Italian Administration has indicated that a new study on demand restraint will be undertaken, following the reorganisation of the ministry and the creation of an Energy Department. In theory, this study should be undertaken within the next three years.
© O
EC
D/IE
A, 2
010

137
OTHER RESPONSE MEASURES
Increased production (surge production)
The scope for surge production of crude oil is very limited as active fields operate at or close to maximum capacity. Italy has no plans to relax product specifications in a crisis in order to increase output of petroleum products. This would create problems of segregation and exports to other countries which have not implemented similar measures. Changing product specifications is considered to be a “last resort” measure which would require general consensus among all EU member states.
Fuel switching
During the Gulf crisis, Italy used about half of its fuel-switching capacity at the time (4 000 t/d, or 27 kb) by replacing fuel oil with natural gas. The Administration estimates that around a third of oil-fired plants can switch to gas in case of an emergency.
However, the use of this emergency response measure as an option in an oil supply disruption is quickly fading. The amount of fuel-switching capacity is more and more limited because of the decreasing share of oil in thermoelectric plants. Oil accounted for only 7.4% of total electricity generation in 2007, whereas it previously accounted for 51% back in 1995. This equates to a maximum theoretical capacity of switching from oil to gas of about 2 Mtoe (14 mb), with an additional 1 Mtoe (7 mb) capacity to switch to coal. New power plants being brought on line in Italy are natural-gas-fired, and no new dual-fired power plants are being planned in the near future. As such, the share of oil in electricity production is expected to continue to decline.
CRITIQUE
Italy is supplied with oil and oil products from a wide variety of sources and supplements these purchases with local production. With the changing shape of the electricity generating portfolio, oil-fired generation is being backed out by gas and new coal technology focusing much oil consumption in the transport sector. While local production is small in terms of overall consumption, it represents a large portion of European production and maintains the potential for further continued production of crude oil. While large volumes of certain reserves remain to be exploited, there are administrative barriers in relation to bringing these reserves to market.
Good progress has been made in the restructuring of the refining sector and the industry is in compliance with the EU directive on lower sulphur content
© O
EC
D/IE
A, 2
010

138
but there remain some weaknesses in the transportation infrastructure. Plans to connect refineries on the west and east of the country by pipeline should be accelerated to increase the robustness of the network in times of disruption. Likewise, proposals for the pan-European oil pipeline should also be advanced for the same reason.
While liberalisation and market reform have visibly had an impact on the wholesale markets for oil products, work remains in the reform of the mid-stream and downstream market sectors. The sale of gasoline and diesel at retail forecourts is still governed by outdated legislation, which is having a negative impact on retail prices and hampering competition. Legislation that determines catchment areas, minimum distances between pumps and that limits commercial activities of retailers place significant barriers in the way of meaningful competition in the sector.
Given the changes in Italy’s energy supply mix, with greater use of natural gas, and the growing concentration of oil consumption in the transport sector, emergency response policies must be adapted accordingly. In this regard, the Administration is taking a positive step by stating its goal to update the Handbook for the Management of Energy Emergencies within the next two years, in order to take into account changes in the country’s energy situation and policies. At the same time, there appears to be a lack of training or exercises conducted in order to test the mechanics of the emergency response mechanisms within the Administration. IEA member countries are asked to regularly test and update internal procedures in order to assure their effectiveness at the national level when used in an IEA co-ordinated response.
It is commendable that Italy has taken the necessary steps to ensure that the country has remained consistently compliant with its stockholding obligations in recent years. Prohibitive fines are regularly levied on non-compliant companies. These actions, coupled with regular monitoring procedures, provide a strong incentive for all market participants to ensure compliance.
It is disappointing that the Italian Administration is eliminating the existing national stock agency primarily as a rationalisation measure. It is likely, however, that a new unit tasked with the same objectives as the current agency will be created within the Ministry of Economic Development, one which will be more involved in the emergency activities like technical support for the ministry in the oil emergency system. Such a unit could be useful but it is different from a stockholding agency. An agency with proper technical expertise, control over emergency reserves and clear guidance and authority regarding stock draw-down in an emergency could help to alleviate the burden on the ministry.
© O
EC
D/IE
A, 2
010

139
RECOMMENDATIONS
The government of Italy should:
Develop a strategy for oil supply infrastructure for the medium to long term, ◗
including a commitment to continue to improve the infrastructure planning and permitting process.
Reform legislative arrangements in the mid-stream and downstream markets ◗
for oil products with a view to passing on the full benefits of competition to consumers.
Evaluate its demand restraint measures in the transport sector. The growing ◗
share of oil use in this sector makes restraint the most effective means for saving oil in a crisis.
Create a stockholding agency – in one form or another – with control over ◗
emergency reserves in order to assure the availability of reserves in a supply disruption.
Examine the availability of ticketed stocks, in order to improve its ability to ◗
bring additional oil to the market during a disruption.
© O
EC
D/IE
A, 2
010

© O
EC
D/IE
A, 2
010
0
141
COAL
OVERVIEW
Demand for coal in Italy is almost completely met by imports, the equivalent of 16.7 Mtoe (24 Mt of coal equivalent) in 2008, which, taken together with local production, represented almost 9.6% of TPES.21 Coal-fired generation contributed 49.14 TWh, or 15.7%, to electricity supply in 2008. This represents a slight increase on the previous year and is almost 25% greater than in 2002. Diversification of import sources is very high and the main sources of coal supplies in 2008 were Indonesia, South Africa, Colombia, Australia and the United States.
DOMESTIC PRODUCTION
Italy has very limited coal reserves and production capacity. Small amounts of coal are produced at the Sulcis mine in Sardinia, which has a production capacity of about 400 000 tonnes per year. Sulcis coal has a calorific value of 5 000 kcal/kg and is relatively poor in quality in terms of ash and sulphur content. The mine recently became operational in order to supply the Sulcis 3 Enel Produzione AFB power station in Portovesme. The mine will also supply a new coal-fired power plant, the integrated Sulcis project to be built in the Sulcis area, which will use a combination of locally produced coal and imports. This latter arrangement has concerned the European Commission.22 Italy intends to subsidise the operation of the plant by purchasing part of its electricity at a price which is above the market price. The plant is then required to sell the rest of its electricity to the local energy-intensive industries below the market price. The Commission is concerned that this arrangement may give an undue competitive advantage to the plant operator, who would receive operating aid, and also to the end-users, who would be able to purchase electricity at artificially low prices. The mine will also supply a new coal-fired power plant, to be built in the Sulcis area, which will use a combination of local coal and imported coal. Recently passed Law no. 99/2009 foresees that one of the future Italian CCS demonstration projects should be realised in Sardinia, using also Sulcis coal.
21. 1 tce = 0.7 toe.22. http://europa.eu/rapid/pressReleasesAction.do?reference=IP/08/1151&format=HTML&aged=0&
language=EN&guiLanguage=en, 16 July 2008, last viewed 13 Jan 2009.
9
© O
EC
D/IE
A, 2
010

142
Figure 31
Coal Supply by Sector*, 1973 to 2030
0
Mtoe
Powergeneration
Other
Industry
Commercial**
20
10
30
1975 1980 1985 1990 1995 2000 2005 2010 2015 2020 2025 2030 * total primary energy supply by consuming sector. Other includes other transformation and energy sector consumption. Industry includes non-energy use. Commercial includes residential, commercial, public services, agriculture, forestry, fishing and other final consumption.** negligible.Sources: Energy Balances of OECD Countries, IEA/OECD Paris, 2009 and country submission.
INDUSTRY STRUCTURE
In Italy as elsewhere, there is persistent opposition to coal use largely because of environmental concerns. As a consequence, new coal power plant programmes come under strong opposition, even when clean, modern technologies to reduce pollutant emissions significantly are proposed. Electrical power capacity diversification is currently evolving towards natural gas, which relies on a very wide distribution network and greater social acceptability.
In recent years the Italian fleet of coal-fired power plants has greatly increased its efficiency. At present, the average efficiency of the fleet is 39%, which is above the European average efficiency of 35%. In the near future, if the switch from oil to supercritical coal of a number of power plants is implemented, efficiency levels of about 45% may be expected. All existing plant operators have put in place investment programmes for plant upgrading and optimisation and, from an environmental point of view, the use of the best technologies available will reduce conventional pollutant emissions.
Enel; with more than 5 380 MW of installed capacity, or 66% of the Italian coal-fired power generation fleet, is the largest coal-fired Italian utility.Over the last five years, Enel has overseen investments totalling almost
31
© O
EC
D/IE
A, 2
010
143
EUR 3 billion in upgrading and optimising its coal-fired plant portfolio. The first of the newly refurbished 660 MW units of the 1 980 MW clean coal-fired plant at Torrevaldaliga Nord near Civitavecchia in Lazio started operation in July 2008. A number of other coal-fired plants are undergoing authorisation procedures. In particular, the project of Porto Tolle (Venice) to switch from oil to supercritical coal has recently been approved by the Ministry for the Environment, Land and Sea through the approval of the environmental impact assessment.
CLEAN COAL DEVELOPMENT
POLICY FRAMEWORK
Interest in carbon capture and storage (CCS) technologies is growing in Italy as an emissions abatement option, as the country makes extensive use of natural gas and coal to generate its electricity. Also, Italy hosted the G8 Ministerial Summit in July 2009, which raised the profile of climate change and clean energy technologies, including CCS. Law no. 99/2009 recognises that CCS is one of the priorities of the Italian strategic energy technology plan, and a few CCS demonstration plants should be realised in the next years. Enel’s Porto Tolle plant is also likely to host a CCS project as part of the European Energy Programme for Recovery (EEPR) funding.
CCS RESEARCH, DEVELOPMENT AND DEPLOYMENT ACTIVITIES
A number of CCS research and development projects are being carried out in Italy, mainly led by the private sector, with the government focusing on communication and public acceptance. The Ministry of Economic Development’s Fund for Research and Development on the Electricity System provides funding for clean coal and CCS research. At present, funding of EUR 10 million per year is available, but only to CO2 capture. The previous political administration did not fund CO2 storage, and reduced CO2 storage research funding for the Industria 2015 initiative. Despite this, the Italian Ministry of Research has funded two CCS research and development projects for CO2 capture; coal gasification with CO2 separation and coal syngas production with CO2 and hydrogen separation.
The private sector has also invested in CCS. For example:
In 2006, Enel began a project to demonstrate an oxyfuel combustion ●
process with a 50 MW thermal pilot plant at the Brindisi power station by 2010, including a 35 MW electricity demonstration plant by 2012.
© O
EC
D/IE
A, 2
010

144
Demonstration of post-combustion capture is being investigated with ●
Enel’s coal-fired Porto Tolle (Venice) 2 000 MW electricity power station.A suitable storage site in the area is being examined by an ongoing feasibility study involving research institutes including Instituto Nazionale di Geofisica e Vulcanologia (INGV), Istituto Nazionale di Oceanografia e Geofisica Sperimentale (OGS) and Cesi Ricerca (now ERSE).
Two CO ● 2 storage pilot plants, based on enhanced coal-bed methane recovery (ECBM) technology, will be built by Carbosulcis with Sotacarbo/ENEA and the regional government of Sardinia at the Sulcis coal fields, and by independent resources in co-operation with INGV and OGS at Ribolla in southern Tuscany, near the Larderello and Amiata geothermal fields.
CO2 STORAGE POTENTIAL
In 2004, the EU’s JOULE II project gave a preliminary estimate of the CO2 storage potential in Italy at 440 Mt in deep aquifers (75% onshore) and 110 Mt and 1 690 Mt in depleted oil and gas fields (onshore and offshore). A further comprehensive survey of Italy’s storage capacity, including saline aquifers, was undertaken in 2006 by Italy’s R&D institutes. This produced larger capacity estimates, especially for aquifers (10 to 40 Gt). These estimates still need to be verified.
Potential storage sites have been identified along the Adriatic Sea (north and south) offshore and partially onshore, along the Bradanic basin, throughout the Po valley, in the central part of the Tyrrhenian Sea, and along the coasts of the Calabria and Sardinia regions. Eni is also working with Italian universities to screen the storage potential of 20 depleted reservoirs managed by the company.
CRITIQUE
Coal production in Italy is limited to very small coal mines in Sardinia. Italy is therefore dependent on imports to meet its needs. In 2008, total imports stood at circa 17 Mtoe. Coal use is expected to increase rapidly in Italy, owing to an ongoing programme of power station conversion at Enel. Older open-cycle oil/gas turbine plants are being converted into high-efficiency coal plants, to increase efficiency of the system and fuel diversification. Enel expects to phase out major oil-fired generation, leaving only small plants on the islands, or for peaking needs in operation. Increased use of coal will improve security of supply, but add to the challenge of achieving the environmental targets set to Italy. This will be capped by the EU-ETS; therefore, in cases of high CO2 prices Italy may be vulnerable. The government should therefore ensure that new coal plants should include carbon capture and storage (CCS) technology when this becomes available. Failing to do so will risk locking in existing technology for a long period and losing a significant opportunity to limit future emissions.
© O
EC
D/IE
A, 2
010

145
Regarding clean coal technologies and CCS, Italy is well placed to become a European leader and has already made a good start in investment and research. There appears, however, to be a clear lack of co-ordination between overall energy policy and investment in this sector. Monies are unevenly spread and the State and private enterprises appear in many cases to be competing for resources. Policies and investment strategies in this sector need to be streamlined and co-ordinated not only in the context of energy policy but also in energy technology and research.
RECOMMENDATION
The government of Italy should:
Develop a clear vision, in partnership with industry and research institutions, ◗
for the future of coal in Italy, including carbon capture and storage considerations.
© O
EC
D/IE
A, 2
010

© O
EC
D/IE
A, 2
010
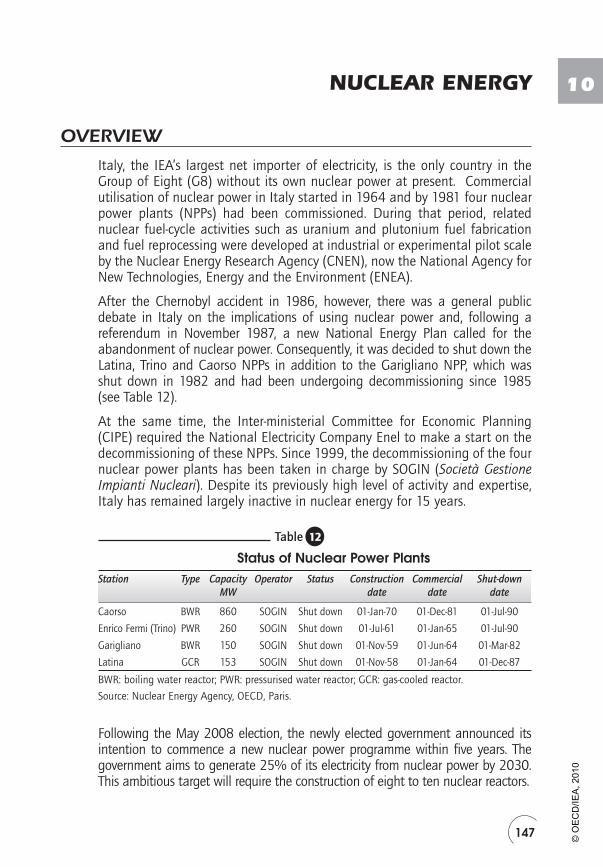
0
147
10NUCLEAR ENERGY
OVERVIEW
Italy, the IEA’s largest net importer of electricity, is the only country in the Group of Eight (G8) without its own nuclear power at present. Commercial utilisation of nuclear power in Italy started in 1964 and by 1981 four nuclear power plants (NPPs) had been commissioned. During that period, related nuclear fuel-cycle activities such as uranium and plutonium fuel fabrication and fuel reprocessing were developed at industrial or experimental pilot scale by the Nuclear Energy Research Agency (CNEN), now the National Agency for New Technologies, Energy and the Environment (ENEA).
After the Chernobyl accident in 1986, however, there was a general public debate in Italy on the implications of using nuclear power and, following a referendum in November 1987, a new National Energy Plan called for the abandonment of nuclear power. Consequently, it was decided to shut down the Latina, Trino and Caorso NPPs in addition to the Garigliano NPP, which was shut down in 1982 and had been undergoing decommissioning since 1985 (see Table 12).
At the same time, the Inter-ministerial Committee for Economic Planning (CIPE) required the National Electricity Company Enel to make a start on the decommissioning of these NPPs. Since 1999, the decommissioning of the four nuclear power plants has been taken in charge by SOGIN (Società Gestione Impianti Nucleari). Despite its previously high level of activity and expertise, Italy has remained largely inactive in nuclear energy for 15 years.
Table
Status of Nuclear Power PlantsStation Type Capacity
MWOperator Status Construction
date Commercial
date Shut-down
date
Caorso BWR 860 SOGIN Shut down 01-Jan-70 01-Dec-81 01-Jul-90
Enrico Fermi (Trino) PWR 260 SOGIN Shut down 01-Jul-61 01-Jan-65 01-Jul-90
Garigliano BWR 150 SOGIN Shut down 01-Nov-59 01-Jun-64 01-Mar-82
Latina GCR 153 SOGIN Shut down 01-Nov-58 01-Jan-64 01-Dec-87
BWR: boiling water reactor; PWR: pressurised water reactor; GCR: gas-cooled reactor.
Source: Nuclear Energy Agency, OECD, Paris.
Following the May 2008 election, the newly elected government announced its intention to commence a new nuclear power programme within five years. The government aims to generate 25% of its electricity from nuclear power by 2030. This ambitious target will require the construction of eight to ten nuclear reactors.
12
© O
EC
D/IE
A, 2
010

148
In June 2009, the government introduced a package of nuclear legislation, including measures to set up a national nuclear research and development entity, to create a new Agency for Nuclear Safety (ANS), to adopt new simplified licensing procedures for plant construction and operation, to define the criteria for selecting nuclear plant sites, to select reactor types allowed to be built in Italy and to develop compensation measures earmarked for the local population affected by the proposals.
POLICY AND FRAMEWORK
The new National Energy Strategy will include the rebuilding of the nuclear sector. The government expects that this policy shift will improve competitiveness in the production of electricity, diversify energy sources and reduce greenhouse gas emissions. The first step is to rebuild the legal framework and the technological conditions that will allow the start of construction of a new nuclear power plant by 2013.
The reintroduction of nuclear power moved closer in July 2009 when the package of proposed legislation successfully went through the lower house, the Chamber of Deputies and the upper house, the Senate of the Republic. Law no. 99 entered into force on 15 August 2009. The government is reinforcing its strategy by concluding agreements with some countries owning advanced know-how on nuclear technologies. A first agreement was signed in February 2009 with France, in order, among other things, to strengthen co-operation on safety, reactor construction, operation and dismantling, and waste disposal.
In 1999 the Società Gestione Impianti Nucleari (SOGIN) was set up as a state-owned enterprise to take overall Enel’s and ENEA’s nuclear assets and be responsible for decommissioning them. It was also to take responsibility for all nuclear wastes. On the basis of Law 99/2009, SOGIN will be reorganised and part of its assets should be marked over to companies operating in the energy sector and owned at least 20% by the Italian State. In November 2007, Electricité de France (EDF) and Enel signed an agreement that gave Enel a share in the new Flamanville-3 plant in France.
Following on from this and in the light of new Italian policy on nuclear energy, in August 2009, EDF formed a joint venture with Enel to conduct feasibility studies towards at least four European pressurised water reactors (EPR) in Italy. Any Italian reactors would be built, owned and operated by new consortia instituted for the task. Enel would retain a majority stake and EDF’s involvement would be expected, but further investors would also be invited. Enel is also involved in nuclear power in Slovakia and via its ownership stake in Endesa.
© O
EC
D/IE
A, 2
010

149
REGULATORY BODIES AND NUCLEAR SAFETY
On the basis of Law 99/2009, the competent national bodies for licensing of nuclear installations and radioactive waste management in Italy are the following:
MINISTRY OF ECONOMIC DEVELOPMENT
The Minister of Economic Development (formerly the Minister of Productive Activities) in agreement with the Minister for the Environment, Land and Sea, the Minister of Infrastructures and Transport and the Conference State-regions-local institutions, is the authority which grants the licence/authorisation for nuclear activities, from the design and construction to the decommissioning and waste disposal. The Ministry of Economic Development is in charge of major practices involving the use of ionising radiations, including the operation of all nuclear and radioactive installations. It receives technical advice from the Agency of Nuclear Safety. This advice is mandatory and binding for nuclear power stations. Authorisations are granted also on the basis of the environmental assessment provided by the Ministry for the Environment, when applicable, and on the basis of the advice provided by the Ministries of Environment, Internal Affairs, Welfare, and Health and by the region where the installation is located.
AGENCY FOR NUCLEAR SAFETY (ASN)
The Agency for Nuclear Safety (formerly National Agency for Environmental Protection – ANPA) is responsible for the regulation and supervision of nuclear installations in matters of nuclear safety and radiation protection. Any licence granted by the Ministry of Economic Development incorporates the legally binding advice of ANS. It is a body governed by public law, with administrative and financial autonomy. The ASN is led by a president and four members, nominated with a Decree of the President of the Italian Republic. The Prime Minister designates the ASN president, and both the Minister of Economic Development and the Minister of the Environment designate two members. The competent Parliament Commissions have to express their positive opinion.
TECHNICAL COMMISSION FOR NUCLEAR SAFETYAND HEALTH PROTECTION FROM IONISING RADIATIONS
This Commission is composed of experts from ENEA, ASN, the regions and various ministries. It gives independent technical advice with regard to the licensing of nuclear installations.
© O
EC
D/IE
A, 2
010
150
DECOMMISSIONING AND WASTE DISPOSAL
By the end of 1999, the then Ministry of Industry, Commerce and Crafts issued strategic guidelines for the management of liabilities resulting from past national nuclear activities. According to this new policy, all the nuclear installations should be completely decommissioned by 2020. In this respect, in 1999 all Enel’s liabilities connected to nuclear power were assigned to a newly established company, SOGIN, the Società Gestione Impianti Nucleari. SOGIN’s shareholder is the Ministry of Economy and Finance, while its strategic and operational aims are directed by the Ministry of Economic Development. In 2003 FN (Fabbricazioni Nucleari) and ENEA’s nuclear-related liabilities were also transferred to SOGIN.
The mission of SOGIN covers the implementation of a prompt decommissioning of the four national power stations with an unconditional release of the respective sites within twenty years, as well as the safe management of radioactive waste and spent fuel. At present, each of the four previously operated NPPs is at different stages in the process of being decommissioned.
At the end of 2008, some 143 tonnes of used fuel, 600 cubic metres of intermediate-level and high-level radioactive wastes and 13 500 cubic metres of very low-level and low-level radioactive wastes were stored in Italy. In November 2006, a bilateral French-Italian agreement cleared the way for SOGIN to sign a contract with Areva (27 April 2007) for reprocessing 235 tonnes of used fuel in storage. It is being shipped to La Hague between 2007 and 2011 and the waste is to be returned before 2025.
Previous spent-fuel reprocessing agreements took into account about 1 628 tonnes in total, including Latina’s Magnox spent fuel — about 1 425 tonnes — shipped to the United Kingdom for reprocessing at Sellafield. All reactors are now defuelled and according to a strategy for immediate decommissioning established in the late 1990s, dismantling and decommissioning operations are foreseen to end in 2019 (brown field). The total cost of this is estimated at EUR 5.2 billion, including EUR 1.2 billion for spent fuel and nuclear materials management. This is funded by a levy on electricity sales.
SOGIN’s plan for decommissioning will see the former fuel fabrication plant at Bosco Marengo becoming the first facility to be safely decommissioned, in 2009. The first nuclear power plant to be decommissioned will be Trino, in 2013. A national repository for wastes is envisaged, but previous attempts to identify a site have failed.
CRITIQUE
Nuclear energy will be beneficial as a source of energy diversity and a more balanced energy mix and also for overall economic growth. Furthermore,
© O
EC
D/IE
A, 2
010

151
nuclear energy will make a large contribution to reducing Italy’s future emissions profile. The government has recognised this fact and Italy has started to make good progress in its efforts to resume its place as a nuclear nation.
Over the coming years, Italy will need to systemically follow all of the steps necessary to rebuild its nuclear programme, as provided for by Law 99/2009. It will need to develop the institutions and facilities that will become necessary, if the nuclear programme progresses as expected, especially if it intends to develop a domestic capability for at least some steps in the nuclear fuel cycle. This will also include preparing detailed plans for nuclear waste management and continuing to develop the skills base in industry and government. Nevertheless, the country’s previous history in relation to nuclear power provides it with a strong start and the activities of Enel elsewhere further strengthen its position.
In order to meet its targets by 2030, Italy will have to build a number of nuclear plants, as many as eight to ten. In principle, the date of 2013 to start construction should be feasible once the new legislation adopted in July 2009 comes into force. Furthermore, to build nuclear plants, Italy would almost certainly have to improve its system of dealing with nuclear waste; 143 tonnes of nuclear fuels are still being stored in the old plants that were shut down years ago. The government must also accept that any proposal to build new large-scale energy infrastructure of the kind proposed is likely to run into difficulties at an early stage. This can be anticipated and the government must commence engagement with local communities affected by the new nuclear programme at a very early stage. The plans must also be supported by an effective, streamlined siting and transparent permitting process
RECOMMENDATIONS
The government of Italy should:
Systematically follow all the steps necessary to establish a nuclear ◗
programme, including the development of detailed plans for nuclear waste management, and ensure sufficient human capacity for the nuclear programme.
Maintain a strong and independent nuclear safety authority, separated from ◗
research and development activities in accordance with the proposals set out in Law no. 99/2009.
Develop and implement an efficient process for the siting of new nuclear ◗
energy infrastructure and subject it to an effective, streamlined siting and permitting process that includes a comprehensive programme of engagement with local populations directly affected by the plans.
© O
EC
D/IE
A, 2
010

© O
EC
D/IE
A, 2
010
PART III
ENERGY TECHNOLOGY
© O
EC
D/IE
A, 2
010

© O
EC
D/IE
A, 2
010

0
155
ENERGY TECHNOLOGY, RESEARCHAND DEVELOPMENT
OVERVIEW
Following the enactment of the 2007 Budget Law, the Ministers of Universities and Research, of Economic Development, and of Innovation and Reforms in the Public Administration signed a joint statement undertaking to jointly support Italian participation in European R&D initiatives. Particular emphasis was placed on joint technology initiatives and joint research programmes pursuant to Article 169 of the EC Treaty, with the preparation of specific national plans involving all relevant national public and private stakeholders. Following the installation of a new government in May 2008, the Ministry of Education and the Ministry of Universities and Research were combined once more.Thus there is now only one ministry dealing with education, universities and research..
The National Research Programme (PNR) is the main Italian research and development policy document. A PNR is prepared every three years and updated yearly. The previous programme addressed the period 2005-2007 and was prepared in accordance with the government’s guidelines for scientific and technological policy. The Ministry of Education, University and Research (formerly the Ministry of Universities and Research) co-ordinated its preparation. The document was drafted after extensive consultation with appropriate stakeholders including ministries, regional governments, the scientific community, the Confederation of Italian Industries, the Science Academy and the labour unions. The plan launched 12 strategic programmes to reinforce the competitiveness of Italy among which was energy.
A new National Research Plan covering the period 2008-2010 is awaiting approval. Funding for this plan was granted in accordance with the four macro-areas set out in the 2002-2006 government guidelines for R&D:
Curiosity-driven research, including energy. ●
Research with medium-term impact. ●
Industrial research and development. ●
Local development (high-tech districts). ●
Priority was attached to programmes related to: Environment, Transport, Energy, Agri-food, Health, Innovation and Communication Technology (ICT), New Materials and Nanotechnology, Production Systems and Cultural Heritage.
11
© O
EC
D/IE
A, 2
010

156
INDUSTRIA 2015Within the framework of its Strategic Action on Industrial Innovation, the Ministry of Economic Development launched the Industria 2015 programme in September 2006. Industria 2015 is considered one of the principal tools with which the government can reposition the Italian economy in the competitive global environment.
Industrial Innovation Projects (IIPs) represent the main and most innovative measure established by Industria 2015. Taking into account the technology and productive objectives fixed by the Italian government, IIPs aim to stimulate and promote the development of innovative and high-technology products and services in a variety of strategic areas, including energy efficiency and sustainable mobility. Total resources devoted to the IIPs are in the region of EUR 990 million with energy efficiency and sustainable mobility accounting for EUR 200 million and EUR 180 million respectively. In March 2008, the Ministry of Economic Development published calls for energy efficiency projects as defined by the terms set out in Industria 2015. The deadline for applications for funding under the programme was mid-September 2008.
In December 2008, the Minister of Economic Development announced that 22 applications for project funding involving participation of 250 enterprises and 100 research centres had been approved within the framework of the call for projects related to sustainable mobility. In the field of innovation in energy efficiency, Industria 2015 has approved 30 projects involving 234 companies and 160 research institutes. This involves the co-financing of EUR 200 million from a total investment expected to amount to EUR 500 million. Overall energy-related monies allocated to Industria 2015 are broken down as follows:
Energy Efficiency: EUR 250 million; ●
Sustainable Mobility: EUR 220 million. ●
The 2006 Budget Law created the Agency for the Diffusion of Technologies for Innovation, aimed at promoting the integration of research and productive systems through the valorisation and diffusion of new developments, technologies, patents and industrial applications at national and international levels. The criteria and modalities for the functioning of the Agency were set out in a January 2008 decree.
A commission nominated by the Minister of Economic Development is charged with the evaluation of energy efficiency projects within the framework of Industria 2015.
INSTITUTIONAL FRAMEWORK
Since the previous in-depth review, there have been significant changes in the institutional framework in relation to overall R&D in Italy. Following the
© O
EC
D/IE
A, 2
010

157
formation of a new government in May 2008, a number of ministries were reorganised; the Ministry of Education and the Ministry of Universities and Research have been unified once more. The Minister of Education, Universities and Research became, for the first time, a member of the Inter-ministerial Committee for Economic Planning, thereby placing greater emphasis on the strategic role that research can play in the preparation of the country’s development plans.
The Inter–ministerial Committee for Economic Planning (CIPE) is the highest level of R&D policy co-ordination. CIPE is especially competent in inter-sector and medium-term interventions and its role became more effective after a special section dedicated to research and education was created during the last decade. CIPE examines the document of economic and financial policy (DPEF). The document establishes strategic direction and priorities for scientific and technological research, financial resources and co-ordination among different public administrations, universities and research institutes. It includes the economic and financial measures for the following year, and is submitted by the ministers’ Cabinet to the Parliament each year. Subsequently, the Minister of Universities and Research became, for the first time, a member of CIPE.
The ministries involved in energy R&D are the Ministry of Economic Development (previously the Ministry of Productive Activities), the Ministry of Education, Universities and Research, and the Ministry for the Environment, Land and Sea. The main public research institutions that carry out energy R&D are the National Agency for New Technologies, Energy and the Environment (ENEA), the National Research Council (CNR) and CESI Ricerca (now ERSE).
ENEA and its associated companies are overseen by the Ministry of Economic Development, in agreement with the Ministry of Education, Universities and Research and the Ministry for the Environment, Land and Sea, which have their own representatives on ENEA’s Board of Administrators. ENEA has twelve research laboratories in Italy and employs 1 500 researchers.
ENEA is charged with:
Promoting and carrying out basic and applied research and technological ●
innovation, also through prototype development and product industrialisation;
Disseminating and transferring research results, encouraging their ●
exploitation for productive and social purposes;
Providing both public and private bodies and enterprises with high-tech ●
services, studies, tests and evaluations.
ENEA’s research activities are carried out under five headings:
The Environment, Global Changes and Sustainable Development; ●
Biotechnologies, Agro-industry and Health Protection; ●
© O
EC
D/IE
A, 2
010

158
Nuclear Fusion and Fission and Related Technologies; ●
Advanced Physical Technologies and New Materials; ●
Energy Technologies, Renewable Energy Sources and Energy Saving. ●
Following the Parliament decision to reuse the nuclear option, operated with the Law no. 99/2009, the same law foresees ENEA’s reorganisation, which will be redirected to research, innovation and services supply in the sectors of energy, in particular nuclear, and economic and sustainable development.
In higher-level educational institutions, the Inter-University Centre for Sustainable Development, a grouping of nine universities, is charged with carrying out R&D activities.
In 2006, CESI, a private enterprise devoted to R&D in the electrical sector, separated into two bodies: CESI and CESI Ricerca. CESI Ricerca, which has been recently renamed as ERSE, is at present 51% owned by ENEA. The remaining 49% is owned by GSE (Gestore dei Servizi Elettrici), which has purchased shares from CESI in July 2009. ERSE is active in electrical system R&D and employs approximately 400 scientists. Its activities are aimed at innovating and improving the performance of the electricity system from an economic, safety and environmental perspective.
ROLE OF REGIONS
Italian regions have a high degree of autonomy in relation to the planning and development of their own innovation and industrial support programmes. The regions and the autonomous provinces have co-ordinating functions in energy matters; they develop regional energy plans, identifying the goals to comply with under the Kyoto Protocol and the European Union’s climate and energy package.
Legislative Decree no. 112 of 31 March 1998 is a milestone in this regard as it assigns specific powers to the regions in terms of design and implementation of industrial and technological policies. More specifically, regions are in charge of the promotion of applied research, innovation, and technology transfer programmes and projects. Pure scientific research (basic research) used to be the exclusive competence of the central government. Some regions have, however, started to introduce regional instruments to support basic research. Research and innovation policies are carried out at regional and local levels by a regional research, development and innovation department alone or in collaboration with regional innovation agencies, which may be either publicly owned or funded from both public and private resources.
In an effort to enhance the competitiveness of the economy, and to reduce the persistent under-utilisation of resources in southern Italy, a National Strategic
© O
EC
D/IE
A, 2
010
159
Framework (NSF) was developed by the central administration and the regions. This framework was approved by the European Commission in July 2007. The NSF identifies ten priorities: human resources; promotion, exploitation and diffusion of research and innovation; energy and environment; social inclusion; natural and cultural resources; networks to increase mobility; productive systems and employment; attractiveness of cities and urban systems; promotion of international investments; governance and open and well-functioning markets.
Environmental protection and risk prevention will have a budget allocation of the European Regional Development Fund (ERDF) for the period 2007-2013 equivalent to 11.2 % of the entire budget of EUR 35.6 billion, of which 9.1% will be applied to renewable energy and energy-saving programmes. The total budget of the ERDF for renewable energy and energy saving for the period 2007-2013 is EUR 1.6 billion and is 50% funded by the European Union. The programme is articulated along three axes: energy production from renewable sources (EUR 779 million); energy efficiency and optimisation of energy systems (EUR 764 million); and technical assistance and related measures (EUR 64 million).
About 0.8 billion will be used for the same measures and in the same period in all southern regions. It is worth underlining that, in general, these resources will not be used to support RES-E plant construction, adequately backed up by green certificates or tariffs, but to support technology capability development and innovative infrastructures like smart grids.
PRIVATE SECTOR R&D
Eni, the Italian oil and gas company, and Enel, the Italian electricity utility, are large investors in R&D programmes, both in Italy and abroad. In 2007, Eni invested over EUR 208 million in its R&D programme (EUR 220 million in 2006), 47% of which was directed to energy exploration and production, 32% to refining and marketing, 14% to petrochemicals and 7% to engineering and construction.
The Eni “Along-with-Petroleum Initiative” addresses innovation in the fields of renewable energy sources and systems for efficient energy use. In 2007 the fund financed projects in the area of innovative photovoltaic projects (EUR 12 million) and biofuels (EUR 7 million). At present, a total of 1 082 people are employed in R&D activities and in 2007 a total of 69 applications for patents were filed (39 in 2006). Over the next four years, Eni plans to invest approximately EUR 1.7 billion to implement its technological innovation strategy. Approximately EUR 120 million of this will be available for the Along-with-Petroleum Initiative.
© O
EC
D/IE
A, 2
010

160
* 20
08 =
est
imat
es.
Sour
ces:
OEC
D E
cono
mic
Out
look
, OEC
D P
aris
, 200
9 an
d co
untr
y su
bmis
sion
.
Fi
gure
32
Gov
ern
me
nt R
D&
D S
pe
ndin
g o
n En
erg
y, 1
990
to 2
008*
32
0
Foss
il fu
els
Nu
clea
r
Oth
erte
ch./
rese
arch
Ren
ewab
leen
erg
y
Pow
er a
nd
sto
rag
e
Ener
gy
effic
ien
cy
100
200
300
400
500
600
700
800
1990
1991
1992
1993
1994
1995
1996
1997
1998
1999
2000
2001
2002
2003
2004
2005
2006
2007
2008
USD
mill
ion
at
20
07
price
s an
d e
xch
ang
e ra
tes
© O
EC
D/IE
A, 2
010
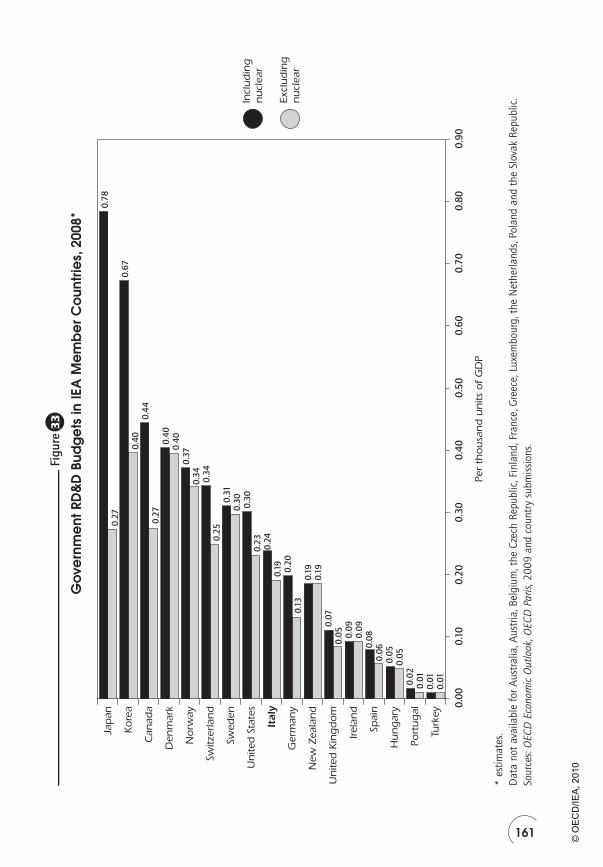
161
* es
timat
es.
Dat
a no
t av
aila
ble
for A
ustr
alia
, Aus
tria
, Bel
gium
, the
Cze
ch R
epub
lic, F
inla
nd, F
ranc
e, G
reec
e, L
uxem
bour
g, t
he N
ethe
rland
s, Po
land
and
the
Slo
vak
Repu
blic
.So
urce
s: O
ECD
Eco
nom
ic O
utlo
ok, O
ECD
Par
is, 2
009
and
coun
try
subm
issi
ons.
Fi
gure
33
Gov
ern
me
nt R
D&
D B
udg
ets
in IE
A M
em
be
r Co
untr
ies,
200
8*
33
0.00
0.10
0.20
0.30
0.40
0.50
0.60
0.70
0.80
0.90
Per
tho
usa
nd
un
its o
f G
DP
Incl
ud
ing
nu
clea
r
Excl
ud
ing
nu
clea
r
0.01
0.01
0.05
0.19
0.010.02
0.05
0.09
0.190.
20
0.34
0.44
0.67
0.78
0.06
0.09
0.05
0.13
0.19
0.23
0.30
0.25
0.34
0.40
0.27
0.40
0.27
0.08
0.07
0.24
0.300.
31
0.37
0.40
Turk
ey
Port
ug
al
Hu
ng
ary
Spai
n
Irela
nd
Un
ited
Kin
gd
om
New
Zea
lan
d
Ger
man
y
Ital
y
Un
ited
Sta
tes
Swed
en
Switz
erla
nd
No
rway
Den
mar
k
Can
ada
Kore
a
Jap
an
© O
EC
D/IE
A, 2
010

162
Electricity utility Enel is also a significant investor in R&D activities. In 2007, the company launched a number of new initiatives aimed at developing and demonstrating innovative technologies in the fields of capture and storage of CO2, electricity generation from renewable energy resources, distributed power generation and energy efficiency. Current plans call for expenditure of some EUR 800 million over the next five years. Research spending in 2007 was EUR 29 million (compared to EUR 22 million in 2006). In 2007, the detailed engineering for a 12 MW hydrogen-powered thermoelectric unit located at Enel’s Fusina plant was completed and construction began.
In the field of CO2 capture and storage (CCS), development and design work began for the construction of a pilot plant for an innovative oxygen combustion system and the first experimental phase was completed at the test plant. The preliminary design work for a pilot plant with post-combustion capture technology at Enel’s Brindisi plant was also completed and the tender for its acquisition has been launched. Enel’s Porto Tolle plant is also likely to host a post-combustion CCS demonstration project in receipt of the European Energy Programme for Recovery (EEPR) funding.
In October 2008, Enel and Eni signed a bilateral co-operation agreement for the common development of CCS technologies. The agreement foresees the integration of existing projects already started by the two companies.
FUNDING
The 2007 Budget Law introduced measures to improve and co-ordinate the management of funds dedicated to research and innovation. These legal changes impacted three ministries: Universities and Research, Economic Development, and Innovation and Reforms in Public Administration. The three ministers signed a joint statement in July 2007, undertaking to jointly support Italian participation in European R&D initiatives and in particular joint technology initiatives and joint research programmes pursuant to Article 169 of the EC Treaty. This statement included a commitment to co-operate in the preparation of specific national plans involving all relevant national public and private stakeholders.
Other funding instruments, in addition to direct government funding to universities and public research institutions, include:
The Fund for Research on the Electrical System (funded by a small ●
levy (< 0.0003 EUR per kWh) on every electricity bill, to finance electrical system research);
Programme agreements with Public Research Institutions: EUR 60 million ●
per year for the period 2006-2008.
© O
EC
D/IE
A, 2
010
163
THE FUND FOR RESEARCH ON THE ELECTRICAL SYSTEM
The Ministry of Economic Development foresees funding under this programme being available under four main headings: power grid management, generation, transmission, and consumption. Funding for this programme, for up to EUR 60 million per year approved by the Minister of Economic Development in June 2007 was divided in three parts:
EUR 35 million have been assigned to CESI Ricerca (now ERSE); ●
EUR 20 million to ENEA; ●
EUR 5 million to CNR, the National Research Council. ●
In addition, 20% of the funds assigned to ENEA and CNR are to be made available for research activities conducted by the universities. In May 2009 a new 3-year plan of the Fund has been approved by the Ministry of Economic Development with an allocation of EUR 210 million for the period 2009-2011.
FUNDING TRENDS The energy R&D funding data concern only the public sector at central level. In 2007 there was a slight decrease in R&D expenditures due to a transfer to 2008 for administrative reasons of some projects from the Fund for Research on the Electrical System to national bodies.
Regional investments in energy R&D are difficult to accurately quantify. Nevertheless, the synergies between the regions, public research institutions and university consortia result in an increase in demonstration projects funded from regional sources with the support of the Seventh Framework Programme (7FP).
Examples of such projects include:
● Civitavecchia Hydrogen Pole: Synergy Lazio Region–ENEA is involved in two projects funded by 7FP. The Civitavecchia Hydrogen Pole is developing a hydrogen-fuelled bus.
Zero Regio: ● An initiative between Lombardia and the Rhein-Main region towards zero emissions and the development and demonstration of hydrogen infrastructure for passenger cars. This project is co-financed by the European Commission under the Sixth Framework Programme (6FP).
INTERNATIONAL COLLABORATION AND PARTNERSHIP
Italy is active in international co-operation on energy and environmental R&D in a number of fields. Examples include participation in bilateral agreements for environmental co-operation in Latin America, the Mediterranean Basin,
© O
EC
D/IE
A, 2
010
164
the Balkan region, Central and East Asia, China, India, Iraq, Thailand and the United States. Italy has also initiated a United States-Italy Programme for Science and Technology Co-operation on Climate Change and is working with the United States Department of Energy in the field of energy R&D in nuclear energy and clean coal technologies.
MULTILATERAL PARTNERSHIPS
Italy is a participant in the Carbon Sequestration Leadership Forum (CSLF). The CSLF is an international climate change initiative that is focused on the development of improved cost-effective technologies for the separation and capture of carbon dioxide for its transport and long-term safe storage. The purpose of the CSLF is to make these technologies broadly available internationally; and to identify and address wider issues relating to carbon capture and storage.
Italy is also a member of the International Partnership on Hydrogen Economy, or IPHE, which serves as a mechanism to organise and implement effective, efficient, and focused international research, development, demonstration and commercial utilisation activities related to hydrogen and fuel cell technologies. In addition, Italy is a member of the Methane to Markets Partnership, an international initiative that advances cost-effective, near-term methane recovery and use as a clean energy source.
The Global Bioenergy Partnership is an Italian initiative introduced at the G8 Gleneagles Summit in 2005. The initiative was given a renewed mandate by the 2007 G8 Heiligendamm Summit to continue its work on biofuel best practices and to take forward the successful and sustainable development of bioenergy.
In 2007 Italy has also signed the adhesion to the Global Nuclear Energy Partnership, or GNEP, an initiative that offers a responsible framework for both international and domestic use of nuclear power to reduce the risks associated with nuclear proliferation and the impacts associated with waste disposal.
In Europe, Italy participates in EURATOM, to the European Commission Framework Programmes, to the Technology Platforms and the EU’s Framework Programme for Research and Technological Development (ERA-NETS) and the Strategic Energy Technology (SET) Plan.
IEA IMPLEMENTING AGREEMENTS
Italy is a participant in 20 IEA Implementing Agreements, as contracting party and as sponsor through Enitecnologie, the technology company of Eni, a centre of excellence for industrial research.
© O
EC
D/IE
A, 2
010

165
PUBLIC-PRIVATE PARTNERSHIPS
The efforts of the Italian authorities to involve the private sector in energy R&D have led to some positive results. Some successful examples include:
The Minister of Economic Development is promoting a photovoltaic energy project aimed at developing a pilot plant for thin-film cadmium telluride (CdTe) module production. The total cost of the project is around EUR 24 million and it will be partly financed by Lombardy region (EUR 9 million). A manufacturing facility with a production capacity around 18 MW per year was to be realised by the Marcegaglia Group in autumn 2008.
The Archimede Project is an example of Enel-ENEA co-operation. The project aims to construct a 5 to 28 MW thermodynamic solar project in Priolo Gargallo in Sicily with a possibility of replication in other countries. Since 2001, ENEA has developed an innovative thermodynamic solar power system using mixed fused salts as heat collector.
KEY PROJECTS AND RESEARCH AREAS
RENEWABLE ENERGY - CONCENTRATING SOLAR POWER
Since 2001, an ENEA programme has been launched following a government directive on research and demonstration of concentrated solar energy technologies.
Several innovations have been introduced in parabolic trough technology: thermal storage by means of molten salt that extends the temperature range up to 550°C, a new heat collecting element and a new tracking system. The solar collector assembly test loop, sited in the ENEA Research Centre in Rome, has allowed scientists to analyse the behaviour of the process components with molten salt as a heat transfer fluid, to verify the instrumentation, control system and operating procedures, and to test the optical and thermal efficiency of the new solar collector.
The follow-up project to the experimental facility is the Archimede Project. An agreement between ENEA and Enel was signed in September 2003 in order to verify the feasibility of the integration of a solar plant into a recently renewed combined-cycle power station. A joint working group of engineers and technicians produced a design document upon which all critical elements of the system were evaluated. The working group confirmed the feasibility and the economical viability of the project, including the use of molten salt as heat transfer fluid and thermal storage media.
© O
EC
D/IE
A, 2
010

166
PHOTOVOLTAIC
Photovoltaic (PV) research is generally conducted by ENEA and CESI Ricerca (now ERSE) with the support, in some cases, of universities and of the National Research Council. Research is concentrated on:
Crystalline silicon and thin films (microcrystalline Si devices). ●
Concentrating solar cells: an assessment of the technical and economical ●
feasibility of this application for centralised generation of electricity.
High-efficiency solar cells for terrestrial applications. ●
Development and qualification of triple junction solar cells (InGaP/ ●
InGaAs/Ge).
Component characterisation and performance evaluation of PV systems. ●
PV systems, including research and demonstration activities for ●
electrification of remote communities.
In addition, Eni is active in the production and marketing of solar cells, panels and photovoltaic systems and, in partnership with the Australian company Pacific Solar, is committed to developing a new generation of silicon cells and thin films aimed at cutting production costs and contributing to the market growth.
BIOENERGY
The Italian National Programme on Renewable Energy from Biomass is promoted by the Ministry of Agricultural and Forestry Policies and involves the regions, provinces, biomass stakeholders and agricultural organisations. The focus of the work is to replace 8 to 10 Mtoe of fossil fuels with biomass sourced from agriculture, forestry, livestock sectors and related industries, by 2012.
PEARs, the Regional Energy and Environmental Plans, are promoted by 19 of the 20 regions and two of the five autonomous provinces. Participants include municipalities, consumer associations, industry, energy service providers and forest-based industries and co-operatives. The initiative focuses on the energy market in the regions, both in terms of supply (existing plants, production, importing, conversion, etc.) and demand.
HYDROGEN ENERGY
The Hydrogen Park Consortium in Venice is based in an experimental park in Marghera on the initiative of the Venice Industrial Union with the aim of developing hydrogen as a fuel and demonstrating its use in a high-density residential and industrial area.
© O
EC
D/IE
A, 2
010

167
Civitavecchia Hydrogen Pole is a project developed jointly by Synergy Lazio Region and ENEA in two separate projects funded by 7FP. The Civitavecchia Hydrogen Pole is developing a bus fuelled by hydrogen.
Zero Regio is a joint initiative between the Lombardy region and the region of Rhein-Main in Germany and it concentrates on zero-emission passenger cars. The project will develop and demonstrate hydrogen infrastructure for passenger cars and is co-financed by the European Commission in the Sixth Framework Programme.
CARBON CAPTURE AND STORAGE (CCS)
A number of CCS R&D projects are being carried out in Italy, mainly led by the private sector, with the government focusing on communication and public acceptance. The Ministry of Economic Development’s Fund for Research and Development on the Electricity System provides funding for clean coal and CCS research. (These projects are discussed in Chapter 9 on Coal.)
ENEA and its associated companies, Sotacarbo and CESI Ricerca (now ERSE) may be considered as an integrated group of capabilities and experiences with the ability to put in place all the competences needed for CCS research and development.
An example of this kind of work is the Sotacarbo carbon sequestration project on hydrogen and energy production from Sulcis coal. The partners have designed and constructed a test facility for syngas (synthetic gas) production from Sulcis coal with CO2 and H2 separation. Other parties involved include Sotacarbo, the project co-ordinator, Ansaldo Ricerche, ENEA and the University of Cagliari. The project has been partially funded by European structural funds through the Italian Ministry of Universities and Research. The project started in January 2003 and will last six years. The total cost (including both investment and testing) is estimated at approximately EUR 12 million.
Enel has also launched an intensive CCS research and development programme, mainly funded by its own resources, in the context of its participation to the European Technology Platform on Zero Emission Power Plants. Further resources, though not yet quantified, could be designated to CCS in actuation of Law no. 99/2009.
NUCLEAR FISSION
A three-year R&D programme on new nuclear fission — funded by the Ministry of Economic Development within the framework of the Fund for Research on the Electrical System — focuses on participation in international initiatives such as INTD (International Near-Term Deployment) and Generation IV nuclear systems. The objectives of this work are to:
© O
EC
D/IE
A, 2
010

168
Keep open the future nuclear energy option in the country; ●
Contribute to development — in an international context — of innovative ●
nuclear systems;
Sustain growth of necessary competences; ●
Sustain the effort required by the national industry for keeping the pace ●
at world and domestic levels.
The main spheres of the programme are:
Studies on nuclear energy at large, scenario studies, advanced fuel ●
cycles, physical protection and proliferation resistance, advisor to the concerned national authorities and ministers, and participation in international R&D initiatives on nuclear fission;
International Near-Term Deployable (INTD) reactors (International ●
Reactor Innovative and Secure [IRIS]);
Generation IV reactors (lead-cooled fast reactor [LFR] and very-high ●
temperature gas-cooled reactor [VHTR]);
Studies on interim storage of high-level radioactive waste and final ●
disposal facility for low-level and intermediate-level wastes.
In parallel there is also a set of activities in relation to the the former TRASCO (TRAsmutazione SCOrie, i.e. waste transmutation in ADS) national programmes, including a two-year EUR 6.8 million R&D project. Further resources, though not yet quantified, could be designated to nuclear research in actuation of Law no. 99/2009.
NUCLEAR FUSION
The fusion activities performed and planned by the Italian Fusion Association (ENEA-CNR-Consorzio RFX) have been defined according to the European Community strategy which is oriented towards making possible the utilisation of fusion as energy source.
ITER ACCOMPANYING PROGRAMME
ENEA (in agreement with the other Italian partners) is proposing a new experiment as part of an ITER accompanying programme, based on a machine FT3, that will allow scientists to investigate the most demanding plasma scenarios. In particular, the experiments will investigate the influence on stability of collective effects associated with fast particles, thus reducing risks, cost and time of the operation of the international thermonuclear experimental reactor (ITER). The most relevant technology is an actively cooled tungsten plasma facing component and will cost EUR 240 million. Funding of up to 40% is available from the EC and the project will take six years.
© O
EC
D/IE
A, 2
010

169
CRITIQUE
Although the government invests in technology R&D, there appears to be a lack of an overall policy framework, both within the technology and research sector and also in relation to overall economic and energy policy. Various measures are introduced at different times by different responsible government institutions, further complicated by the devolution of authority and fragmentation of responsibilities, which sometimes impedes decision making and potentially reduces national impacts of policies. Anyway, some progress can be registered following the Law no. 99/2009, which gives priorities to research and innovation in the energy sector. Such priorities are individuated in advanced nuclear, CCS, distributed generation, renewable energy sources, and energy efficiency.
Nonetheless, the Italian government is to be commended on the increase in energy-related R&D spending included in the Industria 2015 programme of support for technology development and deployment by industry, although the exact amounts to be directed towards energy-related R&D appear unclear. The programme’s approach of defining specific sectors eligible for support on the basis of their potential contribution to national energy efficiency goals and renewables represents a welcome introduction of greater prioritisation in Italy’s public-sector energy-related R&D spending. Given that the programme contributes almost a doubling of Italy’s energy-related R&D spending, rigorous monitoring and evaluation of the programme’s effectiveness will be important.
Italy has a low level of private-sector investment in R&D compared to the OECD average: 40% funded by industry, the remainder by the government. Enel and Eni fund a substantial proportion of the private-sector energy R&D effort. The consortia carrying out Industria 2015 projects could encourage energy users to play a greater role in R&D funding.
The regions are significant players in Italian energy R&D, both through their responsibility for technology transfer and innovation policy and also through the substantial funding available to them through EU structural funds. Close co-ordination with central government R&D programmes and priorities will be necessary to ensure these funds are spent effectively. The programme agreements between central government and the regions to ensure that regional spending on technology deployment and dissemination builds on projects funded through Industria 2015 provide an example ofsuch co-ordination.
Excluding the Industria 2015 programme, there has been little change since the 2003 review in the sectoral division of Italian energy R&D spending. Although spending on renewable energies, energy efficiency and CCS has increased slightly, nuclear fusion and fission research remains the largest recipient of public R&D funds. It is not clear that priorities reflect the most
© O
EC
D/IE
A, 2
010
170
urgent energy challenges facing the country. In addition, there appears to have been little effort made to evaluate the impact of various competing and overlapping funding programmes.
Meeting Italy’s share of the EU’s challenging 2020 targets for energy savings and renewable energy is expected to require deployment of new technologies, in some of which – such as solar-thermal energy or more extensive geothermal energy – Italy has the potential to develop a clear competitive advantage. R&D priorities for 2009 and 2010 should form part of a coherent strategy to meet the 2020 targets.
In addition, oil and gas will remain key parts of Italy’s energy mix for the foreseeable future and coal-fired generation has the potential to contribute to Italy’s energy security. Despite this, publicly funded research into cleaner use of fossil fuels remains small, and there is no national carbon abatement programme while CCS research is currently being defined. A targeted, transparent R&D programme on cleaner fossil fuels, focusing on local environmental impacts in addition to carbon abatement and efficiency, could play a part in influencing local attitudes to coal-fired generation. The Italian National Research Programme for 2008 to 2010 is expected to be published late in 2009 and may provide an opportunity to address these issues.
RECOMMENDATIONS
The government of Italy should:
Ensure that the long-term R&D priorities of the National Research ◗
Programme reflect energy policy needs and are consistent with broader economic, industrial and educational policy needs.
Develop an overall integrated approach to technology research and ◗
development policy and funding that fosters increased private investment in energy R&D.
Monitor and evaluate the Industria 2015 programme to ensure it succeeds ◗
in its aim of commercialising new energy-related technologies.
Further improve co-ordination between European, national and regional ◗
R&D spending.
Continue to work collaboratively at an international level to develop sound ◗
CCS policy.
© O
EC
D/IE
A, 2
010
PART IV
ANNEXES
© O
EC
D/IE
A, 2
010

© O
EC
D/IE
A, 2
010
ANNEX
ORGANISATION OF THE REVIEW
REVIEW CRITERIA
The Shared Goals, which were adopted by the IEA Ministers at their 4 June 1993 meeting in Paris, provide the evaluation criteria for the in-depth reviews conducted by the IEA. The Shared Goals are presented in Annex C.
REVIEW TEAM
The in-depth review team visited Rome from 26 to 30 May 2008. The team met with government officials, energy suppliers, interest groups and various other organisations. The IEA made a follow-up visit in September 2009 following the enactment of Law no. 99/2009. This report was drafted on the basis of these meetings, the government response to the IEA energy policy questionnaire and other information. The team is grateful for the co-operation and hospitality of the many people it met during the visit. Thanks to their openness and candour, the visits were highly productive and enjoyable.
In particular, the team wishes to express its gratitude to Mr Guido Bortoni, Head of the Department of Energy, and Mr Gilberto Dialuce, Director-General for Security of Supply and Energy Infrastructure, Department of Energy, Ministry of Economic Development for their personal engagement in briefing the team on current national energy policy issues. The team is particularly grateful to Mr. Wolfgang D’Innocenzo and Ms Concetta Cecere from the Department of Energy, Ministry of Economic Development and Ms Emilia Gatto, First Counsellor, Italian Delegation to the OECD for their personal engagement in briefing the team on current energy policy issues.
The team members were:
Mr. Richard Lavergne (team leader)Ministry of Ecology, Energy, Sustainable Development and Ocean Affairs France
Mr. Uwe Schröder-Selbach Federal Ministry for Economicsand Technology Germany
Ms Helen Dickinson Department for Business, Enterprise and Regulatory Reform United Kingdom
Mr. Mauri Valtonen Ministry of Employmentand the EconomyFinland
A
173
© O
EC
D/IE
A, 2
010
174
Mr. Huub Halsema Directorate-General for Telecommunications and EnergyNetherlands
Mr. Massimo Lombardini European Commission
Mr. Pieter Boot International Energy Agency
Ms Philippine de T’Serclaes International Energy Agency
Mr. Kieran McNamaraInternational Energy Agency
Ms Jolanka FisherInternational Energy Agency
Mr. Andreas Biermann Italy Desk OfficerInternational Energy Agency
Andreas Biermann managed the review and Kieran McNamara drafted the report. Philippine de T’Serclaes assisted with the preparation of Chapter 4 on Energy Efficiency. Chapter 8 on Oil was prepared with the assistanceof Aad van Bohemen and James Simpson. Pieter Boot, Shinji Fujino and Rebecca Gaghen provided helpful comments. Monica Petit and Bertrand Sadin prepared the figures. Karen Treanton provided support on statistics. Viviane Consoli provided editorial assistance and Marilyn Ferris helped in the final stages of preparation.
ORGANISATIONS VISITED
The team held discussions with the following energy and environment stakeholders:
Agenzia nazionale per le nuove tecnologie, l’energia e lo sviluppo ●
economico sostenibile
Anigas ●
Assocarboni-Unione ●
Associazione Nazionale Energia del Vento ●
Associazione Produttori Energia da Fonti Rinnovabili ●
Assogas ●
Assomineraria ●
CESI Ricerca ●
Confindustria ●
DIFI ●
Edison ●
© O
EC
D/IE
A, 2
010
175
Edison Stoccaggi ●
Enel ●
Eni ●
Federutility ●
FIRE ●
Galsi ●
Gestore dei Servizi Elettrici ●
Italian Competition Authority ●
Ministry of Economic Development ●
Ministry for the Environment, Land and Sea ●
Ministry of Foreign Affairs ●
Ministry of Universities and Research ●
Petrolifera ●
Regulatory Authority for Electricity and Gas ●
SNAM Rete Gas ●
Stogit ●
Terna ●
Unione Biocarburanti ●
© O
EC
D/IE
A, 2
010

177
ANNEX
ENERGY BALANCES AND KEY STATISTICAL DATA
Unit: Mtoe
SUPPLY
1973 1990 2005 2006 2010 2020 2030
TOTAL PRODUCTION 20.4 25.3 27.8 27.4 30.4 33.1 45.2Coal 0.3 0.3 0.1 0.0 0.1 0.1 0.1Peat – – – – – – –Oil 1.1 4.5 6.3 6.1 5.7 5.0 4.6Gas 12.6 14.0 9.9 9.0 8.8 6.0 5.0Comb. Renewables & Waste1 0.2 0.8 3.5 3.9 6.3 9.8 11.7Nuclear 0.8 – – – – – 8.8Hydro 3.2 2.7 3.1 3.2 3.7 3.8 3.8Wind – – 0.2 0.3 0.6 1.3 2.0Geothermal 2.1 3.0 4.8 5.0 5.3 7.1 9.2Solar – 0.0 0.0 0.0 0.0 0.0 0.0
TOTAL NET IMPORTS2 99.5 123.2 153.4 156.7 166.2 185.8 185.9Coal Exports 0.4 0.1 0.2 0.2 0.3 0.3 0.3 Imports 8.2 13.9 16.5 16.8 17.4 20.0 24.8 Net Imports 7.7 13.7 16.4 16.6 17.0 19.8 24.6Oil Exports 29.0 19.7 29.7 28.2 13.7 9.3 8.1 Imports 127.3 104.8 108.2 106.9 92.7 84.6 82.8 Int’l Marine and Aviation Bunkers 8.3 4.0 6.2 6.5 7.1 8.4 9.4 Net Imports 90.1 81.1 72.3 72.2 72.0 66.9 65.2Gas Exports – 0.0 0.3 0.3 .. .. .. Imports 1.6 25.3 60.1 63.4 71.8 94.1 92.0 Net Imports 1.6 25.3 59.8 63.1 71.8 94.1 92.0Electricity Exports 0.2 0.1 0.1 0.1 – – – Imports 0.3 3.1 4.3 4.0 5.1 4.7 3.7 Net Imports 0.1 3.0 4.2 3.9 5.1 4.7 3.7
TOTAL STOCK CHANGES –0.8 –1.8 1.6 –3.0 – – –
TOTAL SUPPLY (TPES)3 119.1 146.7 182.9 181.1 196.5 218.9 231.1Coal 8.1 14.6 16.5 16.7 17.1 19.8 24.6Peat – – – – – – –Oil 90.3 83.5 79.3 78.2 77.7 71.9 69.8Gas 14.2 39.0 70.6 69.2 80.5 100.1 97.0Comb. Renewables & Waste1 0.2 0.9 4.2 4.8 6.5 10.2 12.1Nuclear 0.8 – – – – – 8.8Hydro 3.2 2.7 3.1 3.2 3.7 3.8 3.8Wind – – 0.2 0.3 0.6 1.3 2.0Geothermal 2.1 3.0 4.8 5.0 5.3 7.1 9.2Solar – 0.0 0.0 0.0 0.0 0.0 0.0Electricity Trade4 0.1 3.0 4.2 3.9 5.1 4.7 3.7
Shares (%) Coal 6.8 10.0 9.0 9.2 8.7 9.1 10.7Peat – – – – – – –Oil 75.8 56.9 43.3 43.1 39.5 32.9 30.2Gas 11.9 26.6 38.6 38.2 41.0 45.7 42.0Comb. Renewables & Waste 0.2 0.6 2.3 2.7 3.3 4.6 5.2Nuclear 0.7 – – – – – 3.8Hydro 2.7 1.9 1.7 1.8 1.9 1.8 1.6Wind – – 0.1 0.1 0.3 0.6 0.9Geothermal 1.8 2.0 2.6 2.7 2.7 3.2 4.0Solar – – – – – – –Electricity Trade 0.1 2.0 2.3 2.1 2.6 2.1 1.6
0 is negligible, – is nil. .. is not available.
B
© O
EC
D/IE
A, 2
010

178
Unit: Mtoe
DEMAND
FINAL CONSUMPTION BY SECTOR
1973 1990 2005 2006 2010 2020 2030
TFC 96.6 115.0 142.4 141.5 149.7 173.8 178.8Coal 3.3 3.4 2.9 2.8 4.0 4.6 6.1Peat – – – – – – –Oil 69.9 61.5 64.0 63.8 62.9 63.0 61.8Gas 12.8 30.6 42.9 40.9 45.1 56.5 55.1Comb. Renewables & Waste1 – 0.9 1.8 2.3 3.5 6.6 8.0Geothermal – 0.2 0.2 0.2 0.2 0.3 0.8Solar – 0.0 0.0 0.0 – – –Electricity 10.6 18.5 25.9 26.6 29.6 35.9 40.6Heat – – 4.6 5.0 4.2 7.0 6.5
Shares (%) Coal 3.4 2.9 2.1 2.0 2.7 2.6 3.4Peat – – – – – – –Oil 72.4 53.5 44.9 45.1 42.1 36.2 34.6Gas 13.2 26.6 30.2 28.9 30.1 32.5 30.8Comb. Renewables & Waste – 0.8 1.3 1.6 2.3 3.8 4.5Geothermal – 0.2 0.1 0.2 0.1 0.2 0.5Solar – – – – – – –Electricity 11.0 16.0 18.2 18.8 19.8 20.6 22.7Heat – – 3.2 3.5 2.8 4.0 3.6
TOTAL INDUSTRY5 47.3 44.4 47.1 46.9 48.9 54.1 56.7Coal 2.6 3.3 2.9 2.8 4.0 4.4 5.8Peat – – – – – – –Oil 29.4 16.7 15.4 15.5 14.1 11.8 11.5Gas 8.7 14.6 16.1 15.7 13.9 17.7 17.7Comb. Renewables & Waste1 – 0.2 0.3 0.3 0.7 0.6 1.5Geothermal – – – – – – –Solar – – – – – – –Electricity 6.6 9.5 12.5 12.7 14.4 16.7 17.5Heat – – – – 1.8 2.9 2.7
Shares (%) Coal 5.6 7.4 6.2 5.9 8.2 8.1 10.3Peat – – – – – – –Oil 62.1 37.7 32.6 33.1 28.9 21.8 20.3Gas 18.3 33.0 34.2 33.4 28.4 32.7 31.3Comb. Renewables & Waste – 0.5 0.6 0.6 1.5 1.2 2.6Geothermal – – – – – – –Solar – – – – – – –Electricity 14.0 21.5 26.4 27.0 29.4 30.9 30.8Heat – – – – 3.6 5.4 4.7
TRANSPORT3 19.0 32.9 40.8 41.2 43.7 49.2 52.0
TOTAL OTHER SECTORS6 30.3 37.7 54.4 53.4 57.1 70.4 70.1Coal 0.5 0.1 0.0 0.0 0.0 0.2 0.3Peat – – – – – – –Oil 22.2 12.7 9.2 8.5 7.7 7.1 5.7Gas 4.0 15.7 26.4 24.8 29.9 36.1 33.2Comb. Renewables & Waste1 – 0.6 1.4 1.8 2.3 4.7 4.5Geothermal – 0.2 0.2 0.2 0.2 0.3 0.8Solar – 0.0 0.0 0.0 – – –Electricity 3.6 8.3 12.6 13.0 14.4 18.1 21.9Heat – – 4.6 5.0 2.5 4.1 3.8
Shares (%) Coal 1.6 0.3 – – 0.1 0.3 0.4Peat – – – – – – –Oil 73.3 33.7 16.9 16.0 13.6 10.1 8.1Gas 13.2 41.7 48.6 46.4 52.3 51.2 47.3Comb. Renewables & Waste – 1.7 2.5 3.4 4.1 6.6 6.4Geothermal – 0.5 0.4 0.4 0.4 0.4 1.1Solar – – – 0.1 – – –Electricity 12.0 22.1 23.1 24.4 25.3 25.7 31.3Heat – – 8.5 9.3 4.3 5.8 5.4
© O
EC
D/IE
A, 2
010
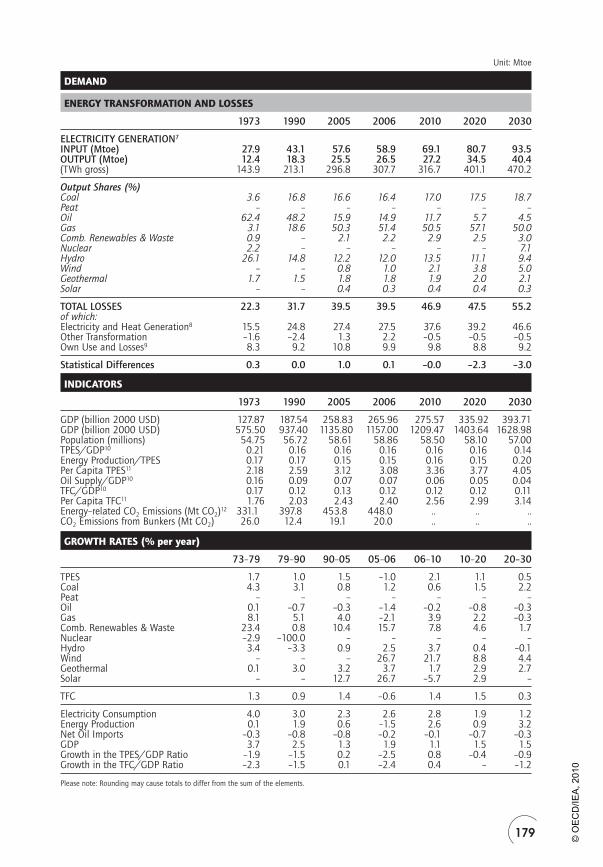
179
Unit: Mtoe
DEMAND
ENERGY TRANSFORMATION AND LOSSES
1973 1990 2005 2006 2010 2020 2030
ELECTRICITY GENERATION7 INPUT (Mtoe) 27.9 43.1 57.6 58.9 69.1 80.7 93.5OUTPUT (Mtoe) 12.4 18.3 25.5 26.5 27.2 34.5 40.4(TWh gross) 143.9 213.1 296.8 307.7 316.7 401.1 470.2
Output Shares (%) Coal 3.6 16.8 16.6 16.4 17.0 17.5 18.7Peat – – – – – – –Oil 62.4 48.2 15.9 14.9 11.7 5.7 4.5Gas 3.1 18.6 50.3 51.4 50.5 57.1 50.0Comb. Renewables & Waste 0.9 – 2.1 2.2 2.9 2.5 3.0Nuclear 2.2 – – – – – 7.1Hydro 26.1 14.8 12.2 12.0 13.5 11.1 9.4Wind – – 0.8 1.0 2.1 3.8 5.0Geothermal 1.7 1.5 1.8 1.8 1.9 2.0 2.1Solar – – 0.4 0.3 0.4 0.4 0.3
TOTAL LOSSES 22.3 31.7 39.5 39.5 46.9 47.5 55.2of which: Electricity and Heat Generation8 15.5 24.8 27.4 27.5 37.6 39.2 46.6Other Transformation –1.6 –2.4 1.3 2.2 –0.5 –0.5 –0.5Own Use and Losses9 8.3 9.2 10.8 9.9 9.8 8.8 9.2
Statistical Differences 0.3 0.0 1.0 0.1 –0.0 –2.3 –3.0
INDICATORS
1973 1990 2005 2006 2010 2020 2030
GDP (billion 2000 USD) 127.87 187.54 258.83 265.96 275.57 335.92 393.71GDP (billion 2000 USD) 575.50 937.40 1135.80 1157.00 1209.47 1403.64 1628.98Population (millions) 54.75 56.72 58.61 58.86 58.50 58.10 57.00TPES/GDP10 0.21 0.16 0.16 0.16 0.16 0.16 0.14Energy Production/TPES 0.17 0.17 0.15 0.15 0.16 0.15 0.20Per Capita TPES11 2.18 2.59 3.12 3.08 3.36 3.77 4.05Oil Supply/GDP10 0.16 0.09 0.07 0.07 0.06 0.05 0.04TFC/GDP10 0.17 0.12 0.13 0.12 0.12 0.12 0.11Per Capita TFC11 1.76 2.03 2.43 2.40 2.56 2.99 3.14Energy–related CO2 Emissions (Mt CO2)12 331.1 397.8 453.8 448.0 .. .. ..CO2 Emissions from Bunkers (Mt CO2) 26.0 12.4 19.1 20.0 .. .. ..
GROWTH RATES (% per year)
73–79 79–90 90–05 05–06 06–10 10–20 20–30
TPES 1.7 1.0 1.5 –1.0 2.1 1.1 0.5Coal 4.3 3.1 0.8 1.2 0.6 1.5 2.2Peat – – – – – – –Oil 0.1 –0.7 –0.3 –1.4 –0.2 –0.8 –0.3Gas 8.1 5.1 4.0 –2.1 3.9 2.2 –0.3Comb. Renewables & Waste 23.4 0.8 10.4 15.7 7.8 4.6 1.7Nuclear –2.9 –100.0 – – – – –Hydro 3.4 –3.3 0.9 2.5 3.7 0.4 –0.1Wind – – – 26.7 21.7 8.8 4.4Geothermal 0.1 3.0 3.2 3.7 1.7 2.9 2.7Solar – – 12.7 26.7 –5.7 2.9 –
TFC 1.3 0.9 1.4 –0.6 1.4 1.5 0.3
Electricity Consumption 4.0 3.0 2.3 2.6 2.8 1.9 1.2Energy Production 0.1 1.9 0.6 –1.5 2.6 0.9 3.2Net Oil Imports –0.3 –0.8 –0.8 –0.2 –0.1 –0.7 –0.3GDP 3.7 2.5 1.3 1.9 1.1 1.5 1.5Growth in the TPES/GDP Ratio –1.9 –1.5 0.2 –2.5 0.8 –0.4 –0.9Growth in the TFC/GDP Ratio –2.3 –1.5 0.1 –2.4 0.4 – –1.2
Please note: Rounding may cause totals to differ from the sum of the elements.
© O
EC
D/IE
A, 2
010

180
FOOTNOTES TO ENERGY BALANCES AND KEY STATISTICAL DATA
1. Combustible renewables and waste comprises solid biomass, liquid biomass, biogas, industrial waste and municipal waste. Data are often based on partial surveys and may not be comparable between countries.
2. In addition to coal, oil, gas and electricity, total net imports also include combustible renewables.
3. Excludes international marine bunkers and international aviation bunkers.
4. Total supply of electricity represents net trade. A negative number in the share of TPES indicates that exports are greater than imports.
5. Industry includes non-energy use.
6. Other Sectors includes residential, commercial, public services, agriculture, forestry, fishing and other non-specified sectors.
7. Inputs to electricity generation include inputs to electricity and CHP plants. Output refers only to electricity generation.
8. Losses arising in the production of electricity and heat at main activity producer utilities and autoproducers. For non-fossil-fuel electricity generation, theoretical losses are shown based on plant efficiencies of approximately 10% for geothermal and 100% for hydro, wind and photovoltaic.
9. Data on “losses” for forecast years often include large statistical differences covering differences between expected supply and demand and mostly do not reflect real expectations on transformation gains and losses.
10. Toe per thousand US dollars at 2000 prices and exchange rates.
11. Toe per person.
12. “Energy-related CO2 emissions” have been estimated using the IPCC Tier I Sectoral Approach from the Revised 1996 IPCC Guidelines. In accordance with the IPCC methodology, emissions from international marine and aviation bunkers are not included in national totals. Projected emissions for oil and gas are derived by calculating the ratio of emissions to energy use for 2006 and applying this factor to forecast energy supply. Future coal emissions are based on product-specific supply projections and are calculated using the IPCC/OECD emission factors and methodology.
© O
EC
D/IE
A, 2
010
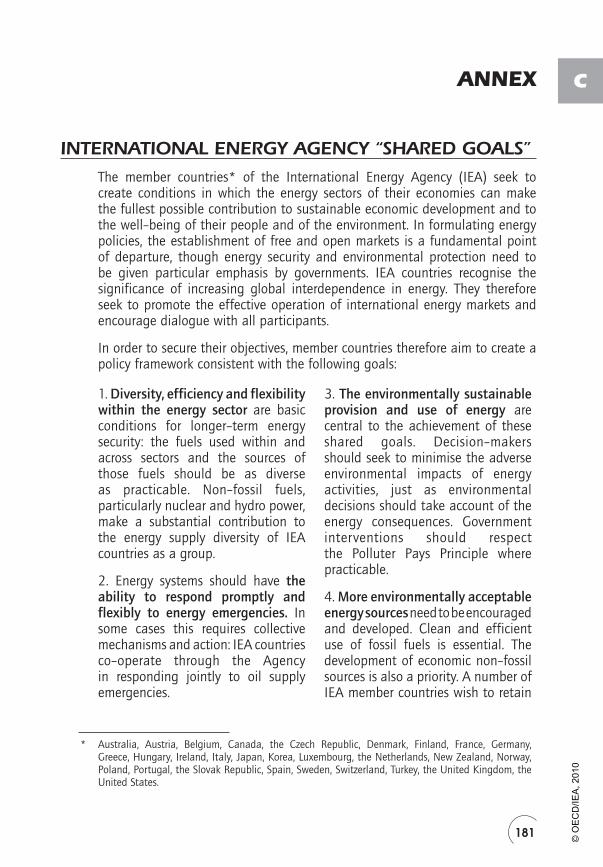
181
CANNEX
INTERNATIONAL ENERGY AGENCY “SHARED GOALS”
The member countries* of the International Energy Agency (IEA) seek to create conditions in which the energy sectors of their economies can make the fullest possible contribution to sustainable economic development and to the well–being of their people and of the environment. In formulating energy policies, the establishment of free and open markets is a fundamental point of departure, though energy security and environmental protection need to be given particular emphasis by governments. IEA countries recognise the significance of increasing global interdependence in energy. They therefore seek to promote the effective operation of international energy markets and encourage dialogue with all participants.
In order to secure their objectives, member countries therefore aim to create a policy framework consistent with the following goals:
1. Diversity, efficiency and flexibility within the energy sector are basic conditions for longer–term energy security: the fuels used within and across sectors and the sources of those fuels should be as diverse as practicable. Non–fossil fuels, particularly nuclear and hydro power, make a substantial contribution to the energy supply diversity of IEA countries as a group.
2. Energy systems should have the ability to respond promptly and flexibly to energy emergencies. In some cases this requires collective mechanisms and action: IEA countries co–operate through the Agency in responding jointly to oil supply emergencies.
3. The environmentally sustainable provision and use of energy are central to the achievement of these shared goals. Decision–makers should seek to minimise the adverse environmental impacts of energy activities, just as environmental decisions should take account of the energy consequences. Government interventions should respect the Polluter Pays Principle where practicable.
4. More environmentally acceptable energy sources need to be encouraged and developed. Clean and efficient use of fossil fuels is essential. The development of economic non–fossil sources is also a priority. A number of IEA member countries wish to retain
* Australia, Austria, Belgium, Canada, the Czech Republic, Denmark, Finland, France, Germany, Greece, Hungary, Ireland, Italy, Japan, Korea, Luxembourg, the Netherlands, New Zealand, Norway,Poland, Portugal, the Slovak Republic, Spain, Sweden, Switzerland, Turkey, the United Kingdom, the United States.
© O
EC
D/IE
A, 2
010
182
and improve the nuclear option for the future, at the highest available safety standards, because nuclear energy does not emit carbon dioxide. Renewable sources will also have an increasingly important contribution to make.
5. Improved energy efficiency can promote both environmental protection and energy security in a cost–effective manner. There are significant opportunities for greater energy efficiency at all stages of the energy cycle from production to consumption. Strong efforts by governments and all energy users are needed to realise these opportunities.
6. Continued research, development and market deployment of new and improved energy technologies make a critical contribution to achieving the objectives outlined above. Energy technology policies should complement broader energy policies. International co–operation in the development and dissemination of energy technologies, including industry participation and co–operation with non–member countries, should be encouraged.
7. Undistorted energy prices enable markets to work efficiently. Energy prices should not be held artificially below the costs of supply to promote social or industrial goals. To the extent necessary and practicable, the environmental costs of energy production and use should be reflected in prices.
8. Free and open trade and a secure framework for investment contribute to efficient energy markets and energy security. Distortions to energy trade and investment should be avoided.
9. Co–operation among all energy market participants helps to improve information and understanding, and encourages the development of efficient, environmentally acceptable and flexible energy systems and markets worldwide. These are needed to help promote the investment, trade and confidence necessary to achieve global energy security and environmental objectives.
(The Shared Goals were adopted by IEA Ministers at their 4 June 1993 meeting in Paris.)
© O
EC
D/IE
A, 2
010
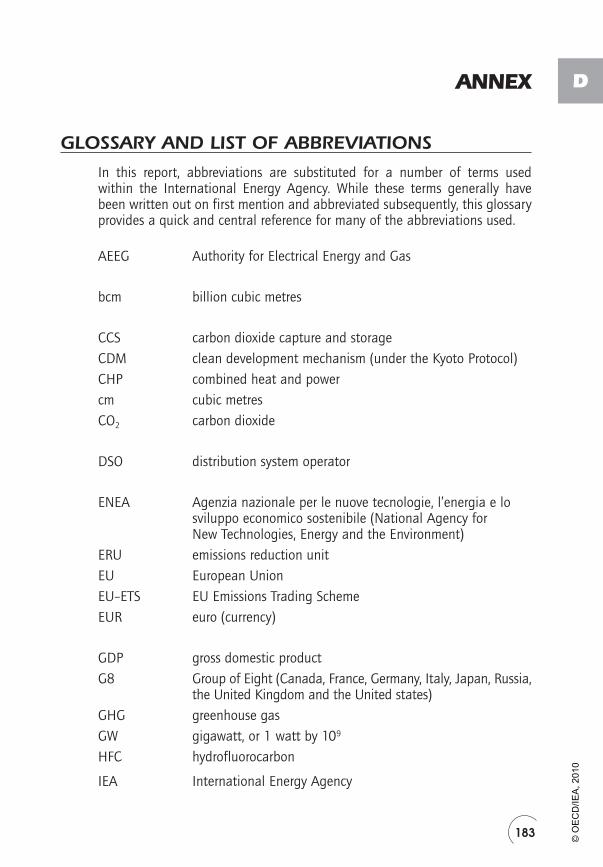
183
ANNEX
GLOSSARY AND LIST OF ABBREVIATIONS
In this report, abbreviations are substituted for a number of terms used within the International Energy Agency. While these terms generally have been written out on first mention and abbreviated subsequently, this glossary provides a quick and central reference for many of the abbreviations used.
AEEG Authority for Electrical Energy and Gas
bcm billion cubic metres
CCS carbon dioxide capture and storageCDM clean development mechanism (under the Kyoto Protocol)CHP combined heat and powercm cubic metresCO2 carbon dioxide
DSO distribution system operator
ENEA Agenzia nazionale per le nuove tecnologie, l’energia e lo sviluppo economico sostenibile (National Agency forNew Technologies, Energy and the Environment)
ERU emissions reduction unitEU European UnionEU–ETS EU Emissions Trading SchemeEUR euro (currency)
GDP gross domestic productG8 Group of Eight (Canada, France, Germany, Italy, Japan, Russia,
the United Kingdom and the United states)GHG greenhouse gasGW gigawatt, or 1 watt by 109
HFC hydrofluorocarbon
IEA International Energy Agency
D
© O
EC
D/IE
A, 2
010

184
JI joint implementation (under the Kyoto Protocol)
kWh kilowatt–hour , or 1 watt � 1 hour � 103
LNG liquefied natural gas
m2 square metremb million barrelsmcm million cubic metresMSE Ministero dello Sviluppo Economico (Ministry of
Economic Development)Mt million tonnesMt CO2–eq million tonnes of CO2–equivalentMtce million tonnes of coal equivalentMtoe million tonnes of oil equivalent, see toeMW megawatt, or 1 watt � 106
MWh megawatt–hour, or 1 watt � 1 hour � 106
NAP National Allocation PlanNO2 nitrogen dioxideOECD Organisation for Economic Co-operation and
Development
PFCs perfluorocarbonsPV photovoltaic
R&D research and developmentRES renewable energy sourcesSMEs small and medium–sized enterprises
t tonneTFC total final consumption of energytoe tonne of oil equivalent, defined as 107 kcalTPA third–party accessTPES total primary energy supplyTSO transmission system operator
UNFCCC United Nations Framework Convention on Climate Change
© O
EC
D/IE
A, 2
010


IEA PUBLICATIONS, 9, rue de la Fédération, 75739 PARIS CEDEX 15
PRINTED IN FRANCE BY SOREGRAPH, January 2010
(61 2009 33 1P1) ISBN : 978-92-64-04343--5