Embed Size (px)
Citation preview

ENERGY POLICY AND CONSUMER REALITY:
THE ROLE OF ENERGY IN THE PURCHASE
OF HOUSEHOLD APPLIANCES IN THE U.S. AND THAILAND
by
Peter T. du Pont
A dissertation submitted to the Faculty of the University of Delawarein partial fulfillment of the requirements for the degree ofDoctor of Philosophy in Urban Affairs and Public Policy
April 1998

ii
ABSTRACT
The proliferation of household appliances is a global energy problem, and thiscomparative study of appliance energy labeling in the U.S. and Thailand offers opportunitiesto learn from the implementation of programs in countries with different income levels andcultural and political climates. In the U.S., I conducted participant observation in anappliance store and interviewed 16 policymakers, 14 salespeople, and 100 consumers. InThailand, I interviewed 11 policymakers, 53 salespeople, and 62 consumers, and carried out anational survey of 971 consumers. This study is the first time that energy labels have beenexamined primarily as a problem of consumer cognition in context — that is, how consumersread, interpret, and think about energy labels in the retail environment.
After just three years of implementation, the Thai appliance labeling program is having asignificantly greater impact on the consumer appliance market than is the 20-year-old U.S.program. While Thai salespeople report that more than 60% of consumers ask about or lookat the label, the corresponding number for the U.S. is just 20%. Energy efficiency wasreported among the top-three purchase priorities by 28% of Thai appliance consumers,compared to just 11% of U.S. consumers. In my in-store tests of label cognition, the U.S.EnergyGuide label fared poorly, and the Thai appliance label was more effective at helpingconsumers to identify efficient models. Yet both labels suffer from the problem of too muchdetailed product information, which hinders label comprehension.
Salespeople are the missing link in both appliance labeling programs. While they exert asignificant influence in at least half of appliance sales, their incentives typically motivatethem to sell appliances that have additional features and use more energy. Finally, U.S. andThai policymakers have defined different purposes for their appliance labeling programs.The objective of the U.S. program is to provide consumers with information to assist in theirappliance purchase decisions. In contrast, the objective of the Thai program is more clearlybehavioral — to persuade consumers to buy a more efficient appliance that will save moneyand protect the environment. To support the program, the Thai government has implementeda massive, nationwide advertising campaign.

iii
ACKNOWLEDGMENTS
I would like first and foremost to express my warm appreciation to my advisor andmentor, Dr. Willett Kempton, who inspired this research project and whose patience,enthusiasm, and insights into how to link the academic with the real world continue to inspireme. I would also like to thank my committee members, Dr. Robert Denhardt, Dr. AlanMeier, Dr. Loren Lutzenhiser, and Prof. Paktrawimol Phienlumplert for their incisivequestioning of my analysis. Thanks also to Deirdre Lord, who energetically helped me startthis massive research project, and to my other colleagues at the University of Delaware,including Chris Payne, Maithili Iyer, Kofi Berko, Lawrence Agbemabiese, Christine Egan,and Anita Eide.
My foray into the arena of U.S. appliances would not have been possible without theadvice and assistance of Marty Rogoff and Dan Barzel. Special kudos are due to MikeGarrison for lending me his polyester tie as well as to his crew of salesmen who tolerated mytape recorder and inquisitive nature for two weeks: Leo, Tom, Charles, Carlo, Jerry, andRocco. I would also like to thank James Mills at the Federal Trade Commission for hissupport, candid opinions, and openness to my suggestions; Jeff Harris for hosting a forum forme at Lawrence Berkeley National Laboratory; John Jimbaldo of AHAM for providingcritical data on the U.S. appliance industry; and Jim McMahon and Ike Turiel of LawrenceBerkeley National Laboratory and Diane Pirkey of the U.S. Department of Energy for sharingtheir thoughts on appliances and labeling policy.
In Thailand, I am deeply indebted to Drs. Piyasvasti Amranand and Pongpisit Viseshakulof the National Energy Policy Office, who agreed to fund my interview and survey work inthat country. Khun Sitthiporn Ratanopas, director of the DSM Office at the ElectricityGenerating Authority of Thailand generously shared his time and viewpoints with me, duringmy annual return visits to Thailand. I would also like to express my appreciation to Dr.Thienchai Chongpeerapien, who provided valuable advice in how to organize the surveyeffort. Through his dedication and persistence, Prof. Tagud Sreecomporn helped our researchteam to exceed its goals and collect more data than I could ever imagine wanting to analyze.And thanks to the tireless survey researchers, Dai, Bed, and Earth, who were so efficient intheir efforts that I had to place caps on their daily production.
Globally, Paul Waide, Lloyd Harrington, and Anne Wilkins were extremely helpful andforthcoming with information about appliance energy labeling policy in the European Union,Australia, and Canada, respectively. George Wilkenfeld of Australia and Kristina Egan ofthe International Institute for Energy Conservation shared their insights on the relationshipbetween standards and labeling policies. Thanks to Nick Banks of the EnvironmentalChange Unit at Oxford University, who is pursuing similar work with British consumers, for

iv
sharing references and ideas. I would also like express a special heartfelt thanks to mycolleagues at the International Institute for Energy Conservation, especially Russell Sturm,Terry Kraft-Oliver, and the entire IIEC-Asia office, for having the patience to wait for mewhile I was immersed in the world of academia.
And finally, I would like to thank my family and, most of important of all, my wife,Dhon, without whom I would never have completed this dissertation and through whose eyesI have gained such a deeper understanding of Thailand. She makes every day on this earth asheer joy.
DEDICATION
This dissertation is dedicated to my step-father,Thomas M. Green III, whom I miss terribly, and who
taught me where to look for the white dragon.

v
TABLE OF CONTENTS
ABSTRACT........................................................................................................................ ii
ACKNOWLEDGMENTS ................................................................................................. iii
LIST OF TABLES ............................................................................................................. xi
LIST OF FIGURES.......................................................................................................... xiv
CHAPTER 1. APPLIANCES: CONVENIENCE AT A COST ..................................... 1-1
Introduction.............................................................................................................. 1-1Evolution of the U.S. Home Appliance Industry ..................................................... 1-2
The “Waves” of Appliance Uptake...................................................................... 1-3Technology, Progress, and the Consumer Society................................................... 1-4
Implications of Consumerism for Developing Countries .................................... 1-6Thailand: Appliance Uptake in an Industrializing Economy............................... 1-7
Scope of the Dissertation ......................................................................................... 1-8Organization of the Dissertation ........................................................................ 1-11
CHAPTER 2. RESEARCH ON CONSUMER BEHAVIOR ANDENERGY LABELING............................................................................. 2-1
Introduction.............................................................................................................. 2-1Prior Research on Consumer Energy Behavior........................................................ 2-1
Economic and Behavioral Frameworks ............................................................... 2-2Attitudes Toward Energy and the Environment................................................... 2-4Energy as a Consumer Priority?........................................................................... 2-4Consumer Search Patterns ................................................................................... 2-6The Role of the Salesperson ................................................................................ 2-7
Consumer Response to Energy Labels..................................................................... 2-9A Typology of Labels .......................................................................................... 2-9Labels from Around the World.......................................................................... 2-10

vi
The Pressing Need for Field Research ............................................................... 2-11A Framework for Studying Label Impacts......................................................... 2-11
Review of Past Label Evaluations ......................................................................... 2-12Understanding the Label .................................................................................... 2-12Scales and Metrics ............................................................................................. 2-13Optimizing for Cognition................................................................................... 2-15Linking the Label to Consumer Action.............................................................. 2-18
Policymaker Assumptions about Consumers......................................................... 2-19Conclusions............................................................................................................ 2-20
CHAPTER 3. METHODOLOGY FOR STUDYING APPLIANCES ........................... 3-1
Overview of Research.............................................................................................. 3-1Research in the U.S.................................................................................................. 3-3
Policymakers........................................................................................................ 3-3Retailers and Consumers...................................................................................... 3-4Sampling Strategy in the U.S. .............................................................................. 3-5Participant Observation........................................................................................ 3-6Avoiding Threats to Validity ............................................................................... 3-8Semistructured Interview Protocols ..................................................................... 3-9
Research in Thailand................................................................................................ 3-9Developing the Thai Consumer Survey ............................................................. 3-10Unstructured Interviews..................................................................................... 3-11Semistructured Interviews.................................................................................. 3-11Sampling Strategy in Thailand........................................................................... 3-11Sampling in Rural Areas .................................................................................... 3-12Response Rate.................................................................................................... 3-13
Methodological Issues............................................................................................ 3-13Approaching Retailers........................................................................................ 3-13In-Store Sampling vs. Contacting Recent Purchasers........................................ 3-14Exit Interviews vs. Mall-Intercept Interviews.................................................... 3-15Limitations of the Methodology......................................................................... 3-16
Conclusions............................................................................................................ 3-16
CHAPTER 4. POLICYMAKERS .................................................................................. 4-1
Introduction.............................................................................................................. 4-1Sample Description.................................................................................................. 4-2Issues Common to Both Countries .......................................................................... 4-3

vii
Barriers to Efficiency ........................................................................................... 4-3Do We Actually Understand the Barriers?........................................................... 4-4Views on Consumer Attitudes ............................................................................. 4-5The Salience of Energy Efficiency....................................................................... 4-7Which Types of Programs Are Most Effective? .................................................. 4-9
Policy Issues Raised Only in the U.S..................................................................... 4-10The Role of Government ................................................................................... 4-10Are U.S. Efficiency Standards Effective?.......................................................... 4-11Are the EnergyGuide Labels Effective?............................................................. 4-13
Policy Issues Raised Only in Thailand................................................................... 4-15How Programs Are Adapted in Thailand........................................................... 4-15Inter-Agency Coordination ................................................................................ 4-17Can Rebates Work in Thailand? ........................................................................ 4-18How to Measure Program Effectiveness............................................................ 4-19
Conclusions............................................................................................................ 4-21Common Themes ............................................................................................... 4-21Policy Issues Raised Only in the U.S................................................................. 4-22Policy Issues in Thailand ................................................................................... 4-22
CHAPTER 5. APPLIANCE RETAILERS ..................................................................... 5-1
Introduction.............................................................................................................. 5-1Overview of the Salesperson Samples ................................................................. 5-2Sales Views.......................................................................................................... 5-3
The Sales Environment ............................................................................................ 5-4Influence of the Salesperson ................................................................................ 5-6Sales Approach .................................................................................................... 5-7Salesperson Training and Incentives.................................................................. 5-11
Incentives at Acme Appliances...................................................................... 5-12Incentives in Thailand.................................................................................... 5-13
Consumer Priorities ............................................................................................... 5-14Salience of Energy Efficiency............................................................................ 5-17Using Efficiency as a Selling Point.................................................................... 5-19Energy as a Selling Point for Air Conditioners.................................................. 5-22
How the Label is Used ........................................................................................... 5-23In Thailand, a Screening Tool............................................................................ 5-23In the U.S., Perhaps a Tie Breaker ..................................................................... 5-24
Understanding the Energy Labels .......................................................................... 5-25Is the New U.S. Label an Improvement? ........................................................... 5-27Why the U.S. Label Works Better on Air Conditioners .................................... 5-30Factors Limiting the Thai Label’s Effectiveness ............................................... 5-31

viii
Role of the Environment........................................................................................ 5-32In the U.S.: “CFC-Free” as a Sales Tool for Service Protection........................ 5-33In Thailand: An Urban/Rural Divide ................................................................. 5-34
Conclusions............................................................................................................ 5-34
CHAPTER 6. APPLIANCE CONSUMERS.................................................................. 6-1
Introduction.............................................................................................................. 6-1Overview of Interview and Survey Samples............................................................ 6-1Comparisons between the U.S. and Thailand .......................................................... 6-4
What Appliances They Purchased ....................................................................... 6-4Who Made the Purchase Decision? ..................................................................... 6-5Why They Bought the Appliance......................................................................... 6-5Pre-Store Information Search............................................................................... 6-6Consumer Priorities ............................................................................................. 6-7Multi-Stage Decision-Making............................................................................ 6-11Salience of Energy Efficiency............................................................................ 6-12Calculating Payback Time ................................................................................. 6-14Awareness of the Label...................................................................................... 6-17The Role of Government in Promoting Energy Efficiency................................ 6-19Linkages with the Environment ......................................................................... 6-22
Conclusions............................................................................................................ 6-24
CHAPTER 7. UNDERSTANDING APPLIANCE ENERGY LABELS ....................... 7-1
Introduction.............................................................................................................. 7-1Whether and How Consumers Read the Energy Labels .......................................... 7-2Interpreting the Labels ............................................................................................. 7-3
Interpreting the U.S. Label................................................................................... 7-3Misinterpretations of the U.S. Label.............................................................. 7-13New vs. Old Label ......................................................................................... 7-14
The Thai Label ................................................................................................... 7-16Consumer Recall of Label Contents .............................................................. 7-17Misinterpretations of the Thai Label.............................................................. 7-18Linking the Thai Label to a Purchase ............................................................ 7-21
Comparisons from Study of the Labels in Both Countries .................................... 7-23The Problem of Too Many Details .................................................................... 7-26
Conclusions............................................................................................................ 7-28

ix
CHAPTER 8. FINDINGS AND RECOMMENDATIONS............................................ 8-1
Introduction.............................................................................................................. 8-1How Salient is Energy Efficiency in the Appliance Purchase Decision? ................ 8-2How Do Policymakers Get Information about and Design Policy?......................... 8-3
Policymakers Do Not Use Empirical Data on Consumers................................... 8-3Policymaker Perceptions of Barriers to Energy Efficiency.................................. 8-4Which Programs Did Policymakers Believe to Be Effective?............................. 8-4Policymaker Perceptions of the Label.................................................................. 8-5The Purpose of the Energy Label As Conceived by Policymakers...................... 8-5
The Role of Salespeople .......................................................................................... 8-7Salesperson Influence .......................................................................................... 8-7Salesperson Incentives ......................................................................................... 8-8The Value of Involving the Salesperson .............................................................. 8-8
Consumer Priorities and Decision-Making............................................................ 8-10Consumer Priorities ........................................................................................... 8-10Consumer Decision-Making .............................................................................. 8-10
The Role of Energy Labeling ................................................................................. 8-11Awareness of the Label...................................................................................... 8-11Reading the Label .............................................................................................. 8-11Interpreting the Label ......................................................................................... 8-12
Recommendations.................................................................................................. 8-12Methodological Recommendations ................................................................... 8-13Retailers: The Missing Link............................................................................... 8-13Improving Energy Labels................................................................................... 8-14A Research Agenda for Appliance Labeling...................................................... 8-15
The Basis of Appliance Demand ................................................................... 8-17
APPENDIX A: STATUS OF APPLIANCE EFFICIENCY POLICYIN THE U.S. ........................................................................................ A-1
APPENDIX B: STATUS OF APPLIANCE EFFICIENCY POLICYIN THAILAND.....................................................................................B-1
APPENDIX C: U.S. INTERVIEW PROTOCOLS.........................................................C-1
APPENDIX D: THAILAND INTERVIEW PROTOCOLS .......................................... D-1
APPENDIX E: THAILAND CONSUMER SURVEY...................................................E-1
APPENDIX F: SURVEY ANALYSIS AND QUALITY CONTROL...........................F-1

x
APPENDIX G: APPLIANCE ENERGY LABELS FROM AROUNDTHE WORLD ...................................................................................... G-1
APPENDIX H: ANNOTATED BIBLIOGRAPHY OF LABELINGEVALUATIONS.................................................................................. H-1
APPENDIX I: SAMPLES OF IMPROVED APPLIANCE LABELS............................. I-1
APPENDIX J: REFERENCES .......................................................................................J-1

xi
LIST OF TABLES
1.1. International Comparison of Household Technologies, 1960.............................. 1-5
2.1. Comparison of Label Types from around the World. .......................................... 2-1
2.2. Consumer Information Processing, as Assumed by Policymakers andRevealed through Research................................................................................ 2-20
3.1. Summary of Data Collection and Sampling Strategy for U.S. Interviews........... 3-4
3.2. Summary of Data Collection and Sampling Strategy for Thailand Interviews.... 3-5
3.3. Numbers Approached In Store and Granting Interviews, in U.S.and Thailand....................................................................................................... 3-13
3.4. Comparison of Sampling Techniques. ............................................................... 3-14
4.1. Summary of Policymaker Samples. ..................................................................... 4-2
5.1. Comparison of Demographic Information on U.S. and Thai Salespeople........... 5-3
5.2. U.S. Sales Views on Appliance Efficiency Standards and Labeling. .................. 5-4
5.3. Thai Sales Views on Appliance Energy Labeling and the Environment. ............ 5-5
5.4. Salesperson Influence in Sale of White Goods in the Northeastern U.S.. ........... 5-7
5.5. One U.S. Store Manager’s Description of Customer Types. ............................... 5-8
5.6. Lexicon of Appliance Sales Terms. ..................................................................... 5-9
5.7. Salesperson Training and Incentives in the U.S. and Thailand.......................... 5-11
5.8. Ranking of Consumer Purchase Criteria Based on Interviews with U.S.Salespeople and Participant Observation........................................................... 5-15
5.9. Ranking of Consumer Purchase Criteria for Refrigerators Based onInterviews with Thai Salespeople. ..................................................................... 5-16
5.10 Comparison of Size, Price, and Operating Cost Among Three Refrigerators ...................................................................................................... 5-18

xii
5.11. The Role of Energy Efficiency in the Sales Transaction. .................................. 5-20
5.12. Summary of Sales Criteria Used in 25 Thai Air-Conditioning Catalogues. ...... 5-22
6.1. Demographic Data on U.S. Consumers Interviewed. .......................................... 6-2
6.2. Demographic Data on Thai Consumers Surveyed. .............................................. 6-3
6.3. Appliances Purchased within the Past Year......................................................... 6-4
6.4. Who Made the Appliance Purchase Decision?. ................................................... 6-5
6.5. Reasons for Purchasing the Appliance................................................................. 6-6
6.6. Sources of Information Before Entering Store..................................................... 6-7
6.7. Impact of Different Advertising Media on Appliance Purchasersin the Northeastern U.S........................................................................................ 6-8
6.8. Knowledge of Energy Efficiency Among U.S. Consumers. .............................. 6-13 6.9. Knowledge of Monthly Electric Bill and How Much Appliances Cost
to Operate in Thailand. ...................................................................................... 6-13
6.10. Knowledge of Monthly Electric Bill and How Much Appliances Costto Operate, among Buyers and Non-Buyers....................................................... 6-14
6.11. Payback Times for U.S. Consumers. ................................................................. 6-15
6.12. Payback Times for Thai Consumers. ................................................................. 6-17
6.13. Awareness of Thailand’s Energy-Efficiency Programs amongBuyers and Non-Buyers. .................................................................................... 6-18
6.14. Awareness of the Energy Label Among Thai Consumers. ................................ 6-18
6.15. U.S. Consumers’ Views on the Role of Government. ....................................... 6-19
6.16. Thai Consumers’ Views on the Role of Government. ..................................... 6-20
6.17 The Relationship between Appliances and the Environment for U.S. and Thai Consumers. ............................................................................................... 6-23

xiii
7.1. Percentage of Thai and U.S. Consumers Who Look at the Label........................ 7-2
7.2. Detailed Interpretation of the U.S. EnergyGuide Labels. .................................... 7-7
7.3. KWh-Cost Table on Old EnergyGuide Label that was Used inLabel Comprehension Test. ............................................................................... 7-11
7.4. Summary of Misinterpretations of U.S. EnergyGuide Labels. .......................... 7-13
7.5. Recall of Label Contents among Thai Consumers Who RecentlyPurchased an Appliance . ................................................................................... 7-18
7.6. How Well Thai Consumers Understood the Appliance Energy Label. ............. 7-18
7.7. Prevalence of Energy Labels on Thai Appliances.............................................. 7-22
7.8. Breakdown of Number Ratings on Thai Energy Labels .................................... 7-22
7.9. Comprehension of Energy Efficiency on U.S. Label ......................................... 7-23
7.10. Comprehension of Efficiency on Label in Thailand .......................................... 7-24
A.1. Penetration of Major Appliances in the U.S. and Europe, 1993......................... A-3
A.2. Primary Retail Outlets for Home Appliances, 1992 ........................................... A-5
A.3. Appliances Covered and Not Covered in the U.S. EnergyGuideLabeling Program................................................................................................ A-7
A.4. Timeline of Progress and Milestones in Development of U.S.Appliance Efficiency Standards. ......................................................................... A-9
A.5. Summary of Savings and Cost Effectiveness of U.S. MinimumEfficiency Standards ......................................................................................... A-11
A.6. Appliance Energy Usage and Cost Comparison, 1990 and 1994 ..................... A-11
A.7. Percentage Increases in Consumer Price Index and Other Productsand Services ...................................................................................................... A-12
B.1. Summary of Thai DSM Programs and Savings Targets for 1998........................B-3

xiv
LIST OF FIGURES
1.1. Replacement of Domestic Servants by Electricity in U.S. Households............... 1-2
1.2. Increase in Saturation of Electrical Appliances in the U.S., 1900-1987.............. 1-4
1.3. Distribution of Energy Use in Hypothetical Developed and Developing Countries. ............................................................................................................. 1-6
1.4. Forecast Increases in Saturation Rates of Thai Refrigerators and A/Cs. ............. 1-8
1.5. Factors Affecting the Consumer Appliance Purchase Decision. ....................... 1-10
2.1. Decline in Consumer Energy Research................................................................ 2-2
2.2. Graphical Displays Tested for Energy Star Billing Project. .............................. 2-14
2.3. Labels used by Weenig and Maarleveld in Their Study of Consumer Cognition ......................................................................................... 2-16
2.4. Labels Used by Patterson in His Test of Consumer Label Preferences ............. 2-17
3.1. Schematic Overview of Study Design and Methodology. ................................... 3-2
5.1. The “Old” EnergyGuide Label........................................................................... 5-28
5.2. The “New” EnergyGuide Label ......................................................................... 5-29
6.1. U.S. Consumer Priorities as Measured by Participant Observationand Consumer Estimates.................................................................................... 6-10
6.2. Comparison of U.S. and Thai Consumer Priorities. .......................................... 6-11
7.1. The “Old” EnergyGuide Label Used in Label Comprehension Test with U.S. Consumers. .......................................................................................... 7-4
7.2. The “New” EnergyGuide Label Used in Label Comprehension Test with U.S. Consumers. ......................................................................................... 7-5

xv
7.3. The Scale of Relative Energy Use on the Old EnergyGuide Label and the New EnergyGuide Label ....................................................................... 7-15
7.4. The Thai Refrigerator Label............................................................................... 7-17
A.1. U.S. Energy Consumption by End-Use Sector, 1949-1996 ................................ A-2
A.2. Shipments of Major U.S. Home Appliances,1940-1990 .................................... A-3
A.3. U.S. Residential End-Use Breakdown, 1990 ...................................................... A-4
A.4. Trends in U.S. Appliance Efficiency .................................................................. A-6
A.5. Projected Impact of Factors on Growth in U.S. Residential ElectricitySales, 1990-2010............................................................................................... A-13
B.1. Historical and Forecast Generation Requirements for Thailand..........................B-1
B.2. Thailand Electricity Generation Requirements by Sector....................................B-2
B.3. Forecast of Thailand Residential Electricity Demand .........................................B-3
B.4. Forecast of Thailand Residential Electricity Demand by End Use ......................B-4
B.5. Forecast of Efficiency Trends for Thai Appliances, Upcountry ..........................B-5
B.6. Thai Energy Organizations ..................................................................................B-6
B.7. Projected Impact of DSM on Thailand’s Peak Electricity Demand.....................B-9
B.8. Refrigerator Labels Sent to Thai Manufacturers................................................B-11
B.9. Average Energy Use of Refrigerators in Thai Labeling Program......................B-12
B.10. Air Conditioner Labels Sent to Thai Manufacturers in 1996.............................B-13
B.11. Average Energy Use of Air Conditioners in the Thai Labeling Program ..........B-13
G.1. The Original U.S. EnergyGuide Label................................................................ G-1
G.2. The New U.S. EnergyGuide Label...................................................................... G-2

xvi
G.3. The Canadian EnerGuide Label .......................................................................... G-3
G.4. The Australian Appliance Energy Label ............................................................. G-4
G.5. The Korean Appliance Energy Label.................................................................. G-5
G.6. The Hong Kong Appliance Energy Label........................................................... G-6
G.7. The Philippines Energy Label for Air Conditioners ........................................... G-7
I.1. Sample of an Improved U.S. EnergyGuide Label................................................. I-2
I.2. Sample of an Improved Thai Appliance Label ..................................................... I-3

1-1
CHAPTER 1
APPLIANCES: CONVENIENCE AT A COST
Chapter Abstract
This chapter traces the evolution of energy-using technologies in U.S. homes during the 20thcentury, documenting their rapid uptake by consumers. It then describes how, as consumerism spreadsto developing countries, appliance production and sales are rapidly increasing in these countries, withsignificant environmental and economic impacts. It concludes by discussing the scope of thisdissertation, which uses case studies from the U.S. and Thailand to explore the elements of an effectivelabeling policy for home appliances. After just four years of implementation, the Thai appliance energylabeling program appears to be having a much greater impact on the consumer appliance market thanthe U.S. program, which has been in place since 1980.
Introduction
Electrical appliances are perceived as convenience items, and they have gradually evolved to beconsidered necessities in most households in industrialized countries. Almost every U.S. home haslamps, a refrigerator, and a stove. And most homes also have air-conditioning systems, dishwashers,clothes washers and clothes dryers. Home appliances account for most of the energy consumed in U.S.homes (if space conditioning is included), and energy use in the U.S. residential sector accounts for aboutone-fifth (19.8%) of total U.S. energy use (Statistical Abstract of the U.S. 1997: 584).
Appliances will also become an increasingly significant contributor to future energy demandworldwide. The trend of appliance uptake is now repeating itself in the developing world, as incomesrise and manufacturers systematically seek out emerging markets. Global sales of “white goods” —refrigerators, dishwashers, clothes washers, clothes dryers, and cooking appliances — are expected toincrease by 15% annually during the 1990s, reaching US$77 billion by the year 2000. Roughly 85% ofsales of white goods take place in the U.S., Western Europe, and Southeast Asia.1
Clearly, energy used to power appliances will become a growing international problem, in terms ofthe capital required to finance and fuel the power plants, as well as the pollutants they emit. Appliancesseem to be a labor-saving commodity, and they provide services for the purchaser. However, as with anycommodity, they are often marketed to do more than they actually accomplish. In fact, there are dataindicating that, despite the proliferation of appliances in U.S. homes, the amount of housework done byU.S. housewives did not decrease during the period 1920 to 1970, when households became fullymechanized (Cowan 1985: 191). This is because additional tasks were added to the housewife’sresponsibilities. Additionally, one can question the implicit assumption in appliance advertisements thatair conditioners are an indispensable accoutrement of development. Anecdotal and empirical data citedby Agbemabiese, Berko, and du Pont (1996) indicate that people in tropical countries are often notcomfortable in air-conditioned buildings. Given the large and growing impact of appliances, it is
1 Euromonitor, cited in Turiel (1997: 3).

1-2
necessary to gain a better understanding of when appliances are genuinely helpful, why people buy them,and how they are used in the home.
Evolution of the U.S. Home Appliance Industry
If one compares the household of today to a turn-of-the-century household, one would find very fewsimilarities. This is because of what Cowan (1985) calls the “industrial revolution in the home.” FigureChapter 1 .1 highlights one remarkable trend in the U.S. household since 1900: the almost completereplacement of domestic servants with energy-using (and primarily) electrical appliances. During thisperiod, electrical appliances took over almost all of the duties formerly carried out by domestic servants,and electricity replaced gas, wood, and other fuels as the home’s main energy source.
Cowan (1985: 195) poses the question of whether the decline in the number of domestic servants wasa cause or an effect of the mechanization of households. She hypothesizes that advertisers — the“ideologues of the 20s” — were the causal link who, by promoting increased mechanization of householdtasks, drove the shift away from domestic services to household appliances. While admitting that herhypothesis is not readily provable, she makes it clear that advertisers at least played a major role inperpetuating the myth of the ideal American housewife (1985: 196-197).2
0
10
20
30
40
50
60
70
1900 1910 1920 1930 1940 1950 1960 1970 1980 1990Year
% o
f hou
seho
ld e
xpen
ditu
res domestic services
appliancepurchases
energy bills
electricity bills(as % of energy)
Figure Chapter 1 .1. Replacement of Domestic Servants by Electricity in U.S. Households. (Adaptedfrom Lebergott 1993).
Cowan also concludes that mechanization of the household did not substantially reduce the amountof time that housewives spent on housework, since new jobs were added to the housewife’sresponsibilities. She conducted a survey of time studies and concluded that the time spent on houseworkby non-employed housewives remained remarkably constant throughout the period from 1920 to 1970
2 Cowan carried out her research by surveying back issues of Ladies Home Journal during the 1920s. She found— by reviewing the journal and by corroborating her findings with independent statistics — that a “significantchange in the structure of the household labor force ... was the disappearance of paid and unpaid servants ... and theimposition of the entire job on the housewife herself.”

1-3
(1985: 191). However, Lebergott (1993) disputes this conclusion and finds that the amount of time spenton household chores fell dramatically.3 Clearly, these two views are in contradiction, and withoutindependently assessing the primary sources used by each author, I cannot resolve the issue.
The “Waves” of Appliance Uptake
In the U.S., the development of the appliance industry proceeded in waves — first with theintroduction of the electric light in the early 1900s, and then with the widespread adoption of therefrigerator during the 1930s, 40s, and 50s. By 1960, with the market for refrigerators and lightingnearing saturation, and with a continued increase in U.S. disposable incomes, air conditioners became thenext wave in the trend toward household mechanization.
Figure Chapter 1 .2 shows the increase in adoption of four of the five main energy-using appliancesin U.S. homes.4 The appliance that most quickly came into all homes was the electric light. Along withmotors for factories, the electric light was the first electric end-use device that the electric utilitiesmarketed in the late 1800s in order to provide a market for their power (Clark 1977; Hughes 1983;Marcus and Sega1 1989).
In the absence of an existing electric appliance industry, the electric generating companies had tocreate one. The marketing of electric end-use devices occurred on several levels. Electric utilitiesmarketed electric lighting and other appliances for the home in an effort to increase their profits byimproving their “load factor,” a term referring to the extent to which customers use the installed capacityof the generating plant. By “diversifying” their load across the day, utilities could recoup more profits onthe fixed costs of operating the plant (Hughes 1983: 220). In 1909, Commonwealth Edison opened an“Electric Shop” in downtown Chicago to show off and sell domestic appliances. In the same building,there was also an “Industrial Power Room,” to market motor-driven machines to factory owners andmanagers (Hughes 1983: 223).
By 1940, the electric light had almost completely replaced the gas light in U.S. homes andmechanical refrigerators had replaced “ice” boxes as the dominant mode of cooling food. The periodafter World War II, when incomes rose rapidly and more women began to enter the labor force, saw thelargest increases in household mechanization, and by 1960 nearly all U.S. houses had electric lightingand refrigeration. The next wave in the evolution of appliances in U.S. homes was the air conditioner.
3 Lebergott asserts that the increased use of kitchen appliances and other conveniences significantly reduced the
amount of time that women spent on housework — “Their weekly hours for household and family chores fell from70 in 1900 to 30 by 1981 (p. 58).”
4 A fifth appliance, heating systems, is not included due to the difficulty in comparing the many different typesof heating systems, such as wood, coal, gas, oil, electric.

1-4
0
10
20
30
40
50
60
70
80
90
100
1900 1910 1920 1930 1940 1950 1960 1970 1980 1987
Year
% Saturati
Lighting
Refrigerators (ice)
Refrigerators(mechanical)
Air Conditioners
ElectricWater
Heaters
Figure Chapter 1 .2. Increase in Saturation of Electrical Appliances in the U.S., 1900-1987 (% of homeswith appliance).
Notes: split for air conditioners in 1987 was 30% room and 34% central; 47% of homes in 1987 had gas waterheaters. The use of cool storage via “ice boxes” peaked around 1920 and were quickly replaced by mechanicalrefrigerators. Gas water heaters are not shown in this figure. The saturation of water heaters overall is split roughlyevenly between electric and gas water heaters.Sources: Data for electric lighting and refrigerators from Lebergott (1993). Data for air conditioners and electricwater heaters from Statistical Abstract of the U.S. (1940, 1950, 1960, 1970, 1980, 1990).
Technology, Progress, and the Consumer Society
The prevailing view in U.S. society is that progress is linear and that it can be directly related toquantitative indicators of growth and output such as the gross domestic product.5 It is also generallyassumed that economic and technological progress are correlated with increased human happiness(Kempton and Payne 1997). Yet as Basalla and numerous other critics have commented, there is noempirical evidence of a causal connection between advances in technology and the overall betterment ofthe human race (Basalla 1988: 218; Kempton and Payne 1997). How did a basic assumption of theconsumer society — that technologies would have to be continuously upgraded and that the basic“needs” of the consumer would continuously escalate — become so ingrained in American culture? Andwill these assumptions be transferred wholesale to the developing world?
In light of the rapid U.S adoption of household appliances, it is interesting to compare the uptake ofenergy-using technologies between U.S. and European homes. Table Chapter 1 .1 shows a comparison
5 This notion is an intellectual outgrowth of the writings of Bacon and Descartes and later Condorcet and Saint-Simon among others, who equated technological change with the idea of social improvement and progress. A goodexample of the paradigm associating increased output with progress is Rosenberg (1972).

1-5
of household technologies for 1960. In almost all categories, the U.S. had the highest proportion ofconvenience appliances. The most marked difference is that, while 96% of U.S. homes had refrigeratorsby 1960, the saturation rates were much lower in European countries. Clearly, the “convenience”technologies such as the refrigerator, hot water systems, and the personal automobile, were slower to takehold in Europe, despite the relative parity of income between Europe and the U.S. Lebergott (1993: 117)attempts to debunk earlier social critics of the “hypnotizing” impact of automatic refrigerators byexplaining that U.S. housewives, given the choice of the new technologies were less willing to makedaily trips to buy groceries, while “Western Europe continued to uphold the tradition of hard labor forwomen [implicit in the act of daily shopping for groceries].”
I do not agree with Lebergott’s dismissal of the hypnotizing impact of home appliances. My ownview is more in line with that of Cowan (1985), who suggests that advertisers were a primary forcedriving the mechanization of households and the perceived need to buy appliances to increaseconvenience. I attribute the slower uptake of appliances in Europe to two factors: first, the fact that therewas less aggressive marketing of appliances there as compared to the U.S.; and second, the fact thatEuropean culture has a longer tradition of social relations and folk traditions, and is thus less susceptibleto the escalation of perceived needs that the Lynds and other critics of the consumer society observed inthe U.S. (see Horowitz 1985: 148-152).
Table Chapter 1 .1 demonstrates the relatively slower uptake of appliances in European households.This fact, combined with data from the tropics showing that the implementation of air conditioning using“Western” design practices is often inappropriate (see below: Busch, 1990; Agbemabiese, Berko, and duPont 1996), suggest that in developing countries, the adoption of electrical household appliances need notoccur the same trajectory as in the U.S.
Table Chapter 1 .1. International Comparison of Household Technologies, 1960.
Percent householdswith technology
U.S. GreatBritain
France WestGermany
Netherlands
Refrigerator (elec/gas) 96 30 23 52 23Hot running water 93 77 41 34 67Washing machine 55 45 32 36 69Stove (coal/wood) na 34 42 50 55Electric sewing machine 45 12 14 10 24Hand/foot poweredsewing machine
<1 34 42 50 55
Car 77 35 40 26 26Source: Lebergott 1993na = not available
Implications of Consumerism for Developing Countries
If developing countries follow in the pathway of Western-style development, and repeat the patternof uptake of household appliances, the air conditioner will follow the electric light and the refrigerator

1-6
into the majority of homes in these countries. A simple thought experiment can illustrate the importanceof understanding the driving forces behind the dynamic baseline of the U.S. “standard of living” and therapid electrification of the U.S. household, which — along with increased energy use in the transport,commercial and industrial sectors — has led to an unsustainable level of energy use.
Figure Chapter 1 .3 shows a conceptual graph of the distribution of energy use in the residentialsector of a less-developed country, a newly industrializing country, and a developed country. Thedistribution of energy use in homes in the less-developed country is represented by curve A. Most of thecountry’s primary energy demand is biomass for cooking, and very few of the people can afford topurchase electric appliances such as refrigerators and air conditioners. Curve B represents thedistribution of energy use in a rapidly industrializing country (such as Thailand) in which energy use hasincreased substantially, largely through the process of national electrification and the uptake of electricappliances following the Western, “mass consumer” model.
Energy Use
% o
f Pop
ulat
ion
lesserdeveloped
country
rapidlyindustrializing
country
industrializedcountry
A B C
Figure Chapter 1 .3. Distribution of Energy Use in Hypothetical Developed and Developing Countries.
The real environmental dilemma that our society faces is in the shift from B to C, which will occurover the next 40-50 years for many developing countries as they follow the Western path of“modernization” and development. This shift will occur in many countries as rising incomes translateinto increasing demand for the major energy-using home appliances — mainly refrigerators and airconditioners.6
While average per capita energy use in the U.S. is 9 kW, the average in developing countries is justone-tenth this amount — about 0.9 kW per person. Average world energy demand in 1980 was about 2
6 This is happening in Thailand, where the saturation of refrigerators and air conditioners is rapidly increasing.
In Bangkok, 40% of houses have air conditioners and more than 90% have refrigerators. Outside of Bangkok,appliance saturations are much lower — just 4% for air conditioners and 50% for refrigerators. But Thai energyplanners expect saturations for both of these appliances to reach nearly 100% in the next 40 to 50 years.
1-7
kW per person, or a total of about 9 terrawats (Goldemberg et al. 1988: 296-302). If all developingcountries make the shift from curve A or B to curve C, then global energy production would have toincrease by roughly five-fold, to about 50 TW. Given our current reliance on the combustion of fossilfuels to provide energy, this would have catastrophic environmental consequences, including local airand water pollution from power production as well as the global impacts associated with global warmingand climate change.
The solution to this dilemma will first require a commitment by developed countries to radicallyreduce their energy demand by shifting their energy use patterns from curve C back toward B.7 There isreason for optimism that this can happen. Over the past two decades, for example, the average energyuse of new U.S. refrigerators has decreased by nearly two thirds (from 1,726 kWh/year in 1972 to 649kWh in 1995).8 However, such large efficiency increases are not enough; the shift from C to B cannot beaccomplished through efficiency improvements alone. Consumption of goods and services will have todecrease as well, and this will eventually require changes in lifestyle and the acceptance, especially byAmericans, of what we might now term a “lower standard of living.”
Thailand: Appliance Uptake in an Industrializing Economy
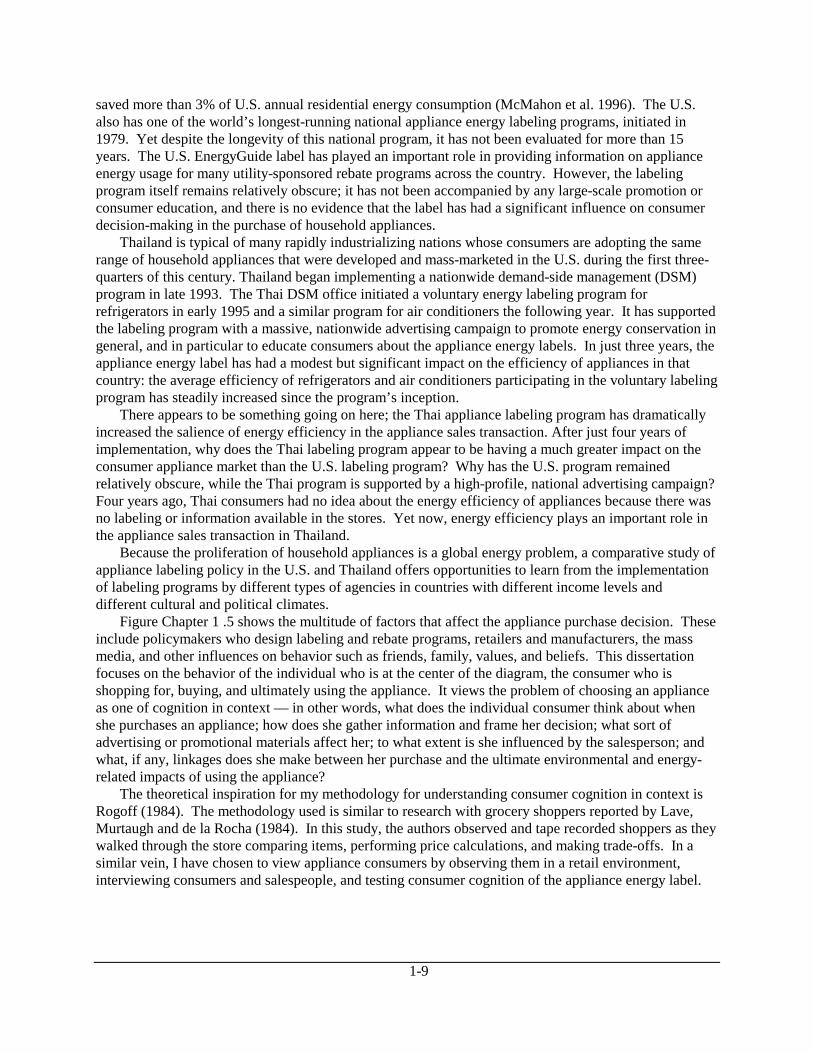
Thailand is representative of a number of newly industrializing economies (represented by curve B inFigure Chapter 1 .3), whose large annual increases in energy demand mean that its energy requirementsare doubling roughly every decade. With a population of 58 million (Mahidol University 1993), it islocated in the center of the booming Southeast Asia region. Nearly all of the country is electrified, andmore than 80% of dwellings throughout the country have electrical service (TLFS 1993B). Until therecent slide in the Southeast Asian currencies, Thailand’s economy had been growing in the range of 7-10 percent annually,9 and this economic growth was accompanied by equally rapid increases in primaryenergy demand.
Figure Chapter 1 .4 shows the projected increase in saturation of two major household appliances,refrigerators and air conditioners, which is driving demand in the residential sector. Over the next nineyears (1997-2005), the saturation rate of refrigerators is expected to increase from 65% to 92%. Duringthe same time period, the saturation rate of air conditioners will increase from 14% to 26%. But despitetheir lower level of saturation, it is air conditioners that will really drive energy demand in the residentialsector.
During the early 1990s, air conditioner sales in Thailand increased at an average rate of more than15% annually, and total production increased at an even greater rate, as exports of air conditioners tripledover a five-year period (IIEC 1995). According to the most recent end-use electricity load forecast forThailand, the stock of residential air conditioners is expected to increase nearly five-fold between 1991and 2006, reaching 4.8 million units. And although refrigerators are currently the largest residential load,
7 Goldemberg et al. (1988) proposed a “1 kW per capita” thought experiment. They argued that developing
countries can obtain a “standard of living” of a typical Western European during the late 1970s with much lowerlevels of energy use. They contend that such activity levels are adequate to meet the basic needs of the populationand that, using technologically feasible improvements in equipment energy efficiency, such a society could existusing an average of just 1 kW per capita.
8 Data from the Association of Home Appliance Manufacturers, 1996.9 As a result of the Asian economic crisis, the Finance Ministry revised its estimates of economic growth in
November 1997 to 0.6% growth in 1997 and 0-1% in 1998, compared with 6.4% in 1996 (Bangkok Post Year-EndEconomic Review, January 14, 1998).

1-8
they will be surpassed by air conditioners before the end of the century. By 2007, consumption ofelectricity for air conditioning will be nearly twice as high as that for refrigerators (TLFS 1993B: 2-19).
0%
20%
40%
60%
80%
100%
1991
1992
1993
1994
1995
1996
1997
1998
1999
2000
2001
2002
2003
2004
2005
Year
Satu
ratio
n (%
of h
omes
)
Refrigerators
Air Conditioners
Figure Chapter 1 .4. Forecast Increases in Saturation Rates of Thai Refrigerators and A/Cs. Source:TLFS 1993B
Indeed, compared to refrigerators, air conditioners will account for three times as much newelectricity demand in the Thai residential sector over the next decade — 38 percent of new residentialdemand for air conditioners, versus just 11 percent for refrigerators. The cost of adding new capacity forair conditioners through the year 2006 could exceed US$2 billion, and it will cost Thai consumers nearlyUS$700 million in annual energy bills to operate these air conditioners.10
The rapid increase in demand for residential appliances in Thailand exemplifies what is occurring indeveloping countries around the world, as they adopt technologies that were originally developed in theU.S. and were adopted by the masses in the early and middle part of this century. What is happening inThailand and other developing countries in fact mirrors the uptake of appliances that occurred in theU.S.; but it will happen in a much more compressed time period, and it will have enormousenvironmental and economic consequences for the planet.
Scope of the Dissertation
The purpose of this dissertation is to explore the elements of an effective energy labeling policy forhome appliances. I have chosen the U.S. and Thailand as the two case studies because of the range ofcontrasts they pose.
In the mid-1980s, threatened by a developing patchwork quilt of minimum appliance efficiencystandards in different states, U.S. manufacturers agreed to a sweeping national law that set minimumefficiency standards for a range of household appliances. To date, appliance and lighting standards have
10 Calculations based on data from Thai load forecast (TLFS 1993: 2-20)
1-9
saved more than 3% of U.S. annual residential energy consumption (McMahon et al. 1996). The U.S.also has one of the world’s longest-running national appliance energy labeling programs, initiated in1979. Yet despite the longevity of this national program, it has not been evaluated for more than 15years. The U.S. EnergyGuide label has played an important role in providing information on applianceenergy usage for many utility-sponsored rebate programs across the country. However, the labelingprogram itself remains relatively obscure; it has not been accompanied by any large-scale promotion orconsumer education, and there is no evidence that the label has had a significant influence on consumerdecision-making in the purchase of household appliances.
Thailand is typical of many rapidly industrializing nations whose consumers are adopting the samerange of household appliances that were developed and mass-marketed in the U.S. during the first three-quarters of this century. Thailand began implementing a nationwide demand-side management (DSM)program in late 1993. The Thai DSM office initiated a voluntary energy labeling program forrefrigerators in early 1995 and a similar program for air conditioners the following year. It has supportedthe labeling program with a massive, nationwide advertising campaign to promote energy conservation ingeneral, and in particular to educate consumers about the appliance energy labels. In just three years, theappliance energy label has had a modest but significant impact on the efficiency of appliances in thatcountry: the average efficiency of refrigerators and air conditioners participating in the voluntary labelingprogram has steadily increased since the program’s inception.
There appears to be something going on here; the Thai appliance labeling program has dramaticallyincreased the salience of energy efficiency in the appliance sales transaction. After just four years ofimplementation, why does the Thai labeling program appear to be having a much greater impact on theconsumer appliance market than the U.S. labeling program? Why has the U.S. program remainedrelatively obscure, while the Thai program is supported by a high-profile, national advertising campaign?Four years ago, Thai consumers had no idea about the energy efficiency of appliances because there wasno labeling or information available in the stores. Yet now, energy efficiency plays an important role inthe appliance sales transaction in Thailand.
Because the proliferation of household appliances is a global energy problem, a comparative study ofappliance labeling policy in the U.S. and Thailand offers opportunities to learn from the implementationof labeling programs by different types of agencies in countries with different income levels anddifferent cultural and political climates.
Figure Chapter 1 .5 shows the multitude of factors that affect the appliance purchase decision. Theseinclude policymakers who design labeling and rebate programs, retailers and manufacturers, the massmedia, and other influences on behavior such as friends, family, values, and beliefs. This dissertationfocuses on the behavior of the individual who is at the center of the diagram, the consumer who isshopping for, buying, and ultimately using the appliance. It views the problem of choosing an applianceas one of cognition in context — in other words, what does the individual consumer think about whenshe purchases an appliance; how does she gather information and frame her decision; what sort ofadvertising or promotional materials affect her; to what extent is she influenced by the salesperson; andwhat, if any, linkages does she make between her purchase and the ultimate environmental and energy-related impacts of using the appliance?
The theoretical inspiration for my methodology for understanding consumer cognition in context isRogoff (1984). The methodology used is similar to research with grocery shoppers reported by Lave,Murtaugh and de la Rocha (1984). In this study, the authors observed and tape recorded shoppers as theywalked through the store comparing items, performing price calculations, and making trade-offs. In asimilar vein, I have chosen to view appliance consumers by observing them in a retail environment,interviewing consumers and salespeople, and testing consumer cognition of the appliance energy label.

1-10
All of this research was conducted in the appliance store environment, in order to assess consumerbehavior and cognition in a context as similar as possible to that of the actual purchase.
Policymakers(govt, utilities,
advisors)
ManufacturersRetailers
Mass Media
ConsumersInfluences
(friends, family,values)
Labeling,DSM
Standards,labeling,
DSM
Salespitch
Advertising, information
Advertising
Pre-storeinformationand beliefs
Advertising, information
Figure Chapter 1 .5. Factors Affecting the Consumer Appliance Purchase Decision.
This dissertation addresses both the formulation of appliance energy policy as well as the consumerdecision-making process. Policymakers in the U.S., Thailand, and elsewhere have designed a range ofprograms to reduce or control electricity demand from appliances — either through legislation requiringminimum efficiency levels, rebates and incentives for consumers or manufacturers, or through labelingand educational programs designed to influence consumer behavior. Most of these programs — with theexception of mandatory minimum efficiency standards — require a reaction on the part of the consumer,since it is at the individual level that the retail purchase decision ultimately occurs. Yet the individualconsumer has a multitude of concerns and priorities in mind besides the efficiency or environmentalimpact of the appliance. And the marketers of appliances are constantly bombarding the consumer withmessages on diverse selling points, of which energy and the environment are the least tangible and oftenthe least touted. This dissertation explores questions such as, How do policymakers gather data aboutconsumer behavior in order to design effective programs?, and What sort of feedback loops are therebetween the design of policy and the retail appliance store? Because of the critical importance of thesequestions, I included policymakers, as well as consumers and retailers, in this study.
For the reasons cited above, I performed parallel studies in the U.S. and Thailand, focusing on threetarget groups: policymakers, retailers, and consumers. (This research did not specifically includemanufacturers due to limitations of time and available budget.) I used a mixture of social scienceresearch techniques in order to gain the best perspective possible on the consumer decision-makingenvironment. These include qualitative techniques such as unstructured, and semi-structuredinterviewing, and quantitative techniques such as a large-scale questionnaire survey. An essential part ofmy research was a two-week period of participant observation, during which I worked as a sales traineeat a regional appliance store in New Jersey. The richness of the data derived from these complementaryresearch techniques allowed me to develop a textured understanding of the role that energy efficiency

1-11
plays, or can potentially play, in the appliance purchase decision. And by helping define the boundariesand limitations of energy efficiency as a salient factor in the purchase decision, it is hoped that thisresearch may contribute to the formulation of improved appliance labeling policies.
I have chosen to study specifically the role of energy efficiency in the retail appliance purchase. Thisis the route by which the majority of home appliances are sold in both the U.S. and Thailand.Admittedly, there are other important problems which are beyond the scope of this research. Theseinclude the issue of bulk purchases by apartment managers and builders of tract homes who have noincentive to buy energy-efficient equipment; what people think they are getting when they purchase anappliance (i.e. modernity, status, relief from drudgery11); how appliances are used (i.e. efficiently or not);whether consumers buy more than they need (i.e. oversized refrigerator or air conditioner, air conditionerinstead of a fan, etc.); and whether marketers influence consumers to “overbuy.”
Organization of the Dissertation
The remaining chapters of this dissertation are organized as follows: Chapter 2 provides thetheoretical and academic background for this research by reviewing previous research on consumerbehavior and energy use as well as previous studies that have examined the relationship betweenconsumer behavior and appliance purchases. Chapter 3 describes the study design and methodology usedfor the research on policymakers, retailers, and consumers in the two countries. Chapters 4 through 6describe, respectively, the results of the research on policymakers, retailers, and consumers. Chapter 7describes the results of the in-store tests with consumers of label cognition. Finally, Chapter 8 analyzesthe policy implications of this study’s findings and makes recommendations for subsequent research toimprove the design, implementation, and evaluation of appliance labeling policy.
Additional resources and information can also be found in the appendices. These includebackground analysis of the appliance efficiency policies in the U.S. (Appendix A) and Thailand(Appendix B); copies of the interview protocols for the U.S. (Appendix C) and Thailand (Appendix D);copies of the survey questionnaires used in Thailand (Appendix E); a discussion of survey analysis andquality control (Appendix F); reproductions of appliance energy labels from around the world (AppendixG); an annotated bibliography of past evaluations of energy labeling programs (Appendix H); andsamples of improved energy labels for the U.S. and Thailand based on the results of the consumercognition tests (Appendix I).
11 Some of my interview questions with rural Thai consumers addressed the associations that villagers have with
the ability to buy or own an air conditioner. These data are not discussed in this dissertation and will be reported in aseparate, forthcoming publication.

2-1
CHAPTER 2
RESEARCH ON CONSUMER BEHAVIORAND ENERGY LABELING
Chapter Abstract
This chapter reviews the literature on consumer energy behavior and energy labeling. Studies in theretail environment underline both the importance of the salesperson in the decision-making process andthe current lack of incentives for salespeople to “push” energy-efficient products. A review of pastevaluations of energy labeling programs indicates the need to redirect research efforts toward in-storeresearch in order to better understand consumer priorities, decision-making, and comprehension.Research in the field of information processing has shown that government policymakers who designinformation programs typically overestimate the amount of time and effort that consumers will put intoprocessing the message on a label.
Introduction
This chapter lays the groundwork for my own field work on this topic by reviewing past research onconsumer energy behavior. The first half of the chapter reviews a number of topics related to consumerenergy behavior: economic and behavioral frameworks, the salience of energy efficiency, consumerattitudes toward energy and the environment, and consumer priorities and search patterns. The secondhalf of the chapter focuses on consumer responses to energy labels and describes what we know aboutthe effectiveness of energy labeling programs. It highlights the need for field research and provides anextensive overview of past evaluations of energy labeling programs. A related, annotated bibliography ofthese past evaluations can be found in Appendix G.
Prior Research on Consumer Energy Behavior
Over the past decade, few studies in the field of marketing and consumer behavior have focused onthe role and salience of energy in consumer purchases. Much of the ground-breaking research inconsumer energy behavior was stimulated by the oil crises of the 1970s and was conducted in the late1970s and early 1980s, but has subsequently declined. Figure 0.1 shows the drop-off in consumer energyresearch as reflected by the decrease in the number of energy-related articles in the Journal of ConsumerResearch. I tabulated the 20-year period from 1974 to 1994, during which 31 energy-related articlesappeared in the journal. Twenty-eight of these appeared between 1974 to 1985, three appeared between1986 and 1989 and no energy-related articles appeared between 1990 and 1994. The actual fall-off is notnearly so steep, because behavioral articles now appear regularly in energy journals, such as EnergyPolicy and Energy and Buildings.

2-2
28
30
0
5
10
15
20
25
30
35
1975-85 1986-89 1990-94Year
Num
ber o
f arti
cles
Figure 0.1. Decline in Consumer Energy Research. The figure shows the number of energy-relatedarticles that appeared in the Journal of Consumer Research over a 20-year period, from 1975 through1994.
Economic and Behavioral Frameworks
Over the past 20 years, the field of consumer energy analysis has maintained a dichotomy betweenexplanations using economic versus behavioral frameworks in the analysis of energy behavior.Economists either consider current energy consumption as optimal, or view the barriers to energyefficiency as being primarily due to imperfect markets, and assume that these can be addressed primarilythrough financial incentives. Behavioral scientists and market researchers tend to view the problem froma different perspective, focusing on the factors that increase awareness, improve information, and lead toaction on the part of the individual. Comparing the approaches, Stern argues that the economic approachhas the advantage of being systematic, but it has blind spots in its ability to accurately predict humanbehavior. And while the behavioral approach has the benefit of having fewer blind spots, it lacks thesystematic rigor of the economic approach (Stern et al. 1986: 220).
My own approach to this dichotomy has been to use a variety of research methods (participantobservation, semi-structured interviews, survey research) and to avoid relying on any single approach. Inmy view, the prevalence of the economic paradigm in energy policy analysis has led to a sort of myopia,in which consumers are viewed by policymakers as rational economic actors, and it is assumed thateconomics will be a primary motivating factor when they make energy-related decisions (such aspurchasing an appliance). It follows that if a higher initial cost is a barrier to the purchase of energy-efficient equipment, then rebates or incentives are the solution. However, empirical data fromevaluations of U.S. residential energy-efficiency programs show that non-financial factors have often hadthe greatest impact on program participation rates. Stern et al. found a weak correlation between the sizeof program financial incentives and participation rates. They concluded that marketing andimplementation were responsible for widely varying participation rates (by a factor or 10 or more) inprograms that offered identical financial incentives (Stern et al. 1986).
Sanstad and Howarth use a modified economic framework to analyze consumer energy behavior,concluding that consumers do the best that they can with the information available to them. They explainthe lack of consumer investment in energy efficiency as the result of what Simon called “bounded

2-3
rationality.” Simon was a strong critic of the rational economic actor paradigm (also called the rational-choice school) and also argued that consumers do the best they can with the information they have. Inpractice, said Simon, consumers cannot make what economists would term “rational” decisions, sincethey lack complete information and the time-cost to acquire and process full information is prohibitivelyexpensive. Thus, the best consumers can do is “muddle through with imperfect results” (Sanstad andHowarth 1992: 1.178).
Sanstad and Howarth also contend that it does not make for good policy to design energy efficiencyprograms that rely on rationality in consumer purchase decisions. If consumers cannot, on average, makecorrect calculations regarding energy efficiency, as may be implied by the findings of high-implicitdiscount rates, then efficiency standards may serve to replicate the correct calculations on a centralized,cost-efficient basis. They argue that it may be more effective to bypass the consumer and achieveefficiency gains through the use of minimum efficiency standards. Thus direct regulation may, in somecases, bypass the problem of bounded rationality altogether by enacting laws that entirely eliminate theworst choices from the market, thus making consumer behavior less important (Sanstad and Howarth1994: 1.181)
I disagree with this view, since it negates the role of the consumer and ignores the vast potential for apro-active consumer role on environmental issues, which has been witnessed for certain activities such asrecycling and buying spray cans with non-CFC propellants (Kempton 1993). It also does not address thefact that energy efficiency is a virtually invisible issue to most consumers, since they lack informationand feedback on energy use. Kempton and Montgomery used a vivid analogy: consumers making energydecisions in the home are forced to use crude estimates, and their use of monthly energy bills to makedecisions is akin to customers who shop in a store without prices on the items and who receive only onebill at the checkout counter. Yet the researchers demonstrated through semi-structured interviews thatconsumers adapt the information available to them and develop fairly sophisticated folk methods toquantify and compare their energy bills (Kempton and Montgomery 1982: 824). This model could alsobe applied to consumers in the retail appliance environment; one can argue that, given clear andunderstandable information on the dollar cost of operating appliances, consumers would use applianceenergy labels as an important decision tool.
When consumers are asked about their intentions, they appear willing to pay a premium for anenergy-efficient product. In one experiment, consumers were asked to explicitly trade off between firstcost and savings. The researchers mailed a survey to 3,000 residential customers in Indiana, asking, “Ifan energy-saving device with a very long useful life could be purchased and installed in your home for$100, approximately how much would you have to save in energy costs each year before you wouldinstall the device?” The researchers calculated a mean discount rate of 22.5% which did not varysignificantly with income (Houston 1983). In a similar experiment in Australia, researchers derived anaverage payback time of 9.5 years (SEC Victoria 1991). If consumers purchased efficiency at ratesconsistent with these results — especially the 9.5-year payback — there would be far more efficiencypurchased in appliance markets than is actually the case.
The fact that these above data are hypothetical is troublesome. If one examines empirical data onprice and efficiency levels, consumer actions are not in fact predicted by the “rational economic” modelsused by economists (e.g., Sanstad and Howarth 1994, Hassett and Metcalf 1993). Indeed, consumers donot tend to optimize their appliance purchases by paying more for energy-efficient models that cost lessto operate. Ruderman et al. calculated “implicit discount rates” for consumers based on aggregatenational data on appliance price and efficiency. They concluded that the high discount rates, whichranged from 16% to more than 200%, were the result of market imperfections that prevented consumersfrom “making economically optimal decisions” (Ruderman, Levine, and McMahon 1987: 48).

2-4
Studies such as this one, which indicate the existence of significant lost economic opportunities, arecommonly used to marshal support for government and utility intervention to overcome “market barriers”to increased energy efficiency. Such studies demonstrate that consumers do not typically act by tradingoff between just two variables — price and operating cost — when they purchase an appliance. Anymodel that assumes consumers act in this manner does not take into account the myriad non-economicand non-energy factors considered by consumers in their actual purchase decision.
Attitudes Toward Energy and the Environment
Another aspect of consumer energy behavior relates to environmental attitudes. U.S. consumerattitudes have remained favorable to the environment throughout the 1980s and into the early 1990s(Dunlap 1991, Kempton, Boster, and Hartley 1995). The results presented by Dunlap in a survey ofenvironmental polling demonstrate widespread support for environmental issues. In a 1989 Harris poll,97% of the public said that they felt the country should be doing more to curb environmental pollution.In a 1990 New York Times/CBS poll, three-quarters of the public agreed with the statement that“Protecting the environment is so important that the requirements and standards cannot be too high, andcontinuing environmental improvements must be made regardless of cost.” Dunlap concludes that theenvironment seems to be gaining in importance as an electoral issue (Dunlap 1991).
Surveys have also shown continuing widespread support for energy efficiency in the U.S.. In onerecent national survey, 55% of the respondents said that energy efficiency or renewable energy should bethe government’s highest energy research priority, compared to just 18% for fossil fuels and 9% fornuclear power. In the same survey, three-quarters of the respondents said they would be willing to paymore for electricity generated from “cleaner renewable sources” (Sustainable Energy Budget Coalition1996).
A major question for the energy policy analyst is, How much of this widespread U.S. public support— this favorable “attitude” — translates into behavior and actions? Dunlap describes this as an area ofcontention, with some groups predicting a potential “sea change” in the market toward environmentalconsumerism, but little solid evidence being presented that actual behavior has changed much. He alsodescribes one factor that may be limiting consumer action on environmental issues: the perception thatenvironmental problems are caused primarily by business and industry, rather than by individuals(Dunlap 1991: 33-34). In fact, there are a number of barriers to consumer action on environmentalissues, including lack of consumer control over the problem, lack of knowledge on how to respond, andlack of association of environmental problems with an appropriate solution (Kempton 1993).
Energy as a Consumer Priority?
A very revealing demonstration of the low salience of energy efficiency in Thailand was made inearly 1993 by a distributor of Sanyo refrigerators in Bangkok. When he was asked whether consumerswould be swayed by marketing placards showing that the new Sanyo “Energy Saver” refrigerator wouldpay for itself in roughly two years. The salesman shook his head and pounded on top of the refrigerator(which has much thicker insulation than the standard model) saying, in Thai, “No, but they will buy itbecause it is a lot sturdier and stronger-looking than the standard model.”
This anecdotal claim is, unfortunately, well supported by past research, which has shown that despiteyears of campaigns and nearly two decades during which energy labels have been prominently displayed

2-5
on U.S. appliances, energy use is not a high priority during the consumer’s decision-making process(Dyer and Maronick 1988; BPA 1987; Brown and Whiting 1996; du Pont and Lord 1996).
However, little research has been conducted to ascertain the salience of energy efficiency in theappliance purchase decision and to determine how energy efficiency might be used as an effective sellingtool. A few studies have found that simply training salespeople and providing point-of-purchaseinformation on energy efficiency can increase the priority that consumers place on energy efficiency as apurchase criterion (BPA 1987; DTI 1994; DOE 1995; Bodner 1997). In a 1983 national survey of 575U.S. homes, energy use and yearly energy costs ranked fifth on a list of important attributes in thepurchase of a refrigerator or washer (Dyer and Maronick 1988).
In a more recent U.S. survey of 323 consumers in four U.S. cities, “low operating cost” rankedseventh on a list of factors that would influence a consumer’s decision to buy a new appliance. Thissurvey was conducted with consumers at appliance stores; most of the respondents were shopping for anappliance, but they had not necessarily recently purchased one (Brown and Whiting 1996).
Even on a high-energy-use item such as an automobile, the evidence shows that energy efficiencyplays a role in only a small percentage of the purchases. In 1978-1979, at the height of the second oilcrisis of the 1970s, fuel economy was ranked as the most important vehicle characteristic at the time ofpurchase. This ranking had fallen to third by 1981 (Pirkey et al. 1982). In a 1990 study, fuel economyhad fallen even further, and ranked “below numerous other features in the purchasing decision” (Hill andLarsen 1990).
Methodology must be evaluated to determine the validity of conclusions about consumer priorities.For example, data that reflect hypothetical intentions are not reliable indicators of consumer preferences,and must thus be viewed with caution. In a national survey of 1,039 Finnish households, the mostimportant feature mentioned by all respondents in the choice of refrigerators and freezers was energyconsumption. When only decision-makers (i.e. those who make the appliance purchase decision) wereasked (568 people) what were the most important selection criteria, energy consumption ranked third,after guarantee/warranty and inside volume. These data reflect attitudes and intentions only, since theresearchers studied a random sample of households and did not focus on recent appliance purchasers(Kuusela 1996).
Response bias has the potential to skew results in favor of energy efficiency. In several studies,energy researchers have signaled their intentions to respondents, yielding results that must be viewedwith some skepticism (SEC Victoria 1991; DOE 1995; Strang 1996). For example, in a 1991 Australianstudy, the researchers introduced themselves as energy researchers conducting a study for the local utilityon energy efficiency and energy labeling schemes. Energy efficiency and operating costs ranked secondin importance after unit capacity. In addition, running costs and efficiency were reported as the mostimportant attributes in the choice of a dishwasher (SEC Victoria 1991). These results should be viewedwith skepticism, however, due to the possibility of response bias in favor of energy efficiency generatedby the interviewer’s introduction.
Another Australian study found that when recent and prospective appliance buyers were asked anunprompted question about their most important purchase criteria, the star label was ranked eleventh.When the consumers were reminded about energy efficiency, it shifted to fourth in the ranking.Wilkenfeld argues that this “prompting” stimulates the way in which a label in an appliance showroomwould remind them about energy efficiency (GWA 1993). However, this prompting does introduce thepotential for response bias, since it is easy for respondents to shift their stated intention to please theinterviewer.
A British study claimed that energy consumption ranked third — after cost and reliability — in a listof important criteria when purchasing a refrigerator or freezer. However, this study was prone to thesame sort of bias as the previous study. The self-completion questionnaire began with a full-page

2-6
reproduction of the EU refrigerator energy label. On the following page, the respondents were asked tolist the three most important factors in their choice of refrigerator (Strang 1996). Again, the prompting(in this case the reproduction of the energy label) may account for the high ranking of energy as apurchase factor.
Consumer Search Patterns
The manner and extent to which appliance consumers gather information prior to purchasing anappliance is a critical policy issue. Early research identified three basic patterns of informationgathering: non-thorough, in which consumers visited few stores and relied on few out-of-storeinformation sources; store intense, in which consumers visit many stores but seek little other information;and thorough and balanced, in which consumers visit many stores and rely on many outside sources ofinformation (Claxton, Fry and Portis 1974).
Building on this earlier work, Westbrook and Fornell found that major appliance buyers could beclassified according to two underlying dimensions of information usage: (1) the extent of physicalshopping and (2) the use of neutral sources vs. personal sources. They were able to segment theappliance buyers according to these two information source categories and came up with four segments:objective shoppers who visit a high number of stores and rely on neutral, as opposed to personalinformation sources; store intense shoppers; who visit more stores and rely more on personal, thanneutral, information sources; personal advice seekers, who visit few stores and rely primarily on advicefrom friends, neighbors, or relatives; and moderate shoppers, who visit the fewest stores and relyprimarily neither on personal nor neutral sources. They concluded that the different types of shoppersmay require different kinds of retail selling approaches. They also hypothesized about the cause of thelimited reliance on neutral information for certain segments of shoppers: either lack of search ability andhigh perceived cost, or lack of perceived information need (Westbrook and Fornell 1979).
Beales et al. also noted the limited reliance on “objective” information such as that disseminated bygovernment programs. They reviewed empirical studies on information search and found that the amountof external information search (i.e. information from third parties, salespeople, and their own personalinspection) that most buyers do is limited for all but the most expensive durable goods. Instead,consumers tend to rely on passively acquired information from prior personal experience, previousexternal searches, or low-involvement activities like advertising or word of mouth (Beales et al. 1981).This means that at the time of the purchase salespeople have the potential to exert a major influence onthe consumers’ decision criteria. Beales et al. concluded that government agencies must developmarketing expertise in order to compete with retailers for the consumers’ attention.
Sellers are skillful providers of information using both verbal and non-verbalmethods of communication. Consequently, government agencies interested in alteringconsumer behavior must acknowledge that they are in competition with sellers for theattention of the consumer. These agencies must either develop an expertise incommunication skills or rely on performance standards and let the seller determine thebest way to meet these standards (Beales et. al 1991: 21).
Research on consumer search patterns can indicate the most effective media and timing forinfluencing consumer decisions and marketing the benefits of energy-efficient models. For example,

2-7
studies of automobile purchase patterns found that since the vast majority (80-90%) of new car buyershave decided what type (and size) of car they want to buy prior to visiting a dealer, it is important forconsumers to have access to information about fuel economy before they visit the dealer (Pirkey et. al.1982, Hill and Larsen 1990).
In the area of appliances, information search is a two-stage process: initially consumers compare (i.e.screen) all alternatives on just one or a few attributes. When the search continues, they select a smallernumber of alternatives and compare these on all available attributes (Bettman 1979; Verplanken 1990cited in de Loor 1991). Commenting on this, de Loor emphasized the critical role of energy labeling inmaking energy efficiency a salient attribute during the early stages of the consumer search process:
The function of an energy label is to present the factor "energy consumption" suchthat it will be included in the first stage: the preliminary scanning of alternatives. If thelabel, for some reason, fails to communicate this factor in the first stage of theinformation search, it is possible that all energy-efficient appliances are excluded fromthe second stage: the comparison on all attributes (de Loor and Zeelenberg 1991).
The Role of the Salesperson
Given the limited external search that most buyers perform, as well as the need to make energyefficiency a salient attribute, it is important to carefully examine the interaction between the salespersonand the consumer in the retail environment. As noted above, prior research has shown that thesalesperson is an essential and often -- from the policy perspective -- overlooked part of the consumerdecision-making process.
In-depth observation of the interaction between the customer and the salesperson can yield muchmore textured information than can be obtained from surveys. Such data are also more reliable thaninformation gained from focus groups because they represent the actual dynamics of a transaction.Olshavsky taped and transcribed 40 complete transactions involving the purchase of either a refrigeratoror a television. He categorized typical sales transactions into three phases: an orientation phase, duringwhich the salesperson determines the customer’s desires and requirements; an evaluation phase, whichinvolves exchange of information about specific alternatives; and a consummation phase, which involvesexchange of information about non-product attributes (e.g., delivery, availability, trade-in, service, returnpolicy, etc.) He concluded that the salesperson often dominated the search process in the store andcontrolled the extent and evaluation of alternatives:
In spite of his very sketchy initial information on the customer’s desires, thesalesman typically selects the order and the number of alternatives evaluated. Thesalesman also seems to dominate the evaluation of each alternative in that his semi-prepared presentations guide the customer’s attention to various product attributes(Olshavsky 1973: 211-212).
The prominent influence of the salesperson was also underlined by Anderson and Claxton, whoconducted a field study of 720 refrigerator sales in 18 stores in Western Canada. They found that thelack of in-store support hampered sales of energy-efficient models (sales staff initiated a discussion of

2-8
energy use in only 17% of interactions). They recommended “in-store” shopping aids in order to helpconsumers compare energy performance between models (Anderson and Claxton 1982). A similarrecommendation has been made for nutrition labels: that for the label to be effective, it must beaccompanied by a continuous, coordinated outreach effort to educate consumers (Byrd-Bredbenner1994).
At least one study has found what I will call the “paradox of salesperson influence.” In a simulatedexperiment in which 123 people “shopped” for a refrigerator at a White-Westinghouse showroom,salespeople appeared to have a large impact on the efficiency of the refrigerator selection. However,consumers when surveyed tended to indicate that the salesperson had very little influence on theirproduct selection (Redinger and Staelin 1981). This may reflect the “art” of being an effective salesman– the ability to listen carefully and to guide, but not overtly push, a consumer toward a specific product.Redinger and Staelin concluded that salespeople will be an essential component in making theEnergyGuide labels effective. They recommended that enlisting salespeople to “sell” energy efficiencywill require not only education but financial incentives for taking the time to show the consumers how tomake the tradeoff.
Ling and Wilhite (1992) used ethnographic interviews to assess consumer decision-making inScandinavian appliances stores. They examined the emphasis on energy use in transactions betweenappliance customers and salespeople at 54 different household appliance stores in four Nordic countries.They found that energy efficiency played only a small role in the sales process – for both the salespersonand the consumer – and that compared to other factors such as size, convenience, color, features, energyuse was considered a minor technical detail. It appeared that the “norm” was for salespeople to play littleif any role in pushing energy efficiency in their sales pitch (Ling and Wilhite (1992).
Some electric utilities implementing demand-side management (DSM) programs have focused on therole of the salesperson in influencing the purchase of energy-efficient appliances. A study by theBonneville Power Administration found that refrigerator purchasers relied heavily on the salesperson forproduct information and recommendations. However, few of the dealers surveyed in the study initiated adiscussion of energy efficiency (BPA 1988).
In 1994 and 1995, the Danish Energy Agency tested the extent to which training, information, andsales aids could increase the effectiveness of salespeople in using the new European Union labels as aselling tool for energy efficiency. In a pilot project, the labeling and training had a large apparentimpact: 95% of the salespeople and 74% of the consumers surveyed replied that the label had an impacton the purchase decision, although it was not possible to quantify the extent of the effect. Seventy-onepercent of respondents said the label was easy to understand. The researchers also compared sales ofenergy-efficient refrigerators and freezers between the 32 stores which had the sales training and energylabels, and another chain of stores, which had energy labels but no training. They found that sales ofenergy-efficient units increased in both chains and concluded that manufacturers were pushing moreenergy-efficient units in response to the newly initiated labeling program (DTI Energy 1994).
Recognizing the crucial link played by the appliance retailer, the U.S. Department of Energy has alsoinitiated a pilot project called the Energy Star Retail Labeling Program (DOE 1995). The programconsists of promotional activities with utilities, sales training1, regional and point-of-purchase advertisingand promotion, and labeling of products that meet pre-specified criteria. The label is a separateendorsement label with an “Energy Star” logo, which is placed on qualifying appliances. To qualify,appliances must exceed the U.S. minimum efficiency standards by a specified amount. Thus far, the
1 The initial pilot phase of the program in four cities included sales training. In the expanded program, there is
no sales training component. Rather, a training manual is sent to participating stores, and there are plans for atraining video to be developed in 1998 (Hazard 1998).
2-9
program has developed qualifying criteria for four types of appliances – refrigerators, dishwashers, roomair conditioners, and clothes washers. After a two-year pilot phase, during which the concept was testedat a number of stores in four U.S. cities and the results assessed using focus groups, the program hasexpanded to include more than 1,000 participating and 11 utility partners nationwide (Hazard 1998).Preliminary data from 30 stores over a three-month period indicate that overall sales of qualified EnergyStar products increased by 27 % (Bodner 1997).
Both the Danish and the U.S. Energy Star Retail Labeling programs move beyond the prescriptionsmade by Anderson and Claxton (1982) and Redinger and Staelin (1981). These programs havedemonstrated that the retailer has an effect on the energy efficiency of the purchased appliance.Furthermore, they demonstrate an ability to influence the retailer, and thus the ultimate consumerdecision, through public policy.
Consumer Response to Energy Labels
This section begins with a typology of energy labels, in order to compare the different ways ofcommunicating energy information to the consumer. It then provides a brief overview of the differenttypes of appliance energy labels currently being used internationally. This is followed by a discussion ofthe need for field research and, finally, a review of prior evaluations of energy labeling programs.
A Typology of Labels
Casey-McCabe and Harris surveyed a range of energy and environmental product labels and makethe following typology distinctions: endorsement vs. comparison labels; by sponsor (government,manufacturing association, or third party); and energy-only vs. environmental criteria (Casey-McCabeand Harris 1995; Harris and McCabe 1996). Below I expand on their distinction between endorsementand comparison labels.
Endorsement labels. These labels offer essentially a “seal of approval” that a product meets certainpre-specified criteria. They generally are based on a “yes-no” cutoff, and offer little additionalinformation. Examples of endorsement labels for energy efficiency are the Energy Star label, which isapplied to heating, ventilation, and air-conditioning equipment and office equipment, and has recentlybegun to be adopted for four types of appliances as part of a national pilot project2; and the Power Smartlabel developed for a range of electrical products by a Canadian utility.3 Generally, these endorsementlabels are applied to the top-tier of products in a market (e.g., the top 20%, or products that exceed atarget by a certain fixed percentage).
Comparative with categories. This type of label allows consumers to compare energy use betweenmodels. These labels use a categorical rating or ranking system that allows consumers to tell howenergy-efficient it is compared to other models in the market. They may or may not also contain detailedinformation on the operating characteristics, costs, and energy use of the models. The main emphasis ison establishing clear categories, so that the consumer can tell, by looking at a single label, how energy-efficient it is relative to others in the market. Examples are the European Union’s refrigerator labels,
2 This program, the Energy Star Retail Labeling Program, was discussed earlier in this chapter.3 Power Smart was initially developed by British Columbia Hydro as an endorsement label for its DSM
programs. It has now been spun off as an international membership organization with more than 30 utility membersaround the world.

2-10
which have a rating scheme from A to G; the Korean and Thai appliance energy labels, which have arating scheme from 1 to 5; and the Australian appliance labels, which have a rating scheme from 1 to 6stars.
Comparative with continuous scale. This type of label provides detailed information on the energyperformance of the product. It may also provide information that forms the basis of a comparison withother models, but does not use specific categories to accomplish this. Examples are the U.S.EnergyGuide and Canadian Energuide labels, which show a dollar or kWh amount of annual energyusage as well as a scale that shows relative energy use compared to other products.
Labels from Around the World
A review of appliance energy labels from around the world shows that most countries have decidedto adopt a label that is comparative with categories (see Table Chapter 2 .1). The European Union,Australia, South Korea, and Thailand all have energy labels with categories. In the case of the EU, thecategories range from A to G; in Australia, they range from one to six stars; and in South Korea andThailand, they range from 1 to 5 -- although in South Korea, 1 is the top ranking, while in Thailand, 5 isthe top ranking. The Canadian and U.S. labels are based on a similar design, and have a comparativelabel with a continuous scale showing the range of models in a particular size category and an arrowindicating where the particular model falls within the range. The Philippines label for air conditioners isa text-only label that provides much detailed product information and the energy-efficiency ratio (EER)of the model in large bold font. Sample reproductions of these labels are shown (in black and white) inAppendix H.
Table Chapter 2 .1. Comparison of Label Types from around the World.
Country Type of label CommentsCanada comparison with
continuous scaleScale shows range of models insize class. Energy use is the scalemetric.
United States comparison withcontinuous scale
Scale shows range of models insize class. On old label, dollarswas metric. On new label, energyuse is metric.
Australia comparison withcategories
Categories range from 1 to 6 stars;6 stars is most energy-efficient).
South Korea comparison withcategories
Categories range from 5 to 1; 1 ismost efficient.
European Union comparison withcategories
Categories range from G to A; A ismost efficient.
Thailand comparison withcategories
Categories range from 5 to 1; 5 ismost efficient.
Philippines text only label Labels only for air conditioner;shows EER of air conditioner.

2-11
The Pressing Need for Field Research
Policymakers tend to wrongly assume that consumers will overtly search for objective information(such as that disseminated via government programs) and incorporate this into their decision process(Beales et al. 1991). As a result, governments have typically not conducted careful market research onthe design of new labeling programs. In the U.S., little research was conducted prior to the introductionof either the Fuel Economy Label for automobiles in 1977, the EnergyGuide label for home appliances in1980, or the nutrition label on foods in the early 1990s (Pirkey et al. 1982, Dyer and Maronick 1988,Byrd-Bredbenner 1994).
Governments have also been slow and less than thorough in their evaluations of the impact of energylabeling programs. In the U.S., there has been no serious effort to evaluate the EnergyGuide programsince 1983. In Europe, the European Union’s energy labeling program for refrigerators was initiated in1994, and an evaluation is just now getting under way. In Australia, an evaluation was conducted in1991, five years after the initiation of the program. In Thailand, research that forms part of thisdissertation, and which was funded by the Thailand National Energy Policy Office, will form the firstevaluation of the impact of the appliance labeling program on consumers. The following sectiondescribes a framework that policymakers can use to evaluate labeling programs and to think about how alabeling scheme would affect consumer purchases.
A Framework for Studying Label Impacts
A useful framework for thinking about the impact of energy labeling on consumers is the hierarchyof effects model. This is a classic marketing framework outlining a series of steps during which theconsumer moves from exposure to an information or advertising campaign up to the point where shemakes a purchase (Wilkie 1994: 177). Behavioral theorists break the hierarchy down into three majordimensions: a (1) cognitive stage, during which the individual develops knowledge or beliefs about anobject; (2) an affective stage, during which the individual develops positive or negative feelings about theobject; and (3) a conative stage, during which the individual decides to take action (Wilkie 1994: 282).
These three stages can be described in slightly less academic language by asking three basicquestions about labeling effectiveness:
• Are consumers aware of the label?• Do they like it?• Do they change their behavior because of it?
Awareness is fairly easy to measure through surveys. The second stage, the affective stage (i.e. doconsumers like it?) is less important for an energy label than it is for selling a product. For an energylabel, the second, crucial step after awareness is understanding. Do consumers understand the label?
Understanding is more difficult to measure than awareness, and it requires a mixture of researchtechniques, including semi-structured interviews and surveys. Wherever possible, it is preferable toconduct such research on cognition in a field environment under actual purchase conditions, rather thanin a laboratory removed from the retail environment. The important variables to measure are salienceand appeal of the label, clarity of understanding of the label’s message as well as its individual elements,response time (to understand label), and recall of label elements.

2-12
The most neglected measurement is the conative stage that is, the linkage of the label to an actualbehavior, to a purchase impact. As noted earlier, this can be done by correlating individual awareness ofthe label with the efficiency rating of the appliance they purchased. It can also be done, at the macrolevel, by tracing the shipment-weighted average efficiencies in the market and attempting to correlatethem with the introduction of a labeling program. The former technique provides a better, more texturedunderstanding of consumer behavior and the impact of the label. It requires developing a sample frameof recent refrigerator buyers, usually through either an appliance retail store or a manufacturer.4
Review of Past Label Evaluations
While a number of studies have examined consumer preferences and understanding of labels, most ofthese studies have been conducted in laboratory situations, or via phone or mail surveys. Few haveassessed consumer understanding of labels directly in the store environment and in person. Most priorevaluations of energy labeling programs have show a high level of awareness (Pirkey et al. 1982; Dyerand Maronick 1988; Hill and Larsen 1990; SEC Victoria 1991). Generally, awareness tends to increaseover the life of the labeling program, and the vast majority of shoppers are aware of labels after they havevisited the store to make a purchase. The following sections focus on consumer understanding, orcognition; and the extent to which labels have been linked to changes in consumer purchasing. Anannotated bibliography of label evaluations can be found in Appendix G. It includes not only evaluationsof appliance energy labels, but also the U.S. fuel economy label for automobiles and the U.S. foodnutrition label.
Understanding the Label
A few evaluations have addressed the understandability of the label. Past evaluations have foundthat simple and non-cluttered label designs are the most effective way of conveying information aboutenergy efficiency (Pirkey et al. 1982, BPA 1987, Carswell, Langel, and Borison 1989, Patterson 1991, deLoor and Zeelenberg 1991, Daamen, Weenig, and Zeelenberg 1992). These evaluations have used focusgroups with consumers and salespeople, interviews with consumers and salespeople, and laboratory testswith consumers designed to measure consumer cognition of different label designs.
Research on label cognition in a laboratory setting by de Loor and Zeelenberg found that informationnot essential to the primary message of the label often has the effect of “masking” the primaryinformation and reducing, or slowing, consumer understanding. The researchers found that consumersconduct a first scan of available purchase options on only a few dimensions (e.g., price and size forrefrigerators), and that it is important to make the energy information as salient as possible, so that itbecomes one of these dimensions. One of the labels they tested failed to convey the concept of energyefficiency because it was a purely informational label with text and numbers, but no indication of relativeenergy use and no graphic element (de Loor and Zeelenberg 1991).
De Loor et al. also recommended that conceptual elements of the label be grouped together toincrease cognitive efficiency. They found that product-specific information often masks the energy
4 In the Oxford study mentioned earlier, the sample frame was customers who purchased appliances at Oxford
appliance stores over a several month period. The retailers passed out flyers to all purchasers of cold appliancesinviting them to fill out a brief survey form. Respondents were given 5 British pounds as an incentive. The final 100respondents were chosen from this first group of respondents.
2-13
thrust of the label, and they suggested that detailed product information could actually be presented onanother label so as not to obscure the meaning of the energy label. They recommended that policymakersdistinguish between product information labels and energy information labels (de Loor and Zeelenberg1991).
Although the EnergyGuide labeling program has been a centerpiece of U.S. appliance efficiencypolicy, there has not been a definitive study to demonstrate the labels’ effectiveness. Several studieshave raised questions about the effectiveness of the label and consumers’ ability to accuratelycomprehend its content. A California utility conducted group interviews and found out that about half ofthe participants “severely misunderstood” the information presented on the federal EnergyGuideappliance labels (Carswell, Langel, and Borison 1989: 37). A study by the Bonneville PowerAdministration concluded that the EnergyGuide labels are not a very convenient way for consumers toidentify energy-efficient models and that the labels are therefore “not particularly effective in specificpurchase decisions.” (BPA 1988)
Redinger and Staelin found that the EnergyGuide labels had little impact without additionalinformation and a “sales push”. They conducted an experiment with 123 people to estimate the effects ofthree market variables: government energy labels, energy communications, and an energy sales push.They concluded that “it is unlikely that the presence of government energy labels will have a significanteffect on expanding the market for energy-efficient appliances unless this information is supplementedwith a heuristic on how to use the information to trade off price differences” (Redinger and Staelin1981).
Pirkey et al. studied the design of the original U.S. Fuel Economy Label for automobiles anddiscovered that consumers found the label confusing. Based on their interviews with consumers, theydecided that it was important to clearly convey the concept of “fuel economy information” to consumersusing a large logo that would be visible from across the car showroom floor. They designed twoalternative labels with logos – a gas can and a gas pump – and also incorporated two fuel economyratings, one for city mileage and one for highway gas mileage. They tested the two alternative labels andthe existing label in focus groups, and found that the label with the gas pump logo was favored byconsumers (Pirkey et al. 1982). It is interesting to note that in the most recent evaluation of the FuelEconomy Label, which was completed in 1990, both consumers and salespeople commented that thelabel (which was revised as a result of the 1982 study by Pirkey et al. to include the gas pump logo)contained too much information and was confusing (Hill and Larsen 1990).
Scales and Metrics
There is some controversy over what is the most effective and appropriate scale for conveyinginformation on energy labels. A Canadian study found that “efficiency” or “energy factor” was not aneffective way of conveying comparative information about energy efficiency. Consumers shown labelsin a series of focus groups were confused by the fact that the right end of the scale represented lowerenergy use and lower operating costs (Patterson 1991). An additional source of confusion may be thefact that “efficiency” is a second order concept, which is harder for people to immediately grasp thanfirst-order measures such as dollars or energy use.
Another area of controversy is whether dollars (currency units) or energy use (kWh) is a better metricfor displaying relative comparisons on the energy label. Patterson concluded that “a scale based onenergy consumption was the least confusing of all alternative measures” (Patterson 1991: 18) TheFederal Trade Commission, in a 1994 rule announcement cited the Patterson study as supporting

2-14
evidence for the its decision to switch from dollar units to kilowatt-hours as the primary unit of energydisclosure on the EnergyGuide labels (FTC 1994: 34027).
However, a close examination of the Patterson study does not support the conclusion that kWh unitsare easier for consumers to understand on an energy label than are dollar units. In the second phase ofthe Patterson study, consumers in two focus groups were shown three alternative scales: one usingefficiency as a metric, one using dollars, and one using energy units. The scales had no explanatory texton them, just symbols on either end of the scale (lightning bolts in the case of energy consumption). Thefocus group participants found that “the notion of ‘kWh’ is unfamiliar and/or obscure to the majority ofparticipants, although it is generally understood as a measure of energy consumption” (Patterson 1991:27).
The participants also experienced some confusion with the use of dollars on the scale: the scale had agreater potential to be confusing because it was not clear whether the dollars referred to either costs orsavings. Another concern was that, since average energy rates vary from year to year, the operating coston the label would become quickly outdated. This last concern was actually the major reason that theU.S. Federal Trade Commission decided to switch from dollars to kilowatt-hours as the primary unit ofenergy disclosure on the EnergyGuide labels (FTC 1994, Mills 1997).
Figure 0.2. Graphical Displays Tested for Energy Star Billing Project (Egan 1997).
Patterson’s discussion of the relative strengths and weaknesses of the two metrics is inadequate. Indiscussing the weaknesses of using dollars, he states that “unless clearly specified as a matter ofoperating cost, the measure is as easily understood as a matter of energy savings, or, as a matter of the
2-15
relative purchase price of the appliance itself” (Patterson 1991: 34). In any event, this objection caneasily be overcome by labeling the scale with the words “annual operating cost” or “annual energysavings” in large, easy-to-read font in order to clarify its meaning. In his discussion of the merits of bothefficiency and cost as metrics, Patterson has parallel commentaries about the strengths and weaknesses ofeach. However, in the section on energy as a metric, he discusses the strengths of using energyconsumption without any parallel discussion of weaknesses. He concludes with the statement that, “Asthese findings clearly support, the obvious recommendation is to use ‘energy consumption’ as the basisof measurement and to depict the measure with the lighting bolt symbol” (Patterson 1991: 34). In myview, using a measure which is “unfamiliar and/or obscure” to the majority of subjects is not a soundrecommendation.
In another study, a laboratory study of label comprehension, Verplanken found that showing theannual operating cost is easier for consumers to understand, since the general public is not familiar withkWh. However, he also noted problems with the use of operating cost that need to be overcome: theprice of energy fluctuates over time, and it often varies within a country (Verplanken 1990 cited in deLoor and Zeelenberg 1991).
Egan surveyed 257 utility bill payers in Delaware and asked them to compare four different graphicaldisplays (see Figure 0.2). The purpose of this study was to gather data to assist in designing an optimalformat for conveying comparative energy billing information for the U.S. Energy Star Billing Project5
(Egan 1997, Lord et al. 1996). The results are surprising: the highest percentage of respondents rated thedistribution curve with houses as easy to understand and the rate of comprehension of the distributiongraphs (C and D) was significantly higher than for the bar graphs (A and B). This finding suggests thatthe bar graph scale used on the U.S. EnergyGuide label may not be ideal.
In sum, the sparse literature on scales and metrics does not support the Federal Trade Commission’saction to replace dollars as the metric on the scale with energy units (kWh). In addition, research onconsumer cognition by Egan suggests that the bar graph scale used on the EnergyGuide label may not beideal.
Optimizing for Cognition
In the early stages of the development of the European label6, several studies by Dutch researcherscompared consumer cognition of different label designs (de Loor and Zeelenberg 1991; Daamen,Weenig, and Zeelenberg 1992; Weenig and Maarleveld 1993). Much of the research focused onoptimizing the label to facilitate consumer comprehension of the appliance’s relative energy efficiency.One study concluded that a vertical scale was more effective than a horizontal scale at conveyinginformation on relative energy efficiency. In another study, it was found that a label with vertical scaledivided into four categories (1, 2, 3, and 4) was slightly superior than either a label with a continuousvertical scale, or pure-text label.
5 This project is supported by the U.S. Environmental Protection Agency.6 The discussion of whether to use operating costs as a metric was not an issue in the development and design of
the European Union’s energy label for refrigerators. The main reason that operating cost is inappropriate for Europehas to do with the logistical difficulty of using one currency when each European country has its own uniquecurrency.

2-16
Figure 0.3. Labels used by Weenig and Maarleveld in Their Study of Consumer Cognition. Fromtop: pure-text label, continuous-scale label, categorical-scale label.

2-17
The categorical label evoked significantly more cognitive responses on energyconsumption than the continuous label did, attracted more of the subjects’ attention,made it significantly easier for respondents to remember the information they hadwatched on the screen, and made choices a bit easier (although not significantly) thanboth other formats (Weenig and Maarleveld 1993: ii).
The three labels that Weenig and Maarleveld tested are shown in Figure 0.3. The results of thisstudy influenced the eventual decision by the European Community to develop an appliance energylabels that uses categories, rather than a continuous scale, or a pure-text label. The European label alsohas a vertical orientation and has a descending scale from A (most efficient) to G (least efficient).
In a related study, researchers consulted five experts in graphic design, marketing, and cognition tooptimize an energy label with a vertical scale that had earlier been tested by de Loor et al. (Daamen,Weenig, and Zeelenberg 1992). The experts liked idea of using a vertically oriented thermometer as avisual representation of relative energy use, related explicitly (possibly using an arrow) to a kWh value ina second column.
Figure 0.4. Labels Used by Patterson in His Test of Consumer Label Preferences. Consumerspreferred the label at lower right, which resembles a speedometer.

2-18
In the Canadian study by Patterson, the preferred format for conveying the idea of relative energy usewas a speedometer. (The four labels considered in the final round of focus group tests are shown inFigure 0.4.) This label format was seen as being familiar, simple, clear and easy to understand.Patterson concluded that, since the label evokes a familiar symbol, it was the one most likely to beunderstood (Patterson 1991: 19).
Linking the Label to Consumer Action
The limitation of many past evaluations of labeling is that they have focused on consumer awarenessof the label and stated intentions, and they have not explicitly linked the label to actual behavior (i.e. tothe efficiency of the purchased appliance). The studies conducted in the late 1970s to evaluate thefederal Fuel Economy Information Program for automobiles are an exception. In these studies, the U.S.Department of Energy found that roughly 5-7% of car buyers used its Gas Mileage Guide, and 25% usedthe Fuel Economy Label in their purchase decisions. These car buyers selected vehicles that were onaverage 1.7 to 2.7 mpg more fuel-efficient than the vehicles purchased by buyers who were unaware ofthe label or the guide. If one makes the very conservative assumption that only 2% of car buyers buy amore energy-efficient car because of the labels, then the federal Fuel Economy Information Program issaving U.S. consumers more than $200 million/year in gas bills.7 Unfortunately, the most recent study ofthe label and guide, completed in 1990, did not collect similar comparative data on the actual fuelefficiency of vehicles purchased by respondents.
One of the few evaluations of appliance energy labels that has linked label awareness to applianceefficiency was carried out with a sample of 100 recent refrigerator buyers in Oxford, England. While thissample is not generalizable to the UK population as a whole, it does indicate a significant impact of thelabel on appliance efficiency. Roughly half the sample (52) had noticed the label, and a 35 said theirchoice of refrigerator had been influenced by the label. Models purchased by these 35 were 20% moreefficient than the models bought by the 17 label-aware consumers who said they had not been influencedby the label.
Another approach to estimating the impact of a labeling program is to look at trends in averageshipment-weighted efficiencies over time and to impute some percentage of the efficiency gain to thelabeling program. When using this approach, the label itself is an invaluable tool for tracking efficiencytrends in the market and can be used as an indirect measure of its own effectiveness. In Australia, alabeling program began for refrigerators and freezers in 1986. It has been estimated that the programresulted in increased appliance efficiency levels for two reasons: manufacturers started to market moreefficient models as early as 1984 in anticipation of, and later after the introduction of, the labelingprogram; and consumers exerted a market pull by selecting more efficient models. The labeling programhas reduced the electricity consumption of new appliances by an estimated 11% on average. The biggestestimated gains were for refrigerator and freezers (12%) and dishwashers (16%); smaller gains wereestimated for air conditioners (6%) and clothes dryers (1%) (Wilkenfeld 1997).
A similar approach to estimating the impact of labeling has been taken in the European Union. In1992, the EU issued a directive granting the European Commission the authority to issue energy labelingdirectives for cold-appliances, washing machines, clothes-dryers, dishwashers, ovens, water-heaters,
7 This estimate was used by a Department of Energy analyst to demonstrate the large impact of the labeling
program (Patterson 1997). I have reproduced this calculation using the following assumptions: 175 million cars andlight trucks on U.S. roads, traveling an average of 10,000 miles per year, a gasoline price of US$ 1.30/gallon, abaseline fuel economy of 20 miles per gallon, and 10% savings due to the label (a 2 mpg improvement).

2-19
lighting sources, and air-conditioning appliances. Labels began appearing on appliances in 1994 inDenmark and in other EU countries in 1995. Analysis of sales data indicates that manufacturers began toincrease the efficiency of units starting in 1992, in anticipation of the labeling requirement taking effect.In Germany, France, the UK, and the Netherlands, the average efficiency of cold appliances increased bya range of 7% to 16% between 1992 and 1996 (Waide 1997).
Another method for evaluating the impact of labeling is to compare the efficiency of units being soldin the marketplace to the efficiency of units being produced and offered by the manufacturers, todetermine if there is any “market pull” effect from consumers. Waide compared the proportions of actualrefrigerator sales by efficiency class (i.e., A, B, C, etc.) to the proportion of models offered inmanufacturer catalogues. In Germany it appears that consumers have been “pulling” the market towardhigher efficiency, by selecting more of the high-efficiency models (rated B, and C) and fewer of thelower efficiency models (rated E and F). In Italy, however, consumers have been selecting models thatare, on average, less efficient that the models being offered by the manufacturers in their catalogues.Waide hypothesizes that this difference is due in part to the fact that German consumers are moresensitized to energy and environmental issues than average EU consumers, while Italian consumers areperhaps less so (Waide 1997).
Policymaker Assumptions about Consumers
Thus far, this chapter has focused on the behavior of consumers and the impact of energy labelingprograms. This section discusses policymakers. It briefly describes the apparent disconnect betweenpolicymaker assumptions about consumer information processing and such information processing asmeasured empirically through consumer research.
Eulau and Prewitt (1973) used the term “mental map” to refer to the expectations and preferences oflocal government officials in the U.S., as well as how they perceive their environment. One of the mainelements of the mental map is the “schema,” which was defined by Axelrod:
A schema is a pre-existing assumption about the way the world is organized. Whennew information becomes available, a person tries to fit the new information into thepattern he has used in the past to interpret information about the same situation (Axelrod1973, cited in Wolman 1992).
Understanding the schema or mental map of policymakers is an important element in the ability toexplain the behavior of policymakers and the development of policy. It has been shown that thepreferences of policymakers are often not aligned with the preferences of citizens (or with whatpolicymakers perceive to be citizen preferences). Wolman (1992) describes international research thathas been conducted to compare the assumptions and preferences of mayors and their citizens. Whilemayors tend to believe they accurately perceive public preferences in different areas (e.g., education,public health, etc.), the mayors’ perceptions are often inaccurate (Baldassare 1986 cited in Wolman1992). In other studies, it was shown that the mayor’s preferences (and often their policy decisions)differed from what they thought citizens favored (Clark 1991 and Balme 1992 cited in Wolman 1992).
One goal of this dissertation is to compare policymakers’ mental maps of consumer behavior withactual behavior as observed through participant observation and interviews. In the area of informationprocessing, research has shown that government policymakers who design information programs

2-20
typically overestimate the amount of time and effort that consumers will put into processing the messageon a label.
Table Chapter 2 .2. Consumer Information Processing, as Assumed by Policymakers and Revealedthrough Research
Policymaker assumptions about consumers Consumer capacity as revealed in research• high information-processing capacity • limited information-processing capacity• great deal of time to review label • limited time to review label• • consumers simplify, use heuristics• more information always better • if too much information, consumers may
ignore most of it• price important in most decisions • price only one among many factors;
decision is multi-stage process(Based on Bettman 1979)
Table Chapter 2 .2 shows the disconnect between policymakers’ assumptions about consumerinformation processing and consumer information processing as it actually occurs, as measured throughcognitive research. The data in this table indicate the importance of developing consumer informationprograms that are well aligned with the way consumers actually process information and of evaluatingthese programs through in-store research.
Conclusions
Past research on consumer energy behavior has shown that consumers do not appear to be optimizingtheir economic utility when they purchase energy-using equipment such as appliances. It is more likelythat they exercise what Simon called “bounded rationality” that is, “satisficing,” or doing reasonablywell while not expending the information effort to reach optimum, given the information they haveavailable. One problem is that energy is not as salient as other appliance characteristics such as price,brand name, size, volume, color, etc. Only a small percentage of consumers may actually look at thelabel and use it as an information tool. Another problem is that energy costs and return on investment forhigher-efficiency units are often not labeled or are difficult to compute. Studies in the retail environmentsupport these assertions and underline both the importance of the salesperson in the decision-makingprocess and the current lack of incentives for salespeople to “push” energy-efficient products.
A review of past evaluations of energy labeling programs indicates the need to redirect researchefforts in three areas: First, there is a need for field studies that assess consumer preferences andunderstanding of labels directly in the store environment. Such research can provide a more accurateindicator of consumer preferences since it more closely simulates the environment a consumer is in whenshe actually makes the appliance purchase decision. Second, there is a need for more in-depth interviewsand participant observation to assess consumer decision-making, both in the retail environment andelsewhere. Such research can help improve policy by identifying the factors necessary for a successfulprogram impact. For example, consumer research performed for the U.S. Fuel Economy InformationProgram revealed that most consumers narrow down their search of automobile models to a few models

2-21
within a certain size (and therefore efficiency) range before they go to the store. As a result of thisresearch, policymakers realized that it was important for consumers to have access to information on fueleconomy before they go to the store, since once they are in the store they have typically already narroweddown their list of options. Such in-depth interviews also can aid in the interpretation of the results oflarge-scale surveys. Finally, there is a need to link the label to actual behavior and to quantify the extentto which the label influences consumers to purchase more energy-efficient models. The example of thecalculation of the impact of the U.S. Fuel Economy Label is revealing: DOE analysts conservativelyassume that if only 2% of consumers rely on the label to purchase a car that is 2 miles-per-gallon moreefficient, the program is saving consumers more than US$200 million a year. Unfortunately, researchthat links appliance energy labels to the actual efficiency of purchased appliances has been the exceptionrather than the rule.
Finally, this chapter has outlined past research into cognition of different energy label formats andhow to optimize label design. Research in the field of information processing has shown that governmentpolicymakers who design information programs typically overestimate the amount of time and effort thatconsumers will put into processing the message on a label. This leads to the question of whether theappliance energy labels in the U.S. and Thailand are optimally designed, given the strategies thatconsumers use to process and understand information.

3-1
CHAPTER 3
METHODOLOGY FOR STUDYING APPLIANCES
Chapter Abstract
This chapter describes the research techniques I used to study policymakers, retailers, andconsumers in both the U.S. and Thailand. These techniques include participant observation at a retailappliance store in the U.S., unstructured and semistructured interviews in both countries, and a nationalsurvey-questionnaire in Thailand. The methodology is robust because it comprises a set ofcomplementary and mutually reinforcing techniques. It also avoids the problem of response bias thathas plagued other studies by energy researchers of consumer priorities in the appliance purchase. As aresult, it should provide an accurate picture of the both the policymaker and retail environments.
Overview of Research
Since my doctoral research addressed both the formulation of appliance energy policy as well asconsumer decision-making in the U.S. and Thailand, I interviewed policymakers, retailers, andconsumers in both countries. In each country, I interviewed a cross-section of policymakers responsiblefor developing and/or implementing appliance energy policies. A second set of interviews involvedconsumers and retailers of appliances. Table 0.1 and Table 0.2 summarize my data collection andsampling strategy for each country. Figure Chapter 3 .1 is a schematic overview of the study design. Itshows how the various segments of my research fit together.
I used several complementary social science research techniques in order to gain the best perspectivepossible on the consumer decision-making environment. These included qualitative techniques such asparticipant observation, unstructured and semistructured interviewing, and quantitative techniques suchas a large-scale questionnaire survey (Bernard 1994: 136-164, 208-236, 256-288). The mixture oftechniques provides multiple, complementary perspectives. The approach is well suited forunderstanding the cognitive environment of consumers who make purchases and policymakers whoconceive, design, and implement policies intended to influence those purchases. These techniques couldalso shed light on the important public policy issue of how such policies can be redesigned to be moreeffective.
Participant observation allows the observer to gain a feel for the social situation being studied andreduces the problem of “reactivity” and response bias inherent in survey research. It also allows theobserver to develop an intuitive understanding of a culture and to make confident assertions about theunderlying meaning of the data (Bernard 1994: 140-141). In the U.S., I became a participant observer byworking for two weeks as a sales trainee at a New Jersey appliance store. In Thailand, where I wasunable to conduct extensive participant observation, I used an initial set of unstructured interviews withconsumers to gain a broad understanding of how appliances are used and perceived in Thai homes.

3-2
Policymakers
U.S: semi-structuredinterviews (N=16)
Thailand: semi-structuredinterviews (N=11)
Retailers
U.S: two-week participantobservation; semi-structuredinterviews (N=14)
Thailand: semi-structuredinterviews (N=53)
Consumers
U.S: two-week participantobservation; semi-structuredinterviews (N=100)
Thailand: unstructured andsemi-structured interviews(N=62); national survey(N=971)
Analysis ofconsumerenvironment
Analysis ofpolicymakerenvironment
Comparepolicymakerperceptions andconsumer reality;compare U.S. andThailand; developconclusions
Figure Chapter 3 .1. Schematic Overview of Study Design and Methodology.
In a semistructured interview, there is a pre-determined set of “main” questions, yet the formatallows for follow-up questions and in-depth probing of the answers to each of the main questions. Thesemistructured interview format can generate more focused responses than an unstructured interview,and, if carried out consistently, can yield data that can be used for quantitative statistical comparisons

3-3
between respondents. At the same time, a semistructured interview allows for the collection of more in-depth data and responses than one gets from a structured interview, such as a survey questionnaire withclosed-ended questions. The use of semistructured interviews thus allows the researcher to answer themany “why” questions that one encounters when interpreting the results of a questionnaire survey. I useda semistructured interview protocol, modified for the different target groups (i.e. policymakers, retailers,consumers) in both the U.S. and Thailand.
Finally, in Thailand I conducted a survey of consumers in three Thai cities in order to be able togather quantitative data and make statistical inferences about consumer preferences and the success of anational appliance labeling program. I was then able to compare the results from this survey with thetabulated results of a smaller number of U.S. consumer interviews, to make comparisons and drawcontrasts between consumer purchase behavior in the two countries.
The next section of this chapter describes in detail the methodology used in my research onpolicymakers, retailers, and consumers in the northeastern U.S. This is followed, in a parallel fashion, bya description of the methodology used to study the same target groups in Thailand. The chapterconcludes by discussing methodological issues that arose during my research.
Research in the U.S.
Policymakers
In January 1996, Deirdre Lord — a graduate student in Urban Affairs and Public Policy at theUniversity of Delaware — and I conducted semistructured interviews with 16 officials responsible fordeveloping and implementing U.S. energy-efficiency policy (duPont and Lord 1996). To ensure that allviews and roles in the policy cycle were well represented, we defined “policymaker” broadly, to includethose involved in both the design and implementation of policy: congresspeople and their staff, federalagency staff working on the implementation of energy policy, and advocates in non-profit organizations.
We chose our sample by contacting energy-efficiency advocates and asking them to recommend keycontacts at each point in the policy cycle. The interviews were conducted in person in Washington, D.C.and by phone from Newark, Delaware in January, 1996. The interview protocol for U.S. policymakerscan be found in Appendix C.
Congressional staff. To achieve a diversity of views among congressional staff, we interviewed aidesworking for congresspeople who had both supported and opposed cuts for energy-efficiency funding inthe U.S. Department of Energy (DOE) and the U.S. Environmental Protection Agency (EPA) during1995. Our sample included five congressional staff — two of whom favored and three of whom opposedcuts in federal energy-efficiency programs.
Implementers at federal agencies. We interviewed six federal government employees involved inpolicy implementation at the U.S. DOE, the U.S. EPA, and the Federal Trade Commission. Since therole of these professionals is to implement energy-efficiency programs and rules, none of these peoplewere opposed to energy-efficiency programs.
Advocates for non-profit groups. We also interviewed five members of non-profit organizations:three work for organizations advocating energy efficiency; one works for a non-profit group thatimplements national, market-based, efficiency programs; and one works for an advocacy group thatopposes federal funding for energy-efficiency programs.

3-4
Table 0.1. Summary of Data Collection and Sampling Strategy for U.S. Interviews
SampleCategory
ResearchTechnique
SampleSize
Dates Description ofpeople interviewed
Sampling strategy
Policymakers Semi-structuredinterviews
16 Jan 1996 Congressional staff,implementers atFederal agencies,andadvocates with non-profit groups.
For congressional staff andadvocates: discretionary sampleof policymakers who bothsupported and opposed continuedfunding for energy efficiency.For implementers: staffresponsible for a range ofprograms, including standards,voluntary programs, andlabeling/education.
Retailers Semi-structuredinterviews
14 Oct 1996 -Jan 1997
Salespeople andmanagers at each of2 stores at 2 differentretail chains inDelaware and NewJersey.
Selected one national applianceand electronics superstore chainand one regional chain in theMid-Atlantic that primarily sellsappliances. Selected two storefrom each chain in New Jerseyand Delaware. Supplementedinterviews of salespeople withinterviews of store management.
Retailers Participantobservation
25a Dec 1996 Worked as salestrainee for twoweeks in a regionalappliance store inNew Jersey. Workedclosely withsalespeople,observed sales, andinteractedextensively withcustomers.
Developed close relationship withstore manager, who supported mytwo-week work stint at store.Interacted on regular basis withcustomers coming into store.Took turns working the floor withdifferent salesmen, who explainedto customers that I was a “salestrainee.”
Consumers Semi-structuredinterviews
100 Feb-Mar1996Nov 1996 -Jan 1997
15 consumers at eachof 2 stores at 2different retailchains.
Sampled customers at random asthey exited the four appliancestores in New Jersey andDelaware. Primarily interviewedpeople who had purchased arefrigerator, range, clotheswasher, or clothes dryer withinthe past year.
a I made detailed observations on 25 complete sales transactions over the two-week period
Retailers and Consumers
I used a two-pronged approach in order to better understand the appliance purchase from theperspective of both the retailer and the consumer. I conducted participant observation by working fortwo weeks as a sales trainee at a regional appliance store in New Jersey. I also conducted semistructuredinterviews with both salespeople and consumers at four appliance stores in New Jersey and Delaware.

3-5
Table 0.2. Summary of Data Collection and Sampling Strategy for Thailand Interviews
SampleCategory
ResearchTechnique
SampleSize
Dates Description of peopleinterviewed
Sampling strategy
Policymakers Semi-structuredinterviews
11 Jul-Aug1996
Policymakers andprogram implementersat governmentagencies and electricutilities.
Selected one or tworepresentative policymakersfrom each key organization andenergy agency responsible fordeveloping policy anddesigning and implementingprograms to improve applianceefficiency.
Retailers Semi-structuredinterviews
53 Mar-Apr1997
Salespeople andmanagers at 45different stores in threeThai cities, includingstores in rural districtsoutside the cities.
Targeted a mixture of largedepartment stores and small“shophouse” stores ingeographically dispersed areasin the three cities.
Consumers Unstructuredand semi-structuredinterviews
62 Mar-Apr1997
Consumers atdepartment stores and“shophouse” stores inthe three cities, andconsumers in fourrural districts.
In cities, conducted mall- andstore-intercept interviews withshoppers at random. In ruralareas, was introduced to localvillagers by the villageheadman or district chief.
Consumers Surveys 971 Mar-Apr1997
Consumers in 14department stores andone outdoor nightbazaar in the threecities, and in thecentral market areas infour rural villages.
In cities, conducted mall- andstore-intercept surveys withshoppers at random. In ruralareas, surveyed villagers atrandom in central market area.Interviewed two groups ofconsumers: those who hadbought an appliance within thepast year (~2/3 of sample) andthose who had not (~1/3 ofsample).
Sampling Strategy in the U.S.
Dealt the hand of a typical graduate student who is long on time and short on funding, I decided tostudy appliance stores close to home in the Mid-Atlantic region. I initiated contacts at two appliancestore chains: one, which I will refer to as Electric World, is a national appliance and electronicsequipment “superstore;” the other, which I will refer to as Acme Appliance, is a regional appliance chainserving the northeastern U.S. I developed a contact at Electric World through a colleague who knew thehead of purchasing, from his company’s participation in a national pilot program to promote the sale ofenergy-efficient appliances.1
I gained the cooperation of Acme Appliance by looking in the yellow pages and calling the managerof a local store in Delaware. When I asked for permission to conduct exit interviews with customers, Iwas referred to the company’s corporate office and given a toll-free telephone number. The contact that Iinitiated with a vice-president at Acme Appliance proved especially fruitful; I was later able to gain the
1 This was one of several contacts I made through this program, the Energy Star Retail Labeling program, whichwas described in Chapter 2.

3-6
confidence of a local store manager for the chain and to work for two weeks as a sales trainee to observethe retail environment.
I conducted interviews with retailers and consumers at four stores dispersed throughout the region —two at Electric World and two at Acme Appliance. One store was located on busy highway in a fairlyaffluent area between Wilmington, Delaware and Philadelphia, Pennsylvania. Two stores were locatedin on a major highway and business corridor just north of Trenton, New Jersey, and one was located in aless affluent, rural area of southern New Jersey.
I also made abortive attempts at interviewing consumers and retailers at two other store chains. Inthe first attempt, Lord and I entered a large department store and began to interview consumers as theywere leaving the appliance section of the store. After the first interview, we were approached by asecurity agent employed by the store who asked what we were doing. When we explained that we werestudents from the University of Delaware conducting a survey, we were told that soliciting was notallowed in the store and were asked to leave. We then attempted to meet with the store manager, whowas not available. At this point, we realized that a more formal approach would be required in order togain permission to do research in the store. We thus wrote a letter to the store manager requestingpermission to interview salespeople and consumers. A few weeks later, we received a message from anofficial at the store requesting that we call back. However, over the course of the next two weeks, wewere unable to establish contact and decided not to pursue the issue further.
In a second abortive attempt, I contacted the head refrigerator buyer for another national chain ofappliance superstores. This company is also participating in the Energy Star Retail Labeling Program. Ifirst conducted an hour-long telephone interview with the buyer, who was supportive of my research. Hetold me that, under new company procedures, I could not conduct research at his company’s stores untilthe project was pre-approved by their communications department. Several weeks later, I received aformal letter from the Director of Corporate Communications, Training & Development politely statingthat they were “unable to participate” in my research. I decided not to pursue the issue further.
From these experiences, I learned (a) that it is essential to request approval from store managementbefore attempting to interview consumers and retailers;2 (b) that direct contact with top storemanagement — or the corporate office in the case of a chain store — is usually the best approach; and (c)that perseverance pays off, since I was able to establish strong contacts at two appliance store chains, oneof which permitted me to actually wear the sales uniform and work the sales floor during a two-weekperiod of participant observation.
Participant Observation
In November 1996, after interviewing the manager of a local Acme Appliance store, I realized that Iwould be much more qualified to assess the interaction between salespeople and consumers if I couldarrange to spend more time in the store. On a whim, I volunteered my services and asked the manager ifhe could use any help around the store. To my surprise and delight, he said that with the Christmas rushapproaching, he could use a helping hand. We later arranged for me to spend two weeks as a “salestrainee” at the store. My uniform consisted of the standard gray flannel slacks, blue blazer, white shirt,and red, white, and blue polyester tie of the store salesman.
I had two main objectives while working at the store: (a) to spend as much time as possibleinteracting with the customers, and (b) not to make a nuisance of myself or wear out my welcome. At
2 While it is possible to conduct exit interviews outside of the store premises, this is inconvenient and less
effective, especially in cold and inclement weather.
3-7
first, Ed (the store manager) suggested that I could work as a “greeter.” Some appliance stores use agreeter to establish first contact with the customer in a low-pressure manner as they come in the door.Typically, a greeter will say “Hello, welcome to Acme Appliance. How are you today?” This allows thecustomer to ask a specific question (such as “Where are the refrigerators?”) or to just say hello and goabout their business unperturbed, but feeling welcomed by the store. The vice-president of AcmeAppliance told me that he preferred that all customers be greeted within no more than one minute (andpreferably fewer than 30 seconds) after they enter the store.
My role as a greeter did not work out, however, mainly because it was not the custom to have agreeter at this particular store. So I continued to play the versatile role of “go-fer,” junior salesman, andsales trainee. In the morning, I would join the daily sales meeting, which was typically a two or threeminute stand-up meeting during which the manager would tell the salesman the sales figures for theprevious day, compare these to their weekly goals, and talk about things around the store that needed tobe done (such as updating the price tags in a certain area of the store, or setting up a new display).
I would then accompany one of the salesmen on the bank and coffee run. This was an excellent timeto learn about the inside politics and maneuvering within the store, as well as to get the know thesalesmen and ask questions about their work. By the end of the two-week stint, the store manager trustedme enough to give me the bank bag, which was filled with about $5,000 in cash, and ask me to make thebank run by myself!
Upon returning to the store with coffee and donuts for the salesmen, I would assume my position atthe back of the store or behind the counter. During slow periods, I was able to listen to and join thebanter between the salesmen and the store manager. In this way, I was able to learn much of the salesvocabulary and to observe the day-to-day concerns that preoccupy and motivate the salesmen. Salesmenwould take turns assisting new customers as they entered the store. In their parlance, each of theseencounters was referred to as an “up.” For example, one salesman might ask, “Whose up is it now?”And another might reply, “It’s John’s turn, Tony just had an up.”
Most of my interaction with the consumers would occur when I accompanied a salesman during an“up.” Typically, the salesman would walk to the department in which the customer was interested andbegin to “qualify” the customer by asking them what type of appliance they were looking for. I wouldwalk along behind the salesman and listen attentively. At some point, the salesman would turn and say,“This is Pete. He’s a sales trainee, and he’s just learning the ropes around here.”
In some cases, when other salesmen were busy or were not on the floor, I would play the role ofgreeter and say, “Hello, welcome to Acme Appliance, my name is Pete. How are you today?” If acustomer asked a question about a specific type of product, I would reply, “I’m a sales trainee and juststarted out a few days ago. Let me get a salesman who can help you out with that.” While at times I feltembarrassed spouting this lame reply, it provided enough “cover” to legitimize my role as a buddingsalesman and to interact with the customer without interfering with the sales process.
During a typical sales interaction, there is a lull during which the salesman says, “Would you like meto go check and see if this model is in stock?” or “Would you like me to check the computer and see ifwe can have that delivered to you tomorrow?” This is one strategy for “closing” a deal. I found it anexcellent time to converse with the customer and to probe about the factors in their purchase decision.These three to five minutes of time with the customer allowed me to gain a different perspective on theirdecision than I would have if I had only witnessed the give-and-take between them and the salesman. Igenerally used these interludes to ask about and clarify customers’ top priorities in the purchase decision.

3-8
Avoiding Threats to Validity
Lord and I developed our initial interview protocol with an eye toward avoiding some of the potentialbias introduced in surveys of appliance decision-making behavior conducted by other energy researchers.Below I provide three examples of biased interview formats used by energy researchers — one inAustralia, one in the United States, and one in the United Kingdom.
In a 1991 survey of consumers evaluating the Australian energy label for electric appliances, theresearchers introduced themselves with the following statement:
Good afternoon. My name is ________ and I’m from Quadrant Research Service.We’re doing a survey on behalf of the Gas & Fuel Corporation and the SEC concerningEnergy Efficiency and Energy Labeling schemes. May I please ask you a few questions?(SEC Victoria 1991: Appendix, p. 1)
In the first two rounds of consumer interviews for the U.S. Energy Star Retail Labeling program, theprotocol begins with a question asking, on a scale of 1 to 10, “how important is energy efficiency in yourappliance purchase decision?” The respondent is then told that the U.S. Department of Energy isconducting a pilot program in the store, and is asked to continue the interview. In the subsequentquestion, the respondent is asked to rate which are the most important criteria (from a list of 10 options)in the purchase of a new refrigerator (US DOE 1995: 34, 36).
Finally, in a 1996 study of response to the European Union’s appliance energy label, more than 200Britons responded to a self-completion questionnaire. The questionnaire began with a full-page pictureof the European appliance energy label. The respondent then turned the page and was faced with aquestion asking him/her to select the three most important factors (from a list of nine) in the purchase ofa refrigerator (Strang 1996).
The three studies above all exhibited a significant internal threat to the validity of their findings: thepossibility of instrument reactivity and the Hawthorne effect. The problem is that if people know that theinterviewer is an advocate of energy efficiency, or is studying energy efficiency per se, they may tend torespond in a way that suggests that they are very concerned about energy efficiency, leading theinterviewer to infer that energy efficiency plays a larger role in their decision-making process than itactually does. All of the interview protocols above began by signaling to the respondent that the studyfocused on energy labels, thus increasing the possibility that the respondents would bias their answers infavor of energy efficiency. This source of potential bias has also been called the deference effect, whichoccurs “when informants tell you what they think you want to know, in order not to offend you” (Bernard1994: 231).
Lord and I avoided this bias by representing ourselves as students in public policy who wereconducting basic market research. Our interview protocol began with questions about why therespondent was in the market for an appliance, how they gather information, and what were the mostimportant criteria in their purchase decision. Only after the respondents named their criteria, which mayor may not have included energy efficiency, did we move on to ask them detailed questions about energyefficiency and the appliance labels.
Semistructured Interview Protocols

3-9
In February and March 1996, Lord and I conducted semistructured interviews with a sample of 13consumers at an Acme Appliance store in Delaware. The interviews with consumers were short(typically five to 10 minutes) and were conducted as the customers were leaving the store. We onlycompleted interviews with customers who had purchased a major appliance (refrigerator, air conditioner,dishwasher, clothes washer, clothes dryer, combined oven-range, water heater, or furnace) within the pastyear. That first consumer interview protocol was the prototype for an interview protocol I later used withconsumers and salespeople at four appliance stores in New Jersey in Delaware, and with consumers andsalespeople in Thailand.
I expanded on the preliminary consumer research with 13 consumers by interviewing an additional87 consumers at the four appliance stores in New Jersey and Delaware from November 1996 throughJanuary 1997. I also interviewed salesmen at the same stores. In the U.S., I interviewed a total of 100consumers and 14 salesmen. The results of my interviews with salespeople and consumers are reported inChapters 5 and 6, respectively. The interview protocols for U.S. consumers and salespeople can befound in Appendix C.
As I began the second round of U.S. consumer interviews in November 1996, I realized that fewconsumers appeared to fully grasp the meaning of the yellow EnergyGuide labels, which are required bylaw to be posted on the front of most major household appliances. In order to test consumer cognition ofthe label, I added a short section to the interview protocol — on a pilot basis — in which I asked them todescribe, in their own words, the meaning of a sample EnergyGuide appliance label.
Although adding these questions on label cognition lengthened the typical interview from 5-10minutes to as long as 10-15 minutes, the preliminary results were startling, and I decided retain thequestions. Later, when I transcribed the interviews, I was able to measure the length of time it took theconsumer to understand the label as well as the extent to which they were able to accurately interpret fivedifferent aspects of information presented on the label (operating cost, efficiency, scale of energy use,and the table showing operating costs at different energy prices). The results of the label cognition studyare reported in Chapter 7.
Research in Thailand
Normally, it would take at least a year or two to be able to effectively carry out a research study ofthis magnitude in a foreign country. However, since I had previously worked in Thailand for six years(1989-1994), four of those in the field of energy policy, and since I speak Thai fluently, I had much of theknowledge infrastructure needed to plan and carry out the study. Nonetheless, I felt it necessary toassemble a Thai research team for the following reasons:
(a) Since it is unusual for foreigners to speak Thai fluently, especially in rural areas, there would beless possibility of some sort of response bias if Thai researchers were to conduct the surveys and to leadthe interviews of consumers and salespeople.
(b) I obtained funding from Thailand’s National Energy Policy Office to conduct a processevaluation of the appliance energy labeling program. This funding allowed me to assemble a team withexperience in field survey research.
(c) By working closely with this team, I could leverage my own knowledge and efforts, whilegaining the benefits of the team’s survey experience in Thailand.
I began by approaching a professor of economics at Thammasat University, one of Thailand’s twomost respected universities. Prof. Tagud Sreecomporn has years of experience doing surveys andresearch in the fields of education, business, energy, the environment, and agricultural development. I

3-10
then hired three students from Ramkamhaeng University who had experience doing survey research inthe energy sector.
The division of responsibilities among the Thai team members was as follows: I was the teamcoordinator and provided continuity with the U.S. interview protocols; Prof. Tagud, the most experiencedmember of the team, helped me plan the research and led the semistructured interviews with consumersand salespeople; and the survey researchers, under guidance from Prof. Tagud and myself, conducted thequestionnaire surveys with consumers.
Prof. Tagud and I conducted unstructured and semistructured interviews with more than 62consumers and 53 salespeople in the three cities. All these interviews were tape recorded and latertranscribed and analyzed. Our funding allowed us to supplement the results of the semistructuredinterviews with a national questionnaire survey. The survey, which included 971 consumers in threemajor Thai cities (Bangkok in the Central Region, Chiang Mai in the North, and Khorat in the Northeast)allowed us to gain a broader understanding of the effectiveness of the labeling program nationally. Theresults of the survey were used to evaluate consumer awareness of energy efficiency, as well as theoverall effectiveness of the appliance labeling program and associated advertising campaign.
Developing the Thai Consumer Survey
The survey questionnaire was developed through the following process. Prof. Tagud and I conducteda number of in-depth, semistructured interviews with Thai consumers, using the format Lord and Ideveloped in our work with U.S. consumers (du Pont and Lord 1996). The questions and wording of theThai translation were adapted to be as effective as possible in the Thai context. The English-Thaitranslation was carried out by Prof. Tagud; I then closely checked the Thai wording with him anddiscussed the meaning of alternative Thai phrasing, to ensure that the Thai translation matched theEnglish as closely as possible, but was still appropriate for the Thai context. These questions were thendeveloped into a longer, more detailed set of closed-ended (rather than open-ended) questions — asurvey questionnaire.
We tested the draft survey questionnaire over several days at a number of different stores beforeagreeing on a finalized version of the questionnaire. We also received very helpful suggestions andcomments on the draft survey questionnaire from Dr. Paktrawimol Phienlumplert of the Institute forEnvironmental Research at Chulalongkorn University, who has extensive experience in conductingconsumer research on environmental issues in urban and rural Thailand.
As with the semistructured interview protocol, the Thai consumer survey was designed to first gatherbasic information about the appliance purchase and to determine which factors were most important inthe consumer’s decision. These questions were followed by questions about awareness of the Thaienergy conservation programs and more specific questions about the energy label and how and whether itinfluenced the consumer’s decision. A final set of questions dealt with consumer interest in andawareness of environmental issues related to the purchase and use of appliances. At the end of eachinterview, the survey researchers would then ask for demographic data — the consumer’s age, level ofeducation, occupation, family size, and income.
While the survey was directed at people who had recently purchased either an air conditioner orrefrigerator, we also decided to develop a similar, but shorter, survey questionnaire for people who hadnot recently purchased an appliance. Having two groups of consumers allowed us to compare theawareness of general Thai consumers with that of recent appliance purchasers. English translations ofthe Thai survey forms can be found in Appendix D.

3-11
Unstructured Interviews
We conducted a set of unstructured interviews with a handful of consumers in each of the threecities. An unstructured interview allows the subjects to speak in their own words without being guidedby a pre-conceived set of questions. In the unstructured interviews, we explored personal motivations forbuying an air conditioner or refrigerator, how consumers think about these appliances, and how they usethem to store food or stay cool. The objective was to gain insight into the underlying roots of demand forthese appliances. The interview protocol for the unstructured interviews is in Appendix D.
Semistructured Interviews
We conducted semistructured interviews with 62 Thai consumers in the three cities. By using asimilar interview format in the U.S. and Thailand, it was possible to compare responses between U.S. andThai consumers across a range of questions, such as “What were your most important criteria in selectingthis appliance?”, “Did you look at the energy label before you purchased your appliance?”, and “Do youknow how much energy this appliance costs to operate each month?” The interview protocol for thesemistructured interviews of Thai consumers is in Appendix D.
We also conducted semistructured interviews with a total of 53 salespeople in the three cities.Salespeople play an important role in the appliance purchase decision (by providing information,displaying certain models and features, and explaining the meaning of the energy labels), and theseinterviews helped us to understand the sales process. The results of these interviews were compared withthe results of the interviews and surveys of consumers to gain a holistic evaluation of the success of theThai appliance energy labeling programs. The interview protocol for the semistructured interviews ofThai salespeople are in Appendix D.
Sampling Strategy in Thailand
The goal of the surveys was to collect data from a representative sample of Thai appliancepurchasers. In order to do this, the study team planned to survey customers at a range of different typesof appliance stores in both Bangkok and upcountry. After some initial visits to appliance stores, wedecided to randomly sample consumers at several large malls and department store complexes in eachcity. We pursued this strategy after determining that we could not practically obtain a large enoughsample if we only interviewed people on the actual day that they purchased an appliance. However, bysampling the very large population of shoppers in a mall or department store, we could easily get arandom sample of 30-40 consumers in one day.
In each city, we chose several different malls and/or department stores in different locations in thecity, in order to sample a variety of consumers with different backgrounds. In the survey form, we askedfor information about level of education, family size, and income, so that we could make adjustments forthese factors in our statistical analysis. We also sampled an equal number of women and men.
The survey researchers conducted “intercept” interviews with consumers as they walked through themalls. They approached consumers and asked if they would be willing to take part in a five-minuteappliance survey. For those who agreed to take part, they then asked whether they had purchased either arefrigerator or air conditioner within the past year. Two-thirds of the interviews (633) were conducted

3-12
with recent purchasers — i.e., people who had purchased a refrigerator or air conditioner within the pastyear. A smaller sample of one-third of the surveys (338) were conducted with non-purchasers.
The semistructured interviews with consumers were usually carried out in the same mall ordepartment store complexes where the surveys were carried out. Prof. Tagud would approach theconsumer or salesperson, indicate that he was a professor from Thammasat University doing a study onelectric appliances, and then ask permission to tape record the interview. The advantage of this approachwas that the consumers were not aware that our goal was to study the role of energy efficiency in thepurchase of appliances; rather, they assumed we were doing a general market survey on appliances. Thisreduced the possibility of bias in their responses in favor of energy conservation.
We interviewed salespeople in two types of locations: in the appliance sections of the departmentstores (hang yai) and in smaller, “shophouse” appliance stores (raan khaa) in different parts of the cities.By sampling salespeople in both these kinds of stores, we were able to get a variety of perspectives,ranging from the small, independent shopkeeper to the large, corporate, department store (e.g., Central,Robinson, Merry King).
Sampling in Rural Areas
We used a similar approach to sampling consumers and salespeople in all three cities, with one majorexception: we conducted four days of sampling in a total of eight rural districts (amper) outside ofChiang Mai and Khorat. Our sampling strategy in the rural areas was to hire a driver who knew the area,and then to visit two sub-districts (tambon) each day. We would start by going to the house of the sub-district chief (kamnan) or village headman (puuyai baan). Prof. Tagud would introduce himself, explainthe purpose of our study (general market research on appliances) , and ask that they cooperate byintroducing us to a few of the villagers. This approach was necessary in order to gain the trust andcooperation of the villagers, since we were outsiders from Bangkok (and one of us was a Thai-speakingforeigner, a farang). We typically interviewed occupants of six to eight households per village or sub-district.
We received excellent cooperation in all cases. The best example was in the San Khampaeng districtoutside of Chiang Mai. The sub-district chief (kamnan) asked two of his assistants to take us around thearea and introduce us to villagers. For two hours, we were escorted on motorcycles and introduced to sixhomeowners. We had a more difficult time gaining the trust of villagers in Rim Tai sub-district of MaeRim district in Chiang Mai. The kamnan was busy at the local temple, and could not find either of hisassistants. So he wrote us a letter of introduction, which we were to show to villagers. While the letterwas accepted by most of the households we visited, one homeowner said that he did not believe that thesignature on the letter looked like the kamnan’s signature. He went back into his house and spent tenminutes going through his files to find a document with the kamnan’s signature. When he compared thetwo signatures and saw that they actually were the same, he apologized, and we proceeded with theinterview.
While we went house to house conducting these interviews, one of the survey researchers would goto the village fresh market (talaad sod) and conduct survey interviews with local villagers. We alsovisited one or two local shophouse appliance stores in each sub-district and conducted semistructuredinterviews with the salespeople or owner.

3-13
Response Rate
Table 0.3 summarizes the response rate for the in-store interviews with U.S. and Thai consumers.The response rate was calculated as the number who agreed to be interviewed divided by the totalnumber of consumers approached. It was 43% in the U.S. and 82% in Thailand. Since we toldconsumers that we were conducting a general market survey on appliances, there is no reason to believethat those who refused to be interviewed would have responded differently to the questions about energyefficiency than did those who agreed to be interviewed.
Table 0.3. Numbers Approached In Store and Granting Interviews, in U.S. and Thailand
Country Total in-storerequests
No. who agreed to beinterviewed (no. whobought an appliance
within past year)
Refusedinterview
Response rate (no.who agreed to be
interviewed dividedby total)
United States 507 220 (105) 287 43%Thailanda 1,908 1,558 (457) 350 82%a The Thai response rate has missing values, since some of the data sheets on which requests were talliedwere lost. This total number of requests and calculated the response rate covers two out of four weeks ofthe survey research in Thailand.
Methodological Issues
Approaching Retailers
Not surprisingly, the optimal approaches to retailers turned out to be strikingly different in the twocountries. In the U.S., I used a top-down approach. I quickly learned the importance and value ofestablishing contacts with the store or company management, in order to facilitate my contacts with thesales staff and to gain the permission necessary to interview consumers on the store premises. I directlycontacted the corporate headquarters of the two U.S. appliance chains to request permission to conductmy research. Once granted, this allowed the research to proceed quite smoothly. I planned a similarapproach in Thailand and reckoned that it would not be difficult to gain access, since Thailand is a fairlysmall country, whose businesses are controlled by relatively few families. However, Prof. Tagud advisedagainst contacting store owners directly, suggesting that a more informal approach was appropriate. Wedirectly contacted branch and store managers on the day that we planned to carry out interviews, andused Prof. Tagud’s government identification card (from the university) to help us gain their trust andensure access.

3-14
Table 0.4. Comparison of Sampling Techniques.
Techniques Benefits DrawbacksContactingRecentPurchasers(via mail ortelephone)
• Can target purchasers at specificstores and within a narrow timeframe.
• Can link attitudes and statedpreferences to characteristics(including energy efficiency) ofactual model purchased.
• Self-administered questionnaireseliminate the possibility ofinterviewer bias.
• Self-administered and telephonequestionnaires allow researcher tocontact a large number (i.e. hundreds)of respondents.
• Difficult to gain access to customerlists.
• Customer may have forgotten manydetails of purchase.
• If surveyed by mail, they may moreeasily ascertain goal of survey,increasing possibility of Hawthorneeffect.
• Phone interviews can be intrusive —busy people are often annoyed bymore demands on their time.
• Requires more initial leg-work andplanning than store-based interviews.
Store-Intercept/ExitInterviews
• Once you receive permission fromstore, can fairly quickly andinexpensively sample 10-20consumers per day.
• Reduced possibility of response biassince interviewer controls order ofquestions.
• Semistructured interviews allow forin-depth probing and exploring ofattitudes.
• Environment of interview closelysimulates environment of appliancepurchase (i.e., noise and “busy-ness”of store around them, shoppingenvironment, etc.).
• Being in the store allows researcherto be closer to, and gain a betterunderstanding of the salesenvironment.
• Possible to test consumerunderstanding and use of label in thestore.
• May need to screen many shoppers inorder to get adequate sample ofrecent purchasers.a
• Difficult to link response tocharacteristics (including efficiency)of actual model purchased.
• Some details of purchase may havebeen forgotten, if purchase madeprior to interview date.
• Can be intrusive — busy people areoften annoyed by more demands ontheir time.
• Personal interviews can be reactiveand require skill to avoid theHawthorne effect.
• Compared to mail surveys ortelephone interviews, can contactlimited number of respondents (i.e.tens rather than hundreds).
a In the U.S., I had to approach 5 customers in order to complete 1 successful interview with a recentpurchaser (see Table 0.3)
In-Store Sampling vs. Contacting Recent Purchasers
I considered two alternative strategies for sampling recent appliance purchasers. One would involveprocuring from the retailer or manufacturer a contact list of recent appliance purchasers. I would thencontact these recent purchasers by telephone or mail. This strategy has been successfully pursued byresearchers at the Environmental Change Unit at Oxford University (Banks 1998). A second strategywould involve interviewing customers at the store, either using exit interviews or “mall intercept”

3-15
interviews. The strategies are compared in Table 0.4, with some points elaborated upon in the followingpages.
I chose to conduct in-store interviews because the technique dovetailed so closely with the rest of myresearch — participant observation as a sales trainee and extensive in-store interviewing of salespeople.Past social science research has indicated the importance of context and environment to the way peopleconceive and process information (Rogoff 1984). For example, a seminal study on how grocery shoppersmake qualitative and quantitative comparisons between products and rationalize their decisions wasconducted by Lave et al. using participant observation. They found that shoppers’ decisions were largelybased on they way they filter and interpret information in the particular environment, as well as on theattitudes they bring to the store. Shoppers rely on past experience and results, and filter overwhelmingamounts of information, “only a small part of which they treat as relevant” (Lave, Murtaugh, and de laRocha 1984: 76).
In the U.S., while it would have been desirable to link consumers’ stated preferences and attitudeswith the actual features and performance of the model they purchased, I decided that the benefits ofconducting the interviews “in the store” outweighed the limitations. Conducting all my research in thestore also reduced my transaction costs and facilitated my interactions with consumers and salespeople,since I could interview both consumers and salespeople on the same day.
Besides being more convenient and less expensive, the in-store approach had three key benefits,listed in Table 0.4: it reduced the possibility of response bias, since I controlled the order of thequestions; it allowed for in-depth probing and exploring of attitudes; and it enabled in-store tests ofconsumer cognition of the energy labels.
Exit Interviews vs. Mall-Intercept Interviews
Our strategy for interviewing consumers was adapted to the circumstances in each country. In theU.S., I received permission from Electric World and Acme Appliance to perform “exit interviews”` withconsumers as they were leaving the appliance superstores. In fact, the U.S. stores contained manyelectrical and electronic items besides large household appliances (e.g., stereos, televisions, computers).Thus, when I would ask someone if they would participate in a five-minute “appliance survey,” therewould be only a 10-40 percent chance that they had bought, or shopped for, a large household applianceon that day. Under these circumstances, it would have been much more time-consuming to onlyinterview people who had bought on that day. I thus interviewed anyone who had purchased a largehousehold appliance within the past year, on the theory that they would remember enough about thedecision process to provide useful and fairly accurate information for the interview.
In Thailand, there are no such appliance superstores. Thai consumers buy appliances at two kinds ofstores: large (often huge) department stores, which have an appliance department; and small, shophousestores, which usually are cramped with a fairly small selection of appliances, and over which shops theowner and his family typically live. It was thus impractical to perform exit interviews either near theappliance department inside the large stores or by waiting outside the shophouse stores. To attempt sucha strategy, one would be fortunate to complete even four or five interviews a day.
We decided instead to sample the rather large population of shoppers at the many “mega-malls” thatdot the Bangkok landscape. The three survey researchers, armed with clipboards and survey forms,would stroll through the mall, asking shoppers at random whether they would participate in a five-minuteappliance survey for Thammasat University. Using this strategy, each researcher was able within a dayto survey 10 to 15 people who had bought an appliance within the past year.

3-16
Limitations of the Methodology
There are a few potential limitations in my methodology. One is that I did not gather data on thespecific model and efficiency of the appliance purchased by each respondent. I was thus unable to makethe crucial link that would determine the ultimate effectiveness of the label: the extent to which the labeland other consumer priorities influenced their decision to buy a more efficient model. Despite thisdrawback, I feel that the advantages of performing store-based research allowed me to gain a more in-depth perspective on consumer cognition and behavior than I would have if I had done a retrospectivemail survey of recent appliance purchasers.
A second limitation is that I did not use strictly parallel methodologies in the U.S. and Thailand. MyU.S.-Thai comparisons were made between a database of 100 consumers U.S. who were interviewed in asemistructured format and a database of 971 Thai consumers who were surveyed in a closed-endedformat. This disparity in the sample sizes is mitigated by the fact that I carried out semistructuredinterviews with 62 Thai consumers, and this helped me interpret the data from the Thai surveys. Inaddition, my own function as the developer of both the U.S. and Thai interview and survey instrumentsreduces the possibility that there is significant instrument bias or variation between the way theinterviews were conducted in Thailand and the manner in which the surveys were carried out in Thailand.
Another limitation, mentioned in Chapter 1, is that I limited my research to the role of energyefficiency in the retail appliance purchase. It does thus not address other classes of appliance sales suchas the bulk purchase of appliances by apartment managers and builders of tract homes who have noincentive to buy energy-efficient equipment. However, since the vast majority of appliances are owned(rather than rented) in both the U.S. and Thailand, this research addresses the most significant portion ofthe U.S. and Thai appliance markets.
Despite these limitations, I feel confident that the methodology is robust because it comprises a set ofcomplementary, mutually-reinforcing techniques — participant observation, unstructured andsemistructured interviews, and a closed-ended survey questionnaire.
Conclusions
This chapter has described a set of complementary research techniques which I used in my researchprojects in the U.S. and Thailand. The research began in the U.S., where I observed consumers andsalespeople by working as a sales trainee at an appliance store, and developed semistructured interviewprotocols that I used to interview 16 policymakers, 14 retailers, and 100 consumers. On the policy side,my goal was to understand the mental maps of policymakers — that is, how they interpret and frame theinformation that forms the basis for their decision-making. On the retail side, my central focus was onthe cognitive environment of consumers and retailers: how consumers prioritize their decisions, trade offpurchase factors, and view and understand the label; and whether retailers have any incentives (ordisincentives) to promote energy-efficient products. I adapted the U.S. interview protocols for use witha parallel group of policymakers, retailers, and consumers in Thailand. In addition, I conducted anational survey of 971 consumers in Thailand that was based largely on questions raised in thesemistructured interviews.
The methodology is robust because it comprises a set of complementary and mutually reinforcingtechniques — participant observation, unstructured and semistructured interviews, and a closed-endedsurvey questionnaire. The methodology also avoided the problem of response bias, which has plagued

3-17
other studies by energy researchers of consumer priorities in the appliance purchase. As a result, itshould provide an accurate picture of both the policymaker and retail environments.

4-1
CHAPTER 4
POLICYMAKERS
Chapter Abstract
This chapter discusses my findings from interviews with 16 U.S. policymakers and 11 policymakersin Thailand who are involved in the design and implementation of consumer energy policy. It exploresthe policymakers’ mental models of consumer behavior and the role of energy efficiency in the retailappliance market. It also examines how the policymakers draw conclusions about programeffectiveness. The interviews with U.S. policymakers revealed strong divisions about the role ofgovernment in promoting energy efficiency. The interviews with Thai policymakers raised issues of hownew programs and policies are adapted for implementation in a developing country, the role of foreignconsultants and expertise, and the role of evaluation in program design.
Introduction
The purpose of including policymakers in this dissertation research is that while they play a centralrole in developing energy policy, little is known about their mental maps – that is, the assumptions theymake and the way in which they gather, organize, and interpret the information that forms the basis fortheir decision-making. In my research on energy policy and consumer behavior, I found that the existingliterature does not go far enough in explaining the mental maps of policymakers and how those mentalmaps affect subsequent development of consumer energy policy.
The planning and implementation of different types of energy policy requires understanding the stepsnecessary for the success of each program. For example, for minimum efficiency standards some of thesteps include the assessment of the marginal cost for technical improvements, the development of cost-efficiency curves for these improvements, the assessment of the economic impact on consumers, andsome level of support from, or at least dialogue with, manufacturers. For labeling, the steps include theavailability of reliable testing facilities, the design of a consumer-friendly label, the establishment ofrational ranking categories, the development of ancillary materials (such as educational brochures),education of the sales force to help promote the label and to educate consumers, and regular process andimpact evaluations of the labeling program. These steps have been fairly consistently followed in thecase of efficiency standards. However, for labeling, there does not appear to be a common understandingamong policymakers about the necessary steps for an designing an effective program. Several of thesteps are not as well understood and not as consistently followed as with standards.
This chapter describes the results of in-depth, semi-structured interviews with U.S. and Thaipolicymakers responsible for developing energy-efficiency policies in the two countries. Themethodology is described in Chapter 3. The preliminary results of my interviews with U.S. policymakersalone are described in a previously published paper (du Pont and Lord 1996); this chapter expands thatanalysis and compares the U.S. results with the Thai results. Both sets of interviews addressed thebarriers to the sale of energy-efficient products, consumer purchase priorities, effectiveness of appliancepolicy, and the appropriate role of government. The interviews with Thai policymakers also contained

4-2
questions specific to the context of implementing new types of policies and programs in a developingcountry. These included questions on the policymaking process and the role of evaluation in programdesign.
Sample Description
The sample of U.S. and Thai policymakers we interviewed is summarized in Table Chapter 4 .1.Fifteen U.S. policymakers were interviewed in January 1996. They ranged in age from 28 to 59 yearsold, with an average age of 42 years old. Their experience in energy and/or energy-efficiency issuesranged from six months to 26 years, with an average of 13 years. Eleven of the policymakers were maleand four were female. Six worked for government agencies, four worked for congressional staff orcommittees, and five worked for non-profit organizations.
I interviewed 11 Thai policymakers in July and August 1996. They ranged in age from 35 to 60years old, with an average age of 47 years old. Their experience in energy-related issues, ranged from 4to 15 years, with an average of 8.1 years. Nine of the policymakers were Thai, and two were foreignadvisors. All were male. Five worked for government agencies, three worked for the electric generatingutility (a state-owned enterprise), and three worked for the private sector, but served as advisors andconsultants on the government and utility energy conservation programs.
While energy-efficiency policies have been implemented in the U.S. for more the two decades,Thailand initiated its ambitious national energy-efficiency programs just seven years ago. Thus while theU.S. policymakers I interviewed had an average of nearly 13 years of experience, the Thai policymakershad just eight years of energy-related experience, and most of these had only three to four years directexperience in the implementation of energy-efficiency programs.
Table Chapter 4 .1. Summary of Policymaker Samples
SampleSize
Gender AverageAge
AverageExperience
M Figure (years) (years)U.S. Policymakers 15 11 4 42 13Thai Policymakers 11 11 0 47 8.1
While all of the U.S. sample worked for public or non-profit agencies, the Thai sample had no non-profit workers and three individuals working in the private-sector. The reason for this disparity is thatthe non-profit sector in Thailand has to date had very limited involvement in the actual design orformulation of energy policy. One of the three private-sector respondents used to work for a non-profitthink tank before he started his own consulting firm; he is still involved with the Thai Load ForecastSubcommittee. Another Thai businessman recently retired from a university position to run a private-sector firm; he continues to serve on the government committee that oversees the Energy ConservationPromotion Fund. And the third private-sector respondent is a foreigner who provides consultingexpertise to Thai government agencies on a contract basis. Since the Thai private sector employees, likethe U.S. non-profit staff, are analysts involved with the design, promotion, or implementation of energyefficiency programs, the difference in the sample composition should not bias comparisons betweenpolicymakers in the two countries.

4-3
Issues Common to Both Countries
This section compares and contrasts the responses of the two sets of policymakers to a common setof questions about the development of consumer energy policy. These include their understanding of thebarriers to energy efficiency, their views on consumer attitudes, their understanding of the salience ofenergy efficiency to consumers, and their views on program effectiveness. Subsequent sections describesets of issues that are particular first to the U.S. policy environment and then to the Thai policyenvironment.
Barriers to Efficiency
The majority of the U.S. policymakers effortlessly recited a list of existing barriers that preventmanufacturers and consumers from producing and purchasing energy-efficient equipment. Three-quarters of the 16 U.S. policymakers began by mentioning “cost” or “first cost” as one of the majorbarriers to the sale and production of energy-efficient products.
Three-quarters of the U.S. policymakers also mentioned lack of information, limited distributionnetworks, and consumer and manufacturer “perceptions” of energy efficiency as additional barriers to theproduction and purchase of these products. Half of the policymakers suggested that manufacturers“perceive” a risk involved with introducing energy-efficient technologies, that manufacturers seem tobelieve neither that there is a market for energy efficient products, nor that consumers are willing to paymore for such products. These same policymaker respondents also mentioned consumer perceptions as abarrier.
The Thai policymakers tended to recite a shorter list of barriers, but the primary barrier they citedwas also price. Seven of the 11 mentioned either the high price of efficient equipment or low energyprices. Other barriers cited included lack of standards, lack of information, and lack of consumerawareness, Surprisingly, given the small market share of energy-efficient products in Thailand, only twoThai policymakers mentioned the lack of availability of energy-efficient equipment. Two of thepolicymakers also cited policy barriers as their primary concern: one bemoaned the lack of standardsspecifying criteria for energy-efficient equipment and the other pointed to the policy overlap between theutility and the government agency’s programs as the cause of delays and problems with programimplementation.
Two policymakers in the electric utility’s DSM Office, which is operating the first nationwideprograms to promote appliance efficiency, mentioned price as a barrier, but also indicated that theprimary barrier was cultural and had to do with awareness. The director of the DSM Office said,
If you give the money to the people, people will do it when you give them themoney. But after that, they might forget it. But in Thailand … we would like toconvince the people to join our program not by forcing them or giving them money, butby heart they accept the principle and they will help you and it will last very long forThai people. So in every program here in this country, we talk about cooperation bypeople (Thai policy interview no. 3).

4-4
Another official in the Thai DSM Office, Vichai, echoed his boss’s emphasis on building awarenessrather than focusing on pricing and incentives:
I mean in U.S.A. they think that price is the barrier, they have incentives. That istheir way. I think that is a mistake. I mean you have to understand clearly the attitudeand the culture of the public … I mean when we have a battle, in fighting, the army, youneed to know which side to attack first, this one first, that one second, that one third, notattack all at once. In U.S.A. they think price is the only barrier, and they use incentivesto attack all … But we don't do that (Thai policy interview no. 4).
While Vichai’s generalization about all U.S. energy efficiency programs is not accurate, it is true thatmost U.S. energy conservation programs have focused on providing some sort of rebates or incentives tospur the adoption of energy-efficient equipment and practices (Nadel 1991). The above quotes help toexplain why the Thai DSM Office has decided to design most of its initial energy efficiency programs asvoluntary programs with limited or no financial incentives. The Thais perceive the barriers differentlythan do their U.S. counterparts and do not consider price to be the primary obstacle. The second quotealso reveals apparent resentment of the U.S. policy approach. This theme is discussed later in thischapter in the section on how rebates are viewed in Thailand.
Do We Actually Understand the Barriers?
Alone among all U.S. and Thai policymakers, one individual, who has more than 20 years experienceanalyzing and advocating energy-efficiency technologies and programs, gave a unique response to thequestion about barriers:
Primarily we don’t understand what the barriers are. There is a whole standard listfrom the literature that you know as well as I do. But I don't think that goes far enoughin explaining, from a theoretical viewpoint, what the problem is. For some reason oranother, manufacturers have the perception that efficiency doesn’t sell, so they don'tproduce it. Consumers don’t have the choice of efficiency in a convenient way and aretalked out of it by the salesman when they start making a decision in that direction.There is a role for retailers and distributors. And it isn’t understood even by the expertsin the business. It’s sort of like asking why is there so much sex and violence on thetelevision. Do consumers choose ugly, sexy movies? Do producers foist bloody movieson the public? Generally no. But generally the movies get produced and sold, andpeople see them (U.S. policy interview no. 5).
This respondent (hereafter referred to as “the dissenter”) makes an important point about consumersnot being able to conveniently choose energy-efficient models. Although he has more than 20 years’experience as leading national advocate for energy efficiency, he was the only policymaker from eithercountry who did not recite a list of barriers to energy efficiency. He went on to say that there are no realdata on how consumers perceive energy efficiency in the purchasing process. Rather “there are

4-5
impressions from manufacturers, and there is behavior that follows from those impressions.” He appearsto believe that policymakers have theories or explanations about why energy efficiency doesn’t sell, butthat consumer preferences for energy efficiency have never been tested in an experimental way.
A central theme of his message was that the behavior of consumers and retailers is not wellunderstood. Up and down the decision-making sequence, from producer to consumer, decisions aremade in the absence of good information about the true relevance of energy efficiency to the consumer.The “sex and violence on television” analogy underscores this attitude of powerlessness he feels inattempting to fathom the decision-making processes of manufacturers and consumers. There is no clearand unambiguous “cause” for the lack of marketing and purchase of energy-efficient products.According to the dissenter, policymakers are therefore forced to develop policy responses to a problemthat is not well understood.
Views on Consumer Attitudes
I queried policymakers to understand the extent to which they base their assumptions about consumerpreferences and behavior on social science research and market studies. I also assessed the extent towhich consumer input affected the development of policy and program design. Only about half of thepolicymakers in either country appeared cognizant of value of basing policy on detailed consumerresearch; an even smaller percentage pointed to explicit input from consumers in the policymakingprocess. When asked about consumer preferences, policymakers tended to frame their responses inpersonal terms, using anecdotes or relying on their own personal experience or that of friends.
For example, several of the U.S. policymakers did not believe that consumers would be sophisticatedenough to calculate the payback for an energy-efficient appliance. Yet none were able to cite specificresearch results to back up this claim. One policymaker expressed the belief that consumers tend not tobe aware of appliance operating costs and that, even if they were, they would not know how to calculatelife-cycle cost and compare appliances based on this measure. He explained:
Who realizes that two-thirds of the total cost of a refrigerator is electricity, one-thirdis first cost? You and I and about thirty other people know that. And, you know, even ifpeople did realize that electricity is important, they don’t know how to compare costs,how to calculate life-cycle costs, or compare products (U.S. policy interview no. 1).
Thai policymakers also tended to draw conclusions about consumer behavior based largely on theirown experience. When asked a general question (“Do you think that consumers actively seekinformation about energy use when they buy an appliance?”), seven of the 11 Thai policymakersprovided a yes or no response without citing any specific research. Instead, they cited sources such as “Iask salespeople,” “from my own experience,” or “common sense.” Two provided a response butadmitted they lacked data, and two provided at least some reference to support their response. A typicalexchange is shown below:
Do you think that consumers actively seek information about energy use when theybuy an appliance?

4-6
Pongsak: Not really, except those who have high education. With the low-incomeconsumer, they don't care about quality, just look at the low-price product. If it’saffordable, it’s O.K. for them. They don't look at the quality, just look at the price.
How do know this?
Pongsak: Uh, it’s uh … common sense (Thai policy interview no. 7).
Anecdotal or personal experience was again predominant when I asked policymakers from bothcountries about consumer priorities when making an appliance purchase. About half of the policymakersin both countries quickly rattled off a list of consumer preferences without referring to any supportinginformation such as studies, surveys, or conversation with manufacturers or suppliers.
Most of the U.S. policymakers listed “price” as the consumer’s number one priority, with “features”,“color”, “brand name”, “convenience”, “performance” and “delivery” as other key factors in thedecision. Several referred to their own personal experience and the experience of colleagues and staff.One U.S. legislative assistant asserted that “price and features are the top priorities,” adding that “energyefficiency is probably at the bottom of the list.” When asked how he knew this, he cited his ownpersonal experience: “I have looked at labels on appliances, but I have never made a decision based onenergy use. I am your worst nightmare.” Another U.S. policymaker, an energy-efficiency advocate, feltthat consumers really do care about energy efficiency. Without being able to cite any specific data —beyond conversations with friends — he said he believed that interest in energy efficiency wasincreasing.
About half of the U.S. policymakers were able to separate their personal feelings or intuition fromthe scientific question of whether data exist on consumer preferences and what the data actually indicate.Three U.S. policymakers cited manufacturers (either discussions or surveys), and one cited discussionswith salespeople involved in a program that he manages. One legislative assistant stated that cost was thefirst priority, citing a Gallup poll on general consumer preferences (not related to energy-consumingproducts). One-quarter of the policymakers stated that they either had no idea or there were no dataavailable. The following response, from a congressional committee staffer, is typical of the cautiousattitude of a minority of respondents. It also contains an air of resignation about it. The implication isthat we do not have it in our power to really understand consumer decision-making.
I don't know. This is something we need more information on, I mean consumers aremore aware than they were 10 years ago. Labeling has gone a long way, but has itaffected consumer decisions? We don't know, we can only make it [the label] available(U.S. policy interview no. 15).
As in the U.S., about half of the Thai policymakers were cautious about making broad assumptionsabout consumer priorities. Two provide responses that were based on input about consumer preferencesbased on discussions and interviews with manufacturers; and three stated that they had no idea becausethere were no data available. The remaining six policymakers easily provided a list of priorities, all basedeither on their own experience or educated guesses.
Apparently, at least half of the policymakers we interviewed in both countries felt comfortablemaking broad assumptions about consumer preferences without any market research or supporting data.
4-7
Yet the consequences of such a lack of reliance on consumer surveys and input can be disastrous. OneU.S. agency employee, Bob, provided a specific example of a strong negative consumer response to aproposed policy intervention. The example involved an advance notice for a proposed rule for a federalstandard that would have largely eliminated electric resistance water heaters in favor of a more efficienttechnology, heat pump water heaters. Bob explained that, early in the process, he and his staff wereaware that consumers and utilities might have concerns about the proposed rule. As the process wore on,the initial “gnawing in his gut” about the strong proposed standard was gradually outweighed by its largedollar and energy benefits. However, after the proposed rule was published, the agency received atorrent of letters and responses directly from consumers (who, in the policymaker’s view, seemed to havebeen motivated, or at least organized, by the electric utility industry). Bob concluded that he should havelistened to his first instinct (the gnawing in his gut) and realized that the proposed rule, despite itsimpressive energy and economic benefits, would stir intense opposition from consumers and industry.
Policy analysts such as Bob tend to be more concerned with saving energy and quantifyingconsequent economic and environmental benefits than with assessing the likely consumer response to apolicy. Like Pongsak, who assumed that low-income consumers would not care about quality but justfocus on price, he makes assumptions without any evidence. In fact, we found that both the U.S. andThai policymakers whom we interviewed rarely requested formal input from consumers at any point inpolicy development. To the extent that it occurs, the feedback from consumers is usually indirect, and isfiltered through dealers, distributors, and manufacturers who deal directly with consumers. In bothcountries, the consumer energy labels were developed by bureaucrats, without targeted consumerresearch to optimize the label in terms of consumer acceptance and understanding.1
In summary, it appears that policymakers in both countries rarely solicit direct feedback fromconsumers and tend to make policy that affects consumers based on limited data and personal experience,rather than on solid market research. If they are to develop truly effective policies, policymakers mustbecome experts in marketing and consumer behavior, in order to develop a better understanding of howto influence the sales transaction.
The Salience of Energy Efficiency
The vast majority of U.S. and Thai policymakers whom I interviewed assumed that energy was not ahigh priority for consumers and thus not a salient factor in appliance purchase decisions. Based onpublished data and data collected as part of this study, it appears that U.S. policymakers are correct andthat energy is not a high priority for consumers. On the other hand, Thai policymakers may beunderestimating consumer interest in energy. I elaborate on this comparison below.
All but two U.S. policymakers asserted that energy efficiency was at or near the bottom of the list ofpriorities. Given published research on this topic, the U.S. policymakers are certainly correct in assertingthat energy consumption is not a top priority for U.S. consumers in either the purchase of automobiles(Hill and Larsen 1990) or appliances (Dyer and Maronick 1988, Brown and Whiting 1996). However,the U.S. policymakers seemed to infer that, since energy efficiency was a low priority that it could not bean effective sales tool. This is not necessarily a sound conclusion. The fact that energy efficiency is nota top-tier priority does not necessarily mean that efficiency is irrelevant or might not play a moreimportant role in the consumer decision making process. Research cited in Chapter 2 suggests thatconsumer decision-making is a two-stage process that includes an initial screening on just a fewattributes and a final decision process that involves comparison among all available attributes (Bettman
1 Consumer responses to, and understanding of, the labels will be discussed in Chapter 6.

4-8
1979; Verplanken cited in de Loor and Zeelenberg 1991). This indicates that there may be more than onepoint at which energy efficiency could play a role in the decision.
When asked where energy efficiency falls in the list of consumer priorities, two U.S. policymakersdistinguished between energy efficiency as a consumer priority, and energy efficiency as a “sellingpoint.” One federal agency employee described energy efficiency as a potential “deal breaker” [sic]2. Hesuggested that energy efficiency does not have to be a top priority in order to play a role in the consumerdecision-making process, indicating that consumers may be susceptible to marketing campaigns thathighlight the merits of reduced operating cost for consumer durables and appliances. Anotherpolicymaker suggested that consumers needed guidance during the shopping process, and that a clearermessage might bring efficiency more readily to the mind of the consumer. This is the underlying premiseof the Energy Star Retailer Initiative, a joint U.S. program between the Environmental Protection Agencyand the Department of Energy to provide point-of-purchase promotional materials and sales training tostimulate the sale of energy-efficient refrigerators and other appliances.3
Thai policymakers also rated energy efficiency as low on the list of consumer priorities. While mostof the policymakers felt that the appliance energy labeling programs had been effective, they tended tobelieve that the manufacturers, who had heavily marketed the energy labels and increased the percentageof labeled products available, were primarily responsible for the programs’ success. Only one Thaipolicymaker listed energy as one of the top three decision criteria for consumers. When asked how heknew this, he cited “friends.”
My interviews and surveys with Thai salespeople and consumers indicate that policymakers may beunderestimating consumer interest in energy efficiency. In interviews with 43 Thai salespeople in threecities, energy efficiency was rated as the second highest consumer priority in the purchase ofrefrigerators, after brand.4 In the survey, 366 Thai consumers who had recently purchased a refrigeratorgave energy efficiency had a lower ranking (fifth overall), but nearly one-third (29%) listed efficiency asone of their top-three priorities.5
Given the influence of salespeople in the appliance purchase decision, the Thai programs could domore to influence consumer purchase decisions is at the retail level. I found it surprising that salespeoplehave been almost entirely ignored in the design of the Thai programs. When asked about the role of thesalespeople in promoting energy efficiency, about half of the Thai policymakers admitted thatsalespeople could potentially play a very important role. Two of the respondents cited instances in whichsalesmen actually played a negative role. In one case, a policymaker visited a store and found thatsalesmen were questioning the believability of the label. In another case, a DSM official reported thatsalesmen were trying to convince customers that the refrigerator with the energy label did not provideenough cooling, and that they should buy a model with no label, because it cooled more effectively. AThai consultant, Boonchu, stated that salespeople could play an important role in the promotion of energyefficiency. Boonchu, who has years of experience advising the government on energy policy, said he
2 While the term “deal breaker” often refers to terms or conditions that can eliminate a potential sale, the
context in which this policymaker used the term actually had the meaning of “tie breaker” – that is, that all otherthings being equal, the fact that a model is energy-efficient could become a deciding factor.
3 The results of this program are described briefly in Chapter 3.4 Fifty-six percent of salespeople listed brand within the top-three priorities, 49% listed energy efficiency, and
30% listed size (see Chapter 6).5 Sixty-one percent of consumers rated brand within the top-three priorities, 54% listed price, 39% listed color,
35% listed quality, and 29% listed energy efficiency (see Chapter 7).

4-9
was skeptical of the motivations of salespeople and that, in his experience, they tended to say good thingsabout their brands and bad things about their competitors’ products.6
None of the Thai policymakers with whom we spoke suggested the need to provide general trainingfor salespeople about energy in general and specific training on the use of labels as a selling tool. Infact, two policymakers spoke rather disparagingly about salespeople. One said that salespeople don'tknow anything about the technical aspects of products and have a limited capacity to respond to specific,technical questions from consumers. When asked about the role of salespeople, another Thaipolicymakers, a government official, had this to say:
If they [salespeople] could do a good job, it would help. But it is quite difficult totrain a salesperson to understand this kind of thing. Especially for consumer products …if you train them to speak out, it’s O.K. They can speak out as you train them. But ifconsumers ask further questions they cannot respond (Thai policy interview no. 5).
In my judgment, neither the Thai nor U.S. policymakers have adequately examined the role of energyefficiency in the sales transaction. In the U.S., energy efficiency is not a salient factor in the purchase ofwhite goods, but if marketed effectively it may have the potential to become more salient and to play therole as a “tie breaker.” Thai policymakers have thus far focused on cooperating with manufacturers, andtheir views on consumer behavior may underestimate the salience of energy efficiency in the appliancesales transaction. In addition, they have not included salespeople in the development of the appliancelabeling programs, and have thus ignored the major role of salespeople in influencing consumer purchasedecisions.
Which Types of Programs Are Most Effective?
To compare policymaker perceptions of program effectiveness, we asked policymakers in bothcountries to assess the effectiveness of different types of energy conservation programs. We asked themwhich type of program was most effective at saving energy : minimum efficiency standards, incentive-type programs (such as rebates), or voluntary-type programs.
In the U.S., minimum efficiency standards for appliances were widely perceived by policymakers asbeing an effective policy instrument. Nine of the 16 U.S. policymakers named standards as the mosteffective federal policy. Of these nine, two were congressional staffers who acknowledged theeffectiveness of standards while indicating that they were ideologically opposed to the policy. Two ofthe policymakers stated that they felt voluntary programs were the most effective type of program. Threedid not answer the question directly because they felt the question was unfair, since the three types ofpolicies were best implemented together, as a package. For example, the response below suggests asequence of policies. It may additionally indicate a growing reluctance by analysts to be drawn into apolarized political debate over mandatory and voluntary types of public programs.
6 As discussed in Chapter 6, many salespeople in department stores are hired directly by the manufacturer or
distributor of a certain brand name, rather than by the store itself.

4-10
This is not a fair question. They're not comparative, they’re part of a continuum.Once technologies are tried and true, it’s not appropriate to do a rebate. You distort themarket, and you're sending a signal that this thing isn't really worth what it’s reallyworth. Then, you need to do voluntary programs, provide unbiased information, and getit to people in order to make a decision. And when you try to transform a market, theultimate transformation is when it becomes a standard, because everyone uses it orbecause the government writes a law that says everyone has to use it. That's the purposeof a standard, to culminate the transformation process (U.S. policy interview no. 12).
The Thai policymakers’ responses were evenly split between standards and voluntary or“cooperation” programs as the most effective approach. While almost all of the Thai policymakersexpressed the opinion that voluntary programs were very appropriate in Thailand, only four of 11 felt thatvoluntary programs would be most effective at saving energy. Five of the 11 Thai policymakersdescribed standards as the most effective policy. Two responded that standards and voluntary programsshould be implemented in conjunction with some form of financial incentives.
Since Thailand has not yet implemented minimum efficiency standards, the responses reflect the factthat there has been four years of experience with voluntary and incentive programs in Thailand and, asyet, no minimum efficiency standards have been passed. Voluntary programs are widely viewed as apolitically safe strategy, and standards are seen as highly effective but more difficult to implement thanare voluntary programs. The Department of Energy Development and Promotion, which has the mandateto implement standards, has its hands full implementing the compulsory law for large buildings andfactories and is not likely to soon issue minimum standards for appliances and equipment. Rebates andfinancial incentives are seen as problematic because of the large financial difference between the poorerrural population and the wealthy consumers in Bangkok who, the policymakers presume, would benefitmost from such incentives.
Policy Issues Raised Only in the U.S.
The salient political issue related to energy efficiency during the time of our interviews with U.S.policymakers (January 1996) was a debate over minimum efficiency standards that called into questionthe role of the U.S. government in promoting energy efficiency. In addition to questioning policymakersabout their views on minimum efficiency standards, we solicited their opinions on the role of governmentin energy policy and on the effectiveness of the U.S. appliance energy labeling program.
The Role of Government
The submission by the Department of Energy (DOE) of a set of aggressive proposals for minimumefficiency standards led to intense opposition, primarily among Republicans7, and eventually to thepassage of a one-year moratorium on the establishment of new efficiency standards in early 1996. Thus,during the time that we conducted our interviews, it was not easy for the U.S. policymakers to talk aboutpolicy effectiveness without also referring more generally to the appropriate role of government.
7 The proposed moratorium on standards became identified with the agenda of the Republican congress elected
in 1994, vowing to enact its Contract with America.
4-11
There was broad support for a government role in energy efficiency policy. Nearly all of the U.S.policymakers (14 of 16) believed that government should play at least some role in promoting energyefficiency. Those policymakers who support a strong government role were more likely to reply thatminimum efficiency standards had been the most effective policy. Those who favored a more limitedgovernment role were less likely to say standards were effective. And those who did not believe thatgovernment should promote energy efficiency argued that standards were not effective; however, theywere unable to cite specific studies to discredit the effectiveness of standards.
One individual, a member of a non-profit think-tank, did not believe that the federal governmentshould promote energy efficiency because he views the federal government as a market-distorting force.In his view, if the government were to play any role, it should be limited to the provision of information.At the same time, he even voiced skepticism of the ability of the federal government to provide unbiasedinformation. This policymaker’s distrust of government was at odds with the rest of those whom weinterviewed. Policymakers who supported a federal role in improving energy efficiency characterized thegovernment as an appropriate medium through which to convey “unbiased” information, largely due toits inherently “broad contact with the public”. They cited the benefits of energy efficiency to society, theenvironment, and consumers. They also described a “moral obligation” to improve the energy efficiencyof the economy. Six respondents stated that market failures justified government intervention to promoteenergy efficiency.
Are U.S. Efficiency Standards Effective?
In the debate over U.S. efficiency standards, I found a curious disagreement over the seemingly easy-to-measure issue of whether minimum efficiency standards for appliances have in fact saved energy. Theminority of policymakers who claimed that standards were not effective did not offer proof of theirargument but rather suggested that the impact of standards was either difficult to discern or had not beenmeasured. Two respondents argued that increases in product efficiency are a natural outcome of freemarkets and competition. One legislative aide, Vincent, remarked that the lack of a control group hindersour ability to tell whether standards have been effective: “We will never know if industry would havedone better without them” (U.S. policy interview no. 6). This statement seems disingenuous, sinceVincent has easy access to information from appliance manufacturers that could help answer thisquestion. Since Vincent has been lobbied by several manufacturers opposing standards, he should haveaccess to information on the impact of standards on manufacturer decisions through conversations withindustry lobbyists.
I asked two analysts with non-profit advocacy groups to respond to Vincent’s assertion that there isno evidence of the effectiveness of the U.S. appliance efficiency standards. They acknowledged the lackof a control group, but pointed out that one could observe the impact of standards by observing the largeincreases in product efficiency that occurred during the years that standards went into effect. Theyquoted peer-reviewed studies estimating that standards for appliances and electrical equipment had saved2.5-3% of U.S. annual residential consumption and were saving the average household more than $200per year on energy costs (Nadel and Goldstein 1996; McMahon et al. 1996). One of them pointed outthat the 1993 standard, which was passed into law in 1989, was so stringent that none of the existing1989 models were capable of meeting it.
When pressed, the legislative aide Vincent made it clear that his opposition to standards wasphilosophical:
4-12
Philosophically, I don't think the government should mandate what products can andcannot be produced. It’s not a role the government should play. Is it [standards]effective? There are equal numbers of people who say it is effective and ineffective, butthat is not the issue for this office. Benign monarchy is probably effective, but none ofus want it (U.S. policy interview no. 6).
Another legislative aide opposed to standards, Jack, mentioned several times the need for “hardscience” and “good science” in order to provide legislative decision-makers with objective informationon complex policy issues. He proceeded to complain about an advance notice for a proposed federalstandard that would have eventually required horizontal axis (as opposed to the currently commonvertical axis) washing machines, seizing on this as an argument against standards. His argument againsthorizontal axis machines was based largely on anecdotal evidence: his brother lives in Germany and isdissatisfied with them; he once lived in Japan and found that the horizontal axis machines were “dinky”and “could only fit two pairs of Levis”; and “people in the U.S. almost overwhelmingly choose verticalaxis machines”.8 He added, “We shouldn’t have DOE decide how people wash their clothes.” Whenasked to compare standards, manufacturers incentives, voluntary programs, and education, Jack arguedthat education should be the highest priority. When asked which of the four program types has had themost impact, he replied, “I don’t know” (U.S. policy interview no. 3).
Both Vincent and Jack avoided the issue of effectiveness and argued against minimum efficiencystandards on the grounds that they limit consumer and manufacturer choice. Said Jack: “We have to bereal careful that we don’t force a technology down peoples’ throats. A program is beneficial to someextent if it is putting labels on equipment and providing information. But we have a problem if wemandate production lines and eliminate consumer choice.” Vincent argued that the government roleshould be to “encourage” and not to “mandate”. “Consumers will choose more energy-efficient productsas they become available ... current policy is not demand driven. It seeks to force demand by limitingavailable products.”
In response to the argument that standards limit product availability, a congressional committeestaffer pointed out that individual choices to purchase energy-inefficient products have negativeenvironmental impacts:
I think from a public policy perspective we shouldn’t give consumers the choice tomaximize the externalities they’re imposing on the rest of society and on theenvironment, because of their self-serving choices ... And if consumer choice is less ...energy-efficient, then well, we ought to slap a huge tax on it to offset the societal cost ofthe externality that you’re imposing by maintaining this consumer choice. But [thesechoices are] not cost-free (U.S. policy interview no. 14).
Another policymaker, an energy-efficiency advocate, contended that standards do not limit consumerchoice:
8 When we pressed him to back up this claim, he said that “98 % of U.S. households have vertical axis washers,
based on sales -- when you go to Sears, you see it.” This appears to be an invalid argument against horizontal axismachines: that U.S. consumers choose vertical-axis machines over horizontal axis machines because only verticalaxis machines are available.

4-13
I would say that the standards by and large don't limit choice. You still have all thesame colors, features, and with whatever else you want, it’s just that all of the units aremore efficient. There has been no proven case that I am aware of that, followingstandards, the amount of choice has actually gone down (U.S. policy interview no. 2).
In our discussions with U.S. policymakers, we were often left with the feeling that we were talkingwith two groups of people who speak different languages. In the view of policymakers opposed tominimum efficiency standards, such standards limit the ability of manufacturers and consumers to choosewhich types of products they want to make and buy, respectively.9 Some, but not all, of these opponentsof standards also argued that standards had been an ineffective policy, but were unable to cite anyresearch to support this claim. In the view of the energy-efficiency advocates and most of the federalagency employees, minimum efficiency standards do nothing to alter the amenity provided by a productclass, and they actually increase choice by offering consumers a way to save money on their energy bills.One of the advocates mentioned the fact — ignored by the policymakers who opposed standards — thatresearch has shown that the minimum efficiency standards also provide this amenity at no significantadditional first cost.10
Are the EnergyGuide Labels Effective?
Unlike our discussions about standards, there was near unanimous agreement among thepolicymakers that appliance energy labeling is an appropriate government policy. Most policymakerswere not aware of any studies or evaluations of the labels, but this did not prevent them from statingopinions, which varied widely. Jack and Vincent, the two legislative aides opposed to standards, assertedthat labeling was a good policy by virtue of the fact that it was making information available toconsumers. Said Vincent:
There is a valid role for the government to provide tools for consumers to make agood choice. Even though the majority of consumers don't look at the labels, it’s still agood program (U.S. policy interview no. 6).
In an odd contradiction, Vincent supports a program that he believes is clearly ineffective. And atthe same time, when pressed as to how he knows that consumers don't look at labels, he was unable tocite any research to support this claim.
Jack felt that while consumer awareness was low, the label itself provided clear information:
9 One of the legislative aides worked for a Congressman who was among the most vocal in pressing for a
moratorium on efficiency standards in 1995. In this Congressman’s district lies a ballast-manufacturing facilitywhich would have been rendered obsolete by a draft standard for lighting ballasts efficiency proposed in 1995.
10 The available data show no significant increase in appliance prices due to either state or federal efficiencystandards over the past fifteen years (McMahon 1995).

4-14
EnergyGuide labels are on the outside [of appliances], but awareness is till aproblem. From what I am told, energy use is not a big selling item … Information,consumer awareness and education are the key. We need to inform people and give thema real desire to buy energy-efficient products … Big yellow labels, it doesn't get anyclearer than that (U.S. policy interview no. 3).
A number of other policymakers were skeptical about the impact of the labeling program, since theyhad not seen any evaluation results. One energy-efficiency advocate remarked that he thought there hadbeen a study conducted in the mid 1980s. Another said, “I have yet to see any data that proves that they[the labels] have done anything” (U.S. policy interview no. 5). However, these advocates and some ofthe agency officials argued that the label was an important building block, since it formed the basis forcomparisons and was used by utility DSM rebate programs. One policymaker opined that the impact ofthe label on manufacturers probably far exceeded whatever impact it had on consumers:
The FTC [Federal Trade Commission] did a study in the mid ‘80s, and it wasinconclusive, but I don't feel that the program has been very effective. Although theoriginal goal was to change consumer decision-making, the labels have had a large effectby changing manufacturer decision-making. In conversations with manufacturers, theyhave said that when they saw their product at the bottom of a range, they would cut offtheir lowest models. So when you look at the program overall, it has had a positiveimpact, and labeling has also been important in utility rebate programs (U.S. policyinterview no. 5).
Curiously, in light of our results from the study of retailers and consumers — which showed a lowlevel of interest in and understanding of labels by U.S. consumers (see Chapters 5 and 6) — only one ofthe policymakers was openly critical of the EnergyGuide label and its comprehensibility. This respondentargued that it was much too complicated for the average consumer to easily read and understand:
Is the label effective? Yes and no. The FTC label has the information there. Butit’s my observation that consumers aren't getting the message. You might have 20consumers coming into the store, and one of them might really say, “Oh, here’s the FTClabel, let me take a quick look at this. The other 19 will go, “I didn't know it was there,”or “I don't care,” or “I can read English, but it’s too dull,” or whatever. I mean, it has allthe information there, but have you ever read a prospectus for a stock fund? You don'thave any of these mutual fund companies coming to you and saying, “Oh, first read thisprospectus.” They summarize it for you and tell you quickly what the outcome will be –20 percent increase last year and your five-year average is 18 percent. I mean, whowants to read a prospectus? (U.S. policy interview no. 8)
In summary, policymaker evaluations of the EnergyGuide label ran the gamut, from assuming that itis a useful policy even though most consumers don't look at the labels; to assuming that the labels had
4-15
primarily influenced manufacturer, rather than consumer, decisions; to questioning the design of the labeland its basic comprehensibility. The common thread, however, is that the purpose of the labelingprogram in the view of these policymakers is primarily cognitive (to provide information and to makeconsumers aware) rather than behavioral (to stimulate a measurable change in consumer purchasing).
Policy Issues Raised Only in Thailand
Wide-scale planning and implementation of energy-efficiency programs in Thailand only began inthe early 1990s. In order to understand the issues facing Thai policymakers, I added a series of questionsto the interview protocol addressing the implementation of energy policy in developing countries and thechallenges of interagency coordination. This section thus addresses the following issues: the adaptationof foreign ideas and programs, the need for interagency coordination, the question of whether rebateprograms can succeed in Thailand, and the question of how to measure program effectiveness.
How Programs Are Adapted in Thailand
One issue that interested me was the role of foreign expertise and consultants, and how programswere adapted and designed to operate in Thailand. I was particularly interested in why the Thais haddecided to pursue a strategy of relying largely on voluntary cooperation with manufacturers and limitedor no incentives, instead of the incentive-based approach proposed by Western consultants and the WorldBank who advised the Thai government in the early 1990s.
The responses of Thai policymakers were marked by a recognition of the need for foreign expertise,tempered with a pride in the ability of (and need for) Thais to decide among themselves how best toadapt foreign programs in the Thai context and in Thai style (baap thai). The director of the Thai DSMOffice described the process this way:
Consultants come and give advice, we take this into account and decide by ourselves.We have many consultants who come – six in the past year. This year a consultant willcome and advise on setting up an ESCO [energy service company] … But in reality, wejust sit and talk with two or three people here in our office and find out a better way. Wediscuss strategy and we debate. Of course, we learn from the experience, from thesuccess and failure of each country and each program. We try to adapt it to the model ofbaap thai [Thai style], as you know (Thai policy interview no. 3).
Apichart, a high-ranking policymaker, explained how the closely-knit fabric of Thai society,especially the relationships among leaders in society, predisposed policymakers to adopt voluntary, ratherthan mandatory types of programs:
That sort of thing [voluntary cooperation with manufacturers] has been done inThailand before, maybe not with energy conservation appliances but other things likefuel specifications, for example. When we got the oil companies to agree to changes inthe fuel specification, we didn't have to have a lot of debate and public hearings before
4-16
passing a law … like in the US. Thailand is a much smaller country, and the governmentstill has a lot of influence on the private sector. So it was relatively easy, I think in bothcases, for appliances and fuel specifications to simply sit down with them and simplyforce them somehow to agree, because I think they do realize that if they do not agreethen the government could use its power to come up with compulsory standards, whichwould affect them anyway, so they might as well agree (Thai policy interview no. 1).
One foreign consultant, who had spent several years advising a Thai government agency on thedevelopment of its energy-efficiency programs, mused that what he learned had little to do with energyengineering and finance, but everything to do with “dealing with the Thai culture, with the idea ofmarketing, dealing with politicians and policies and how to do DSM within the Thai context.” Hequickly learned the limitations of being a foreigner in Thailand — that his role was simply that of anadvisor, who could gather data on international programs and technologies and share this informationwith the Thai policymakers, but not presume what approaches would be effective:
I think the very first thing I learned was try not to tell them what's right or wrong, butgive them as much exposure to other experiences as possible, and let them decide if andhow it can be adapted. Now that's not to say just hand it to them and step back, but offerthem other alternatives, other ways that it can be used but try not to take your, um,understanding or experience with the culture and say I think this will work here, becauseyou’re not part of the culture necessarily. And there's two things that’ll probably happen.One you'll probably get it wrong, even though you might think you're right. and the otherthing is you won't be perceived as being right. I don't know what it would be like for aforeigner who has been here 30 years, but as someone who’s only been here two years,I'm still a foreigner (Thai policy interview no. 11).
This foreign consultant also professed admiration for the way that the Thai policymakers were ableto enlist industry buy-in and cooperation to its programs. He described the Thai approach as less “heavyhanded” than in the West and observed that the Thais involved the manufacturers more directly in theprocess of program design. However, while he agreed that the most effective types of programs forThailand were those in which the government reached agreements directly with trade allies andmanufacturers, he felt that the agreements to date had resulted in only limited efficiency gains becausethey did not create an incentive for manufacturers to “push” the market with leading-edge technologies.In essence, he argued, because of the lack of a government definition for what is “high efficiency”, theproducts promoted by the utility’s DSM program (thin-tube, 36-watt fluorescent tubes and airconditioners and refrigerators rated at 4 and 5) have become the de facto upper limit for efficiency:
So we’re kind of a long way off before we start seeing appliance and equipmentstandards implemented. And because of that, EGAT, although they’ve implementedsome programs, like refrigerator labeling and air conditioner labeling and the thin-tubeprogram, they’re reluctant to start pushing those technologies into making largeefficiency changes without minimum codes or testing standards mandated by thegovernment. So what that means in terms of getting … the market potential for high

4-17
efficiency technologies, the public sector is promoting moderate-to-low-efficiencytechnologies, even though they’re still you know the 4s and 5s in the labels, they’re stillno leading edge. And the market sort of sees this is a 4 or a 5, why should I go for whatmight be considered an 8 or a 10, when the public sector is telling me 4s and 5s are good(Thai policy interview no. 11).
Inter-Agency Coordination
Over the past seven years, Thailand has passed national energy-efficiency legislation, established alarge energy conservation fund, and initiated the first comprehensive DSM program in Asia virtuallywithout political opposition. My interviews and discussions with Thai policymakers over the past fewyears have revealed a sometimes uneasy truce between the three primary policy agencies masked by anoutward appearance of interagency coordination.
The National Energy Policy Office (NEPO) is the lead policymaking organization: it serves as thesecretariat for the National Energy Policy Committee and oversees the Energy Conservation PromotionFund. The Department of Energy Development and Promotion (DEDP) is responsible for EnergyConservation Promotion Act, which requires energy conservation measures in all large buildings andfactories. DEDP also has the authority to issue appliance efficiency standards and building efficiencycodes. And the Electricity Generating Authority of Thailand (EGAT) staffs and directs the Demand SideManagement Office, which is responsible for promoting end-use efficiency programs in the commercial,industrial, and residential sectors. The potential for overlap and confusion arises at the intersection ofthe commercial and residential sector DSM programs, operated by EGAT, with the DEDP program,which mandates all large buildings and factories to implement energy efficiency plans.
While most of the Thai policymakers said they felt that there was adequate coordination between theDSM and DEDP programs, two policymakers argued forcefully that the DSM Office was oversteppingits bounds and, primarily through its Green Buildings Program, trying to interfere with DEDP’s programfor large buildings and factories. Boonchu, the consultant, explained that the committee structure, whileintended to be a vehicle to develop consensus on policy and program direction, was not workingeffectively.
In the Thai situation as you probably know, they usually set up committees, and theyinvite everyone [from the utilities, government agencies, and universities] to join thatcommittee. So presumably there would be coordination in that committee, right? But infact, it has never happened, because when they go back to their own agency, and whenthey come to the time when they have to set up a target, set up a budget, they willdisregard whatever the other party is doing. So, a committee is a place where peoplemeet so they can say they are in coordination, but in practice, it’s not coordination …there is no assignment of responsibility from the top … there is no top-down policy fromthe government to clearly assign the objective and assign the responsibility for who isdoing it” (Thai policy interview no. 9).
Can Rebates Work in Thailand?

4-18
As mentioned earlier, the Thai policymakers whom I interviewed were evenly split on the issue ofwhether minimum efficiency standards or voluntary programs was the most effective policy approach, interms of potential energy savings. Of the three policy options we discussed – minimum standards,rebates, and voluntary programs, there was the greatest sensitivity to the concept of providing directfinancial incentives (i.e. rebates) to either consumers or manufacturers. Two of the Thai policymakersstated flat-out that rebates cannot work in Thailand. One, Vichai, stated:
I learned from foreign countries that they implement DSM by incentive way. That’swhat I learned from them … But I know that those … measures cannot be implementedin Thailand. Never. Because we cannot rebate. If you give money to somebody, theysay, “EGAT is very rich, why you give money to that person? We are poor. No moneyfor eating. And you give money to buy air conditioning”11 (Thai policy interview no. 4).
Clearly, Vichai is sensitive to the political implications of providing rebates in a society where thereis such a wide income gap between the rich people in Bangkok — who may be buying their second, thirdor even fourth air conditioner — and the poor farmers in the country, who may consider themselveslucky to have even a small refrigerator in their household. The bulk of the rebates would constitute agovernment subsidy of appliance consumption by the wealthy.12
When I queried Apichart, the senior policymaker who has significant responsibility for policyformulation, about rebates, he separated the question of the program’s effectiveness from the issue of itspolitical feasibility:
Rebates could also be effective. I think rebates could change consumer behaviorvery quickly, but then I think there are also problems with rebates in Thailand. I thinkwhat EGAT told you was probably the fact that politically it could be difficult becausethe program was implemented by EGAT, which is a government organization … [forsuch] government organizations, providing an outright rebate as you do in the U.S. couldbe difficult (Thai policy interview no. 1).
11 Vichai resents the fact that a team of foreign advisors — who performed a pre-investment appraisal for the a
large grant from the Global Environment Facility to Thailand’s DSM program — were dictating what types ofprograms he should implement. “Our culture is different so much. We are poor, and EGAT still gives money to richpeople to buy number 5 [the highest efficiency rating] air conditioners? But the World Bank said, ‘Why don't you dothis?’ I'm against it, and they said I am stupid. O.K. forget it. This is my way, and I know.”
12 A logical extension of this argument, not made by the interviewees, is “why should the government pay forlarge power generation increases to provide for appliances for the wealthy?” One of the Thai air conditionersalesmen that we interviewed appeared quite uncomfortable with the emphasis on promoting the sale of efficient airconditioners rather than the need to conserve: “It seems to me that EGAT is promoting that people use number 5products, but they aren't telling people that they should save energy. If you look at and listen to the ads closely, itseems that's what they're saying. They have advertisements to get people to buy, but they don't have advertisementsto get people to save energy … Its mainly a product promotion program. They should really say, “please saveenergy” (U.S. sales interview no. 13).
4-19
However, two other policymakers said they thought that rebates could work in Thailand, and one, asenior member of one of the energy policymaking committees, felt that Thais should at least attempt apilot rebate program. “Rebates have worked in other countries, why not in Thailand?” asked Boonchu,the consultant. “We have to try. Using the experience of other countries that have been doing this kindof programs for many years, they have been well received by many customers. Why shouldn’t it work inThailand? I don't think Thai consumers are any different from consumers in any other countries. Whywould they be different?” (Thai policy interview no. 9)
In fact, the debate over rebates is nuanced and cannot drawn in black and white. Vichai’s oppositionto rebates does not preclude the possibility of financial incentives being provided to EGAT customers indifferent forms. Financial incentives are already included as part of the Thai program mix. The DSMOffice is implementing two programs that provide financial incentives. One is a zero-interest loanprogram for air conditioners described in Appendix B. When asked about this form of financial incentive,Vichai replied that this is not the same as a rebate program, since the customers have to pay back theirloans. Also, one of the foreign consultants pointed out to me that the DSM Office is providing directrebates in a program in which purchasers of large electrical motors receive a rebate to cover theincremental cost of high-efficiency equipment. The motors program does not raise equity issues becauseit is primarily for large industrial facilities (and not wealthy consumers) that buy large motors.
How to Measure Program Effectiveness
While most of the Thai policymakers I interviewed paid lip service to the importance of evaluatingprogram effectiveness and the role of evaluation in improving program design, their responses indicated alack of in-depth understanding of the type of data needed to perform proper evaluations. Most madegeneral statements about the need to conduct surveys and to collect data on end use.
The DSM program provides a case study for how Thai policymakers perceive the role of evaluationin program design and improvement. When I asked policymakers about the effectiveness of the DSMprograms, most of those familiar with the programs felt comfortable in asserting that the programs13 hadbeen effective. For the thin-tube lighting program, the evidence of the program’s success was widelyapparent: the five manufacturers of fluorescent lamps switched production of all their “fat tube” 40-wattand 20-watt fluorescent tubes to “thin tube” 36-watt and 18-watt tubes over an 18-month period as theresult of a voluntary agreement with the government. For the appliance labeling programs, the citedevidence of success was less clear. Some cited the saturation in television advertising for the labelingprograms. Two policymakers told me that the DSM program was the largest TV ad campaign for anyone “product” in the country.14 Several others noted that there had been a documented increase in thesales of air conditioners and refrigerators with high-efficiency labels.15
13 The DSM programs which had been under way for at least one-two years included the thin-tube fluorescent
lamp program and the energy labeling program for refrigerators and air conditioners. These programs are describedin Chapter 2.
14 EGAT’s advertising budget during the years 1995 and 1996 was approximately US$12 million per year. Themajority of this advertising budget was spent to promote EGAT’s DSM programs, although some was also used topromote the utility’s corporate image and to build awareness of the benefits of nuclear power, a technology thatEGAT managers would like to adopt in the future. Two of the main TV channels provide a 45% discount forEGAT’s advertisements, so while EGAT has the greatest number of “spots” or minutes on TV, they do nottechnically have the largest television advertising budget (Ratanopas 1997).
15 The available data on sales of refrigerators and air conditioners with energy labels is discussed in Chapter 2.

4-20
While staff at the DSM Office were confident of the success of their labeling program, three otherpolicymakers, not within EGAT, expressed skepticism about the program’s effectiveness, based either ontheir own experience at retail shops or from accounts of problems in newspaper articles. In addition, theDSM staff and several of the other policymakers expressed a caveat: while it appeared that manufacturerswere embracing the program and putting high-efficiency labels on their appliances, there was arecognition of the need to conduct market surveys in order to get actual data. Several policymakers notedthat the lack of baseline data on the appliance market as well as ongoing data on appliance productionand sales would hamper evaluation efforts. One of the foreign consultants described how the DSMOffice, during the negotiations with appliance manufacturers had missed an opportunity to gain valuablemarket information from the manufacturers.
I think EGAT needs to be far more forceful in what they demand from theirparticipants. In the very first program [the thin-tube program], I think EGAT gave a lotto the manufacturers and received very little in return – very little market information.EGAT essentially eliminated a market barrier, and the manufacturers reaped somemanufacturing savings. It didn't adversely affect their market shares, improved theirreputations with the customers overall, and yet in terms of the enhanced information thatEGAT was able to obtain on the market, it was very small. They [EGAT’s DSM Office ]don't know what the real size of the market is. They don't know the adoption rate. Theydon't know the sales shares of each of the manufacturers … I think that informationcould have been obtained from the manufacturers as part of participating in the process.The same goes for the air conditioner and refrigerator programs.
The implications of this statement are that the DSM managers lack an appreciation of the role ofevaluation and the necessary steps that must be taken to continually develop and update baseline marketdata. In the case of the appliance labeling programs, the DSM Office does not have data on the truemarket size for either refrigerators or air conditioners, and not all units are labeled. Thus given theircurrent data, they can only see changes in numbers of labeled units and not movements in the market aswhole
The director of the DSM Office acknowledged the important role that an evaluation would play forhis office, indicated that he did not know much about evaluation methodology, and stated that this wouldbe recommended by an outside consultant, who would soon begin to provide them assistance in this area.Another policymaker complained about the high cost of evaluations and the fact that he did not have abudget to conduct evaluations. He mentioned a proposal he had recently received by a consulting firm tofund an evaluation of a government-funded program: the proposal requested US$200,000 to evaluate aprogram that had spent US$160,000!
Only one respondent, the consultant Boonchu, articulated a clear understanding of the basic steps in aprogram evaluation:
It’s straightforward. They have to follow from the start, even before the start of theprogram, how the consumer responds to the program, how the supplier responds to theprogram, what the change is of the penetration of these kind of appliances, how the stockof the appliances have changed, how the utilization has changed, and eventually theresult is how much energy you have saved as a result of this program. They have to do
4-21
it, but it’s not simple. But they should do it now, not wait until five years from now andstill make an evaluation process. You can't do it, because you will lose a lot of importantinformation. You have to keep track of information from day one (Thai sales interviewno. 9).
Most of the policymakers focused on the need to conduct impact evaluations – that is, on justmeasuring how many kW or kWh were saved as a result of the program. One policymaker associatedwith the government’s compulsory program for large buildings claimed that their evaluation would be100% effective, since they were collecting monthly data on energy use from each designated facility andputting it into an evaluation database. Only three of the policymakers described the need for some sortof process evaluation in order to get feedback on the mechanics of the program operation and oncustomer awareness, attitudes, and response.
One government policymaker responsible for funding energy conservation projects commented witha smile on the lack of interest among consultants in evaluating their programs:
Funny enough, you don't hear much about evaluation. What they say to you is this isthe program, this is what we have spent, this is at the end of year, but less do people talkabout how much they get from spending this kind of money. [We intend] to do that, butunfortunately you come into a very early stage. We have spent, but the results are notthere yet (Thai policy interview no. 2).
In summary, Thai policymakers are aware of the importance of evaluation in program design, but fewof them have a sophisticated understanding of what is involved. The DSM Office has taken steps toimprove their capability by contracting long-term foreign consultants to assist them in this area. It is alsoimportant to remember how long it took utilities and government agencies in North America to makeserious progress in evaluating their own programs. When asked what types of evaluations had beenconducted on Thai programs, one foreign consultant put the issue of evaluation in perspective, replying,“None. But this is probably not much different from the early days of energy efficiency in [Australia]”(Thai policy interview no. 10).
Conclusions
Common Themes
Our interviews with policymakers in the U.S. and Thailand reveal that their mental maps of theappliance marketplace do not accurately reflect consumer purchase behavior. Policymakers in bothcountries rarely conduct marketing or behavioral research and rarely solicit formal input from consumers.Instead, they tend to make policy that affects consumers based on limited data and personal experience.When asked about consumer preferences and interest in the energy labeling programs, fewer than half ofthe policymakers in each country cited empirical research results to support their assertions orconclusions.
The vast majority of U.S. and Thai policymakers whom I interviewed assumed that energy was not asalient characteristic in the purchase of appliances and thus not a high priority for consumers. Based onprevious research and data collected as part of this study, it appears that U.S. policymakers are correct

4-22
and that energy is not a high consumer priority. However, Thai policymakers may be underestimatingconsumer interest in purchasing energy-efficient products.
Among the U.S. policymakers, minimum efficiency standards for appliances were widely perceivedas being the most effective policy instrument, and there was also strong support for both voluntary-typeprograms and rebate programs. The Thai policymakers’ responses were evenly split between standardsand voluntary programs as the most effective approach. In Thailand, voluntary programs were widelyviewed as a politically safe strategy, and standards were seen as highly effective but more difficult toimplement than voluntary programs.
Policy Issues Raised Only in the U.S.
In our discussions with U.S. policymakers, we were often left with the feeling that we were talkingwith two groups of people who speak different languages. In the view of the energy-efficiency advocatesand most of the federal agency employees, minimum efficiency standards do nothing to alter the amenityprovided by a product class, and they actually increase choice by offering consumers a way to savemoney on their energy bills. In the view of the minority of policymakers opposed to minimum efficiencystandards, such standards limit the ability of manufacturers and consumers to choose which types ofproducts they want to make and buy, respectively. We also found a tendency among the opponents ofstandards to confuse the issue of effectiveness with their view of the proper role of government. Whenasked whether standards were an effective policy, these policymakers responded by expressing theirphilosophical opposition to government intrusion into this area.
Unlike our discussions about standards, there was near unanimous agreement among U.S.policymakers that appliance energy labels are an appropriate government policy. While nearly all of theU.S. policymakers interviewed strongly support the energy labeling program, the majority also tend tothink that it is largely ineffective. Although most policymakers were not aware of any studies orevaluations of the labels, this did not prevent them from sharing their opinions.
Policy Issues in Thailand
Most Thai policymakers strongly supported continued development of voluntary-type energyefficiency programs such as the thin-tube agreement with lamp manufacturers and the appliance energylabeling programs. The majority also supported the eventual implementation of some form of minimumefficiency standards. However, opinion was divided over the feasibility of implementing rebateprograms in Thailand.
Rebates were seen as problematic for two reasons: first, some policymakers claimed that while priceis an important barrier, it is not nearly as important as assumed by Western energy experts. Thesepolicymakers emphasized the need to conduct a massive public awareness campaign to spark a long-lasting cultural shift in Thailand toward energy efficiency. Another reason that rebates do not have fullsupport among Thai policymakers was political: rebates were seen by some as politically untenablebecause of the wide income gap between the generally rich consumers in Bangkok and the poor farmersand villagers who would not benefit from most rebate programs.
Despite an outward appearance of interagency coordination, the interviews revealed a sometimesuneasy truce between the three agencies responsible for implementing Thailand’s ambitious energy-efficiency programs. The potential for overlap and confusion arises at the intersection of the commercialand residential sector DSM programs, operated by the Electricity Generating Authority of Thailand, with

4-23
the Department of Energy Development and Promotion’s program, which mandates all large buildingsand factories to implement energy-efficiency plans.
While most of the Thai policymakers recognized the importance of evaluating program effectiveness,their responses indicated a lack of in-depth understanding of the type of data needed to perform properevaluations. Several policymakers noted that the lack of baseline data on the appliance market as well asongoing data on appliance production and sales would hamper evaluation efforts. Most of thepolicymakers focused on the need to conduct impact evaluations – that is, on just measuring how manykilowatts or kilowatt-hours were saved as a result of the program. Only three of the policymakersdescribed the need for process evaluations in order to get feedback on the mechanics of the programoperation and on customer awareness, attitudes, and response.

5-1
CHAPTER 5
APPLIANCE RETAILERS
Chapter Abstract
This chapter explores the retail environment where appliances are sold. It discusses my findingsbased on participant observation at a retail appliance store in the U.S. and semi-structured interviewswith 67 salespeople in the U.S. and Thailand. I found that salespeople exert a significant influence overthe final purchase decision in roughly half of appliance purchases. With the exception of airconditioning, salespeople have no incentives to sell energy-efficient appliances. To the contrary, theirprimary incentives are to sell larger units that use more energy. The concept of energy efficiencyappeared to be significantly more salient in the Thai retail environment, and the energy label appearedto be much more of a selling point for retailers. Thai salespeople reported that nearly two-thirds of theircustomers asked about or looked at the energy label; the corresponding figure for the U.S. was 20%. Itis also apparent that due to the time constraints on each sale and the large number of criteria beingevaluated, consumers spend very little time reading the label.
Introduction
This chapter reports the findings of my study of U.S. and Thai appliance retailers. It addresses anumber of questions intended to further understanding of the consumer purchase environment. Thetopics I pursued included the role of the salesperson in the decision-making process; identification ofsalesperson incentives and how these affect their motivation to sell energy-efficient appliances;salespeoples’ perceptions of consumer purchase priorities; the salience of energy efficiency in the salestransaction; and consumer and salesperson understanding of, and use of, the energy label.
In my study of the retail environment in the U.S. and Thailand, I used a combination of techniques.In the U.S., I conducted semistructured interviews with 14 salespeople. I spent two weeks in December1996 working as a “sales trainee” at a New Jersey branch of Acme Appliances (a pseudonym), a regionalappliance chain covering the eastern U.S. I interviewed three corporate managers in the retail applianceindustry: a vice-president at Acme Appliances and two senior appliance buyers, one each at two of thetop-three U.S. appliance retailers. In addition, one of the companies allowed me to review proprietarymarket research data, which it uses to assess market trends and consumer preferences. In Thailand, Iconducted semistructured interviews with 53 salespeople. I also interviewed the marketing director ofone of Thailand’s major appliance manufacturers. I reviewed the catalogues of all of the major Thai airconditioner manufacturers to assess the salience of energy efficiency in their promotional literature.Details of the methodology used were discussed previously in Chapter 3.
Overview of the Salesperson Samples

5-2
The U.S. appliance market is dominated by three major national retailers, Sears, Circuit City, andMontgomery Ward. Appliances are also marketed by computer and electronics superstores such as BestBuys and Nobody Beats the Wiz, but for these stores appliance sales accounts for a small percentage oftheir total turnover. There are also a number of regional appliance chains as well as local applianceretailers with just one or two locations. In the U.S., I studied one national retailer (Electric World, apseudonym) and one regional appliance chain (Acme Appliances, also a pseudonym). I conducted semi-structured interviews with 11 salespeople at four stores in New Jersey and Delaware — two branch storesof Electric World, and two branch stores of Acme Appliances.
In Thailand, we divided our Thai sales interviews between shophouse (small, usually family-owned)stores (60%) and department stores (40%).1 In department stores, there are two types of salespeople:those employed by the store and those employed by the manufacturer or its licensed distributor. Thecompany (as opposed to the store) employees are more likely to work on a commission basis and tend toearn higher incomes than the store employees. Nearly a quarter of the Thai salespeople we interviewedwere in rural districts, in order to account for the large percentage of the Thai population living in ruralareas.
Table Chapter 5 .1 compares demographics and sales experience in the two countries. The U.S.salespeople I interviewed were older than the Thai salespeople (42.1 vs. 31.5 years) and tended to havemore experience selling appliances (8.1 vs. 5.0 years). Compared to the U.S., a significant portion of theThai sales force is comprised of young men or women with little schooling and/or training.2
In Thailand, a quarter of the salespeople earned less than US$400 per month, and half less thanUS$800 per month.3 Salesperson income depends to a great extent on whether they earn a commission.While all of the U.S. salespeople we interviewed earn a commission, only slightly more than half of theThai salespeople we interviewed earn a commission.
1 The Thai appliance market is divided between two types of stores: shophouse stores and department stores.
Over the past decade, the overall growth in department stores has been phenomenal, both in Bangkok and upcountry,and they have gained an increasing share of rapidly growing appliance sales. Yet shophouse stores still retain thevast majority of the market. The most common type of shophouse store is a family-owned business run out of thefirst floor of a typical Chinese-style shophouse building, in which the family that operates the store lives on the upperfloor or floors. In some urban areas (such as the Prakanong area in Bangkok), there are concentrations of appliancestores, and these are generally known by consumers as good places to go shopping for appliances. Some of theshophouse retailers have taken over entire buildings, expanded to multiple locations, and branched out to sell a rangeof products including furniture, motorcycles, cars, and in some cases, even real estate.
2 One marked difference between the samples is the lack of females in the U.S. sample. Female salespeople arerare at U.S. appliance stores, and at the four stores I studied, I encountered just three female salespeople, and one ofthese sold just electronics and stereo equipment (brown goods). Unfortunately, due to problems with scheduling, Iwas unable to interview either of these two appliance saleswomen. In Thailand, female salespeople are moreprevalent, and more than one-third of my sample was female.
3 Average family income in Thailand is about US$940 per month. This is based on per-capita GDP ofUS$2,830 (1995) and average family size of 4 people.
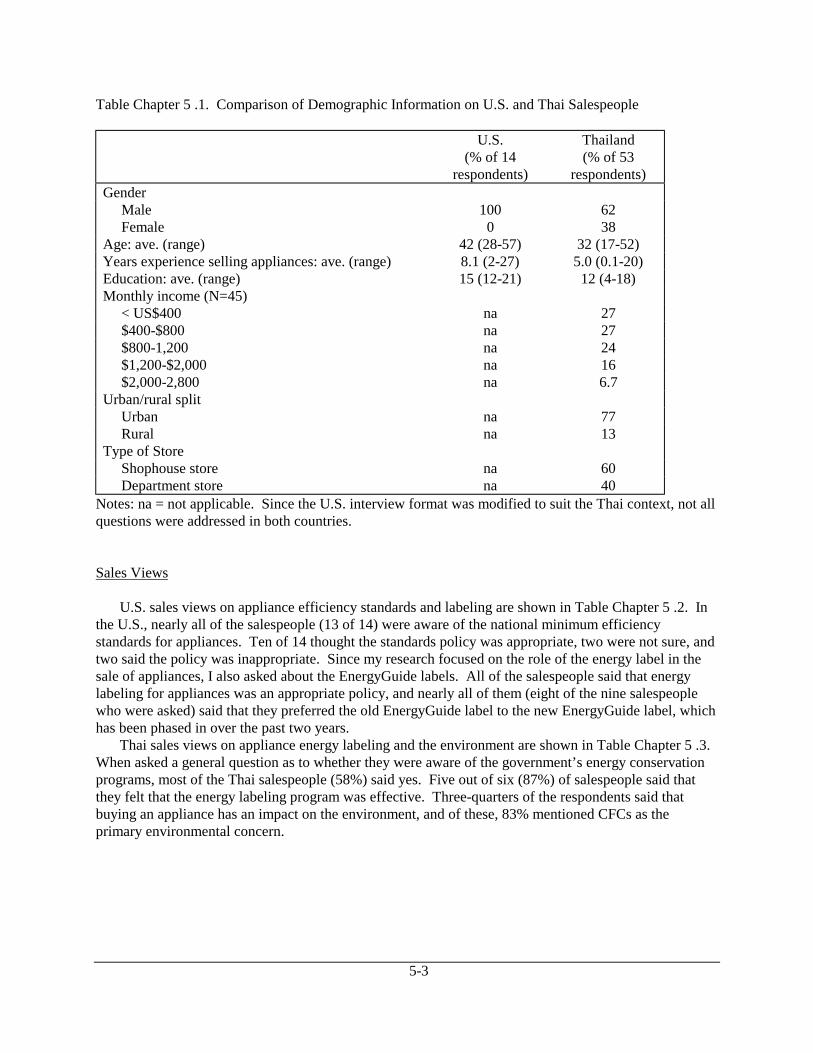
5-3
Table Chapter 5 .1. Comparison of Demographic Information on U.S. and Thai Salespeople
U.S.(% of 14
respondents)
Thailand(% of 53
respondents)Gender Male 100 62 Female 0 38Age: ave. (range) 42 (28-57) 32 (17-52)Years experience selling appliances: ave. (range) 8.1 (2-27) 5.0 (0.1-20)Education: ave. (range) 15 (12-21) 12 (4-18)Monthly income (N=45) < US$400 na 27 $400-$800 na 27 $800-1,200 na 24 $1,200-$2,000 na 16 $2,000-2,800 na 6.7Urban/rural split Urban na 77 Rural na 13Type of Store Shophouse store na 60 Department store na 40
Notes: na = not applicable. Since the U.S. interview format was modified to suit the Thai context, not allquestions were addressed in both countries.
Sales Views
U.S. sales views on appliance efficiency standards and labeling are shown in Table Chapter 5 .2. Inthe U.S., nearly all of the salespeople (13 of 14) were aware of the national minimum efficiencystandards for appliances. Ten of 14 thought the standards policy was appropriate, two were not sure, andtwo said the policy was inappropriate. Since my research focused on the role of the energy label in thesale of appliances, I also asked about the EnergyGuide labels. All of the salespeople said that energylabeling for appliances was an appropriate policy, and nearly all of them (eight of the nine salespeoplewho were asked) said that they preferred the old EnergyGuide label to the new EnergyGuide label, whichhas been phased in over the past two years.
Thai sales views on appliance energy labeling and the environment are shown in Table Chapter 5 .3.When asked a general question as to whether they were aware of the government’s energy conservationprograms, most of the Thai salespeople (58%) said yes. Five out of six (87%) of salespeople said thatthey felt that the energy labeling program was effective. Three-quarters of the respondents said thatbuying an appliance has an impact on the environment, and of these, 83% mentioned CFCs as theprimary environmental concern.

5-4
Table Chapter 5 .2. U.S. Sales Views on Appliance Efficiency Standards and Labeling
Question % of 14respondents
Are you aware of U.S. minimum energy efficiency standards forappliances? Yes 86 Not sure but assumed they existed 7 No 7Do you think minimum standards are an appropriate governmentpolicy? Yes 71 No 14 Not sure 14Is the energy labeling program appropriate Yes 100 No 100Do you prefer old label or new U.S. EnergyGuide label? (N=9) Prefer old label 89 Prefer new label 11
The Sales Environment
As articulated by salespeople in both countries, the overriding goal of a salesperson is to listenclosely to the customer and to sell them what they want to buy. The commonly voiced theme in ourinterviews was the need to strike a balance between serving the customer’s needs and selling the productsthat make as much profit for the store (and the salesman) as possible. These comments by a Thaisalesman reflect that balance — his motivation to get them to look at products with additional features,while not denigrating the quality of a product the customer was initially looking at:
Once they say they’re interested, then the sale really begins. We need to either sellthem the unit they came to look at or the unit that we want to sell them. After they’velooked at the products, I will talk about the good aspects of the product that they lookedat. There are good points and bad points, and I will explain them. Then, I have to find away to persuade them to look at another product. Sometimes, the quality is a littleworse, or the brand has a little less promotion, but we have to talk about both theweaknesses and the strengths of the product before we sell it, you see? But we can'tattack the product that they came to look at. [Emphasis added.] They won't buy it fromus. They’ll think we are liars, or that we are exaggerating (Thai sales interview no. 10).

5-5
Table Chapter 5 .3. Thai Sales Views on Appliance Energy Labeling and the Environment
Question % of 53 respondentsAware of Thai government energy-efficiency programs (N=31): Yes 58 No 42Is the energy labeling program effective? (N=15) Yes 87 No 13Does buying an appliance affect the environment? (N=50) No 20 Don't know 6 Yes 74 Of which: mention CFCs 83 mention pollution 8 mention recyclability 3Able to correctly explain how CFCs affect the environment(N=23) Yes 44 No 57
In general, products with more features have a higher retail price and make more profit for the storeand the salesperson. Yet salespeople must learn to “push” their preferred products with a legerdemain,so that the customers do not feel as if they are being unduly influenced. In controlled experiments withrefrigerator buyers nearly 20 years ago, Redinger and Staelin (1981) observed the paradox ofunrecognized (by the consumer) salesperson influence in the purchase decision: while the researchersobserved that salespeople appeared to have a large impact, this influence was discounted by consumers,who indicated very little salesperson influence over product selection. Yet the reality of retailing is thatproducts with new and additional features make more money for the store; these are the products that thestore management wants to sell and which salespeople must promote in order to do well.
If there are five products, and there's a basic product that pays 50 cents, and thenthere's a better basic product that pays a buck and a half, and then there's a mid featureproduct that pays five bucks, and then there's a fully featured product that pays 10 bucks,you need to understand what those different feature packs are and what the commissionsare that go along with them, and how you encourage people to buy the fully featuredproduct and why. I mean, you have to understand the reasoning, and you have to do itwith the right amount of pressure. If you push people too hard, they get a negativefeeling of the shopping experience, And if you don't push them hard enough, then youget a negative feeling in your pocket (U.S. sales interview no. 14).

5-6
These comments explain the dilemma faced by manufacturers and retailers who want to “push”energy-efficient products. First of all, energy efficiency is a feature that can be added to product, but itis often invisible to the consumer and difficult to sell. And second, with the exception of airconditioners, the value added for energy efficiency is much less than that for most other features (e.g,glass shelves and through-the-door ice for refrigerators, sealed burners for stoves), which yield a higherunit profit for both the manufacturer and the retailer.
The salespeople we interviewed said that they are able to apply subtle pressure only after establishinga rapport with the customer and overcoming the negative connotations that many customers have,especially in the U.S., of salespeople as pushy and not trustworthy. One of the other U.S. corporatemanagers described the balance as a fine line between being a pushy shark and being an aloof, non-caringsalesperson:
The biggest thing salesman has to do is to quickly break down the defenses andfences that go up on the customer from walking into a store in our industry. The industrystill has a reputation of sharks. It’s an unbelievably hard job. Because I just think it is sohard to bust your ass and walk away with no money one day … And I've seen how goodthey [salespeople] can be. They can both get what they want, which is sell the productthat they choose to sell and make money on, but they truly believe in it and they can givethe customer what they want too. But it’s a fine line between selling what the customerwants and giving them what you want to sell them. It’s hard. I mean, if I'm on them inless than ten seconds I'm a shark. And if I wait more than a minute, we don't care. It’sreally tough. It’s a fine line (U.S. sales interview no. 13).
Influence of the Salesperson
I found a strong level of confidence among salespeople in both countries that they could influencethe majority of customers and affect the purchase decision. Apparently, the need to walk the “fine line”does not prevent salespeople from being able to successfully (in their eyes) push the products that theywant to sell.
These parallel comments from a junior Thai salesman and a U.S. store manager reflect the strong selfassurance of the majority of salespeople we interviewed:
If we want to persuade the customer buy another product, we can do it. If we want acustomer to buy the no-name brand, we can do it. It depends which product we promote.We can compare the two products and tell them that everything is the same, the quality,the guarantee, just that it’s not a name brand. Or if we want to sell them the Sharp [i.e.the brand-name model], we can. It depends on our technique and the way we talk to them(Thai sales interview no. 19).
How much influence [do salespeople have in the purchase decision]? … [Hewhistles.] Tons of influence. A salesman usually has a very large impact on what thecustomer buys. Not always, but for at least 50 percent of them, they’ll buy what thesalesman recommends most of the time … if you do a good job. You know, that's what

5-7
separates a good salesman from a bad salesman. Some people come and they want justthe one in the ad. And a lot of those people can even be shown something better … Ifthey [customers] don't like their salesman, and they really like the product, they probablywon't buy. If they love their salesman a lot, and they're iffy on the product, they mayactually go ahead and buy the product because they like the salesman (U.S. salesinterview no. 4).
I reviewed proprietary market data that addressed the topic of salesperson influence. The researchersmeasured salesperson influence in appliance purchases by asking consumers of different appliance typesabout the role of the salesperson in the purchase. They found that generally, salesperson influence ishigher for audio and TV/video products (~60-90%) than for white goods (~30-50%). Nonetheless, formost classes of white goods, salesperson influence was estimated to be significant and often greater than50%. Table Chapter 5 .4 summarizes the results of the survey. Salesperson influence appears to behighest for products such as mid-priced refrigerators and heavy-duty washer-dryers, where thesalesperson can “sell” the benefits to the consumer of purchasing models with additional features.
Table Chapter 5 .4 Salesperson Influence in Sale of White Goods in the Northeastern U.S.
Type of product Typical lengthof sale
Estimated amountof salesperson
influence
Comments
Refrigerators 18-45 minutes 33-75% Influence was least (33%) forpromotional refrigerators, andmost (75%) for mid-pricedmodels
Washers and Dryers 12-45 minutes 20-60% Influence was least (20%) forMaytag models, and most(60%) for extra-heavy-dutymodels.
Dishwashers 35 minutes 55-60% Not as much data available fordishwasher sales
Source: proprietary market research from a U.S. appliance retailer
Sales Approach
Several of the questions in the semi-structured interview protocol attempted to discern whethersalespeople used special techniques or heuristic devices to categorize and influence customers. Thesequestions included, “Can you tell up-front whether a customer will make a purchase here today?” and“Do you ‘type’ customers into different categories?” For the vast majority of customers the answer toboth of these questions was no. Most of the salespeople said they treated each customer as an individualand responded to their individual concerns and needs. One Thai saleswoman warned of the danger ofmaking assumptions based on appearances, saying “Really, we can't do this [categorize customers],because you can't tell by looking at the customer. You can't tell by looking at their clothes or their face.

5-8
Some guys come in here wearing casual clothes, just shorts, and will spend more than 100,000 baht(US$4,000) on appliances!” (Thai sales interview no. 2)
However, at Acme Appliances, we found a core of salespeople who had been trained at anotherregional appliance chain (their former employer) in the psychology of sales, and had learned to slightlyadjust their sales approach in order to establish better rapport with different types of customers. Thesecustomer types are described by one of the store managers in Table Chapter 5 .5. These five categoriesare similar to the four categories described by Westbrook and Fornell (1979) 20 years ago and discussedin Chapter 2.
Table Chapter 5 .5. One U.S. Store Manager’s Description of Customer Types and How They Are Usedby Some Salesmen
Customer Type Description of CategoryAchievers(also called “statusseekers”)
“You know, like the high-fallutin types that know what they want, theywant the best one. ‘Hey, where’s your best washer at?’ There’s adifferent type of sales pitch you can use, and I use this example, ‘Canyou afford this washer?’ ‘Yeah.’ ‘Alright, well get it then. This is theeasiest choice, this is the best one, you can afford it, so you wanna getthis one.’ You know, with TVs, I’ll say, ‘this is the biggest and thebest.’ And that’s how you sell to someone. You don’t have to explainto ‘em what it has — just hammer away that it’s the best, and that’llmake them buy it.”
Cynics “These are the folks who come in with all the magazines. You want tomake sure that you stick to factual information.”
Comfort Seekers(also called “Wishy-Washy People”)
“They’re the ones where you say, ‘Yes sir, you’re making the rightdecision.’ Now those are the people who are going to want to seeliterature or owner’s manuals, and they may not buy the first time in.Those are usually the hardest ones to deal with. You have to be very,uh, like sympathetic, ‘Oh, I’m sorry your washer broke.’ And ‘What’sthe warranty on this?’ and ‘What don’t they cover?’ They tend to combthrough details and owner’s manuals.”
Sociable People “These are the ones that have to like their salesmen. They come in, andthey’ll tell you about their job, their car, ‘Oh, I’m buying a TV. I’mputting it in this new winter home I got. It’s got this, it’s got this.’ Andall you gotta do is listen to their stories, and a lot of times those type ofpeople you just gotta make small talk with.”
Low Reactor Types “They’ll wander the store, look at everything, then they’ll come grabyou and say, ‘I want to buy this and this.’ They like to make their owndecisions … they’re the low reaction type people, you have to identify,they just don’t like talking to people. Whatever you do, no matter howcharismatic you are, they’re not gonna talk to you.”
Source: U.S. sales interview no. 4

5-9
The store manager described how he uses these psychological rules to help him deal more effectivelywith his customers:
So as a salesman, if you can identify that not all customers are the same — I thinkthe best salesman is a salesman that doesn’t sound like a salesman. You know, find outwhat kind of person you’re dealing with. And that’s psychology … Naturally, I’ve madeit very over simple, there’s more than that. You can even have combinations of both.You can have people that are social, but they want the best. So that would make them acombination of sociable and achievers. You know, there’s a whole zillion differentcategories (U.S. Sales interview no. 4).
During my two-week tenure as a sales trainee at Acme Appliances, I developed a lexicon of salesmanslang and shorthand terms used by the salesmen among themselves (see Table Chapter 5 .6). As in othersubcultures, the special lexicon reflects the primary concerns and the items of discussion amongsalespeople.
Table Chapter 5 .6. Lexicon of Appliance Sales Terms
A.D.V. – advertised model. These are sold at a low sticker price in order to attract customers tothe store. Generally salespeople would greatly prefer to sell a “push” piece, as compared toan A.D.V. piece, since their commission will be higher on the former.
bad hair – a general term used to cover a multitude of situations when things go wrong, such aswhen a customer returns an appliance, when a warehouse cannot fulfill an order on the datepromised, or any sort of customer complaint. A commonly used term was “Today is a bad-hair day.”
boater – fishing term, someone who buys the whole ball of wax, tag & 10.brown goods – these are electronic devices, stereo equipment, and TVs, as distinguished from
white goods, which are kitchen appliancesclose (also called “bang”) – to complete a sale. There are a number of ways of closing, some
aggressive (“When would you like that delivered?”) and some more subtle (“Would you likeme to check and see if we have that in stock?”)
cank – shorthand for “cancel.” When someone canks, it is bad hair.cheese (also called “air”) – see warrantychisler – similar to tire kicker; someone who keeps chipping away to get the best dealclem – clearance model, that is a model that is on sale and that the store wants to sell to reduce
their inventory. Generally, salespeople would prefer not to sell clems, since they make littlecommission on them.
landing – what a customer does when they settles in on a product he is interested in. Onecustomer came in and Mike said, “I’ll wait until he lands. He is still cruising around looking,he hasn’t landed yet” (like a bird)
laydown – a customer who is a pushover; who will “lay down” and buy at tag & 10 withouttrying to negotiate or cut a better deal
leader – loss leader, an item with little or no profit margin that are sold at a low sticker price in

5-10
order to attract customers to the storemajor – the major appliances are refrigerators, freezers, air conditioners, dishwashers, clothes
washers and dryers, ranges, and ovens.MAP – minimum advertised pricing. For licensed dealers of brand-name products, this is the
minimum amount at which a product can be advertised. This limits the retailers flexibility inadvertising sales and specials and is carefully policed by distributors.
N.L.A. – no longer available.Push piece – a high-profit-margin piece that the store and salespeople want to sell (as opposed to
an A.D.V. piece, the purpose of which is to attract shoppers to the store)points – a term used to describe the percentage above a store’s costservice – an extended service plan sold by the store which typically extends the manufacturer’s
one-year warranty to three or five years. Selling “service” is essential for a salesperson to dowell and make a good income.
seven-second test – used by salespeople as a rule of thumb for ease of explaining something to aconsumer. If a feature cannot be explained or easily understood within seven seconds, thesalesperson is likely to lose the customer’s interest.
spif –a fixed, per-unit amount that is paid indirectly by the manufacturer via the store to thesalesperson. Spifs tend to be larger for more expensive items. One saleperson described thespif as “basically a kickback from the manufacturer for selling their product.”
step up – persuade a customer that they should buy a high-value product with additional featuresand conveniences, compared to the one they came in intending to purchase. The unit willcost more for the consumer and will yield a higher commission for the salesperson.
strapper – strappers are not loyal customers. They come into to the store and try to get as muchinformation as they can, without any real intention of purchasing. The name comes from theword for an Australian cowboy.
tag and 10 (also called “T and T”) – means you sell the appliance at the full price on the salestag (no further discount) plus 10 years worth of warranty.
tire kicker – someone who isn’t really serious about buying, but asks a lot of questions and grillsyou for information.
warranty – this is an extended service plan to provide additional protection in case the appliancefails beyond the usual one-year manufacturer warranty. It provides additional commission tothe salesman on the same appliance. Also referred to as “cheese,” “air,” “CPP” (customerprotection plan, Silo Co. usage), or “MAS” (maintenance and service, Sears Co. usage).
white goods – the full range of kitchen appliances. Excludes air conditioners.
The salesman are motivated to try to avoid selling the “leaders” or the “A.D.V.” pieces and instead“step up” customers to convince them of the extra convenience they will receive from buying a moreexpensive “push piece” that has additional features and benefits. The ideal situation is to sell a “pushpiece” at “tag and ten” (i.e. sell a high-profit model at list price with ten years of service). None of theslang terms that I learned while at Acme Appliances related to energy efficiency or reduced operatingcosts. This reflects the fact that, with the exception of air conditioners, energy efficiency is not asignificant issue of discussion among the sellers of white goods.

5-11
Salesperson Training and Incentives
Table Chapter 5 .7 compares training and incentives for appliance salespeople in the two countries.A major difference between U.S. and Thai retailers was a greater emphasis in the U.S. on training andkeeping up to date with product knowledge and developments. All of the salespeople at the four storesreceived more than three days per year of ongoing training. At Acme Appliances, salespeople spend 10-15 days each year (one day every other week during the off-peak periods, August to November andFebruary through May) in product training courses at the headquarters. These training sessions areusually led by equipment suppliers and cover the latest developments in their product lines and in theproduct area generally. At the national retailer, they have formal training for all new salespeople at thecorporate headquarters, which lasts about a week. After that, they have two types of ongoing training,usually on a weekly basis, at the stores: presentations by vendors, and also cross-training between thesalespeople at which they share their experiences. The other national retailer, for which I interviewed thesenior buyer for refrigerators, has a mentorship program in which new salespeople are paired up withanother salesperson for their first four to six weeks. After that, they have a regional seminar about once ayear for major product groups to talk about developments in the product and share sales experience.
Table Chapter 5 .7. Salesperson Training and Incentives in the U.S. and Thailand
U.S. Thailand(% of 14
respondents)Amount of training a
No training 0 40 Initial training only 0 21 Less than 3 days/year 7.1 26 More than 3 days/year 93 13Do you receive a commission on sales?b
Yes 100 54 No 0 46
a N=38 Thai respondents for this questionb N=24 Thai respondents for this question
In Thailand, the training is less formal and less extensive. Compared to the U.S. salespeople weinterviewed, nearly all of whom had more than three days training per year, only 13% of the Thaisalespeople received more than three days training per year. At shophouse stores, there is usually noformal training, and most of the learning occurs as mentoring between the owner or manager and juniorsalespeople. Occasionally, salespeople attend local product seminars by distributors held at a hotel orconference center. Department stores generally have a structured training period, during which the newemployees wear “trainee” badges for several weeks while they learn the systems and procedures of thestore. And they also tend to have more ongoing training from appliance distributors over the course of ayear. The company employees tend to have more regular training on their manufacturer’s new productsand technologies.

5-12
In neither country, did I find any incentives relating to the sale of more energy-efficient equipment.4In the U.S., all of the salespeople whom I interviewed worked on a commission basis and at all fourstores, the sale of extended service was the largest single component of salesperson commission income.In contrast, in Thailand, slightly over half of salespeople worked on a commission basis.
Incentives at Acme Appliances
At Acme Appliances, I observed the constraints on the price at which a retailer can sell an appliance.One is set by the manufacturer, and is the minimum advertised price, or MAP, of a product. In essencethe manufacturers cannot control the price at which the retailer sells the product, but they can penalize, oreven terminate, the retailer for selling a product below MAP. Acme Appliances strongly discourages itssalespeople from selling any appliance at less than 15% above the cost to the store.
An actual transaction can be used to demonstrate how this works. A couple who had shopped forprice at a nearby appliance store, came into Acme Appliances and looked at a Kitchen Aid dishwasherwith a sticker price of $609. The customer tried to bargain down the price, saying that the neighboringstore had the piece on sale for $559. The salesman, James, said “Let me see what I can do, let me talk tothe store manager.” James found out that Acme Appliances’ cost was $490. He explained to me that heknew right off the bat that with a $609 sticker price he would be hard-pressed to sell it for $559. Theway he calculates whether he can sell it is whether it is 15% (also called 15 “points”) above their cost.James has strong incentives not to sell anything below 15 points, because below 15 points, hiscommission drops from 2% to 1% of the value of the sale.
James worked out the example for me. He said that on this Kitchen Aid dishwasher, 15 points (i.e.15% above his store’s cost) would be $571. So he quoted the couple a price of $589, because he didn’twant to go below the 15 point level. If he had been able to sell the dishwasher for $589, he would havemade a total of about $22 — $12 commission plus a per-unit fee, called a spif, of $10.5 If he sold it forless than 15 points, he would be penalized twice: first, he would make only the commission, and no spif;and second, his commission rate would drop from 2% to just 1%. Thus if James had sold the dishwasherat $559, he would have only made 1% on $559, or $5.59. He said that not only wasn’t it worth it for himto sell at that price, but the company questions you when you sell products below 15 points.
In this case, James lost the sale. As it turned out, the couple had initially been shopping for aWhirlpool dishwasher that sells for $400. After comparing different products, they decided to “step up”to a substantially higher-quality dishwasher with a stainless steel tub and spend an extra hundred dollarsor so. Because of this decision, they felt that they had to shop vigorously on price. They had alreadybeen to two other stores, and the extra $30 they could save by going to the neighboring store was veryimportant to them. So James lost the sale.
At Acme Appliances, the salespeople’s paychecks are calculated based on the amount of their profitmargin and the amount of service they sell. The company wants you to have a profit margin of more than15% — that is, your total sales should exceed the store’s cost for those products by at least 15%. If it’sless than 15%, as noted earlier, you get a lower commission percentage.
4 This statement is true for white goods but not for air conditioners. In general, within a given size category,
high-efficiency air conditioners tend to have a higher sticker price and thus yield a higher sales commission.5 A commission is a fixed percentage of the sale value, which is earned by the salesperson. At Acme
Appliances the percentage commission rate can vary depending on the salesperson’s monthly sales. A spif is a fixed,per-unit amount that is paid by the store to the salesperson. Spifs tend to be larger for more expensive items. Onesaleperson described the spif as “basically a kickback from the manufacturer for selling their product.”

5-13
But the major incentive for the salesmen at Acme Appliances is to sell an extended service plan(a.k.a. “service”). If more than 8% of your total sales are service, then 20% of the service goes directlyto the salesperson. The commission a salesperson earns from selling service is called “cheese” or “air”(see Table Chapter 5 .6). For example, if you sell a refrigerator for $800 plus a five-year extendedservice plan for $200, you would earn approximately about $76 — $16 on commission, $20 as a spif and$40 for the service plan. In the salesperson culture a real home run occurs when you sell an appliance atlist price plus the maximum amount of service, 10 years. In the sales argot, this is referred to as “tag andten.” A salesperson may say, “I sold it at tag with ten years of cheese (or air).” According to thesalespeople at Acme Appliances, you cannot really succeed unless you sell a substantial amount ofservice:
In this business, my motivation is to sell service. In this company, you cannotsurvive without selling service. I really don't, the bottom line is I care what they buy, butI care more that they buy service, because without that, I lose. I can't stay in thisbusiness … they ought to have a better pay structure. They don't believe — the bottomline is, in order to survive and provide for my family, I've gotta sell service. and withoutselling service, I won't stay here (U.S. salesperson interview no. 5).
None of the incentives that I observed in the U.S. appeared to be related to energy efficiency. In fact,the incentives motivate salespeople to “step up” customers and influence them to purchaser largerproducts with additional features. To this extent, the incentives appear tilted toward the sale of productsthat use more energy rather than less.
Incentives in Thailand
In Thailand, the presence of commission and its structure varied greatly by region and by type ofstore. Overall, we found slightly more than half of the salespeople reported that they worked on acommission basis. The tendency to offer a commission did not vary between department stores andshophouse stores, although we found only one store in a rural district that offered commissions to itssalespeople.
Many of the managers said that they used to have sales goals, but because of the slow economy andtheir relatively slow sales, they did not strictly track these goals.6 The most common way ofcompensating salespeople was a bonus system — usually not related to sales — common for most Thaicompanies, whereby the salespeople are given a year-end bonus equal to one month’s worth of pay.None of the performance evaluation criteria that we observed were related to energy efficiency.
The most common type of incentive we observed was a “spif”. The value of the spifs ranged from aslow as 0.3% of the product retail price (US$0.75 to US$1.25 on a US$250 refrigerator) to as high as 3%.In some cases, the spifs would increase to a higher level if the salesperson exceeded the quota. For thestores that offered percentage-based commissions, the commissions generally ranged from 1% to 3%.The most generous commission structure was for Singer, which sells products through its outlets directly
6 Although these interviews took place four months before the beginning of Thailand’s currency crisis, which
sparked the beginning of the Asian economic crisis of 1997, many of the retailers whom we interviewed complainedthat sales of appliances had been sluggish for the previous 12 to 18 months.

5-14
to customers, and finances nearly all of its purchases. Singer salespeople receive a 5% commission onthe sale value plus a 9% collection fee, and they are responsible for collecting the monthly paymentsfrom the customers.
The sales incentives can also vary by product and manufacturer and may not be based just on theprice of the unit. For example, I asked one Thai shophouse salesman if he would generally get a largercommission for selling a more expensive product.
No. It depends on the manufacturer and which products they are selling a lot of. Forinstance, if we get 100 Toshiba units, we’ll get a lot of commission for selling Toshiba.It depends on the company and what sales goal they set (Thai sales interview no. 10).
As in the U.S., the incentives in Thailand are geared toward selling larger, higher-value products withmore features that tend to used more — not less — energy. In Thailand, because many of the salespeopleare employed by a brand distributor rather than the retail store, there is also a strong incentive to sellmodels produced by a particular manufacturer. We observed no incentives related to the sale of energy-efficient equipment. As in the U.S., the exception to this rule was for air conditioners. Within a certainsize category, salespeople have an incentive to sell higher efficiency air conditioners that tend to pay ahigher commission.
Consumer Priorities
Past research in the U.S. has shown that, despite years of campaigns and nearly two decades duringwhich energy labels have been prominently displayed on U.S. appliances, energy use is not a highpriority during the typical consumer’s decision-making process (Dyer and Maronick 1988; and du Pontand Lord 1996). Understanding priorities in consumer decision-making is difficult, since these prioritiesmay be unspoken, may vary between the two (or more) purchasers, and may be biased in the reporting.One such problem, bias in self-reporting of energy as a priority (the Hawthorne Effect) was discussed inChapter 3. Below, I report the results on consumer priorities gained from my semi-structured interviews,as well as from my two-week participant observation at Acme Appliances.
Table Chapter 5 .8 shows the ranking of the top purchase criteria for the U.S. The table has twocolumns of results. The left column shows the priorities as reported by the salespeople whom Iinterviewed. The right column shows the results from my two weeks of participant observation as a salestrainee at a New Jersey appliance store.7 During the two weeks, I was able to rank consumer prioritiesbased on my detailed observation of 25 appliance sales.
The different results between the two columns in Table Chapter 5 .8 have to do with the method ofdata collection. I feel that the results from the participant observation are more reliable and accurate,since they represent a record of what was actually observed on the store floor at the time of the sale. Inthe salesperson interviews, they responded to a question about priorities in the abstract, based on theirexperience. Their responses indicate a common view among the salespeople that feature, price, and sizewere they key priorities. In my observation of actual purchase decision cases, these three were indeedmost important, but price (mentioned in 23 of 25 transactions) and features were way ahead. Size, colorand other (financing, availability, quality) were the next most important.
7 The results of this participant observation are described in Chapter 7.

5-15
Table Chapter 5 .8. Ranking of Consumer Purchase Criteria Based on Interviews with U.S. Salespeopleand Participant Observation (Major Appliances, Excluding Air Conditioners).
Purchase Criterion Interviews with 14salespeople(% in top 3)
Participant observation of25 sales
(% in top 3)Features 64 80Price 57 92Size 43 32Energy efficiency 7 4Brand 7 8Quality 7 0Durability 7 0Appearance 7 0Guarantee 7 0Other 7 16Finance 7 4Delivery 7 0Color 0 24
Table Chapter 5 .9 summarizes the Thai salespeople’s perceived purchase criteria. In Thailand, I hadno participant observation to compare with the salesperson perceptions, so Table Chapter 5 .9 is bestcompared with the first column in Table Chapter 5 .8. There are several obvious differences in theresults between the two countries. In the U.S., features (64% of salespeople mentioned it, and in 80% ofsales I observed it) were mentioned much more frequently than in Thailand (just 23%). At the sametime, brand (7.1% and 8.0%) and efficiency (7.1% and 4.0%) were mentioned much less frequently in theU.S. In Thailand, brand was mentioned most often as a top priority (56%). Energy efficiency (49%) wasthe second most frequently mentioned criterion.
When I asked salespeople in both countries about priorities, it was clear that price was not really apriority in the purchase decision, but more of a boundary. In their explanations of consumer prioritiesand decision-making, salespeople from both countries indicated that, while consumers might have a pricerange in mind, this was not the determining factor and did not eliminate many tradeoffs between variousfeatures on the models that they were comparing. One U.S. salesman described the price barrier thatmany customers begin with and his strategy of trying to “step up” customers to more expensive modelswith more features:

5-16
Table Chapter 5 .9. Ranking of Consumer Purchase Criteria for Refrigerators Based on Interviews withThai Salespeople
Purchase Criterion PercentBrand 56Energy efficiency 49Size 30Price 28Quality 21Durability 23Appearance 23Features 23Guarantee 12Color 12Other 9Finance 7Delivery 0
I would say that most of the time they're looking at a price range, and the price rangerestricts the features that are available to them. So sometimes what I try to do, if they'renot aware of features, is show them the top of the line product, because that usually hasall the features, and they can decide from there which features they want to pay for andwhich they don't (U.S. sales interview no. 8).
U.S. salespeople stressed the need to deliver perceived value. One salesman referred to it as savingconsumers time and providing them convenience. Another stressed the fact that he tries to sell featuresrather than price: “I try to express features and benefits, rather than price, because any salesman can dropprice. You can have a monkey standing in the store [dropping the price] …” (U.S. sales interview no. 6).
In Thailand, refrigerators tend to be simpler (single-door, 4-6 cu. ft. models make up 60% of sales)and there are fewer convenience features to distinguish one model from another. This is probably theexplanation for why features were ranked much lower than in the U.S. The type of convenience featuresmentioned most often by Thai retailers were automatic defrost, semi-automatic defrost for refrigeratorsand air filters and remote control for air conditioners.
While my U.S. research suggests that there is less brand loyalty in the U.S. than ten or 20 years ago8,brand clearly plays a major role in decision-making for Thai consumers. First, the marketing ofappliances in Thailand is driven much more by television than in the U.S.; Thai consumers arebombarded with advertisements from the different appliance manufacturers each night on TV. The Thairetail environment also lends itself to brand identification. Department store displays are typically set upin sections, divided by brand, so that the Sharp refrigerators are displayed in a separate area from the
8 My conversations with salespeople suggested that strong brand loyalty is less prevalent in appliance sales than
it used to be. In a proprietary market study conducted for Acme Appliances, 30% of respondents replied “no brand”when they were asked, “Does any one appliance brand first come to mind?” Another market study for AcmeAppliances found that appliance sales are more brand-driven than three to four years ago.

5-17
Mitsubishi, National, and Toshiba models. And as mentioned earlier, the salespeople are just as likely tobe employed by the brand distributor as by the store itself. Thus, they often tend to promote the uniqueadvantages of their particular brand over other brands and to discourage a customer from choosing asfreely between different brands.
Salience of Energy Efficiency
The results of my sales interviews and participant observation in the U.S. and Thailand make it clearthat the energy efficiency of the products is a more salient issue in Thailand than in the U.S. Onesalesman, indicating that the energy label has become a clearly identifiable product feature, describedhow brand and energy efficiency play out as the two most common criteria sought out by customers:
Every customer, they walk through and look at the products first. They ask, “Whatbrand is this? Do you have Whirlpool? Do you have Sanyo?” Then they see the labelson the refrigerators and ask “What number is this? You don't have number 5 for thisbrand? This brand only has 4?” Then they change their mind and look at this otherbrand. But a lot of people who come in and want a particular brand, there’s not thatmuch difference (Thai sales interview no. 32).
In contrast to Thailand, where energy efficiency, as embodied by the number 5 label, was discussedby the vast majority of salespeople as an important and tangible criterion, in the U.S., the quality orproperty of being “energy efficient” was often not clear to either the customer or the salesperson and wasdescribed by one U.S. consumer as a “gray area.” Most of the factors involved in the evaluation andpurchase of an appliance are discrete and easily understood. Some of these factors include the size,volume, price, available financing options, and features such as glass shelves and side-by side doors (forrefrigerator-freezers); sealed burners and self-cleaning capability (for ovens); and a stainless steel tub andthree-level wash (for dishwashers). A salesman from Acme Appliances explained the intangibility ofenergy efficiency:
Basically, you're not selling a refrigerator on energy consumption. You're reallyselling it on features and benefits to the customer. The only reason I tell you that we willstart to explain to them that it costs more to run is because they're entitled to know that.Otherwise, if you didn't explain that to them, they wouldn't know. I mean, that tag doesnot say on it “This costs more to run than a top and bottom.” I mean, nothing’s thatexplicit. So the consumer, only through the salesperson, will know that it costs more.And refrigeration is bought on features and benefits. What does it have. What does it dofor me? How does it make my life easier than the one I own now (U.S. sales interviewno. 2).
During my two-week participant observation, energy efficiency was not a salient characteristic indiscussions among salespeople or the actual sales transactions. In the 25 sales that I closely observed,efficiency appeared to be an important decision criterion in only one case, and the salesmen rarely

5-18
referred to the EnergyGuide label. In only three cases, all with the same salesman, was efficiency usedas a selling tool. Below I describe three cases I observed, representing a range of typical situations. Inonly one of them was energy efficiency an issue.
Energy-efficiency as an unnecessary, complicated, or expensive feature. In one case, an elderlywoman spent a long time shopping for a dishwasher at Acme Appliances and couldn’t make up her mind.She asked about a Frigidaire dishwasher listed at $219 (4 cycles, 24”). The salesman, Tom, tried to “stepher up” to a higher-priced model, a White Westinghouse unit on sale for $244 (5 cycles, 24”). Heclaimed that it was an “Energy Saver,” and that it used half as much energy as the Frigidaire.9 At first thewoman replied, “Oh, I don’t need that,” about the Energy Saver. The woman seemed disinclined to get aunit with extra features and buttons. She wanted to get something cheap and simple, and the fact thatthere are a lot of buttons made her feel like she was paying more for features she didn’t need, eventhough she was getting a very good price, $244. Her initial inclination had been to think that the “EnergySaver” was just another button or another feature that would add to the cost of the unit, so she did notwant it. But then Tom explained to her how it saved energy (lower water usage and booster waterheater). After hearing the benefits explained in terms of reduced operating cost, she decided that shewanted the feature, and said “Oh, energy saver, that’s good.”
Energy efficiency ignored by salesman because not among customer’s primary concerns. A well-dressed businessman named Chris came into Acme Appliances to buy a refrigerator-freezer for hisgirlfriend. He said that the existing unit, which has a top-mounted freezer, works fine, but she doesn’tlike it and has been “bugging” him to buy a new one. They just bought a new house. Chris said thatsince the existing refrigerator is brown and the other appliances in the kitchen are black, getting a blackrefrigerator was the most important criterion, followed by the convenience of the features. Chris spentmost of his time comparing three side-by-side models, outlined in Table Chapter 5 .10.
All three models were side-by-side models with through-the-door ice and water. After twentyminutes of looking them over and discussing the details with the salesman, James, Chris said he preferredthe Frigidaire to the other two models because he liked the look of the inside, the shelving arrangements,and the design of the door handle. The energy use was apparently an invisible feature. Although theFrigidaire had the highest energy use, he never looked at the label and didn’t consider that. James neverpointed out the fact that the Amana would cost $16 less per year to run (about $28 less per year in thatarea of New Jersey), and Chris never even considered energy use in his decision.
Table Chapter 5 .10. Comparison of Size, Price, and Operating Cost among Three Refrigerators
GE Profile Frigidaire Gallery AmanaSize 21.6 cu. ft. 22 cu. ft. 21.8 cu. ft.List Price $1,399 $1,349 $1,399Operating cost $74/year $76/year $60/year
9 The White Westinghouse had a label on the outside that showed 624 kWh/year and had listed operating costs
of $54/year for electric and $30/year for gas. The Frigidaire did not have a label either on the outside or the inside(most dishwashers at the store had the labels sitting on the interior racks), so I could not tell if Tom’s claim was true.I suspect it was an exaggeration.

5-19
Energy-efficient unit selected even though efficiency “invisible” to customer. I also observed a casein which a customer bought the highest efficiency model in a size category without even being aware ofit, because he was focusing on other criteria. A man who came in looking for an almond-colored, top-mounted refrigerator-freezer. He needed a model within a certain price range and, without any assistancefrom a salesperson, chose a Kitchen Aid unit for $699. He pulled the price tag off the front of the unitand started walking to the front of the store to pay for it. When I pointed out that he had purchased anenergy-efficient unit, he said, dismissively, “Oh, they’re all within $10-20 anyway. I then explained tohim that his model was rated at $46 per year, and this was $10 less than the nearest similar model.Further, at local electricity rates, this would actually save him about $18 per year, or nearly $200 over thelifetime of the refrigerator. He thanked me for the information and seemed mildly pleased, but then wenton to explain his primary, and much more pressing, concern: he wanted a new model with propertemperature regulation. In his existing unit, food freezes in the refrigerator, and if he turns the thermostatdown too much, food melts in the freezer.
Commenting on the lack of salience of energy efficiency, one of the U.S. corporate managers opinedthat marketing energy efficiency per se would not solve the problem. Instead, he said, it was necessary tointegrate energy efficiency into the array of features offered in the entire appliance package and to makeit a profitable proposition. He cited the examples of Whirlpool and Amana, and stated that these twocompanies had not been able to develop energy efficiency as a profitable feature in their mix of products.
Marketing alone won’t help to sell energy efficiency. It has to be packaged and soldas an additional value-added feature … Whirlpool and Amana are dropping their lines ofenergy-efficient refrigerators. They have emphasized this for the past few years, butfound that they are not making money on these, so are going to drop them … They hadenergy efficiency as an additional feature in their deluxe models, but it doesn’t work ifyou’re not getting a bang out of the feature. A good feature is one you can add on for $1and get an additional $10 on the selling price. But that’s been the problem with some ofthe energy-efficiency features, they’ve been expensive to add on. You need to make afeature work for you. You need to have a good margin (U.S. sales interview no. 12).
The above comments emphasize the important point that the economics of “features” being sold (i.e.added to new models) requires a much higher return on investment than the base characteristics of theappliance. The economics that this executive is describing appear to be quite different from theeconomics assumed in models used to determine what are “cost effective” measures in the developmentof national minimum efficiency standards. Apparently, according to this U.S. respondent, who is a seniorbuyer for a national appliance retailer, Whirlpool are Amana are dropping their lines of energy-efficientrefrigerators because they do not get a big enough bang (i.e. enough profit) from energy efficiency as amarginal feature.
Using Efficiency as a Selling Point
Our interviews revealed that efficiency is more actively used as a selling point by Thai applianceretailers than by U.S. retailers. When asked whether use energy efficiency as a selling point, more thanthree quarters (80%) of Thai salespeople said yes, compared to just over half (54%) of U.S. salespeople.In addition, Thai salespeople reported greater consumer interest in the energy label. On average, Thai

5-20
salespeople stated that nearly two thirds (62%) of consumers asked about or looked at the label,compared with a reported average of just one fifth (21%) of U.S. consumers (see Table Chapter 5 .11).10
Table Chapter 5 .11. The Role of Energy Efficiency in the Sales Transaction
U.S.(% of 14
respondents)
Thailand(% of 53
respondents)Estimated percent of customers who ask about orlook at energy label: ave. (range) 21 (5-95) 62 (20-100)Do you use energy efficiency as a selling point(N=39) Yes 54 80 No 46 21
The following comments by a U.S. salesman reflect the relative lack of importance of energyefficiency and the EnergyGuide labels on the overall sales process:
To be totally honest with you, I think that [the EnergyGuide label] has no bearing ona purchase. I really think it has no bearing, but then you'll get that one consumer who’sreally involved in the yellow EnergyGuide and what it really means. But I think that,just you know — because every refrigerator is very close from manufacturer tomanufacturer, like if GE’s 18 cubic foot is 58 [dollars], Whirlpool’s gonna be 56[dollars] — so personally I don't think that's gonna have a bearing on a sale.
What percentage of customers might ask about it?
I'd say, it would be less than 10 percent.
And those customers who look at the label, do they really understand it?
Out of that 10 percent, maybe there's one percent that actually knows what it actuallymeans.
Do you think the labels are effective as they are now?
Again, I really don't think so. It depends, on a small percentage basis, I would sayyes. Out of 100 people looking for refrigerators, I would say less than 10 percent wouldactually ask the salesman to explain what this EnergyGuide is. And of that 10 percent,
10 Since the sample of U.S. salespeople (N=14) was small, it is affected by outliers. In this case, one of the
salespeople reported that 95% of customers look at the label. If this data point, is removed, the U.S. average fallsfrom 21% to just 13%.

5-21
only one percent would actually buy because of the EnergyGuide (U.S. sales interviewno. 6).
This attitude was reflected in the comments of the corporate managers whom I interviewed. One ofthe managers, who personally felt very strongly about the need to conserve energy, and who hascommitted his company to participating in the U.S. government’s Energy Star Retail Labeling Program,11
nonetheless stated that, “I mean it [energy efficiency of the product] is just not a factor when we considerwhat will spur sales and what won't.” A vice-president at Acme Appliances, who described himself asskeptical of environmentalists and not personally very interested in energy efficiency, said that he feltthat the labels were essentially irrelevant:
From our perspective, we put ‘em [the labels] on there less because it’s a feature tosell than because it’s the law. And as in everything in running a retail store, it’s aquestion of compliance getting them on there. I've never heard of a customer eithercomplaining that it was there or be happy that it was, and I'm also not sure based on theindustry’s reputation that they [consumers] believe what it says (U.S. sales interview no.13).
The label is the primary vehicle for Thai salespeople to communicate that the unit will save energyand reduce operating costs. Below is a sample of responses by Thai retailers to the question, “Do youuse energy efficiency as a selling point?”
We explain to the customer that this number 5 is an important aspect of this airconditioner. Number 5 is the number that saves the most energy. It goes from 1, 2, 3, 4,and then 5, and number 5 saves the most energy (Thai sales interview no. 15).
Yes, it’s an important selling point for refrigerators and air conditioners. People willask, “does this use a lot electricity?” Some villagers don't know that when they buysome of these appliances that their electricity bill will go up quite a bit, for example iftheir bill is 50 baht, it could go up to 100 per month (Thai sales interview no. 29).
Yes. This is a very important piece of information. If a customer comes in andlooks at a product, it can be a way for them to make up their minds. For example, “Isthis number 5?” If it’s number 4, it takes a bit longer. If it’s number 5, they say, “Oh,this saves energy. This is better” (Thai sales interview no. 46).
Yes. In almost all cases, if they see a number 5, then they take the unit. They wantthat brand. And if there isn't a number 5, they say, “OK, we’ll take a number 4. Youdon't see number 3 anymore” (Thai sales interview no. 21).
11 This program, which combines training of salespeople, point-of-purchase information, and placement of an
Energy Star logo on four types of appliances, is described in Chapter 2.
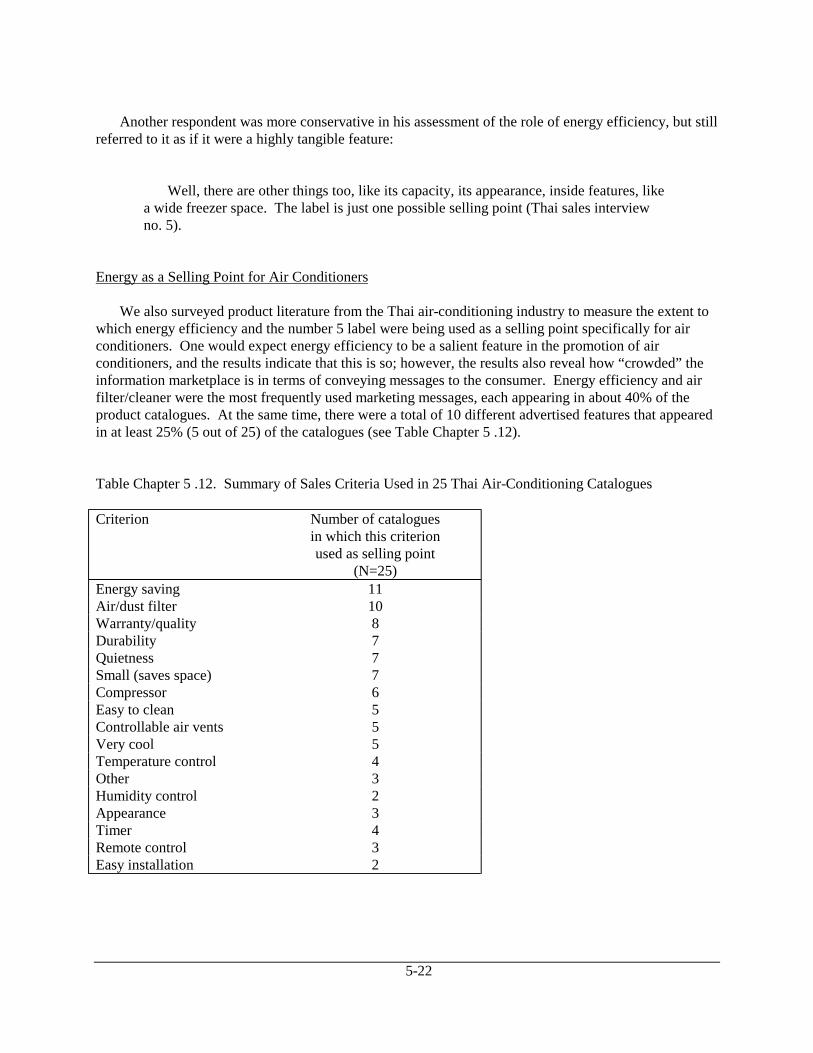
5-22
Another respondent was more conservative in his assessment of the role of energy efficiency, but stillreferred to it as if it were a highly tangible feature:
Well, there are other things too, like its capacity, its appearance, inside features, likea wide freezer space. The label is just one possible selling point (Thai sales interviewno. 5).
Energy as a Selling Point for Air Conditioners
We also surveyed product literature from the Thai air-conditioning industry to measure the extent towhich energy efficiency and the number 5 label were being used as a selling point specifically for airconditioners. One would expect energy efficiency to be a salient feature in the promotion of airconditioners, and the results indicate that this is so; however, the results also reveal how “crowded” theinformation marketplace is in terms of conveying messages to the consumer. Energy efficiency and airfilter/cleaner were the most frequently used marketing messages, each appearing in about 40% of theproduct catalogues. At the same time, there were a total of 10 different advertised features that appearedin at least 25% (5 out of 25) of the catalogues (see Table Chapter 5 .12).
Table Chapter 5 .12. Summary of Sales Criteria Used in 25 Thai Air-Conditioning Catalogues
Criterion Number of cataloguesin which this criterionused as selling point
(N=25)Energy saving 11Air/dust filter 10Warranty/quality 8Durability 7Quietness 7Small (saves space) 7Compressor 6Easy to clean 5Controllable air vents 5Very cool 5Temperature control 4Other 3Humidity control 2Appearance 3Timer 4Remote control 3Easy installation 2

5-23
How the Label is Used
Based on the salesperson response reported above, the Thai label appears to be more successful thanthe U.S. label at clearly communicating to customers which models are the most energy-efficient. Thismay explain the different ways in which the label is used in the two countries. In Thailand, there is ahigh level of consumer interest due to the large, nationwide television advertising campaign, and itappears that the energy label is being used as a pre-screening device by a large percentage of consumers.In contrast, in the U.S. appliance stores I visited, the label plays a negligible role in most transactions;however, there appears to be support for the idea of energy efficiency being used as a “tie breaker,” tohelp consumers choose between two otherwise similar models.
In Thailand, a Screening Tool
Research cited in Chapter 2 has concluded that in the area of appliances, information search is a two-stage process: initially consumers compare (i.e. screen) all alternatives on just one or a few attributes.When the search continues, they select a smaller number of alternatives and compare these on allavailable attributes (Bettman 1979; Verplanken 1990 cited in de Loor 1991). In Thailand, the energylabel has apparently made it into the first stage of the process, the initial screening of products.Incredibly, after just two years of the labeling program, energy efficiency is such a salient issue inappliance purchases that it appears to be on the tip of most consumers’ tongues when they enter the store.Salespeople consistently reported that customers ask about the energy labels as they begin their productsearch in the store. These comments from two Thai salespeople indicate the extent to which energyefficiency is used as a primary sorting criterion by consumers:
For the most part, customers approach me and they ask, “Miss, do you have anumber 5 refrigerator?” It’s like that. “What models or brands do you have that are anumber 5 refrigerator? Can you show me some?” … The label can play an importantrole in roughly a third to a half of all sales (Thai sales interview no. 2).
These days, since EGAT has begun its ad campaign, customers generally look fornumber 5. If it’s more expensive, that’s OK. But it has to be number 5. They considerthat number 4 is inferior, a lower grade, is not very good. It’s lower than 5 (Thai salesinterview no. 46).
The second quotation suggests that the energy efficiency rating has, for some customers, become ageneral quality rating. However, this screening relies on models having a diversity of ratings. As notedearlier, we were told by a number of refrigerator retailers that as more of the models receive the number 5rating, the impact of the label as a tool for screening models will diminish:
In the U.S., Perhaps a Tie Breaker

5-24
Two U.S. policymakers introduced the idea of energy efficiency being used as a “tie breaker” or“deal breaker” — that is, as an extra attribute that could be used to close a sale when a consumer wasweighing two units that were similar in most other respects. We tested this idea by asking several of theU.S. salesmen the question, “Could energy efficiency be used as a tie breaker?” The responses weremixed, indicating some acceptance of the idea, but revealing that much more retailer education wouldhave to be done in order for them to use it in that way. This salesmen responded positively:
I usually point it [the EnergyGuide label] out to them. When it comes down to
indecision … to try to help them decide which way to go when they're undecidedbetween one or two products, I point out one or two differences that they may haveoverlooked. For example, I might say, “You know, one of the things you might consideris the energy efficiency of this particular model, especially in an area where energy costsare high” (U.S. sales interview no. 8).12
But another salesman indicated that the label itself would have a lot less weight than would his ownadvice and suggestions:
I think that the deciding factor to break a tie is gonna be what the salesperson’sadvice is. I think if he says, and he really talks a lot about how it uses less energy andover the course of a year it can save you a couple hundred dollars, that'll be meaningful.To point out the difference in the EnergyGuide A being less expensive than B, but B Isell a lot of and my customers really seem to like it, I think they're gonna buy B. I think asalesperson’s advice carries a lot of weight (U.S. sales interview no. 13)
Other salesmen were more skeptical of whether energy efficiency was a strong enough attribute to beused as a tie breaker.
You could use energy efficiency as a selling point in addition to other features, butnot as a tie-breaker. Most people don’t care too much about the environment. Somepeople can be turned off if you talk too much, and you can lose a customer. I won’tmake a big deal out of it (U.S. sales interview no. 9).
There are so many other factors that customers are considering that energy efficiencywouldn’t be the one thing to break a tie. But it could be used as another selling feature,and salespeople could be educated on how to explain the benefits of this feature. It’sclearly a benefit. When a customer is comparing models, it doesn’t hurt at all for thesalesman to point out that this model is energy efficient and can save you so muchmoney (U.S. sales interview no. 12).
12 This salesman also said that he would buttress his argument by showing them that the actual electricity use, at
the local electricity price of 14 cents/kWh, was off the scale of the cost table at the bottom of the label, and thus evenmore expensive than the highest annual cost shown on the table.

5-25
At the corporate level in the U.S., there is some feeling that, while energy efficiency is not one of thetop-tier features in a typical appliance sale, it has the potential to give an appliance retailer a competitiveadvantage. One of the corporate managers who is participating in the U.S. government’s Energy StarRetail Labeling Program, said, “We feel that energy savings in the future will be another feature used tosell appliances, and this program is helping to educate consumers” (U.S. sales interview no. 12). Anothercorporate manager whose company is also participating in the Energy Star program acknowledged thatenergy efficiency “is just not a factor when we consider what will spur sales and what won’t” (U.S. salesinterview no. 14). Yet this same manager, when asked why his company was participating in the EnergyStar program, cited very personal reasons having to do with the oil shocks in the 1970s and his feelingthat eventually there will be another similar crisis, for oil, or electricity, or water. He said that thepreliminary data he had seen from the program indicated to him that energy efficiency was being used asa tie breaker in stores that participated in the program: “We did this awareness stuff in D.C., and theyused it [energy efficiency and the energy labels] effectively. And it didn't drive sales, but it was a tiebreaker. I mean the sales of those units were up.”13
Understanding the Energy Labels
In my discussions with salespeople in both countries, it became apparent how little time customers ineither country actually spend deciphering the label. Given the time constraints on the sale; the need forthe salesperson to establish a rapport with the customer, talk about the many attributes of the productsand the stores, and discuss financing and service arrangements; and the pressure on the salesperson tokeep the customer’s attention, they have little time to spend explaining the fine print and technical detailson the appliance labels. Chapter 7 focuses on consumer understanding of the energy labels.
Many of the U.S. salesmen said that they would not normally point out the EnergyGuide label.Among those who said they did point out the label, most indicated that they would do just the bareminimum when discussing the EnergyGuide label with a customer.
It’s too much work for salesperson to go into it and calculate it out. A customer’sattention span listening to a salesman I think is very short, unless you've reallyestablished good rapport with them. So if you hit ‘em with too much detail like that, myexperience has been you turn them off. Because they think you're trying to sell, insteadof trying to help them make a decision that they feel is their own (U.S. sales interviewno. 8).
A common theme among Thai salesman was that customers usually only understand whether a unithas a 4 or a 5 rating, and they are content with that superficial level of information. Said one,“Customers usually don't look at that level of detail. The just read the big number, the number and thesize” (Thai sales interview no. 26). The marketing director of a major Thai appliance manufacturer
13 His comment should be interpreted to mean that elements of the Energy Star Retailers program acted as a tie
breaker. These elements included trained salespeople, point-of-purchase information, and a special Energy Star logoon high-efficiency units to spur sales of more efficient refrigerators. His comment does not necessarily mean that theexisting EnergyGuide label could be used effectively as a tie breaker.

5-26
praised the Thai appliance labeling program but indicated that consumers don't look beyond the overallnumerical rating of the model:
This [EGAT’s labeling] program has … made consumers aware that you have to look at the labelfirst. Just only aware. But they never look at the label in detail to see for each brand, how importantit is. because some brands will save more. For example, even though two models are both number 5,but a Sanyo number 5 might save more than a Toshiba number 5. The consumer is not aware at thislevel (Thai sales interview no. 54).
The U.S. salesmen whom I interviewed uniformly said that few customers bother to look at the labeland those who do have a hard time understanding it. Said one. “I don't think they understand it. I mean,if I had ten customers, maybe one of them would understand what it really means, unless you explain it tothem” (U.S. sales interview no. 2). Another reported a similar experience: “They usually ask how tointerpret it. It’s hard for the average person to understand what exactly it means” (U.S. sales interviewno. 4). One salesman called me over to a nearby refrigerator to discuss his views on the EnergyGuidelabels:
I think they're too confusing … Gosh, I talk to people, and I say all right, you knowyou're from 64 to 121 [dollars], and 74 [dollars, the rating for this unit], but that's goingat these rates per kilowatt-hour. So I ask, “What are you paying?” And nobody knowswhat they're paying as far as kilowatt-hours goes. At least I haven't found anyone tellingme what they’re paying.
Could you figure out how much this model would cost to use in this area?
Absolutely not. I couldn't do it. And I work here. And the main reason I don't is Inever want to get too technical. I want to get features and benefits. Let me show youthis one, right over here [walks to refrigerator that he said sells for $1,500.] This is a 25cubic-foot refrigerator, it uses 60 dollars per year, side by side. this is extremely energy-efficient and quiet. In fact this one and the 27 [cubic-foot model] was rated number onein Consumer Reports. Then I boom, boom, boom, and I go through all of this stuff[features and benefits of the refrigerator] (U.S. sales interview no. 5).
This response indicates a layer of barriers to the problem. First, he finds the labels confusing andcan’t fully understand them or explain them himself. Second, he knows that customers find the labelsconfusing and he would be unlikely to take the time out to explain them even if he did fully understandthe label. And finally, his first priority is selling the “features and benefits” that the customer desires,and these do not include anything but a passing reference to the unit’s energy consumption. He is afraidthat if he spends too much time on the energy label, he will lose their interest and thus lose the sale.
Is the New U.S. Label an Improvement?

5-27
In 1994, the Federal Trade Commission issued a final rule that revised the format and design of theEnergyGuide appliance labels (FTC 1994). The new labels now appear on about half or more of whitegoods in U.S. appliance stores. In an effort to understand how well the new label design has beenreceived by salespeople, I showed sample EnergyGuide labels to nine of the 14 U.S. salespeople andasked which label was easier for consumers to understand (see Figure 0.1 and Figure 0.2). Eight of thenine responded that they preferred the old label, and the overwhelming reason was that having a dollaramount on the label makes it easier to explain and compare.14 Below is a sampling of their comments:
Actually, I think we’ve gone backwards here with this label. That's only my opinion.Because the energy cost dollar number is very, very small, and it’s almost at the bottomof the label. It’s not prominent on the label. I think this [dollar] figure should beprominent on this label, because it can catch your eye and then lead someone to lookfurther at this (U.S. sales interview no. 7).
If there was a way of saying right up front this is what it’s gonna cost youapproximately to run per year and just having one figure there, to be honest with you,that would probably make the whole thing easier, if you could do it (U.S. sales interviewno. 1).
The dollar figure is what’s important, and it’s easier to understand, especiallybecause it is so large on the old label (U.S. sales interview no. 9).
It doesn't relate it to dollars for you, so it’s much more difficult to use (U.S. salesinterview no. 14).
I like the other one better because I think dollars are more understandable thankilowatts (U.S. sales interview no. 13).
Yeah, I've seen these [the new EnergyGuide labels], but I've had a tendency not topay any attention to ‘em. Because it doesn't seem to be as bold as this [the old label].This [small dollar figure at the bottom of the new label] should be bolder down here. Ithink if this was up here [if the dollar amount were at the top of the label], peoples’attention is drawn more to dollars (U.S. sales interview no. 8).
One respondent was more analytical and picked up on a theme that was echoed by many of the U.S.consumers on whom I later tested the label (see Chapter 7). Compared to the old EnergyGuide label, thenew label is graphically improved and has a simpler design that contains less information and is thus lesslikely to be confusing. At the same time, however, primary emphasis is on the dollar figure (rather thankilowatt-hours, which are not an understandable concept to many consumers15), and the use of large,bolder type could greatly improve the new label’s readability.
14 The old label has a large, bold dollar figure prominently displayed near the top of the label. The new label
instead has a kilowatt-hour figure, in smaller point size, as the primary figure near the top of the label. It also has adollar figure, representing estimated annual operating cost, in even smaller type near the bottom of the label.
15 See Patterson 1991, page 27

5-28
Figure 0.1. The “Old” EnergyGuide Label. This is still on about one-third to one-half of white goods inappliance stores.
From a graphical standpoint, I would say this [the scale on the new label] would beeasier to understand. But if you're not so oriented, then I think this [the old label] wouldbe easier. Because this [the old label] relates to cold, hard cash. So it depends on whatthe individual relates to. I mean, I like the graphical representation better on the otherone [the new label] because it shows more, so it jumps out at you. But I probably wouldlike it better if you used that kind of representation with money (U.S. sales interview no.11).

5-29
Figure 0.2. The “New” EnergyGuide Label. Introduced in a 1994 ruling, this label is gradually beingphased in on all new models to replace the old label.
Essentially, he is saying he would prefer the new label even more if the horizontal scale on the newlabel — which clearly compares the energy use of this model to that of other similarly-sized models —displayed energy use as operating cost (dollars) rather than energy units (kilowatt-hours).
One of the corporate managers was less charitable. He has a fifteen-year background in marketingand retail (department stores, women’s clothing, and appliances), and he scoffingly remarked that thelabel “Looks like it was designed by a bureaucrat.”
If the EnergyGuides were more customer friendly and more marketing tools … It’snot done the way you would write an ad. It’s pretty technical, it’s pretty ugly. It’s verygovernment looking, and it doesn't say “Save a hundred bucks, see details.” You knowthat would get somebody’s attention … If we really wanted to help consumers to savemoney, then someone with a marketing bent would redesign the tag, wouldn't they (U.S.sales interview no. 13)?
Why the U.S. Label Works Better on Air Conditioners

5-30
A comparison of my interviews with U.S and Thai salespeople led me to hypothesize that the Thaienergy labels were more salient, at least in part, because they provide a simpler metric that is both easierfor the salesperson to explain and for the customer to understand. As one Thai salesperson said, “It goesfrom 1, 2, 3, 4, and then 5, and number 5 saves the most energy (Thai sales interview no. 15). Thesimplicity of this numbering system is easy to grasp, much like the numerical rating system for theefficiency of air conditioners. On the U.S. EnergyGuide label, the energy-efficiency ratio (EER) of theunit is shown in large bold type.16 One U.S. salesperson said that, for him, the air conditioner label waseasy to explain because he could easily categorize the models into “good, better, and best.” “Anythingabove an 8, I tell ‘em it’s good. Over a 9, it’s better. And anything over 10 is the best U.S. salesinterview no. 5).”
A couple days after our interview, while I was doing participant observation, the same salesmandescribed how he had tried to incorporate this comparative strategy into his presentation of refrigerators.He had explained to a customer that refrigerators that are around 80 dollars a year on the EnergyGuidelabel are good, the ones that are around 70 are better, and the ones that are under 60 are best. To him,this was a quick and simple way of using the EnergyGuide label to distinguish between models. He saidhe thought that he convinced the customer to trade up to a “better” model in the 60 dollar range, but thecustomer left the store, and he didn’t close the sale.
Other salespeople indicated that customers pay more attention to the energy efficiency of airconditioners for a number of reasons. First they are more aware that air conditioning will be a big part oftheir energy bill. As one salesperson put it, “The efficiency of spreading this much cold air over myentire room is more understandable than just cooling one small box with food with it” (U.S. salesinterview no. 13). And second, unlike refrigerators, which have a panoply of convenience features thatdistinguish them, an air conditioner — especially a room air conditioner — has few distinguishingfeatures. Said one salesman, “It’s just an ugly box with brown on the front” (U.S. sales interview no. 4).These comments explain why consumers are more likely to pay attention to the EnergyGuide label on anair conditioner; however, they do not address the comprehensibility of the label. Several salesmen feltthat numerical rating system for air conditioners is much easier for them to explain and for consumers tounderstand:
Yes, [the EER rating is easier] because it is simple, and people can tell quickly that ahigher number is a better unit and will save them more money (U.S. sales interview no.12).
I think the EER is easier for the salesman to explain, it’s easier for the customer tounderstand, and it is a ranking. You just go look for a higher number. Anything overnine is considered high efficiency. Then you have them going right down [the row].They don’t look at it. They don't have to multiply it out. It’s very simple and easy tounderstand (U.S. sales interview no. 4).
It appears that although consumers do not understand the technical aspects of the EER rating systemfor air conditioners, it works better than the scale of relative energy use on the label for white goods. It
16 EER ratings are expressed to the nearest tenth of a unit (e.g., 8.7, 9.3, etc.). The EER units for the very best
units available are in the range of 12 to 14.

5-31
works better because its simple (just one large number), it’s easy for the salesperson to explain, and it’seasy for the consumer to understand.
Factors Limiting the Thai Label’s Effectiveness
Although the label appears to be used by most Thai salespeople as a selling point, there are twofactors that limit its usefulness. These limitations are discussed below.
Problems with the Closed-Ended Rating System. In urban areas, especially Bangkok, we found thatas the percentage of single-door refrigerators with high-efficiency labels increased 17, the ability to usethe label as a selling point reduced. When most of the units in a product display are rated at 5, thenumber 5 rating becomes less unique. The marketing manager for a major Thai appliance manufacturerstold me, “At first, we started using this as a selling point, but after everyone had labels, it wasn't a sellingpoint any more. It’s like it just became another part of the assembly process. Now, consumers don't lookinto it too deeply” (Thai sales interview no. 54). Other retailers we interviewed made similar comments:
Really, it doesn't help that much these days, because almost all of the refrigeratorsare number 5 now. It’s not like only some brands are number 5. Now, almost all of themodels are number 5. At first, it may have been a selling point, but now it’s like it wasbefore (Thai sales interview no. 45).
We received similar comments from salespeople, who said that as more of the models receive thenumber 5 rating, the impact of the label as a tool for screening models will diminish:
Most customers come in and they ask to see models with the energy saver stickernumber 5. That’s the first thing. Then they see that a lot of the brands have number 5and they’re not that interested anymore, because there is very little difference betweenthem. Because now almost all of the models are number 5 (Thai sales interview no. 9).
This clustering of models in the highest category is a characteristic problem of closed-end categoryratings (vs. a kWh, cost, or EER scale), which possibly could be addressed by periodically “re-calibrating” the scale. This problem is being faced by Australia and the European Union, who areconsidering how to deal with the issue.
Rating Efficiency Vs. Rating Overall Resource Use. Another potential problem with the labelingsystem occurs for retailers who are selling both regular-size units, single-door refrigerators (typically 4 to6 cu. ft.) and larger-volume, two-door (and multi-door) units, which tend to be imported. Because thelabeling scheme only covers single-door units, larger (mostly imported) refrigerators do not have anylabels. For salespeople selling the larger units, this puts them in the awkward position of having to
17 According to an informal survey I conducted, more than half of single-door refrigerators in Bangkok have a
number 4 or 5 label. The results from this informal survey are reported in Chapter 7.

5-32
explain why the larger units do not have an energy-efficiency label. One shophouse salesman, who sellsan entire range of brands and models, imported and domestically produced, said he tends to avoid usingthe label as a selling point since it hurts his ability to sell imported units:
No, I tend to look at the specifics of the product and the quality. If we look atnumber 5 as a selling point, then the products that don't have number 5, like theseimported refrigerators which don't have number 5 [he points to two- and three-doorimported refrigerators] — these use about the same amount of energy as a number 5, butwe can't sell them on the basis of the label (Thai sales interview no. 9).
Another salesman, employed by a distributor of imported refrigerators, uses the energy efficiency ofhis imported refrigerators as a selling point, but finds himself at a disadvantage because the energy labelshave not yet been approved for models with more than one door.
People come in looking at the large refrigerators and ask, “Why isn't there one with anumber 5 label?” So I have to explain to them, before I tell them anything about theproduct. Because if I say that this unit doesn't use much energy before they know thereason, the customer won't necessarily believe what I say (Thai sales interview no. 10).
This points out a problem with the Thai scheme of rating models from 1 to 5, compared to using localcurrency (i.e. baht or dollars) as the primary rating. It does not distinguish between efficiency andoverall resource use. Once EGAT expands its labeling to cover large refrigerators, a large, multi-doorrefrigerator could be rated at 5 because it is more efficient than other large models. But this model mightnot be efficient in the Thai context — that is, it would use a lot more energy than a more traditional,single-door refrigerator to cool food. With a numerical rating system geared to categories, there is noway for consumers to quickly and easily compare the energy use of different-sized. While it istheoretically possible for consumers to do this by looking at the annual operating cost (baht per year), ourinterviews with customers showed that only 16% read the label in any level of detail.
Role of the Environment
A final set of questions had to do with the linkage between the production and use of appliances and theenvironment. In neither country was energy use widely seen as being linked to the environment. In theU.S., the focus was on the CFC substitutes being used in refrigerator-freezers and the opportunity thatthis presented to sell extended service plans. In Thailand, CFCs were a salient issue because of theextensive advertising on this topic by refrigerator manufacturers.
In the U.S.: “CFC-Free” as a Sales Tool for Service Protection

5-33
In the U.S., environmental regulations required the shift away from CFCs in all refrigerators andrefrigerator-freezers as of January 1, 1996. The U.S. salespeople with whom I spoke said that while CFCshad been an issue of considerable consumer interest during 1994 and 1995, it was much less of an issuewhen I conducted my interviews in late 1996 and early 1997. As one salesman remarked, “Two yearsago, this was the first thing out of their mouths, ‘Is this CFC-free?’ Of course, it was hitting the papers, itwas hitting the news, everybody was reading about it. Now, I’ll be honest with you, it still comes up, butit’s like in passing” (U.S. sales interview no. 1).
The more interesting finding from my discussions with U.S. salespeople was that many of them wereusing the issue as a selling point for their extended service plans. (As mentioned earlier, sellingmultiyear service plans for white goods is a major source of income for the salespeople I interviewed.)Their basic argument to their customers is that since the new CFC substitutes do not have a track recordas far as longevity and repair, it is in the customer’s best interest to purchase an extended service plan tocover repairs to their refrigerator that may be necessary if the new refrigerant causes a breakdown ormalfunction in future years. Here is a sample of their reasoning:
I bring up the freon versus the R134a because that’s very important, and because theR134a does not have a proven track record, it could be a costly expense to you down theroad (U.S. sales interview no. 3).
I usually bring it [the environment] up, but for different reasons. I bring it up becauseit’s part of my, it’s preliminary to my service pitch. Because I tell them this refrigeranthas only been on the market for two years, so it has a very small track record. And freonwas on the market for 80 years, and that usually helps me close service. That's the onlycontext I ever bring it up in (U.S. sales interview no. 8).
Some people ask about it [CFCs]. I usually volunteer the information, too, as aselling point and making the link to ozone. Our service plan will protect you from theextra cost of recharging the new refrigerant (U.S. sales interview no. 9).
Viewed in the context of the retailers’ motivations, the use of CFC substitutes as a tool to sell serviceplans makes sense. As a purely environmental issue, “CFC-free” is no longer a selling point in the U.S.,because all refrigerator-freezers are now required to use CFC substitutes. Thus, for a refrigerator to beCFC-free is no longer a distinguishing attribute. However, retailers make a large margin on the sale oftheir extended service plans, and thus any possible reason they can offer the customer to invest in themulti-year service plan is to the benefit of both the company and the individual salesperson.
This practice of using the switch to CFC substitutes as a way of selling service was not an officialpolicy at any of the stores I visited. Neither was it endorsed by any of the corporate managers whom Iinterviewed. In fact, one of the corporate managers, when told of this strategy, was surprised and replied,“That's not a very positive thing to sell something to someone and then to say that it may not work verywell” (U.S. sales interview no. 12). He felt there was something perverse about selling a new productand then claiming that there is a problem with the product and using that as the rationale for needing anextended warranty. When I tried making this criticism to salespeople, they asserted that it was not afaulty product, but rather the by-product of a new government policy, and that there really was legitimateconcern about the longevity of the CFC-free substitutes.

5-34
In Thailand: An Urban/Rural Divide
Nearly all of the Thai salespeople whom we interviewed were aware of CFCs, and 83% mentionedCFCs when they were asked the question, “Does buying an appliance affect the environment?” Anumber of the salespeople said that CFCs were a very popular topic with customers and that theextensive television advertising on this topic by manufacturers had been effective. A typical responsefrom a Bangkok salesperson was: “We don't have to bring it [CFCs] up. They [customers] often specifya model that is CFC-free. If there is a model that isn't CFC-free, they might tend not to buy it. Theadvertisements on this topic have been very effective” (Thai sales interview no. 13). Another Bangkokretailer, when asked about the link between appliances and the environment, replied, “These days, thereare two things, CFC-free and new, energy-saving appliances” (Thai sales interview no. 8).
Upcountry, there was less familiarity with CFCs and, especially in the rural districts we visited,salespeople said that many of their customers weren’t familiar with CFCs or why they might pose a threatto the environment. Those salespeople who claimed to use the CFC issue as a selling point said that,while customers may have seen the ads on TV, “The farmers and people around here have a difficult timegrasping what the problem is” (Thai sales interview no. 32).
The majority of salespeople tended to associate CFCs more with global warming than with ozonedepletion. While CFCs are in fact a greenhouse gas, they are of greatest concern because of their effecton stratospheric ozone depletion. We asked about 15 of the Thai salespeople to explain what impactCFCs had on the environment. The most common response was that CFCs cause global warming. Only asmall minority were able to clearly state CFCs’ impact on the ozone layer, and a few mentioned thatCFCs did something to damage the atmosphere. Several of the salesmen clearly had no idea, such as theone salesman who said that CFCs was a chemical that controls odors, and another who tentativelyguessed that it affected the atmosphere by “making it less pure” (Thai sales interviews nos. 26 and 27).
Another issue raised in our discussion of the environment with Thai retailers was a lack of commonunderstanding of the meaning of the word “environment.” A Bangkok salesman (no. 15) responded byciting the local impacts of the appliances, such as the heat given off by the condensing units, which hestated was more of a problem in the city than in the country. But our questions about the environment,when posed to upcountry and rural retailers, were much less likely to yield responses touching on theimpact of CFCs or pollution from power plants. Often, the “environmental” impacts of appliances wereseen in terms of the direct effect on a consumer’s lifestyle or residence. A Khorat salesman said, “I don'tknow what [environmental] effects it [the appliance] has. I know that if you use an air conditioner, thedirty water leaks outside the building. And there is dust from the air conditioner, when you clean it”(Thai sales interview no. 39).
Conclusions
A commonly voiced theme in our interviews with salespeople was the need to strike a balancebetween serving the customer’s needs and selling the products that make the store (and the salesman) asmuch money as possible. At the same time, we found a strong level of confidence among salespeople inboth countries that they could influence the purchasing decisions of the majority of customers.
The primary incentive for salespeople who work on commission (all of the U.S. sample and morethan half of the Thai sample) is to sell products that have a higher retail price and thus generate morecommission. The vocabulary used by salespeople illustrates the focus on “stepping” customers up tomodels with additional features and to selling “push” pieces (i.e. models that make more profit) ratherthan “A.D.V.” pieces (advertised models, which make little profit). None of the incentives that I observed

5-35
in the U.S. appeared to be related to energy efficiency. In fact, the incentives motivate salespeople to“step up” customers and influence them to purchaser larger products with additional features that usemore energy. In the U.S. an additional incentive is for salespeople to sell extended service plans, whichcan double what they earn on the sale of a specific product. In Thailand, because many of thesalespeople are employed by a brand distributor rather than the retail store, there is also a strongincentive to sell models produced by a particular manufacturer.
The sale of energy-efficient products appears to motivate neither the stores nor their salespeoplebecause of the low value-added of energy efficiency as a feature. Energy efficiency can be added to aproduct, but it is often invisible to the consumer and difficult to sell. According to a corporate managerof a U.S. appliance retail chain, good features have a margin of 10:1, meaning that manufacturers cancharge an extra $10 at retail for $1 worth of feature. The margin on energy efficiency improvements ismuch less than this.
As reported by salespeople, energy efficiency was a significantly higher consumer priority inThailand than in the U.S. In Thailand, the top reported priorities were brand, efficiency, size, and price.Half of the Thai salespeople reported that energy efficiency was a top-three consumer priority. U.S.salespeople reported that the top consumer priorities were reported to be features, price, and size. Only 1in 14 U.S. salespeople reported that energy efficiency was a top-three priority.
In Thailand, energy efficiency was discussed by the majority of salespeople as an important andtangible criteria, clearly communicated via the number 5 label. In contrast, in the U.S., the quality orproperty of being “energy-efficient” was often not clear to either the customer or the salesperson and wasdescribed by one U.S. consumer as a “gray area.” A comparison of my interviews with U.S and Thaisalespeople led me to hypothesize that the Thai energy labels were more salient, at least in part, becausethey provide a simpler metric that is both easier for the salesperson to explain and for the customer tounderstand.
Energy efficiency is more actively used as a selling point by Thai appliance retailers than by U.S.retailers. More than three quarters (80%) of Thai salespeople said that they use energy efficiency as aselling point, compared to just over half (54%) of U.S. salespeople. In addition, Thai salespeoplereported greater consumer interest in the energy label. On average, Thai salespeople stated that 62% ofconsumers asked about or looked at the label, compared with a reported average of just 21% of U.S.consumers.
In Thailand, there is a high level of consumer interest in the energy label due to the large, nationwidetelevision advertising campaign, and it appears that the energy label is being used as a pre-screeningdevice by a large percentage of consumers. In contrast, in the U.S. appliance stores I visited, the labelplays a negligible role in most transactions; however, a small number of salespeople report using energyefficiency as a “tie breaker,” to help consumers choose between two otherwise equally attractive models.
In my discussions with salespeople in both countries, it became apparent how little time customers ineither country actually spend deciphering the label. Given the time constraints on the sale; the need forthe salesperson to establish a rapport with the customer, talk about the many attributes of the productsand the stores, and discuss financing and service arrangements; and the pressure on the salesperson tokeep the customer’s attention, they have little time to spend explaining the fine print and technical detailson the appliance labels. The U.S. salesmen whom I interviewed uniformly said that few customersbother to look at the label and those who do have a hard time understanding it. Thai salesman reportedthat customers usually only understand whether a unit has a 4 or a 5 rating, and they are content with thatlevel of information.
Finally, I asked salespeople about the linkage between the production and use of appliances and theenvironment. In neither country was energy use widely seen as being linked to the environment. In theU.S., the focus was on the CFC substitutes being used in refrigerator-freezers and the opportunity that

5-36
this presented to sell extended service plans. In Thailand, CFCs were a salient issue because of theextensive advertising on this topic by refrigerator manufacturers.

6-1
CHAPTER 6
APPLIANCE CONSUMERS
Chapter Abstract
This chapter reports the results of interviews with 100 consumers in the U.S., 62 consumers inThailand, and a survey of 971 consumers in Thailand. The topics covered include consumer informationsearch, consumer priorities, salience of energy efficiency, awareness of the energy labels, perceptions ofthe role of government, and the relationship between purchasing an appliance and the environment.Energy efficiency is a significantly higher consumer priority in Thailand than in the U.S. This supportsthe findings from the interviews with salespeople, which suggested that energy efficiency was being usedas a screening tool by Thai consumers in the purchase of refrigerators and air conditioners. I also findevidence to support the theory that the consumer decision-making process has multiple stages, and that ifenergy efficiency can potentially be used as a selling point in any of the stages, it can have an impact onthe purchase decision. Finally, I find the environment to be a more salient factor in discussions withThai consumers than with U.S. consumers.
Introduction
This chapter focuses on understanding the attitudes and behavior of appliance purchasers. Itcompares data from participant observation, unstructured and semi-structured interviews, and surveys inan attempt to answer these questions: What role do energy efficiency and other environmentalconsiderations play in the purchase of a home appliance?, How effective are the existing energy labelingprograms?, and What factors might influence a consumer to purchase a more energy-efficient appliance?
Overview of Interview and Survey Samples
I conducted semi-structured interviews with 100 U.S. consumers at four appliance stores in NewJersey and Delaware in March, November and December 1996 and January 1997. I also conductedparticipant observation in December 1996 by working for two weeks as a sales trainee at a New Jerseybranch of the regional appliance chain that I here call Acme Appliance. I closely observed 25 salesduring this time period, and the experience provided me with insights that were helpful in interpreting theresults of the consumer interviews. The methodology is discussed in Chapter 3. Table 0.1 summarizesthe demographic data on the sample of U.S. consumers interviewed.
Slightly more than half (55%) the respondents were males, and the remainder were either females(18%) or couples shopping jointly (27%). The average age of the respondents was 45, and the averageeducational level was three years of college (15 years of schooling). The sample had a higher income
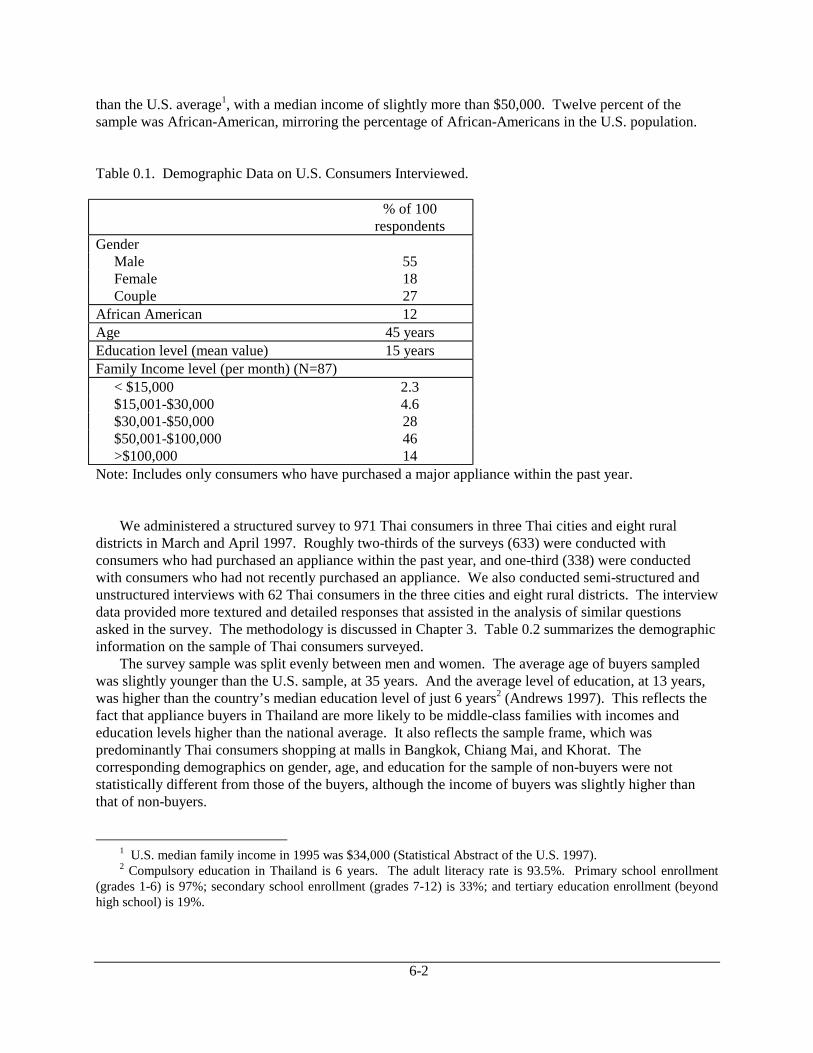
6-2
than the U.S. average1, with a median income of slightly more than $50,000. Twelve percent of thesample was African-American, mirroring the percentage of African-Americans in the U.S. population.
Table 0.1. Demographic Data on U.S. Consumers Interviewed.
% of 100respondents
Gender Male 55 Female 18 Couple 27African American 12Age 45 yearsEducation level (mean value) 15 yearsFamily Income level (per month) (N=87) < $15,000 2.3 $15,001-$30,000 4.6 $30,001-$50,000 28 $50,001-$100,000 46 >$100,000 14Note: Includes only consumers who have purchased a major appliance within the past year.
We administered a structured survey to 971 Thai consumers in three Thai cities and eight ruraldistricts in March and April 1997. Roughly two-thirds of the surveys (633) were conducted withconsumers who had purchased an appliance within the past year, and one-third (338) were conductedwith consumers who had not recently purchased an appliance. We also conducted semi-structured andunstructured interviews with 62 Thai consumers in the three cities and eight rural districts. The interviewdata provided more textured and detailed responses that assisted in the analysis of similar questionsasked in the survey. The methodology is discussed in Chapter 3. Table 0.2 summarizes the demographicinformation on the sample of Thai consumers surveyed.
The survey sample was split evenly between men and women. The average age of buyers sampledwas slightly younger than the U.S. sample, at 35 years. And the average level of education, at 13 years,was higher than the country’s median education level of just 6 years2 (Andrews 1997). This reflects thefact that appliance buyers in Thailand are more likely to be middle-class families with incomes andeducation levels higher than the national average. It also reflects the sample frame, which waspredominantly Thai consumers shopping at malls in Bangkok, Chiang Mai, and Khorat. Thecorresponding demographics on gender, age, and education for the sample of non-buyers were notstatistically different from those of the buyers, although the income of buyers was slightly higher thanthat of non-buyers.
1 U.S. median family income in 1995 was $34,000 (Statistical Abstract of the U.S. 1997).2 Compulsory education in Thailand is 6 years. The adult literacy rate is 93.5%. Primary school enrollment
(grades 1-6) is 97%; secondary school enrollment (grades 7-12) is 33%; and tertiary education enrollment (beyondhigh school) is 19%.

6-3
Table 0.2. Demographic Data on Thai Consumers Surveyed.
BuyersN=633
(%)
Non-BuyersN=338
(%)Gender Male 51 51 Female 49 49Age (mean value) 39 years 37 yearsLevel of education (mean value) 13 years 12 yearsLocation of interview Bangkok 48 29 Chiang Mai 23 31 Khorat 29 41Interview in rural or urban district? Urban 91 78 Rural 8.8 23Home location In district area (urban) 83 65 Outside district area (rural) 17 35Family income level (per month) <B10,000 (<US$400) 10 22 B10,001-20,000 (US$401-800) 25 31 B20,001-30,000 (US$800-1,200) 37 29 B30,001-50,000 (US$1,200-2,000) 20 13 B50,001-70,000 (US$2,001-2,800) 6.8 4.5 >70,000 (>US$2,800) 1.4 0.9Number of people in home (mean value) 4.0 people 3.9 people
Half of the buyers sampled were from Bangkok (48%), and roughly one-quarter each were fromChiang Mai and Khorat (23% and 29%, respectively). The sample of non-buyers had fewer Bangkokrespondents and was more weighted toward Khorat.
The samples were biased toward urban areas and represent a higher proportion of urban residentsthan the Thai population as a whole. Ninety-one percent of the interviews were conducted in eitherBangok, Chiang Mai, or Khorat. The remaining 9% of interviews were conducted in the eight ruraldistricts that we visited. The proportion of urban interviews was slightly higher for buyers than non-buyers (78%).
The heading of “home location” is an indicator of how close the respondents live to a governmentdistrict office and is a better indicator than interview location of whether a respondent is from the city orfrom a rural area. The Thai government is organized into provinces, which are somewhat similar tostates in the U.S. and have a governor (although in the case of Thailand, the governor is appointed by theMinister of Interior). Within each province, there are a number of districts, and many of them are quiterural. Within each district, there are sub-districts and then villages. The data on home location indicatesthat among the buyers we sampled, 17% lived in rural areas, whereas among non-buyers, 35% lived in

6-4
rural areas. According to 1993 census data, 31 % of Thailand’s population lives in urban areas and 69%live in rural areas (Mahidol University 1993).
For buyers, the median income level was between 20,000 and 30,000 baht (US$800 and 1,200) permonth. For non-buyers, it was slightly below 20,000 per month.3 The lower income level of non-buyersreflects the fact that the sample of non-buyers had fewer Bangkok residents and more from Khorat.Finally, the average number of people per home (~4) was statistically similar between buyers and non-buyers.
Comparisons between the U.S. and Thailand
What Appliances They Purchased
In the U.S., the EnergyGuide labels are affixed to the following home appliances: refrigerators andrefrigerator-freezers, freezers, water heaters, dishwashers, clothes washers, room and central airconditioners, and furnaces (FTC 1979). In Thailand, the voluntary labeling program applies only to twoclasses of home appliance: single-door refrigerators and room air conditioners with capacity smaller than13,000 Btu/hr. Table 0.3 shows the appliances purchased within the past year by the consumers whomwe sampled. In the U.S., the primary appliance purchased was refrigerator-freezers (44%), followed bystoves (27%), clothes washers (26%) and clothes dryers (25%). In Thailand, I only interviewedconsumers who had purchased either a refrigerator or an air conditioner within the past year; 58% hadpurchased a refrigerator and 44% had purchased an air conditioner.
Table 0.3. Appliances Purchased within the Past Year
U.S. ThailandAppliance purchased % of 98
respondents% of 633
respondentsRefrigerator/refrigerator-freezer 44 58Stove/range 27Clothes washer 26Clothes dryer 25Air conditioner 14 44Dishwasher 12Water heater 2Other appliance 5Note: column totals exceed 100% because of multiple appliance purchases
Nearly all of the respondents purchased an appliance that displays an energy label. In the U.S, allappliances sampled except stoves and clothes dryers have EnergyGuide labels (Table 2.3 lists appliancescovered under the U.S. labeling rule). In Thailand, we sampled recent purchasers of refrigerators and airconditioners, which are the only Thai appliances with energy labels.
3 Average family income in Thailand is about US$940 per month. This is based on per-capita GDP ofUS$2,830 (1995) and average family size of 4 people.

6-5
Who Made the Purchase Decision?
In the U.S., nearly two-thirds (62%) of respondents reported that they made a decision jointly withtheir partner, and slightly more than one-third (36%) reported that they made the decision themselves(see Table 0.4). In Thailand, fewer than one-quarter (23%) said they made a joint decision, half (51%)said they made the decision themselves, and one-quarter (23%) said their partner made the decision. Inthe U.S., 27% of the U.S. respondents were couples, while none of the Thai respondents were couples.This reflects a slight difference in methodology between the U.S. and Thailand: when I conducted myU.S. interviews, I would enter the respondents as being a couple as long as the partner participatedminimally in the interview; in Thailand, the survey team noted the gender of the respondent (male orfemale) who took the primary role in the interview.
Table 0.4. Who Made the Appliance Purchase Decision?
Who made purchase decision? United States(% of 98 responses)
Thailand(% of 419responses)
Jointly with partner 62 23Respondent 36 51Partner 2 23Other 0 3
Why They Bought the Appliance
Table 0.5 compares reported reasons for purchasing a new appliance from two different studies. Thefirst column shows data from a national appliance survey in the U.S. conducted by the Association ofHome Appliance Manufacturers. The second column shows data from my interviews with 100 recentappliance buyers in Delaware and New Jersey. The third column shows data from my survey of recentappliance buyers in Thailand.
According to the AHAM survey of 8,740 purchasers of all types of major appliance (AHAM 1996A),the most common reason for purchasing a new home appliance in the U.S. is “new home” (peoplemoving into a new home). This is followed by “broken” (an appliance breaking down or requiring costlyrepairs) and then by “update model” (purchasing a more modern, updated model). The results for asubsample from that survey of 1,956 purchasers of refrigerators are shown in the first column of Table0.5.
My own much smaller sample of 89 consumers in New Jersey and Delaware has a slightly differentbreakdown of responses than the AHAM survey. The most common reason for buying a new appliancewas “broken,” which was the second most common reason on the AHAM survey. This was followed by“new home” (moving into a new home) and then “remodeling.”

6-6
Table 0.5. Reasons for Purchasing the Appliance
Why did you buy theappliance?
United StatesAHAM Surveya
Full-Size Refrigerators(% of 1,956 responses)
United StatesThis Study(% of 89
responses)
ThailandThis Study(% of 419responses)
Broken 31 41 23New home 41 16 4Remodeling 5 10 7Update model 24 8 13First-Time appliance 0 6 31Other reason 4 8 4
a Data from national survey by Association of Home Appliance Manufacturers (AHAM 1996A: 32)
While the Thai results also show that “broken” is an important reason for purchasing a newappliance, it was only the second most important reason. The most important reason was “first-timeappliance” (consumers making a first-time purchase of an appliance). This difference reflects the relativeimmaturity of the Thai appliance market and the fact that (with the exception of refrigerators in Bangkok)there is not yet full saturation for most household appliances (the saturation of appliances in Thailand isdiscussed in detail in Appendix B). Another difference between the Thai and U.S. responses is the muchsmaller role of “new home” in an appliance purchase. This probably reflects the fact that Thais moveless often than do people in the U.S. and that, even after they leave school and enter the work force, manyyoung Thais continue to live with their parents.
Pre-Store Information Search
Similar percentages of U.S. and Thai consumers indicated that they conducted some sort ofinformation search before they went to buy the appliance at the store: 60% in the U.S. and 67% inThailand (see Table 0.6). The two primary information sources in the U.S. were newspapers (30%) andConsumer Reports articles (28%), followed by friends (19%). In Thailand, the biggest informationsource was television (37%); in contrast, not one U.S. respondent indicated that they had gotteninformation from television. Other important information sources in Thailand were brochures (30%) andfriends (29%). Brochures are a very common way of marketing the convenience features of homeappliances in Thailand; they are widely available at stores and are often distributed in rural districts bysales representatives.
Market studies conducted for Acme Appliance have ranked the importance of newspapers, television,direct mail, and radio in order to direct the firm’s advertising efforts. Table 0.7 shows the results of theirsurveys of ~1,100 appliance consumers in the northeastern U.S. in 1989, 1992, and 1996. The resultsindicate that tabloid inserts and circulars are the most widely seen form of advertising, followed bytelevision and direct mail.
At the same time, the market studies also show that newspaper inserts were less important in 1996than in 1989, while the influence of direct mail was larger. In my unprompted question aboutinformation sources, not one of the 100 respondents mentioned television; in contrast, roughly one-thirdof those surveyed in the retail chain’s studies (28-32%) reported that television ads most influenced theirdecision, and 38% said they looked at television ads before shopping. The difference likely has much to

6-7
do with the survey methodology; I believe that television is a less important medium than indicated inthese market research studies, since not one of the 100 consumers whom I interviewed mentionedtelevision as an information source.
Table 0.6. Sources of Information Before Entering Store
Did you search for information before youwent to the store?
United States(% of 89 responses)
Thailand(% of 633responses)
No 40 33Yes 60 67 of which: Television 0 37 Newspaper 30 13 Consumer Reports 28 na Friends 19 29 Family 8 4 Brochures 0 30 Magazines 0 3 Other information source 7 2Average number of information sources 1.6 sources 1.2 sourcesAverage number of stores visited 2.4 stores 2.5 stores
Note: Percentage totals exceed 100% because of multiple responses from each person.
A comparison of the results on information search between the U.S. and Thailand indicate that inboth countries, a significant percentage of consumers (40% in the U.S. and 33% in Thailand) enter thestore having conducted virtually no prior information search. This fact underlines the importance ofproviding point-of-purchase information on energy efficiency as a part of labeling efforts intended topromote the purchase of energy-efficient appliances. In addition, it highlights the influential role of thesalesperson in the appliance purchase and the necessity of involving retailers as an integral part of anappliance labeling effort. The results also highlight differences in the importance of media in thepurchase. In Thailand, it appears that television plays a major role (through the national televisionadvertising campaign funded by the DSM Office), and that consumers rely heavily on word of mouth(friends) and brochures that they get from the stores or in the mail. In the U.S., consumers report thatthey rely heavily on articles in the magazine Consumer Reports, as well as advertising circularsdistributed in the local newspapers. Market research data from Acme Appliance suggests that televisionand direct mail are an important source of reaching appliance purchasers, but I discount these sourcesbased on the lack of reference to them by consumers whom I interviewed.
Consumer Priorities
The question of consumer priorities is critical to an understanding of how and whether to marketenergy efficiency. If, for example, energy efficiency is among the top priorities, then it will likely be
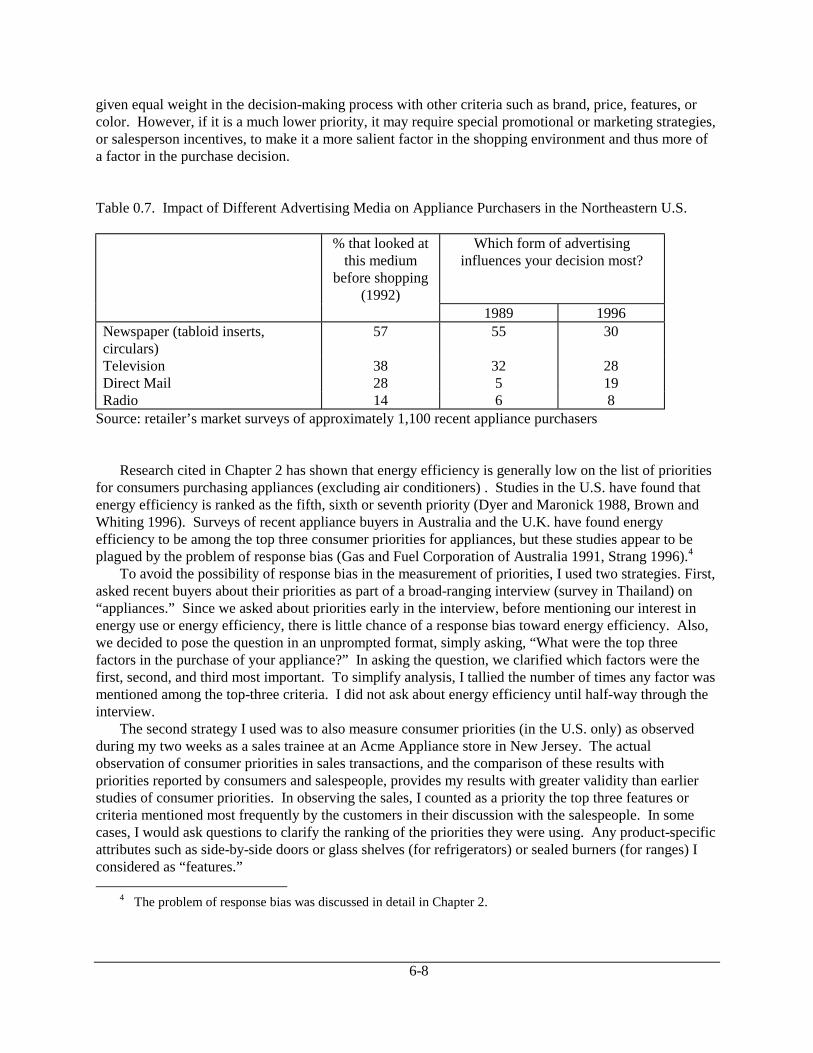
6-8
given equal weight in the decision-making process with other criteria such as brand, price, features, orcolor. However, if it is a much lower priority, it may require special promotional or marketing strategies,or salesperson incentives, to make it a more salient factor in the shopping environment and thus more ofa factor in the purchase decision.
Table 0.7. Impact of Different Advertising Media on Appliance Purchasers in the Northeastern U.S.
% that looked atthis medium
before shopping(1992)
Which form of advertisinginfluences your decision most?
1989 1996Newspaper (tabloid inserts,circulars)
57 55 30
Television 38 32 28Direct Mail 28 5 19Radio 14 6 8
Source: retailer’s market surveys of approximately 1,100 recent appliance purchasers
Research cited in Chapter 2 has shown that energy efficiency is generally low on the list of prioritiesfor consumers purchasing appliances (excluding air conditioners) . Studies in the U.S. have found thatenergy efficiency is ranked as the fifth, sixth or seventh priority (Dyer and Maronick 1988, Brown andWhiting 1996). Surveys of recent appliance buyers in Australia and the U.K. have found energyefficiency to be among the top three consumer priorities for appliances, but these studies appear to beplagued by the problem of response bias (Gas and Fuel Corporation of Australia 1991, Strang 1996).4
To avoid the possibility of response bias in the measurement of priorities, I used two strategies. First,asked recent buyers about their priorities as part of a broad-ranging interview (survey in Thailand) on“appliances.” Since we asked about priorities early in the interview, before mentioning our interest inenergy use or energy efficiency, there is little chance of a response bias toward energy efficiency. Also,we decided to pose the question in an unprompted format, simply asking, “What were the top threefactors in the purchase of your appliance?” In asking the question, we clarified which factors were thefirst, second, and third most important. To simplify analysis, I tallied the number of times any factor wasmentioned among the top-three criteria. I did not ask about energy efficiency until half-way through theinterview.
The second strategy I used was to also measure consumer priorities (in the U.S. only) as observedduring my two weeks as a sales trainee at an Acme Appliance store in New Jersey. The actualobservation of consumer priorities in sales transactions, and the comparison of these results withpriorities reported by consumers and salespeople, provides my results with greater validity than earlierstudies of consumer priorities. In observing the sales, I counted as a priority the top three features orcriteria mentioned most frequently by the customers in their discussion with the salespeople. In somecases, I would ask questions to clarify the ranking of the priorities they were using. Any product-specificattributes such as side-by-side doors or glass shelves (for refrigerators) or sealed burners (for ranges) Iconsidered as “features.”
4 The problem of response bias was discussed in detail in Chapter 2.
6-9
Figure 0.1 compares U.S. consumer priorities using the two methods: self-reporting by consumersand participant observation. The basic order of priorities is similar in both cases: features and price arethe top-two priorities, followed by size, and then color. Energy efficiency ranks near the bottom of thelist using both techniques: it ranks seventh using participant observation and ninth using self-reporting byconsumers. The fact that both techniques produced data showing that energy efficiency was no higherthan the 6th priority indicates the challenge faced by U.S. policymakers who attempt to influenceconsumer energy behavior through energy labeling programs. This finding reinforces the results ofearlier studies in the U.S. and elsewhere which have found that energy labeling alone will have little orno impact on consumer appliance purchase behavior without an in-store “push” from salespeople(Redinger and Staelin 1991, BPA 1988, Ling and Wilhite 1992).
Figure 0.2 compares consumer priorities as measured in both countries using the same technique:self-reported priorities by consumers using an unprompted (or “free listing”) format. The emphasis onpriorities among U.S. and Thai consumers appears to be quite different. In both countries, price andquality were among the top four priorities. Brand name was also important in both countries, but appearsto be a much more important factor for Thai consumers (61%) than for U.S. consumers (31%). Weapplied the term “features” to any mention by consumers of a range of product-specific attributes relatingto the convenience or function of the appliance. These included factors such as side-by-side doors orglass shelves (for refrigerators) or sealed burners (for ranges). In the U.S., features were the secondhighest priority, after price, and were mentioned by 55% of consumers. In Thailand, features appearedsixth on the list of priorities, mentioned by just one-fifth (21%) of respondents. This likely reflects thefact that Thai refrigerators (and other appliances) are smaller, simpler, and have far fewer conveniencefeatures to distinguish one model from another than is the case in the U.S. For example, a typical U.S.consumer may want a side-by-side refrigerator with an ice-maker, through-the-door ice and water, glassshelves, sealed and humidity-controlled crispers, and gallon-jug containers in the doors. Most of thesefeatures are simply not available on the 4- to 6 cu. ft. models that dominate the Thai marketplace.
The size of the appliance was reported to be much more of a factor in the U.S. than in Thailand. Thedifference in the importance of appliance size (third in the U.S. at 41% versus tenth in Thailand at 6%)reflects the large size of U.S. appliances5 and their size relative to U.S. kitchens, which are cramped withcounters, cabinets, and other appliances, thus making the size and dimension of the appliance a criticalfactor. My interviews with U.S. consumers revealed that size is an important screening criterion forbecause the refrigerator or dishwasher must be able to fit through the doorway opening, or into theavailable space between counters. Since refrigerators in Thailand are much smaller, such considerationsare less of an issue, and consumers rarely mentioned size as a screening criterion in the Thai interviews.
In terms of consumer energy policy, the most important result from these consumer-reportedpriorities is that energy efficiency was not among the top-three criteria in either country. The resultsshow, however, that energy efficiency appears to be a significantly higher priority among Thaiconsumers buying refrigerators than among the sample of U.S. consumers I interviewed, who purchased arange of white goods, but primarily (48%) refrigerators. Energy efficiency was ranked in interviews asthe fifth overall priority for Thai consumers, but the fifth priority for U.S. consumers. More than one-quarter of Thai consumers ranked efficiency within their top-three priorities (28%), while only one in 10U.S. consumers (11%) ranked efficiency within their top-three priorities. The participant observation ofU.S. sales — a more reliable indicator of actual consumer priorities — showed that energy efficiencywas a top-three criteria in only one of 25 sales (4%). This strengthens my conclusion that energyefficiency is typically a much lower priority among U.S. appliance consumers than among Thai applianceconsumers.
5 The size of typical U.S. refrigerators (18-24 cu. ft.) is three to four times that of Thai refrigerators (4-6 cu. ft.).

6-10
92
63
80
55
32
41
24
19
16
5
8
31
4
11
4
3
0
37
0
13
0
13
0 20 40 60 80 100
U.S
. par
ticip
ant
obse
rvat
ion
U.S
. con
sum
ers
% listing factor in top-three criteria
energy efficiency ranked 7th
energy efficiency ranked 9th
price
price
features
features
size
size
color
color
other
other
brand
brand
finance
finance
quality
quality
guarantee
guarantee
delivery
delivery
Figure 0.1. U.S. Consumer Priorities as Measured by Participant Observation and by ConsumerEstimates. Based on participant observation of 25 appliance sales and interviews with 100 recentappliance purchasers in Delaware and New Jersey.

6-11
63
54
55
21
41
6
37
35
31
61
19
39
13
20
13
13
11
28
5
5
3
9
0 10 20 30 40 50 60 70
U.S
. con
sum
ers
Thai
con
sum
ers
% listing factor in top-three criteria
energy efficiency ranked 9th
efficiency ranked 5th
price
price
features
features
size
size
quality
quality
brand
brand
color
color
guarantee
guarantee
delivery
delivery
other
other
finance
finance
Figure 0.2. Comparison of U.S. and Thai Consumer Priorities. Based on interviews with 100 recentappliance purchasers in the U.S. (48% of whom bought refrigerators) and a survey of 366 recentrefrigerator purchasers in Thailand.
Multi-Stage Decision-Making
Bettman (1979) and Verplanken (cited in de Loor and Zeelenberg 1991) found that consumers shopfor appliances in a two-stage process: initially they screen all alternatives on just one or a few attributes.When the search continues, they select a smaller number of alternatives and compare these on all

6-12
available attributes. In my observation, it appears that the primary first-stage screening criteria beingused by consumers in the U.S. and Thailand are price, features, size, color, and brand.
Olshavsky (1973) distinguished a third phase in the appliance shopping process. During this finalstage, he found that consumers weighed the various non-product attributes (such as financing and serviceprotection) being offered by the store. In my assessment of consumer priorities, there also appears to bea second tier of decision criteria that are used during this final stage of the decision-making process.These criteria are listed less frequently among the top-three criteria, but in a number of cases are decisivein the purchase. They relate not to the actual product itself but, as Olshavsky suggested to the conditionsunder which the product is purchased: guarantee, financing, delivery and availability. In my participantobservation in the U.S., I noticed that these factors would often tilt the scale toward the purchase of aparticular model. For example, the same model might have been available at a nearby store, but with lessfavorable financing terms than at Acme Appliance. Or the customer would want a specific model ofrefrigerator in a specific color, and they would curtail the purchase and head to another store if theproduct were not available for immediate delivery by Acme Appliance. The implication of considering amore complex model in which energy is a two-stage or three-stage decision process is that it providesdifferent points at which energy efficiency, if it can be marketed effectively, can have an impact on thepurchase decision.
Salience of Energy Efficiency
Given that energy efficiency does not appear to be a top-three priority for the respondents in eithercountry, one wonders how familiar consumers are with energy efficiency and how salient a characteristicit might be when they are weighing options in the decision-making process. The results of my U.S.consumer interviews indicate that energy efficiency is not a very salient characteristic. Half of therespondents (48%) said they had no idea about energy efficiency, and 80% said they did not know theirelectricity rate (see Table 0.8). This latter result is particularly important, given the fact that the newU.S. EnergyGuide labels require consumers to know their electricity rate in order to calculate the annualcost of operating a home appliance in their area. In addition, most (80%) of the respondents said thatthey did not know the annual operating cost for the appliance that they had recently purchased.
Despite the professed lack of knowledge about energy efficiency and electricity rates, nine out of 10consumers (92%) said that they would be willing to pay more for an energy-efficient appliance. Whilethese types of “willingness to pay” questions typically give higher values than the decisions that peoplewill make in practice, this result indicates promise for potential marketing efforts aimed at “green” andenergy-efficient appliances.
We asked a different set of questions to assess the salience of energy efficiency in Thailand. Thequestions focused on peoples’ awareness of their electric bills and the relative contribution of eachparticular appliance. We did not ask whether consumers knew their electricity rate, since there isessentially a single residential rate for the entire country, and the single operating cost that is shown onthe Thai label reflects that rate. Therefore, it is not necessary for the consumer to know her electricityrate in order to know the energy cost datum needed in the appliance purchase decision — the operatingcost of the appliance. The results for these questions are shown in Table 0.9.

6-13
Table 0.8. Knowledge of Energy Efficiency among U.S. Consumers
Question %How much do you know about energy efficiency? (N=93) No idea 48 Some knowledge 44 Know a lot 8Do you know your electricity rate (in cents/kWh)? (N=64) Yes 20 No 80Do you know the appliance’s annual operating cost? (N=76) Yes 20 No 80Would you be willing to pay more for an appliance that is energy-efficient?(N=89) Yes 92 No 8
Virtually all Thai respondents (>98%) were able to provide estimates of their monthly electric bill.Not surprisingly, the mean estimated bill amounts were significantly higher in Bangkok than in the ruraldistricts. However, if one compares the monthly electric bill as a percentage of monthly income, it isroughly similar for both Bangkok and rural residents, between 3% and 4% of income.6
Table 0.9. Knowledge of Monthly Electric Bill and How Much Appliances Cost to Operate in Thailand
Recent appliance buyers(N=633)
Monthly electric bill Can provide estimate 99% Mean estimated value B627 (US$25) Range B100-5,000Refrigerator monthly operating costa
Can provide estimate 46% Mean estimated value B83 (US$3.30)Air conditioner monthly operating costb
Can provide estimate 45% Mean estimated value B263 (US$10.50)a This question was asked of all respondentsb This question was asked only of recent purchasers of an air conditionersNotes: 25 Thai baht (B25) = US$1
6 This rough estimate was arrived at by dividing the mean estimated electric bill for Bangkok respondents
(B1,093) by their median income (~B28,000); and by dividing the mean estimated electric bill rural respondents(B503) by their median income (~B15,000).

6-14
Table 0.9 also shows differences in reported awareness of the contribution that major appliancesmake to their total bill. For refrigerators, more than half (54%) of the Bangkok respondents were able toprovide an estimate of their monthly refrigerator bill, while fewer than one-third (31%) of rural residentswere able to do so. The difference in reported awareness was smaller (but still significant) for owners ofair conditioners: 45% of Bangkok respondents provided estimates, while only 38% of rural residentswere able to do so. In fact, it is surprising that such a high percentage of respondents are able to estimatehow much they think that their individual appliances cost to operate, since there has been no specific dataavailable on appliance operating costs until the advent of the refrigerator labeling program in late 1994and the air conditioner labeling program in early 1996.
To test the success of the label in educating consumers about appliance operating cost, I comparedknowledge of electric bills and appliance operating costs among consumers who had purchased anappliance within the past year. Since virtually none of the DSM program’s promotion media (television,radio, newspaper, brochures) includes specific information on the operating cost of appliances, anyincrease in awareness of appliance operating costs must be associated with consumer reading of theappliance energy label. The results, shown in Table 0.10, show only a small, statistically insignificantdifference between buyers and non-buyers, suggesting that the labels have not had a significant impact ineducating consumers about appliance energy costs. This finding is consistent with findings reported inChapter 7 that only 16% of Thai consumers read the labels closely (and thus are likely to read andremember the estimated annual operating cost).
Table 0.10. Knowledge of Monthly Electric Bill and How Much Appliances Cost to Operate, amongBuyers and Non-Buyers
Buyers(N=633)
Non-Buyers(N=338)
Monthly electric bill Can provide estimate 99% 99% Mean estimated value B944 B842Refrigerator monthly operating cost a
Can provide estimate 46% 43% Mean estimated value B83 B60Air conditioner monthly operating cost b
Can provide estimate 45% 37% Mean estimated value B263 B236a This question was asked of all respondentsb This question was asked only of respondents who own an air conditionerNotes: 25 Thai baht (B25) = US$1
Calculating Payback Time
As another indicator of the salience of energy efficiency, we asked consumers in both countrieswhether they would be willing to pay more for an energy-efficient appliance, and how they would

6-15
consider recouping their investments for slightly high-first-cost, energy-efficient models. U.S.consumers generally seemed more comfortable with the concept of payback time than Thai consumers.They were also more likely to discuss differences between models in terms of operating cost and savings.This is likely due to the fact that the U.S. appliance energy labels have operating cost as the primarymetric. In contrast, operating cost is in very small type on the Thai label, along with other technicalproduct details on the bottom half of the label.
In the U.S. The U.S. consumers were more sophisticated about calculating payback time than wasassumed by some of the U.S. policymakers whom we interviewed. I measured knowledge of paybackawareness by asking a series of questions intended to elucidate how a respondent would decide whetherto pay more for an energy-efficient unit. First, I asked whether consumers would pay more for a $600energy-efficient refrigerator, compared to a $500 standard-efficiency unit. (As I already noted in Table0.8, 92% responded yes.) Then I asked how they would decide whether it was worth spending the extrahundred dollars. Nearly half of the respondents (48%) articulated a quantitative payback methodology,and an additional one-third (35%) articulated a qualitative methodology. Only 17% were unable toarticulate a payback methodology (see Table 0.11).
Table 0.11. Payback Times for U.S. Consumers
Question % of 79 respondentsCan they articulate a payback methodology? (N=79) Yes, with quantitative response 48 Yes, with qualitative response 35 No 17Desired payback time (mean value) 4 years
This response, from a 49-year old accountant with an MBA, is fairly typical of the quantitativemethodology I observed:
How would you decide whether it was worth spending the extra 100 dollars?
Well, in that instance, depending on what the savings are, I would just multiply thesavings and say, look, in three years, we would save the, the initial outlay of funds wewould get back in two years or something.
OK, so two or three years would be acceptable? Where would your cutoff be?
Five years. I'd say that, just quickly (U.S. consumer interview no. 61).
Another consumer, a 42-year-old home health aide with a high-school degree, provided a typicalexample of a qualitative response. She said that she would be likely to pay more for energy-efficientappliances that she uses frequently, since they will be more likely to pay for themselves in savings.

6-16
How would you decide whether it was worth spending the extra 100 dollars?
Well, if I use it all the time it would be worth it. If I don't, like the dishwasher, Idon't use it all the time, so … it's the price range, and why should I go and spend 500dollars if I only use it maybe … and since we had it over a year, we just only used itthree times (U.S. consumer interview no. 85).
And finally, this couple, a college-educated insurance auditor and a housewife with a high-schooldegree, provides an example of a response that lacked any apparent methodology for computing payback.They did not appear interested in the numerical calculations involved with computing the value of energysavings.
And how would you decide whether to spend that extra 100 dollars or whatever itwas?
Mike: Gee, I don't know
Chris: Just decide to do it, I guess. Is that what you mean?
Yeah, would you do some sort of calculation, or how would you decide whether itwas worth it?
Mike: No, we wouldn't sit down and like figure out the numbers or anything.
Chris: We would just decide (U.S. consumer interview no. 58).
The responses on payback methodology indicate that, contrary to assumptions made bypolicymakers, roughly half of U.S. consumers are sophisticated enough to comfortably trade off first costand energy savings in the purchase of an appliance — if provided information in a format that is easilyunderstandable and where the calculation is facilitated for them, as I did in my question format.
In Thailand. In Thailand, we did not include a question parallel to the U.S. question of “how wouldyou decide whether it was worth paying the extra cost?” Our question simply asked, “If you pay morefor an energy-efficient appliance, in how many years would you like to get your money back?” Theresults are shown in Table 0.12. We found that 19% of consumers were unable to respond when askedthe length of time in which they would want to recoup their investment for a higher-first-cost, energy-efficient appliance. The ability to answer this question was significantly higher for Bangkok than forrural residents, and for men than for women. These differences indicate possible roles for education andgender in determining consumer ability to make trade-offs between first price and energy savings whenbuying an appliance. Bangkok residents reported a longer desired payback time than rural residents, andmales reported a shorter payback time than female respondents.

6-17
Table 0.12. Payback Times for Thai Consumers
Question Data by Location ofInterview
Data by Gender Data forEntire Sample
(N=633)Bangkok Rural Male Female
(%) (%) (%) (%) (%)Know how quickly theywant a payback? Yes 84 71 85 76 81 No 16 29 16 24 19Desired payback time(mean value)
6.7 years 3.6 years 4.6 years 5.5 years 5.0 years
In semi-structured interviews with Thai consumers, I found that operating cost was not a salientfactor. Discussions of efficiency tended to revolve around the numerical ranking on the label, and onlyrarely did respondents report comparing operating costs between units. Future research in this areashould focus on the practical issue of understanding how Thai consumers use the label, and shouldinclude questions such as “Do you use the label to decide whether it is worth buying a more efficientunit?” and “How would you decide whether it is worth paying more for an energy-efficient unit?”
Awareness of the Label
Awareness of an energy label is the first step in its effectiveness, and this awareness must befollowed by understanding and action. The only national survey of awareness of the U.S. labelingprogram was conducted in the early 1980s as part of the overall program evaluation (Dyer and Maronick1986). This survey found that three years after the initiation of the labeling program, in 1983, 58% ofrefrigerator buyers and 52% of washer purchasers were aware of the energy labels. In my own pre-testinterviews, conducted 13 years later in 1996, all of the consumers whom I interviewed were aware of theU.S. EnergyGuide label, and I did not include a question about label awareness in the interview protocol.
Thailand’s DSM programs began quite recently: a voluntary program to switch to manufacture ofenergy-efficient, thin-tube fluorescent lamps began in 1993, and the energy labeling program only beganin late 1994 for refrigerators and in early 1996 for air conditioners. I thus included in the Thai protocolseveral questions about awareness of the array of energy efficiency programs and the energy label inparticular. The purpose of these questions was to measure salience of these energy efficiency programsamong the general public and to see whether awareness was significantly different among buyers andnon-buyers.
Table 0.13 compares awareness of the major Thai energy efficiency programs between buyers andnon-buyers. The question was unprompted, so respondents had to be able to recall the name of eachprogram independently. The results indicate the tremendous effectiveness of the national advertising andawareness campaign for the labeling program: 78% of the respondents mentioned the labeling program.The next most well-known program was the thin-tube program for fluorescent lamps, which wasmentioned by nearly one-third (31%) of consumers surveyed. This was followed by advertisingcampaigns, which were mentioned by one-quarter (25%) of respondents. “Advertising campaigns” refers

6-18
to a number of television-based advertising campaigns, including advertisements done by the DSMOffice and another Thai agency, the National Energy Policy Office, to promote its “Join Together andDivide by 2 (ruam palang han 2) campaign to reduce resource and energy use. Buyers were had slightlyhigher awareness levels for the labeling program and the advertising campaigns, which were statisticallysignificant.
Table 0.13. Awareness of Thailand’s Energy Efficiency Programs among Buyers and Non-Buyers
Program Buyers(N=633)
Non-Buyers(N=338)
Total(N=971)
% % %Labeling program 82.6 71.0 78.6Thin-tube lamps 29.4 32.8 30.6Advertising campaigns 27.8 19.2 24.8Energy saving in buildings 15.3 10.7 13.7Energy saving in factories 1.6 1.8 1.6Other 3.3 2.1 2.9
Table 0.14 provides a more detailed look at consumer awareness of the Thai energy label. The firstlabel shows the response to a question about whether consumers were aware that there was an energylabel on appliances. (Note that the response rate to this specific question was slightly higher than theresponse to the broader question asked earlier of whether consumers were aware of the energy labelingprogram.) Nine of ten Thai consumers (91%) who had recently purchased an appliance reported thatthey were aware of the labeling program before they went to the store, and nearly all of these respondentsassociated the program with refrigerators. A smaller, but still high, percentage of respondents (68%)were aware that the labeling program also applied to air conditioners. The results also indicate that themass media campaign for the energy label has been effective among the general population, since 82% ofnon-buyers were also aware of the labeling program and knew that it covered refrigerators.
Table 0.14. Awareness of the Energy Label among Thai Consumers.
Buyers(% of 626)
Non Buyers(% of 338)
Total(N=964)
Aware of Label Aware 91.4 82.2 88.2 Not Aware 8.6 17.8 11.8Thought label was on refrigerators 89.1 80.5 86.7Thought label was on air conditioner 67.5 56.2 64.0Thought label was on other appliances 3.2 5.0 3.8

6-19
I also examined consumer understanding of the label by including a label comprehension test in myinterviews (as per Lave, Murtaugh, and de la Rocha 1984 and Rogoff 1984). These results are discussedin Chapter 7.
The Role of Government in Promoting Energy Efficiency
We asked a number of questions to assess consumers perceptions about the role of government inimplementing energy efficiency programs. Initially, we included these questions in the U.S. consumersinterviews after hearing some of the U.S. policymakers whom we interviewed argue vociferously thatminimum efficiency standards were an intrusion into the marketplace and were hurting consumers bylimiting product choice. We decided to ask a parallel set of questions in Thailand to gather informationon consumer views of the labeling program and the role of the government (and of EGAT, the state-owned electric generating utility) in promoting energy efficiency.
Minimum efficiency standards for appliances were an invisible policy to the majority of U.S.consumers whom we interviewed. Seven in ten consumers were unaware that minimum efficiencystandards even existed for appliances. Only 17% were aware of the federal standards, and 13% said theyhad assumed that some sort of standards existed, but were not sure (see Table 0.15).
Table 0.15. U.S. Consumers’ Views on the Role of Government
Question % of 100responses
Are you aware that there are national minimum efficiency standardsfor appliances? Yes, aware of standards 17 Assumed there were standards 13 Not aware of standards 70Are such standards an appropriate role for government? Yes 82 No 18Is requiring energy labels an appropriate role for government? Yes 98 No 2
We found broad support among consumers in both countries for a government role in promotingenergy efficiency. In the U.S., 82% of respondents said that minimum efficiency standards were anappropriate role, while nearly all of the respondents (98%) said that requiring the EnergyGuide labelswas an appropriate government role.
In Thailand, we asked buyers and non-buyers about their views on the government programs. Nearlyall of the respondents (98%) expressed support for the government’s role in the appliance labelingprogram, and three quarters (76%) expressed a desire to see the government do more to promote energyefficiency (see Table 0.16). These views were not sensitive to gender differences, but support for

6-20
additional government actions to promote energy efficiency was significantly lower in rural areas (64%)than in Bangkok 84%).
Table 0.16. Thai Consumers’ Views on Role of Government
Question Total(% of 971)
Is labeling program appropriate? (N=629) Yes 98 No 2Would you like to see government do more on energyefficiency? (N=629) Yes 76 No 15 Don’t know 9
In the U.S., the support for a strong government role in energy efficiency seemed to reflect a distrustof manufacturers and a desire to have comparative product information provided by a reliable source.One consumer responded that energy labeling “goes right up there with unit pricing for canned goods in agrocery store.” Here are two other typical responses, from a 37-year-old police office with two years ofcollege education, and then a 46-year-old attorney with a business degree and a masters in religion:
[The government should] Not so much set the standards, but at least have a — surefor safety purposes and efficiency wise, sure. Yeah, I mean, the manufacturers would bepushing out shit if there wasn't some standard for them to produce a product that wasreliability and within a certain range — you know what I mean, efficiency range. Peopleare looking for efficiency (U.S. consumer interview no. 50).
That's why I say it [standards and labeling]7 is the proper role of government. I'm nota big government person, you know, but this is the exact area where the governmentshould require that information be displayed in the appropriate manner that the averageperson can look at and make a reasonable decision. ‘Cause the marketplace won't requirethis. The marketplace won't reflect this anywhere in price or value or sales, and there'sno incentive to put it in here, so that's why government has to act on this. But there's noincentive in the system, from sales all the way to manufacturing, to inform the consumer(U.S. consumer interview no. 56).
Both of these respondents indicated an initial reluctance to have government intrude into too manyareas, and this distrust of government was a very common reaction among consumers we interviewed.
7 This respondent felt that both minimum efficiency standards and energy labeling were appropriategovernment activities.

6-21
Yet both also articulated their feeling that there is a market failure and that government plays animportant role in protecting consumers — against decisions by manufacturers to produce low-efficiencyequipment — by setting standards and providing clear product labeling and information.
The Thai respondents voiced similar sentiments and seemed highly supportive of a policy designed tohelp consumers save money on appliance operating costs. A 24-year-old Khorat native, who recentlyreceived his college degree in marketing, was clearly concerned about the environmental problems thatThailand is facing and felt that the government could play a critical role in providing unbiasedinformation and leading public campaigns on environmental causes.
Yes [the government energy efficiency programs are appropriate], how will villagesknow which ones will save energy? They don't take an interest in or study thisinformation. So the government has to prompt what is good … in my feeling, whateverthe government supports and advertises, I will use in my house. For example, on theenvironment, they are saying that we should use white cloth instead of died cloth, so weare trying to use undied cloth (Thai consumer interview no. 38).
Another respondent, a 36-year old management consultant with a bachelor’s degree in engineeringand an M.B.A. degree, voiced similarly strong support for a government role, but at the same timeexpressed reservations about the equity impacts of the air conditioner labeling program.
I totally agree with the [appliance energy labeling] program, because this campaignhelps people to see the big picture and that we should help save energy. The problem isthe difference in purchasing power. Most of the purchasing power is with the middleclass, and it is easier for them, say, to buy air conditioners with labels. But peoplewithout much money will buy the “no name” brands, which costs 10s of thousands ofbaht less (Thai consumer interview no. 8).
He is referring to the price differential between the top-tier of air conditioners (imported models andthe better domestic brands capable of achieving a 4 or 5 rating) and low-end air conditioners that herefers to as “no-name” brands. The price of a one-ton, high-end model ranges from approximatelyB25,000 to B40,000 (US$1,000-1,600), while a one-ton, low-end unit can sell for as low as B10-12,000(US$400-480) or less.8 He is concerned that the labeling program for air conditioners will do nothing tohelp the poorer consumers, especially villagers, who on the one hand, do not have enough money to paythe extra B10,000-20,000 first cost for an efficient unit and will, at the same time, be penalized withmuch higher energy bills for buying the cheaper unit.
Linkages with the Environment
The final section of the consumer interview protocol and survey examined the linkages betweenappliances and environmental issues. The goal of these questions was to elucidate the salience of the
8 These units are commonly referred to as Btu/per baht (B.T.U. tor baht) units, which means that they cost,
roughly, 1 baht per Btu of cooling power.

6-22
environment in the retail appliance market. Little research has been done in this area. In Chapter 2, Idiscussed Dunlap’s survey of environmental polling (1991) and the high percentage of Americans whoassociate themselves favorably with environmental issues. Dunlap poses the question as to how muchthe favorable public attitudes toward the environment translate into behaviors and actions. Initialresearch for the Energy Star Retail Labeling program in the U.S. found that the most effective in-storeappeal for promoting energy-efficient appliances was an emphasis on lower utility bills, followed byperformance, and then protecting the environment (DOE 1995). However, like other studies by energyresearchers, this study had problems with response bias, since the researchers “telegraphed” their primaryinterest in energy efficiency early in the interview.
In both countries, the respondents expressed a high level of concern for the environment: 66% of theU.S. respondents and 58% of the Thai respondents said that they were either very concerned or extremelyconcerned about the environment (see Table 0.17). However, for most of the U.S. respondents, this highlevel of concern did not factor into the appliance purchase decision. Only one-quarter of respondents(27%) said that their environmental concern did affect their purchase decision. When we asked whetherthe environment could affect the purchase decision, the positive response was slightly higher, at 37%.Unfortunately, we did not ask this question of Thai consumers, so we were not able to estimate thepercentage of Thai consumers for whom the environment did or could play a role in buying an appliance.
When asked more generally about the environment and appliances, we got very high response rates.Seventy-nine percent of the U.S. respondents said that they would consider other environmental factorsbesides energy use when buying an appliance. And 76% of Thai consumers said that buying and usingan appliance had an impact on the environment.
When consumers were asked to list the environmental impacts of appliances, CFCs and the ozonelayer had the highest response in the U.S. (37%), followed by pollution (16%), water use (11%), anddisposal (10%). In Thailand, pollution had the highest response (48%), followed by CFCs and the ozonelayer (44%), and water use (18%). Based on these results, it appears that the Thai respondents are moreinclined to link appliances to environment pollution. This may have to do with controversies in recentyears about the siting of large power plant projects (including dams and lignite-fired plants) and the veryhigh level of publicity that the issue of power generation has generated.
Despite the high level of concern for the environment shown in the above survey data, our interviewswith consumers in both countries left me with the impression that there is little linkage of theenvironment to appliance purchases, either as awareness or a stimulus to change behavior. The U.S.responses seemed to fall into two main categories. The majority of consumers appeared to see no link, orto have never really thought about the environment while buying an appliance. Ken, a 49-year oldelectric engineer, explained to me why the issue of the environment never occurred to him while he wasshopping for a dryer. His response, more thoughtful than most, explains the typical disconnect of mostconsumers between the appliance that they plug into the wall and the environment problems they readabout in magazines or newspapers or see on the evening news.
I don't think the average consumer necessarily looks that far into it, that far ahead, torealize that, uh, a common, ordinary household appliance has an effect — you knowsomething other than a heating system. The heating system, if not set up properly,belches exhaust fumes out of the chimney. You can see the results of that, you know it'sdoing something, but typically one doesn't think of refrigerators, and dryers, andappliances of that sort, dishwashers as having any real effect on the environment in oneway or another (U.S. consumer interview no. 98).

6-23
Table 0.17. The Relationship Between Appliances and the Environment for U.S. and Thai Consumers.
Question U.S.(% of 100responses)
Thailand(% of 633responses)
What is your level of environmental concern? (N=69) Not concerned 1 1 Somewhat concerned 33 41 Very concerned 51 52 Extremely concerned 15 6Did your concern for the environment affect yourpurchase? (N=89) Yes 27 na No 73 naCould your concern for the environment affect an appliancepurchase? (N=65) Yes 37 na No 63 naDoes buying an appliance affect the environment? Yes na 76 No na 24Are there environmental factors besides energy use that youwould consider when buying an appliance? (N=93) Yes 79 na No 21 naEnvironmental factors listed CFCs/ozone 37 44 Water use 11 18 Recyclability/re-usablity 7 0 Pollution 16 48 Disposal 10 0 Other factors 16 6
A smaller group of consumers said that they were very concerned about the environment, but didn'tfactor it into their purchase decision because they assumed that the government would set standards todeal with any environmental problems or impacts. One man, a 77-year-old retired prison worker,succinctly stated why the environment was not even on his radar screen when he shopped at theappliance store: “ Because, I would assume that anything we bought would probably be a littler betterthan what we got. That one’s twenty years old.” For him, the government has a role to protect theenvironment by increasing standards and improving the quality of products in order to limit theirenvironmental impact. Because government is taking care of this, he did not actively consider thiscriterion (the environment) when he shopped for an appliance.
I found the environment to be more salient with Thai consumers, who were more likely to either linkappliance usage to general environment pollution or to mention the impact of CFCs. I attribute the

6-24
higher salience of the environment to two factors: one is the fact that 1997 was the first year that CFCswere beginning to be widely phased out by Thai refrigerator manufacturers. As a result, most of the fivemanufacturers has budgeted extensive television advertising campaign touting their models as beingCFC-free The second factor has to do with the way the energy labeling program is being marketed.Unlike the U.S. labeling program, which has no advertising or promotional budget, the Thai program isone of the largest television advertising campaigns in the country. And the message that the Thai DSMOffice is broad and emphasizes the environmental aspects of energy saving: “save your money, save ourenergy, save the environment” (Ratanopas 1996). Yet despite the higher salience of the environmentamong Thai consumers, I found little evidence that it was being used by Thai consumers as a criterion intheir appliance purchases.
The linkage of environmental issues to appliances were much weaker for the Thai villagers weinterviewed. In fact, rural respondents tended to have an entirely different interpretation of the questionfrom what we intended. For most of these villagers, environmental problems such as water and airpollution, and traffic congestion are things they read about in the newspapers but do not experience intheir villages. The environment impacts that they link to appliances have to do with the improvementsoffered by the amenity of the appliance.
Yes. It [a refrigerator] definitely has to have an impact [on the environment]. If youhave a refrigerator, you don't have to go to the market every day. If you don't have arefrigerator, it’s difficult. There has to be a refrigerator to keep meat so it doesn’t spoil.When your children come back home, you have food to eat. The food doesn't spoil.Before, your food would spoil! (Thai consumer interview no. 45).
Like many other villagers we interviewed, the environmental linkage they make to appliances is abenefit: the fact that the refrigerator allows them to keep food longer, travel less frequently to market,and reduce spoilage. They are not cognizant of the environmental impacts associated with the productionof power to operate the appliance and would not appear to be susceptible to environmental marketingcampaigns.
Conclusions
Roughly two-thirds of both U.S. and Thai consumers indicated that they conducted some sort ofinformation search before going to the appliance store. U.S. consumers relied primarily on newspapersand Consumer Reports articles, as well as discussions with friends. In Thailand, the primary informationsource was reported to be television; in contrast, not one U.S. respondent indicated that they had gotteninformation from television. The key finding related to information search is that 30-40% of consumersin both countries had no information on their appliance options before entering the store. This supportsthe assertion of salespeople that they have significant influence over the appliance purchase decision in atleast half of sales (see Chapter 5). This finding also supports Beales’ (1981) conclusion that governmentagencies promoting energy efficiency need to realize that they are competing with retailers for theattention of the consumer.
The question of consumer priorities is critical to an understanding of how to market energyefficiency. My findings support previous research which has shown that energy use is not a high priorityduring the typical consumer’s decision-making process. This study is unique in that unlike any other

6-25
previous study, I used two techniques to assess consumer priorities: self-reporting by consumers andparticipant observation in the store environment. In the U.S., energy efficiency was among the lowest ofpurchase priorities and was a top-three purchase criteria in only about 10% of sales. In Thailand, whileenergy efficiency ranked just fifth on the list of priorities, it was mentioned by 28% of respondents asbeing among their top-three purchase criteria.
My observations support earlier findings that the consumer appliance purchase is a multi-stageprocess. It appears that the primary first-stage screening criteria being used by consumers in the U.S. andThailand are price, features, size, color, and brand. Remarkably, energy efficiency is also among thefirst-stage screening criteria for Thai consumers. There also appears to be a set of decision criteria thatare used during the final stage of the decision-making process. These criteria are listed less frequently byconsumers among the top-three criteria, but in a number of cases appear to be decisive in the purchase.They relate not to the actual product itself but to the conditions under which the product is purchased:guarantee, financing, delivery and availability. In my participant observation in the U.S., I noticed thatthese factors would often tilt the scale toward the purchase of a particular model. The implication ofconsidering a more complex model in which energy is a two-stage or three-stage decision process is thatit provides different points at which energy efficiency, if it can be marketed effectively, can have animpact on the purchase decision.
Just two years after the start of the Thai energy labeling program, nine out of ten Thai consumerswho recently purchased an appliance were aware of the labeling program and nearly all of theseassociated the program with refrigerators. This is much higher than the ~50-60% awareness rate thatDyer and Maronick (1988) found among U.S. appliance consumers in 1983, three years after theinitiation of the U.S. labeling program. These findings reflect the effectiveness of the national televisionadvertising campaign launched by the Thai DSM Office. The campaign has also been effective amongthe general population, since more than 80% of the non-buyers we surveyed were also aware of theappliance energy labeling program.
U.S. consumers generally seemed more comfortable with the concept of payback time than Thaiconsumers. They were also more likely to discuss differences between models in terms of operating costand savings. This is likely due to the fact that the U.S. appliance energy labels have operating cost as theprimary metric. In contrast, information on appliance operating cost is provide in very small type, alongwith other technical product details on the bottom half of the Thai label.
We found broad support among consumers in both countries for a government role in promotingenergy efficiency. In the U.S., four out of five respondents said that minimum efficiency standards werean appropriate role, while nearly all of the respondents said that requiring the EnergyGuide labels was anappropriate government role. In Thailand, nearly all of the respondents expressed support for thegovernment’s role in the appliance labeling program, and three quarters expressed a desire to see thegovernment do more to promote energy efficiency.
I found the environment more salient in my conversations with Thai consumers, who were morelikely than U.S. consumers to either link appliance usage to general environment pollution or to mentionthe impact of CFCs. I attribute the higher salience of the environment among Thai consumers to twofactors: one is the fact that 1997 was the first year that CFCs were beginning to be widely phased out byThai refrigerator manufacturers. The second factor has to do with the extensive national marketingcampaign to promote awareness about the program, and the fact that the campaign has a significantenvironmental message. Yet despite the higher salience of the environment among Thai consumers, Ifound little evidence that the environment was being used by either Thai or U.S. consumers as a criterionin their appliance purchases.

7-1
Chapter 7
UNDERSTANDING APPLIANCE ENERGY LABELS
Abstract
This chapter shifts from the macro level to the micro level to focus on consumer cognition of the U.S.and Thai appliance energy labels. Only a small minority of consumers in either country reported thatthey read the labels carefully, suggesting the need to provide a clear, simple message on the appliancelabel in large, bold font. In my tests of detailed label interpretation, the U.S. EnergyGuide label faredpoorly. Most respondents were able to interpret operating cost, but fewer than half were able tointerpret whether the label represented an efficient model. In contrast, the Thai label was significantlymore effective at assisting consumers to identify efficient models. A common response from consumersin both countries was that the labels were too detailed and not easy enough to read. Consumers oftenseemed overwhelmed by the technical nature of the information presented in the labels. Myrecommendation is to compartmentalize the detailed, technical, product information so that it does notimpede understanding of, and access to, the primary label information. This will assist the largemajority of consumers who might be interested in energy efficiency, but are not technically oriented.
Introduction
This research addresses for the first time appliance energy labels as a problem of cognition incontext. It reports the results of in-store tests of consumer understanding appliance energy labels. InChapter 2, I reviewed the previous literature on energy labels. Simple, non-cluttered designs have beenfound to be the most effective (Pirkey et al. 1982, BPA 1987, Carswell, Langel, and Borison 1989,Patterson 1991, de Loor and Zeelenberg 1991, Daamen, Weenig, and Zeelenberg 1992). Labels that haveonly text are much less effective than labels with graphic elements (Weenig and Maarleveld 1993).Researchers have also found that it is important for the label to have a primary message or themeconveyed with either a logo, or large, bold type that can be seen from a distance (Pirkey et al. 1982).They suggested that this primary theme should not be “masked” by extraneous product details (de Loorand Zeelenberg 1991).
There is evidence from one study that energy labels that use a categorical rating scheme are easier forconsumers to remember than are labels using a continuous scale (Weenig and Maarleveld 1993). Recentresearch conducted on energy-billing designs yielded the surprising result that distribution-type graphswere slightly easier for consumers to understand than bar graphs, suggesting that the bar graph used as ascale of relative energy use on the U.S. EnergyGuide label may not be an optimal design (Egan 1997).Research findings on the optimal metric for consumer comparisons of energy efficiency are divided. ACanadian study recommended energy use, expressed in kilowatt-hours, as the preferred metric forcomparing energy use; however the underlying data from the study did not support this recommendation,since kilowatt-hours were “unfamiliar or obscure” to the majority of respondents (Patterson 1991).
This chapter reports the results of an in-depth evaluation of consumer comprehension of the U.S. andThai energy labels. My broad-ranging interviews with consumers in both countries investigated how

7-2
consumers in fact read the labels, interpret the different elements, and draw conclusions from thisinformation for their purchase decision. This chapter evaluates label effectiveness, as measured by howeasily consumers can read, understand, and explain them. It begins with a discussion of how consumersread the labels.
Whether and How Consumers Read the Energy Labels
One of the first questions to ask in assessing the effectiveness of any product labeling program iswhether consumers actually look at and read the labels. I asked this question of salespeople andconsumers in both countries in an effort to develop a better estimate of how often the labels are actuallyread. U.S. salespeople reported than fewer than 20% of appliance shoppers look at or ask about the label.In Thailand, salespeople estimated that more than 60% of consumers would look at or ask about thelabel.
Consumers themselves reported paying greater attention to the labels. In the U.S., 71% respondedthat they looked at the label; the corresponding figure for Thailand was 76% (see Table Chapter 7 .1).However, only a small minority of consumers reported that they read the label carefully — 26% in theU.S. and 16% in Thailand. It appears that most consumers glance at the label briefly or read it inpassing, suggesting that there should be a clearly focused message on the label in large type that conveysone main idea. Any additional detail in small print must not clutter the label and thereby mask theprimary message (de Loor and Zeelenberg 1991). Only 16 to 26% of consumers read the label in detail,but these are the consumers most likely to use the label as a decision tool in their purchase.1
Table Chapter 7 .1. Percentage of Thai and U.S. Consumers Who Look at the Label.
Did You Look at the label when shopping? United States(N=73)
Thailand(N=425)
No, did not look at label 29 25Yes, looked at label, of which: 71 76 Yes, looked carefully 26 16 Yes, looked in passing 45 60
1 Pirkey et al. (1982) studied the design of the original U.S. Fuel Economy Label for automobiles and
discovered that consumers found the label confusing. They decided that it was important to clearly convey theconcept of “fuel economy information” to consumers using a large logo that would be visible from across the carshowroom floor. DOE revised the label with a large gas pump logo, and also incorporated two fuel economy ratings— one for city mileage and one for highway gas mileage — set in very large type. Despite these efforts to simplifythe label and provide a clear central message, the most recent evaluation of the Fuel Economy Label (completed in1990) revealed that many consumers and salespeople (percentage not quantified) thought that the label still“contained too much information and was confusing” (Hill and Larsen 1990).

7-3
Interpreting the Labels
In each country, I tested label comprehension by showing consumers the energy label and asking aseries of questions. The methodology is described in Chapter 3. My test of label comprehension wasmore rigorous in the U.S., and I did not use parallel methodologies in the two countries, so I cannotdirectly compare the results. In the U.S., I tested label comprehension by showing respondents samplelabels during a five-minute segment of a 15-minute in-store interview with 85 consumers. In Thailand, Iconducted a less rigorous comprehension test, but supplemented this with questions about labelawareness on the national survey of 971 Thai consumers. The U.S. results provide more insight into howconsumers interpret and understand the label, while the Thai results provide a larger sample of data abouthow the label is used in the shopping process.
Interpreting the U.S. Label
After conducting several initial interviews with U.S. consumers in March 1996, I realized that fewconsumers appeared to fully grasp the meaning of the yellow EnergyGuide labels, which are required bylaw to be posted on the front of seven categories of household appliances.2 To test consumer cognitionof the labels, I added a short section to the interview protocol in which I asked respondents to describe intheir own words the meaning of two sample EnergyGuide labels for refrigerators: the originalEnergyGuide label, which has been in use since 1980, and the revised EnergyGuide label, which wasintroduced in a 1994 ruling by the Federal Trade Commission (FTC 1994). Today, in U.S. appliancestores, there are both “old” and “new” labels, and eventually the “old” label will be phased out. Theactual EnergyGuide labels that I used in my in-store comprehension test are shown in Figure Chapter 7 .1and Figure Chapter 7 .2.
I began by showing consumers the old label and asking, “One of the things I’m doing is studying howeasy the energy labels are to understand. Can you tell me what’s going on here?” I followed this up byprompting the respondent to describe difficult aspects of the label. The methodology is described inChapter 3. This set of questions allowed me to measure the length of time it took the consumer tounderstand each label as well as the extent to which they were able to accurately interpret four differentaspects of information presented on the label: operating cost, efficiency, scale of energy use, and thetable showing operating costs at different energy prices (for the old label only). The results of the labelcomprehension test are shown in Table Chapter 7 .2.
Time. Since I taped the interviews, I could easily measure the elapsed time required forunderstanding. I set the following criterion: since there are a number of different label elements(operating cost, relative efficiency, energy usage, etc.), I counted the elapsed time until a respondent hadclearly shown that she understood (or thought she understood) the meaning of any two primary labelelements.
Early on in my experience as a sales trainee, one of the salesmen said to me that if a customer doesn’tunderstand something within about seven seconds, it’s too long and you will lose them. He said that thiswas the problem with the EnergyGuide labels; they take too long for the average consumer to read andunderstand. In my evaluation of label comprehension, neither label passed this salesman’s seven-secondtest. For the old label, the average time was 43 seconds and the range was from 5 seconds to as long as
2 The labeling rules have been laid out by the U.S. Federal Trade Commission (FTC 1979; FTC 1994).

7-4
113 seconds. For the new label, even with the learning effect, the average time was 32 seconds, and therange was from 11 seconds to 102 seconds.
Figure Chapter 7 .1. The “Old” EnergyGuide Label Used in Label Comprehension Test with U.S.Consumers.
Unfortunately, I tested the labels in a sequential manner, always showing customers the old labelfirst, followed by the new label. As a result, any direct comparisons of understanding would be invalid,since there would always be a tendency for consumers to more easily interpret the new label, afteralready having learned something from the experience of trying to interpret the old label first.3
3 After having performed this label comprehension test and analyzed the data, I concluded that if I do a similar
experiment in the future, I will alternate the label presentation (i.e. old followed by new, then new followed by old,and so one) to allow me to make direct comparisons of consumer comprehension between the two labels.

7-5
Figure Chapter 7 .2. The “New” EnergyGuide Label Used in Label Comprehension Test with U.S.Consumers.
All of the responses shown in Table Chapter 7 .2 indicate how much the respondent understood aftertaking as much time as she wanted. This was, on average, 30 to 40 seconds. In a store purchase with noparticipant observer, few consumers would be likely to spend this much time trying to understand themeaning of the label unless they were very interested. And we have seen from data presented in TableChapter 7 .1 that only ~16-26% of consumers report that they take the time to carefully read energylabels on appliances.
Operating Cost. Operating cost was the most salient characteristic of the U.S. labels. Fifty-ninepercent of respondents were able to correctly interpret the operating cost from looking at the old label.An additional 11% were able to interpret the operating cost with some prompting and 7% got the answerpartially correct (e.g., one woman realized that the scale showed operating costs but interpreted them tobe a range of operating costs for this appliance under different conditions). Nearly one-quarter ofrespondents (24%) were unable to use the old label to discern appliance operating costs at all. As onewould expect, the scores for the new label were slightly better: nearly two-thirds of the respondents(64%) could discern operating cost without any guidance. Only 13% were unable to discern operating

7-6
costs at all. In addition to the learning effect, there is another important reason for the highercomprehension of operating cost on the new label: unlike the old label, it has text clearly stating that thisfigure represents operating cost. It states specifically that “Refrigerators using more energy cost more tooperate. This model’s yearly operating cost is $___.”
One of the biggest flaws in the old label is the lack of clear labeling of the elements. This was borneout in discussions with consumers about the meaning of the large dollar figure on the label. Nearly one-third of the respondents (32%) thought that the dollar number referred to the amount that the consumerwould save each year, not the annual operating costs. Even after extensive prompting (to stimulate acloser look at the label and to get consumers to read the fine print more carefully), nearly one-quarter ofrespondents (24%) still believed that the label showed savings (see Table Chapter 7 .2).
This exchange with a 42-year-old librarian with a masters in library science shows the commontendency among consumers to initially mistake the large dollar amount at the top of the old label asannual savings, rather than operating cost:
Well, this — I'm assuming that it saves you 62 dollars a year. And it gives you theyearly cost … for different models, and how much kilowatts they cost, so …
OK, so what would the yearly cost of this be for you?
I guess it would be 62 dollars … It says “this model.”
And you just said that’s — when you started looking at it, you said you’re assumingthat’s how much you save per year.
But I guess it's not. I — I don't know.
Do you find this confusing?
Yeah (U.S. consumer interview no. 16).
In another case, the respondent, a 44-year old carpenter with a ninth-grade education, assumed thatthe whole purpose of the label is to show energy savings and, despite the small print saying “annualoperating cost” and “cost per year,” he assumed that both the large dollar amount at the top and the dollaramounts on the kWh-cost table represented the amount a consumer will save:
[long pause while he reads the label] …it tells you the size of the refrigerator, between a20.5 to 22.4 cubic feet. And then 62 dollars is — I don't understand. What's that,yearly? If that's yearly or not. And … and with this, this chart here it's 2 cents cost perhour on a kilowatt, and you save like 15 dollars a year. 12 cents up to 86 dollars.
So what's the 62?
I'm assuming the 62 is you save 62 dollars a year on electricity, if I'm not mistaken (U.S.consumer interview no. 100)

7-7
Table Chapter 7 .2. Detailed Interpretation of the U.S. EnergyGuide Labels.
Old Label(% of responses)
New Label(% of responses)
Time to understand at least 2 major facets of label (mean value) (N=76/73)
43 seconds 32 seconds
Correctly interpret operating cost? (N=85/75) Yes 59 64 Yes, with guidance 11 15 Partially correct 7.1 8.0 No 24 13 Correctly interpret whether unit is efficient?(N=77/75) Yes 42 55 Yes, with guidance 12 6.7 Partially correct 3.9 6.7 No 43 32 Correctly interpret meaning of scale? (N=82) Yes 33 53 Yes, with guidance 11 6.5 Partially correct 24 9.1 No 32 31 Correctly interpret meaning of table? (N=75) Yes 40 na Yes, with guidance 1.3 na Partially correct 16 na No 43 na Interpretation of scale (N=82/77) Scale refers just to this model 9.2 na Scale refers just to one brand 5.3 na Interpretation of table (N=75) Think table can be used to calculate hourly operating cost of unit in ¢/kWh
9.3 na
Think label shows annual savings: Just initially 8 na Throughout the interview 24 nana = question not applicable to new labelNotes: since the new label was always shown after the old label, one cannot directly compare the response rate timesbetween the two labels; the learning effect made it likely that consumers would respond more quickly and morecorrectly to the new label after they had seen the old label. Also, the number of respondents varied slightly for eachquestion because of the open-ended format of the comprehension test (i.e. a few respondents did not see or discusssome label elements). This might introduce a potential bias that could inflate the score, but only by a few percent (~<5%). “Yes with guidance” indicates that the respondent required some prompting before they were able to explaina facet of the table. “Partially correct” means that a respondent understood a facet, but not fully, such as concludingthat the scale showed relative energy use for one brand of models rather than for models of all brands within aparticular size range.

7-8
In a few cases, I was surprised that even people with very technical job experience and advanceddegrees could be so completely wrong in their interpretations of the label. The following respondent is a47-year-old marketing manager for a company that supplies electrical equipment for substations andpower plants. He has a bachelor’s degree in electrical engineering and a master’s in businessadministration:
Can you tell me what’s going on here, what the numbers mean [I point to the old label]?
I had a problem with that myself. I would have much preferred to see what the energycost - or the energy usage is over the year, and the rate that they use to calculate what thecost is, and the savings and what it would be. In other words, uh, they don't give you anidea of — well they say here 8 ¼ cents per kilowatt-hour, that's almost half of what I pay.I mean so that's not realistic, but technically speaking that would mean that I was gonnasave a hundred and twenty dollars on that product, versus buying something else.
So what does this 62 dollars mean?
That means — in my mind, that means I'm saving 62 dollars a year. [Text deleted.]
OK, what about these numbers down here [I point to table at bottom]?
It's estimating at 10 cents a kilowatt-hour what your savings would be, at 12 cents akilowatt-hour what your savings would be, and for this model, technically, I'd be saving78 dollars [since he knows his rate is 12 cents], but it doesn't give you an understandingof what you're comparing it to.
Now they have a new label right here [show him new label]. Is this any easier tounderstand? All new appliances are going to have this label.
So this is telling you how many kilowatt-hours a year, so that's the total usage … and thisgives you a range. Now this tells you how much it costs to operate, it doesn't tell youhow much the savings are, it just tells you how much it would cost to operate per year(U.S. sales interview no. 38)
This exchange shows a complete failure by the consumer to overcome his initial assumption that theold label shows energy savings, even though the fine print of the label indicates that the figures heinterprets to be savings actually represent annual costs. It also shows that the new label, because it showsa range of energy use in terms of kWh/year, avoids the problem of consumers assuming that the labelrepresents energy or dollar savings.
It is understandable that consumers might assume that the yellow label would show energy savings,and many of those whom I interviewed indicated that they viewed the label as an “energy savings” label.But this problem does not necessarily mean that dollars are an ambiguous metric. In fact, themisunderstanding can easily be avoided with clearer typesetting, such as the use of large-font text besidesthe dollar amount saying “cost per year.” On the old label, the words “yearly operating cost” are set in

7-9
very small reverse type in a bar underneath the dollar amount, and many of the consumers did not read ornotice this small text.
Efficiency. I compare the ability of the U.S. and Thai labels to convey the concept of efficiency inan later section. Only 42% of U.S. respondents were able to tell me whether the old energy labelrepresented a model that was more efficient than most models (see Table Chapter 7 .2).
Scale. The EnergyGuide labels use a scale to show relative energy use. Visualizing the scale on thelabel is the first step toward understanding how relatively efficient a model is. Only one-third (33%) ofrespondents were able to tell that the horizontal bar graph on the old label represented a scale of relativeenergy use. Another one-third of respondents were only able to understand the scale either partially4
(24%), or with prompting (11%). More than half of respondents (55%) were able to discern andunderstand the scale on the new label without any prompting; 7% needed prompting, and 9% onlypartially understood the scale (see Table Chapter 7 .2).
My exchange with a 44-year-old high school math teacher with a master’s degree in educationadministration indicates how the scale is graphically much clearer on the new label. When I asked her ifshe could tell whether the model represented by the old label was more efficient than most models, shereplied “Couldn't tell you unless you have a bunch of them in front of you to compare.” When I showedher the new label, she immediately saw that the main feature of the label was a scale comparing energyuse: “Well sure. Because it’s telling you exactly where this one falls based on all the similar models,which is quite high, based on all similar models” (U.S. consumer interview no. 47).
The above remarks, and the compiled results, indicate that the scale on the new label was clearer,easier to see, and less ambiguous. At the same time, there appeared to be a core of about one-third ofrespondents for whom the graphical scale was not useful. The percentage who did not “see” the scalewas virtually the same: just under one-third for both labels (32% for the old label and 31% for the newlabel).
The problem with partial understanding of the scale on the old label (which carried over to the newlabel in some cases) was a misunderstanding of the universe represented by the scale. Consumers fellinto two main categories: those who thought the scale referred to all models made by just onemanufacturer, and those who thought the scale referred to the range of use for just one particular model.Nearly one in ten respondents (9%) felt that the scale referred to the range in energy use for just the onemodel; and one in twenty (5%) thought that the scale referred to just the energy use of appliances sold byone manufacturer.
One respondent, a forty-year old businessman with a masters in economics, said, “I guess I'm — as Ilook at these, what's confusing is the range is just the model of that particular manufacturer. I wouldhave thought that if you had it across all models, that would be more valuable” (U.S. consumer interviewno. 31). And the comments below were made by a 39-year-old high-school graduate who assemblesheaters and air conditioners at a local Trane Co. factory. As we started the label test, he expressed greatfamiliarity with the yellow EnergyGuide labels, since labels must be applied to the products that hiscompany makes before they are shipped.
4 The most common kind of “partial understanding” of the scale occurred when a respondent thought that the
scale showed relative energy use either for just one particular brand, for one particular model, or for all models of allsizes (i.e. they did not understand that the scale showed relative energy use for models of all brands within a certainsize range).

7-10
OK, what does the 62 mean here?
[reading from label] “… estimated yearly” … Uh, it will cost you, uh, 62 dollars a yearto run this, right?
OK, and then what are the 52 and the 106?
That’s the lowest it will cost you and the most it will cost you, for energy, if it is turnedall the way up.
OK, and then what are these rates down here and the dollar amounts [I point to kWh-cost table at bottom of label]?
This would have to be savings, maybe, or something like that, I'm not really sure.
How about this — they have a new label. [Show him new label.] How does thiscompare. Is this easier to understand?
At the lowest setting, this uses 518, at the highest setting, this is the most it ever uses[points to 697 at right end of scale] (U.S. consumer interview no. 36)
This man makes two mistakes. First, he believes that the scale shows the range of energy use for justthat one appliance rather than for all appliances within the same size range. Second, he believes, thoughhe is not sure, that the kWh-cost table shows savings.
As mentioned earlier, consumers were more likely to be able to understand the scale of relativeenergy use on the new label than on the old label. In a few cases, consumers did not even recognize thescale on the old label and then, upon seeing the new label, they realized that both labels had a similarscale of relative energy use, but that it was more obviously displayed on the new label. The followingexcerpts from one interview illustrate the graphical improvements of the scale on the new label:
[Looking at the old label] Is this model more efficient than most?
I guess it would be more, because the lowest would be 52. The highest would be 106dollars. So this falls, this is not even in the midrange. But I guess it gives you a point atthe scale where it is [points to arrow]. Now I would look at it, after I deciphered it for awhile, but if it was more user friendly, where they could show you were going to save,actually year by year and so forth and so on … what the hell is a kilowatt-hour? [Textdeleted.]
[Now looking at the new label.] How about this one? Can you tell by looking at thislabel whether it is more efficient than most?
Yeah, this would be. Now that you can see that [points to scale with larger arrow]. Istill don’t think it’s really user friendly.

7-11
OK, why do you say — this part’s a little easier, the scale on top [of the new label]?
Right.
Why is that?
Well, it stands out. You know, the other one [old label], I think doesn’t really stand out.I mean, it shows it, but it’s smaller. This stands out.
Right, the arrow is showing you where you are —
Right, it’s more pronounced. Right (U.S. consumer interview no. 65).
These comments illustrate several points. First, the respondent was able to make out the scale on theold label, but it was clearly a difficult and time-consuming task and he would not necessarily have takenthe time to do so under normal shopping conditions. Second, while the scale was more apparent on thenew label, the respondent, a wilderness educator with a master’s degree in educational psychology, stillfelt that it was difficult and not user-friendly. And finally, his comment, “What the hell is a kilowatt-hour?” reveals the frustration of consumers who — while they are shopping for an appliance andsimultaneously considering eight or 10 other criteria besides energy use — are asked to understandtechnical details that require an extra dimension of knowledge and understanding.
KWh-Cost Table. The kWh-cost table is the table on the bottom half of the old EnergyGuide labelthat shows the annual operating cost for the model over a range of electricity rates, which are supposed tospan the range of electricity costs across the U.S. The table was not included in the design of the newlabel, in part because it was deemed to be confusing to consumers. My results support the fact that thetable introduced an element of confusion into the ability of consumers to understand the label.
Table Chapter 7 .3. KWH-Cost Table on Old EnergyGuide Label that was Used in LabelComprehension Test.
Cost per kilowatt-hour Yearly Cost2 ¢ $ 154 ¢ $ 306 ¢ $ 458 ¢ $ 6010 ¢ $ 7412 ¢ $ 89
There were a number of difficulties with consumer comprehension of the kWh-cost table. First,while 40% of respondents correctly interpreted the meaning of the table, a slightly higher percentage(43%) were unable to interpret the table, either partially or with prompting.
A number of the respondents who understood the label were unhappy that it did not reflect the highcost of energy in their service area. As Table Chapter 7 .3 indicates, the kWh-cost table shows the

7-12
annual operating cost for the model at a range of electricity rates. However, the range of electricity ratesextends from 2 ¢/kWh only up to 12 ¢/kWh. The electricity rate in parts of New Jersey is 14 ¢/kWh, andit exceeds 12 ¢/kWh in much of the northeastern U.S. Although only 20% of respondents were aware oftheir electricity rate, these were the people most likely to use that information with the kWh-cost table,and they were often unable to easily calculate the actual cost of operating the appliance in their servicearea.
One in ten respondents came up with a completely novel interpretation of the table. Theserespondents (7 of 75, or 9% of the total) interpreted the table backwards — that is, instead of using theirlocal electricity rate to calculate the actual cost of operating the appliance in their area, they used the costshown at the top of the label to calculate the hourly cost of operating the appliance, in cents per kilowatt-hour (see Table Chapter 7 .2). The comments of a 42-year-old steam fitter who works in the powerindustry show how these consumers were confused the presence of two complex elements (the scale andthe kWh-cost table) on the old label:
[Pointing to old label] What is this telling you down here, the table?
Well, it's telling us that yearly cost, well, at 62 dollars it will cost you 8 cents perkilowatt-hour to run.
So this refrigerator will cost 8 cents per kilowatt-hour to run?
Yeah, I would like to see something more like this [he points to line with 4 ¢/kWh and$26].
More like 26 and 4 cents?
Right (U.S. consumer interview no. 40).
This man sees the large $62 at the top of the label and then looks down at the kWh-cost table belowto find the closest dollar amount, which is $60. He then interprets that at $60, the hourly cost to run theappliance is 8 ¢/kWh. He would prefer to have a model that costs less to operate as measured by its costin ¢/kWh and associated annual operating cost. He apparently does not understand that the purpose ofthe table is to calculate the cost of operating the refrigerator in different regions of the country.
Another respondent used the table on the bottom as a scale of relative energy use. When I asked a54-year-old college-educated nurse whether the model represented by the old label was more efficientthan most, she replied, “It’s in the middle. Its like right here [points to row showing 8 ¢/kWh and $62 onthe table]” (U.S. consumer interview no. 82). Like the man above, she used the large $62 figure andfound the closest dollar figure in the table, $60. She saw that $62 was in the middle of annual costfigures shown in the table, which ranged from as low as $15 to as high as $89, and thus assumed that thismodel was “in the middle,” or about average.
Misinterpretations of the U.S. Labels

7-13
Table Chapter 7 .4 summarizes the different ways in which the two EnergyGuide labels weremisinterpreted by the 85 U.S. consumers who took the comprehension test. The problems fall into twobroad categories: problems that can be fixed by tinkering with the design and typesetting, and problemsthat require a major design change or removal of an element.
Table Chapter 7 .4. Summary of Misinterpretations of U.S. EnergyGuide Labels
WhichLabel?
LabelElement
Problem Solution
OldandNew
General Text too small. Cannot readwithout reading glasses.
Very size of text. Have very largetext for primary message andsmaller text, without clutter, fordetailed product information.
OldandNew
Efficiency Only 40-50% can tell whether labelrepresents an efficient model.
Change wording at either end ofscale so reads: “Highest/lowestefficiency model uses.”Use a categorical rating system.
OldandNew
Scale Think scale applies to just onemanufacturer.Think scale shows range of energyuse for just one model.
Don’t recognize scale (1/3 on bothlabels).
Add text to clarify (done on newlabel).Change wording at either end ofscale so reads: “Highest/lowestefficiency model uses.”Scale on new label improved, butstill 1/3 do not see it as a scale.Use another graphic?
Old kWh-costtable
Think dollar amounts representyearly savings instead of yearlyoperating cost.Use to calculate hourly cost(¢/kWh) to operate appliance.Use as scale of relative energy usefor different models.
Add large-font text to clarify.
Remove table; too confusing ormost consumers (table does notappear on new label).
Old Dollarfigure
Think dollar amount representsyearly savings instead of yearlyoperating cost.
Add large-font text to clarify.
New kWhmetric
Most consumers prefer dollars tokWh as comparative metric. Only20% know their electricity rate.
Use dollars or categories asprimary comparative metric.
A number of misunderstandings can be corrected simply by better typesetting and using larger fonts.For example, a number of consumers were confused by the words “uses most energy” and “uses leastenergy” at either end of the scale on the new label. Some of the consumers did not clearly understandthese words, since there is no subject to this sentence. What is the subject? “This model?” “Anothermodel?” Consumer understanding could be improved by using the words: “highest efficiency model
7-14
uses” at the left end of the scale and “lowest efficiency model” at the right end of the scale. Alternatively,the wording could be “model using the least energy” and “model using the most energy” as appeared onthe scale on the old label. Similarly, another typesetting fix could be found to the problem of consumermisunderstanding of the dollar figure as savings on the old label. Placing the words “cost per year” inlarge type next to the large dollar figure would eliminate the tendency I observed of one-third ofconsumers to interpret the dollar figure as savings. Consumer understanding of these designmodifications could be tested empirically, and the best option chosen.
The other problem categories are more fundamental and point to the possible need to rethink theentire design of the label. At least one-third of all consumers appear not to understand the scale as ameans of comparing relative energy use of different models. In Chapter 2, I reported on the surprisingresult by Egan and colleagues (Egan 1997; Lord et al; 1996), who compared different graphical displaysfor use in a comparative energy billing format. They found that the rate of comprehension of distributiongraphs was significantly higher than for bar graphs. The findings of Egan and the results of this researchsuggest that the bar graph may not be the optimal graphic to use for comparison on the EnergyGuidelabel.
The label comprehension tests revealed at least two other fundamental problems with the design ofthe new EnergyGuide label: the text is too small, and the font sizes are not varied. A number ofconsumers remarked that “nothing jumps out at you” on the new label, reflecting the fact that the labelconveys no primary focus or message. This problem could be solved by redesigning the label so thatthere is a primary focal point (either a logo, and a large number figure, or both) at the top of the label,with blocks of detailed but uncluttered product information in smaller type at the bottom of the label. Anexcellent example of this is the Fuel Economy label used on U.S. automobile. It has a gasoline pump as alogo. This is on the top-central part of the label and can easily be seen across a showroom floor. It alsohas two large-font numbers representing the fuel efficiency in miles per gallon, which can also be seenfrom a distance. The rest of the detailed product information is in two small block paragraphs of text atthe bottom of the label.
New vs. Old Label.
After I had shown consumers both the old and new labels, I asked them which label was easier tounderstand and which label they preferred. The majority of respondents (72%) said that the new labeldesign was easier to understand. This response, from a 32-year old computer programmer with threeyears of college education, is typical of the many respondents who said they thought the new label waseasier because they could see the scale of relative energy use more clearly:
Well, I could tell right away that it was higher on the scale, it uses most energy, so …using more costs more … This gives me, right way, I’ll say OK, my fridge sits right hereon the scale, so maybe I’ll wanna get one that’s down here [points to left end of scale],cheaper (U.S. consumer interview no. 67).

7-15
Figure Chapter 7 .3. The Scale of Relative Energy Use on the Old EnergyGuide Label (Top) and theNew EnergyGuide Label (Bottom, Inside Box).
It was clear from the consumers’ responses that the scale comparing energy use was much moresalient and easy to understand on the new label than on the old label (see Figure Chapter 7 .3).5 Onecouple, both white-collar professionals in their late twenties with college degrees, said they preferred thenew label because they liked to be able to see how a model rated compared to other models.
Because I guess it's more important to know where your refrigerator would be standingcompared to other refrigerators, ‘cause the number really doesn't mean anything if youdon't know what the other ‘frigerators are going for (U.S. consumer interview no. 84).
Despite the fact that most consumers found the new label simpler and easier to look at, there wasstrong resistance to the use of kilowatt-hours as the primary metric. This comment from a 64-year-oldexecutive with a master’s in business administration reflects the ambiguous nature of many of theresponses; he liked seeing a clear comparative scale, but would prefer to see dollars as the comparativemetric:
Well let’s see … [reading from label] “This model uses 655 kilowatts” … so I can seewhere it is. Yeah. I think this is much clearer, in that this uses quite a lot compared withthe least. So this unit uses a lot of power, right? In other words, on the scale, it’s a high
5 The small arrows on the bar graph on the old label are a relic of printing constraints when the label was first
developed in 1970. The first labels had to be printed on line printers, so the small v-shaped arrows were a by-product of the primitive printing hardware and were never enlarged to make the scale easier to read (Meier 1998).Although the scale on the new label has a larger arrow indicating the usage of this model, the scale itself is largelybased on the old scale, and there is substantial room for improvements that would to make the scale morecomprehensible.

7-16
user of energy. Now what that means, if this model’s unit operating cost is 57 dollars[dollar cost shown at bottom of label], then something down here [points to left end ofscale] would be less, but you have no idea how much.
Hmm hmm.
I don’t know what this means. I understand that this is not a particularly efficient model.But — and I understand that this is going to cost 57 dollars. But I have no concept at all,without going into a pencil and paper calculation, as to what it means, what would itmean if you were here [points to left side of scale]. Would it be 50? Would it be 30? Idon't know.
So in other words if you were lower down on the scale —
I don't know what it would mean. No I — I, I mean could do it, because you’re sayingit’s 8.67 per kilowatt hour, and that this uses 655 — I mean you could go through amathematical calculation, but you’re shopping for an appliance, you don’t want to spenda half hour doing this (U.S. consumer interview 69).
Although he likes the scale, he feels frustrated in that the kilowatt-hours are a meaningless metric tohim. Since the scale shows the variation between models in terms of kilowatt-hours. He knows that hecan calculate the annual operating cost of other models in the range by multiplying 8.67¢/kWh times theenergy use in kWh, but he cannot be bothered with the calculation. The scale is therefore not very usefulto him.
In summary, the majority of U.S. consumers said that the new label was easier to understand becauseit was simpler and they could see where the model fell on a scale of relative energy use, compared toother models. There was also no confusion about whether the dollar amount represented cost or savings(as on the old label), since the text at the bottom of the new label clearly says, “This model’s yearlyoperating cost is $57.” Yet despite these positive points, consumers were clearly uncomfortable withhaving kilowatt-hours — a metric with which most of them were unfamiliar — as the metric on the scale.Their suggestions on how to improve the new label fell into two categories: to put the single dollar figurein very large font at the top of the label above the scale; and to use dollars, instead of kilowatt-hours asthe metric on the scale. In Appendix I, I experiment with some of these suggestions as an illustration thatsome label improvements may not be difficult to do.
The Thai Label
A sample of the Thai energy label for a refrigerator is shown in Figure Chapter 7 .4. The followingsection presents survey results on consumer recall of the label contents and understanding of the label.This is followed by a section on misinterpretations of the Thai label and then a comparison of the abilityof the Thai and U.S. labels to convey the concept of efficiency.

7-17
low
O.K.medium
good
very good
efficiency level
type: refrigerator
label showing efficiency ofelectric equipment
efficiency (cu.dm./kWh)
operating cost (baht/yr)
energy use (kWh/yr)
model
size (liters and cu.ft.)
logos of electric utilities
Figure Chapter 7 .4. The Thai Refrigerator Label.
Consumer Recall of Label Contents
We tested the recall and comprehension of the Thai energy label as part of our survey of 633 recentappliance purchasers. In one question, without showing them an actual label, we asked respondents tolist what type of information was on the energy label. Table Chapter 7 .5 shows the results. More thanhalf of respondents stated correctly stated that the label showed the efficiency of the appliance (55%) orits operating cost (53%). Smaller percentages were able to provide additional details, and the averagenumber of items listed was 1.8, indicating that the respondents were not very familiar with the detailedinformation on the appliance label.
We got a more revealing response to another question in which we asked how well consumers feltthey understood the label. Only 16% felt that they understood the label well, and 85% said they eitherdidn't understand the label (22%) or only understood it somewhat (see Table Chapter 7 .6). Thisresponse is explained by our semi-structured interviews, in which many consumers said that they onlylooked at the large, 1 to 5 rating system at the top of the label and did not look at, or did not understandthe technical details on the bottom half of the label.

7-18
Table Chapter 7 .5. Recall of Label Contents among Thai Consumers Who Recently Purchased anAppliance
What information is on the appliance energy label? % of 421respondents who
recalled labeldetail
Efficiency 55%Electricity cost of appliance 53%Size of appliance 32%Electricity units 21%Other information 13%Don’t know what is on label 18%Average number of label details recalled? c 1.8Note: This question was added one week into the survey and was asked of 425 consumers.
Table Chapter 7 .6. How Well Thai Consumers Understood the Appliance Energy Label
How well did you understand the applianceenergy label?
% of 421 responses
Didn’t understand 22Understood somewhat 63Understood very well 16Understood extremely well <1%Notes: Column total exceeds 100% because of rounding. This question was added one week into thesurvey and was asked of 425 consumers.
We thus find a situation in which the national advertising campaign appears to be very effective andthe majority of appliance purchasers are aware of the labeling program and know that they should lookfor a number 5 model in order to save energy (see results on awareness on Chapter 6). At the same time,most consumers only appear to be reading the numerical rating system at the top of the label, and feeluncomfortable with the technical details displayed in smaller print at the bottom of the label. Consumerreluctance to spend time understanding detailed technical information on the label — a reluctance wefound among both Thai and U.S. consumers — will be discussed later in this chapter.
Misinterpretations of the Thai Label
In Thailand, I performed in-store tests of label comprehension with 42 consumers. The labelcomprehension test was shorter and less rigorous that the U.S. label test. I asked two questions. First,while showing the respondent a number 4 label, I asked, “Is this more efficient than most models?” ThenI held up a number 5 label next to the number 4 label and asked which label represented a more efficientmodel? I then asked for general feedback on the design of the label.

7-19
Because of the way I performed the test, the only direct comparison I can make between the U.S. andThai label tests is on their effectiveness at conveying the concept of efficiency. This comparison is madelater in this chapter, and it shows that a higher percentage of Thai consumers were able to use a singleenergy label as an indicator of whether a model was energy-efficient.
While more than half of the Thai consumers (55%) whom we interviewed could tell that a number 4label was energy-efficient, and three-quarters (76%) could tell that a number 5 was more efficient than a4, a small minority of those interviewed, mostly in rural districts, had misconceptions about the label.These misconceptions fell into two categories.
Conflation of Efficiency and Quality. The text above the numbers at the top of the label indicates“medium” for 3, “good” for 4, and “very good” for 5. For some consumers — who were aware of themedia campaign about the importance of buying a refrigerator with a number 5 label, but who had notunderstood the underlying message of why they should buy number 5 (because it’s more efficient andsaves money) — the “very goodness” of the 5 acted as a barrier to them desiring it. One consumer, whenasked whether a number 4 or a number 5 was more efficient, responded,
Take Number 4. It’s good enough. I don't want too good a model. Number 5 is verygood, it might be too good, and you might not be able to find it. So you shouldn’t bedisappointed if you can’t find a number 5. Number 4 is OK (Thai sales interview no.45).
Another villager, upon viewing the label, said, “I think that for people in the country, they’ll read it butnot be able to understand it. It’s a language that rural people won't understand.” This respondent wenton to prove his point when he was asked whether he would choose a refrigerator with a number 4 or anumber 5 label, replying, “If I had to choose, I would choose number 4.” When asked why he wouldchoose number 4, he said, “That’s very good [points to number 5 label], but I think I would just chooseone that’s good [points to 4] (Thai consumer interview no. 54). The implication of this is that thenumber 5 model is of a quality that is too good for simple, rural people. While he understands thatnumber 5 conveys the idea of quality, he does not understand the basic concept that the number 5 willhave lower operating costs and thus provide him with a benefit (cost savings) every month when he payshis electric bill.
In our interviews with urban Thai consumers, we also found a tendency for some consumers tointerpret the label as a indication of quality. This tendency is fostered, at least in part, by the text abovethe numbers which indicates quality and not efficiency: the word “good” appears above number 4 and“better” above number 5. A Thai policymaker recounted to me a revealing anecdote about how thenumber 5 label had come to confer the idea of “quality” for Thai consumers. In the Thai air conditioningmarket, imported air conditioners are typically much more expensive than domestically produced models.Prior to the introduction of the energy labeling system, Toshiba sold it’s one-ton, wall-type airconditioners for about 50,000 baht ($2,000). After the labeling program began, sales of Toshiba unitsbegan to fall. Apparently, consumers who had previously bought Toshiba air conditioners because theyknew that the imported, Japanese models would be high-quality, were convinced that number 5 rating onsome Thai-produced air conditioners meant that these units were of equally high quality. Yet thedomestic units sold for about 40% less than the Toshiba models, or around 30,000 baht (US$1,200). Inorder to avoid losing market share, Toshiba was forced to reduce the price on its one-ton imported airconditioners by 25%, to 40,000 baht ($1,600).

7-20
The Thermostat Dial Inside the Refrigerator. We found another misconception exclusively amongvillagers who had either not been exposed to the television advertising campaign, had not paid attentionto it, or who only knew about it vaguely. These respondents (4 out of 32 villagers with whom we testedthe label) were applying their mental model of the thermostat dial inside the refrigerator to the similarlynumbered energy label developed by the Thai DSM Office. The two women below work as seamstressesin a small village about 40 kilometers outside of Chiang Mai. Although they were familiar with thetelevision commercials about the energy label, they did not know specifically what the number 5 on thelabel means.
[first woman] I want to get number 1. It saves energy.
[second woman] At our house, we just set it at 2.
So you understand it [the label] as the temperature setting inside your refrigerator?
[second woman] They say that it is on strong at 4 or 5, it will use a lot and waste energy.
[first woman] I use it at number 1.
Do you understand the same as her?
[second woman] Yes, but what number should we get if we don't want to waste energy?
You’re asking us [smiling]? We’ll tell you at the end.
[first woman] We want you tell us now [laughs playfully].
[second woman] Number 5 is what they say on T.V., they say number 5. And there’sthat fat woman crying in the commercial [they laugh].
[first woman] What does it mean? Number 5! (Thai consumer interview no. 27).
The response below is from a woman in the same village who owns a small shop that sells food anddrinks.
What does number 1 mean?
Not very cold.
And what does number 5 mean?
The most cold, things will get very cold.

7-21
If you had to choose between a 4 and a 5? Which one is better?
Number 5 is better.
How is it better?
It goes from the lowest up to number 5. And the level of coolness is different. Number 5is the coolest. When I use it, I try to save, I don’t use number 5. I just set it at 1 (Thaiconsumer interview no. 31).
The seamstresses and the vendor are clearly very conscious of the cost of operating their refrigeratorand prefer to set the thermostat dial in the refrigerator at the lowest levels, 1 and 2. The dial thermostatsin Thai refrigerators go from either 1 to 5, or sometimes 1 to 6. It is thus natural for them to link thissame numerical rating scheme to the 1 to 5 rating they see on the new energy labels. The result is theopposite of that intended by the DSM Office: these women think that a number 1 refrigerator will use theleast energy, and a number 5 will use the most. They are aware of the television advertisements andassume that the number 4 and number 5 units are being advertised because of their quality, because oftheir greater cooling ability, and this uses more energy. Another respondent in a village outside ofKhorat in northeastern Thailand, when shown a number 4 label responded that “People out in the countrydon't use any higher than the lowest level, this number [points to number 1 on the label]. I don'tunderstand” (Thai consumer interview no. 48).
Linking the Thai Label to a Purchase
In order to assess the impact of the Thai appliance energy labels on the market, we gathered twotypes of data. First, we gathered data on the prevalence of labels in stores by conducting an informalsurvey of labels in 24 appliance stores in Bangkok, Chiang Mai, and Khorat. Overall 57% ofrefrigerators in the stores we sampled had energy labels and 26% of air conditioners had labels. Thepercentage of models with labels was significantly higher in Bangkok than upcountry.
The second type of data we gathered was on the prevalence of labels on models purchased. Weasked recent buyers of refrigerators and air conditioners whether they had purchased a model with alabel. Since the Thai labeling program is voluntary, not all models have energy labels. In practice,manufacturers only put labels on appliances that are more efficient than average — that is, with a 4 or 5rating. We compared the prevalence of labels from our two information sources: the percentage of labelsin stores and the percentage of labels on purchased models. The objective was to see if the percentage oflabeled models purchased by consumers matches the percentage of labeled models actually observed instores. Table Chapter 7 .7 shows the comparison. The table shows that the percentages of models withenergy labels is quite similar for refrigerators: 62% as reported by recent buyers and 57% as observed instores. However, the percentages are quite different for air conditioners: while 82% of recent airconditioner buyers reported buying a labeled model, we only observed 26% of models in the store withlabels. There are two possible explanations for this result: (a) consumers are over-reporting thepercentage of units with labels; or (b) there is a large consumer “pull” effect — that is, the percentage ofnumber 5 models being purchased by consumers is higher than the percentage of models available instores. I think that while there may be some over-reporting, the data indicate a large pull effect, and thatconsumers are driving demand for number 5 air conditioners.

7-22
Table Chapter 7 .7. Prevalence of Energy Labels on Thai Appliances
Prevalence of labelson refrigerators
Prevalence of labelson air conditioners
Labelrating
% bought(reported by357 buyers)
% in stores(observed in survey
of 24 stores)
% bought(reported by 267
buyers)
% in stores(observed in survey
of 24 stores)No Label 38 43 18 74Label 62 57 82 26
I also examined the breakdown of labels being purchased, in order to estimate what percent oflabeled models are rated 5, 4, and 3. To do this, I compared data from our survey of recent buyers withdata from the DSM Office on the breakdown of labels supplied to manufacturers. Table Chapter 7 .8shows the comparison. The prevalence of number 5 labels in our survey sample of purchasedrefrigerators closely matches the prevalence of number 5 labels supplied by the DSM Office to appliancemanufacturers through the labeling program. Sixty-eight percent of consumers who purchased a labeledrefrigerator said the label was a number 5, while 62% of refrigerator labels supplied by the DSM Officeduring the last six months of 1996 were number 5. Eighty percent of consumers who purchased a labeledair conditioner said the label was a number 5, while 77% of refrigerator labels supplied by the DSMOffice during the last six months of 1996 were number 5.
Table Chapter 7 .8. Breakdown of Number Ratings on Thai Energy Labels
Label breakdown for refrigerators Label breakdown for air conditionersLabel rating % bought
(reported by357 buyers)
% supplied by DSMOffice, Jul-Dec ‘96
% bought(reported by267 buyers)
% supplied by DSMOffice, Jul-Dec 1996
Rated 5 68 62 80 77Rated 4 25 32 15 23Rated 3 6 6 2 0
Important note: this table shows a percentage breakdown only for models with appliance labels. Data shown inTable Chapter 7 .7 indicate that roughly 62% of consumers in our survey reported that they purchased a refrigeratorwith a label, and 82% purchased an air conditioner with a label.
In sum, the above data suggest that roughly 60% of refrigerators and 80% of air conditioners beingpurchased have energy labels. I also infer that there is a large consumer “pull” effect for air conditioners,since the percentage of number 5 models being purchased by consumers is much higher than thepercentage of models available in stores.

7-23
Comparisons from Study of the Labels in Both Countries
In the final section of this chapter, I draw some comparisons from my study of consumerunderstanding of labels in the U.S. and Thailand. First, I compare how well each label conveys theconcept of efficiency. I then describe a common problem with the labels, as reflected in consumercomments: too much detailed product information.
The one question for which I can directly compare responses between the two countries is thefollowing: “Is this model more efficient than most units?” Table Chapter 7 .9 and Table Chapter 7 .10indicate the extent to which the label in each country conveyed the concept of energy efficiency.
In the U.S., only 42% of respondents were able to tell me whether the old energy label represented amodel that was more efficient than most models; roughly the same proportion (43%) was unable to say atall whether the label represented an efficient model. The remainder, about 16%, either got the answerpartially correct (e.g., a few respondents thought the scale for efficiency referred to just one brand ofrefrigerators) or needed assistance (i.e. needed to be prompted with additional questions in order toencourage them to think more before answering).
A higher percentage of respondents was able to use the new label as an indicator of efficiency. Forthe new label, more than half of respondents (55%) used the label to tell whether the model was efficient,yet one-third (32%) were still unable to discern whether the label represented an efficient model. Thereare two likely reasons for the higher proportion of correct answers for the new label: one is that the scaleis improved and more clearly marked on the new label compared to the old label. This improvement wasmentioned by a number of respondents. Another reason, mentioned earlier, was the learning curve effect:after having interpreted the meaning of the old EnergyGuide label, respondents were be more likely torespond correctly on a second label that has a slightly different design but is similar in many respects.Unfortunately, the new label was always presented second, so we cannot infer how much better the newlabel is compared to the old at conveying the concept of energy efficiency.
Table Chapter 7 .9. Comprehension of Energy Efficiency on U.S. Label
Did they understand whether thismodel was more efficient than mostmodels?
Old Label(% of 77 responses)
New Label(% of 75 responses)
Yes 42 55Yes, with guidance 12 7Partially correct 4 7No 43 32Column totals exceed 100% because of rounding.
As mentioned earlier, we administered the label test slightly differently in Thailand. We only testedone label design, since there is only one style of energy label in Thailand. First, we would show therespondent a number 4 label and ask whether they could tell if it was more efficient than most models.After they responded to this question, we would show them two labels side by side, a number 4 and anumber 5, and ask which was more efficient.
More than half of the Thai respondents (55%) were able to tell that the number 4 label represented anenergy-efficient model. When comparing a 4 and a 5 label, three quarters (76%) of respondentsanswered correctly that the number 5 model was more efficient than the number 4. In the Thai labelcomprehension test, our sample was heavily weighted toward rural respondents: 33 of the 42 respondents

7-24
to this question were from rural districts, where the population tends to be poorer and less well-educated.Since eight of the 9 urban consumers we tested (5 in Bangkok and four in Khorat), responded correctly toboth questions, we can safely infer that the actual rate of efficiency comprehension for the urban Thaipopulation would be significantly higher than 55%.
Based on the above results, I conclude that it is cognitively somewhat easier for Thai consumers torecognize an efficient Thai label than it is for U.S. consumers to recognize an efficient U.S. label. TheU.S. consumers whom I interviewed used the U.S. label to make deductions about energy efficiency inone of two primary ways: First, only 42% of respondents were able to use the scale on the old label andthe relative position of the arrow to tell where a model’s operating cost fell relative to other models (asintended by the Federal Trade Commission, which establishes rules governing label design); thispercentage increased to 55% when viewing the new label, due to both the learning effect and to the factthat the scale itself is more graphically distinguishable on the new label (see Figure Chapter 7 .3). Thesecond way that consumers made deductions about energy efficiency was by comparing the dollaramount (or kWh amount) on one label to the corresponding dollar figure on a nearby model. When Itook this option away from respondents by asking them to only look at the single label, 43% were unableto use the single label as an indicator of energy efficiency.
Table Chapter 7 .10. Comprehension of Efficiency on Label in Thailand.
Question % of 42responses
Is this model [number 4] more efficient than mostmodels? Yes 55 No 45When shown two labels, one with a 4 rating and one witha 5, can tell which is more efficient? Yes 76 No 24
Note: 33 of the 42 respondents in this sample were from rural districts, where the population tends to bepoorer and less well-educated. The comprehension among the urban Thais in our sample wassignificantly higher: 8 of 9 answered correctly.
A typical U.S. consumer response, when asked to determine whether the model was more efficientthan most was, “Couldn't tell unless you had a bunch of them in front of you to compare” (U.S. consumerinterview no. 47).
The Thai consumer responses to the label is a reflection of the massive national advertisingcampaign, which has made most Thai consumers aware of the number 5 rating system.6 It is remarkablethat in just two years of implementation, the Thai label appears to more effectively convey the concept ofenergy efficiency than the U.S. EnergyGuide label, which has been on U.S. appliances for nearly 20years. The results may also indicate the effectiveness of a simple categorical rating system at conveyingthe concept of energy efficiency. The vast majority of Thai consumers who were aware of the
6 In our survey, 83% of 633 recent buyers and 71% of 238 non-buyers, were aware of that energy labels wereposted on appliances.

7-25
advertising campaign and knew that they should buy a model with a number 5 rating. The highest levelof understanding, observed in just a small proportion of those whom we interviewed, is represented bythis individual, a merchant in a rural district outside of Chiang Mai in northern Thailand:
The label explains what it means. Number 5 saves the most … it begins with 1, 2, 3, 4, 5.Five is the best. Four is good. Three is medium. Two is barely [he laughs]. For themost part, they are 4 or higher. If its lower than 4, they don't bother to sell it (Thaiconsumer interview no. 18).
However, the more common approach to reading the Thai label was to focus on the numerical ratingsystem at the top and to become slightly (or greatly) confused by the details of the small print (e.g., unitsof energy use, size in cubic decimeters, annual operating costs) on the bottom half of the label. One man,a Bangkok insurance manager with a college education and a high income level, became frustrated by thedetails on the bottom part of the label, saying, “I guess I just don't understand it … I would just look atthe electricity cost per year, just this. I don't know how many units it uses.” He then went on to add:
Really, the most important point is this number here [points to the number 5 on thelabel], because this number is the same one that I have seen on the advertisement. Iknow that number 5 is the best, so I don't have to look down here [points to small printon bottom half of label].
If you compare this label, which is more efficient? [holding up a number 4 label]
This [number 4] means good, but not very good, not as good as a 5.
Which model is more efficient?
I don't have the time to compare and calculate, but I know that this unit [number 5] savesthe most” (Thai consumer interview no. 9).
This response, which is typical of the Thai consumers whom we interviewed illustrates two points.First, it indicates that, to some degree, the Thai energy label has conflated the two concepts of qualityand energy efficiency, a problem that was mentioned earlier. This man links the 1 to 5 scale to quality, 4being “good” and 5 being “best.”7 Only after he mentions that 5 is “the best” and 5 is “very good” doeshe state that it saves energy. The second point illustrated by the above response is the reluctance, whichwe also found among U.S. consumers, to spend a lot of time learning the details of energy units and theother technical specifications listed on the labels. For most consumers, the detailed information on thebottom half of the label appears to be extraneous and often is a source of confusion.
7 Note that the text above the numbers 4 and 5 on the label says “good” and “very good,” respectively.

7-26
The Problem of Too Many Details
Previous research by de Loor and Zeelenberg (1991) has warned of the danger of “masking” aprimary message about energy use or energy efficiency with detailed product information. Consumers inboth countries often seemed overwhelmed by the technical nature of the information presented in thelabels. In the U.S., some respondents often replied in frustration that they would have to be technicalspecialists to fully understand the label:
When I looked at this, I had a hard time focusing on anything. It's just, it's just too much.It’s like reading a page from a grid (35-year-old fundraiser with a law degree; U.S.consumer interview no. 23).
[When asked if he could tell whether the label represented an energy-efficient model:]Not as a simple citizen, if I would be a, a electrician or something, I’d be more able (59-year-old cabinet maker with a high school education; U.S. consumer interview no. 76).
[When asked how he would compare two models to see if the energy-efficient modelwould pay for itself over time:] I’m sure there's a mathematical equation that you couldpunch in to figure that out (32-year-old electrician with a high-school degree; USinterview no. 43).
Thai respondents voiced similar concerns about the presentation of too many technical details on theThai energy label. This comment came from a 32-year-old soldier with a high-school degree and twoyears of higher education in marketing:
I don't understand it very well, some points I don't understand. Like it says, efficiency240.08 cubic decimeters per kWh, right? For regular people, this will be difficult tounderstand. But for students or technicians, they’ll know what the word “decimeters”means and how big it is … But for the most part, they won't be that interested (Thaiconsumer interview no. 36).
A Thai management consultant with a bachelor’s degree in engineering and a master’s in businessadministration degree echoed these comments:
It [the label] is pretty good, except there's one problem. They should write somethingthat summarizes it easier than this. People who buy appliances, not everyone is all thateducated. Some people may not know as much as others. If they try to read theefficiency, or the amount of electricity use … sometimes, it will be pretty funny [readingfrom label, sarcastically] “fan coil … condensing” … it would have to be pretty funny,they're not going to have any idea (Thai consumer interview no. 8).

7-27
After spending 45 seconds trying to determine whether a number 4 label represented an energy-efficient model, this policeman from a rural district said:
I think that for people in the country, they’ll read it but not be able to understand it. Its alanguage that rural people won't understand (Thai consumer interview no. 54).
The Problem of Precision. The policymakers who designed the U.S. and Thai labels included a levelof precision that is mind-numbing and not necessary for nearly all consumers who will read the label.The Thai label has detailed product data to a precision of five significant digits (e.g., operating cost is683.35 baht per year). This level of precision is not necessary for two reasons: first, it is far beyond theprecision that will be useful for consumers comparing energy costs between units; and second, it isbeyond the level of precision of the refrigerator energy test itself. Similarly, the U.S. label informs theconsumers that the operating cost shown is based on a national average price of 8.67 cents per kWh.This figure is not used by most consumers and, in any event, it would be easier and more understandableto calculate operating cost using a representative figure, say 9 cents per kWh, to make the calculationeasier for consumers to see and interpret.
The consumers whom I interviewed said that the amount of information and the level of detail on thelabels made them difficult to understand. The concern — common to consumers in both countries —about the readability of the labels can be illustrated in comments made by two U.S. consumers about theneed for a more simple presentation of information about the appliance’s energy efficiency. One womanemphasized that a sixth grader ought to be able to read and understand the label. Another woman, aprofessional fundraiser with two bachelor’s degrees and a law degree, set the bar a little higher:
I mean I really don't even think that this label is the best that can be done. Because Ithink if you can't get a high school kid to come, to be able to figure this out, tounderstand this, then you're not gonna get the average adult, because there are adultswalking in here, who — their education is, even if they went to graduate school, if theymajored in things that had nothing to do with math, or if they’ve been away from mathfor X years, they only know the basics of going to the supermarket and figuring outX,Y,Z, or miles to the gallon times the — you know, like basic, basic things (U.S.consumer interview no. 23).
Did You Bring Your Glasses? Early on in the process of interviewing U.S. consumers, I noticed thatone of the respondents was not able to read the EnergyGuide label I was showing him. He said that hehad left his reading glasses in the car. The only elements of the label he could read clearly were the largedollar amount and the scale of relative energy use. In this particular interview, we were able to continueonly because his wife answered the questions relating to detailed interpretation of the label. After that, Ikept track of how many consumers needed their reading glasses in order to be able to understand thelabel. In the end, 9% (7 of 76) of the U.S. consumers on whom I tested the label were not able to read thelabel without their reading glasses, and about half of these did not have their reading glasses in the storewith them.
7-28
Conclusions
The data in this chapter provide a wealth of information about how U.S. and Thai consumers readand interpret appliance energy labels. I assessed the extent to which consumers look at energy labelsduring the appliance purchase by first asking salespeople and then asking consumers themselves.Salespeople’s estimates of how often consumers look at the energy label were lower than consumers’self-reported estimates, indicating the possibility that self-reported responses about label awarenessmight overstate the importance of the label in the purchase decision. However, only a small minority ofconsumers in either country reported that they read the labels carefully, suggesting that most consumersare likely to do no more than glance at the label and read it briefly. This finding argues for the need toprovide a clear, simple message on the appliance label in large, bold font, and to supplement this withdetailed information that does not detract from or mask the primary message.
In my tests of detailed label interpretation, the U.S. EnergyGuide label fared poorly. Mostrespondents were able to interpret operating cost, but fewer than half were able to interpret whether thelabel represented an efficient model. Most striking was the finding that one-third of respondents thoughtthe dollar figure on the old EnergyGuide label represented savings, the opposite of the truth. And one-third of respondents were unable to “see” the comparative scale of energy use and thus use this as a basisof comparison with other models. The comprehension scores for the new EnergyGuide label wereslightly higher than for the old label on all of these criteria. Unfortunately, the new label was alwayspresented after the old label on the comprehension tests, so I cannot be sure that the new label is better.By cognitive criteria, the labels, whether new or old, do not do the job they were intended to do.
In an effort to understand consumer reactions to the EnergyGuide label designs, I asked consumerswhich label they preferred and which was easier to understand. The majority of consumers said that thenew label was easier to understand because it was simpler, and because they could more easily see wherethe model fell on a scale of relative energy use, compared to other models. However, there was strongresistance among most consumers to the use of kilowatt-hours, rather than dollars, as the primary metricon the new label. Consumers’ suggestions on how to improve the new label fell into two categories: toput a single dollar figure in very large font at the top of the label above the scale; and to use dollars,instead of kilowatt-hours as the metric on the scale. Clearly, the cognitive ease with which consumersinterpret dollars should be weighed against the logistical problems that led the Federal TradeCommission to remove dollars as the primary metric in its 1994 rulemaking for the new EnergyGuidelabel.
Compared to the U.S. respondents, there were fewer misconceptions about the meaning of the labelamong Thai consumers. Most of the Thai respondents focused exclusively on the 1 to 5 ranking at thetop of the label, and few were comfortable reading the technical details on the bottom half of the label.This aversion to reading the technically oriented bottom half of the label is supported by the finding thatthe vast majority of Thai consumers responded that they either did not understand the label (~22%) orunderstood it only somewhat (~63%). The Thai label appears to succeed at conveying the concept ofenergy efficiency through the 1 to 5 rating system, but the label also appears to intimidate manyconsumers who do not feel fully comfortable interpreting the technical details on energy use, operatingcost, and size at the bottom.
A comparison of the results from the U.S. and Thai label comprehension tests indicates thatsignificantly higher percentage of Thai than U.S. respondents were able to tell whether the energy labelrepresented a model that was more efficient than most models. I conclude that the Thai label issignificantly more effective at identifying efficient models than is the U.S. label.
We found two types of misinterpretations about the Thai label among a small proportion of thevillagers we interviewed in upcountry Thailand. Several villagers viewed the label as a quality rating and

7-29
assumed that the models with higher-ratings, such as 4 and 5, were the highest quality available andwould provide the most cooling. When asked which model they would prefer to buy, these villagers said3 or 4, since a number 5 was too good for them, and a lower-rated model would be good enough. Ourconversations with urban Thai consumers and an anecdote related to me by a Thai policymaker supportthe notion that the label is being perceived by many Thais as a “quality” label as well as just an“efficiency” label. This conflation of “energy efficiency” with “quality” is not surprising, given the textlabels above the numerical ratings on the label: the word “good” appears above number 4, and “better”above number 5. However, from a policy perspective, this might not be desirable, since consumers couldpurchase high-efficiency units that are low quality in other respects (e.g., noise) and becomedisenchanted.
We found another misinterpretation among a number of respondents in one village. They confusedthe numbering system on the thermostat inside the dial with the numbering system on the label,indicating that they preferred to keep their refrigerator at 1 or 2 and that a refrigerator rated 4 or 5 wouldbe too cold for their needs. These villagers were not familiar with the labeling program and had notrecently purchased an appliance. These problems can be dealt with through education by retailers andexposure to the labels in a store environment. At the same time, such feedback on consumer reaction tothe label would be very helpful input during the design phase of the label development.
A common response from consumers in both countries was that the labels were too detailed and noteasy enough to read. Consumers often seemed overwhelmed by the technical nature of the informationpresented in the labels. The level of precision on the labels — e.g., five significant digits on the Thailabels — leads many consumers to either ignore the information or to not use it. This finding isconsistent with research previous research in the Netherlands (de Loor and Zeelenberg 1991) which hasshown that information not essential to the primary message of the label often has the effect of“masking” the primary information and reducing, or slowing, consumer understanding. This might beresolved by having higher and lower salience information distinguished by typography, such as font size.
This last recommendation requires a brief explanation. Admittedly, consumers are not homogenous,and there will be a stratum of consumers who read the label in detail. These people are important for tworeasons: they are the consumers most likely to use the label to purchase an energy-efficient unit; and theyare also likely to talk about the label and share their opinions with others. My recommendation is not to“dumb down” the label, but rather to compartmentalize the detailed, technical, product information sothat it does not impede understanding of, and access to, the primary label information. This will assistthe large majority of consumers who might be interested in energy efficiency, but are not technicallyoriented, and who do not have more than a few seconds to scan the label and decide whether it is a usefuldecision tool.

8-1
CHAPTER 8
FINDINGS AND RECOMMENDATIONS
Abstract
This chapter begins by summarizing the results from my analysis of policymaker, retailer, andconsumer perspectives on appliance energy policy in the U.S. and Thailand. After just four years ofimplementation, the Thai appliance labeling program appears to be having much greater impact on theconsumer appliance market than the U.S. program, which has been operating since 1980. In Thailand, alarge percentage of consumers are already using the energy label to assist them in the first-stagescreening of products when they enter the store. There is also potential for energy efficiency to be usedas a tie-breaker at a later stage in the sales transaction. Such an objective cannot be achieved withoutthe active involvement of retailers, who are the group that exerts the most influence over a purchasedecisions. Finally, I lay out a research agenda covering appliance labeling issues for policymakers inboth industrialized and developing countries.
Introduction
As home appliances proliferate in the developing world, they will become an increasingly significantcontributor to energy demand worldwide. Energy labeling programs such as those in the U.S. andThailand have the potential to significantly check the growth in energy demand from appliances.Worldwide appliance sales will reach US$77 billion annually in the year 2000. If one assumes thatlabeling programs alone have the modest potential to influence 20% of consumers to buy models that are10% more efficient than they would have otherwise purchased, then the potential benefit from well-researched and effective labeling programs worldwide could be on the order of US$800 billion annuallyin the coming decades.1
In this dissertation, I have examined ways to limit the impact of appliance usage from a number ofperspectives. First, to understand the basis of policy formulation, I have examined the framework fromwhich policymakers gather and interpret information (i.e. their mental maps) in order to understand thebasis of consumer energy policy. Second, to study the milieu in which the appliance sale takes place, Ihave used the techniques of an anthropologist and social scientist — participant observation,unstructured and semi-structured interviews, and a national survey. As a component of this store-basedresearch, I also examined cognition in context (per Lave, Murtaugh, and de la Rocha 1984 and Rogoff1984) — in other words how individual consumers think about and understand energy-related
1 The calculation assumes that the lifetime costs of operating these appliances will be approximately equal to
their purchase price — ~US$77 billion. If 20% of consumers use an appliance energy label to choose a model that is10% more efficient in the year 2000, they will save ($77 billion x 0.20 x 0.10=) $1.54 billion in lifetime operatingcosts. Assuming the lifetime of the appliance to be 10 years, this is a savings of $154 million in year one. Overtime, the savings would accumulate; the cumulative savings over a ten-year period would average 7.7 billion, or anaverage savings of ~$770 million annually.

8-2
information (specifically energy labels) when they purchase an appliance. And at a third level, I haveused a cross-cultural framework to compare the differences between policymaker perceptions andconsumer decision-making in the U.S., an industrialized country which has had a national applianceenergy policy for more than 20 years and Thailand, a rapidly industrializing country which has initiated aset of national energy-efficiency programs within just the past five years.
This chapter synthesizes the threads of my research. It begins with a brief discussion of the salienceof energy efficiency in the appliance purchase decision, based on previous research and augmented bymy findings for the U.S. and Thailand. It then compares the ways in which policymakers from the twocountries make assumptions, gather information, and then develop and analyze consumer energy policy.This is followed by a discussion of the sales environment, including the role of the salesperson,salesperson incentives, consumer priorities, and consumer decision-making. The subsequent sectiondiscusses the impact of appliance energy labels in consumer decision-making and the role of energylabeling. And finally, in an effort to apply what I have learned to the practice of public policy, I make aset of policy recommendations that could help policymakers in both industrialized and developingcountries to better evaluate the impact and potential of appliance labeling policy.
How Salient is Energy Efficiency in the Appliance Purchase Decision?
Broadly speaking, policymakers use two models of consumer energy behavior. One model,consumers as active seekers of energy information, supports a policy of labeling and information tostimulate a consumer shift toward purchase of more energy-efficient appliances. A second model,consumers as passive and disinterested in energy efficiency, leads policymakers to support efficiencyimprovements primarily through mandated minimum efficiency levels, which are essentially invisible tothe consumer. These models represent two ends of a spectrum, and in reality they coexist.
In order to understand which model more closely reflects consumer behavior, I studied the salienceof energy efficiency in the appliance marketplace — that is, how important is energy use, or applianceoperating costs, or perceived product energy efficiency in the purchase of an appliance? Is it a major orminor factor in the sales transaction? And when we examine cognition in context, what factors makeenergy efficiency more or less salient?
In interviews with scores of retailers and hundreds of consumers in both the U.S. and Thailand, itbecame apparent that the energy efficiency of appliances was a much more salient issue in the Thai retailenvironment than in U.S. stores. In the U.S., the quality or property of being “energy-efficient” wasoften not clear to either the customer or the salesperson and was aptly described by one U.S. consumer asa “gray area.” While many of the factors involved in the evaluation and purchase of an appliance — e.g.,size, volume, price, financing options — are discrete and easily understood, most consumers were at aloss to describe or rate the energy efficiency, operating costs, or energy savings for particular products.During my two-week participant observation as a sales trainee at a New Jersey appliance store, energyefficiency was not a salient characteristic in discussions among salespeople or in actual salestransactions. In the twenty-five sales that I closely observed, the salesmen referred to the EnergyGuidelabel in only three instances, and efficiency appeared to be an important decision criterion in only onecase.
In contrast, energy efficiency was a salient issue among both salespeople and customers in Thailand.Energy efficiency, as represented by the number 5 (most efficient) rating on the appliance energy label,was described by the vast majority of Thai salespeople as an important and tangible criteria. Salespeoplereported that customers would often come into the store specifically seeking models with the number 5rating. In marketing jargon, this means that energy efficiency has become critical in the “screening”

8-3
stage of the purchase decision. Interviews and surveys with Thai consumers revealed that there is highawareness of the energy labeling program; that the label is effective at communicating the level ofproduct energy efficiency; and that a majority of consumers are purchasing energy-efficient models.Interviews with salespeople and with the marketing director of a Thai appliance manufacturer alsoindicated that the label is being widely used by manufacturers as a marketing tool.
There appear to be major national differences in the effectiveness of the U.S. and Thai programs.After just four years of implementation, why does the Thai appliance labeling program appear to behaving much greater impact on the consumer appliance market than the U.S. program? Four years ago,Thai consumers had no idea about the energy efficiency of appliances because there was no labeling orinformation available in the stores. Yet now, energy efficiency, while not among the top three consumerpriorities, has become a very important part of the appliance sales transaction.
How do Policymakers Get Information about and Design Policy?
While many social scientists who study consumer behavior have noted that consumers are notrational economic actors, it is equally true that the policymakers who design consumer energy policy donot design consumer policy in a way that reflects the actual behavior of consumers. In fact, manypolicymaker decisions and actions depend largely on their mental maps — that is, the assumptions theymake and the way in which they gather, organize, and interpret the information that forms the basis fortheir own decision-making (Eulau and Prewitt 1973; Wolman 1992). Our interviews with policymakersengaged in the formulation and implementation of energy efficiency policy in the U.S. and Thailandrevealed much about these mental maps.
Policymakers Do Not Use Empirical Data on Consumers
We found a disturbing tendency for policymakers from both countries to base their views ofconsumer behavior (and thus both the design and assessment of labeling programs) largely on personalexperiences and anecdotes — their own or others’ — about consumer preferences and behavior. Onlyabout half of the policymakers in either country appeared to recognize the value of basing policy onconsumer research; an even smaller percentage reported any input from consumers in the policymakingprocess. To the extent that it occurs, the feedback from consumers is usually from interestedintermediaries, filtered through dealers, distributors, and manufacturers who deal directly withconsumers. Stern (1993) recognized that the failure to involve consumers in the design of programsintended to change their behavior was a critical shortcoming in energy policy. He wrote:
[Policymakers] assume implicitly that programs can be designed optimally inadvance, with the result that when evaluation is used, it is used for final judgment ratherthan as a tool in the implementation process. In short, when policymakers applycommon sense, they are often led into error (Stern 1993: 1898).
Policymaker Perceptions of Barriers to Energy Efficiency

8-4
The majority of policymakers in both countries believed that they understood the most significantbarriers to improving consumer energy efficiency. U.S. policymakers seemed more convinced that pricewas the primary barrier to efficiency and would thus require some form of financial incentives in order toeffectively change the market. In contrast, while the majority of Thai policymakers cited price as abarrier, several of them, particularly managers within the electric utility’s DSM Office, took the positionthat the primary barrier was cultural and had to do with awareness.
This difference in perspective about the importance of price helps to explain the divergence inapproach between the U.S. and Thai energy efficiency programs. Over the past twenty years, financialincentives and rebates have been an important element within many federal and state programs as well asutility-sponsored DSM programs in the U.S. It is thought by U.S. policymakers that these incentives arenecessary in order to help offset the incremental first cost of energy-efficient products which save energyand money over the log run. However, the Thai DSM office has decided to implement its energy-efficiency programs primarily as voluntary-type programs. Since its inception in 1993, the Thai DSMOffice has pursued a strategy of relying largely on voluntary cooperation with manufacturers and limitedor no incentives or regulations. This is in contrast to the incentive-based approach proposed by Westernconsultants and the World Bank who advised the Thai government in the early 1990s, or thepredominantly regulation-based policies pursued in the U.S.
Which Programs Did Policymakers Believe to Be Effective?
Most U.S. policymakers viewed minimum efficiency standards as the most effective policy fordelivering energy savings. Only a small minority questioned the impact of standards and some of theseappeared to confuse their assessment of effectiveness with their ideological opposition to governmentinterference in the consumer appliance market. Financial incentives such as rebates were widely acceptedas effective, and there was also strong support for voluntary programs, although a number of U.S.policymakers thought voluntary programs unlikely to deliver large savings.
In Thailand, policymakers distinguished between “appropriate” and “effective” policies. While mostof the Thai policymakers viewed voluntary-type programs as appropriate for their country, theirresponses were evenly split between standards and voluntary or “cooperation” programs as being themost effective approach at saving energy. This belief in the appropriateness of voluntary programsreflects the direction that the Thai DSM program has taken during its initial four years ofimplementation.
The issue of financial incentives, especially rebates, was politically sensitive among the Thaipolicymakers. Of the three policy options we discussed — minimum standards, rebates, and voluntaryprograms, there was the greatest sensitivity to the concept of providing direct financial incentives (i.e.rebates) to either consumers or manufacturers. Two key policymakers in the Thai DSM Office statedunequivocally that rebates cannot work in Thailand. Their reasoning was that first, changes in consumerbehavior will reverse themselves after the rebates have been discontinued or phased out; and second,providing rebates will be politically untenable. They were sensitive to the political implications ofproviding rebates in a society where there is such a wide income gap between the rich people in Bangkok— who may be buying their second, third or even fourth air conditioner — and the poor farmers in thecountry, who may consider themselves lucky to have even a small refrigerator in their household. Theyargued that the bulk of the rebates would constitute a government subsidy of appliance consumption by

8-5
the wealthy.2 These opponents of rebates appeared to be going with their gut political instincts, andneither cited any specific research or surveys suggesting that rebates would be an unpopular policy.
The opposition to rebates was not unanimous, however. Two senior Thai policymakers felt thatsince rebates had been an effective policy in other countries and had been well received by manycustomers, they ought to be attempted in Thailand. Upon closer inspection, the concern over rebatesappears to apply only to certain types of high-profile energy-efficiency that would benefit wealthyconsumers. The Thai Energy Conservation Promotion Fund is providing financial incentives to factoriesand buildings to upgrade their facilities to comply with the Energy Conservation Promotion Act. And theDSM Office, as part of its industrial motors program, is providing rebates to factory owners to offset theincreased cost of buying energy-efficient motors.
Policymaker Perceptions of the Label
In the U.S., nearly all policymakers favored the intent of the appliance energy labeling policy andsupported the goal of providing information to consumers. However, policymaker viewpoints of labelingprogram effectiveness do not follow a logical chain of reasoning. Most of the U.S. policymakers putenergy efficiency far down the list of consumer priorities when purchasing an appliance. The U.S.policymakers are correct in asserting that energy consumption is not a top priority among U.S.consumers, but few questioned the effectiveness of the labeling program or were able to cite any researchor evaluation results to judge whether the program had been effective. That is, most of the U.S.policymakers seemed content to support the labeling policy, but not to question its effectiveness, even inlight of their perception that there is little consumer interest in energy efficiency.
In contrast to the U.S., Thai policymakers appeared to underestimate the importance of energyefficiency as a consumer priority. While most of the policymakers felt that the appliance energy labelingprograms had been effective, they tended to believe that the manufacturers, who had heavily marketedthe energy labels and increased the percentage of labeled products available, were primarily responsiblefor the program’s success. Only one Thai policymaker listed energy as among the top-three decisioncriteria for consumers. In fact, the data collected from Thai salespeople and consumers during thisresearch indicate that 50% of salespeople and 28% of consumers ranked energy efficiency among thetop-three consumer priorities. This may indicate untapped potential to build more consumer “pull” intothe Thai programs.
The Purpose of the Energy Label As Conceived by Policymakers
In our conversations with policymakers, we observed a fundamental difference in the stated purposeof the U.S. and Thai labeling programs. The objective of the U.S. program is primarily cognitive — toprovide consumers with information to assist in their appliance purchase decision. In contrast, theobjective of the Thai program is behavioral — to persuade consumers to use the label as a tool to buy amore efficient appliance that will save money and protect the environment. These differing purposes
2 A logical extension of this argument, not made by the interviewees, is “why should the government pay for
large power generation increases to provide for appliances for the wealthy?” One of the Thai air conditionersalesmen that we interviewed appeared quite uncomfortable with the current emphasis in the Thai programs onpromoting the sale of efficient air conditioners rather than the need to conserve.

8-6
have significant consequences for the way the labels are designed and promoted, and, ultimately, theireffectiveness.
In Thailand, the appliance labeling program is the centerpiece of a national demand-side management(DSM) program run by the Electricity Generating Authority of Thailand. EGAT has the largest nationaltelevision advertising account, and the vast majority of its television budget is for marketing the DSMprograms in general and the appliance labeling program in particular. During the program’s first fouryears, the DSM office has spent nearly 300 million baht (US$12 million)3 to promote its energy-efficiency programs, which include an energy-efficient lighting campaign and the labeling programs forair conditioners and refrigerators. The marketing campaign relies largely on the popularity and image oftelevision and movie celebrities and sports stars to promote the benefits of saving energy.
Another significant aspect of the Thai marketing campaign, besides its sheer size, is the broadness ofits message. The campaign explicitly links energy efficiency together with money savings and theenvironment in a patriotic appeal to consumers to help their country and buy an energy-efficientappliance in order to “save your money, save our energy, save the environment” (Ratanopas 1996).
In contrast to the high-profile nature and marketing flair of the Thai program, the U.S. applianceenergy labeling program is about to pass its twentieth anniversary, and much of the initial popularenthusiasm for the program — and indeed, for saving energy in general in the U.S. — seems to havedissipated. The major federal initiative to spur energy savings in the residential sector is the minimumnational efficiency standards for appliances.4 Energy labeling is an ongoing policy, but is not supportedby any national or local marketing or promotional efforts, as is the case in Thailand. Federalpolicymakers involved with the labeling program stated that the goal of the EnergyGuide label is not topromote energy efficiency or environmental awareness per se, but rather to fulfill the letter of the federallaw. The federal mandate regarding what must appear on the label is limited to the statutory directive inthe US Federal Code. The code itself requires the label to show (a) the estimated annual operating cost(if feasible), and (b) information on the range of operating costs.5
The difference between the two labeling programs is clear: the Thai labeling program is part of a pro-active national campaign operated by an aggressive national utility implementing its first-ever DSMprograms with the nation’s largest television advertising budget. Its goal is to exhort consumers to helptheir country by buying an appliance that will save energy, save money, and save the environment. TheFederal Trade Commission, the agency implementing the U.S. program, takes a legalistic position of itsmandate to implement the federal law.6 The U.S. program has virtually no supporting marketingcampaign, and does not have a high-profile public agency promoting it. It is ironic that, while the bestelectric utility DSM programs in the U.S. have consistently emphasized the role of trade allies andretailers in their appliance rebate programs, the U.S. federal labeling program —which, research hasshown, requires in-store information and assistance in order to be effective — has no linkage to themanagement or sales force of appliance retail stores.
In sum, policymakers often base energy policy on common sense and do not realize the need fordetailed consumer research. They do not use empirical data and tend to think of program evaluations asand endpoint, instead of an ongoing part of program development. Standards are viewed by U.S.
3 Assumes pre-July-1997 exchange rate of 25 baht = US$1.4 The standards were passed in the form of the National Appliance Energy Conservation Act in 1987.5 There is also a caveat that the operating cost may not need to be displayed if it “is not likely to assist
consumers in purchasing decisions.”6 One could speculate that — given its track record implementing the Energy Star programs — if the U.S.
Environmental Protection Agency were implementing the federal appliance labeling program, there would be muchmore emphasis on promotion and marketing.

8-7
policymakers as the most effective program in terms of saving energy. In Thailand, an equal number ofpolicymakers supported standards and voluntary or “cooperation” programs as being the most effectivetype of program. But the Thai policymakers feel that voluntary programs are a particularly effectiveapproach for Thailand, and they have largely eschewed incentive and rebate type programs designed forthem by U.S. and international consultants. I have also observed a fundamental difference in the intentand purpose of the U.S. and Thai energy labeling programs, which likely has much to do with the greatersuccess achieved by the Thai program.
The Role of Salespeople
Understanding the retail environment is critical to being able to design an effective appliance energypolicy, since appliance salespeople interpret product information and features for consumers and guidecustomers to the products that they want to sell themselves. Salesperson support of energy-efficiencyprograms is also important because the salesperson, with her influence over the customer purchase, hasthe ability to steer customers away from energy-efficient models as well as toward them.
As articulated by the salespeople whom I interviewed and observed in both countries, theiroverriding goal is to listen closely to the customer and to sell to the customer what the customer wants tobuy. At the same time, there is always an underlying tension for the salesperson: the need to strike abalance between serving the customer’s needs and selling the product that makes the salesman the mostcommission. I found that salespeople themselves, in both countries, claimed with confidence that theycould strike that balance and still exert a strong influence on the purchase decision of the majority ofcustomers.
Salesperson Influence
The role of the salesperson in influencing consumer choice has been recognized for years7, andretailers have been a cornerstone of the most effective DSM programs in North America. My researchwith consumers in the U.S. and Thailand revealed that up to two-fifths of consumers came to the storewithout having done any pre-store information search. This indicates, at the very least, that salespeoplewill likely have a large impact on this segment of buyers. A market study conducted for a regionalappliance retailer in the northeastern U.S. found that salesperson influence over model selection forwhite goods was significant, and typically in the range of 30-50%. For mid- to high-priced models withmore features, the influence tends to be even higher and can be as high as 75%.8
7 Beales et al. (1981) reviewed empirical studies on information search and found that the amount of external
information search that most buyers do is limited for all but the most expensive durable goods. Instead, consumerstend to rely on passively acquired information from prior personal experience, previous external searches, or low-involvement activities like advertising or word of mouth. They concluded that salespeople have the potential to exerta major influence on the consumers’ decision criteria
8 The study was based on consumer response to questions about the level of assistance and influence thatsalespeople had in the purchase decision.

8-8
Salesperson Incentives
Given the significant influence that salespeople have over the purchase decision, it is unfortunate thatthere is little or no incentive for salespeople in either country to promote energy-efficient appliances. Tothe extent that I observed incentives in my interviews and participant observation, these were primarilydriven by sales commissions. All of the salespeople whom I interviewed in the U.S. worked on acommission basis, while only half of the Thai sample earned a commission. In Thai department stores,there are two kinds of employees, those employed by the store and those employed by a brand distributor.The incentives for the latter appeared to be solely to sell their own specific brand name. In the U.S.stores I visited, the major incentive driving salespeople was the financial benefit of selling extendedservice plans. The salespeople earn relatively low base salaries and rely heavily on commissions. Andbecause they earn a much higher percentage on the sale of a service protection plan, as opposed to theircommission on the product itself, a salesman can often double what she earns on the sale of a singleproduct by selling a multi-year extended service plan.
The reality of retailing is that products with new and additional features make more money for thestore, and these are the products that the store management wants to sell. In general, products with morefeatures will have a higher retail price, make more profit for the store and the salesperson, and will belarger and use more energy. So in most cases, there are structural incentives to sell equipment thatactually uses more energy. The only exception to this I observed was the sale of room air conditioners inthe U.S. Unlike refrigerators or other kitchen appliances, room air conditioners do not have a lot ofdistinguishing convenience features. One of the store managers whom I interviewed described them asan “ugly box with brown on the front” (U.S. sales interview no. 13). Because of this fact and because ofthe high level of consumer awareness that air conditioners are expensive to operate, U.S. salespeople areable to use the EnergyGuide labels as a significant selling point for air conditioners. This is the onlyappliance for which I found this to be the case. And in the case of air conditioners (as compared to, say,refrigerators), more expensive units within a certain size range tend to be more energy-efficient. In thiscase, the salesperson’s incentive (increased commission income) is well aligned with the policy goal ofimproved energy efficiency.
The Value of Involving the Salesperson
Despite the fact that a number of U.S. research studies have concluded that in-store aids andsalesperson training were essential in order for appliance energy labels to be effective (Redinger andStaelin 1981, Anderson and Claxton 1982, BPA 1988), these elements have never been part of thenational labeling program in the U.S.. However, the value of ancillary information has been recognizedby other governments: for example, Australia has a companion consumer guide designed to support itsappliance energy label (SEC Victoria 1991), and in Denmark a pilot study found that simply trainingsalespeople and providing point-of-purchase information on energy efficiency can increase the prioritythat consumers place on energy efficiency as a purchase criterion (DTI 1994). This approach ofproviding point-of-purchase information is now being used by two national retailers, Montgomery Wardand Circuit City, that are participating in the Energy Star Retail Labeling Program in the U.S.
The Energy Star Retail Labeling Program is a joint program between the U.S. Department of Energyand the U.S. Environmental Protection Agency. It was designed to stimulate increased sales of energy-efficient appliances through better marketing and partnerships with retailers. The program, which has1,100 participating retail stores and 11 utility partners nationwide, consists of promotional activities withutilities, regional and point-of-purchase advertising and promotion, and labeling of products that meet

8-9
pre-specified efficiency levels. An initial pilot project in four cities had training of salespeople; underthe expanded program, a training manual is sent to participating utilities, but there is no required trainingfor salespeople — that is left up to the store. The energy label used in the program is roughly the samesize as the yellow EnergyGuide label and has a large “Energy Star” logo. It is placed only on qualifyingappliances — those that exceed the federal minimum efficiency standards by a specified amount.9 Thecontractor managing the program for the federal government conducted focus groups and surveys in anumber of participating cities and found that, while energy efficiency was not a “first-tier” issue,customers were more inclined to by energy-efficient products once they had been exposed to informationabout appliances and energy use (Brown and Whiting 1996; DOE 1995).
One successful outcome of the Energy Star Retail Labeling Program is that it has spurredmanufacturer interest in the use of the Energy Star logo as a marketing tool for the sale of high-efficiencymodels. Several manufacturers have petitioned the Federal Trade Commission for the right to voluntarilyprint a small rendition of the Energy Star logo on the yellow EnergyGuide label, for their qualifyingmodels. The manufacturers’ petition is currently being reviewed internally by the Federal TradeCommission and, if approved, will need to go through the process of federal rulemaking and publiccomment before it can be accepted as an amendment to the current U.S. labeling rules (Mills 1998).
In Thailand, the labeling program has been implemented without any input from, or participation by,appliance retailers. While the policymakers whom I interviewed at the DSM Office agreed that involvingsalespeople would be a good idea, they indicated that they had no plans to do so. Thai salespeopleappeared to receive significantly less training than their U.S. counterparts, and the only information theyreceived about the appliance energy label was from the national television advertising campaign.
In most cases, this poor communication may not much matter, since consumer demand for efficiencyis high. However, we found one example in Thailand of poor communication with retailers, whichcaused problems in program implementation. The air conditioner program labeling program wasdesigned to be supplemented with zero-interest loans of 5,000 baht (US$200) for units rated number 4,and 10,000 baht (US$400) for units rated number 5. The program is called the Green Shop program:customers buying air conditioners at participating “Green Shops” can apply for the loans. In the initialstages of program development, there was inadequate communication with the retailers involved in theprogram, and as a result, there was widespread confusion among retailers as to how the program shouldwork. Only 50 air conditioners were financed nationwide during the first month, and the DSM Officehad to set up a special bank of phones and staff to handle phone calls from retailers with questions aboutthe program. To its credit, the DSM Office recognized the problem and embarked on a crash program toeducate 400 retailers nationwide. Nonetheless, when we interviewed participating retailers in ChiangMai and Khorat, and in rural districts outside these cities nine months later, we found widespreadskepticism of the program, a feeling that it was poorly designed, and in some cases retailers would eventold us they would discourage customers from using the program.
The influence of salespeople is significant in the purchase of appliances. I conclude this based on myinterviews with salespeople in both countries; the fact that roughly 40% of consumers in both countriesperform no information search before going to the appliance store; and market research conducted forAcme Appliances in the northeastern U.S., which shows a strong salesperson influence in the selection ofwhite goods. Innovative programs in Denmark and the U.S. (Energy Star Retail Labeling program) havehighlighted the value of involving retailers and have also demonstrated that consumer research canimprove public policy
9 Qualifying levels are 13% better than federal standards for dishwashers, 15% for room air conditioners, 20%
for refrigerators, and 115% for clothes washers (Bodner 1997).
8-10
Consumer Priorities and Decision-Making
Consumer Priorities
I assessed consumer priorities in the purchase of appliances using three methods: interviews aboutconsumers with salespeople in both countries, interviews and surveys with consumers in both countries,and participant observation of consumer search preceding actual sales transactions in a U.S. store.Assessing consumer priorities from the standpoint of the retailer as well as consumer is a usefultechnique: because the salesperson has so much influence over the process, her view of consumerpriorities reflects not only what she views as consumer’s interests, but also to some extent her ownpriorities in selling. To the extent that there are differences in the priority rankings, these may reflect amisalignment between what the salespeople are trying to “push” and what the consumers think of asimportant.
In the U.S., price, features, and size were ranked as the top-three criteria by both consumers andsalespeople. The consumer responses showed a greater variety of priorities: five criteria were rankedamong the top three by at least 30% of respondents: price, features, size, quality, and brand. Energyefficiency was listed as a top-three criteria by only one in ten consumers and ranked ninth, after color,delivery, and finance.
The findings from the Thai interviews and surveys reveal some interesting differences between theresponses of the salespeople and consumers. Energy efficiency was ranked as the second highest priorityby Thai salespeople, ahead of size and price. Yet it was ranked as the fifth-highest priority by Thaiconsumers after brand, price, color, and quality. Still, three times as many Thai compared to U.S.consumers ranked energy efficiency as one of their top-three purchase criteria.
In terms of consumer energy policy, the most important result from this analysis of consumerpriorities is the difference in the priority placed on energy efficiency in the two countries. In the U.S.,energy efficiency was ranked as an important priority by just one in ten salespeople and consumers.Among the list of consumer-ranked priorities, it fell in ninth place. In contrast, in Thailand, energyefficiency was listed as a high priority by half of salespeople and nearly one-third of consumers.
Why is energy efficiency a much higher purchase priority for Thai consumers? Based on data fromsalespeople and consumers, I conclude that the major factor in the high priority placed on energyefficiency is the extensive television and media advertising campaign for the Thai DSM programs,including the labeling program. Ninety percent of recent appliance buyers and 80% of the non-buyerswere aware of the energy labeling program and high percentages of consumers were also aware of thenumerous other national, energy efficiency programs. This awareness, combined with the simplicity ofthe Thai energy label (1 to 5, where 5 is the best rating) make it easy for Thai consumers to seek out andselect energy efficiency in the appliance store. There appears to be no other adequate explanation for thefact that energy efficiency is being widely used as a screening criteria by Thai appliance purchasers justtwo years after introduction of the energy label.
Consumer Decision-Making
Research cited in Chapter 2 has concluded that in the area of appliances, information search is a two-stage process: initially consumers compare (i.e. screen) all alternatives on just one or a few attributes.When the search continues, they select a smaller number of alternatives and compare these on all

8-11
available attributes (Bettman 1979; Verplanken 1990 cited in de Loor 1991). Olshavsky (1973)distinguished a third phase in the appliance shopping process. During this final stage, he found thatconsumers weighed the various non-product attributes (such as financing and service protection) beingoffered by the store.
My observation of appliance sales transactions supports a multi-stage theory of decision-making. Forexample, I found that consumers appeared to negotiate on price only after they had selected an appliancebased on a certain set of features. During the qualifying stage of the sales transaction, they tended topresent two or three primary screening criteria, which typically include size, type of model (e.g. side-by-side vs. top-mounted refrigerator-freezer), price, or brand. Then, either by themselves or with assistancefrom a salesperson, they would focus in on the detailed differences between the products that meet thescreening criteria. And in a few cases, as Olshavsky suggested, a non-product attribute would tip thebalance in favor of a particular selection.
I also found that price was rarely the single highest priority in the consumer purchase decision. Mostconsumers wanted a “good deal”, but did not come to buy the cheapest appliance in the store. Only aftercertain criteria were met did price became the key negotiating point. Often, consumers would come intothe store with a certain price range in mind, and then allow the salesperson to “step them up” to a higher-priced models that had additional features they desired. One consumer put it this way, “the bottom line isthat the bottom line makes a difference, but there are some elegant negotiables” (U.S. consumerinterview no. 5).
This remark illustrates the nature of consumer decision-making and highlights opportunities fortargeted policy intervention. First, it illustrates that once the basic screening criteria have been met,consumers may be interested in trading off small increments in purchase price for additional features oroptions (the elegant negotiables). Second, by reinforcing the multi-stage nature of decision-making, ithighlights the fact that energy efficiency could potentially have an impact on the decision process at morethan one stage. As described in Chapter 5, my conversations with salespeople have led me to concludeenergy efficiency is already being used as a first-stage screening criterion in Thailand and has thepotential to be used as a second-stage criterion in the U.S.
The Role of Energy Labeling
Awareness of the Label
Despite a high level of label awareness in both countries, it was apparent in my discussions withsalespeople in both countries that customers spend very little time deciphering the label. At the sametime, consumers are likely to receive very little help on the label from salespeople. Given the timeconstraints on the sale and the many other factors in the purchase (brand, price, color, features,availability, etc.), salespeople have little time to spend explaining the detailed technical information onthe label.
Reading the Label
Salesmen reported that 62% of Thai consumers asked about or looked at the energy labels, comparedto just 20% of U.S. consumers. The corresponding numbers were much higher when we asked theconsumers themselves; however, only a minority reported that they read the labels carefully — 26% in
8-12
the U.S. vs. 16% in Thailand. It thus appears that most consumers are likely to glance at the label brieflyand read it only in passing. This finding argues for the need to provide a clear, simple message on thelabel in large font and to supplement this with detailed information that does not detract from or mask theprimary message.
Interpreting the Label
The results of my in-store tests of label cognition reveal that while the Thai label is more effectivethan the U.S. label at conveying the concept of energy efficiency, there are problems with theinterpretation of both labels. The U.S. respondents had difficulty interpreting several elements of theEnergyGuide labels, including the dollar cost figure on the old label and the scale of relative energy useon both the new and old labels. The majority of U.S. consumers felt uncomfortable with kilowatt-hoursas a metric for comparing different models, and many complained that there was too much detailedinformation on the label.
Compared to the U.S. respondents, there were fewer misconceptions among Thai consumers in thetests of label interpretation. Most of the Thai consumers tended to focus exclusively on the 1 to 5ranking at the top of the label, and few were comfortable reading the technical details at the bottom. Thisis supported by the finding that 85% of Thai consumers responded that they either did not understand thelabel (~22%), or understood it only somewhat (~63%). The label appears to succeed at conveying theconcept of energy efficiency, but it also intimidates many consumers who do not feel fully comfortableinterpreting the technical details on energy use, operating cost, and size at the bottom.
We also found two types of misinterpretations about the label among a small proportion of Thaiconsumers. Several villagers confused the numbering system on the thermostat dial inside therefrigerator with the 1 to 5 rating system on the energy label, indicating that they preferred to keep theirrefrigerator at 1 or 2 and that a refrigerator rated 4 or 5 would be too cold for their needs.
A second misinterpretation was more widespread. A number of rural and urban consumersapparently conflated the properties of energy efficiency and quality, assuming that the highest-ratedmodel (rate 5) was the highest overall quality. While this might be a favorable outcome for energyadvocates, it is misleading and could potentially result in negative backlash if consumers buy energy-efficient models and are disappointed with the quality of other aspects of the product’s performanceThese misconceptions of the label’s meaning can be dealt with through education by retailers andexposure to the labels in a store environment. At the same time, they demonstrate the need for greaterclarity in the label design, as well as for intermediate evaluations of consumer reaction to the label duringthe process of label development.
Recommendations
The fundamental recommendation of this dissertation is to apply Stern’s dictum about the need forconsumer-based scientific research (Stern 1993) to the area of appliance energy policy. The researchdescribed in this dissertation took the consumer as its central focus. This research project is unique inthat it is the first time consumer responses to energy labeling have been studied as a problem of consumercognition in context (per Lave, Murtaugh, and de la Rocha 1984; Rogoff 1984). This kind of consumer-based input is essential to the development of effective policies that work because they are based onsound research.

8-13
My interviews with policymakers in the U.S. and Thailand revealed that the mental maps ofpolicymakers — their expectations and preferences, and perceptions of their environment (Eulau andPrewitt 1973) — are not attuned to the importance of using consumer-based research as the basis fordeveloping energy policy that relies on consumers to engage in certain behaviors. The Thai DSM Officehas taken a huge step beyond U.S. policymakers by successfully marketing its labeling program to theThai masses through television and other media. However, the Thai policymakers developed the labelwithout significant consumer input and have not relied on evaluations or partnerships with retailers toimprove the effectiveness of the labeling program.
Methodological Recommendations
Policymakers designing consumer energy programs that depend on consumers to act in a certain wayshould use a mix of research techniques in order to identify key problems, frame important researchquestions, develop useful research and policy instruments, and ultimately craft effective responses toproblems. The combination of methodologies used in this research — participant observation,unstructured and semi-structured interviews, a survey questionnaire, and independent assessments of theperspectives of consumers and salespeople — allowed me to build a strong basis for assertions aboutconsumer behavior and then to test these assertions using data from different sources. Other studies ofappliance energy labels have taken one of two approaches: surveys or interviews with consumers to gettheir responses to the label; and laboratory experiments, removed from the retail environment which testlabel understanding and cognition, but out of the context of the retail environment.
It is important to avoid the problem of response bias in consumer surveys on energy. The samemistake has been made repeatedly by researchers studying energy labeling in the U.S, the UnitedKingdom, and Australia: researchers can bias their findings by revealing their interest in energy in theearly stages of an interview, thus obtaining inflated estimates of the impact of energy efficiency. In orderto obtain an unbiased perspective of how consumers weigh the multitude of different criteria in anappliance purchase, it is important to develop a neutral survey instrument. I did this by referring to myinterviews and surveys as generic marketing research on appliances.
Finally, I cannot overemphasize the value of using participant observation as a bedrock tool forstudying any problem, but the appliance energy transaction in particular. I used it both in acting as asalesman and in following consumers through 25 purchase decisions. By actually spending timeobserving the nuances and signals in the retail environment, the researcher develops the basis for furthertools such as interview protocols and surveys, while also improving the robustness of her results andconclusions.
Retailers: The Missing Link
Retailers are the critical missing link in both the U.S. and Thai labeling programs. Because of theirinfluence on appliance selection, which appears to be significant in at least 30-50% of transactions,retailers represent enormous potential for leveraging a labeling program. It is ironic that one of thecentral lessons of U.S. experience in demand-side management programs — the importance ofdeveloping trade allies — is being ignored in the U.S. EnergyGuide labeling program. In Thailand, theeffectiveness of its successful labeling program is also being limited because of a lack of involvement ofretailers in the program design.
8-14
My participant observation with a U.S. appliance retailer, combined with interviews with more than60 salespeople in both the U.S. and Thailand, allowed me to carefully study salespeople’s incentives.Unfortunately, there exist no incentives — besides altruism — for salespeople in either country toactively promote the sale of energy-efficient appliances10. In fact, the incentives actually work againstenergy efficiency, since salespeople are rewarded with higher commissions for selling products withadditional features that use more energy. This fact, combined with the fact that energy efficiency isextremely low on the list of selling points for most salespeople, suggest that without some form ofincentive structure, it will not be possible to enlist salespeople as effective allies in an energy labelingprogram.
Improving Energy Labels
By conducting a micro-level study of consumer cognition of the label in the retail environment, I wasable to gain insight into the qualities that would allow a typical U.S. or Thai consumer to use the label asa decision tool while they are simultaneously shopping on a number of other criteria. Below is asummary of the major lessons learned from my study of label cognition. While many of these samerecommendations appear in the literature on labeling, a scan of appliance energy labels worldwideindicates that few of these guidelines are being followed by policymakers.
Simplicity. Consumers stressed the need to make the label simple to understand. One U.S. consumersaid that a sixth grader should be able to read the label. In fact, a number of consumers in both countriesfelt overwhelmed by the amount of detail on the label and used phrases like, “I could understand it if Ihad a calculator,” or “If I were an electrician, I could figure it out.” These responses reflect afundamental disconnect between the mental maps of policymakers and marketers. Policymakers want toprovide as much detailed, accurate, and relevant information as possible. Marketers want to raiseawareness about a product and get consumers to develop a positive association with that product.Policymakers need to learn to think more like marketers, and they can begin by designing a simple label.
Single Message. To be effective, an energy label should have a large logo, or large, bold fontconveying one primary message. The Thai label has compromised the effectiveness of its simplenumerical rating system by cluttering the bottom two-thirds of the label with detailed productinformation, including a measure that is meaningless to virtually all consumers: a measure of efficiencyexpressed in cubic decimeters per kilowatt-hour. As a result, 85% of Thai consumers in our survey saidthat they either did not understand or only somewhat understood the label. Fortunately, the message to“buy number 5” is strong enough that Thai consumers are using the label as a screening tool even withouta full understanding of what it means.
Compartmentalize the Details. Consumers in both countries often seemed overwhelmed by thetechnical nature of the information presented in the labels. Admittedly, consumers are not homogenous,and there will be a stratum of consumers who read the label in detail. These people are important for tworeasons: they are the consumers most likely to use the label to purchase an energy-efficient unit; and theyare also likely to talk about the label and share their opinions with others. My recommendation is not to“dumb down” the label, but rather to compartmentalize the detailed, technical, product information so
10 The one exception to this is air conditioners, a product for which higher prices within a category tend to
correlate with higher efficiency and higher commissions.

8-15
that it does not impede understanding of, and access to, the primary label information. This will assistthe large majority of consumers who might be interested in energy efficiency, but are not technicallyoriented, and who do not have more than a few seconds to scan the label and decide whether it is a usefuldecision tool.
Good Formatting. Many of the problems with the U.S. EnergyGuide label could be solved by betterformatting and design. The new label is much improved relative to the old label in that it has a clearerscale set in a box so that it stands out against the background of the label. The scale also works better onthe new label because the arrow indicating where the particular model falls is larger, bolder, and clearlylinked to the energy use figure above it. However, the new label still fails is in its lack of any primaryemphasis. There is no central message, no text or figures in large type to get the consumer’s attention.The critical cognitive point learned from this research is that the size of typography should beproportional to the importance of the label element. Using input from the consumer interviews, I havedesigned a sample improved EnergyGuide label, which can be found in Appendix I.
The Value of Money. A major advantage of doing store-based research of label comprehension isthat it allows you to develop a real-time understanding of how to get consumers to behave the way youwant them to. In my conversations with U.S. consumers, I found that they overwhelmingly preferred tosee a dollar amount on the label that would show them how much a model would save. While theimplementation of dollars as a metric poses logistical difficulties from a policymaker’s viewpoint, it isimportant for policymakers to respect the consumer preference for currency over energy units.Consumers indicated that cost comparisons — and not comparisons of energy units — would allow themto make meaningful tradeoffs between models as they shop.
Because operating cost is set in such small type on the Thai label, few Thai consumers use it duringtheir selection of an appliance. The Thai label can be improved by making annual operating cost asecondary message and setting it in larger type. Sample, improved label designs for both the U.S. andThai labels, based on consumer recommendations, are shown in Appendix I.
A Research Agenda for Appliance Labeling
While I have learned a significant amount from this research about the retail appliance environmentand consumer purchase behavior, there remain a number of fundamental questions that require additionalresearch in order to facilitate the development of more effective appliance energy policy. This problemis particularly worthy of further study because of the enormous economic and environmental impacts ofthe continuing proliferation of appliances not only in industrialized nations, but in developing countriesas well. Below, I briefly outline a research agenda for appliance labeling issues. Most of these elementswill apply to both industrialized countries that already have a labeling program as well as to developingcountries that are considering initiating such a program.
Elaborate the Stages of the Decision-Making Process. An improved understanding of the consumerdecision-making process will help policymakers target possible intervention points for energy efficiencyas a selling point. This research can be done through participant observation of consumers both as theyplan their purchase and then at the store as they compare a range of alternatives. Do most consumershave a two-stage decision process, or is there a third stage at which non-product attributes are weighedand assessed? Semi-structured interviews can also be used to test different models of decision-making inorder to determine where energy efficiency is most likely to play a significant role and how the message

8-16
can best be packaged. Close cooperation with retailers will be important in order to understand thestructure of a typical sale and to identify the stages at which stages retailers can introduce energyefficiency during the sales presentation.
Develop a Methodology for Measuring Label Effectiveness. Since my study of energy labelingcognition in context was the first of its kind, I developed ad hoc criteria for measuring and comparingconsumer understanding of label elements. For international comparisons of label effectiveness to bemeaningful, there will need to be an accepted methodology for comparing label cognition. The two keyquestions that need to be asked about label effectiveness are: How effective is the label at beingunderstood by consumers? and How effective is the label at achieving policy objectives, such as amountof energy savings?
A methodology for measuring consumer understanding could be drawn in part from literature oncognition and information processing and would deal with topics such as processing time, recall ability,and comparisons of comprehension of different label elements. Effectiveness at achieving policyobjectives would include a number of topics, including comparison of the impact of different types oflabels. For instance, what are the energy impacts of an in-class labeling system (which provides arelative ranking for products within separate size categories, as in Thailand) and an absolute rankingsystem (such as the mile-per-gallon ratings on cars, which clearly reflect the larger energy impact ofdriving large cars that get fewer miles per gallon). These are important issues that need to be consideredin developing an appliance energy rating system. In Thailand for example, the current labeling systemfor refrigerators will soon be expanded to cover multi-door models much larger than the four- to six-cubic-feet volume that is typical of Thai refrigerators today. A consumer comparing a six-cubic-footmodel with a 10-cubic-foot model might look at a number 5 label in both cases, but the numerical ratingsystem does not reflect the much larger energy impact of the 10-cubic-foot model.
Develop a Scheme for Revising Label Categories. Other policy issues related to labeling include thelong-term implications of different labeling schemes. One current issue in labeling policy is how toadapt categorical rating schemes once efficient products begin to become “crowded” in the highestefficiency categories. These issues are not resolved and are currently being addressed in Europe andAustralia In Europe, there is no standard procedure for periodically updating the label categories, but thecommission hires consultants who assess the distribution of models in the market and determine whetherthe categories are out of date. The choices they are considering are to add an A+ category or to retest allmodels and reset the thresholds from A to G (Waide 1998). In Australia, policymakers are consideringwhether to open up the six-star rating system to, say, eight or 10 stars, or whether to retest all productsand re-grade them back to five stars11 (Harringon 1998). In either case, the development of categoricallabeling systems is not a one-time activity and requires analytical expertise to regularly monitor andassess the impact of the categories. In addition, the labeling systems should have some sort of regularreview process built into the legislation.
In this regard, labeling schemes that do not have fixed categories have certain advantages. The fueleconomy labels for cars use miles per gallon and avoid this problem entirely; and the dollar-based U.S.appliance labels reduce the problem by simply requiring periodic revision of the empirical data (cost ofenergy, high and low models in each category).
11 The Australian label was designed in 1986 with six stars as the highest efficiency rating. The selection of six
stars was unfortunate, since surveys have shown that most consumers believe that five stars is the highest rating.

8-17
These issues form the basis for policy-related research that would be useful to policymakers aroundthe world who are implementing labeling programs or considering initiating programs. They need to beexplored in order to develop a systematic way of comparing different labeling and rating systems that canbe used by policymakers as a gauge of both consumer understanding and policy impact.
Tests of Label Cognition. This study has produced valuable information on consumer cognition ofthe U.S. and Thai appliance labels. However, more basic research needs to be done starting from thefundamental question of what is the best format for providing information that is useful to applianceconsumers. This research could begin with in-depth, unstructured interviews with a small sample ofconsumers to elicit a range of ideas for communicating energy efficiency through a label. As mentionedearlier, the findings from my study suggest that a 1 to 5 rating system is effective at identifying efficientmodels, but that it is not good an differentiating between gradations of efficiency. Tests with the U.S.label suggest that dollars are an extremely effective way to communicate with consumers and thatconsumers expect to see a dollar number that represents savings, since that is how they tend to calculatetheir own economic benefit. These are just some of the issues raised in my study that could lead topossible variations on label formats. There are also a number of different labeling formats in useinternationally, and these were described briefly in Chapter 2. They include categorical labels with acontinuous scale (such as the U.S. and Canada); categorical rating systems with numbers (such as Koreaand Thailand); categorical rating systems with stars (Australia); and categorical rating systems withletters (European Union). Sample labels using these and other formats could be tested in focus groups atseveral early points in the design process, before a more systematic, in-store study of cognition is carriedout. This study should include at least one professional researcher with a background in marketing andproduct promotion, and in cognition of “mental math.”
In-Store Tests of Label Impact. The results of a label cognition study should be used to assess theimpact of labels in an actual retail situation. The only similar study of which I am aware was a 1981study by Redinger and Staelin carried out at a White-Westinghouse warehouse, in which theymanipulated the treatment of labels and salespeople and measured the impact on the efficiency ofrefrigerators selected. A similar type of study could be carried out in an appliance store with trainedresearchers as salespeople. The goal of such a study would be to manipulate the treatment of a numberof different label designs and a number of different levels of salesperson involvement on the efficiency ofappliance models selected.
Experiment with Retailer Incentives. Salespeople are the group that exerts the most influence onconsumer appliance purchase decisions. It would be valuable to test the impact of retailer incentives onthe sale of energy-efficient appliances. Experiments in Denmark (DTI 1995) and with the U.S. EnergyStar Retailer Labeling Program (Bodner 1997) have shown that salesperson education can have asignificant impact on sales of efficient appliances over a short time span. Such an experiment inThailand could cover not only training but also ongoing incentives, by either adding an incentive forefficiency or removing current incentives against efficiency. Incentives could be on both a commissionand per-unit basis, to determine their impact, to assess which types of incentives are most effective, andto allow a benefit-cost analysis of the savings resulting from the program.
The Basis of Appliance Demand

8-18
An additional set of research topics could be addressed in developing countries that are coping withrapidly increasing power demand due to increases in appliance saturation. Policymakers in thesecountries will need to take a broader perspective than just examining labels and technical methods forimproving appliance efficiency. These studies can assess the underlying bases of consumer demand forappliances and investigate options for providing consumer satisfaction and mitigating energy demandbesides just the promotion of technical efficiency improvements.
Appliance Usage Surveys. Appliance usage surveys are an important step for developing countriesand provide data that can prove useful on a number of levels. Typically these studies are carried out byexperienced survey researchers who gather detailed data on types of appliances, power demand, andpatterns of use. Thailand developed its end-use load forecast for the residential sector in 1990. Thesedata were subsequently used in the development of savings estimates for the national DSM Master Planin 1991. Such data can also be used by policymakers to prioritize the end-use technologies that are themajor drivers of demand.
Study of Consumer Appliance Demand. The small research project in this dissertation on appliancesin rural Thailand is an example of how unstructured interviews can be used to understand the causes ofdemand and identify possible policy responses that would help to mitigate that demand. Two of myfindings on rural Thai consumers could lead to further research projects. These findings were part of thisresearch but are not reported in this dissertation. They will be published separately elsewhere.
One is the finding that many consumers, in both urban and rural districts, tend to increase their foodstorage in a modular, step-wise function. That is, when their six-cubic-foot refrigerator is no longer largeenough, they buy another six-cubic-foot unit. From a efficiency perspective, this is much more wastefulthan operating one 12-cubic-foot refrigerator. Research could more fully explore the behavioral aspectsof refrigerator purchase behavior; the social and economic considerations in play when consumers shopfor their refrigerator; and the limitations of a policy that would promote replacement of smallrefrigerators with larger units when a family outgrows the smaller unit. There may also be otherconsiderations that would argue against the promotion of larger units, such as the fact that the larger unitsare not accepted by Thai homeowners, or that widespread promotion of larger units might have theopposite of the intended effect and lead to increased energy demand countrywide
Another possible topic is generated by my finding that more than half of the rural consumers whom Isurveyed said that they did not want to buy an air conditioner. This leads to the question of whyconsumers are buying new air conditioners, a question that has not been studied in any detail in Thailandor many developing countries. For example, the villagers whom I interviewed said that the type ofpeople who own air conditioners are people who build new houses. But why are these people installingair conditioners when they build new houses? Is it because new houses are not constructed using passivesolar techniques such as large overhangs, proper orientation, natural ventilation, and high ceilings, whichwould obviate the need for an air conditioner? Is it because having an air conditioner is a status symbol?A unique research project in Bangkok called the Residential Energy Efficiency Project tested the abilityof ceiling insulation to reduce indoor ceiling temperatures, and reduce air conditioner demand in aBangkok residence (Parker 1994). Similar research could be carried out in traditional-style and newlyconstructed houses in rural Thailand to test levels of temperature, thermal comfort, ventilation, andenergy use and determine optimal housing designs that could be used in new construction. Such researchcould also incorporate local builders to provide training in passive solar design techniques and develop anetwork of firms that can build low-energy houses.