Embed Size (px)
Citation preview

Energy Policy to Cope with Energy Policy to Cope with Climate Change in TaiwanClimate Change in Taiwan
Dr. ChiDr. Chi--Yuan LiangYuan LiangChairman of Chung-Hua Institution for Economic Research
Chair Professor of National Central University
March 12, 2012
RECCS Road-Show Project: Increasing Climate Chang Impact Assessment Cpacity in Asia

2
OutlineOutline
1. Characteristic of Energy Situation in Taiwan
2. Framework of Sustainable Energy Policy
3. Energy Policy to Cope With Climate Changes

3
1. Characteristic of Energy Situation in Taiwan

4
1.1 Imported Energy Ratio
1) The imported energy ratio and the concentration rate of energy supply are conventionally chosen as key energy security indicator.
2) In addition, for coping with the global warming issue, CO2 per capita CO2/ GDP are also important to be considered.
3) The imported energy ratio is defined as:
Imported Energy / Total Energy Supply
4) For each of energy resources, Taiwan’s imported energy ratio was 98.1 percent in 2009. That was the highest one among 10 major countries. Next to Taiwan were Korea (97.6%), Japan (95.6%) and France (91.4%). Conversely, PRC (12.4%), United Kingdom (34.2%) and the United States (34.5%) were among the lowest. (see Figure 1)

5
1.1 Imported Energy Ratio (Cont.)
5) Compared to the other types of energy, a small amount of nuclearfuel can generate a lot of energy and lasting for much longer time. Therefore, in some countries, e.g. Japan, define nuclearnuclear energy as a quasi-indigenous energy.
6) Even though nuclear is excluded from imported energy, Taiwan’s imported energy ratio (87.6%) was still the highest one among major countries. (see Figure 1)

6
Figure 1. Imported Energy Ratio (2009)
98.1 97.6 95.6 91.4 88.6 83.972.1
34.5 34.2
12.4
78.8
25.7
83.981.7
50.9
80.487.6
61.5
24.9
11.6
0
20
40
60
80
100
120
Taiwan Korea Japan France Spain Italy Germany USA UK PRC
%Energy Imported / Total Energy Supply Energy Imported(Excluing nuclear) / Total Energy Supply

7
1.2 Energy Concentration Ratio
1) The energy concentration ratio (ECR) is calculated as follows:
i=1,2,3,…
where SEi denotes i type of energy in total energy supply
2) The higher energy concentration ratio, the lower energy security will be.
Taiwan had higher relative ECR, i.e., 63.4% among the major countries in 2009, only next to PRC (70.0%) and Italy (66.2%).
The United States was among the lowest (53.1%).
(see Figure 2)
i
EiSECR 2

8
Figure 2. Concentration of Energy Supply (2009)
63.4 62.5 60.554.0 53.4 53.1 51.6 50.4 49.5 48.4
66.270.0
0
10
20
30
40
50
60
70
80
PRC Italy Taiwan Korea UK Spain France USA EU Japan World Germany
%

9
1.3 CO2 Emission, CO2 Per Capita
1) Taiwan emitted 276 million tones of CO2 in 2007, ranked the lowest among major countries. (see Figure 3)
2) However, Taiwan CO2 per capita recorded 12.1 tones/person, ranked the second and only next to the United States (19.1 tones/person). (see Figure 4)
3) Taiwan’s high CO2 per capita could be attributed to:
Taiwan is an export-oriented economy.
(export accounted for 70 % of GDP)
High energy intensity or high ratio of (energy consumption)/GDP
High CO2 emission per kWh of electricity generation
(See Figure 5)

10
Figure 3. CO2 Emissions (2007)
6027.855769.31
1236.34798.44
523.01 488.71 437.56 369.31 344.7 276.18
0
1000
2000
3000
4000
5000
6000
7000
PRC USA Japan Germany UK Korea Italy France Spain Taiwan
Mt of CO2

11
Figure 4. Per capita CO2 (2007)
19.1
12.1
10.1 9.7 9.78.6
7.7 7.4
5.84.6
0
5
10
15
20
25
USA Taiwan Korea Germany Japan UK Spain Italy France PRC
per capita CO2

12
Figure 5. CO2 Emission per kWh of electricity generation (2007)
655
549
455 450427
405
205
9040 23 7 1
0
100
200
300
400
500
600
700
Taiw
an
Unite
d St
ates
Sout
h Ko
rea
Japa
n
Germ
any
Neth
erla
nd
Cana
da
Fran
ce
Swed
en
Switz
erlan
d
Norw
ayRe
publ
ic of
Icel
and
gCO2/kwh
Source: IEA CO2 Emissions From Fuel Combustion, 2009 edition

13
1.4 CO2/GDP
1) PRC registered the greatest CO2/GDP (2.52kg/$US 2000 prices) among 10major countries.
2) Next to PRC are Korea (0.69kg/ $US 2000 prices), Taiwan (0.66 kg/ $US 2000 prices) and the United States (0.5kg/ $US 2000 prices).
(see figure 6)
CO2/GDP is adjusted by purchasing power parity3) After purchasing power parity adjustment, PRC still had the highest
CO2/GDP ratio (0.61kg/ $US 2000 prices).
4) United States ranked the second (0.5 kg/ $US 2000 prices).
5) The followings are Korea and Taiwan.
(see Figure 7)

14
Figure 6. CO2/GDP (2007)
2.52
0.69 0.660.5 0.47 0.39 0.37 0.3 0.25 0.24
0.0
0.5
1.0
1.5
2.0
2.5
3.0
PRC Korea Taiwan USA Spain Germany Italy UK France Japan
kgCO2
(in 2000 US prices)

15
Figure 7. CO2/GDP(PPP adjusted) (2009)
0.61
0.50.46
0.43
0.34 0.340.32
0.29 0.28
0.21
0
0.1
0.2
0.3
0.4
0.5
0.6
0.7
PRC USA Korea Taiwan Japan Germany Spain UK Italy France
kgCO2 (in 2000 US prices)

16
1.5 Energy Consumption / GDP
1) Since CO2 emission mainly comes from energy consumption, the ranking of CO2/GDP are highly correlated with that of Energy consumption/GDP with only exception of France.
2) France uses a lot of zero carbon nuclear energy.
(see Figure 8, 9 and Figure 10)

17
Figure 8. Energy Consumption/GDP (2009)
3126
20 20 18 16 15 12 10
82
0
10
20
30
40
50
60
70
80
90
PRC Korea Taiwan USA Spain France Germany Italy UK Japan
toe/thousand(in 2000 US prices)

18
2120 20
1715
14 1413
1211
0
5
10
15
20
25
Korea PRC USA Taiwan France Germany Japan Spain UK Italy
toe/thousandUS$ in 2000
Figure 9. Energy Consumption/GDP(PPP adjusted) (2009)
We conclude that Taiwan is vulnerable to all kinds of energy We conclude that Taiwan is vulnerable to all kinds of energy security indicators by international level.security indicators by international level.
19
1.6 Changes in Imported Energy Ratio and Consumption of Energy Supply
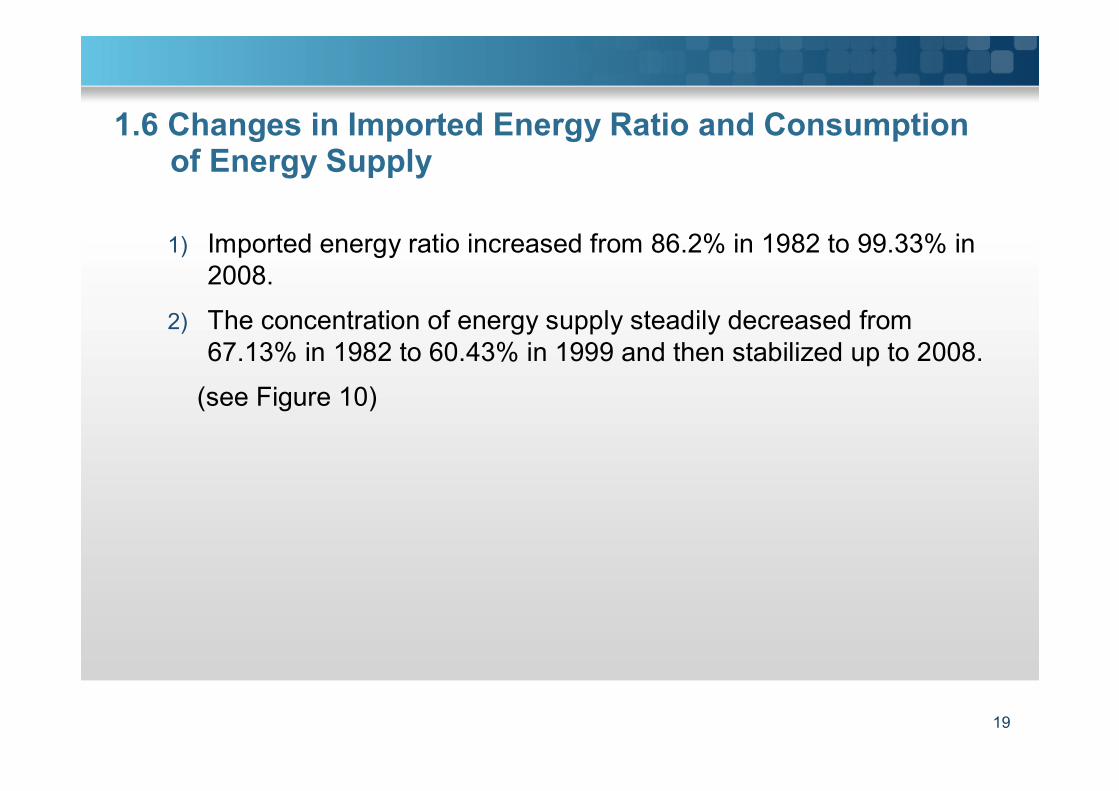
1) Imported energy ratio increased from 86.2% in 1982 to 99.33% in 2008.
2) The concentration of energy supply steadily decreased from 67.13% in 1982 to 60.43% in 1999 and then stabilized up to 2008.
(see Figure 10)

20
Figure 10. Imported Energy Ratio & Concentration of Energy Supply in Taiwan
0
20
40
60
80
100
120
1982
1984
1986
1988
1990
1992
1994
1996
1998
2000
2002
2004
2006
2008
%Imported Energy RatioConcentration of Energy Supply

21
3) Per capita CO2 of Taiwan showed a trend of increase during 1982-2008 with the only exception of 2008.
4) The decrease of per capita CO2 in 2008 is due to the financial tsunami and the improvement of the energy efficiency.
(see Figure 11)
5) Taiwan’s CO2/GDP showed a trend of decrease during 1982-1999, while it reversed during 1999-2003.
6) Finally, it showed a trend of decrease during 2003-2008.
7) In the meanwhile, the changes in energy intensity showed the similar patterns.
8) During 1999-2006, the energy intensity increase 3.4%, compared to a decrease of 20 percent during 1982-1999
(see Figure 11, 12, and 13)
1.6 Changes in Imported Energy Ratio and Consumption of Energy Supply (Cont.)

22
Figure 11. Per capita CO2 emission
0.0
2.0
4.0
6.0
8.0
10.0
12.0
14.0
1982
1984
1986
1988
1990
1992
1994
1996
1998
2000
2002
2004
2006
2008
toe/people

23
Figure 12. CO2/ GDP (kg/1000NT$)
18.5
19.0
19.5
20.0
20.5
21.0
21.5
22.0
22.5
23.0
23.519
82
1984
1986
1988
1990
1992
1994
1996
1998
2000
2002
2004
2006
2008
kg/1000NT$

24
Figure 13. Energy Intensity (LOE/1000NT$)
Energy Intensity(LOE/1000NT$)
7.07.58.08.59.09.5
10.010.511.011.5
1982
1984
1986
1988
1990
1992
1994
1996
1998
2000
2002
2004
2006
2008
Year
LOE/
1000
NT$

25
1.6 Changes in Imported Energy Ratio and Consumption of Energy Supply (Cont.)
This could be contributed to:
1) The changes in share of energy-intensive industries in total energy consumption.
It decreased during 1982-2003, while it increased during 1999-2003.
2) The changes of energy price
especially the increase of energy price led to the decrease of energy intensity during 2003-2008.

26
2. Framework of Sustainable Energy Policy
27
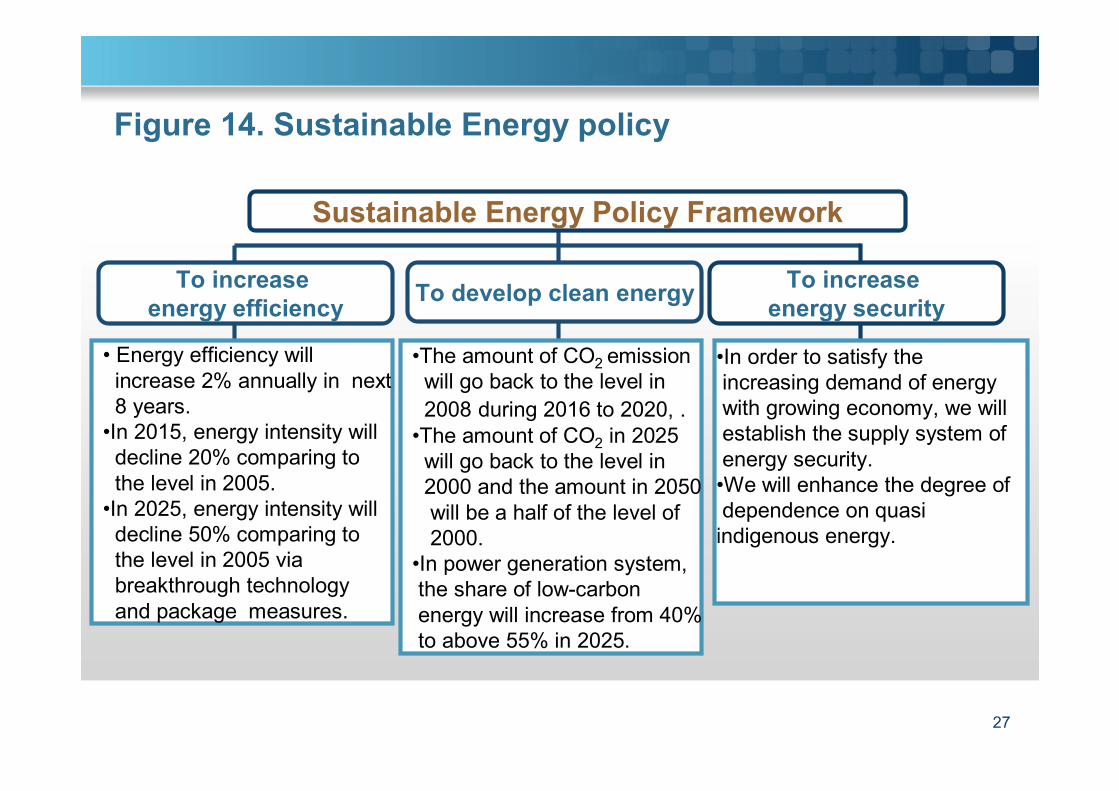
Figure 14. Sustainable Energy policy
To develop clean energy To increase energy security
To increase energy efficiency
• Energy efficiency will increase 2% annually in next 8 years.
•In 2015, energy intensity will decline 20% comparing to the level in 2005.
•In 2025, energy intensity will decline 50% comparing to the level in 2005 via breakthrough technologyand package measures.
•In order to satisfy the increasing demand of energywith growing economy, we will establish the supply system of energy security.
•We will enhance the degree of dependence on quasi
indigenous energy.
•The amount of CO2 emission will go back to the level in 2008 during 2016 to 2020, .
•The amount of CO2 in 2025 will go back to the level in 2000 and the amount in 2050will be a half of the level of 2000.
•In power generation system, the share of low-carbon energy will increase from 40% to above 55% in 2025.
Sustainable Energy Policy Framework

28
Energy Saving and Carbon Reduction Promotion
Committee(Since Dec. 28, 2009)
Chairman: Vice Premier of Executive Yuan
Vice-Chairman: Secretary General of Executive Yuan and Two Minister without
Portfolio
Inter-Ministerial Committee
Members (14)
Executive Secretary(Ministry of Economic
Affairs)
Green Transport Promotion
Green Building
Low-carbon Community and Society
Low-Carbon Infrastructure
Energy Saving and Carbon Reduction Technology
Low-Carbon Industries
Energy Saving and Carbon Reduction Education
Propagation and Communication
Project and Indicator Management
Low-Carbon Energy System
Figure 15. Executive Yuan-Level Institution

29
Figure 16. Executive Yuan-Level Institution
New Energy Development and Promotion Committee(Since Dec. 30, 2009)
Task 2:New Energy Promotion
Task 1: New Energy Development Policies
4 Major Tasks
Task 3: New Energy Technologies, Research and Development
Task 4: New Energy Industries Development
Executive Secretary: Director-General of Bureau of Energy
Co-Chaired by: One Minister without Portfolio and Minister of Economic Affairs
Inter-Ministerial Committee Members (11) with Industrial Experts (8)

30
3. Energy Policy to Cope With Climate Changes

31
3.1 Energy Restructuring: Renewable Energy
1) Taiwan has passed the “Renewable Energy Development Act” on July 8, 2009 to develop the clean energy.
2) The limitation of renewable energy
More costly than the traditional fuels
Unstable power supply
3) Resource of renewables is limited in Taiwan
High population density (637 persons/km2) less space to deploy renewables
2/3 of the land is mountain area
Hydro energy shares 0.3 percent of total energy supply only

32
4) SuggestionsThe strategy to develop renewable energy is to separate promotion with industry development.
5) Criteria for Renewable Energy Promotion Energy output-input ratio ≧ 1
(Production cost of renewable energy) – (CO2 abatement cost) –(Net industrial linkage effect) ≦ (Traditional energy production cost)
6) R&D for renewable energyTo strengthen R&D for renewable energy is essential to increase the long-term competitiveness of Taiwan’s renewable energy industries.
3.1 Energy Restructuring: Renewable Energy (Cont.)

33
89083200Total
Ocean PowerFuel cellBiofuel PowerGeothermal PowerSolar PowerWind PowerHydro Power
Year
200-200-
1400815150-
200011245643625021939
2025Target
2009 Actual
Source : Bureau of Energy (2010)
Unit: MW
Table 1. The Proposed Renewable Energy Targets in Taiwan (draft)

34
Ration of electricity output by unclear
The Electricity Strategy of Carbon Reduction in OECD
7(6)0.0Australia
4(3)17Taiwan
10(7)19America
18(1)20Spanish
12(4)26Germany
10(9)28Japan
1(1)37South Korea
11(11)78France
Renewable Energy
(include Hydro-electricity)
NuclearCountry
• According to “Paradigm of carbon reduction in OECD” in 2006 (the CO2 emission coefficient is lower than 0.44), in Germany, South Korea, Japan and Spanish, their ratios of non-carbon energy were 38%, and the CO2emission coefficient was 0.46~0.37, due their higher electronic supply by low-carbon energy. • Developing renewable energy is not an easy job because of the geographical environment and climate. Taiwan will make the maximum ratio of electronic supply by renewable energy up to 8% in 2025. Besides, referring to the policies of above benchmark countries, Taiwan may need to increase nuclear power and LNG electricity to make the CO2 emission coefficient lower than 0.44, the paradigm of OECD.
CO2 emission coefficient (kg-co2/kwh)Australia, 0.92
Taiwan; 0.66
Germany, 0.26Spanish, 0.2
America, 0.54
Japan, 0.43
South Korea, 0.46
France, 0.09
0
0.2
0.4
0.6
0.8
1
0 10 20 30 40 50 60 70 80 90
CO2 emission coefficient (kg-CO2/kwh)
0.5(average in world)0.44(average in OECD)
CO2 Emissions from Fuel Combustion (IEA,2009 edition)

35
3.2 Energy Pricing Policy
1) Energy Price should fully reflects its internal and external cost.
2) Taiwan’s energy prices are one of the lowest countries in the world.
3) Since state-owned Chinese Petroleum Corporation and Taiwan Power Company enjoy monopolistic power in Taiwan’s oil and electricity market, respectively, there are always pressures asking government to intervene the energy markets when import energy prices increase.

36
Table 2. Comparison of Oil Prices (before Tax) among Taiwan, Japan, Korea and Singapore
-5,852-8.6-10.8-5.4-8599-10.2-10.0-8.1-2,936-5.8-7.5-5.7
Difference between Taiwan’s
Price and the Price above
24,93931.533.227.222,68234.334.031.416,65626.628.425.8
Average Price of
Japan, Korea and
Singapore
-34.834.2--39.236.836.1-29.830.329.6Singapore
25,77229.232.126.321,60234.031.129.016,42225.926.523.9Korea
24,10530.5-28.123,76229.8-29.116,89024.1-23.9Japan
19,08722.922.421.814,21924.124.023.413,72020.1Taiwan
959295929592Fuel OilDiesel
GasolineFuel OilDiesel
GasolineFuel OilDiesel
GasolineItem
Average Price (2012.01)Average Price (2008.05)Average Price (2007.10)Time

37
Figure 17. Comparison of 2008 Regular Unleaded Gasoline Comparison of 2008 Regular Unleaded Gasoline Prices
0.0
0.5
1.0
1.5
2.0
2.5G
erm
any
Den
mar
k
Aus
tria
Cze
ch R
epub
lic
Kor
ea, S
outh
Japa
n
Sing
apor
e
New
Zea
land
Aus
tralia
Can
ada
Thai
land
Taiw
an
Uni
ted
Stat
es
Chi
na
Rus
sia
USD
$/Li
ter

38
Figure 18. Comparison of 2008 Premium Unleaded Gasoline Prices
Comparison of 2008 Premium Unleaded Gasoline Prices
0.0
0.5
1.0
1.5
2.0
2.5
Nor
way
Finl
and
Ger
man
y
Italy
Den
mar
k
Fran
ce
Uni
ted
Kin
gdom
Swed
en
Irel
and
Aus
tria
Switz
erla
nd
Sing
apor
e
New
Zea
land
Aus
tralia
Thai
land
Taiw
an
Rus
sia
Uni
ted
Stat
es
Indo
nesi
a
USD
$/Li
ter

39
4) During May 2000-May 2008, the government even strongly intervened the domestic energy market. The energy prices were ‘frozen’ when crude oil price increased from USD $80 to USD $147 per barrel during Nov. 2007-May 2008.
5) The results of irrational energy price:State-owned Chinese Petroleum Corporation and Taiwan Power Company lost NTD$120 billion and NTD$75 billion, respectively, in 2008.
6) Since June 2008, the government has unfrozen and adjusted the energy prices upward: Oil price by 15% Electricity by 25% Natural gas by 30%
7) As a result, under the new government, the energy intensity has decreased by 7 percent in the second half of 2008.
3.2 Energy Pricing Policy (Cont.)

40
1) The tax revenue should be used for following purposes:
To reduce the personal and business income tax rate
To lower the burden of social welfare (e.g. Retirement Fund and Medicare) of the employers
To subsidize the energy expenses of low-income families
To purchase CO2 emission credits from abroad
To refund the enterprises with outperforming energy efficiency
Energy R&D
Except for the item 5, others are the consensus and resolution of National Energy Conference in 2009.
2) Ministry of Finance is drafting the “Energy Tax Bill” to reflect the external cost of CO2 emission.
3.3 Carbon Tax and Green Tax Reform

41
Table 3. Analysis Results for the Impacts of the Carbon Tax (without Tax Cut) on the Economy in 2020
+9.3+0.45%Net Effects(3)=(1)+(2)
+34.0+1.64%Industry Linkage Effects of Energy-Saving Investments(2)
-24.7-1.19%
Effects from 25% of Energy Saving(Carbon Tax without Tax Cut and Regardless of Industry Linkage Effects of Energy-Saving Investments)
(1)
Jobs(Ten Thousands)
Economic Growth (%)ItemNumber
Source: Based on the simulation result of Dynamic General Equilibrium Model of Taiwan (or Liang-Jorgenson Model)

42
Table 4. Analysis Results for the Impacts of the Carbon Tax (with Supplementary Tax Cut) on the Economy in 2020
+21.8+1.05%Net Effects(3)=(1)+(2)
+34.0+1.64%Industry Linkage Effects of Energy-Saving Investments(2)
-12.2-0.59%
Effects from 25% of Energy Saving(Carbon Tax with Supplementary Tax Cut and Regardless of Industry Linkage Effects of Energy-Saving Investments)
(1)
Jobs(Ten Thousands)
Economic Growth (%)ItemNumber
Source: Based on the simulation result of Dynamic General Equilibrium Model of Taiwan (or Liang-Jorgenson Model)
Implication:Energy conservation can not only reduce CO2 emissions, but also create jobs and increase economic growth rates. Thus, it is a no-regret policy in Taiwan.

43
1) The Executive Yuan has sent the “Greenhouse Gas Emissions Reduction Bill” to the Legislative Yuan for approval.
2) The reduction measure of the bill includes: Registration and reporting Establish GHG emission standards Conditions for implementing cap-and-trade Regulation of new sources or expansion of existing sources checking
3) Establish credits for early action programs in order to reward industrial entities that achieve greenhouse gas reductions.
3.4 Cap and Trade

44
3.5 Regulation on Energy Efficiency
1) Taiwan Government has amended the “Energy Management Act”on July 8, 2009 to promote energy saving measures.
2) Several key recommendations for enhancing Taiwan’s energy efficiency are suggested in the following:
Increase the minimum energy efficiency standards routinely and implement these standards effectively
Combine comparative labels for energy performance based on the concept behind Japan’s Top Runner program
Replace typical light bulbs with high-efficiency light bulbs
Promote green building and enhance building insulation
Promote high-efficiency vehicles

45
3.6 Industrial Restructuring
1) Promote the less energy-intensive industries, such as service industry
2) Demand energy-intensive industries (such as steel, cement, petroleum chemical) to provide CO2 offset plans when investing in new projects.
3) Minimize the CO2 reduction cost and maintain industrial competitiveness, oversea CO2 offset plans are needed.
4) Apply for entering to the UNFCCC.
5) It will be very unfair to Taiwan for not being allowed to enter UNFCCC.

46
3.7 The Development of Green Energy Industries
1) Taiwan’s Government has adopted the “Dawning Green Energy Industry Program”, including a pledge to provide NT$37.38 billion (US$1.2 billion) between 2009 and 2012 to support promising green technologies.
2) The program aims at developing seven industries considered vital to Taiwan’s green-tech future, including: Solar photovoltaic (PV) Wind energy Biofuel, hydrogen/fuel cells LED lighting Electric vehicles Energy information communication technology
3) The program has chosen two industries for priority development: Solar photovoltaic energy LED lighting

47
3.7 The Development of Green Energy Industries (Cont.)
4) The program envisions: PV production value will be NT$450 billion in 2015 (from
NT$106 billion in 2009) LED lighting production value will be NT$540 in 2015 (from
NT$94 billion in 2009)
5) It is worth of noting that Taiwan has strong competitiveness in ICT industries which is the foundation of green energy industries. The production values of 14 ICT products in Taiwan were
ranked as No.1 or No.2 in the world. The production values of LED light sources and solar batteries
were ranked as No. 2 and No. 4, respectively, in the world.

48
3.7 The Development of Green Energy Industries (Cont.)
6) Taiwan’s ICT enterprises are good at “process innovation”and world-wide logistic center which make the cost-down of new energy technologies possible.
7) The successful experience and policy to promote ICT industry since 1980 will be useful to refer.

49
3.8 Industrial Development
1) Taiwan government promulgated the Industrial Innovation Bill on April 16.2010, and amended the Income Tax Bill, which lowers the Corporate Income Tax rate from 25 percent to 17 percent.
2) Starting from 2011 Taiwan will be one of the lowest Corporate Income Tax rate (17%) countries in East Asia.
3) Taiwan also signed Economic Cooperation Framework Agreement (ECFA) with mainland China on June 29, 2010.
4) All of the above changes will enhance the international competitiveness of Taiwan’s Industries.

50
Thanks for Your Attention.