Embed Size (px)
Citation preview
Energy Prices and In�ation in TanzaniaThe role of pass-through e�ects on the CPI
Christopher AdamOxford University and IGC-Tanzania
Bank of Tanzania Research SeminarOctober 24, 2013
Adam (October 2013) Energy Price Passthrough: Tanzania BoT Seminar 1 / 27
Outline
1 Background and Motivation
2 Reduced-Form Econometric Evidence
3 Structural Evidence: the Input-Output structure
4 Conclusions: Energy Costs and Growth
Adam (October 2013) Energy Price Passthrough: Tanzania BoT Seminar 2 / 27
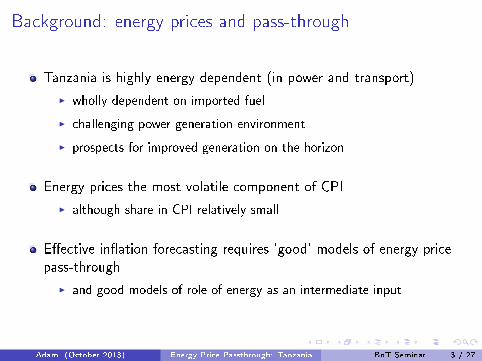
Background: energy prices and pass-through
Tanzania is highly energy dependent (in power and transport)
I wholly dependent on imported fuel
I challenging power generation environment
I prospects for improved generation on the horizon
Energy prices the most volatile component of CPI
I although share in CPI relatively small
E�ective in�ation forecasting requires 'good' models of energy pricepass-through
I and good models of role of energy as an intermediate input
Adam (October 2013) Energy Price Passthrough: Tanzania BoT Seminar 3 / 27

Figure 1: Energy price in�ation and volatility
0.0%
5.0%
10.0%
15.0%
20.0%
25.0%
30.0%
35.0%
40.0%
45.0%
Pe
rce
nt
per
an
nu
m
Annual Headline Inflation and Components October 2010 to August 2013
Headline
Food
Energy
Core (non-food, non-energy)
Adam (October 2013) Energy Price Passthrough: Tanzania BoT Seminar 4 / 27
0.0%
5.0%
10.0%
15.0%
20.0%
25.0%
Pe
rce
nt
Pe
r A
nn
um
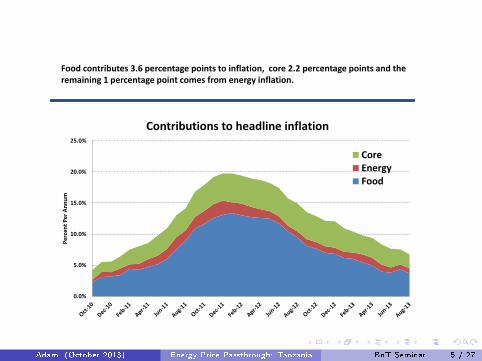
Contributions to headline inflation
CoreEnergyFood
Food contributes 3.6 percentage points to inflation, core 2.2 percentage points and the remaining 1 percentage point comes from energy inflation.
Adam (October 2013) Energy Price Passthrough: Tanzania BoT Seminar 5 / 27
Energy as an intermediate input
Large distances / low density and poor infrastructue means highenergy and transport costs damaging to growth and development
E.g. cost per ton of grain / 100km around US$15 in East Africacompared to US$5 in Midwest US (<$3 if by river)
Distorts location of economic activity and underpins persistently high�rural-urban productivity gap�
I Addressing cost structure central to realizing Vision 2025
transformation
Adam (October 2013) Energy Price Passthrough: Tanzania BoT Seminar 6 / 27
Reduced form econometic evidence on the energy pricepass-through
Long-run versus short-run co-movement in energy and fuel prices
Econometric evidence on pass-through of fuel prices
Evidence of price-gouging and pricing-to-market?
Adam (October 2013) Energy Price Passthrough: Tanzania BoT Seminar 7 / 27
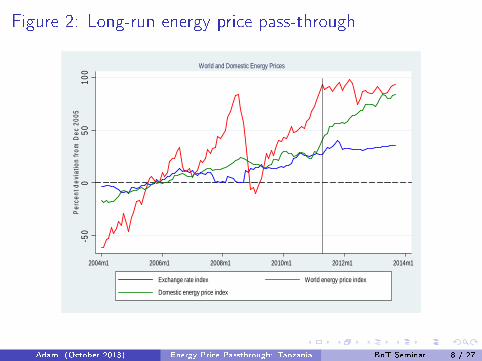
Figure 2: Long-run energy price pass-through
-50
050
100
Per
cent
dev
iatio
n fr
om D
ec 2
005
2004m1 2006m1 2008m1 2010m1 2012m1 2014m1
Exchange rate index World energy price index
Domestic energy price index
World and Domestic Energy Prices
Adam (October 2013) Energy Price Passthrough: Tanzania BoT Seminar 8 / 27
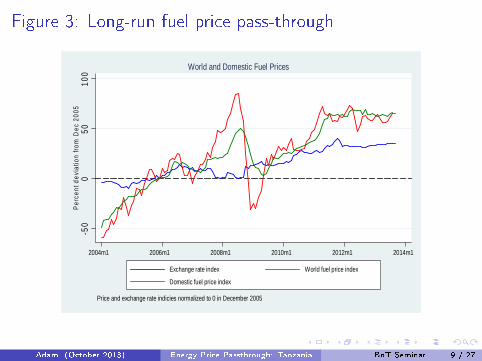
Figure 3: Long-run fuel price pass-through
-50
050
100
Per
cent
dev
iatio
n fr
om D
ec 2
005
2004m1 2006m1 2008m1 2010m1 2012m1 2014m1
Exchange rate index World fuel price index
Domestic fuel price index
Price and exchange rate indicies normalized to 0 in December 2005
World and Domestic Fuel Prices
Adam (October 2013) Energy Price Passthrough: Tanzania BoT Seminar 9 / 27
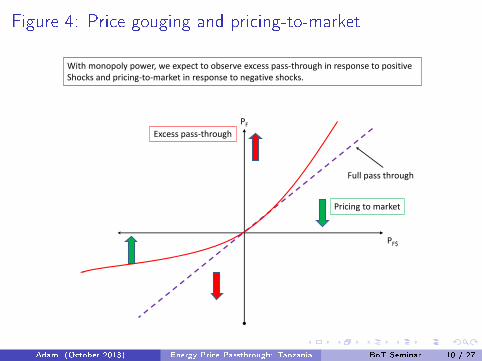
Figure 4: Price gouging and pricing-to-market
PF
Full pass through
PF$
Pricing to market
Excess pass-through
With monopoly power, we expect to observe excess pass-through in response to positive Shocks and pricing-to-market in response to negative shocks.
Adam (October 2013) Energy Price Passthrough: Tanzania BoT Seminar 10 / 27
Long-run vs short-run pricing to market
We use a standard vector error correction model to examine long- andshort-run pass-through for fuel prices.
Similar (but not identical) results on energy price index
I World and domestic energy mix di�ers and regulated prices
Adam (October 2013) Energy Price Passthrough: Tanzania BoT Seminar 11 / 27
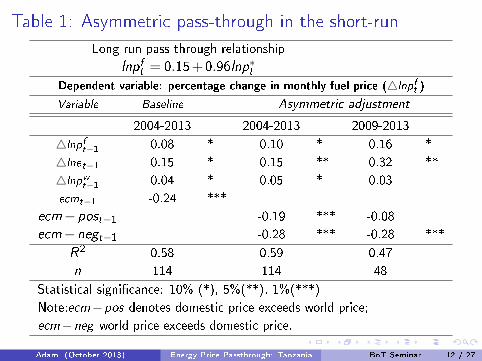
Table 1: Asymmetric pass-through in the short-run
Long run pass-through relationship
lnpft = 0.15+0.96lnp∗t
Dependent variable: percentage change in monthly fuel price (4lnpft )
Variable Baseline Asymmetric adjustment
2004-2013 2004-2013 2009-2013
4lnpft−1 0.08 * 0.10 * 0.16 *
4lnet−1 0.15 * 0.15 ** 0.32 **
4lnpwt−1 0.04 * 0.05 * 0.03
ecmt−1 -0.24 ***
ecm−post−1 -0.19 *** -0.08
ecm−negt−1 -0.28 *** -0.28 ***
R2 0.58 0.59 0.47
n 114 114 48
Statistical signi�cance: 10% (*), 5%(**), 1%(***)
Note:ecm−pos denotes domestic price exceeds world price;
ecm−neg world price exceeds domestic price.
Adam (October 2013) Energy Price Passthrough: Tanzania BoT Seminar 12 / 27
Summary
Strong evidence of cointegration => full long-run pass-through, atleast for fuel
But short-run behavior (weakly) consistent withgouging/pricing-to-market hypothesis
Arguably the more important dimension is the role of energy as anintermediate input.
Adam (October 2013) Energy Price Passthrough: Tanzania BoT Seminar 13 / 27
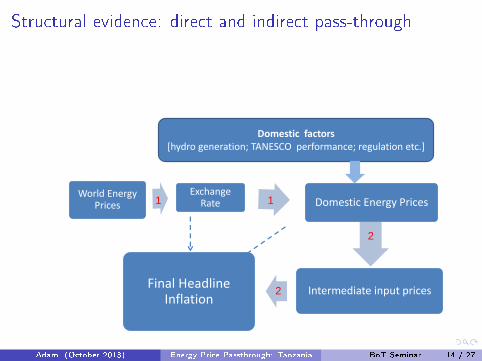
Structural evidence: direct and indirect pass-through
World Energy Prices
Exchange Rate Domestic Energy Prices
Intermediate input prices Final Headline
Inflation
Domestic factors [hydro generation; TANESCO performance; regulation etc.]
1 1
2
2
Adam (October 2013) Energy Price Passthrough: Tanzania BoT Seminar 14 / 27
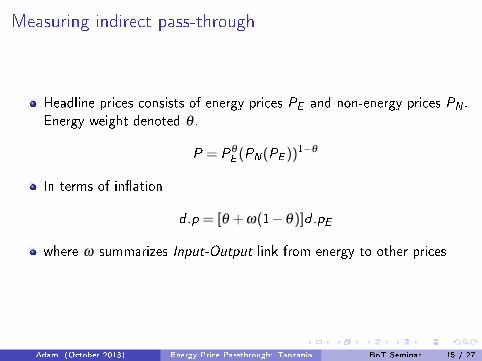
Measuring indirect pass-through
Headline prices consists of energy prices PE and non-energy prices PN .Energy weight denoted θ .
P = Pθ
E (PN(PE ))1−θ
In terms of in�ation
d .p = [θ + ω(1−θ)]d .pE
where ω summarizes Input-Output link from energy to other prices
Adam (October 2013) Energy Price Passthrough: Tanzania BoT Seminar 15 / 27
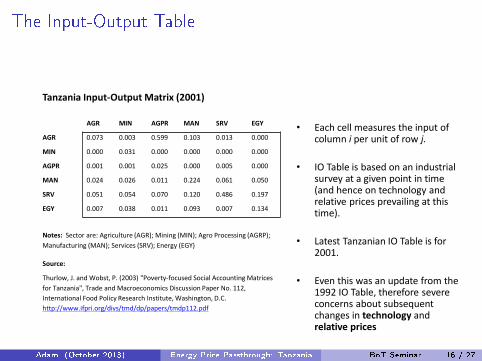
The Input-Output Table
Tanzania Input-Output Matrix (2001)
AGR MIN AGPR MAN SRV EGY
AGR 0.073 0.003 0.599 0.103 0.013 0.000
MIN 0.000 0.031 0.000 0.000 0.000 0.000
AGPR 0.001 0.001 0.025 0.000 0.005 0.000
MAN 0.024 0.026 0.011 0.224 0.061 0.050
SRV 0.051 0.054 0.070 0.120 0.486 0.197
EGY 0.007 0.038 0.011 0.093 0.007 0.134
Notes: Sector are: Agriculture (AGR); Mining (MIN); Agro Processing (AGRP);
Manufacturing (MAN); Services (SRV); Energy (EGY)
Source:
Thurlow, J. and Wobst, P. (2003) "Poverty-focused Social Accounting Matrices
for Tanzania", Trade and Macroeconomics Discussion Paper No. 112,
International Food Policy Research Institute, Washington, D.C.
http://www.ifpri.org/divs/tmd/dp/papers/tmdp112.pdf
• Each cell measures the input of column i per unit of row j.
• IO Table is based on an industrial survey at a given point in time (and hence on technology and relative prices prevailing at this time).
• Latest Tanzanian IO Table is for 2001.
• Even this was an update from the 1992 IO Table, therefore severe concerns about subsequent changes in technology and relative prices
• NBS shortly releasing 2007 IO Table.
Adam (October 2013) Energy Price Passthrough: Tanzania BoT Seminar 16 / 27
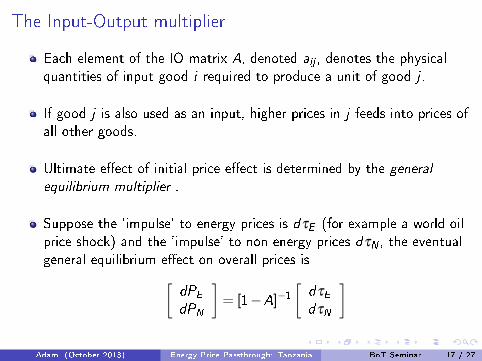
The Input-Output multiplier
Each element of the IO matrix A, denoted aij , denotes the physicalquantities of input good i required to produce a unit of good j .
If good j is also used as an input, higher prices in j feeds into prices ofall other goods.
Ultimate e�ect of initial price e�ect is determined by the general
equilibrium multiplier .
Suppose the 'impulse' to energy prices is dτE (for example a world oilprice shock) and the 'impulse' to non-energy prices dτN , the eventualgeneral equilibrium e�ect on overall prices is[
dPE
dPN
]= [1−A]−1
[dτE
dτN
]
Adam (October 2013) Energy Price Passthrough: Tanzania BoT Seminar 17 / 27
The Input-Output multiplier
Can be interpreted as pass-through from input prices to output pricesif:
I elasticity of substitution between inputs (and between intermediatesand factors) is zero
The pass-through will be lower if:
I �rms substitute away from energy if energy prices highI �rms absorb higher costs in lower pro�ts
IO multiplier is thus an upper-bound on the pass-through
Adam (October 2013) Energy Price Passthrough: Tanzania BoT Seminar 18 / 27
Using the IO Table to estimate pass-through
But set against this, perhaps the energy-intensity of economic activityhas increased in last 20 years
Within-sector energy e�ciency savings outweighed by structural shiftfrom low-energy to high-energy activities
Relative price of energy has also increased over time
IO mutiplier may actually understate pass-through e�ects.
Adam (October 2013) Energy Price Passthrough: Tanzania BoT Seminar 19 / 27
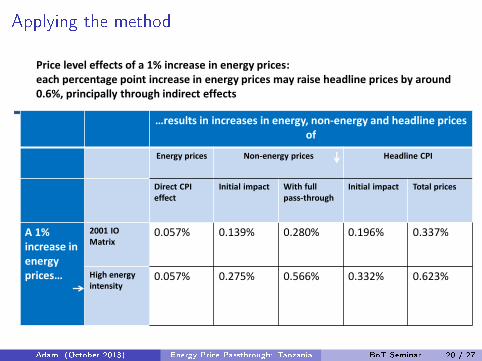
Applying the method
Price level effects of a 1% increase in energy prices: each percentage point increase in energy prices may raise headline prices by around 0.6%, principally through indirect effects
…results in increases in energy, non-energy and headline prices of
Energy prices Non-energy prices Headline CPI
Direct CPI effect
Initial impact With full pass-through
Initial impact Total prices
A 1% increase in energy prices…
2001 IO Matrix
0.057% 0.139% 0.280% 0.196% 0.337%
High energy intensity
0.057% 0.275% 0.566%
0.332% 0.623%
Adam (October 2013) Energy Price Passthrough: Tanzania BoT Seminar 20 / 27
Caveats and quali�cations
Input-output table is very out of date. It is reasonable to believe thatGDP is signi�cantly more energy intensive even than suggested by`high energy intensive' scenarios => estimates possibly too low?
But these calculations assume full pass-through of input costs tooutput costs. This is unlikely:
I Firms absorb some of the rise in input costs by substituting away fromhigh-cost inputs and via lower pro�ts and wages.
I Income e�ect of prices rises reduces demand and hence price pressure.
I Price rises may induce tightening of monetary policy.
Adam (October 2013) Energy Price Passthrough: Tanzania BoT Seminar 21 / 27
Cross checking with the econometic evidence
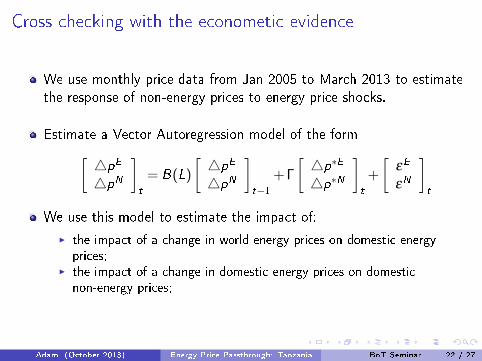
We use monthly price data from Jan 2005 to March 2013 to estimatethe response of non-energy prices to energy price shocks.
Estimate a Vector Autoregression model of the form[4pE
4pN
]t
= B(L)
[4pE
4pN
]t−1
+ Γ
[4p∗E
4p∗N
]t
+
[εE
εN
]t
We use this model to estimate the impact of:
I the impact of a change in world energy prices on domestic energyprices;
I the impact of a change in domestic energy prices on domesticnon-energy prices;
Adam (October 2013) Energy Price Passthrough: Tanzania BoT Seminar 22 / 27
Cross-checking with econometric evidence
-0.8
-0.4
0.0
0.4
0.8
1.2
2 4 6 8 10 12 14 16 18 20
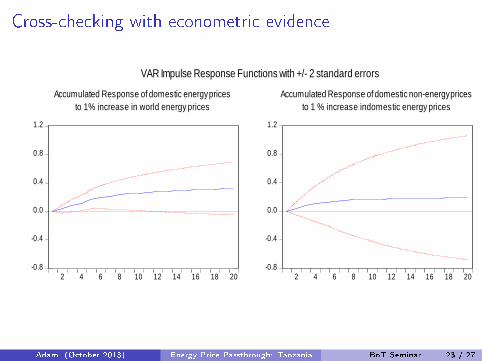
Accumulated Response of domestic energy prices
to 1% increase in world energy prices
-0.8
-0.4
0.0
0.4
0.8
1.2
2 4 6 8 10 12 14 16 18 20
Accumulated Response of domestic non-energy prices
to 1 % increase indomestic energy prices
VAR Impulse Response Functions with +/- 2 standard errors
Adam (October 2013) Energy Price Passthrough: Tanzania BoT Seminar 23 / 27
Cross-checking with econometric evidence
VAR suggests 1% increase in domestic energy prices translates into a0.20% increase in non-energy prices (although this is not statisticallysigni�cant)
Lower than the `full pass-through' IO-based estimates (0.288% to0.566%)
Consistent with �rms absorbing part of input price increase orsubstituting away from energy intensive inputs.
Adam (October 2013) Energy Price Passthrough: Tanzania BoT Seminar 24 / 27
Transport costs and structural transformation: widening thenet
Recent revival of research in area of urbanization, agglomeration andsturctural transformation
A major new theme for the IGC
Adam, Bevan, Gollin and Mkenda (2012 and 2013) explore theconsequences of reduction in transport costs on the spatial distributionof economic activity, rural-urban migration and welfare.
Adam (October 2013) Energy Price Passthrough: Tanzania BoT Seminar 25 / 27
Adam et al (2013) approach
Develop a simulation model � currently based on 2001 SocialAccountng Matrix � to explore spatial distribution of economic activityand growth.
Examine e�ects of alternative public investment (and �nancing) acrosslocations and skill groups .
I Distinguishes between rural economy and two distinct urban locations(Dar and 'secondary' cities).
I Explores long-run changes (a V2025 horizon, not conventional macrohorizon).
Adam (October 2013) Energy Price Passthrough: Tanzania BoT Seminar 26 / 27
Public Interventions
Transport infrastructure infrastructure have across-the-board bene�ts
I appear to have the strongest impact on the well-being of the unskilled.
Key mechanism is that improved market integration � via lowertransport costs � allows e�cient rural-urban migration
I Accelerated if there are agglomeration e�ects in urban areasI Reduction in wage goods (food) makes non-food sector more
productive
Skilled rural workers bene�t consistently from public investments inagriculture, but unskilled workers do not.
Increases in public capital targeted to the non-agriculture sectorappear to do a somewhat better job of reducing poverty � includingrural poverty � than investments targeted speci�cally to theagricultural sector.
Adam (October 2013) Energy Price Passthrough: Tanzania BoT Seminar 27 / 27