Embed Size (px)
Citation preview

TP Engineering Services llp, Link House, St Mary’s Way, Chesham, Bucks, HP5 1HR Telephone: 01494 771100 Fax: 01494 791679
ENERGY REPORT
FOR
WILLIAM KNIBB CENTRE
Ref: 15-2241
Jul 2016
V1.1 - Final

ENERGY REPORT
WILLIAM KNIBB CENTRE
C O N T E N T S
Section Description
1.0 Executive Summary
2.0 Introduction
3.0 Site Location
4.0
5.0
6.0
7.0
8.0
Planning Policy
Existing Building
Proposed Building
Energy Analysis
Final Proposal Summary
Appendices

ENERGY REPORT
WILLIAM KNIBB CENTRE
1.0 Executive Summary
The site is located at Montague Street, Kettering, Northamptonshire. The proposal is for
refurbishments within parts of the existing 1920’s Victorian building, along with refurbishment
in parts of the more modern side (1960’s). The current building is a multi-storey building,
which is to be partly refurbished. Evidence of services show that parts of the building dates
back to 1951 (64 years), with revisions made in 1984.
To minimise the energy footprint the development will provide the following:
High level of external insulation.
Air tight building (target air permeability rate of 10m3/m2.hr).
Photocell dimming in office and meeting areas.
Lighting efficiency average of 100 luminaire lumens per circuit watt average across
building with photocell dimming in offices and meeting room areas.
Gas fired boiler with an efficiency of 96%.
Hot water heater with an efficiency of 91%.
Mechanical Ventilation in all office and meeting room areas (heat recovery units).
Existing Air Conditioning units as installed
Existing radiators re-piped in Victorian building and new heating systems within the
1960’s building (radiators in all areas with UFH within toilet cores).
U-values and specific fan capacities as shown in the BRUKL document attached to the
Appendix.

The table below highlights the annual fuel consumption of this assessment.
Development Details
Development name/reference William Knibb Centre
Development description (e.g. number and type of residential units) Offices
sqm Gross Internal Floor Area (GIFA) 1426
Site electricity demand per annum (kWh) 21,790.98
Site delivered gas demand per annum (kWh) 49,409.97
Predicted site CO2 emissions per annum (kg) 21,706.46
Source of kWh/CO2 emission data TAS v9.3.2

2.0 Introduction
The Sustainable Energy Report has been prepared to support the planning application part
refurbishment of the existing building. Two models will be created and evaluated to establish
the performance of the existing building, and that of thereafter the improvements have been
made.
The approach taken during the consideration for this development is as follows:
“baseline” – The existing building energy performance as it stands. All existing services are used
to establish a general running of day to day service, with all existing rooms.
“be lean” – passive methods used to reduce projected energy including improved thermal
performance through improved U-values, reduced air leakage and optimisation of useful solar
gains through adjusting building fabrics.
Consideration to reduce building services energy consumption through the implementation of
energy equipment such as low energy lighting, low loss hot water storage vessels, adaptive
heating and hot water controls, and heat recovery ventilation systems.
This Energy Statement sets the parameters of detailed design, but remains at a strategic level.
The calculations in this document are an indication of system size and carbon emissions
based on guidance documents, approved software and practical experience. They are not
design calculations but establish the viability of various technologies for the proposed
development.
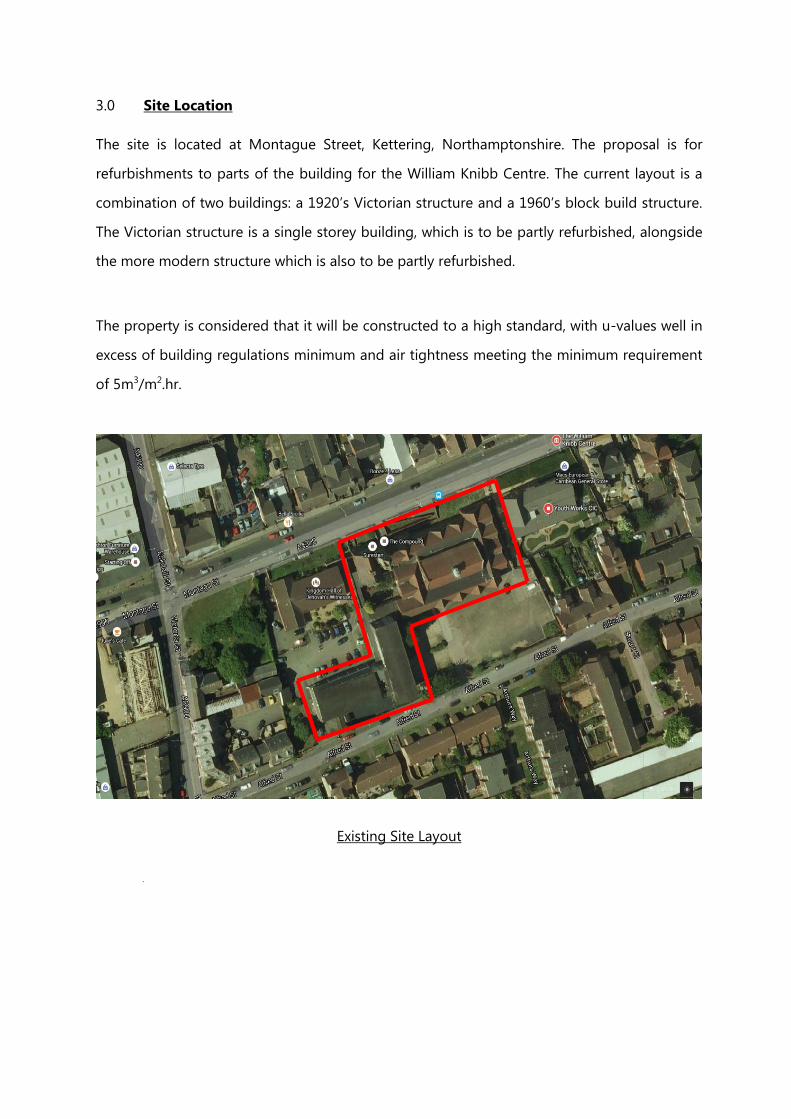
3.0 Site Location
The site is located at Montague Street, Kettering, Northamptonshire. The proposal is for
refurbishments to parts of the building for the William Knibb Centre. The current layout is a
combination of two buildings: a 1920’s Victorian structure and a 1960’s block build structure.
The Victorian structure is a single storey building, which is to be partly refurbished, alongside
the more modern structure which is also to be partly refurbished.
The property is considered that it will be constructed to a high standard, with u-values well in
excess of building regulations minimum and air tightness meeting the minimum requirement
of 5m3/m2.hr.
Existing Site Layout

4.0 Planning Policy
The building currently has an overall Display Energy Certificate (DEC) performance rating of
73 and falls within band C, with heating rated at 150 and Electricity rated at 16. The models
will produce two BRUKL documents and two EPC certificates for the existing and proposed
builds.
The development will be subject to the requirements of Building Regulations Part L2B,
Conservation of fuel and power in existing buildings other than dwellings, 2013. The two
models will be simulated as existing and after refurbishment of services. The difference
between the two models will be discussed and evaluated, which will give an idea of the
reduction in energy usage.

5.0 Existing Building
5.1 Carbon Emissions
Baseline
The baseline predictions are based on the existing 3no. gas fired Broag Seagold cast iron
sectional boilers, each rated at 262kW. A standard efficiency of 85% has been used to model
the three boilers installed approximately 19 years ago (1996). The gas fired boilers serve the
existing radiators, fan convectors and the hot water system, which were selected for use in the
SBEM calculations. This provided a base line energy level with which to compare other
solutions. The base line energy is based upon a Part L compliant building.
TPES have produced a dynamic simulation 3D model to determine energy consumption and
carbon emissions, and to assist with a comparison to a newly refurbished building.
William Knibb Centre –
Target Emissions Rate (TER)
Annual Energy Consumption (kWh/year)
Annual Carbon Emissions (kgCO2/year)
Heating (per m²) 34.33 7.42
Cooling (per m²) 0.15 0.08
Auxiliary (per m²) 0.73 0.37
Lighting (per m²) 12.27 6.21
DHW (per m²) 4.28 0.92
Total (per m²) 51.76 14.99
Total Area (m²) 1430.87 1430.87
Total (per annum) 74,061.83 21,448.74
TABLE 5.1
As the first part of this report is to examine the existing building performance, the U-vales of
the existing building have been calculated as shown in table 5.2 below:

Element U-value (W/m2 K) Maximum
Allowable U-value (W/m2 K)
External Walls 1.66 0.35
Ground Floors 0.95 0.25
Roofs 2.82 0.25
Windows 2.98 2.2
Doors 3.09 2.2
TABLE 5.2
The full BER calculation sheets are enclosed in the Appendix A to support the above figures.
These figures respond to a typical development with construction thermal properties and
system selection to ensure that the unit complies with Building Regulations Part L2B. As the
building is very old, it was expected the U-values would be unachievable.
The existing building incorporates radiators and fan convectors, along with air conditioning
units serving a fraction of the building. The U-values do not comply with Part L 2013, and so
the existing services provide an increase in the carbon emissions over the target emission rate
(TER). The results have been shown in table 5.3 below:
William Knibb Centre –
Building Emissions Rate (BER)
Annual Energy Consumption (kWh/year)
Annual Carbon Emissions (kgCO2/year)
Heating (per m²) 126.29 27.28
Cooling (per m²) 0.03 0.01
Auxiliary (per m²) 0.73 0.37
Lighting (per m²) 15.33 7.76
DHW (per m²) 4.35 0.94
Total (per m²) 146.73 36.36
Total Area (m²) 1430.87 1430.87
Total (per annum) 209,951.56 52,026.43
TABLE 5.3

6.0 Proposed Build
6.1 Carbon Emissions
Baseline
The baseline for the refurbished building incorporated standard high efficiency gas fired
boilers serving underfloor heating in WC areas, standard intermittent local extract fans and
heat recovery units for use in the SBEM calculations. This provided a base line energy level
with which to compare other solutions. The base line energy is based upon a Part L compliant
building.
TPES have produced a dynamic simulation 3D model to determine energy consumption and
carbon emissions.
This Energy Statement sets the parameters of detailed design, but remains at a strategic level.
The calculations in this document are an indication of system size and carbon emissions
based on guidance documents, approved software and practical experience. They are not
design calculations but establish the viability and feasibility of various technologies for the
proposed development.
William Knibb Centre –
Target Emissions Rate (TER)
Annual Energy Consumption (kWh/year)
Annual Carbon Emissions (kgCO2/year)
Heating (per m²) 14.96 3.23
Cooling (per m²) 0.22 0.11
Auxiliary (per m²) 4.54 2.30
Lighting (per m²) 16.96 8.58
DHW (per m²) 9.20 1.99
Total (per m²) 45.88 16.21
Total Area (m²) 1426.18 1426.18
Total (per annum) 65,433.14 23,118.38
TABLE 6.1

Be Lean
Energy used by the building during its life is a key producer of C02 and therefore the
reduction in energy is important to provide a sustainable development.
The main consideration is the thermal performance of the buildings envelope. A high level of
insulation is proposed to ensure that the energy used for heating the building is minimised. It
is our view that it is better to put resources into ensuring the building is well insulated and air
tight, rather than the addition of technology to a poor performing base building.
The initial proposal is to aim for an insulation level to achieve the following u-values for the
external envelope:
Element U-value (W/m2 K) Maximum
Allowable U-value (W/m2 K)
External Walls 0.29 0.35
Ground Floors 0.16 0.25
Roofs 0.18 0.25
Windows 1.65 2.2
Doors 1.61 2.2
TABLE 6.2
An air test target of 5m3/m2.hr for the air permeability of the building has been set as a target
due to the improved installation and material. An air pressure test will be required for the
building on completion.
The full BER calculation sheets are enclosed in the Appendix A to support the above figures.
These figures respond to a typical development with construction thermal properties and
system selection to ensure that the unit complies with Building Regulations Part L2B.
The proposed design should minimise the carbon emissions of the proposed development,
with other proposed energy saving measures including:
Lighting
A target of 100% of all lighting shall be low energy. This is a target figure of 80 luminaire
lumens per circuit watt. Corridors, stores, toilets, etc will have automatic presence detection
and offices, meeting and circulation areas with daylight shall have automatic daylight
dimming.

Ventilation
The scheme is based around a mechanical ventilation system in offices and meeting areas in
the form of heat recovery units, due to single sided natural ventilation. Natural ventilation will
also be considered, where applicable, achieved via openable windows. Local extract fans will
be modelled in toilet areas and store rooms.
The toilet extract fans will have a maximum specific fan power of 0.5W/l/s and air handling
units will achieve 1.9W/l/s
Equipment specification
The initial scheme uses time and temperature controlled zones with a high efficiency boiler.
The hot water system will be direct gas-fired with a minimum efficiency of 91%.
The above items are generally achievable within the economic constraints of the project. The
model was amended in accordance with the above figures to provide an enhanced building
energy load. The improved parameters of the building achieves a 6.2% betterment over the
target emission rate (TER). The revised energy table is shown below:
William Knibb Centre –
Building Emissions Rate (BER)
Annual Energy Consumption (kWh/year)
Annual Carbon Emissions (kgCO2/year)
Heating (per m²) 26.11 5.64
Cooling (per m²) 0.18 0.09
Auxiliary (per m²) 3.21 1.62
Lighting (per m²) 11.89 6.02
DHW (per m²) 8.54 1.84
Total (per m²) 49.93 15.22
Total Area (m²) 1426.18 1426.18
Total (per annum) 71,209.17 21,706.45
TABLE 6.3

7.0 Energy and Carbon Emissions Analysis
The Target Emissions Rate (TER) must be achieved in order to comply with Part L of the
Building Regulations. Table 5.1 shows the TER for the existing building, which will produce
approximately 21,463 kgCO2 of carbon emissions and consume approximately 74,061 kWh of
energy every year.
When measured against the actual building, the Building Emissions Rate (BER) will produce
52,026 kgCO2 of carbon emissions and consume approximately 209,951.56 kWh of energy
every year.
From the results above, it can be concluded that the existing building does not meet the
regulations of Part L 2013 Building regulations as the BER produces approximately double the
TER carbon emissions and consumes approximately 3 times that of the energy.
The proposed building has refurbished U-vales, more energy efficient services and an
improved air permeability rate. From table 6.1, it is shown the TER for the proposed building,
will produce approximately 23,118 kgCO2 of carbon emissions and consume approximately
65,433 kWh of energy every year.
When measured against the actual building, the Building Emissions Rate (BER) will produce
21,706 kgCO2 of carbon emissions and consume approximately 71,209 kWh of energy every
year.
From the results above, it can be concluded that the proposed building does meet the
regulations of Part L 2013 Building regulations as the BER achieves a 6.2% betterment over
the TER (as shown by the BRUKL document in Appendix B).
In order to find out if the proposed building performs better than the existing building, the
two must be compared.
The energy consumed by the existing building is 209,951 kWh/yr compared to the proposed
buildings 67,073.25 kWh/yr. This is a reduction of approximately 30%.

The carbon emissions produced by the existing building is 52,026 kgCO2/yr compared to the
proposed buildings 21,920 kgCO2/yr. This is a reduction in the production of carbon
emissions by approximately 40%.
The graphs below represent the Energy Usage and Carbon Emissions production for the
existing and proposed models.
Figure 7.1
Figure 7.2
8.0 Final Proposal Summary
It has already been established that the existing building will not meet Part L of the Building
Regulations due to the age of the original building.

From the results above, it can be concluded that the proposed building does meet the
regulations of Part L 2013 Building regulations as the BER produces approximately 40% less
carbon emissions and consumes approximately 30% less energy.

Appendix A(i) – BRUKL Output
Existing Building BRUKL

BRUKL Output DocumentCompliance with England Building Regulations Part L 2013
Administrative information
Criterion 1: The calculated CO emission rate for the building should not exceed the target2
Criterion 2: The performance of the building fabric and the building services shouldachieve reasonable overall standards of energy efficiency
Project name
Date: Wed Dec 09 15:38:09 2015
As designedWilliam Knibb Centre
Building DetailsAddress: William Knibb Centre, Maontague Street,
Kettering,
Owner DetailsName:
Telephone number:
Address: , , Certification toolCalculation engine: TAS
Calculation engine version: "v9.3.3"
Interface to calculation engine: TAS
Interface to calculation engine version: v9.3.3
BRUKL compliance check version: v5.2.d.2
Certifier detailsName: Dharmesh Maisuria
Telephone number: 01494 771100
Address: Link House St. Mary's Way, Chesham, HP5 1HR
CO emission rate from the notional building, kgCO /m .annum2 22 15.2
Target CO emission rate (TER), kgCO /m .annum2 22 15.2
Building CO emission rate (BER), kgCO /m .annum2 22 45.3
Are emissions from the building less than or equal to the target? BER > TER
The building does not comply with England Building Regulations Part L 2013
Are as built details the same as used in the BER calculations? Separate submission
Element U U U Surface where the maximum value occurs*a-Limit a-Calc i-Calc
Wall** 0.35 1.66 1.66 External Wall
Floor 0.25 0.95 0.95 Ground Floor
Roof 0.25 2.82 2.82 Roof
Windows***, roof windows, and rooflights 2.2 2.98 3.06 Type 4
Personnel doors 2.2 3.09 3.11 Elevation 5 Door
Vehicle access & similar large doors 1.5 - - No vehicle doors in project
High usage entrance doors 3.5 - - No high usage entrance doors in project
Building fabric
Values not achieving standards in the Non-Domestic Building Services Compliance Guide and Part L are displayed in red.
U = Limiting area-weighted average U-values [W/(m K)]a-Limit2
U = Calculated area-weighted average U-values [W/(m K)]a-Calc2 U = Calculated maximum individual element U-values [W/(m K)]i-Calc
2
* There might be more than one surface where the maximum U-value occurs.** Automatic U-value check by the tool does not apply to curtain walls whose limiting standard is similar to that for windows.*** Display windows and similar glazing are excluded from the U-value check.N.B.: Neither roof ventilators (inc. smoke vents) nor swimming pool basins are modelled or checked against the limiting standards by the tool.
Air Permeability Worst acceptable standard This building
m /(h.m ) at 50 Pa 3 2 10 5** Buildings with less than 500 m total useful floor area may avoid the need for a pressure test provided that the air permeability is taken as2
15 m /(h.m ) at 50 Pa. 3 2
Page 1 of 8

Whole building lighting automatic monitoring & targeting with alarms for out-of-range values YES
Whole building electric power factor achieved by power factor correction >0.95
Building services
The standard values listed below are minimum values for efficiencies and maximum values for SFPs.Refer to the Non-Domestic Building Services Compliance Guide for details.
1- Natural Vent with Radiators
Heating efficiency Cooling efficiency Radiant efficiency SFP [W/(l/s)] HR efficiency
This system 0.85 - - - -
Standard value 0.91* N/A N/A N/A N/A
Automatic monitoring & targeting with alarms for out-of-range values for this HVAC system YES* Standard shown is for gas single boiler systems <=2 MW output. For single boiler systems >2 MW or multi-boiler systems, (overall) limiting efficiency is 0.86. For any individual boiler in a multi-boiler system, limiting efficiency is 0.82.
2- Extract with Radiators (9 Zones)
Heating efficiency Cooling efficiency Radiant efficiency SFP [W/(l/s)] HR efficiency
This system 0.85 - - - -
Standard value 0.91* N/A N/A N/A N/A
Automatic monitoring & targeting with alarms for out-of-range values for this HVAC system YES* Standard shown is for gas single boiler systems <=2 MW output. For single boiler systems >2 MW or multi-boiler systems, (overall) limiting efficiency is 0.86. For any individual boiler in a multi-boiler system, limiting efficiency is 0.82.
3- Radiators Only
Heating efficiency Cooling efficiency Radiant efficiency SFP [W/(l/s)] HR efficiency
This system 0.85 - - - -
Standard value 0.91* N/A N/A N/A N/A
Automatic monitoring & targeting with alarms for out-of-range values for this HVAC system YES* Standard shown is for gas single boiler systems <=2 MW output. For single boiler systems >2 MW or multi-boiler systems, (overall) limiting efficiency is 0.86. For any individual boiler in a multi-boiler system, limiting efficiency is 0.82.
1- New DHW Circuit
Water heating efficiency Storage loss factor [kWh/litre per day]
This building 0.85 0
Standard value 0.9* N/A* Standard shown is for gas boilers >30 kW output. For boilers <=30 kW output, limiting efficiency is 0.73.
Local mechanical ventilation, exhaust, and terminal units
ID System type in Non-domestic Building Services Compliance Guide
A Local supply or extract ventilation units serving a single area
B Zonal supply system where the fan is remote from the zone
C Zonal extract system where the fan is remote from the zone
D Zonal supply and extract ventilation units serving a single room or zone with heating and heat recovery
E Local supply and extract ventilation system serving a single area with heating and heat recovery
F Other local ventilation units
G Fan-assisted terminal VAV unit
H Fan coil units
I Zonal extract system where the fan is remote from the zone with grease filter
Zone name SFP [W/(l/s)]HR efficiency
ID of system type A B C D E F G H I
Standard value 0.3 1.1 0.5 1.9 1.6 0.5 1.1 0.5 1 Zone Standard
WC G 10 0.3 - - - - - - - - - N/A
Page 2 of 8

Zone name SFP [W/(l/s)]HR efficiency
ID of system type A B C D E F G H I
Standard value 0.3 1.1 0.5 1.9 1.6 0.5 1.1 0.5 1 Zone Standard
WC G 23 0.3 - - - - - - - - - N/A
WC G 24 0.3 - - - - - - - - - N/A
WC F 9 0.3 - - - - - - - - - N/A
WC F 10 0.3 - - - - - - - - - N/A
WC F 14 0.3 - - - - - - - - - N/A
Tea Point/Kitchen G 9 0.3 - - - - - - - - - N/A
Shower F 1 0.3 - - - - - - - - - N/A
WC G 17 0.3 - - - - - - - - - N/A
General lighting and display lighting Luminous efficacy [lm/W]
Zone name Luminaire Lamp Display lamp General lighting [W]
Standard value 60 60 22
Meeting Room G 1 55 - - 412
Meeting Room G 2 55 - - 307
Meeting Room G 7 55 - - 311
Meeting Room G 8 55 - - 716
Meeting Room G 11 55 - - 105
Meeting Room G 13 55 - - 137
Meeting Room G 26 55 - - 250
Meeting Room G 27 55 - - 293
Meeting Room F 4 55 - - 920
Meeting Room F 8 55 - - 715
Meeting Room S 3 55 - - 982
Meeting Room S 7 55 - - 996
Corridor G 3 - 55 - 158
Corridor G 6 - 55 - 111
Corridor G 19 - 55 - 53
Corridor G 20 - 55 - 240
Corridor F 16 - 55 - 131
Corridor S 4 - 55 - 31
Office G 4 55 - - 151
Office G 5 55 - - 163
Office G 14 55 - - 184
Office G 15 55 - - 180
Office G 16 55 - - 169
Office G 18 55 - - 184
Office F 7 55 - - 115
Office S 5 55 - - 150
Office S 6 55 - - 173
Store G 12 55 - - 11
Store F 2 55 - - 30
Store F 6 55 - - 17
Store F 12 55 - - 62
Page 3 of 8
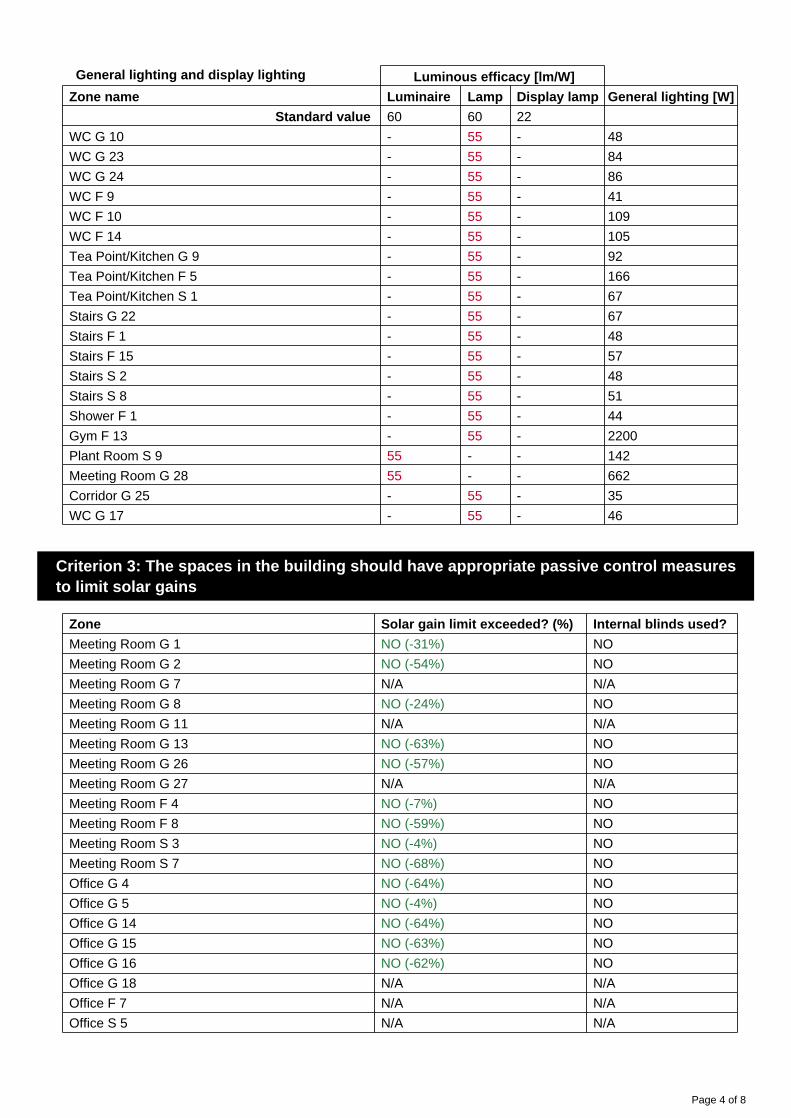
General lighting and display lighting Luminous efficacy [lm/W]
Zone name Luminaire Lamp Display lamp General lighting [W]
Standard value 60 60 22
WC G 10 - 55 - 48
WC G 23 - 55 - 84
WC G 24 - 55 - 86
WC F 9 - 55 - 41
WC F 10 - 55 - 109
WC F 14 - 55 - 105
Tea Point/Kitchen G 9 - 55 - 92
Tea Point/Kitchen F 5 - 55 - 166
Tea Point/Kitchen S 1 - 55 - 67
Stairs G 22 - 55 - 67
Stairs F 1 - 55 - 48
Stairs F 15 - 55 - 57
Stairs S 2 - 55 - 48
Stairs S 8 - 55 - 51
Shower F 1 - 55 - 44
Gym F 13 - 55 - 2200
Plant Room S 9 55 - - 142
Meeting Room G 28 55 - - 662
Corridor G 25 - 55 - 35
WC G 17 - 55 - 46
Criterion 3: The spaces in the building should have appropriate passive control measuresto limit solar gains
Zone Solar gain limit exceeded? (%) Internal blinds used?
Meeting Room G 1 NO (-31%) NO
Meeting Room G 2 NO (-54%) NO
Meeting Room G 7 N/A N/A
Meeting Room G 8 NO (-24%) NO
Meeting Room G 11 N/A N/A
Meeting Room G 13 NO (-63%) NO
Meeting Room G 26 NO (-57%) NO
Meeting Room G 27 N/A N/A
Meeting Room F 4 NO (-7%) NO
Meeting Room F 8 NO (-59%) NO
Meeting Room S 3 NO (-4%) NO
Meeting Room S 7 NO (-68%) NO
Office G 4 NO (-64%) NO
Office G 5 NO (-4%) NO
Office G 14 NO (-64%) NO
Office G 15 NO (-63%) NO
Office G 16 NO (-62%) NO
Office G 18 N/A N/A
Office F 7 N/A N/A
Office S 5 N/A N/A
Page 4 of 8

Zone Solar gain limit exceeded? (%) Internal blinds used?
Office S 6 NO (-37%) NO
Gym F 13 YES (+17%) NO
Meeting Room G 28 NO (-24%) NO
Criterion 4: The performance of the building, as built, should be consistent with thecalculated BER
Separate submission
Criterion 5: The necessary provisions for enabling energy-efficient operation of thebuilding should be in place
Separate submission
EPBD (Recast): Consideration of alternative energy systems
Were alternative energy systems considered and analysed as part of the design process? NO
Is evidence of such assessment available as a separate submission? NO
Are any such measures included in the proposed design? NO
Page 5 of 8

Technical Data Sheet (Actual vs. Notional Building)
Building Global Parameters Building Use
Actual NotionalArea [m ]2
External area [m ]2
Weather
Infiltration [m /hm @ 50Pa]3 2
Average conductance [W/K]
Average U-value [W/m K]2
Alpha value* [%]
* Percentage of the building's average heat transfer coefficient which is due to thermal bridging
14316360NOR5121431.916.83
14316360NOR418270.296.83
% Area Building TypeA1/A2 Retail/Financial and Professional servicesA3/A4/A5 Restaurants and Cafes/Drinking Est./TakeawaysB1 Offices and Workshop businessesB2 to B7 General Industrial and Special Industrial GroupsB8 Storage or DistributionC1 HotelsC2 Residential Inst.: Hospitals and Care HomesC2 Residential Inst.: Residential schools
100 C2 Residential Inst.: Universities and collegesC2A Secure Residential Inst.Residential spacesD1 Non-residential Inst.: Community/Day CentreD1 Non-residential Inst.: Libraries, Museums, and GalleriesD1 Non-residential Inst.: EducationD1 Non-residential Inst.: Primary Health Care BuildingD1 Non-residential Inst.: Crown and County CourtsD2 General Assembly and Leisure, Night Clubs and TheatresOthers: Passenger terminalsOthers: Emergency servicesOthers: Miscellaneous 24hr activitiesOthers: Car Parks 24 hrsOthers - Stand alone utility block
Energy Consumption by End Use [kWh/m ]2
Actual NotionalHeating
Cooling
Auxiliary
Lighting
Hot water
Equipment*
TOTAL*** Energy used by equipment does not count towards the total for calculating emissions.** Total is net of any electrical energy displaced by CHP generators, if applicable.
158.5101.7419.611.3140.17181.17
43.8601.629.171.2940.1755.94
Energy Production by Technology [kWh/m ]2
Actual NotionalPhotovoltaic systems
Wind turbines
CHP generators
Solar thermal systems
0000
0000
Energy & CO Emissions Summary2
Actual NotionalHeating + cooling demand [MJ/m ]2
Primary energy* [kWh/m ]2
Total emissions [kg/m ]2
510.55258.8945.3
136.8787.3715.2
* Primary energy is net of any electrical energy displaced by CHP generators, if applicable.
Page 6 of 8

HVAC Systems Performance
System Type Heat dem Cool dem Heat con Cool con Aux con Heat Cool Heat gen Cool genMJ/m2 MJ/m2 kWh/m2 kWh/m2 kWh/m2 SSEEF SSEER SEFF SEER
[ST] Central heating using water: radiators, [HS] LTHW boiler, [HFT] Natural Gas, [CFT] Electricity
Actual
Notional
352
122.2
0
0
115
41
0
0
1.6
1.1
0.85
0.83
0
0
0.85
----
0
----
[ST] Central heating using water: radiators, [HS] LTHW boiler, [HFT] Natural Gas, [CFT] Electricity
Actual
Notional
904.5
166.8
0
0
295.6
56.6
0
0
7.6
9.6
0.85
0.82
0
0
0.85
----
0
----
[ST] Central heating using water: radiators, [HS] LTHW boiler, [HFT] Natural Gas, [CFT] Electricity
Actual
Notional
809.4
181
0
0
264.5
61.4
0
0
1.7
1.8
0.85
0.82
0
0
0.85
----
0
----
Key to terms
Heat dem [MJ/m2] = Heating energy demandCool dem [MJ/m2] = Cooling energy demandHeat con [kWh/m2] = Heating energy consumptionCool con [kWh/m2] = Cooling energy consumptionAux con [kWh/m2] = Auxiliary energy consumptionHeat SSEFF = Heating system seasonal efficiency (for notional building, value depends on activity glazing class)Cool SSEER = Cooling system seasonal energy efficiency ratioHeat gen SSEFF = Heating generator seasonal efficiencyCool gen SSEER = Cooling generator seasonal energy efficiency ratioST = System typeHS = Heat sourceHFT = Heating fuel typeCFT = Cooling fuel type
Page 7 of 8

Key Features
The BCO can give particular attention to items with specifications that are better than typically expected.
Element U U Surface where the minimum value occurs*i-Typ i-Min
Wall 0.23 1.66 External Wall
Floor 0.2 0.95 Ground Floor
Roof 0.15 1.5 Internal Ceiling
Windows, roof windows, and rooflights 1.5 2.36 Elevation 5, FF 10
Personnel doors 1.5 3.08 Elevation 4 Door
Vehicle access & similar large doors 1.5 - No vehicle doors in project
High usage entrance doors 1.5 - No high usage entrance doors in project
Building fabric
U = Typical individual element U-values [W/(m K)]i-Typ2 U = Minimum individual element U-values [W/(m K)]i-Min
2
* There might be more than one surface where the minimum U-value occurs.
Air Permeability Typical value This building
m /(h.m ) at 50 Pa 3 2 5 5
Page 8 of 8

Appendix A(ii) – BRUKL Output
Proposed Building BRUKL

BRUKL Output DocumentCompliance with England Building Regulations Part L 2013
Administrative information
Criterion 1: The calculated CO emission rate for the building should not exceed the target2
Criterion 2: The performance of the building fabric and the building services shouldachieve reasonable overall standards of energy efficiency
Project name
Date: Fri Jan 29 16:00:33 2016
As designedWilliam Knibb Centre - Proposed
Building DetailsAddress: ,
Owner DetailsName:
Telephone number:
Address: , , Certification toolCalculation engine: TAS
Calculation engine version: "v9.3.3"
Interface to calculation engine: TAS
Interface to calculation engine version: v9.3.3
BRUKL compliance check version: v5.2.d.2
Certifier detailsName:
Telephone number:
Address: , ,
CO emission rate from the notional building, kgCO /m .annum2 22 16.2
Target CO emission rate (TER), kgCO /m .annum2 22 16.2
Building CO emission rate (BER), kgCO /m .annum2 22 15.2
Are emissions from the building less than or equal to the target? BER =< TER
Are as built details the same as used in the BER calculations? Separate submission
Element U U U Surface where the maximum value occurs*a-Limit a-Calc i-Calc
Wall** 0.35 0.29 0.29 External Wall
Floor 0.25 0.16 0.24 Exposed Floor
Roof 0.25 0.18 1.31 Internal Ceiling
Windows***, roof windows, and rooflights 2.2 1.65 1.87 Elevation 5, FF 10
Personnel doors 2.2 1.61 1.61 Elevation 4 Door
Vehicle access & similar large doors 1.5 - - No vehicle doors in project
High usage entrance doors 3.5 - - No high usage entrance doors in project
Building fabric
Values not achieving standards in the Non-Domestic Building Services Compliance Guide and Part L are displayed in red.
U = Limiting area-weighted average U-values [W/(m K)]a-Limit2
U = Calculated area-weighted average U-values [W/(m K)]a-Calc2 U = Calculated maximum individual element U-values [W/(m K)]i-Calc
2
* There might be more than one surface where the maximum U-value occurs.** Automatic U-value check by the tool does not apply to curtain walls whose limiting standard is similar to that for windows.*** Display windows and similar glazing are excluded from the U-value check.N.B.: Neither roof ventilators (inc. smoke vents) nor swimming pool basins are modelled or checked against the limiting standards by the tool.
Air Permeability Worst acceptable standard This building
m /(h.m ) at 50 Pa 3 2 10 10** Buildings with less than 500 m total useful floor area may avoid the need for a pressure test provided that the air permeability is taken as2
15 m /(h.m ) at 50 Pa. 3 2
Page 1 of 8
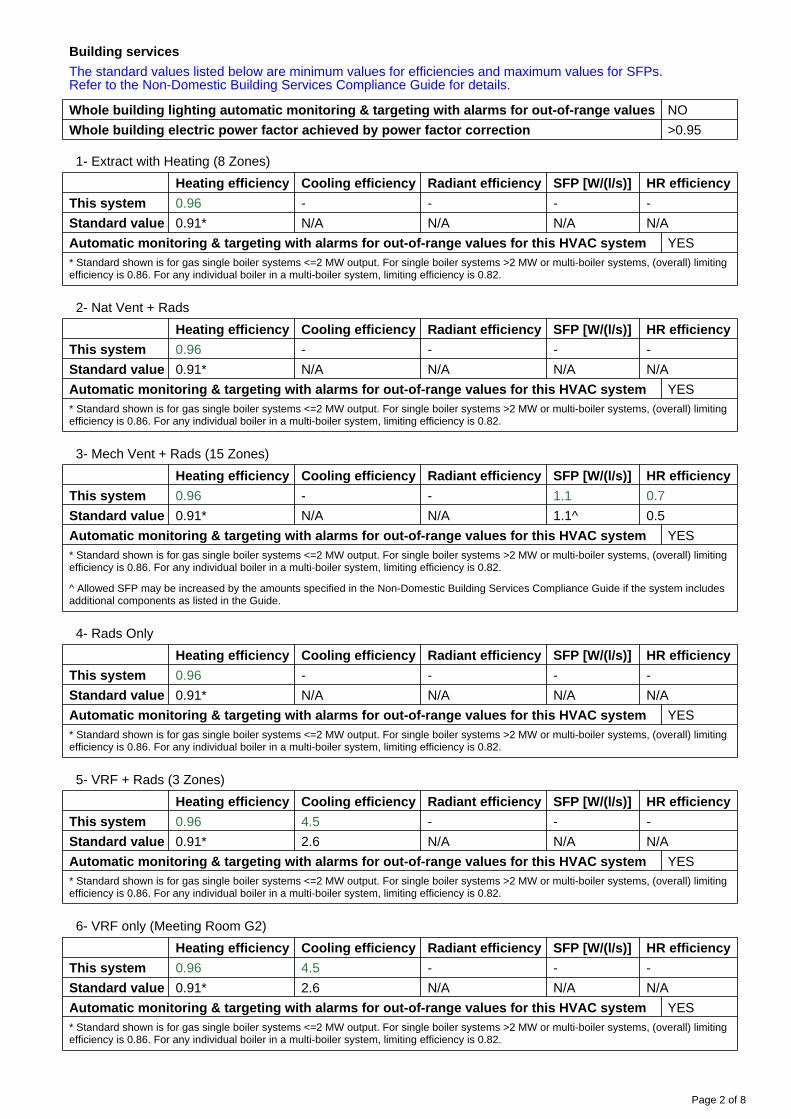
Whole building lighting automatic monitoring & targeting with alarms for out-of-range values NO
Whole building electric power factor achieved by power factor correction >0.95
Building services
The standard values listed below are minimum values for efficiencies and maximum values for SFPs.Refer to the Non-Domestic Building Services Compliance Guide for details.
1- Extract with Heating (8 Zones)
Heating efficiency Cooling efficiency Radiant efficiency SFP [W/(l/s)] HR efficiency
This system 0.96 - - - -
Standard value 0.91* N/A N/A N/A N/A
Automatic monitoring & targeting with alarms for out-of-range values for this HVAC system YES* Standard shown is for gas single boiler systems <=2 MW output. For single boiler systems >2 MW or multi-boiler systems, (overall) limiting efficiency is 0.86. For any individual boiler in a multi-boiler system, limiting efficiency is 0.82.
2- Nat Vent + Rads
Heating efficiency Cooling efficiency Radiant efficiency SFP [W/(l/s)] HR efficiency
This system 0.96 - - - -
Standard value 0.91* N/A N/A N/A N/A
Automatic monitoring & targeting with alarms for out-of-range values for this HVAC system YES* Standard shown is for gas single boiler systems <=2 MW output. For single boiler systems >2 MW or multi-boiler systems, (overall) limiting efficiency is 0.86. For any individual boiler in a multi-boiler system, limiting efficiency is 0.82.
3- Mech Vent + Rads (15 Zones)
Heating efficiency Cooling efficiency Radiant efficiency SFP [W/(l/s)] HR efficiency
This system 0.96 - - 1.1 0.7
Standard value 0.91* N/A N/A 1.1^ 0.5
Automatic monitoring & targeting with alarms for out-of-range values for this HVAC system YES* Standard shown is for gas single boiler systems <=2 MW output. For single boiler systems >2 MW or multi-boiler systems, (overall) limiting efficiency is 0.86. For any individual boiler in a multi-boiler system, limiting efficiency is 0.82.
^ Allowed SFP may be increased by the amounts specified in the Non-Domestic Building Services Compliance Guide if the system includes additional components as listed in the Guide.
4- Rads Only
Heating efficiency Cooling efficiency Radiant efficiency SFP [W/(l/s)] HR efficiency
This system 0.96 - - - -
Standard value 0.91* N/A N/A N/A N/A
Automatic monitoring & targeting with alarms for out-of-range values for this HVAC system YES* Standard shown is for gas single boiler systems <=2 MW output. For single boiler systems >2 MW or multi-boiler systems, (overall) limiting efficiency is 0.86. For any individual boiler in a multi-boiler system, limiting efficiency is 0.82.
5- VRF + Rads (3 Zones)
Heating efficiency Cooling efficiency Radiant efficiency SFP [W/(l/s)] HR efficiency
This system 0.96 4.5 - - -
Standard value 0.91* 2.6 N/A N/A N/A
Automatic monitoring & targeting with alarms for out-of-range values for this HVAC system YES* Standard shown is for gas single boiler systems <=2 MW output. For single boiler systems >2 MW or multi-boiler systems, (overall) limiting efficiency is 0.86. For any individual boiler in a multi-boiler system, limiting efficiency is 0.82.
6- VRF only (Meeting Room G2)
Heating efficiency Cooling efficiency Radiant efficiency SFP [W/(l/s)] HR efficiency
This system 0.96 4.5 - - -
Standard value 0.91* 2.6 N/A N/A N/A
Automatic monitoring & targeting with alarms for out-of-range values for this HVAC system YES* Standard shown is for gas single boiler systems <=2 MW output. For single boiler systems >2 MW or multi-boiler systems, (overall) limiting efficiency is 0.86. For any individual boiler in a multi-boiler system, limiting efficiency is 0.82.
Page 2 of 8
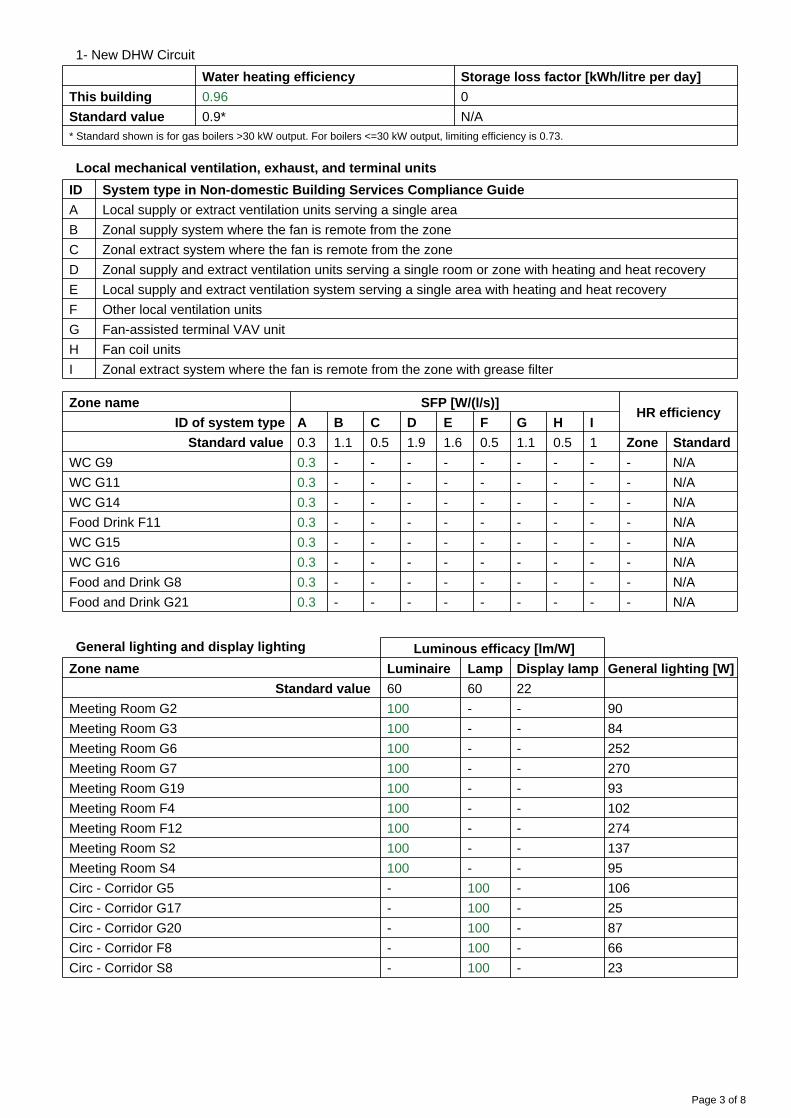
1- New DHW Circuit
Water heating efficiency Storage loss factor [kWh/litre per day]
This building 0.96 0
Standard value 0.9* N/A* Standard shown is for gas boilers >30 kW output. For boilers <=30 kW output, limiting efficiency is 0.73.
Local mechanical ventilation, exhaust, and terminal units
ID System type in Non-domestic Building Services Compliance Guide
A Local supply or extract ventilation units serving a single area
B Zonal supply system where the fan is remote from the zone
C Zonal extract system where the fan is remote from the zone
D Zonal supply and extract ventilation units serving a single room or zone with heating and heat recovery
E Local supply and extract ventilation system serving a single area with heating and heat recovery
F Other local ventilation units
G Fan-assisted terminal VAV unit
H Fan coil units
I Zonal extract system where the fan is remote from the zone with grease filter
Zone name SFP [W/(l/s)]HR efficiency
ID of system type A B C D E F G H I
Standard value 0.3 1.1 0.5 1.9 1.6 0.5 1.1 0.5 1 Zone Standard
WC G9 0.3 - - - - - - - - - N/A
WC G11 0.3 - - - - - - - - - N/A
WC G14 0.3 - - - - - - - - - N/A
Food Drink F11 0.3 - - - - - - - - - N/A
WC G15 0.3 - - - - - - - - - N/A
WC G16 0.3 - - - - - - - - - N/A
Food and Drink G8 0.3 - - - - - - - - - N/A
Food and Drink G21 0.3 - - - - - - - - - N/A
General lighting and display lighting Luminous efficacy [lm/W]
Zone name Luminaire Lamp Display lamp General lighting [W]
Standard value 60 60 22
Meeting Room G2 100 - - 90
Meeting Room G3 100 - - 84
Meeting Room G6 100 - - 252
Meeting Room G7 100 - - 270
Meeting Room G19 100 - - 93
Meeting Room F4 100 - - 102
Meeting Room F12 100 - - 274
Meeting Room S2 100 - - 137
Meeting Room S4 100 - - 95
Circ - Corridor G5 - 100 - 106
Circ - Corridor G17 - 100 - 25
Circ - Corridor G20 - 100 - 87
Circ - Corridor F8 - 100 - 66
Circ - Corridor S8 - 100 - 23
Page 3 of 8

General lighting and display lighting Luminous efficacy [lm/W]
Zone name Luminaire Lamp Display lamp General lighting [W]
Standard value 60 60 22
Office G1 100 - - 306
Office F2 100 - - 109
Store G10 100 - - 2
Store F9 100 - - 6
WC G9 - 100 - 21
WC G11 - 100 - 26
WC G14 - 100 - 35
WC F10 - 100 - 60
WC F15 - 100 - 58
Food Drink F11 - 60 - 41
Circ - Stairs G18 - 100 - 13
Circ - Stairs F1 - 100 - 27
Circ - Stairs F7 - 100 - 32
Circ - Stairs S1 - 100 - 27
Circ - Stairs S6 - 100 - 28
Photo Copy F18 100 - - 194
Plant Room S7 60 - - 130
WC G15 - 100 - 21
Circ - Stairs G25 - 100 - 35
Circ - Entrance G4 - 100 - 17
Circ - Entrance G23 - 100 - 28
Store G12 100 - - 20
Store G13 100 - - 23
Store G24 100 - - 5
WC G16 - 100 - 23
Food and Drink G8 - 100 - 84
Food and Drink G21 - 100 - 274
Circ - Corridor G26 - 100 - 26
Meeting Room F13 100 - - 260
Meeting Room F14 100 - - 180
Meeting Room F17 100 - - 172
Meeting Room F19 100 - - 177
Open Office F3 100 - - 560
Open Office F5 100 - - 510
Open Office F16 100 - - 1135
Open Office S3 100 - - 510
Open Office S5 100 - - 579
Criterion 3: The spaces in the building should have appropriate passive control measuresto limit solar gains
Zone Solar gain limit exceeded? (%) Internal blinds used?
Meeting Room G2 NO (-69%) NO
Meeting Room G3 NO (-60%) NO
Meeting Room G6 NO (-48%) NO
Page 4 of 8

Zone Solar gain limit exceeded? (%) Internal blinds used?
Meeting Room G7 NO (-43%) NO
Meeting Room G19 NO (-71%) NO
Meeting Room F4 NO (-53%) NO
Meeting Room F12 NO (-48%) NO
Meeting Room S2 NO (-54%) NO
Meeting Room S4 NO (-53%) NO
Circ - Corridor G5 NO (-99%) NO
Office G1 NO (-48%) NO
Office F2 NO (-70%) NO
Food Drink F11 N/A N/A
Photo Copy F18 NO (-38%) NO
Food and Drink G8 NO (-36%) NO
Food and Drink G21 NO (-24%) NO
Meeting Room F13 NO (-35%) NO
Meeting Room F14 NO (-56%) NO
Meeting Room F17 NO (-30%) NO
Meeting Room F19 NO (-37%) NO
Open Office F3 NO (-29%) NO
Open Office F5 NO (-66%) NO
Open Office F16 NO (-44%) NO
Open Office S3 NO (-33%) NO
Open Office S5 NO (-75%) NO
Criterion 4: The performance of the building, as built, should be consistent with thecalculated BER
Separate submission
Criterion 5: The necessary provisions for enabling energy-efficient operation of thebuilding should be in place
Separate submission
EPBD (Recast): Consideration of alternative energy systems
Were alternative energy systems considered and analysed as part of the design process? NO
Is evidence of such assessment available as a separate submission? NO
Are any such measures included in the proposed design? YES
Page 5 of 8

Technical Data Sheet (Actual vs. Notional Building)
Building Global Parameters Building Use
Actual NotionalArea [m ]2
External area [m ]2
Weather
Infiltration [m /hm @ 50Pa]3 2
Average conductance [W/K]
Average U-value [W/m K]2
Alpha value* [%]
* Percentage of the building's average heat transfer coefficient which is due to thermal bridging
14266359NOR1017090.276.91
14266359NOR318780.36.91
% Area Building TypeA1/A2 Retail/Financial and Professional servicesA3/A4/A5 Restaurants and Cafes/Drinking Est./Takeaways
100 B1 Offices and Workshop businessesB2 to B7 General Industrial and Special Industrial GroupsB8 Storage or DistributionC1 HotelsC2 Residential Inst.: Hospitals and Care HomesC2 Residential Inst.: Residential schoolsC2 Residential Inst.: Universities and collegesC2A Secure Residential Inst.Residential spacesD1 Non-residential Inst.: Community/Day CentreD1 Non-residential Inst.: Libraries, Museums, and GalleriesD1 Non-residential Inst.: EducationD1 Non-residential Inst.: Primary Health Care BuildingD1 Non-residential Inst.: Crown and County CourtsD2 General Assembly and Leisure, Night Clubs and TheatresOthers: Passenger terminalsOthers: Emergency servicesOthers: Miscellaneous 24hr activitiesOthers: Car Parks 24 hrsOthers - Stand alone utility block
Energy Consumption by End Use [kWh/m ]2
Actual NotionalHeating
Cooling
Auxiliary
Lighting
Hot water
Equipment*
TOTAL*** Energy used by equipment does not count towards the total for calculating emissions.** Total is net of any electrical energy displaced by CHP generators, if applicable.
26.110.183.2111.898.5436.9649.92
14.960.224.5416.969.236.9645.88
Energy Production by Technology [kWh/m ]2
Actual NotionalPhotovoltaic systems
Wind turbines
CHP generators
Solar thermal systems
0000
0000
Energy & CO Emissions Summary2
Actual NotionalHeating + cooling demand [MJ/m ]2
Primary energy* [kWh/m ]2
Total emissions [kg/m ]2
95.188815.2
74.4594.4916.2
* Primary energy is net of any electrical energy displaced by CHP generators, if applicable.
Page 6 of 8

HVAC Systems Performance
System Type Heat dem Cool dem Heat con Cool con Aux con Heat Cool Heat gen Cool genMJ/m2 MJ/m2 kWh/m2 kWh/m2 kWh/m2 SSEEF SSEER SEFF SEER
[ST] Central heating using water: radiators, [HS] LTHW boiler, [HFT] Natural Gas, [CFT] Electricity
Actual
Notional
182.7
188.7
0
0
54.5
41.6
0
0
3
3.9
0.93
1.26
0
0
0.96
----
0
----
[ST] Central heating using water: radiators, [HS] LTHW boiler, [HFT] Natural Gas, [CFT] Electricity
Actual
Notional
130
101.9
0
0
38.8
22.5
0
0
1.1
1
0.93
1.26
0
0
0.96
----
0
----
[ST] Central heating using water: radiators, [HS] LTHW boiler, [HFT] Natural Gas, [CFT] Electricity
Actual
Notional
65.9
33.5
0
0
19.7
7.4
0
0
5.5
8
0.93
1.26
0
0
0.96
----
0
----
[ST] Central heating using water: radiators, [HS] LTHW boiler, [HFT] Natural Gas, [CFT] Electricity
Actual
Notional
120.1
105.2
0
0
35.8
23.2
0
0
1.1
1.1
0.93
1.26
0
0
0.96
----
0
----
[ST] Central heating using water: radiators, [HS] LTHW boiler, [HFT] Natural Gas, [CFT] Electricity
Actual
Notional
93.2
40.6
26.9
24.9
27.8
9
1.7
1.9
2.1
1.1
0.93
1.26
4.5
3.6
0.96
----
4.5
----
[ST] No Heating or Cooling
Actual
Notional
134.5
60.4
40
63.9
40.1
13.3
2.5
4.9
0
0
0.93
1.26
4.5
3.6
0.96
----
4.5
----
Key to terms
Heat dem [MJ/m2] = Heating energy demandCool dem [MJ/m2] = Cooling energy demandHeat con [kWh/m2] = Heating energy consumptionCool con [kWh/m2] = Cooling energy consumptionAux con [kWh/m2] = Auxiliary energy consumptionHeat SSEFF = Heating system seasonal efficiency (for notional building, value depends on activity glazing class)Cool SSEER = Cooling system seasonal energy efficiency ratioHeat gen SSEFF = Heating generator seasonal efficiencyCool gen SSEER = Cooling generator seasonal energy efficiency ratioST = System typeHS = Heat sourceHFT = Heating fuel typeCFT = Cooling fuel type
Page 7 of 8

Key Features
The BCO can give particular attention to items with specifications that are better than typically expected.
Element U U Surface where the minimum value occurs*i-Typ i-Min
Wall 0.23 0.29 External Wall
Floor 0.2 0.15 Ground Floor
Roof 0.15 0.18 Roof
Windows, roof windows, and rooflights 1.5 1.62 Type 4
Personnel doors 1.5 1.6 Elevation 5 Door
Vehicle access & similar large doors 1.5 - No vehicle doors in project
High usage entrance doors 1.5 - No high usage entrance doors in project
Building fabric
U = Typical individual element U-values [W/(m K)]i-Typ2 U = Minimum individual element U-values [W/(m K)]i-Min
2
* There might be more than one surface where the minimum U-value occurs.
Air Permeability Typical value This building
m /(h.m ) at 50 Pa 3 2 5 10
Page 8 of 8