Embed Size (px)
Citation preview
Energy Research and Development Division
FINAL PROJECT REPORT
Effect of Variable Fuel Composition on Emissions and Lean Blowoff Stability Performance Analysis of Nine Industrial Combustion Applications
Appendix F - Burner Configuration #6: Gas Turbine Combuster
California Energy Commission Edmund G. Brown Jr., Governor
June 2017 | CEC-500-2017-026-APF
UCI Combustion Laboratory Burner Config. #6. Gas turbine combustor
Burner Configuration # 6: Gas turbine combustor
Emissions and Stability Performance
CEC Agreement No. 500-13-004
Prepared by:
Andrés Colorado and Vincent McDonell1
Version1: 03 Dec 2015
1 949 824 5950 x 11121; [email protected]
UCI Combustion Laboratory Burner Config. #6. Gas turbine combustor
1 | P a g e
Contents
EXECUTIVE SUMMARY ......................................................................................................................................................... 4
Key Features .............................................................................................................................................................................. 1
Virtual AeroThermal Field - Computational Fluid Dynamics ................................................................................ 2
1.1. Zonal distribution ................................................................................................................................................ 2
1.2. Reactor Network Variables .............................................................................................................................. 3
1.3. Effect of Fuel Composition on Emissions ................................................................................................... 4
1.3.1. Fuel class I - Hydrogen enriched natural gas .................................................................................. 5
1.3.2. Fuel class II- Landfill / digester biogas .............................................................................................. 7
1.3.3. Fuel class III-Mixtures with heavier hydrocarbons .................................................................... 10
1.4. Stability analysis ................................................................................................................................................. 12
Appendix A: Interchangeability analysis ...................................................................................................................... 1
1.4.1. Interchangeability under the criterion of Flashback (AGA) ..................................................... 2
1.4.2. Interchangeability under the criterion of Lifting (AGA) ............................................................. 3
1.4.3. Interchangeability under the criterion of yellow tipping (AGA)............................................. 4
Appendix B: NOx pathways ................................................................................................................................................ 1
References ................................................................................................................................................................................ 43
UCI Combustion Laboratory Burner Config. #6. Gas turbine combustor
2 | P a g e
List of Figures
Figure 1. Schematic representation of the typical flow distrubution in a turbine combustor. ............... 1 Figure 2. Example of a Combustion System divided into several chemical reactors. ................................. 3 Figure 3. Concentration of NOx ( left axis) & Emission index (right vertical axis)-Fuel class I. Hydrogen enriched NG .......................................................................................................................................................... 6 Figure 4. . Concentration of CO (see left axis- part per Million) & Emission index (read right vertical axis)-Fuel class I. Hydrogen enriched NG ...................................................................................................................... 6 Figure 5. NOx concentration [ppmdv corrected at 15%O2] and Emission index as a function of the mole fraction of CO2 in the fuel. ........................................................................................................................................ 8 Figure 6. Concentration of CO & Emission index Fuel class II-biogas ................................................................ 9 Figure 7. NOx concentration and Emission index as a function of the Equivalence ratio for natural gas mixed with C2H6 (left) and C3H8 (right). ........................................................................................................... 10 Figure 8. CO concentration and Emission index as a function of the Equivalence ratio for natural gas mixed with C2H6 (left) and C3H8 (right). ................................................................................................................... 11 Figure A-1. AGA Flashback index. ..................................................................................................................................... 2 Figure A-2. AGA Lifting index. ........................................................................................................................................... 3 Figure A-3. AGA Yellow tipping index. Analysis of interchangeability for mixtures CH4-H2 and CO-H2
................................................................................................................................................................................................ ......... 4
UCI Combustion Laboratory Burner Config. #6. Gas turbine combustor
3 | P a g e
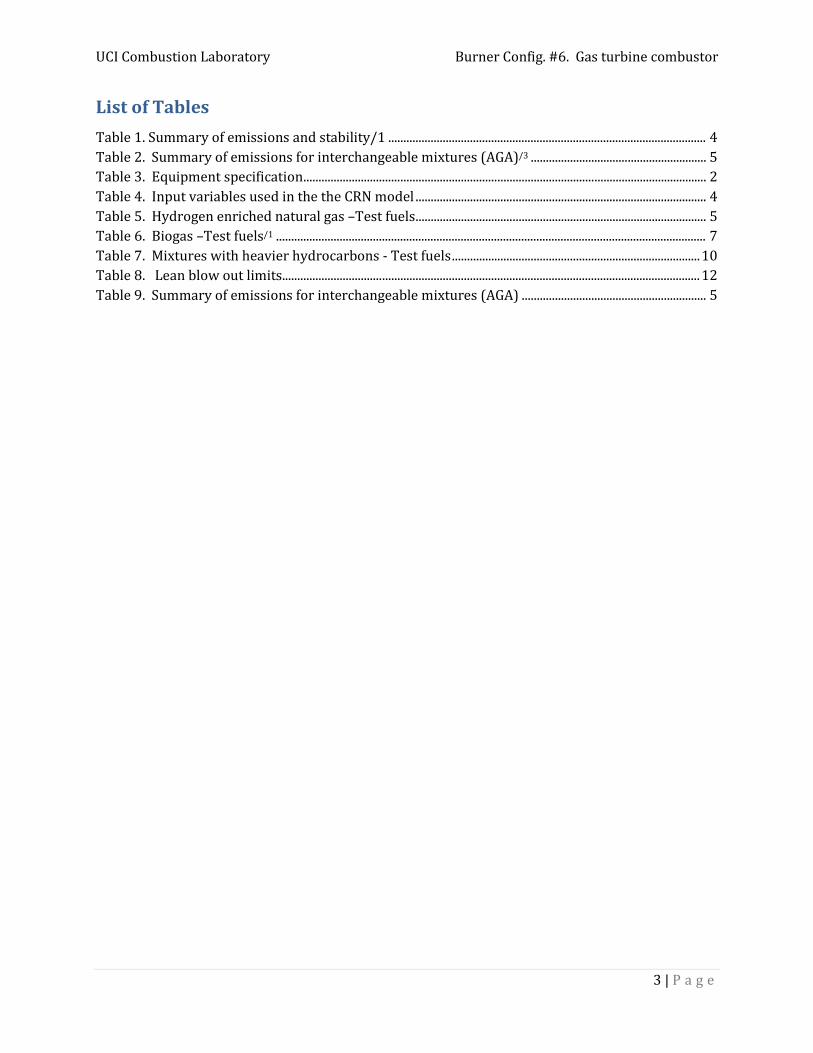
List of Tables Table 1. Summary of emissions and stability/1 ......................................................................................................... 4 Table 2. Summary of emissions for interchangeable mixtures (AGA)/3 .......................................................... 5 Table 3. Equipment specification ..................................................................................................................................... 2 Table 4. Input variables used in the the CRN model ................................................................................................ 4 Table 5. Hydrogen enriched natural gas –Test fuels ................................................................................................ 5 Table 6. Biogas –Test fuels/1 .............................................................................................................................................. 7 Table 7. Mixtures with heavier hydrocarbons - Test fuels .................................................................................. 10 Table 8. Lean blow out limits.......................................................................................................................................... 12 Table 9. Summary of emissions for interchangeable mixtures (AGA) ............................................................. 5

UCI Combustion Laboratory Burner Config. #6. Gas turbine combustor
4 | P a g e
Burner Configuration # 6: Gas turbine combustor
EXECUTIVE SUMMARY A summary of the emissions and stability results for Burner Configuration #6, Gas turbine combustor, is presented in Table 1. The table is coded with colors and trend indicators to provide a simple overview of how fuel composition impacts the performance of Burner Configuration #6.
Table 1. Summary of emissions and stability/1 Fuel class/2
I II III
Hydrogen enriched natural gas (CH4+H2)
Biogas (CH4+CO2)
Mixtures with heavier hydrocarbons (C1/C2/C3)
NOx ↓ @↑H2 ↓@↑CO2 ↑@↑C2,C3..
CO ↓ @↑H2 ↑@↓CO2 ↑@↑C2,C3..
Stability ↑ @↑H2 ↓@↑CO2 ↑ @↑C2,C3..
/1 Cells highlighted with red represent negative impacts on emissions or stability. Conversely, cells highlighted with green represent positive effects.
/2 Fuel Class I: Hydrogen Containing Fuels Fuel Class II: Diluted Fuels Fuel Class III: Fuels with Higher Hydrocarbons
The example below illustrates how the table can be read:
Emissions Hydrogen enriched natural gas (CH4+H2)
Reading
NOx ↑ @↑H2 NOx increases (↑) when adding (@) (↑) H2
CO ↓ @↑H2 CO decreases (↓) when adding (↑) H2
UCI Combustion Laboratory Burner Config. #6. Gas turbine combustor
5 | P a g e
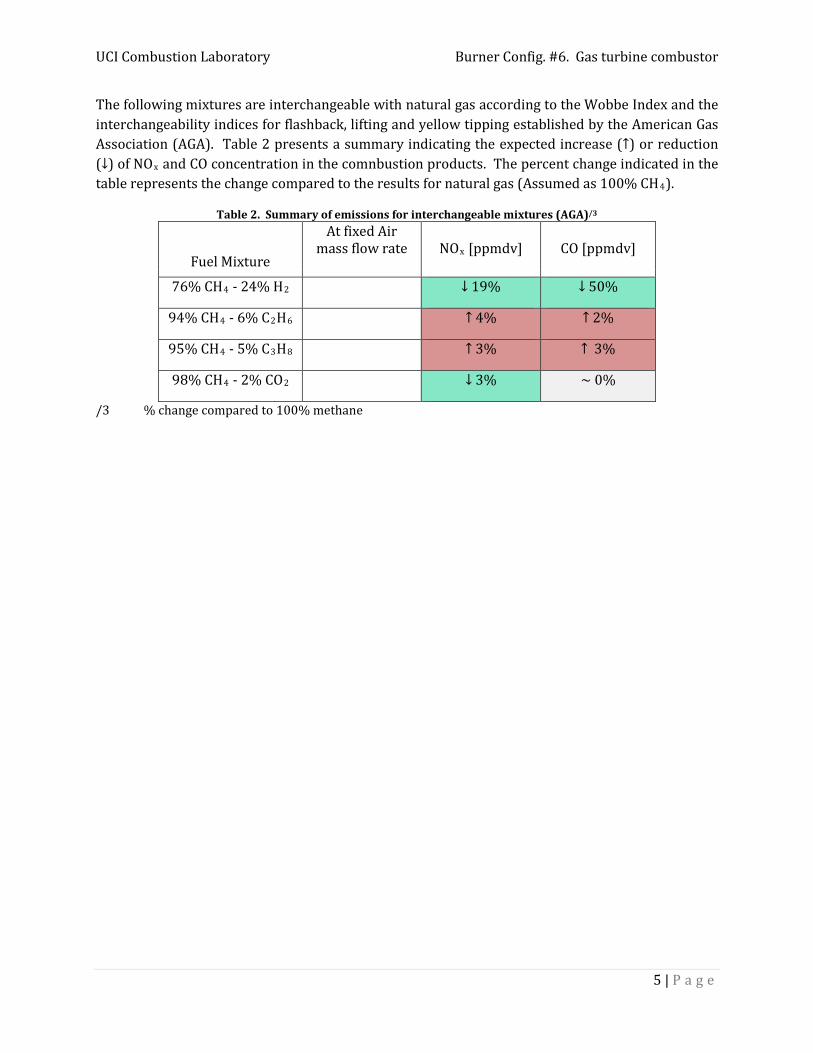
The following mixtures are interchangeable with natural gas according to the Wobbe Index and the interchangeability indices for flashback, lifting and yellow tipping established by the American Gas Association (AGA). Table 2 presents a summary indicating the expected increase (↑) or reduction (↓) of NOx and CO concentration in the comnbustion products. The percent change indicated in the table represents the change compared to the results for natural gas (Assumed as 100% CH4).
Table 2. Summary of emissions for interchangeable mixtures (AGA)/3
Fuel Mixture
At fixed Air mass flow rate NOx [ppmdv] CO [ppmdv]
76% CH4 - 24% H2 ↓ 19% ↓ 50%
94% CH4 - 6% C2H6 ↑ 4% ↑ 2%
95% CH4 - 5% C3H8 ↑ 3% ↑ 3%
98% CH4 - 2% CO2 ↓ 3% ~ 0%
/3 % change compared to 100% methane
UCI Combustion Laboratory Burner Config. #6. Gas turbine combustor
1 | P a g e
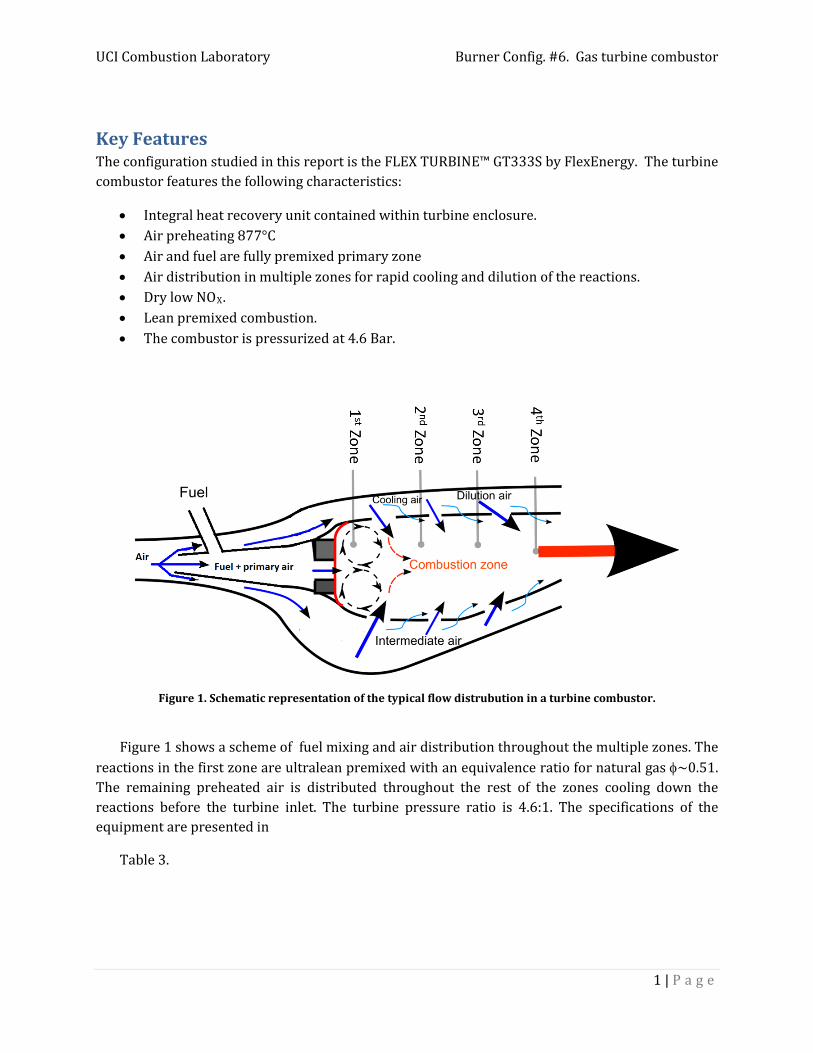
Key Features The configuration studied in this report is the FLEX TURBINE™ GT333S by FlexEnergy. The turbine combustor features the following characteristics:
• Integral heat recovery unit contained within turbine enclosure. • Air preheating 877°C • Air and fuel are fully premixed primary zone • Air distribution in multiple zones for rapid cooling and dilution of the reactions. • Dry low NOX. • Lean premixed combustion. • The combustor is pressurized at 4.6 Bar.
Figure 1. Schematic representation of the typical flow distrubution in a turbine combustor.
Figure 1 shows a scheme of fuel mixing and air distribution throughout the multiple zones. The reactions in the first zone are ultralean premixed with an equivalence ratio for natural gas φ~0.51. The remaining preheated air is distributed throughout the rest of the zones cooling down the reactions before the turbine inlet. The turbine pressure ratio is 4.6:1. The specifications of the equipment are presented in
Table 3.
UCI Combustion Laboratory Burner Config. #6. Gas turbine combustor
2 | P a g e
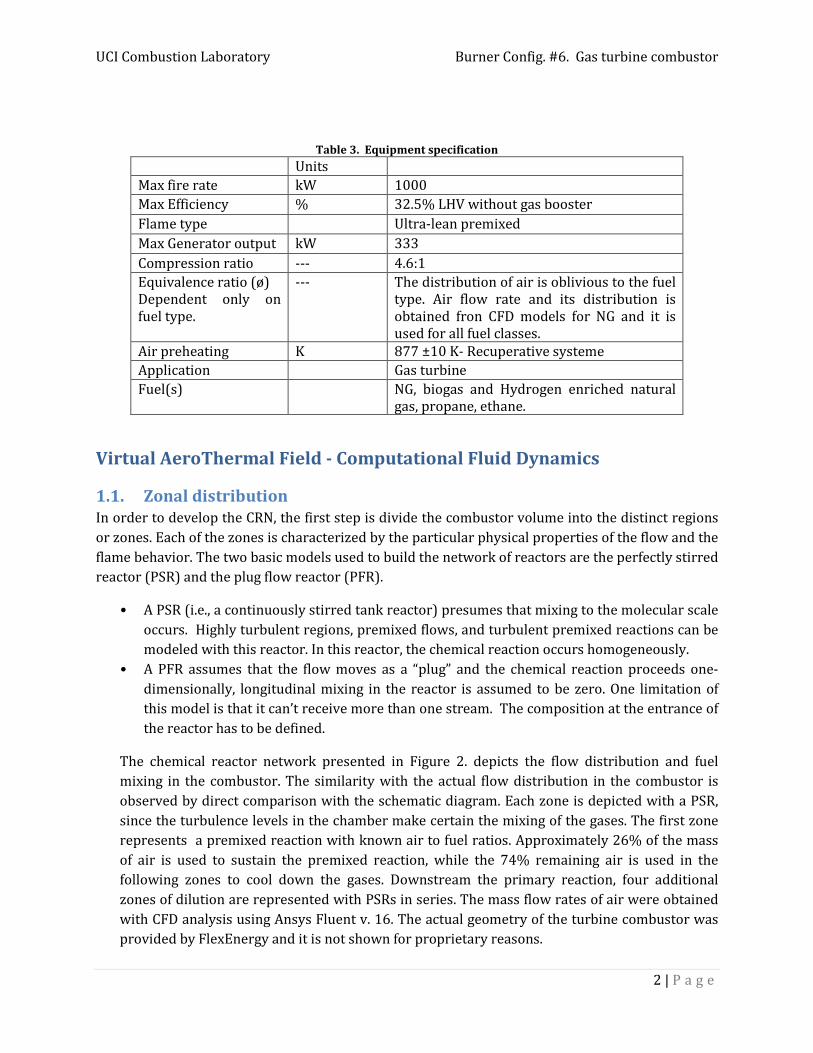
Table 3. Equipment specification
Units Max fire rate kW 1000 Max Efficiency % 32.5% LHV without gas booster Flame type Ultra-lean premixed Max Generator output kW 333 Compression ratio --- 4.6:1 Equivalence ratio (ø) Dependent only on fuel type.
--- The distribution of air is oblivious to the fuel type. Air flow rate and its distribution is obtained fron CFD models for NG and it is used for all fuel classes.
Air preheating K 877 ±10 K- Recuperative systeme Application Gas turbine Fuel(s) NG, biogas and Hydrogen enriched natural
gas, propane, ethane.
Virtual AeroThermal Field - Computational Fluid Dynamics
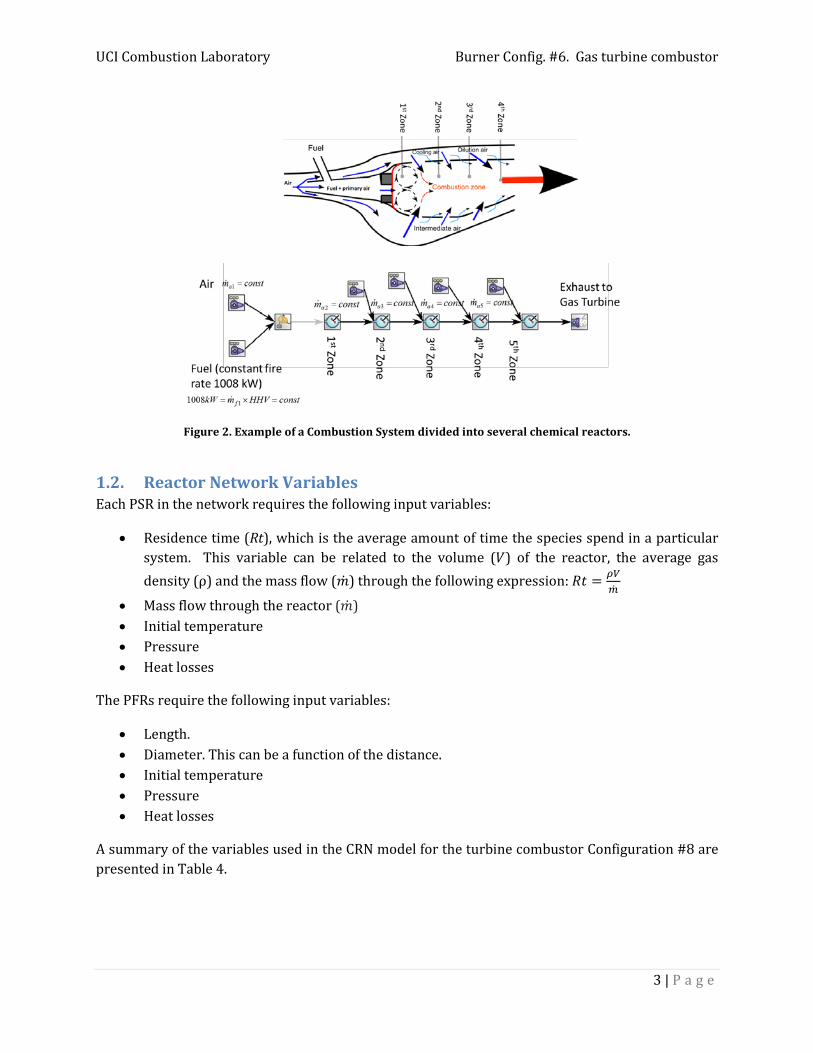
1.1. Zonal distribution In order to develop the CRN, the first step is divide the combustor volume into the distinct regions or zones. Each of the zones is characterized by the particular physical properties of the flow and the flame behavior. The two basic models used to build the network of reactors are the perfectly stirred reactor (PSR) and the plug flow reactor (PFR).
• A PSR (i.e., a continuously stirred tank reactor) presumes that mixing to the molecular scale occurs. Highly turbulent regions, premixed flows, and turbulent premixed reactions can be modeled with this reactor. In this reactor, the chemical reaction occurs homogeneously.
• A PFR assumes that the flow moves as a “plug” and the chemical reaction proceeds one-dimensionally, longitudinal mixing in the reactor is assumed to be zero. One limitation of this model is that it can’t receive more than one stream. The composition at the entrance of the reactor has to be defined.
The chemical reactor network presented in Figure 2. depicts the flow distribution and fuel mixing in the combustor. The similarity with the actual flow distribution in the combustor is observed by direct comparison with the schematic diagram. Each zone is depicted with a PSR, since the turbulence levels in the chamber make certain the mixing of the gases. The first zone represents a premixed reaction with known air to fuel ratios. Approximately 26% of the mass of air is used to sustain the premixed reaction, while the 74% remaining air is used in the following zones to cool down the gases. Downstream the primary reaction, four additional zones of dilution are represented with PSRs in series. The mass flow rates of air were obtained with CFD analysis using Ansys Fluent v. 16. The actual geometry of the turbine combustor was provided by FlexEnergy and it is not shown for proprietary reasons.
UCI Combustion Laboratory Burner Config. #6. Gas turbine combustor
3 | P a g e
Figure 2. Example of a Combustion System divided into several chemical reactors.
1.2. Reactor Network Variables Each PSR in the network requires the following input variables:
• Residence time (Rt), which is the average amount of time the species spend in a particular system. This variable can be related to the volume (𝑉𝑉) of the reactor, the average gas density (ρ) and the mass flow (�̇�𝑚) through the following expression: 𝑅𝑅𝑅𝑅 = 𝜌𝜌𝜌𝜌
�̇�𝑚
• Mass flow through the reactor (�̇�𝑚) • Initial temperature • Pressure • Heat losses
The PFRs require the following input variables:
• Length. • Diameter. This can be a function of the distance. • Initial temperature • Pressure • Heat losses
A summary of the variables used in the CRN model for the turbine combustor Configuration #8 are presented in Table 4.
UCI Combustion Laboratory Burner Config. #6. Gas turbine combustor
4 | P a g e
Table 4. Input variables used in the the CRN model Fuel classes (% by Vol.) • 100% CH4
• up to 100% H2 (Balance CH4). • Up to 65% CO2 (Balance CH4). • Up to 100% C2H6 (Balance CH4). • Up to 100% C3H8 (Balance CH4).
Equivalence ratio (ER) Variable: Depends on fuel class only ass air flow rate is a fixed variable.
Mass flow rate Variable: set to guarantee 1008 kW Pressure (Bar) 4.6 Inlet temperature (K) 877
1.3. Effect of Fuel Composition on Emissions In this section, the evaluation of the effect of the fuel composition on the emissions is assessed using the CRN methodology. The fire input to the burner is held constant at 1008kW. Also the control strategy fixes the air flow rate obtained through CFD analysis for natural gas and its distribution. This is, the primary air to fuel ratio is known, which for CH4 is φ = 0.51. The remaining air cools down the gases with the goal to ensure the integrity of the turbine blades.
The results for emissions are presented as part per million (ppm) or part per billion (ppb) of pollutant corrected at 15% oxygen on a dry basis. This presentation is representative of the measures in the field for gas turbines and it is also typical of units found in regulatory or permit limits. Volumetric fractions such as “ppm” indicate a relative proportion of the pollutant in the pool of species. When the emissions are plotted against equivalence ratio they represent the dependency of the emissions on the relative proportion of available oxygen.
The emissions are also presented in the form of emission index, which measures the emissions on a mass basis.
The emission index is usually presented in one of the following forms:
• as mass of pollutant emmited per mass of fuel burned:
gNOxkgFuel_burned
• Pollutant emmited per energy contained in the fuel:
gNOxkWhFuel_burned
• Pollutant emmited per electricity generated. In this case the emission index includes the efficiency of the system and it would be read as:
gNOxkWhelectricity_generated
UCI Combustion Laboratory Burner Config. #6. Gas turbine combustor
5 | P a g e
The CRN results for emissions were obtained using Chemkin Pro 15131 and the UCSD reaction mechanism [1]. While it is recognized that the specific chemistry mechanism used can influence the absolute values of the emissions predicted [2], the NOX and CO trends are generally insensitive to the mechanism used. UCSD has shown to be more accurate to predict the concentration of some species like N2O at low temperature reactions, under the same conditions the GRI 3.0 [3] fails to predict N2O trends at low temperature.
1.3.1. Fuel class I - Hydrogen enriched natural gas
The fuel class I is hydrogen enriched natural gas. The fuel compositions are presented in Table 5 . by fixing the air flow rate, the the equivalence ratio for the hydrogen blends in the primary zone becomes a variable. For example, at fixed fire rate and with the same air flow rate to the primary zone, the equivalenfe ratio for 30%H2/NG is φ=0.49, compared to NG, which is φ=0.51; At constant fire rate, and similar air flow rate the hydrogen blends are leaner than pure NG. With 100% H2, φ=0.4 in the primary zone. The reason is simple, the air requirements of hydrogen blends are lower than those of pure NG, therefore at constant fire rate and air flow rate the air to fuel ratio for hydrogen blends is leaner. Also, the addition of hydrogen increases the flame temperature, nevertheless the use of leaner mixtures counteract the effect that higher temperatures have on emissions.
Table 5. Hydrogen enriched natural gas –Test fuels Hydrogen enriched natural gas Wobbe index
(BTU/scf) 10% CH4 – 90% H2 1095 30% CH4 – 70% H2 1095 50% CH4 – 50% H2 1144 70% CH4 – 30% H2 1205
The emissions trends for CO, NOx, UHC, and VOC were obtained using the reactor network analysis and are presented on a concentration of part per million (ppm) on a dry basis corrected @ 15% O2 and in the form of Emission Index vs equivalence ratio (see Figure 3 and Figure 4 ).
UCI Combustion Laboratory Burner Config. #6. Gas turbine combustor
6 | P a g e
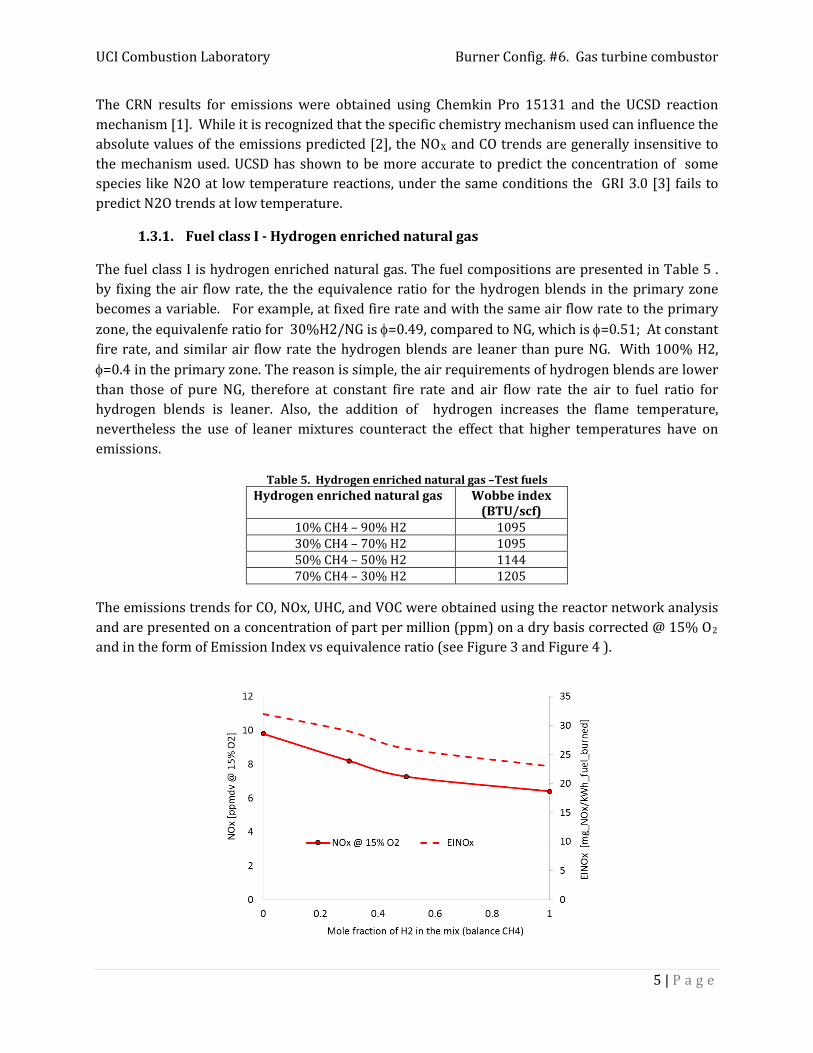
Figure 3. Concentration of NOx ( left axis) & Emission index (right vertical axis)-Fuel class I. Hydrogen enriched NG
A summary of the key points regarding the behavior of NOx emissions for Fuel Class I include:
• The experimental and CRN results show that the addition of hydrogen to NG leads a reduction of the concentration of NOx emissions. The use of leaner mixtures for hydrogen blends compared to NG in the primary zone seems to be the main reason to cause the NOx reduction. While for natural gas the equivalence ratio in the primary zone is φ=0.51 for pure hydrogen it is φ=0.4. The NOx reduction is from 9ppm with natural gas to 6 ppm with pure hydrogen, this represents a 33% reduction on the NOx emissions.
• Also the addition of H2 promotes the formation of intermediate species like OH and H, which form more NOx through the NNH, thermal and N2O routes compared to pure hydrocarbon flame. On the other hand, the prompt path is initiated by rapid reactions of hydrocarbon radicals with molecular nitrogen; therefore the addition of H2 to the fuel reduces the formation of NOx through the prompt route.
• The results in form of emission index display the same trends as the concentration results in ppmdv. However, the emission index form allows an easy estimation, for example, of the mass of pollutant emited per year; in contrast the concentration form gives a relative idea of volume occupied by the pollutant on a dry basis (after removing the water from the combustion products), which again biases the results for the Hydrogen samples, since hydrongen enriched fuels produce more water than carbon dioxide when compared to any hydrocarbon.
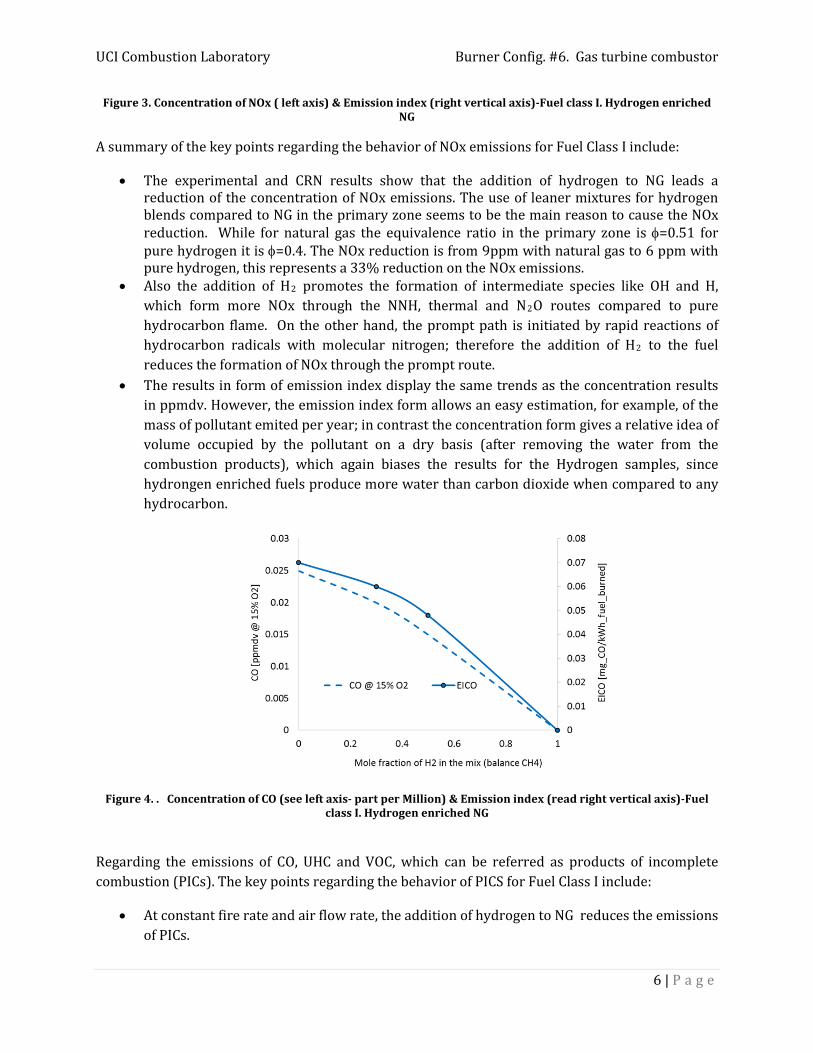
Figure 4. . Concentration of CO (see left axis- part per Million) & Emission index (read right vertical axis)-Fuel class I. Hydrogen enriched NG
Regarding the emissions of CO, UHC and VOC, which can be referred as products of incomplete combustion (PICs). The key points regarding the behavior of PICS for Fuel Class I include:
• At constant fire rate and air flow rate, the addition of hydrogen to NG reduces the emissions of PICs.
UCI Combustion Laboratory Burner Config. #6. Gas turbine combustor
7 | P a g e
• The high reactivity of hydrogen helps to complete the oxidation reactions avoiding incomplete combustion products. Moreover, the additional hydrogen displaces carbon from the fuel, so inherently less CO, UHC and VOC can form.
• The predicted levels of CO are below 1 ppm @ 15% O2 and decreases with the addition of hydrogen.
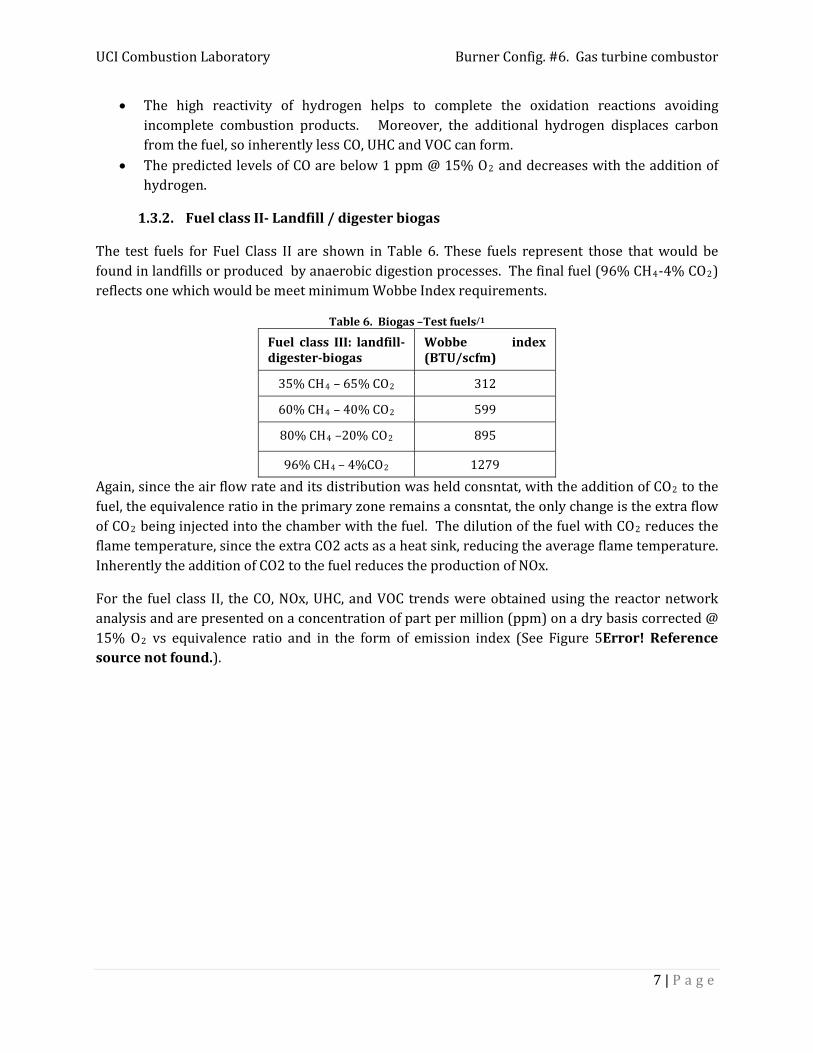
1.3.2. Fuel class II- Landfill / digester biogas
The test fuels for Fuel Class II are shown in Table 6. These fuels represent those that would be found in landfills or produced by anaerobic digestion processes. The final fuel (96% CH4-4% CO2) reflects one which would be meet minimum Wobbe Index requirements.
Table 6. Biogas –Test fuels/1
Fuel class III: landfill-digester-biogas
Wobbe index (BTU/scfm)
35% CH4 – 65% CO2 312
60% CH4 – 40% CO2 599
80% CH4 –20% CO2 895
96% CH4 – 4%CO2 1279
Again, since the air flow rate and its distribution was held consntat, with the addition of CO2 to the fuel, the equivalence ratio in the primary zone remains a consntat, the only change is the extra flow of CO2 being injected into the chamber with the fuel. The dilution of the fuel with CO2 reduces the flame temperature, since the extra CO2 acts as a heat sink, reducing the average flame temperature. Inherently the addition of CO2 to the fuel reduces the production of NOx.
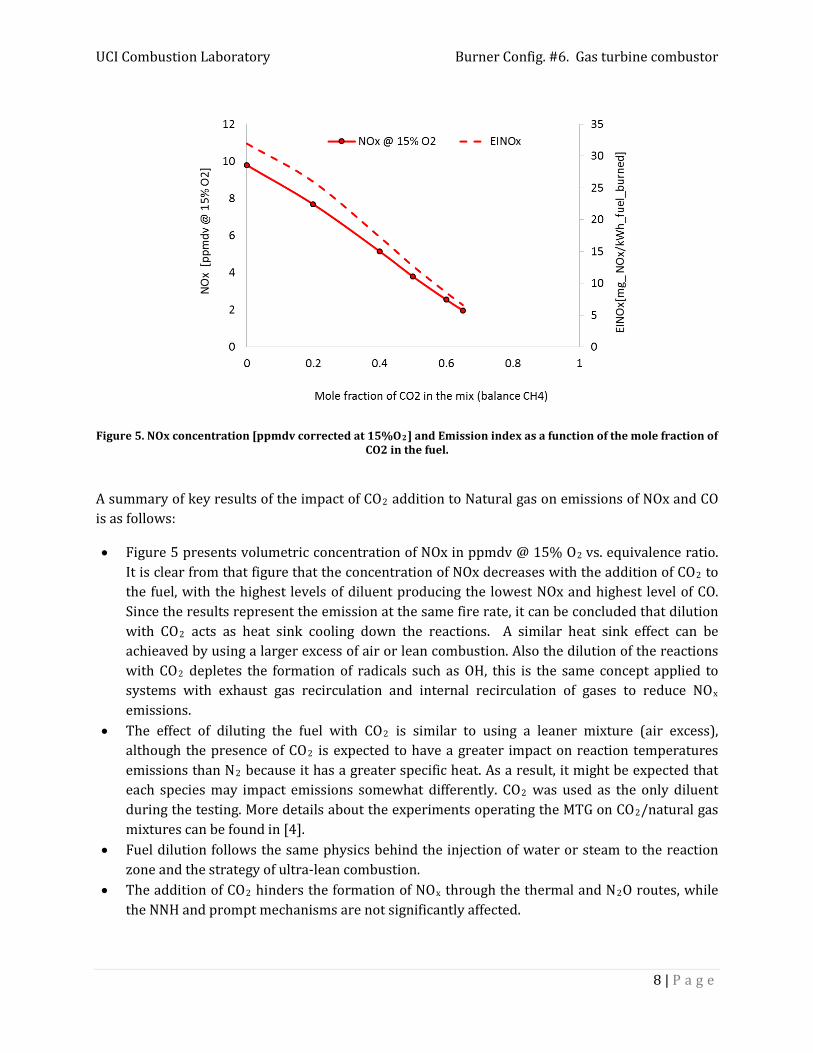
For the fuel class II, the CO, NOx, UHC, and VOC trends were obtained using the reactor network analysis and are presented on a concentration of part per million (ppm) on a dry basis corrected @ 15% O2 vs equivalence ratio and in the form of emission index (See Figure 5Error! Reference source not found.).
UCI Combustion Laboratory Burner Config. #6. Gas turbine combustor
8 | P a g e
Figure 5. NOx concentration [ppmdv corrected at 15%O2] and Emission index as a function of the mole fraction of CO2 in the fuel.
A summary of key results of the impact of CO2 addition to Natural gas on emissions of NOx and CO is as follows:
• Figure 5 presents volumetric concentration of NOx in ppmdv @ 15% O2 vs. equivalence ratio. It is clear from that figure that the concentration of NOx decreases with the addition of CO2 to the fuel, with the highest levels of diluent producing the lowest NOx and highest level of CO. Since the results represent the emission at the same fire rate, it can be concluded that dilution with CO2 acts as heat sink cooling down the reactions. A similar heat sink effect can be achieaved by using a larger excess of air or lean combustion. Also the dilution of the reactions with CO2 depletes the formation of radicals such as OH, this is the same concept applied to systems with exhaust gas recirculation and internal recirculation of gases to reduce NOx emissions.
• The effect of diluting the fuel with CO2 is similar to using a leaner mixture (air excess), although the presence of CO2 is expected to have a greater impact on reaction temperatures emissions than N2 because it has a greater specific heat. As a result, it might be expected that each species may impact emissions somewhat differently. CO2 was used as the only diluent during the testing. More details about the experiments operating the MTG on CO2/natural gas mixtures can be found in [4].
• Fuel dilution follows the same physics behind the injection of water or steam to the reaction zone and the strategy of ultra-lean combustion.
• The addition of CO2 hinders the formation of NOx through the thermal and N2O routes, while the NNH and prompt mechanisms are not significantly affected.
UCI Combustion Laboratory Burner Config. #6. Gas turbine combustor
9 | P a g e
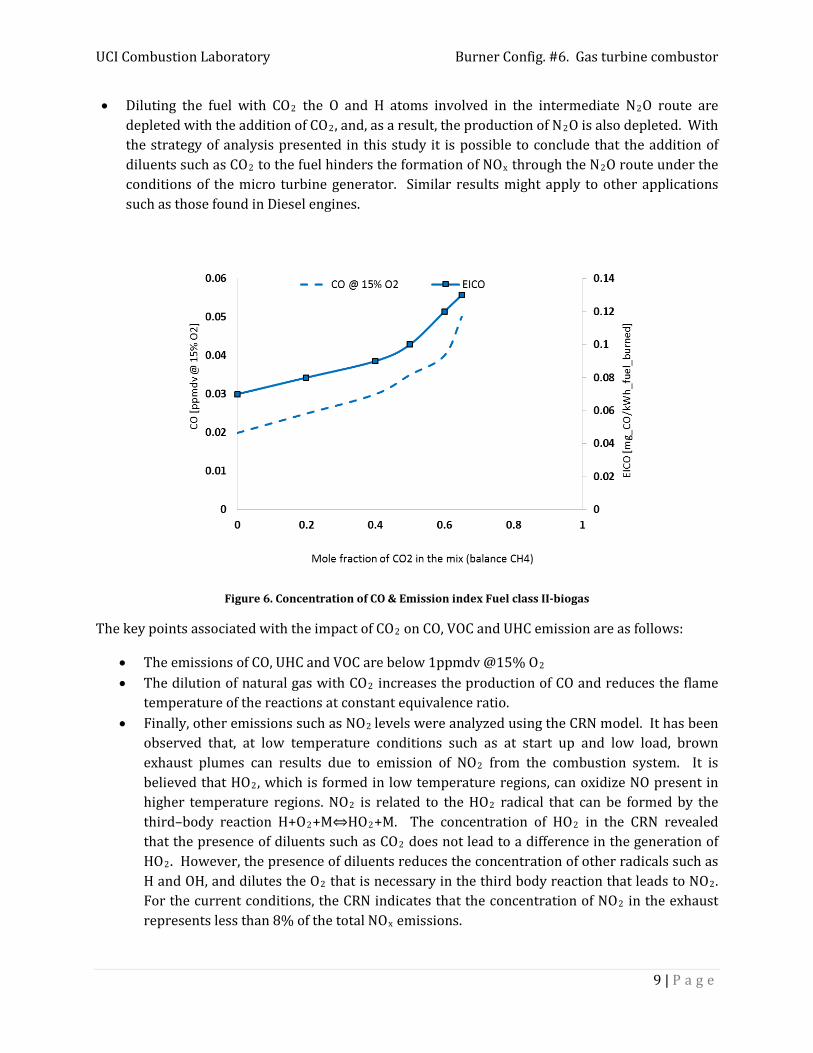
• Diluting the fuel with CO2 the O and H atoms involved in the intermediate N2O route are depleted with the addition of CO2, and, as a result, the production of N2O is also depleted. With the strategy of analysis presented in this study it is possible to conclude that the addition of diluents such as CO2 to the fuel hinders the formation of NOx through the N2O route under the conditions of the micro turbine generator. Similar results might apply to other applications such as those found in Diesel engines.
Figure 6. Concentration of CO & Emission index Fuel class II-biogas
The key points associated with the impact of CO2 on CO, VOC and UHC emission are as follows:
• The emissions of CO, UHC and VOC are below 1ppmdv @15% O2 • The dilution of natural gas with CO2 increases the production of CO and reduces the flame
temperature of the reactions at constant equivalence ratio. • Finally, other emissions such as NO2 levels were analyzed using the CRN model. It has been
observed that, at low temperature conditions such as at start up and low load, brown exhaust plumes can results due to emission of NO2 from the combustion system. It is believed that HO2, which is formed in low temperature regions, can oxidize NO present in higher temperature regions. NO2 is related to the HO2 radical that can be formed by the third–body reaction H+O2+M⇔HO2+M. The concentration of HO2 in the CRN revealed that the presence of diluents such as CO2 does not lead to a difference in the generation of HO2. However, the presence of diluents reduces the concentration of other radicals such as H and OH, and dilutes the O2 that is necessary in the third body reaction that leads to NO2. For the current conditions, the CRN indicates that the concentration of NO2 in the exhaust represents less than 8% of the total NOx emissions.
UCI Combustion Laboratory Burner Config. #6. Gas turbine combustor
10 | P a g e
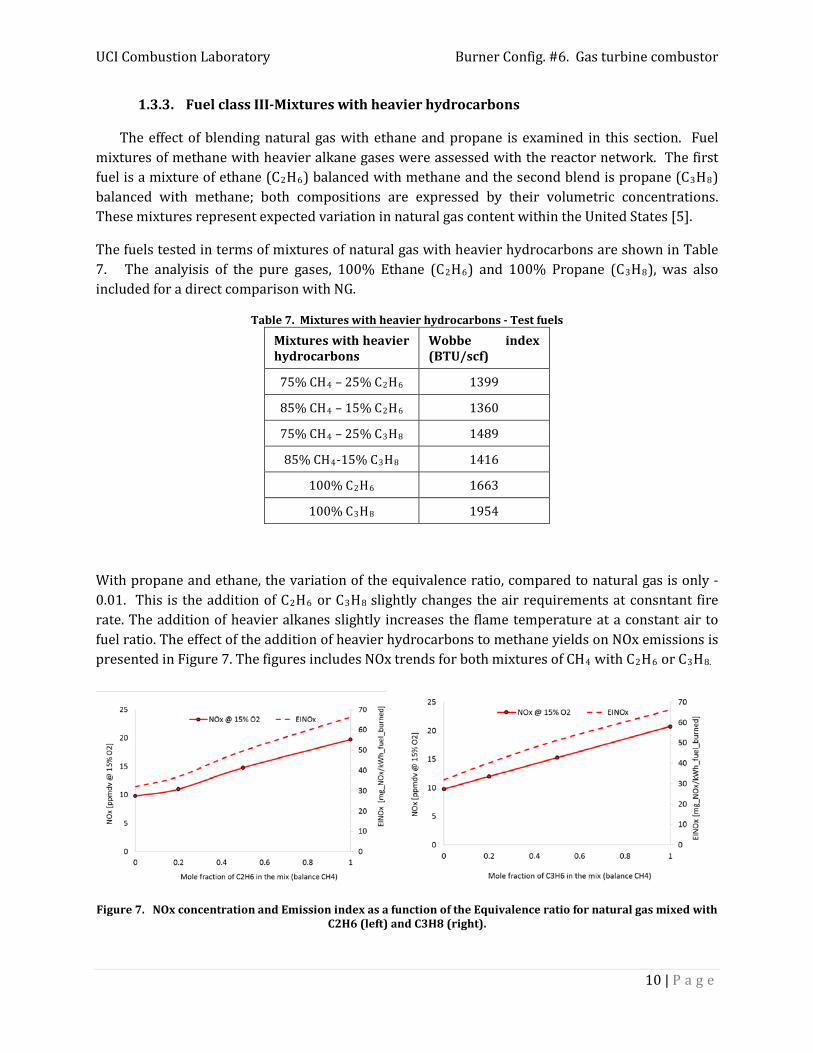
1.3.3. Fuel class III-Mixtures with heavier hydrocarbons
The effect of blending natural gas with ethane and propane is examined in this section. Fuel mixtures of methane with heavier alkane gases were assessed with the reactor network. The first fuel is a mixture of ethane (C2H6) balanced with methane and the second blend is propane (C3H8) balanced with methane; both compositions are expressed by their volumetric concentrations. These mixtures represent expected variation in natural gas content within the United States [5].
The fuels tested in terms of mixtures of natural gas with heavier hydrocarbons are shown in Table 7. The analyisis of the pure gases, 100% Ethane (C2H6) and 100% Propane (C3H8), was also included for a direct comparison with NG.
Table 7. Mixtures with heavier hydrocarbons - Test fuels
Mixtures with heavier hydrocarbons
Wobbe index (BTU/scf)
75% CH4 – 25% C2H6 1399
85% CH4 – 15% C2H6 1360
75% CH4 – 25% C3H8 1489
85% CH4-15% C3H8 1416
100% C2H6 1663
100% C3H8 1954
With propane and ethane, the variation of the equivalence ratio, compared to natural gas is only -0.01. This is the addition of C2H6 or C3H8 slightly changes the air requirements at consntant fire rate. The addition of heavier alkanes slightly increases the flame temperature at a constant air to fuel ratio. The effect of the addition of heavier hydrocarbons to methane yields on NOx emissions is presented in Figure 7. The figures includes NOx trends for both mixtures of CH4 with C2H6 or C3H8.
Figure 7. NOx concentration and Emission index as a function of the Equivalence ratio for natural gas mixed with C2H6 (left) and C3H8 (right).
UCI Combustion Laboratory Burner Config. #6. Gas turbine combustor
11 | P a g e
A summary of key impacts of fuel composition on NOx are as follows:
• The addition of heavier hydrocarbons to methane yields an increase of the concentration of NOx as presented inFigure 7. At temperatures below 1900K, the thermal NOx pathway is not expected to produce most of the NOx. Below this temperature, other NOx pathways play a more significant role. In this case, the N2O pathway plays a significant role in the overall levels of NOx emitted from lean premixed reactions with equivalence ratios less the 0.80. The N2O reaction is also pressure dependent. At high pressures NO formation via N2O becomes important. The pressure influence on NO formed from this mechanism is evidenced in the reaction O + N2 + M ↔ N2O + M; with “M” representing a chemically unchanged third body species. Per Le’ Chatelier’s principle, increasing pressure drives the equation to the right, thus enabling NO formation through the subsequent reactions.
• At an equal flame temperature, the addition of ethane or propane enhances the production of NOx. The trends indicate that the addition of ethane or propane to natural gas has a similar effect on increasing the NOx emissions.
• The results for the pure fuels (100% C2H6 or C3H8 ) also indicate an increase of NOx for heavier hydrocarbons compare to pure CH4.
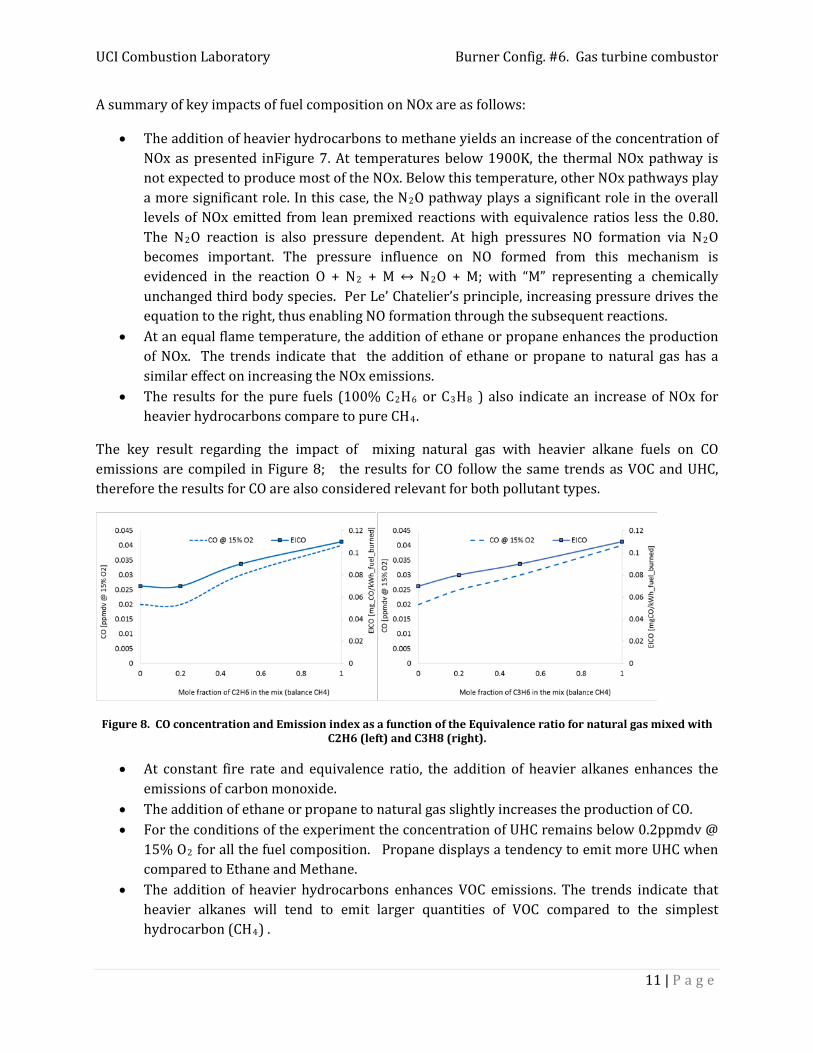
The key result regarding the impact of mixing natural gas with heavier alkane fuels on CO emissions are compiled in Figure 8; the results for CO follow the same trends as VOC and UHC, therefore the results for CO are also considered relevant for both pollutant types.
Figure 8. CO concentration and Emission index as a function of the Equivalence ratio for natural gas mixed with C2H6 (left) and C3H8 (right).
• At constant fire rate and equivalence ratio, the addition of heavier alkanes enhances the
emissions of carbon monoxide. • The addition of ethane or propane to natural gas slightly increases the production of CO. • For the conditions of the experiment the concentration of UHC remains below 0.2ppmdv @
15% O2 for all the fuel composition. Propane displays a tendency to emit more UHC when compared to Ethane and Methane.
• The addition of heavier hydrocarbons enhances VOC emissions. The trends indicate that heavier alkanes will tend to emit larger quantities of VOC compared to the simplest hydrocarbon (CH4) .
UCI Combustion Laboratory Burner Config. #6. Gas turbine combustor
12 | P a g e
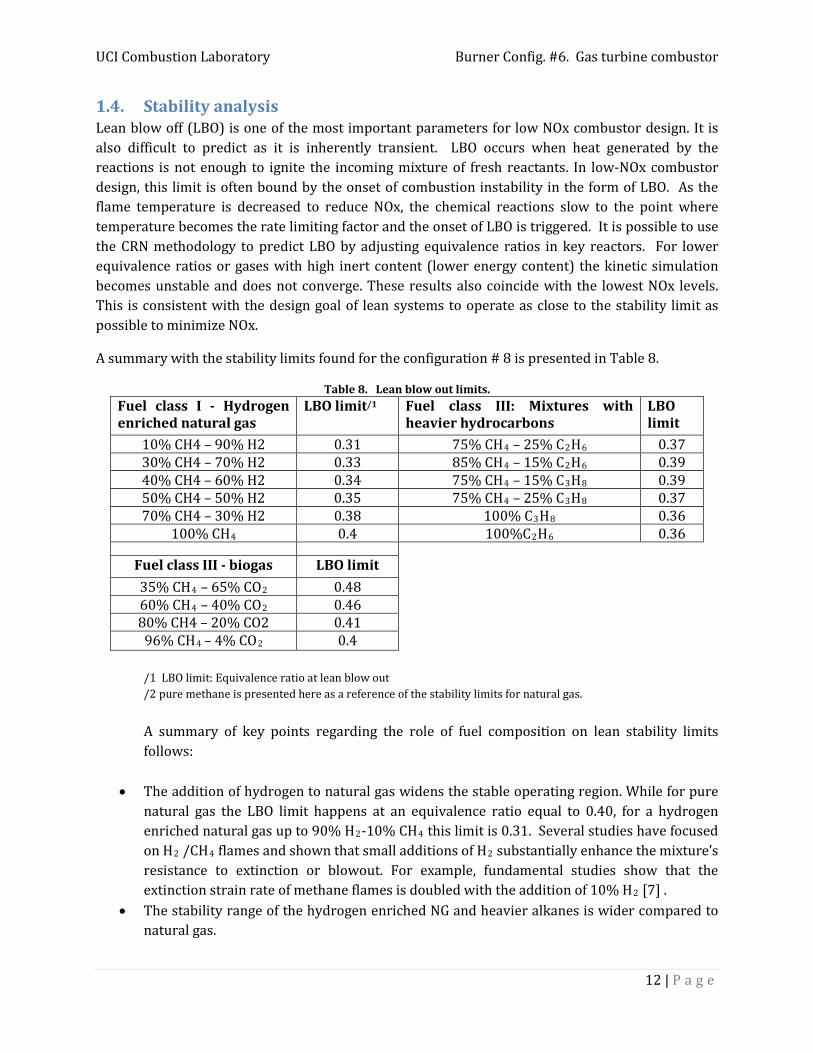
1.4. Stability analysis Lean blow off (LBO) is one of the most important parameters for low NOx combustor design. It is also difficult to predict as it is inherently transient. LBO occurs when heat generated by the reactions is not enough to ignite the incoming mixture of fresh reactants. In low-NOx combustor design, this limit is often bound by the onset of combustion instability in the form of LBO. As the flame temperature is decreased to reduce NOx, the chemical reactions slow to the point where temperature becomes the rate limiting factor and the onset of LBO is triggered. It is possible to use the CRN methodology to predict LBO by adjusting equivalence ratios in key reactors. For lower equivalence ratios or gases with high inert content (lower energy content) the kinetic simulation becomes unstable and does not converge. These results also coincide with the lowest NOx levels. This is consistent with the design goal of lean systems to operate as close to the stability limit as possible to minimize NOx.
A summary with the stability limits found for the configuration # 8 is presented in Table 8.
Table 8. Lean blow out limits. Fuel class I - Hydrogen enriched natural gas
LBO limit/1 Fuel class III: Mixtures with heavier hydrocarbons
LBO limit
10% CH4 – 90% H2 0.31 75% CH4 – 25% C2H6 0.37 30% CH4 – 70% H2 0.33 85% CH4 – 15% C2H6 0.39 40% CH4 – 60% H2 0.34 75% CH4 – 15% C3H8 0.39 50% CH4 – 50% H2 0.35 75% CH4 – 25% C3H8 0.37 70% CH4 – 30% H2 0.38 100% C3H8 0.36
100% CH4 0.4 100%C2H6 0.36
Fuel class III - biogas LBO limit 35% CH4 – 65% CO2 0.48 60% CH4 – 40% CO2 0.46 80% CH4 – 20% CO2 0.41 96% CH4 – 4% CO2 0.4 /1 LBO limit: Equivalence ratio at lean blow out /2 pure methane is presented here as a reference of the stability limits for natural gas. A summary of key points regarding the role of fuel composition on lean stability limits follows:
• The addition of hydrogen to natural gas widens the stable operating region. While for pure natural gas the LBO limit happens at an equivalence ratio equal to 0.40, for a hydrogen enriched natural gas up to 90% H2-10% CH4 this limit is 0.31. Several studies have focused on H2 /CH4 flames and shown that small additions of H2 substantially enhance the mixture’s resistance to extinction or blowout. For example, fundamental studies show that the extinction strain rate of methane flames is doubled with the addition of 10% H2 [7] .
• The stability range of the hydrogen enriched NG and heavier alkanes is wider compared to natural gas.
UCI Combustion Laboratory Burner Config. #6. Gas turbine combustor
13 | P a g e
• The dilution of natural gas with diluents like CO2 or N2 reduces the stability limits. These diluents in the fuel impact the flame stability in at least three ways, through changes in (1) mixture specific heat and adiabatic flame temperature, (2) chemical kinetic rates, and (3) radiative heat transfer. The addition of N2 apparently has straightforward effects, as it is only manifested through the first item above, an influence that can be easily quantified with standard equilibrium calculations.
• The addition of CO2 to NG up to 65 % doesn’t affect significantly the stability of the system. In this case diluting the fuel with CO2 is similar to using a leaner mixture with natural gas. For a biogas up to 65% CO2 the equivalence ratio at blowoff is 0.48. For pure natural gas this limit is 0.40.
• H2O and CO2 additions, however, exert additional subtle effects through the latter two items. As noted by the second point, CO2 and H2O do not act as passive diluents in the fuel but interact kinetically reducing the flame speed of the mixtures with CO2 dilution [7].
• The addition of heavier hydrocarbons to natural gas widens the stability limits.
UCI Combustion Laboratory Burner Config. #6. Gas turbine combustor
A-1 | P a g e
Appendix A: Interchangeability analysis In this section an interchangeability analysis is presented. For the analysis we take into account the Wobbe index and the rule 30. The former regulates the content of other constituents of the natural gas distributed in California.
According to rule 30 the gas shall have a minimum Wobbe Number of 1279 Btu/scf and shall not have a maximum Wobbe Number greater than 1385 Btu/scf. The gas shall meet American Gas Association's Lifting Index, Flashback Index and Yellow Tip Index interchangeability indices for high methane gas relative to a typical composition of gas in the Utility system serving the area.
Acceptable specification ranges are:
AGA Indices Acceptable specification ranges Lifting Index (IL) IL <= 1.06 Flashback Index (IF) IF <= 1.2 Yellow Tip Index (IY) IY >= 0.8
Regarding the fuel composition, rule 30 specifies:
Carbon Dioxide: The gas shall not have total carbon dioxide content in excess of three percent (3%) by volume.
Inerts: The gas shall not contain in excess of four percent (4%) total inerts (the total combined carbon dioxide, nitrogen, oxygen and any other inert compound) by volume.
Since the Wobbe Index is only concerned with matching heat release for a given burner, other indices have been developed to assess the interchangeability of other flame properties such as lifting, yellow tipping, flash back, air supply, incomplete combustion, and burner load [8].
In 1946 the American Gas Association (AGA) carried out extensive experimental research on fuel gas interchangeability [8]. AGA Tests were done on a specially developed partial premixing Bunsen-type burner and focused on establishing criteria for blending “supplemental” or “peaking gases” with base load supplies or adjustment gases; those adjustment gases were the three most historically representative natural gases available in the U.S at that time [5]. Based on this experimental work, AGA developed several empirical indices to address the effects of fuel interchange on Yellow Tipping ( YI ), Flame Lifting ( LI ) and Flash Back ( FI ). The methodology to calculate these indices is presented in the AGA bulletin#36 of 1946 [8]. These indices may not be applicable to the typical complex turbulent premixed flames found in current practical systems. The inaccuracies expected from applying AGA indices to current fuels may be even greater, since current fuels of interest include coal derived syngas, landfill and biomass gases, imported liquefied natural gas (LNG) and hydrogen augmented fuels whose composition is completely different to those natural gases used to set the stability criteria. Nonetheless, these indices were considered as the most advanced methods and effective tools to predict interchangeability in the United States and should be considered as a starting point.
UCI Combustion Laboratory Burner Config. #6. Gas turbine combustor
A-2 | P a g e
Considerations before applying the AGA indices:
• AGA Tests were done on a specially developed partial premixing Bunsen-type burner. The results of these experiments may not be feasible for other kind of systems where the conditions are different to those of the atmospheric burner.
• AGA developed a set of preferable limits for each of the three indices. Those limits establish if a fuel is interchangeable with the adjustment gases under each criterion (flashback, lifting and yellow tipping).
• AGA set the preferable limits for three adjustment natural gases. Thus, the same limits may not be suitable if other adjustment gases are selected as reference fuels.
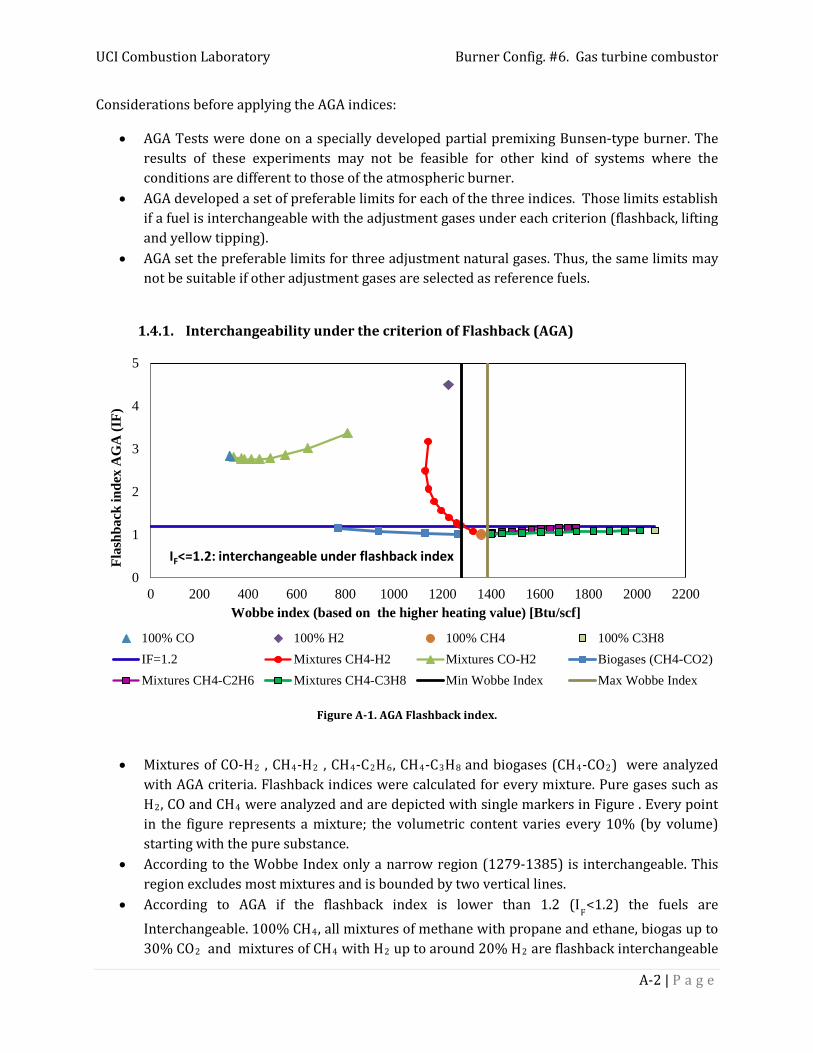
1.4.1. Interchangeability under the criterion of Flashback (AGA)
Figure A-1. AGA Flashback index.
• Mixtures of CO-H2 , CH4-H2 , CH4-C2H6, CH4-C3H8 and biogases (CH4-CO2) were analyzed with AGA criteria. Flashback indices were calculated for every mixture. Pure gases such as H2, CO and CH4 were analyzed and are depicted with single markers in Figure . Every point in the figure represents a mixture; the volumetric content varies every 10% (by volume) starting with the pure substance.
• According to the Wobbe Index only a narrow region (1279-1385) is interchangeable. This region excludes most mixtures and is bounded by two vertical lines.
• According to AGA if the flashback index is lower than 1.2 (IF<1.2) the fuels are Interchangeable. 100% CH4, all mixtures of methane with propane and ethane, biogas up to 30% CO2 and mixtures of CH4 with H2 up to around 20% H2 are flashback interchangeable
0
1
2
3
4
5
0 200 400 600 800 1000 1200 1400 1600 1800 2000 2200
Flas
hbac
k in
dex
AG
A (I
F)
Wobbe index (based on the higher heating value) [Btu/scf]
100% CO 100% H2 100% CH4 100% C3H8IF=1.2 Mixtures CH4-H2 Mixtures CO-H2 Biogases (CH4-CO2)Mixtures CH4-C2H6 Mixtures CH4-C3H8 Min Wobbe Index Max Wobbe Index
IF<=1.2: interchangeable under flashback index
UCI Combustion Laboratory Burner Config. #6. Gas turbine combustor
A-3 | P a g e
with the original adjustment natural gases. Most of these mixtures are outside of the interchangeable region defined with the Wobbe Index.
• Mixtures CH4-H2 with a concentration of H2 higher than 20% are prone to flashback, therefore they are not interchangeable with the adjustment gases. Enrichment of the methane with H2 makes the mixture more prone to flashback; a higher concentration of H2
increases the pool of OH and H radicals that makes the mixture more reactive, this translates into a higher flame speed that entails a higher flashback propensity.
• No mixtures of CO-H2 are feasible to interchange with the adjustment gases. Since all their flashback indices are higher than 1.18; according to the AGA index all these mixtures would experience flashback. Again the higher reactivity of CO and H2, when compared to that of CH4, makes these mixtures more likely to flashback.
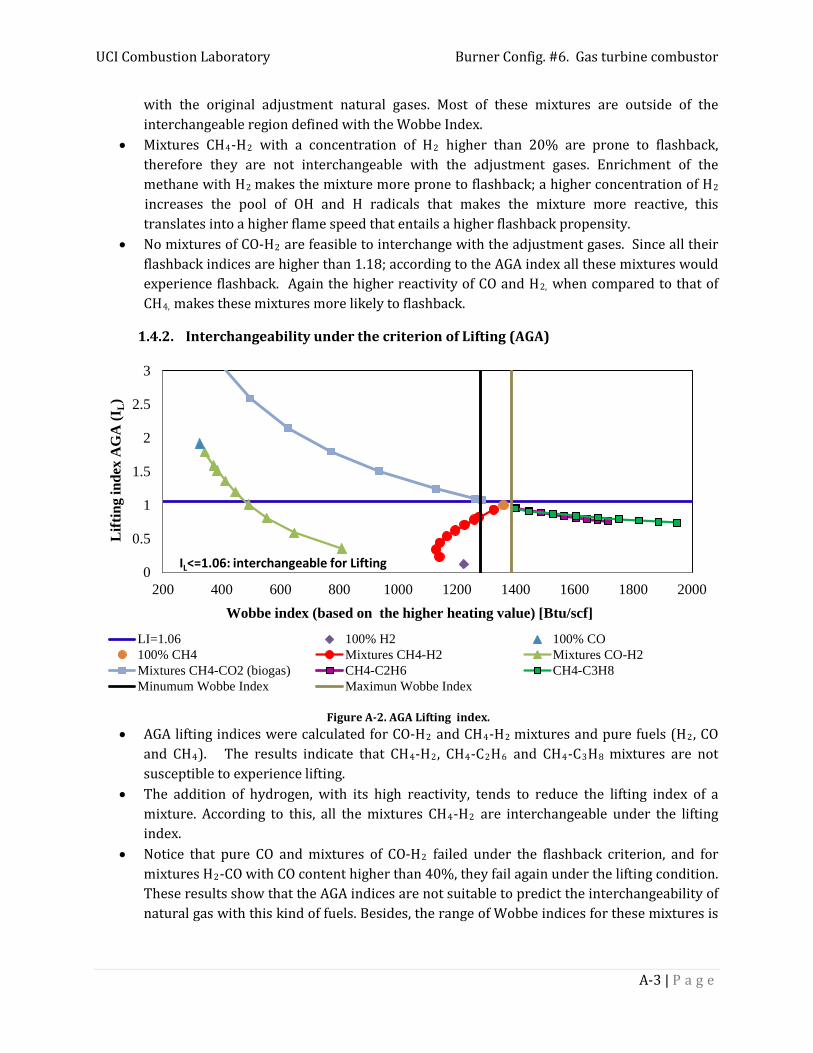
1.4.2. Interchangeability under the criterion of Lifting (AGA)
Figure A-2. AGA Lifting index. • AGA lifting indices were calculated for CO-H2 and CH4-H2 mixtures and pure fuels (H2, CO
and CH4). The results indicate that CH4-H2, CH4-C2H6 and CH4-C3H8 mixtures are not susceptible to experience lifting.
• The addition of hydrogen, with its high reactivity, tends to reduce the lifting index of a mixture. According to this, all the mixtures CH4-H2 are interchangeable under the lifting index.
• Notice that pure CO and mixtures of CO-H2 failed under the flashback criterion, and for mixtures H2-CO with CO content higher than 40%, they fail again under the lifting condition. These results show that the AGA indices are not suitable to predict the interchangeability of natural gas with this kind of fuels. Besides, the range of Wobbe indices for these mixtures is
0
0.5
1
1.5
2
2.5
3
200 400 600 800 1000 1200 1400 1600 1800 2000
Lift
ing
inde
x A
GA
(IL)
Wobbe index (based on the higher heating value) [Btu/scf]
LI=1.06 100% H2 100% CO100% CH4 Mixtures CH4-H2 Mixtures CO-H2Mixtures CH4-CO2 (biogas) CH4-C2H6 CH4-C3H8Minumum Wobbe Index Maximun Wobbe Index
IL<=1.06: interchangeable for Lifting
UCI Combustion Laboratory Burner Config. #6. Gas turbine combustor
A-4 | P a g e
far from the region expected for natural gas. As mentioned before, these indices were intended to predict the interchangeability between natural gasses.
• Most biogas mixtures fall in the non-interchangeable region. Only biogas up to 3% CO2 is interchangeable under the lifting condition.
• Even though all CH4-H2 mixtures are interchangeable under the lifting criterion, only 100% CH4 and mixtures up to 20% H2-80%CH4 were interchangeable under the flashback criterion, therefore only the mixtures that are interchangeable under all the criteria are really interchangeable.
1.4.3. Interchangeability under the criterion of yellow tipping (AGA)
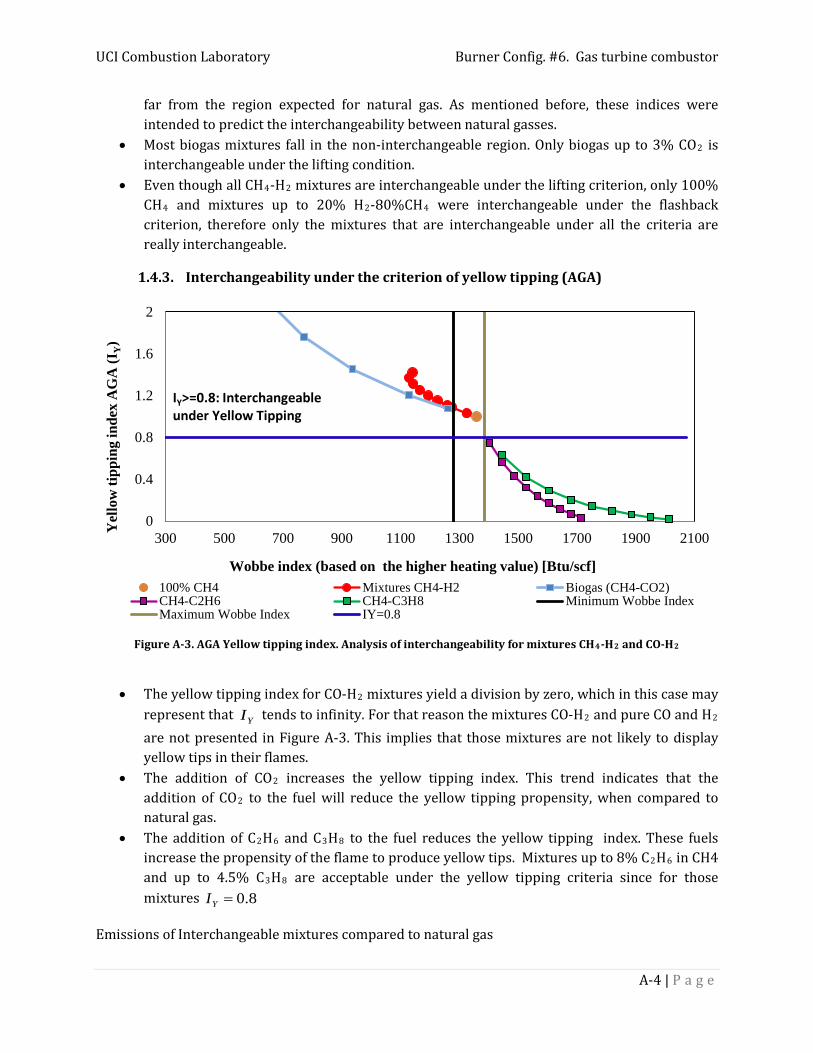
Figure A-3. AGA Yellow tipping index. Analysis of interchangeability for mixtures CH4-H2 and CO-H2
• The yellow tipping index for CO-H2 mixtures yield a division by zero, which in this case may represent that YI tends to infinity. For that reason the mixtures CO-H2 and pure CO and H2 are not presented in Figure A-3. This implies that those mixtures are not likely to display yellow tips in their flames.
• The addition of CO2 increases the yellow tipping index. This trend indicates that the addition of CO2 to the fuel will reduce the yellow tipping propensity, when compared to natural gas.
• The addition of C2H6 and C3H8 to the fuel reduces the yellow tipping index. These fuels increase the propensity of the flame to produce yellow tips. Mixtures up to 8% C2H6 in CH4 and up to 4.5% C3H8 are acceptable under the yellow tipping criteria since for those mixtures 8.0=YI
Emissions of Interchangeable mixtures compared to natural gas
0
0.4
0.8
1.2
1.6
2
300 500 700 900 1100 1300 1500 1700 1900 2100
Yel
low
tipp
ing
inde
x A
GA
(IY)
Wobbe index (based on the higher heating value) [Btu/scf]
100% CH4 Mixtures CH4-H2 Biogas (CH4-CO2)CH4-C2H6 CH4-C3H8 Minimum Wobbe IndexMaximum Wobbe Index IY=0.8
IY>=0.8: Interchangeable under Yellow Tipping
UCI Combustion Laboratory Burner Config. #6. Gas turbine combustor
A-5 | P a g e
The following mixtures are interchangeable with natural gas according to the Wobbe Index and the interchangeability indices for flashback, lifting and yellow tipping established by the American Gas Association (AGA)
Table 9. Summary of emissions for interchangeable mixtures (AGA)
Fuel Mixture
At fixed Air mass flow rate NOx [ppmdv] CO [ppmdv]
76% CH4 - 24% H2 φ=0.49 ↓ 19% ↓ 50%
94% CH4 - 6% C2H6 φ=0.51 ↑ 3% ↑ 3%
95% CH4 - 5% C3H8 φ=0.51 ↑ 3% ↑ 3%
98% CH4 - 2% CO2 φ=0.51 ↓ 3% ~ 0%
Using the CFD to CRN methodology, the NOx and CO emissions for the fuel mixtures presented above were compared to the emissions of pure natural gas.
• A mixture of 76% CH4 and 24% H2 is interchangeable according to the Wobbe Index and the AGA interchangeability indices. The CRN results indicate that the addition of hydrogen to natural gas reduces the concentration of NOx by 19%. For this fuel mixture the production of CO is reduced by 50%.
• The interchangeable mixture of 94% CH4 and 6% C2H6 increases the concentration of NOx
by only 3% and the concentration of CO is increased by 3%. A similar result was found for the fuel mix with 5% C3H8.
• The dilution of natural gas with a small amount of CO2 reduces the oncentration of NOx by 3%. The emissions of CO remain oblivious to the addition of lower concentrations of CO2.
UCI Combustion Laboratory Burner Config. #6. Gas turbine combustor
B-1 | P a g e
Appendix B: NOx pathways There are several routes to form NOx pollutants and these may be broadly catalogued as thermally-generated, flame-generated, or fuel-bound NOx.
1. Thermal NOx -Thermal NOx is formed by oxidation of nitrogen in air and requires sufficient temperature and time to produce NOx. A rule of thumb is that below approximately 1700K, the residence time in typical gas turbine combustors is not long enough to produce significant thermal NOx. Where temperatures higher than 1700K cannot be avoided, it is necessary to limit residence time to control NOx formation, which favors very short combustor designs. Thermal NOx production also increases with the square root of operating pressure, making it more difficult to reduce in higher-pressure aero-derivative gas turbines. The three principal reactions (the extended Zeldovich mechanism) producing thermal NOx are:
N2 + O → NO + N
N + O2 → NO + O
N + OH → NO + H
2. Fuel NOx - Fuels that contain nitrogen (e.g., coal) create “fuel NOx” that results from oxidation of the already-ionized nitrogen contained in the fuel. Crude oils contain 0.1 to 0.2 % nitrogen on a mass basis, but levels as high as 0.5 % are found in some oils. In refining the oil, this nitrogen is concentrated in the residual fractions, that is, in that portion of the oil that is most likely to be burned in large combustion systems such as power plants or industrial boilers rather than used as transportation fuels. Coal typically contains 1.2 to 1.6 % nitrogen [9].
3. Prompt NOx - This third source is attributed to the reaction of atmospheric nitrogen, N2, with radicals such as C, CH, and CH2 fragments derived from fuel, where this cannot be explained by either the aforementioned thermal or fuel processes. Occurring in the earliest stage of combustion, this results in the formation of fixed species of nitrogen such as NH (nitrogen monohydride), HCN (hydrogen cyanide), H2CN (dihydrogen cyanide) and CN- (cyano radical) which can oxidize to NO [13]. In fuels that contain nitrogen, the incidence of prompt NOx is especially minimal and it is generally only of interest for the most exacting emission targets. This other route occurs at low temperatures, fuel rich conditions and short residence times. This mechanism was first identified by C.P Fenimore in 1971 while studying NO formation in fuel–rich hydrocarbon flames. Fenimore concluded that the NO formed early in the flame was the result of the attack of a hydrocarbon free radical on N2 , in particular by:
CH + N2 → HCN + N
UCI Combustion Laboratory Burner Config. #6. Gas turbine combustor
B-2 | P a g e
NO from N2O Under favorable conditions, which are elevated pressures and oxygen-rich conditions, this intermediate mechanism can contribute as much as 90% of the NOx formed during combustion. This makes it particularly important in equipment such as gas turbines and compression-ignition engines. Because these devices are operated at increasingly low temperatures to prevent NOx formation via the thermal NOx mechanism, the relative importance of the N2O-intermediate mechanism is increasing. It has been observed that about 30% of the NOx formed in these systems can be attributed to the N2O- intermediate mechanism [10].
At high pressures NO formation via N2O becomes important. The pressure influence on NO formed from this mechanism is evidenced in the reaction O + N2 + M ↔ N2O + M; with “M” representing a chemically unchanged third body species. Per Le’ Chatelier’s principle, increasing pressure drives Equation 1 to the right, thus enabling NO formation through the subsequent reactions.
O + N2 + M ↔ N2O + M
N2O + H ↔ NO + NH
O + N2O ↔ NO + NO
UCI Combustion Laboratory Burner Config. #6. Gas turbine combustor
43 | P a g e
References
[1] “Chemical-Kinetic Mechanisms for Combustion Applications, San Diego Mechanism web page, Mechanical and Aerospace Engineering (Combustion Research), University of California at San Diego (http://combustion.ucsd.edu).”
[2] A. Colorado and V. McDonell, “Reactor network analysis to assess fuel composition effects on NOx emissions from a recuperated gas turbine,” in Proceedings of ASME Turbo Expo 2014: Turbine Technical Conference and Exposition GT2014. June 16 – 20, 2014.
[3] and Z. Q. Gregory P. Smith, David M. Golden, Michael Frenklach, Nigel W. Moriarty, Boris Eiteneer, Mikhail Goldenberg, C. Thomas Bowman, Ronald K. Hanson, Soonho Song, William C. Gardiner, Jr., Vitali V. Lissianski, “GRI 3.0 mechanism.” .
[4] M. Effinger, J. Mauzey, and V. McDonell, “Characterization and Reduction of Pollutant emissions froma Landfill and Digester Gas Fired Microturbine Generator.,” in Proceedings of GT2005, 2005, pp. 1–7.
[5] I. W. Group, “White Paper on Natural Gas Interchangeability and Non-Combustion End Use NGC + Interchangeability Work Group,” 2005.
[6] R. L. Hack and V. G. McDonell, “Impact of Ethane, Propane, and Diluent Content in Natural Gas on the Performance of a Commercial Microturbine Generator,” J. Eng. Gas Turbines Power, vol. 130, no. 1, p. 011509, 2008.
[7] T. Lieuwen, V. McDonell, E. Petersen, and D. Santavicca, “Fuel Flexibility Influences on Premixed Combustor Blowout, Flashback, Autoignition, and Stability,” J. Eng. Gas Turbines Power, vol. 130, no. 1, p. 011506, 2008.
[8] R. Halchuk-harrington, X. Energy, R. D. Wilson, and K. Energy, “AGA Bulletin# 36 and Weaver Interchangeability methods: Yesterday’s Research and today's Challenges. Gas interchangeability today.,” pp. 1–22.
[9] C. Flagan and J. Seinfeld, Fundamental of air pollution engineering. 1988.
[10] “ANSYS® Fluent, Release 14.0, Help System, NOx Formation, Theory Guide, ANSYS, Inc.,” Ansys Fluent v.14\. .


![CFD INVESTIGATION OF SWIRL-STABILIZED FLEXI-FUEL ...Stirred Reactor) calculations. The CANTERA software [13] has been used for the detailed mechanism simulations and an in-house PSR](https://img.pdfslide.net/doc/110x75/60df711794c244360c50f8f5/cfd-investigation-of-swirl-stabilized-flexi-fuel-stirred-reactor-calculations.jpg)
![Инструкция Yamaha PSR-E453PSR-E453/PSR-EW400 7 + " , . 4 " [ ] ( 5 .) ( 6&- " ), " . $ , . # "](https://img.pdfslide.net/doc/110x75/60dceb7003bf806879693103/f-yamaha-psr-e453-psr-e453psr-ew400-7-4-.jpg)