Embed Size (px)
Citation preview
Energy Research and Policy
Ernest J. Moniz
Cecil and Ida Green Professor
Of Physics and Engineering Systems
Co-Director, Laboratory for Energy and the Environment
May 10, 2006
Perfect Storm of Energy Challenges
• Energy supply and demande.g. projected doubling of energy use and tripling of
electricity use by 2050 in business as usual
• Energy and security e.g. geological and geopolitical realities of oil supply
• Energy and environmente.g. greenhouse gas emissions and climate change
• Future scenarios highly uncertain on mid-century time scale•50-year time scale characteristic of significant change in energy infrastructure, of greenhouse gas concentrations approaching twice pre-industrial,…
• Multiple uncertainties•Resource availability?
-fossil fuels, land for renewables,…•Science and technology advances?
-technology breakthroughs, climate change impacts•Geopolitical considerations?
-Middle East, climate protocol participation,…
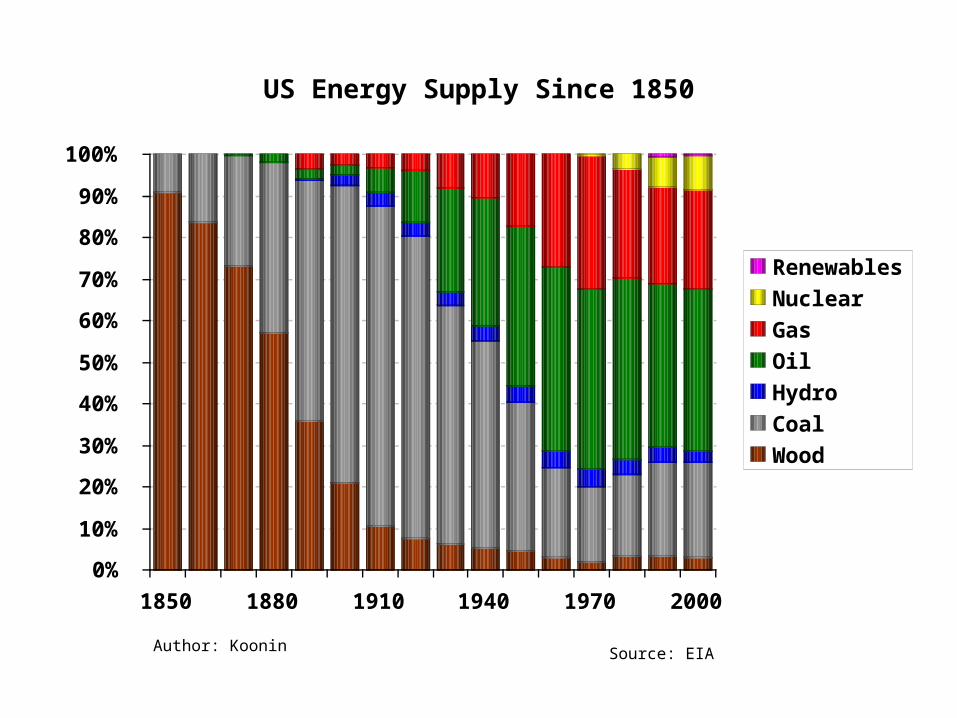
0%
10%
20%
30%
40%
50%
60%
70%
80%
90%
100%
1850 1880 1910 1940 1970 2000
RenewablesNuclearGasOilHydroCoalWood
US Energy Supply Since 1850
Source: EIA Author: Koonin
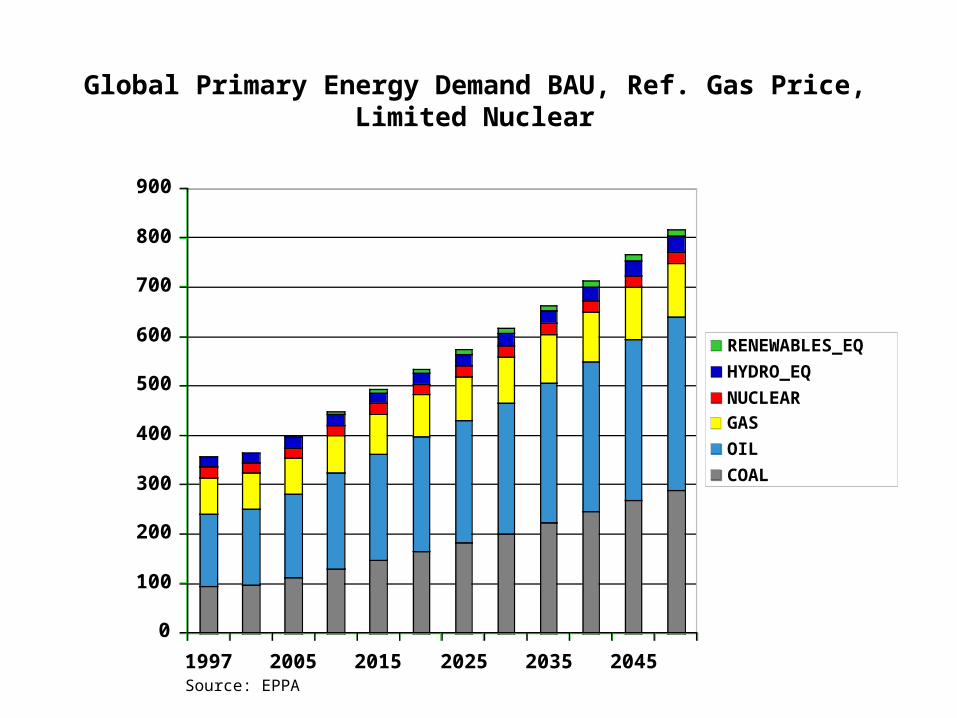
Global Primary Energy Demand BAU, Ref. Gas Price, Limited Nuclear
0
100
200
300
400
500
600
700
800
900
1997 2005 2015 2025 2035 2045
RENEWABLES_EQ
HYDRO_EQ
NUCLEAR
GAS
OIL
COAL
Source: EPPA
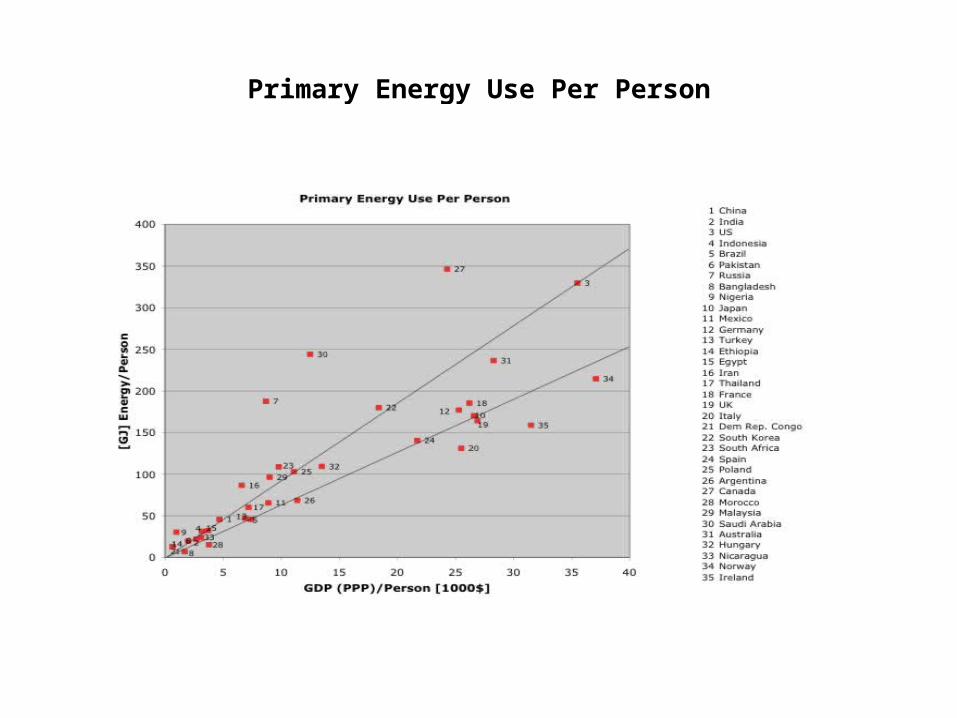
Primary Energy Use Per Person
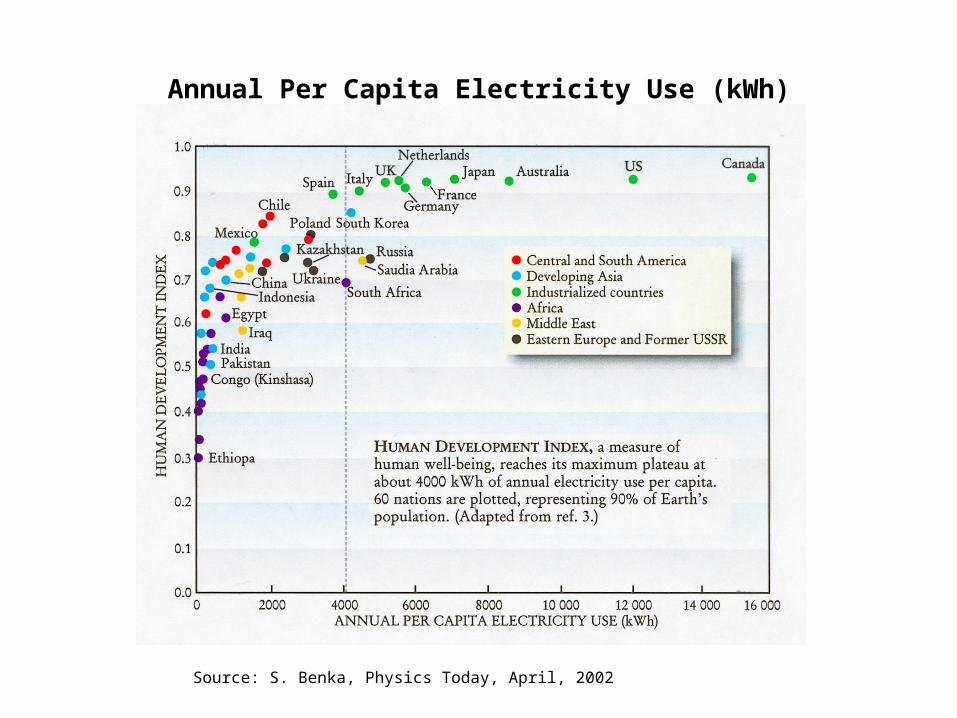
Annual Per Capita Electricity Use (kWh)
Source: S. Benka, Physics Today, April, 2002
Energy and Security
• Oil (and natural gas) adequate and reliable supply
• Vulnerability of extended energy delivery systems • Nuclear weapons proliferation facilitated by worldwide nuclear power expansion
• Dislocation from environmental impacts, such as from climate change
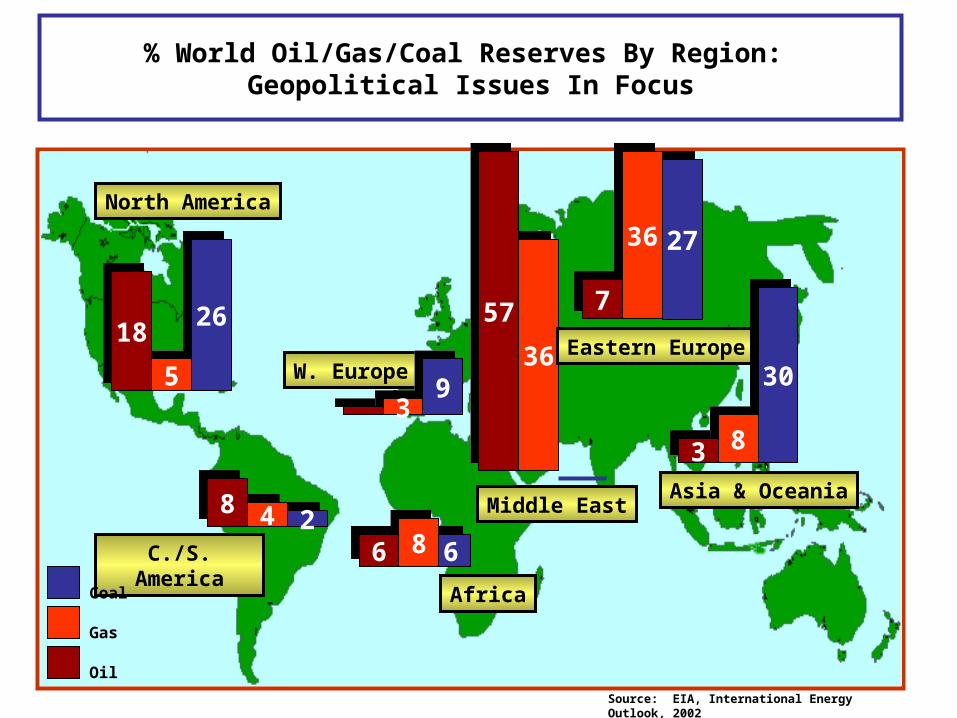
% World Oil/Gas/Coal Reserves By Region: Geopolitical Issues In Focus
C./S. America
Asia & Oceania
3636
Middle East
5757
North America
W. EuropeEastern Europe
Africa
2626
55
1818
224488
668866
9933
27273636
77
3030
8833
Source: EIA, International Energy Outlook, 2002
Oil
Gas
Coal
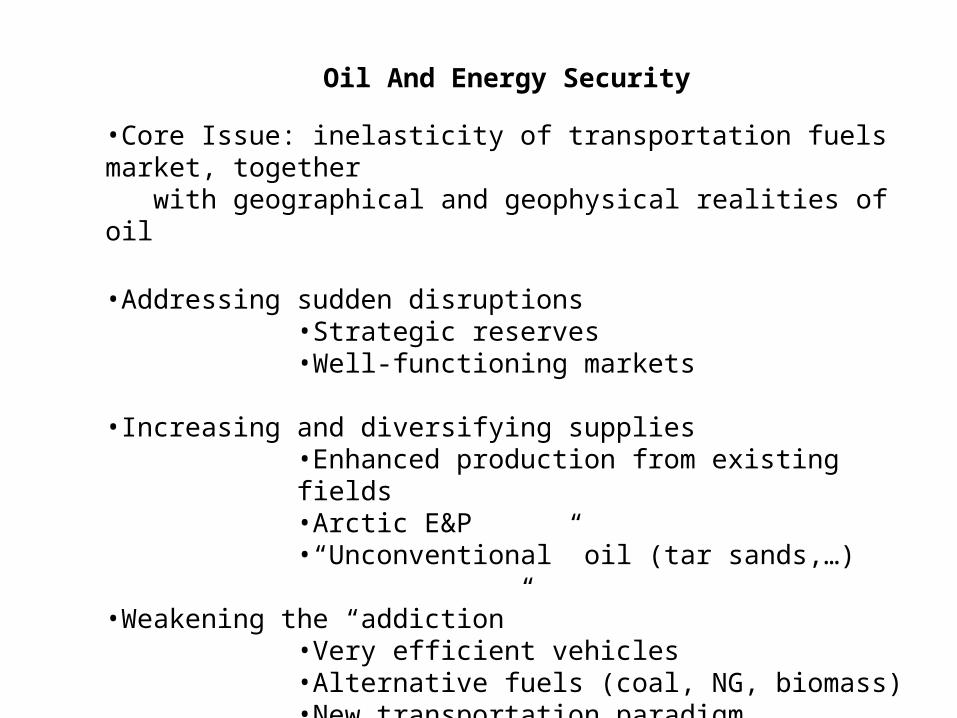
Oil And Energy Security
•Core Issue: inelasticity of transportation fuels market, together with geographical and geophysical realities of oil
•Addressing sudden disruptions •Strategic reserves•Well-functioning markets
•Increasing and diversifying supplies •Enhanced production from existing fields•Arctic E&P•“Unconventional” oil (tar sands,…)
•Weakening the “addiction” •Very efficient vehicles•Alternative fuels (coal, NG, biomass)•New transportation paradigm (electricity as “fuel”? H2?)
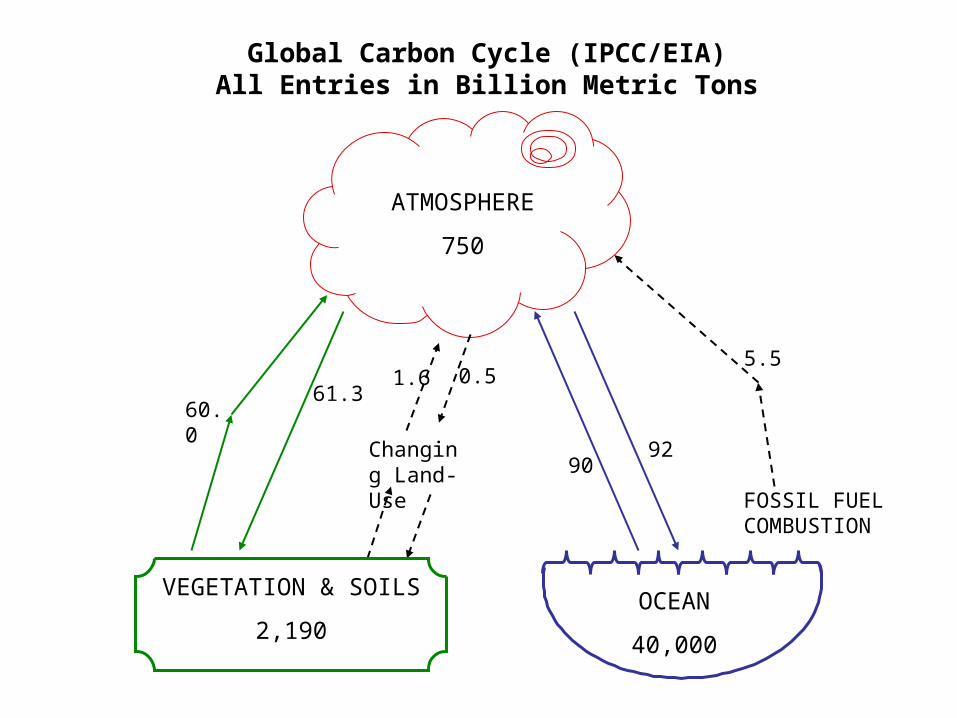
ATMOSPHERE
750
VEGETATION & SOILS
2,190OCEAN
40,000
60.061.3
Changing Land-Use
1.6 0.5
9092
FOSSIL FUEL COMBUSTION
5.5
Global Carbon Cycle (IPCC/EIA) All Entries in Billion Metric Tons
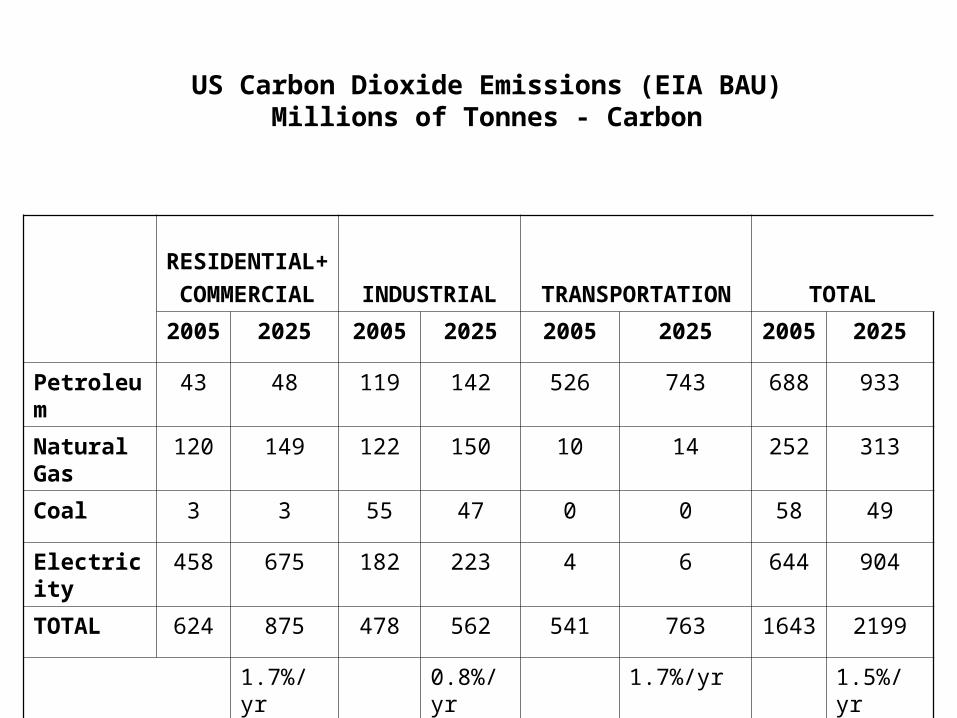
US Carbon Dioxide Emissions (EIA BAU)Millions of Tonnes - Carbon
RESIDENTIAL+
COMMERCIAL INDUSTRIAL TRANSPORTATION TOTAL
2005 2025 2005 2025 2005 2025 2005 2025
Petroleum 43 48 119 142 526 743 688 933
Natural Gas
120 149 122 150 10 14 252 313
Coal 3 3 55 47 0 0 58 49
Electricity 458 675 182 223 4 6 644 904
TOTAL 624 875 478 562 541 763 1643 2199
1.7%/yr 0.8%/yr 1.7%/yr 1.5%/yr
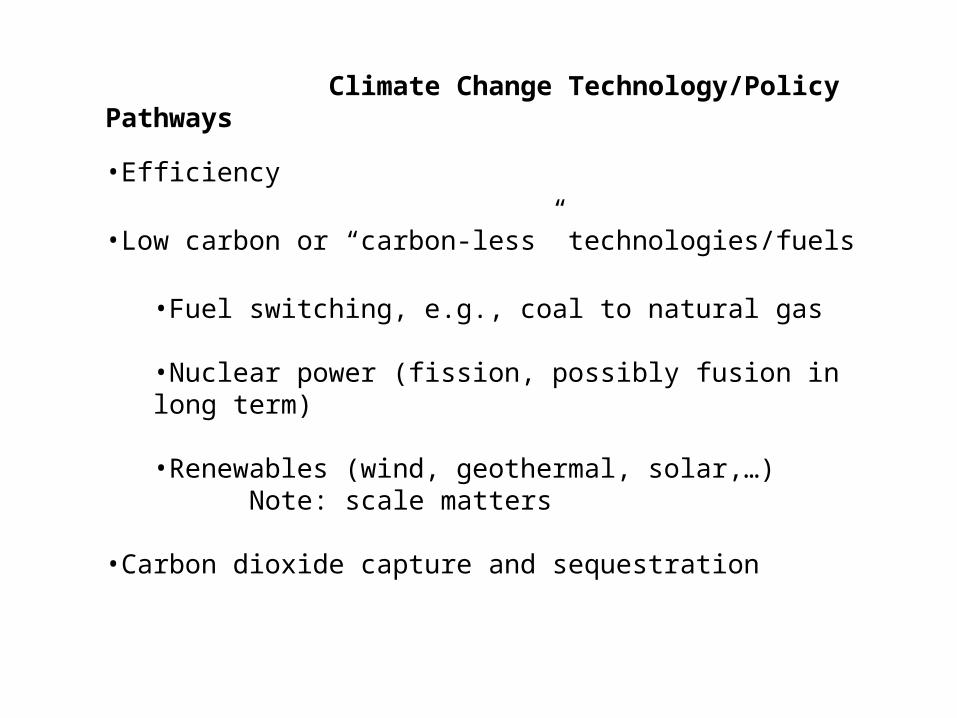
Climate Change Technology/Policy Pathways
•Efficiency
•Low carbon or “carbon-less” technologies/fuels
•Fuel switching, e.g., coal to natural gas
•Nuclear power (fission, possibly fusion in long term)
•Renewables (wind, geothermal, solar,…)Note: scale matters
•Carbon dioxide capture and sequestration
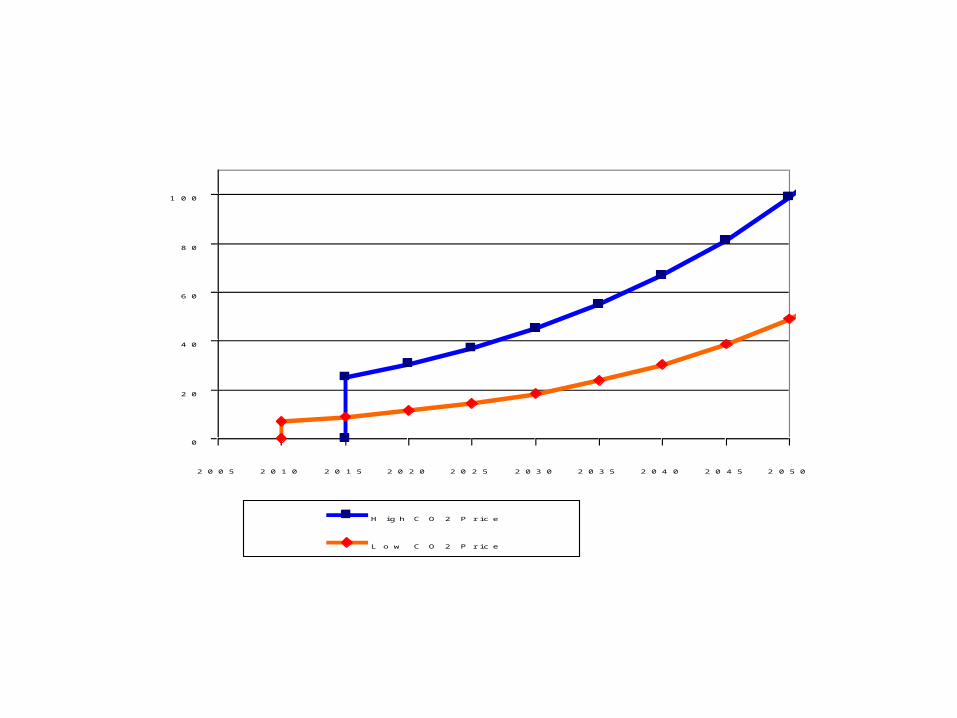
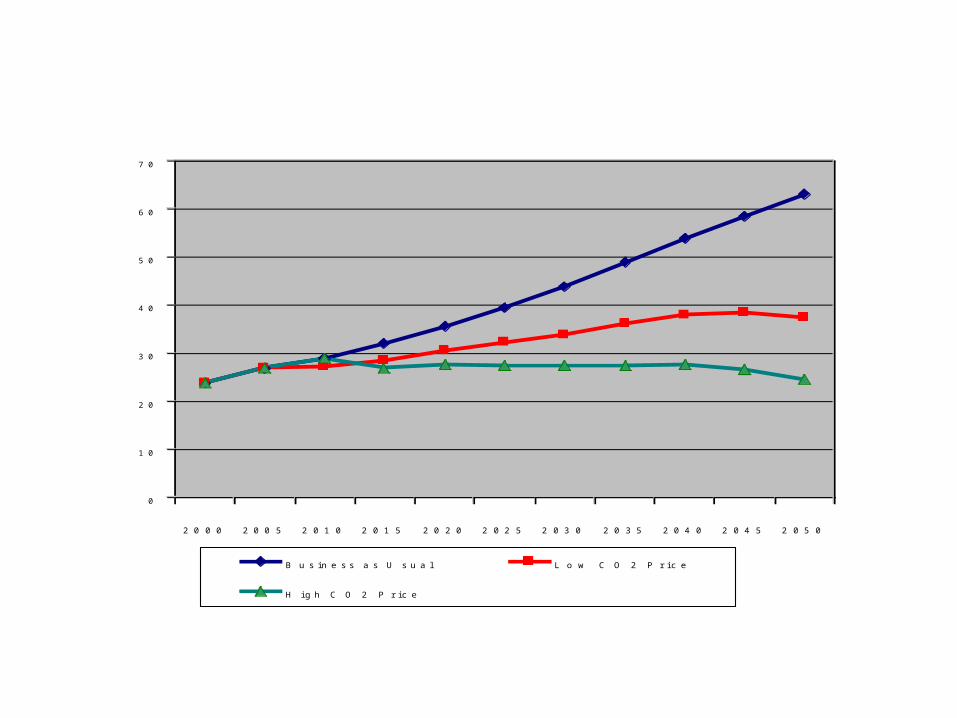
The EPPA model can be used to study how world energy markets would adapt to a carbon policy change. In the EPPA world, a significant (but not exorbitant?) CO2 tax leads to emissions stabilization by mid-century. However, the time to stabilization and the scale of emissions are quite dependent on the “tax profile.”
0
2 0
4 0
6 0
8 0
1 0 0
2 0 0 5 2 0 1 0 2 0 1 5 2 0 2 0 2 0 2 5 2 0 3 0 2 0 3 5 2 0 4 0 2 0 4 5 2 0 5 0
CO2 Price ($/t)
H i g h C O 2 P r i c e
L o w C O 2 P r i c e
0
1 0
2 0
3 0
4 0
5 0
6 0
7 0
2 0 0 0 2 0 0 5 2 0 1 0 2 0 1 5 2 0 2 0 2 0 2 5 2 0 3 0 2 0 3 5 2 0 4 0 2 0 4 5 2 0 5 0
Global CO2 Emissions (Gt/year)
B u s i n e s s a s U s u a l L o w C O 2 P r i c e
H i g h C O 2 P r i c e
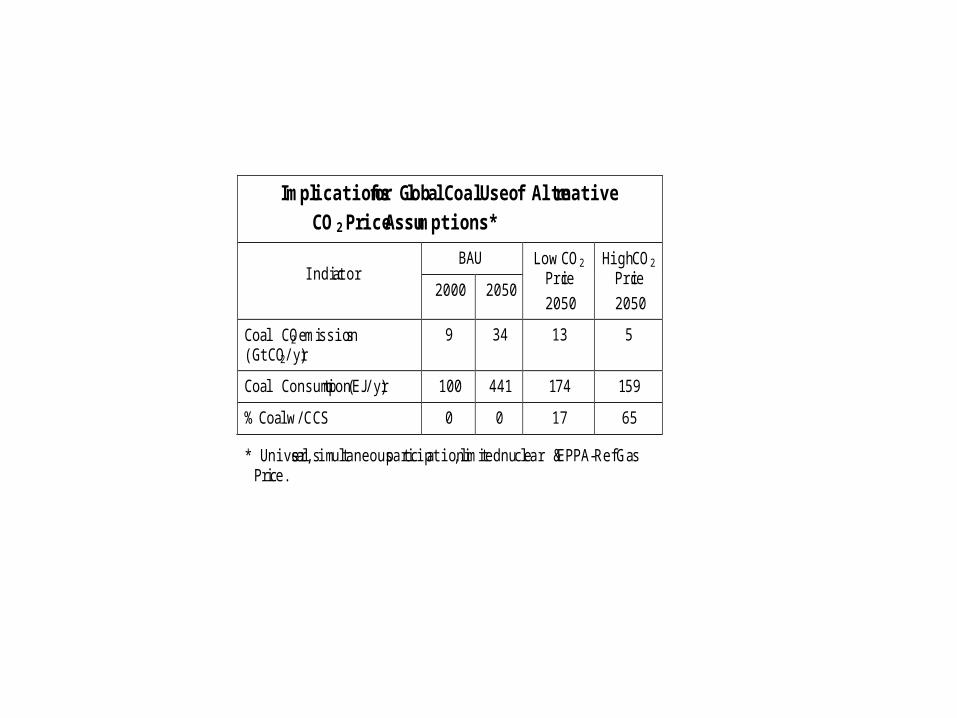
Implications for Global Coal Use of Alternative
CO2 Price Assumptions*
BAU Indicator
2000 2050
Low CO2 Price
2050
High CO2 Price
2050
Coal CO2 emissions (GtCO2/yr)
9 34 13 5
Coal Consumption (EJ/yr) 100 441 174 159
% Coal w/ CCS 0 0 17 65
* Universal, simultaneous participation, limited nuclear & EPPA-Ref Gas Price.
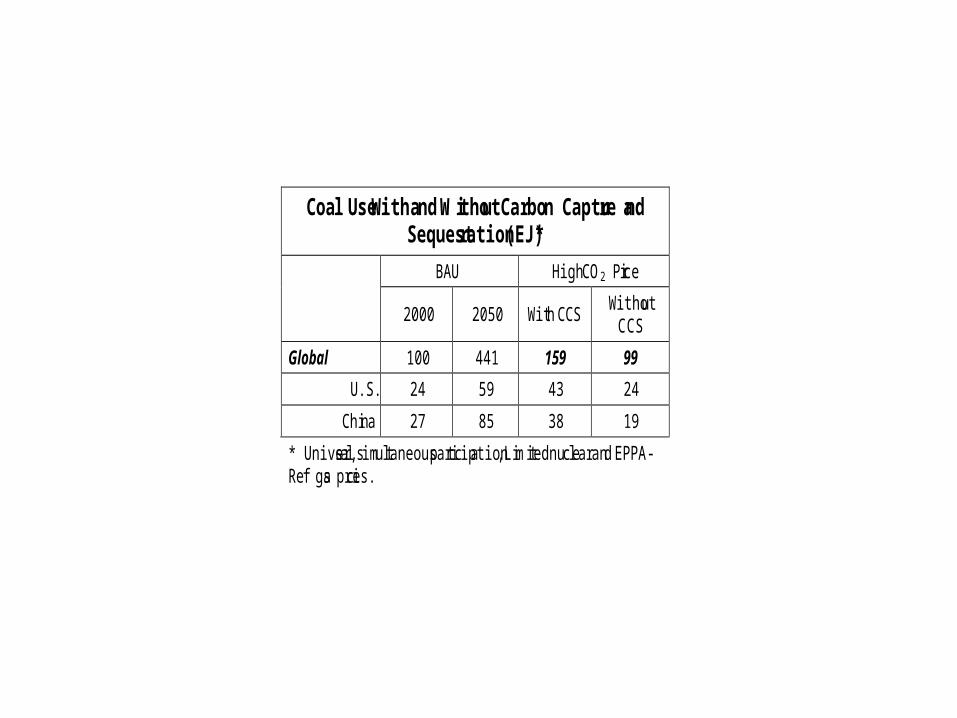
Coal Use With and Without Carbon Capture and Sequestration (EJ)*
BAU High CO2 Price
2000 2050 With CCS
Without CCS
Global 100 441 159 99
U.S. 24 59 43 24
China 27 85 38 19
* Universal, simultaneous participation, Limited nuclear and EPPA-Ref gas prices.
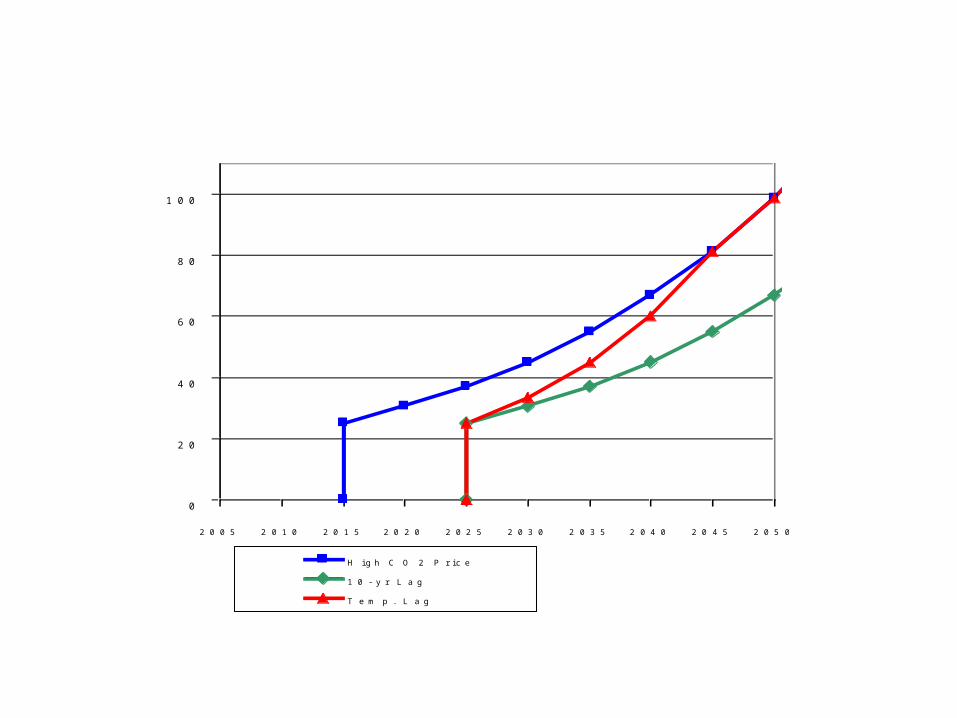
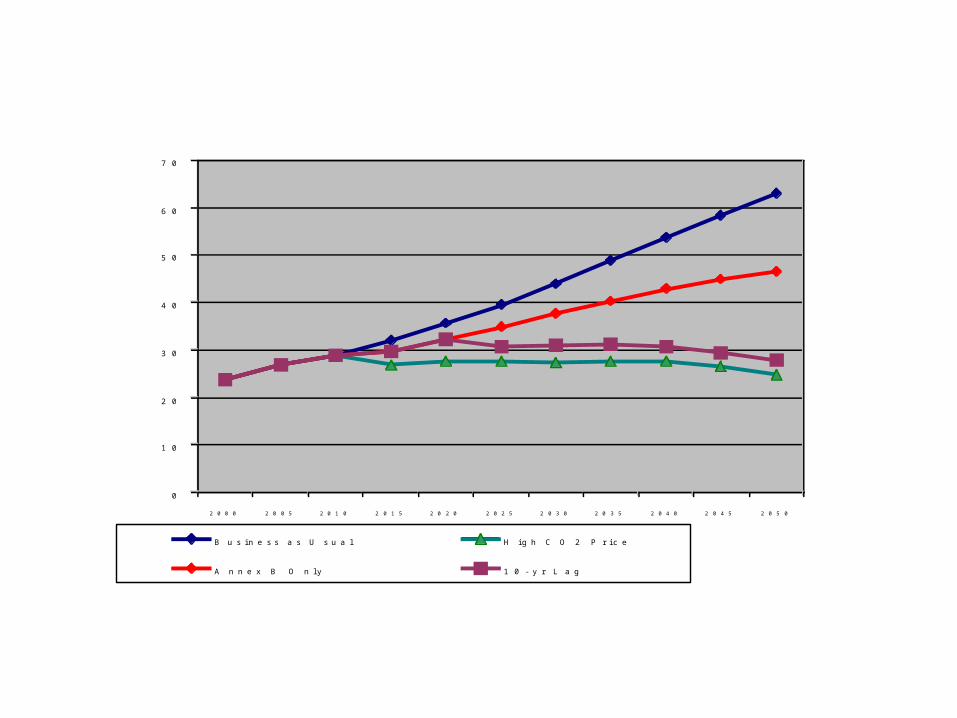
•If developing economies do not adopt a carbon charge, emissions cannot be stabilized by mid-century.
•If developing economies adopt a carbon charge but lag behind developed economies in doing so, stabilization of emissions is possible, although achieved later and at a higher level.
•For example, a 10 year lag increases cumulative emissions to mid-century by less than 10%.
0
2 0
4 0
6 0
8 0
1 0 0
2 0 0 5 2 0 1 0 2 0 1 5 2 0 2 0 2 0 2 5 2 0 3 0 2 0 3 5 2 0 4 0 2 0 4 5 2 0 5 0
CO2 Price ($/t)
H i g h C O 2 P r i c e
1 0 - y r L a g
T e m p . L a g
0
1 0
2 0
3 0
4 0
5 0
6 0
7 0
2 0 0 0 2 0 0 5 2 0 1 0 2 0 1 5 2 0 2 0 2 0 2 5 2 0 3 0 2 0 3 5 2 0 4 0 2 0 4 5 2 0 5 0
Global CO2 Emissions (Gt/year)
B u s i n e s s a s U s u a l H i g h C O 2 P r i c e
A n n e x B O n l y 1 0 - y r L a g
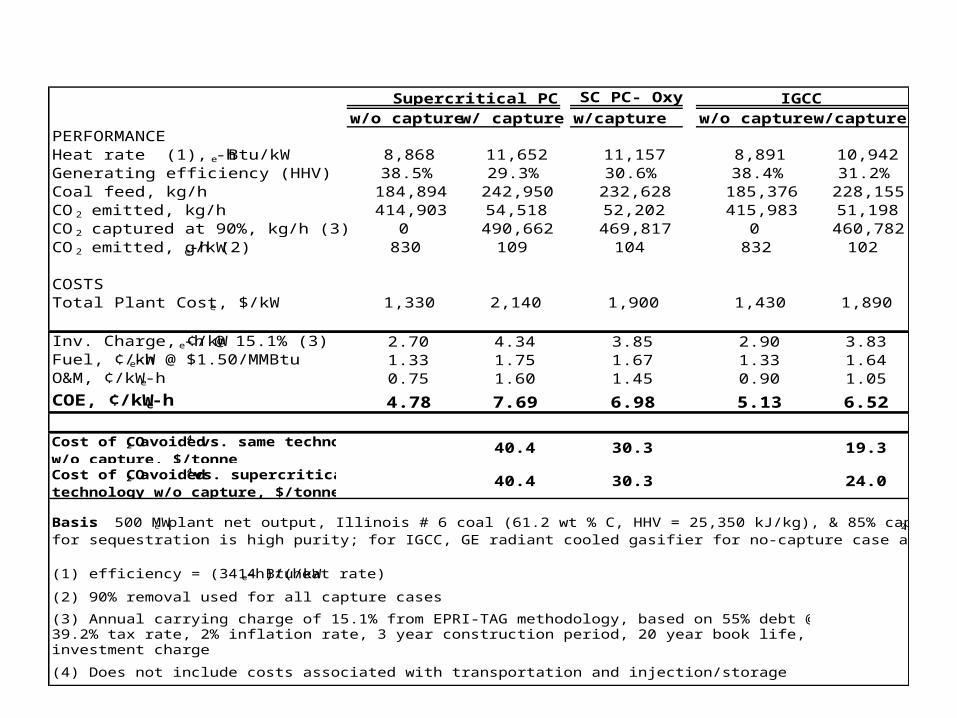
SC PC- Oxy
w/o capture w/ capture w/capture w/o capture w/capturePERFORMANCEHeat rate (1), Btu/kWe-h 8,868 11,652 11,157 8,891 10,942Generating efficiency (HHV) 38.5% 29.3% 30.6% 38.4% 31.2%Coal feed, kg/h 184,894 242,950 232,628 185,376 228,155CO2 emitted, kg/h 414,903 54,518 52,202 415,983 51,198CO2 captured at 90%, kg/h (3) 0 490,662 469,817 0 460,782CO2 emitted, g/kWe-h (2) 830 109 104 832 102
COSTSTotal Plant Cost, $/kWe 1,330 2,140 1,900 1,430 1,890
Inv. Charge, ¢/kWe-h @ 15.1% (3) 2.70 4.34 3.85 2.90 3.83Fuel, ¢/kWe-h @ $1.50/MMBtu 1.33 1.75 1.67 1.33 1.64O&M, ¢/kWe-h 0.75 1.60 1.45 0.90 1.05
COE, ¢/kWe-h 4.78 7.69 6.98 5.13 6.52
Cost of CO2 avoided4 vs. same technology w/o capture, $/tonne
40.4 30.3 19.3
Cost of CO2 avoided4 vs. supercritical technology w/o capture, $/tonne
40.4 30.3 24.0
Basis: 500 MWe plant net output, Illinois # 6 coal (61.2 wt % C, HHV = 25,350 kJ/kg), & 85% capacity factor; for oxy-fuel SC PC CO2
for sequestration is high purity; for IGCC, GE radiant cooled gasifier for no-capture case and GE full-quench gasifier for capture case.
(2) 90% removal used for all capture cases
(4) Does not include costs associated with transportation and injection/storage
(3) Annual carrying charge of 15.1% from EPRI-TAG methodology, based on 55% debt @ 6.5%, 45% equity @ 11.5%, 39.2% tax rate, 2% inflation rate, 3 year construction period, 20 year book life, applied to total plant cost to calculate investment charge
IGCC
(1) efficiency = (3414 Btu/kWe-h)/(heat rate)
Supercritical PC
Science and Technology for a Clean Energy Future
•Renewable technologies (wind, solar, geothermal, waves, biofuels)
•Electrochemical energy storage and conversion
•Core enabling science and technology (superconducting and cryogenic components, nanotechnology and materials, transport phenomena,…)
• Nuclear fusion
Improving Today’s Energy Systems
•Advanced nuclear reactors and fuel cycles that address cost, safety, waste, and nonproliferation objectives•Affordable supply of fossil-derived fuels (oil, natural gas, coal) from both conventional and unconventional sources and processes•Key enablers such as carbon sequestration•Thermal conversion and utilization for dramatically enhanced energy efficiency, including in industrial uses•Enhanced reliability, robustness and resiliency of energy delivery networks•System integration in energy supply, delivery, and use•Learning from the past and understanding current public attitudes towards energy systems•Understanding and facilitating the energy technology innovation process•In-depth integrative energy and technology policy studies that draw on faculty across the campus
Energy Systems For a Rapidly Evolving World
•Science and policy of climate change
•Advanced efficient building technologies
•Advanced transportation systems, from novel technologies and new fuels, to systems design including passenger and freight networks
•“Giga-city” design and development, particularly in the developing world