Embed Size (px)
Citation preview
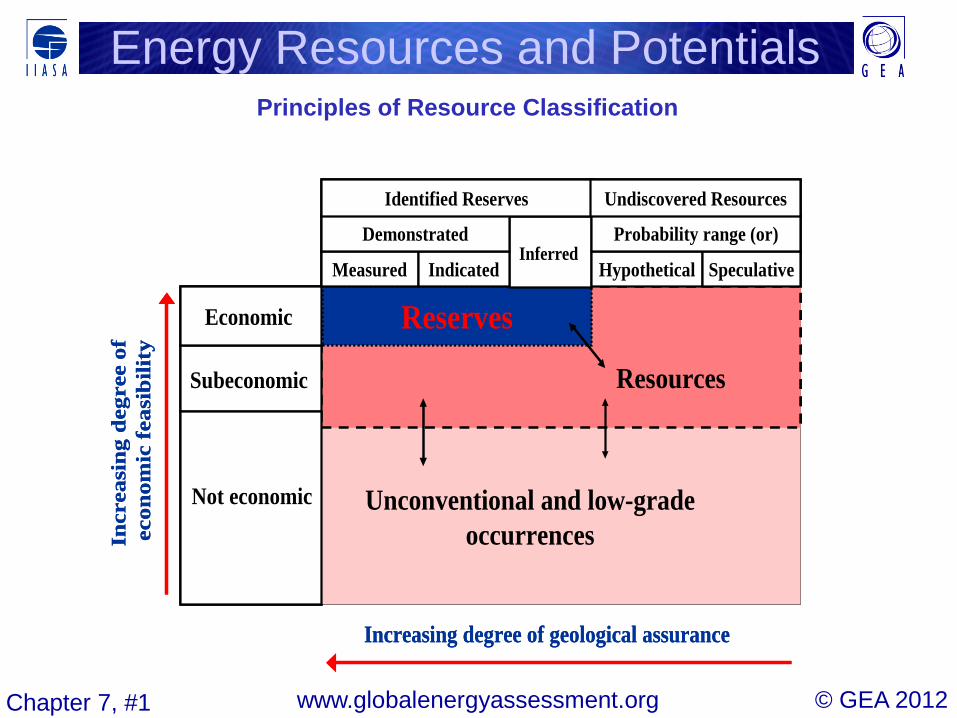
© GEA 2012 www.globalenergyassessment.org Chapter 7, #1
Principles of Resource Classification
Energy Resources and Potentials
Increasing degree of geological assurance
Incr
easi
ng d
egre
eof
econ
omic
fea
sibi
lity
Subeconomic
Economic
Not economic
Reserves
Resources
Unconventional and low-gradeoccurrences
InferredMeasured Indicated
Demonstrated
Identified Reserves
Hypothetical Speculative
Probability range (or)
Undiscovered Resources
Subeconomic
Economic
Not economic
Reserves
Resources
Unconventional and low-gradeoccurrences
InferredMeasured Indicated
Demonstrated
Identified Reserves
Hypothetical Speculative
Probability range (or)
Undiscovered Resources
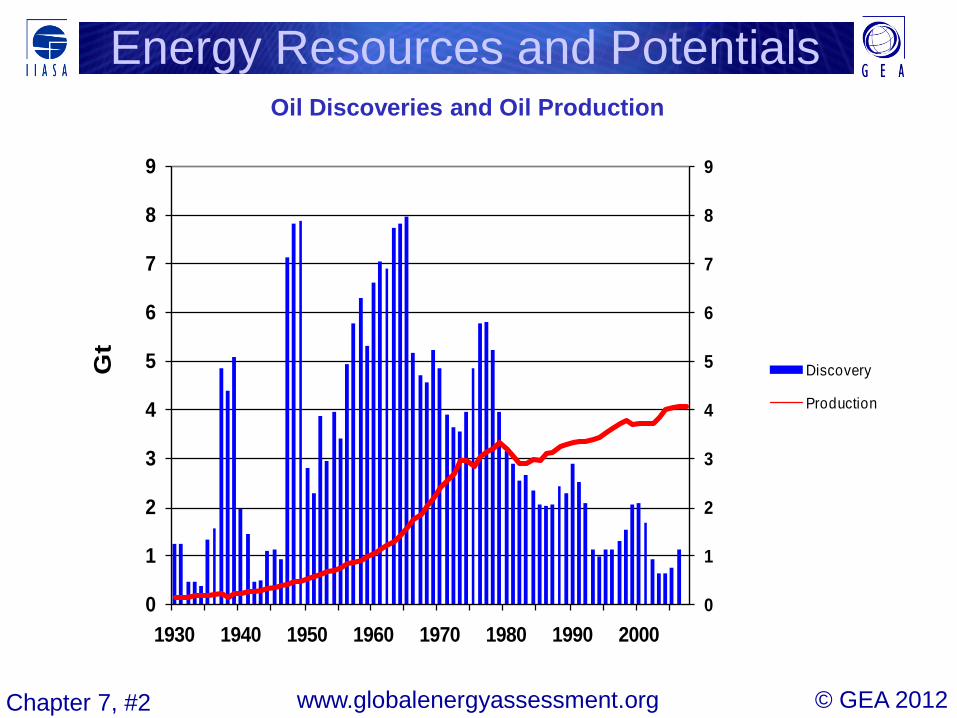
© GEA 2012 www.globalenergyassessment.org Chapter 7, #2
Oil Discoveries and Oil Production
Energy Resources and Potentials
0
1
2
3
4
5
6
7
8
9
0
1
2
3
4
5
6
7
8
9
1930 1940 1950 1960 1970 1980 1990 2000
Gt
Discovery
Production
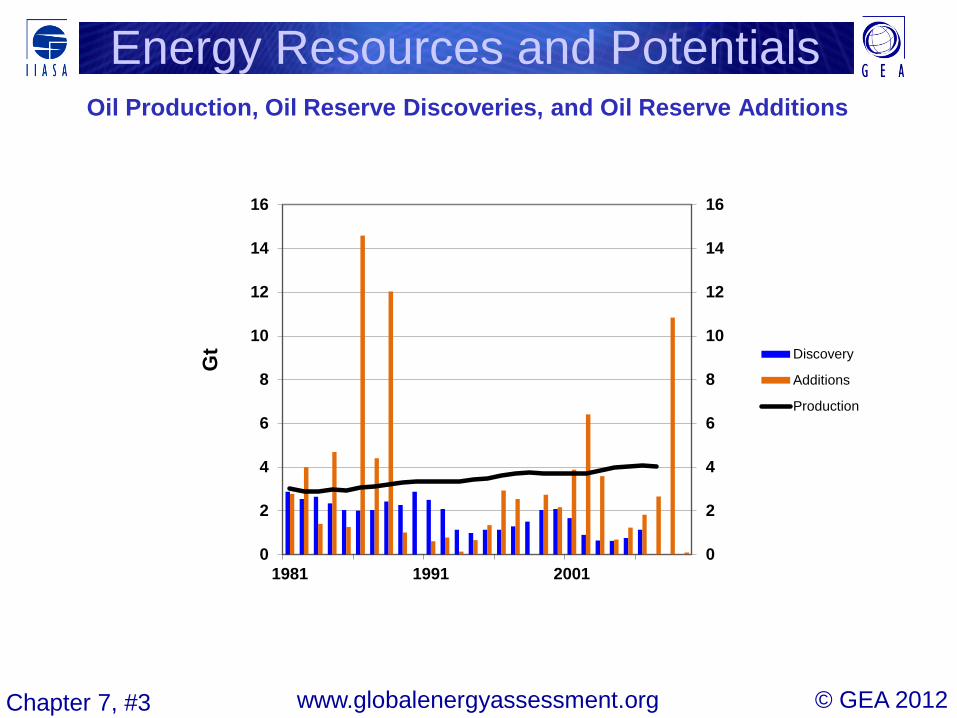
© GEA 2012 www.globalenergyassessment.org Chapter 7, #3
Oil Production, Oil Reserve Discoveries, and Oil Reserve Additions
Energy Resources and Potentials
0
2
4
6
8
10
12
14
16
0
2
4
6
8
10
12
14
16
1981 1991 2001
Gt Discovery
Additions
Production
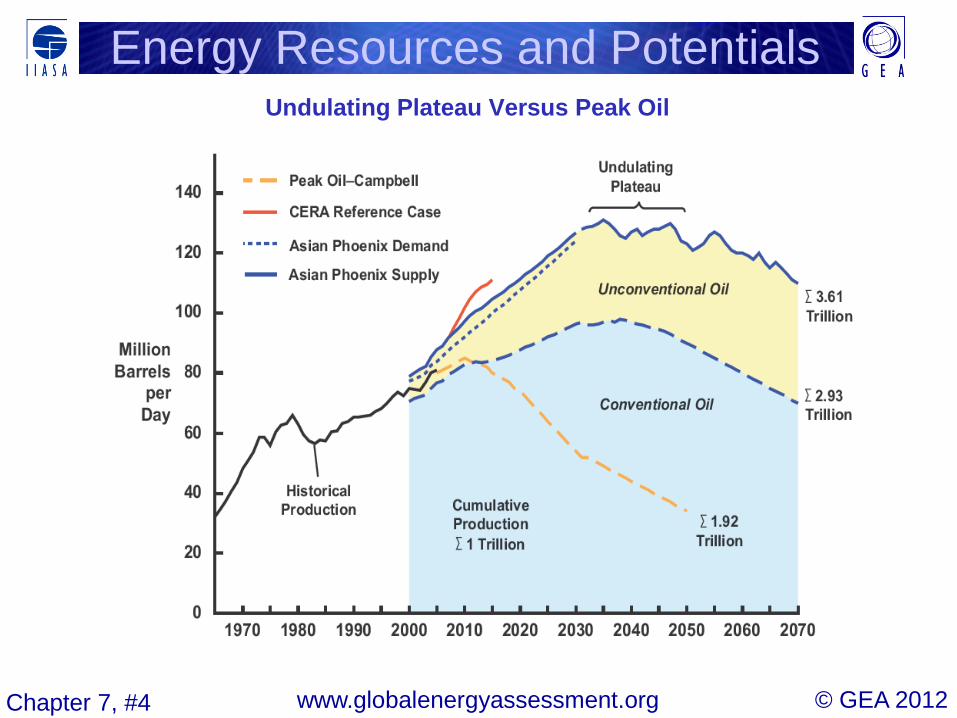
© GEA 2012 www.globalenergyassessment.org Chapter 7, #4
Undulating Plateau Versus Peak Oil
Energy Resources and Potentials
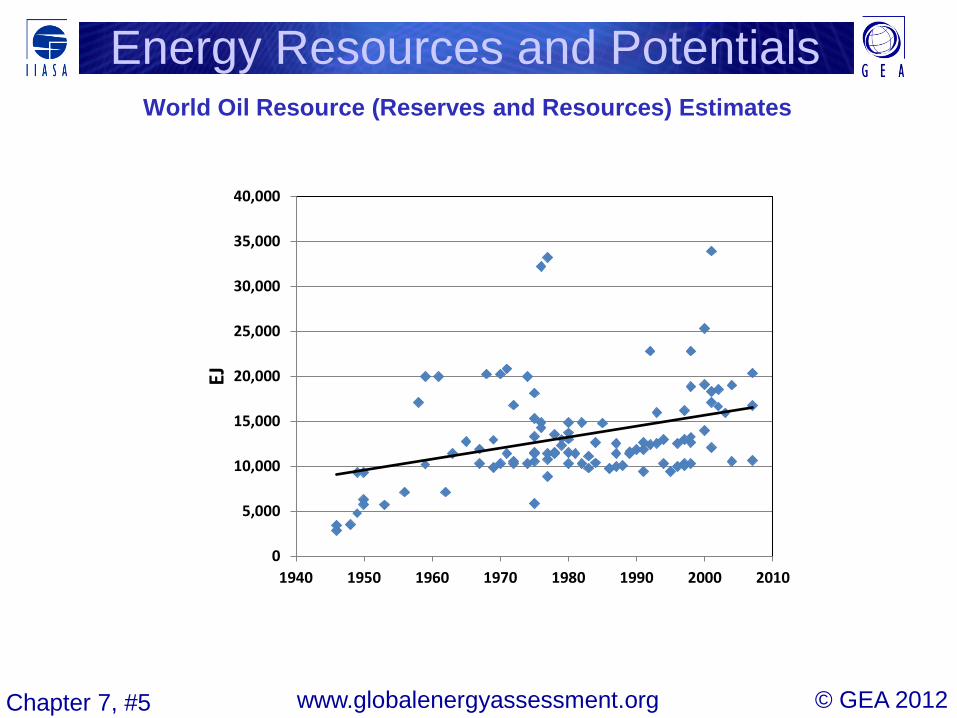
© GEA 2012 www.globalenergyassessment.org Chapter 7, #5
World Oil Resource (Reserves and Resources) Estimates
Energy Resources and Potentials
0
5,000
10,000
15,000
20,000
25,000
30,000
35,000
40,000
1940 1950 1960 1970 1980 1990 2000 2010
EJ
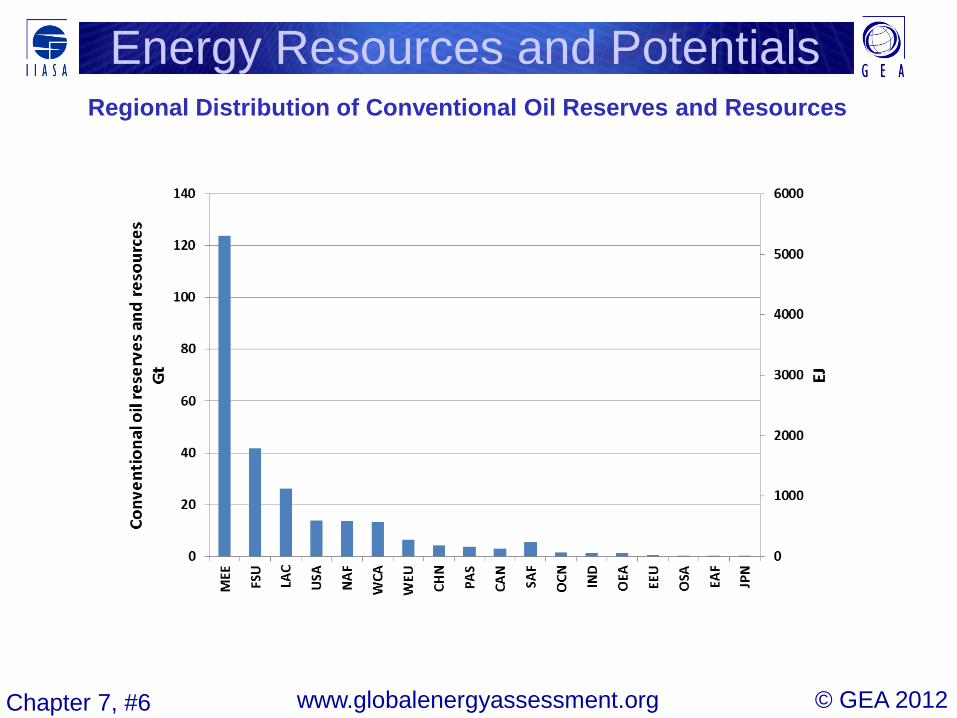
© GEA 2012 www.globalenergyassessment.org Chapter 7, #6
Regional Distribution of Conventional Oil Reserves and Resources
Energy Resources and Potentials
© GEA 2012 www.globalenergyassessment.org Chapter 7, #7
Energy Resources and Potentials
© GEA 2012 www.globalenergyassessment.org Chapter 7, #8
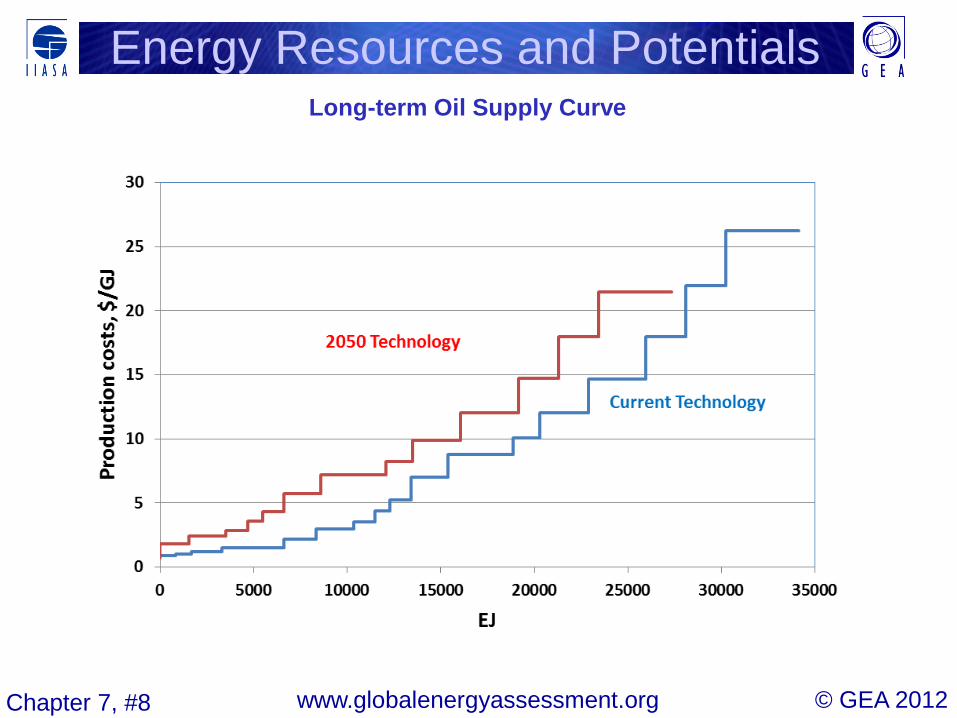
Long-term Oil Supply Curve
Energy Resources and Potentials
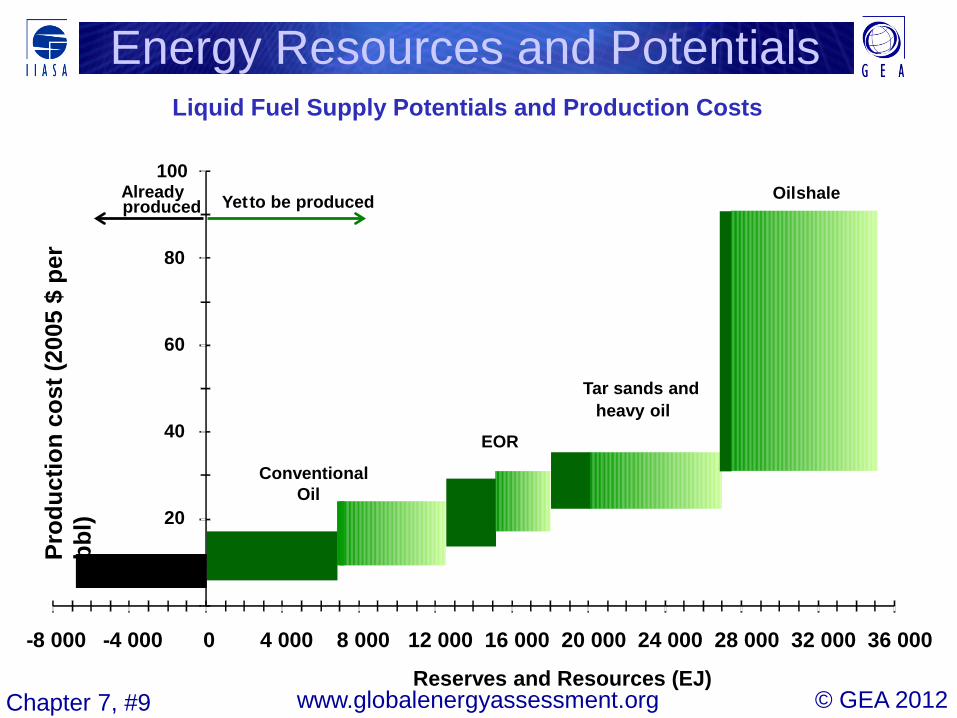
© GEA 2012 www.globalenergyassessment.org Chapter 7, #9
Liquid Fuel Supply Potentials and Production Costs
Energy Resources and Potentials
20
60
40
80
100
- 8 000 - 4 000 0 4 000 8 000 12 000 16 000 20 000 24 000 28 000 32 000 36 000
Prod
uctio
n co
st (2
005
$ pe
r bb
l)
Reserves and Resources (EJ)
Conventional Oil
EOR
Tar sands and heavy oil
Oil shale Yet to be produced Already produced
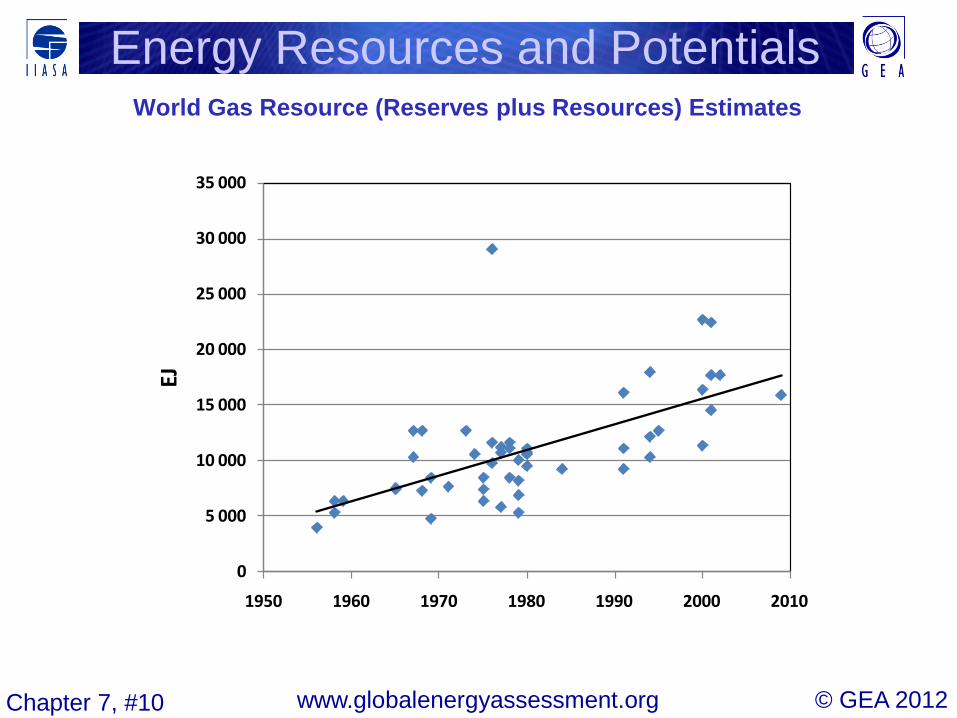
© GEA 2012 www.globalenergyassessment.org Chapter 7, #10
World Gas Resource (Reserves plus Resources) Estimates
Energy Resources and Potentials
0
5 000
10 000
15 000
20 000
25 000
30 000
35 000
1950 1960 1970 1980 1990 2000 2010
EJ
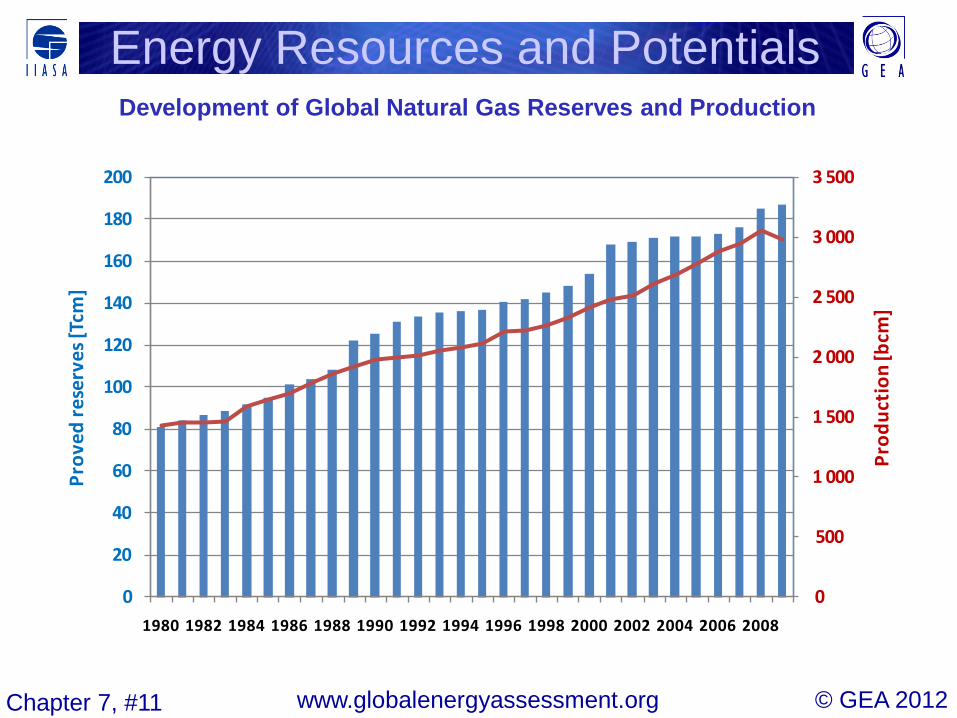
© GEA 2012 www.globalenergyassessment.org Chapter 7, #11
Development of Global Natural Gas Reserves and Production
Energy Resources and Potentials
0
500
1 000
1 500
2 000
2 500
3 000
3 500
0
20
40
60
80
100
120
140
160
180
200
1980 1982 1984 1986 1988 1990 1992 1994 1996 1998 2000 2002 2004 2006 2008
Prod
uctio
n [b
cm]
Prov
ed re
serv
es [T
cm]
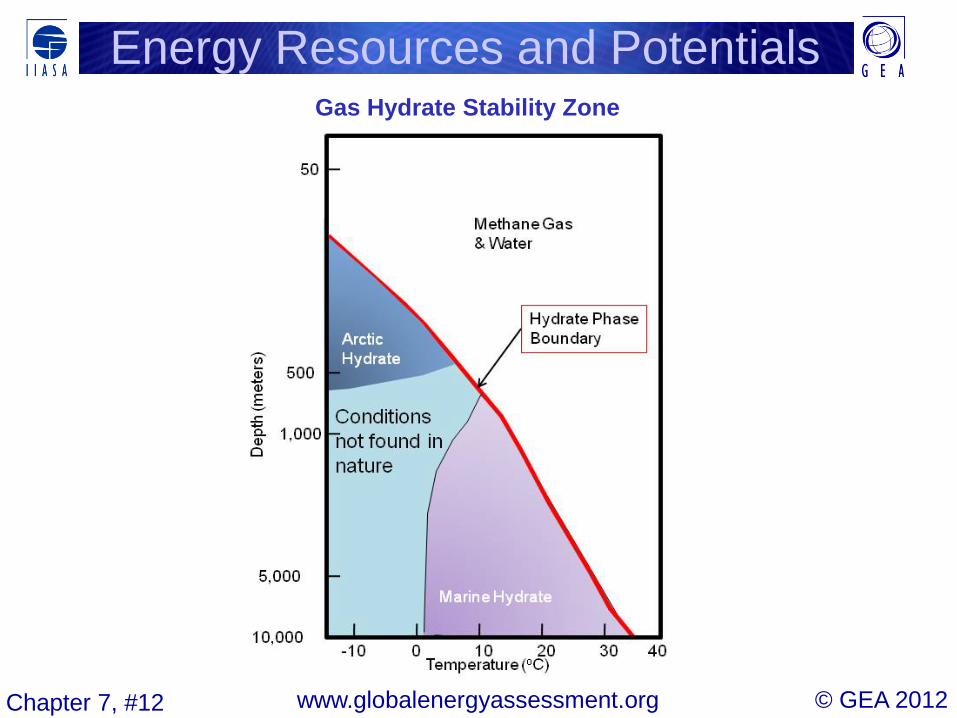
© GEA 2012 www.globalenergyassessment.org Chapter 7, #12
Gas Hydrate Stability Zone
Energy Resources and Potentials
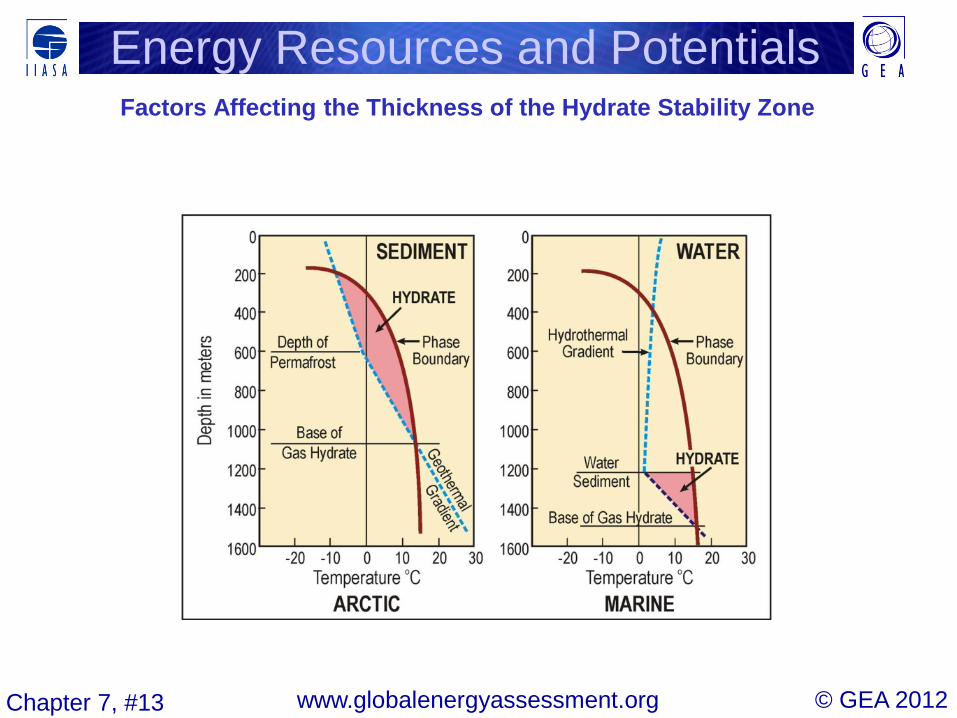
© GEA 2012 www.globalenergyassessment.org Chapter 7, #13
Factors Affecting the Thickness of the Hydrate Stability Zone
Energy Resources and Potentials
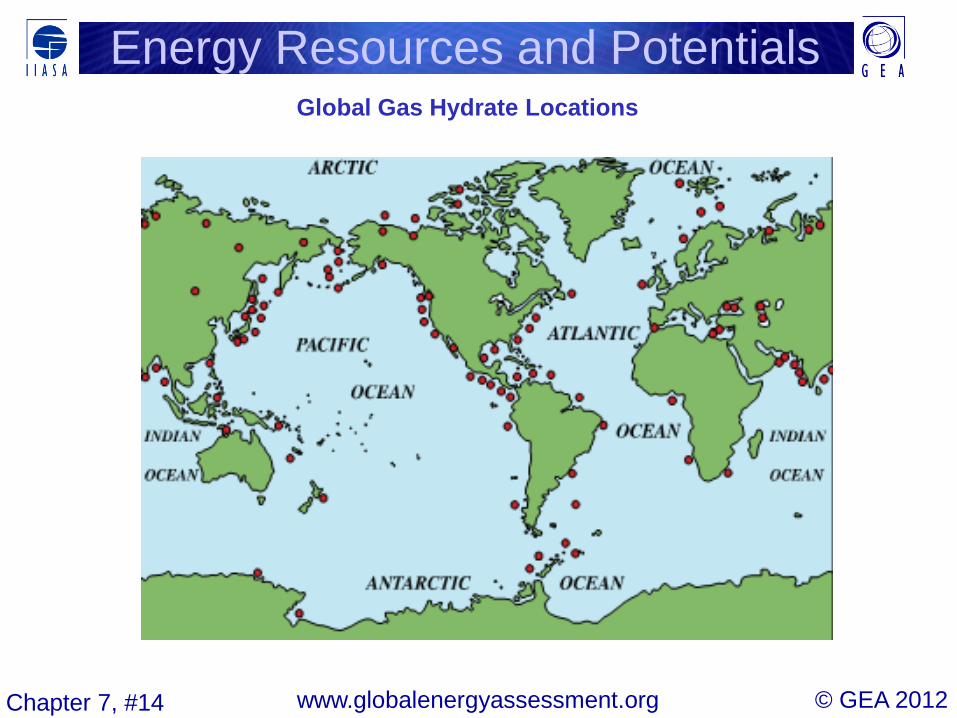
© GEA 2012 www.globalenergyassessment.org Chapter 7, #14
Global Gas Hydrate Locations
Energy Resources and Potentials
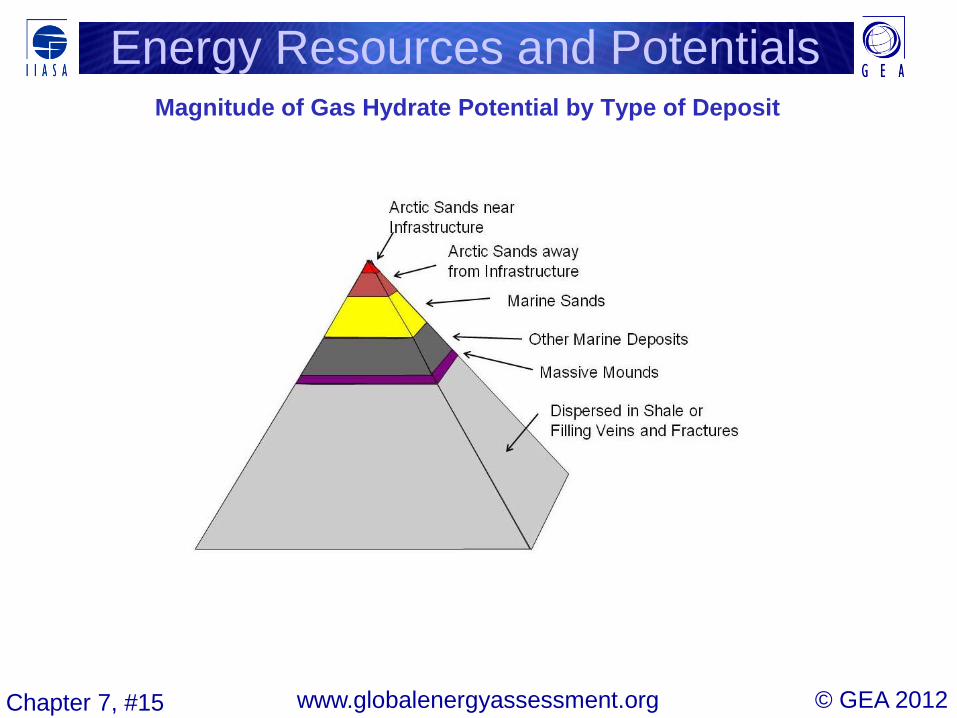
© GEA 2012 www.globalenergyassessment.org Chapter 7, #15
Magnitude of Gas Hydrate Potential by Type of Deposit
Energy Resources and Potentials
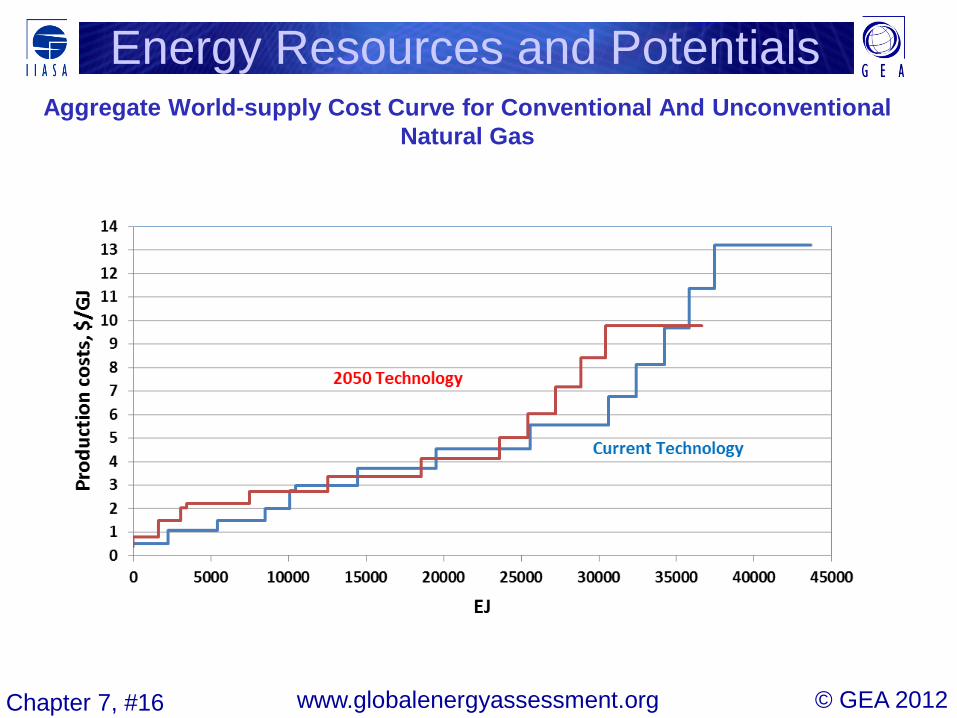
© GEA 2012 www.globalenergyassessment.org Chapter 7, #16
Aggregate World-supply Cost Curve for Conventional And Unconventional Natural Gas
Energy Resources and Potentials
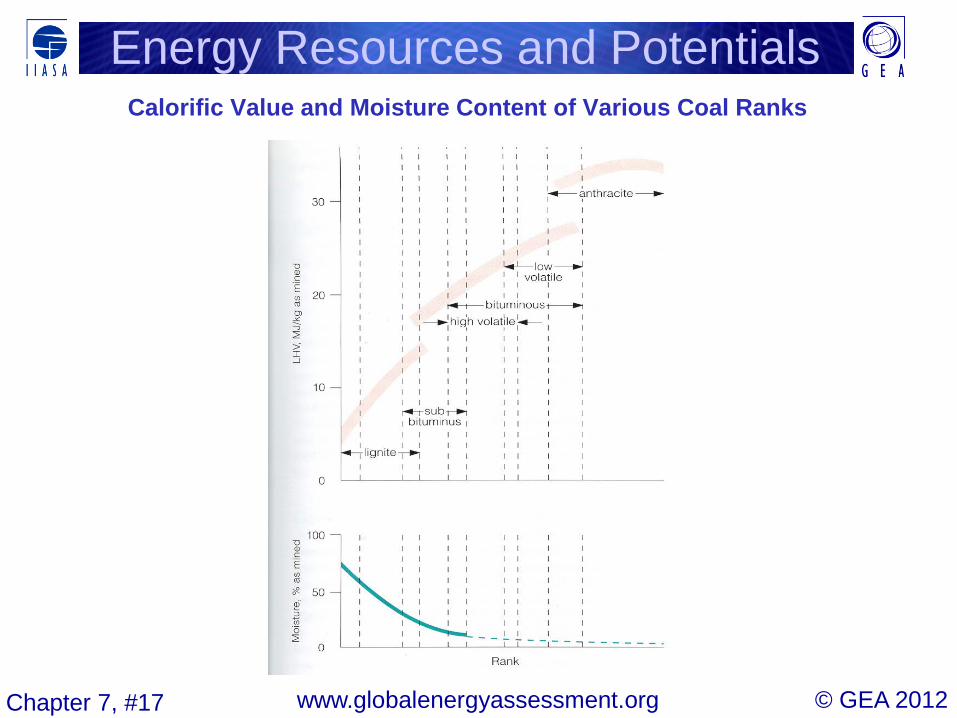
© GEA 2012 www.globalenergyassessment.org Chapter 7, #17
Calorific Value and Moisture Content of Various Coal Ranks
Energy Resources and Potentials
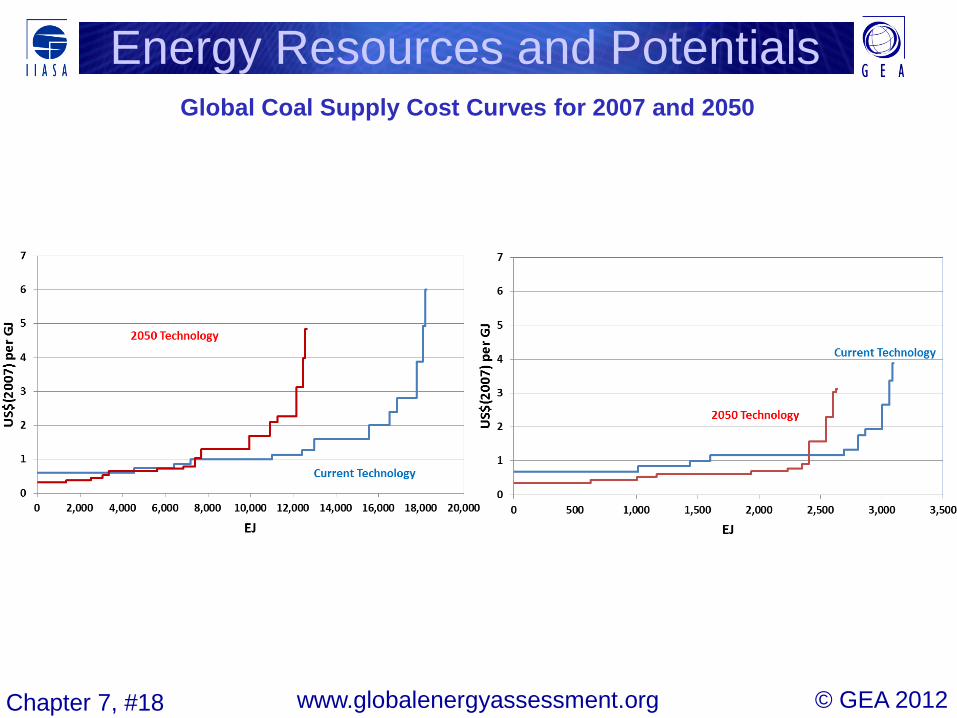
© GEA 2012 www.globalenergyassessment.org Chapter 7, #18
Global Coal Supply Cost Curves for 2007 and 2050
Energy Resources and Potentials
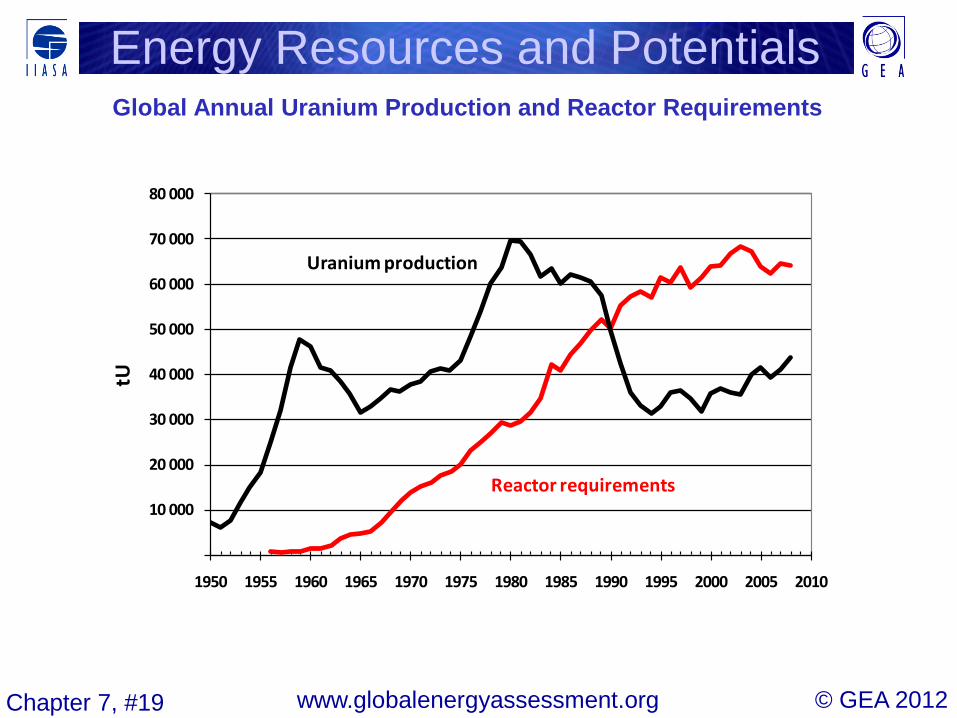
© GEA 2012 www.globalenergyassessment.org Chapter 7, #19
Global Annual Uranium Production and Reactor Requirements
Energy Resources and Potentials
10 000
20 000
30 000
40 000
50 000
60 000
70 000
80 000
1950 1955 1960 1965 1970 1975 1980 1985 1990 1995 2000 2005 2010
tU
Uranium production
Reactor requirements
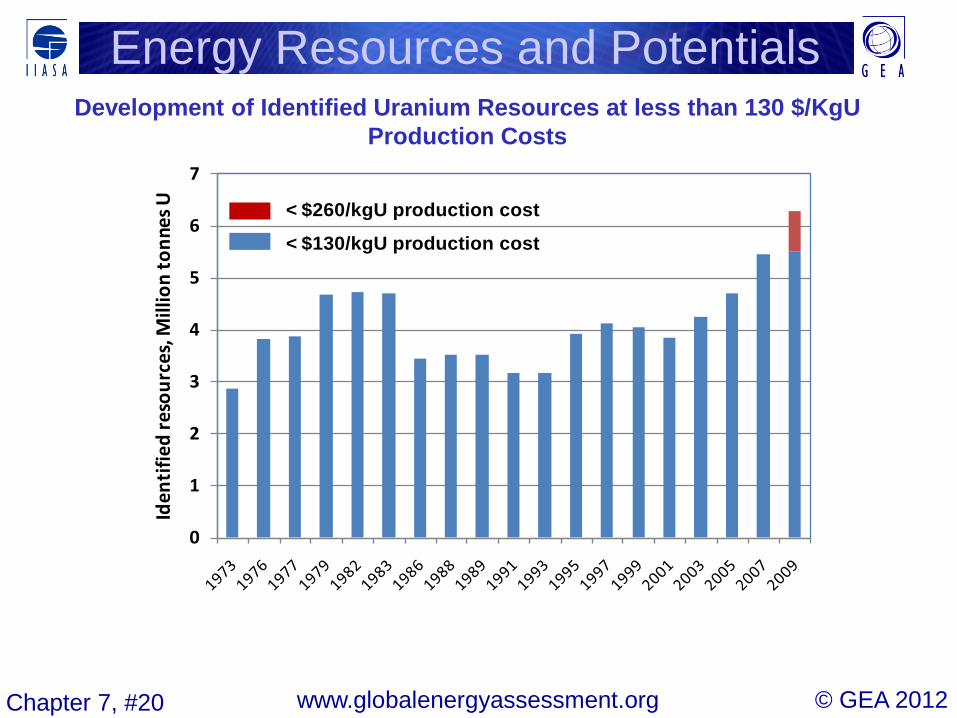
© GEA 2012 www.globalenergyassessment.org Chapter 7, #20
Development of Identified Uranium Resources at less than 130 $/KgU Production Costs
Energy Resources and Potentials
0
1
2
3
4
5
6
7Id
entif
ied
reso
urce
s, M
illio
n to
nnes
U
< $130/kgU production cost
< $260/kgU production cost
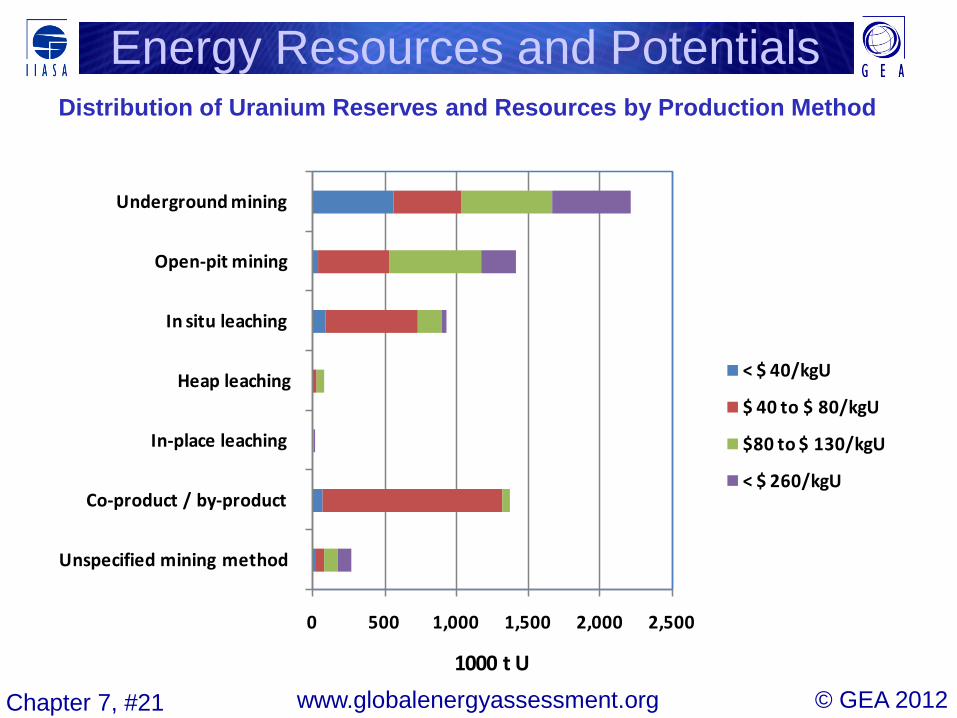
© GEA 2012 www.globalenergyassessment.org Chapter 7, #21
Distribution of Uranium Reserves and Resources by Production Method
Energy Resources and Potentials
0 500 1,000 1,500 2,000 2,500
Unspecified mining method
Co-product / by-product
In-place leaching
Heap leaching
In situ leaching
Open-pit mining
Underground mining
1000 t U
< $ 40/kgU
$ 40 to $ 80/kgU
$80 to $ 130/kgU
< $ 260/kgU
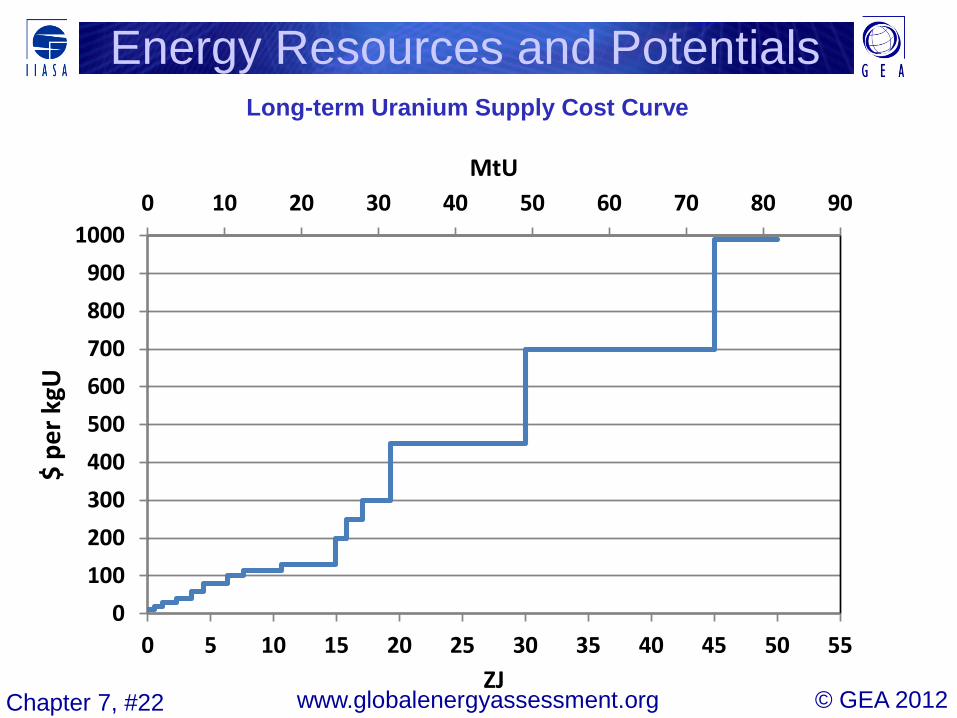
© GEA 2012 www.globalenergyassessment.org Chapter 7, #22
Long-term Uranium Supply Cost Curve
Energy Resources and Potentials
0 10 20 30 40 50 60 70 80 90
0100200300400500600700800900
1000
0 5 10 15 20 25 30 35 40 45 50 55
MtU
$ pe
r kgU
ZJ
© GEA 2012 www.globalenergyassessment.org Chapter 7, #23
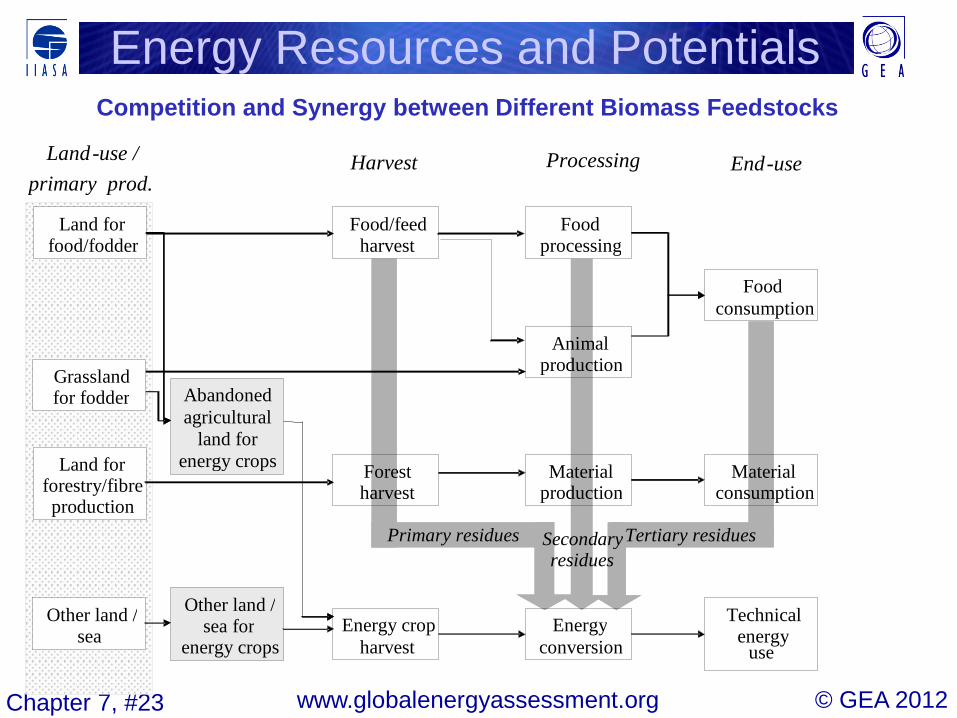
Competition and Synergy between Different Biomass Feedstocks
Energy Resources and Potentials
Other land / sea for
energy crops
Land for forestry/fibre production
Energy crop harvest
Food/feed harvest
Forest harvest
Energy conversion
Food processing
Technical energy
use
Food consumption
Material production
Material consumption
Land - use / primary prod.
Harvest Processing End - use
Primary residues Tertiary residues Secondary residues
Animal production
Land for food/fodder
Abandoned agricultural
land for energy crops
Other land / sea
Grassland for fodder

© GEA 2012 www.globalenergyassessment.org Chapter 7, #24
Bioenergy Crops Supply Cost Curve
Energy Resources and Potentials
0
1
2
3
4
5
6
7
0 10 20 30 40 50 60 70 80 90
$/GJ
EJ/yr
© GEA 2012 www.globalenergyassessment.org Chapter 7, #25
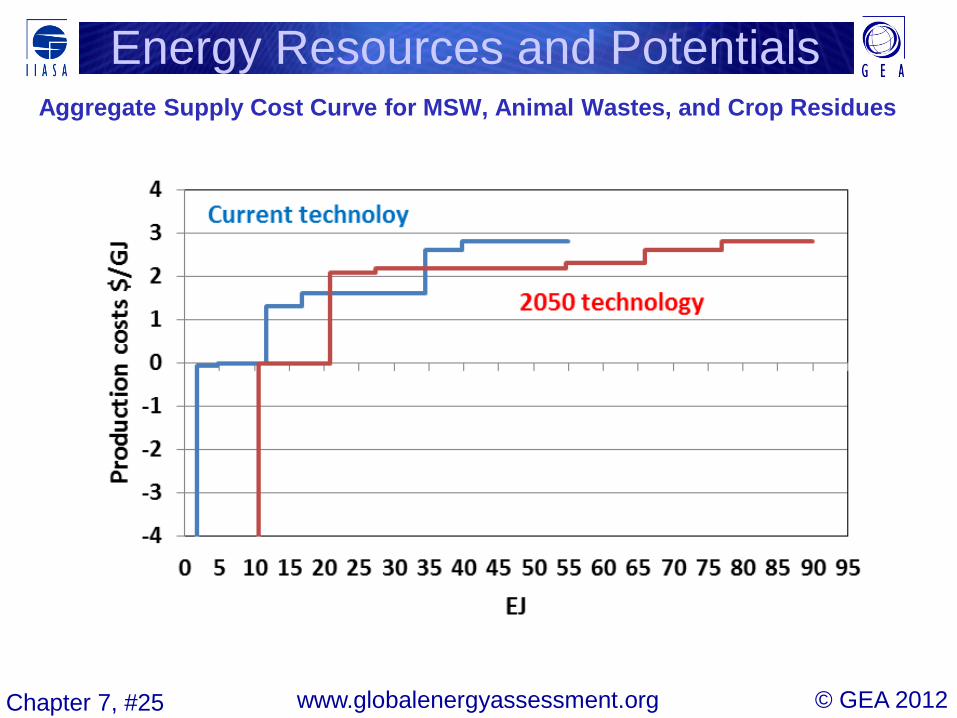
Aggregate Supply Cost Curve for MSW, Animal Wastes, and Crop Residues
Energy Resources and Potentials
© GEA 2012 www.globalenergyassessment.org Chapter 7, #26
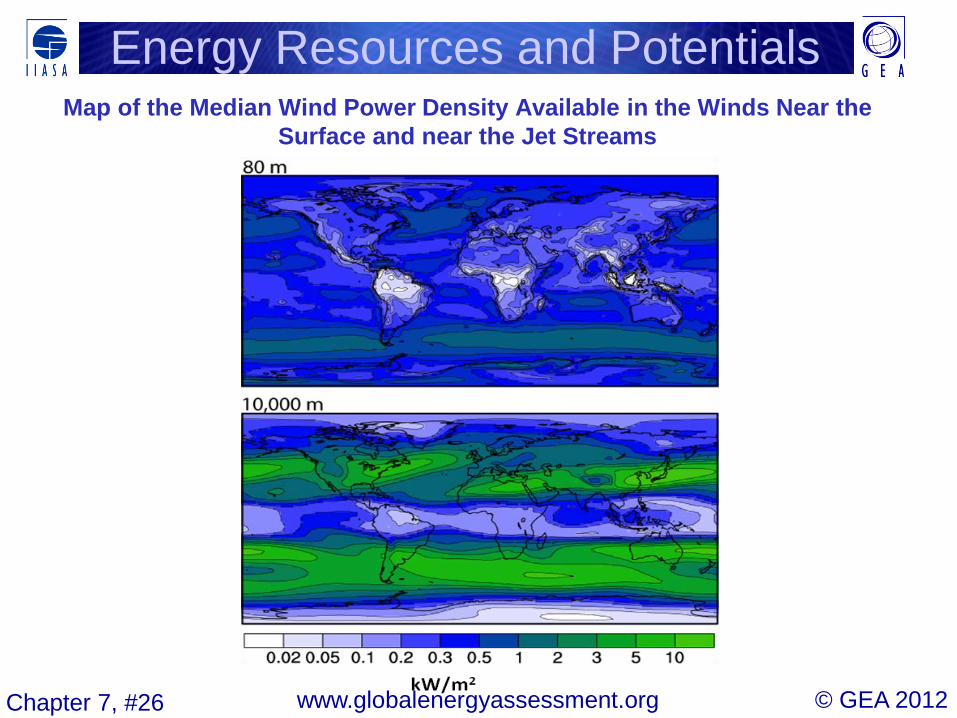
Map of the Median Wind Power Density Available in the Winds Near the Surface and near the Jet Streams
Energy Resources and Potentials
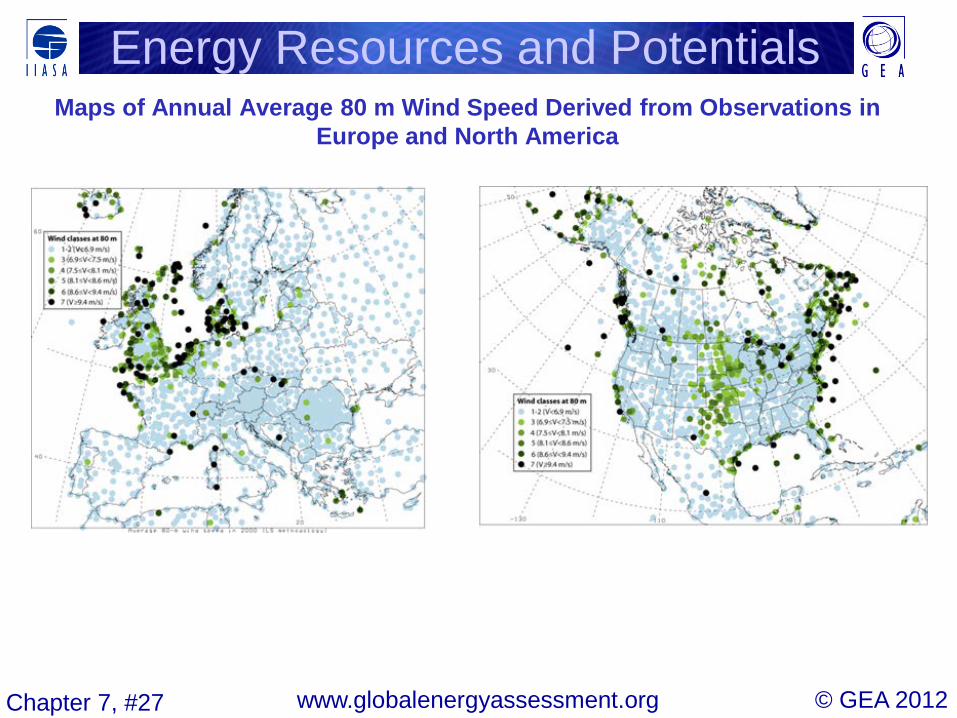
© GEA 2012 www.globalenergyassessment.org Chapter 7, #27
Maps of Annual Average 80 m Wind Speed Derived from Observations in Europe and North America
Energy Resources and Potentials
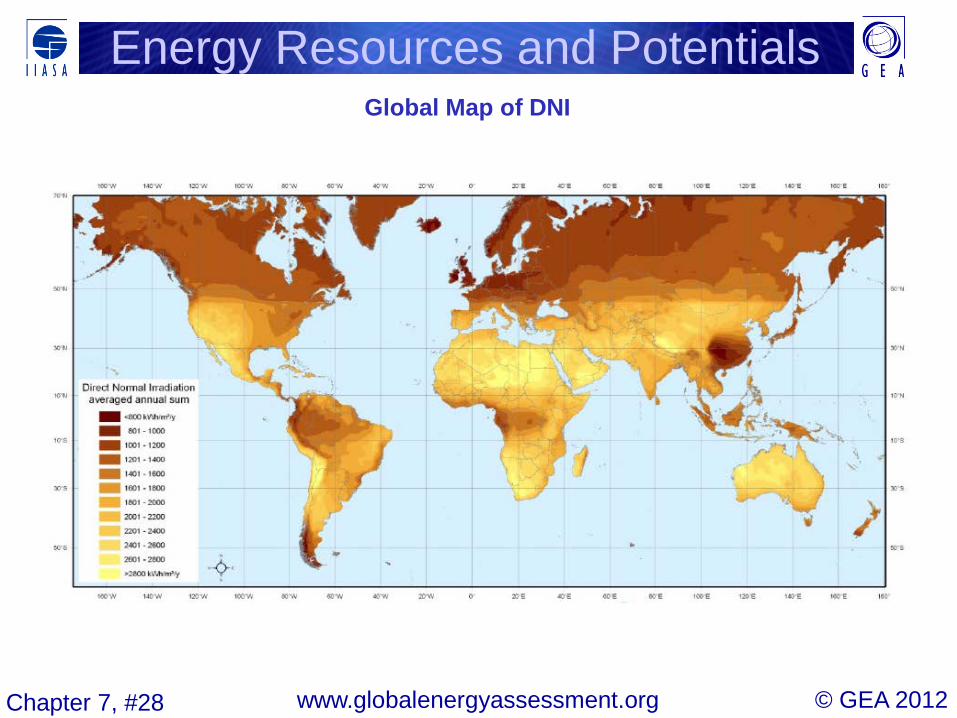
© GEA 2012 www.globalenergyassessment.org Chapter 7, #28
Global Map of DNI
Energy Resources and Potentials
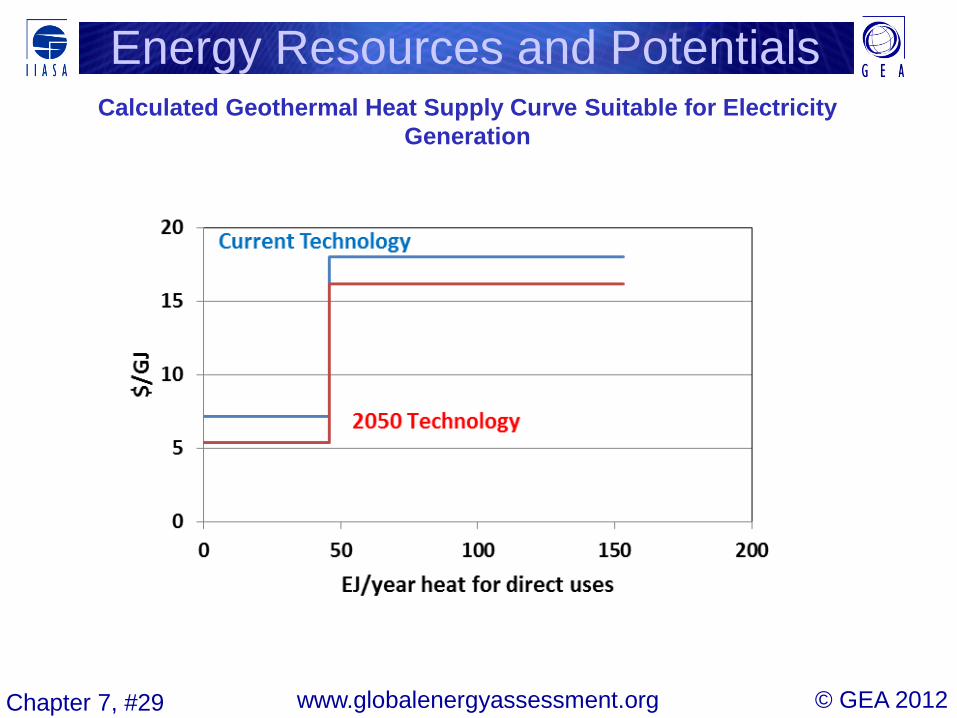
© GEA 2012 www.globalenergyassessment.org Chapter 7, #29
Calculated Geothermal Heat Supply Curve Suitable for Electricity Generation
Energy Resources and Potentials
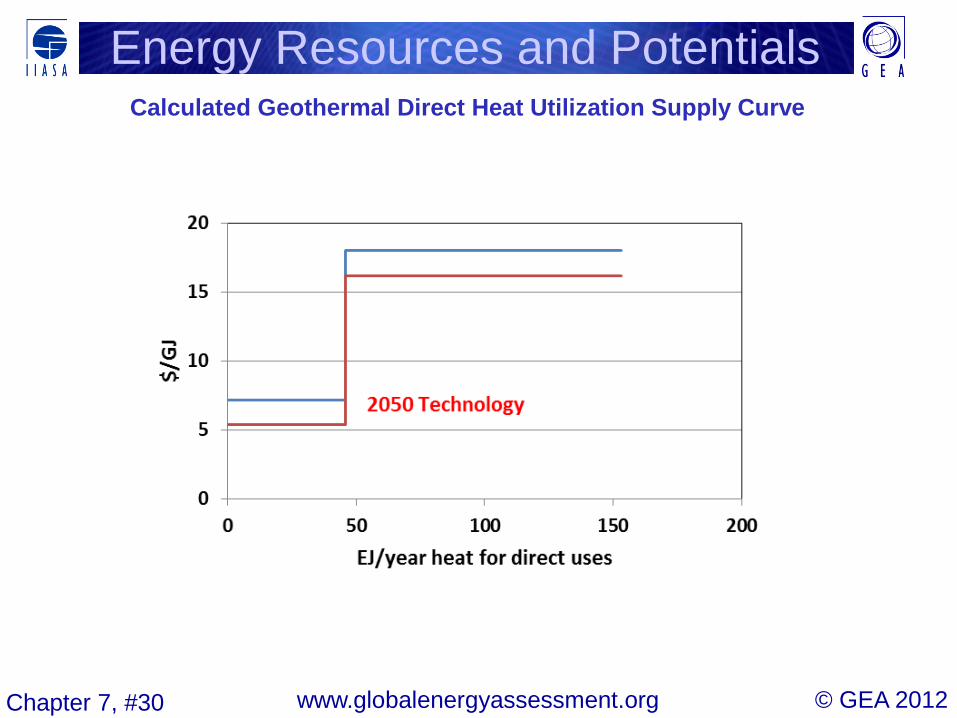
© GEA 2012 www.globalenergyassessment.org Chapter 7, #30
Calculated Geothermal Direct Heat Utilization Supply Curve
Energy Resources and Potentials
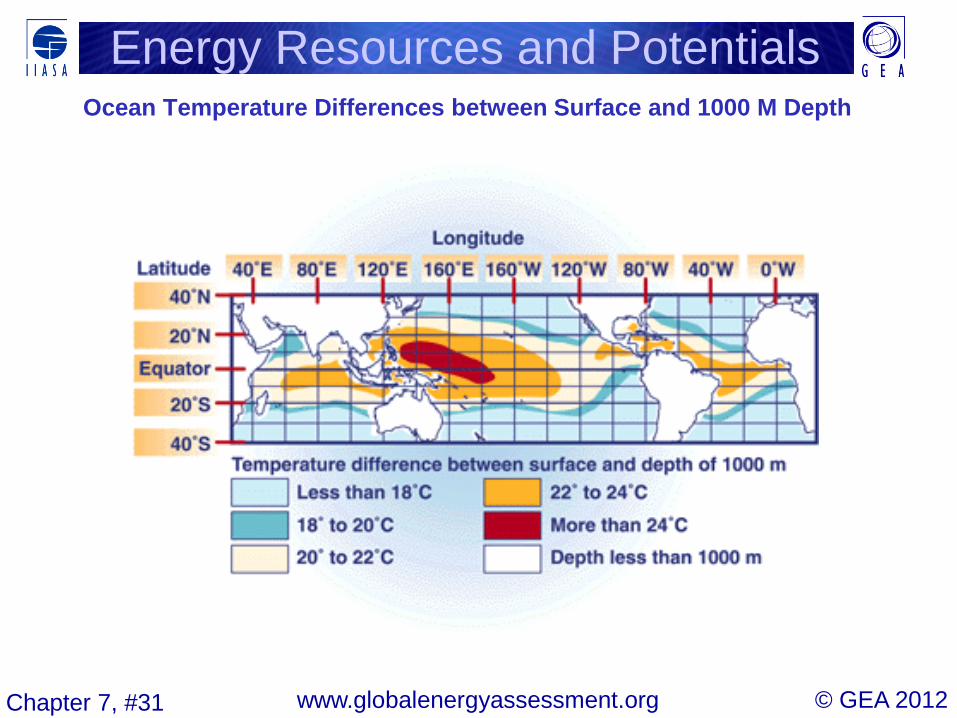
© GEA 2012 www.globalenergyassessment.org Chapter 7, #31
Ocean Temperature Differences between Surface and 1000 M Depth
Energy Resources and Potentials