Embed Size (px)
Citation preview
Romania
Climate Change and Low Carbon Green Growth Program
Component B Sector Report
Energy Sector Rapid Assessment
January 2013
Advisory Service Agreement between Ministry of Environment and Climate Change and the International Bank of Reconstruction and Development
Beneficiary: Ministry of Environment and Climate Change
The World Bank Europe and Central Asia Region
Project co-financed by the European Regional Development Fund through OPTA 2007 – 2013
[Type a quote from the document or the summary of an interesting point.
You can position the text box anywhere in the document. Use the Text
Box Tools tab to change the formatting of the pull quote text box.]
[
T
y
p
e
a
q
u
o
t
e
f
r
o
m
t
h
e
d
o
c
u
m
e
n
t
[
T
y
p
e
a
q
u
o
t
e
f
r
o
m
t
h
e
d
o
c
u
m
e
n
t
[
T
y
p
e
a
q
u
o
t
e
f
r
o
m
t
h
e
d
o
c
u
m
e
n
t
[
T
y
p
e
a
q
u
o
t
e
f
r
o
m
t
h
e
d
o
c
u
m
e
n
t
[
T
y
p
e
a
q
u
o
t
e
f
r
o
m
t
h
e
d
o
c
u
m
e
n
t
[
T
y
p
e
a
q
u
o
t
e
f
r
o
m
t
h
e
d
o
c
u
m
e
n
t
Pub
lic D
iscl
osur
e A
utho
rized
Pub
lic D
iscl
osur
e A
utho
rized
Pub
lic D
iscl
osur
e A
utho
rized
Pub
lic D
iscl
osur
e A
utho
rized

i
Contents CONTENTS ..................................................................................................................................................................................... I
ABBREVIATIONS AND ACRONYMS ....................................................................................................................................... I
ACKNOWLEDGEMENT ............................................................................................................................................................ III
EXECUTIVE SUMMARY ........................................................................................................................................................... IV
1 THE ENERGY SECTOR AND CLIMATE CHANGE MITIGATION IN ROMANIA ................................................ 1
1.1 ENERGY SECTOR CONTRIBUTION TO GREENHOUSE GAS EMISSIONS ...................................................................................... 1 1.2 MAIN CHARACTERISTICS OF ENERGY SUPPLY AND DEMAND .................................................................................................. 2 1.3 EU PRIORITIES AND TARGETS FOR SUSTAINABLE ENERGY IN 2020 AND ROMANIA’S COMMITMENTS ......................... 6 1.4 OBJECTIVE AND FOCUS OF THE ENERGY SECTOR RAPID ASSESSMENT .................................................................................. 7
2 LOW-CARBON INVESTMENT PRIORITIES AND POLICY SUPPORT IN THE ELECTRIC POWER SECTOR .......................................................................................................................................................................................... 9
2.1 TECHNOLOGIES, INFRASTRUCTURE AND SECTOR MANAGEMENT .......................................................................................... 9 2.2 ALTERNATIVE SCENARIOS FOR ACHIEVING EU 2020 TARGET FOR RENEWABLE ENERGY ............................................. 10 2.3 ANALYSIS OF INVESTMENT OPTIONS AND NEEDS DURING 2014-2020 ............................................................................ 14 2.4 ECONOMIC ANALYSIS OF THE RENEWABLE EXPANSION ........................................................................................................ 17 2.5 POLICY RECOMMENDATIONS AND USE OF EU FUNDS ............................................................................................................ 19
3 ENERGY EFFICIENCY OPPORTUNITIES AND CHALLENGES IN THE END-USE SECTORS ...................... 22
3.1 MAIN ENERGY EFFICIENCY GAPS ............................................................................................................................................... 22 3.2 INGREDIENTS OF SUCCESSFUL ENERGY EFFICIENCY PROGRAMS .......................................................................................... 25 3.3 ENERGY POLICY AND REGULATORY ISSUES ............................................................................................................................. 27 3.4 ENERGY EFFICIENCY FINANCING DURING 2007-2013 ........................................................................................................ 30 3.5 GAPS IN IMPLEMENTATION CAPACITY ..................................................................................................................................... 34 3.6 CONCLUSIONS OF THE GAP ANALYSIS ....................................................................................................................................... 37
4 PRELIMINARY ASSESSMENT OF DISTRICT HEATING ...................................................................................... 39
4.1 KEY SECTOR ISSUES ..................................................................................................................................................................... 39 4.2 SOURCES OF FINANCING FOR MODERNIZATION ...................................................................................................................... 42
5 PRIORITIES FOR ENERGY EFFICIENCY INVESTMENT AND GOVERNMENT SUPPORT ......................... 44
5.1 CATALOGING ENERGY EFFICIENCY INVESTMENTS .................................................................................................................. 44 5.2 POTENTIAL ENERGY SAVINGS IN KEY END-USE AREAS .......................................................................................................... 46 5.3 PRIORITIZING ENERGY EFFICIENCY INVESTMENTS AND POLICY SUPPORT ......................................................................... 47 5.4 INVESTMENT NEEDS AND FINANCING SOURCES DURING 2014-2020 ............................................................................... 48
6 DELIVERING ENERGY EFFICIENCY INVESTMENTS DURING 2014-2020 ................................................... 51
6.1 MATCHING FINANCING AND DELIVERY MECHANISMS WITH SPECIFIC SECTOR NEEDS AND CONSTRAINTS ................... 51 6.2 POLICY SUPPORT AND IMPLEMENTATION CAPACITY-BUILDING .......................................................................................... 58
ANNEXES .................................................................................................................................................................................... 62
ANNEX 1: LESSONS LEARNED ON ENERGY PERFORMANCE CONTRACTING IN THE PUBLIC SECTOR ................................................. 62 ANNEX 2: USE OF ETS IN ROMANIA TO INVEST IN ENERGY SECTOR CLIMATE CHANGE MITIGATION ............................................. 69
REFERENCES ............................................................................................................................................................................. 68
ii
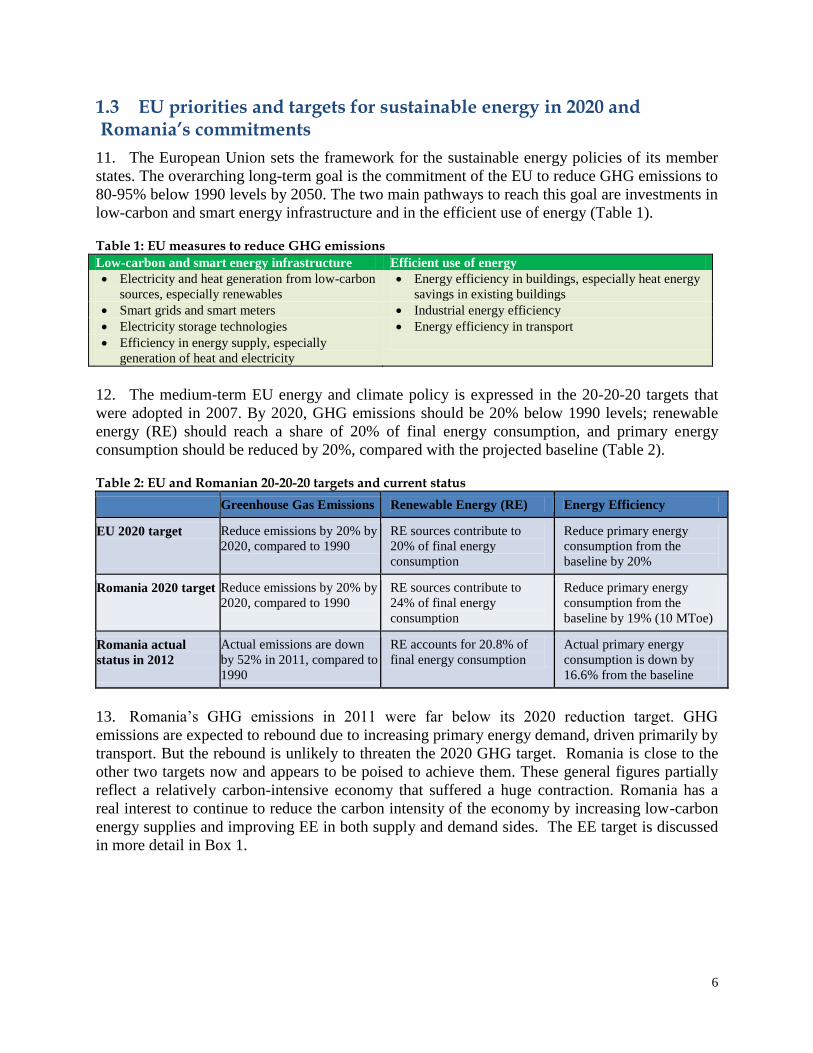
Table 1: EU measures to reduce GHG emissions ..................................................................................... 6
Table 2: EU and Romanian 20-20-20 targets and current status ................................................................ 6
Table 3: Government Power Sector Investment Plan, 2013 - 2020 ......................................................... 11
Table 4: Alternative Power Sector Investment Plan ................................................................................ 13
Table 5: Investment Costs: Government Plan (Scenario A) vs. Proposed Alternative Scenario B ............ 15
Table 6: Public Investments under the Government Pan and the Alternative Scenario ............................ 16
Table 7: Subsidies for renewable energy ................................................................................................ 18
Table 8: Adoption of EU Energy Efficiency Directives in Romania ....................................................... 27
Table 9: Public building renovation projects co-financed with EU funds, 2007-2013 ............................. 33
Table 10: Estimated available financing for energy efficiency investments during 2007-2013 ................ 34
Table 11: Summary of EE framework in Romania – Achievements and necessary improvements ... Error!
Bookmark not defined. Table 12: Summary of Gap Analysis ..................................................................................................... 37
Table 13: Demand-side energy efficiency interventions by sector .......................................................... 44
Table 14: Estimated cost of saved energy of selected EE interventions in Romania ................................ 45
Table 15: 2011 Energy prices for different consumer groups, incl. taxes, in EUR/MWh ......................... 46
Table 16: Potential energy savings based on 2011 stock or activity levels .............................................. 46
Table 17: Demand-side energy efficiency investment screening matrix: considering scalability and cost 48
Table 18: Matching Government Support with Critical Needs .................. Error! Bookmark not defined.
Table 19: Investment needs for selected energy efficiency interventions, 2014-2020 .............................. 49
Table 20: Financing Sources for selected energy efficiency investments, 2014-2020 .............................. 50
Table 21: Renovation Loan Funds in Estonia and Lithuania ................................................................... 56
Figure 1: The Energy Sector Dominates GHG Emissions in Romania ...................................................... 1
Figure 2: Romania: GHG emission trends, 1989-2011 Figure 3: Decoupling of energy and GDP growth 1
Figure 4: Romania: primary energy consumption by fuel, and compared with Germany and EU27 .......... 2
Figure 5: Romania: electricity generation mix by fuel, 2011, compared with Spain, Germany and EU ..... 2
Figure 6: Indicators for primary energy intensity in Romania, 2000-2010, and EU ................................... 3
Figure 7: Romania consumes significantly less energy per capita than high-income EU countries: Per
capita final fuel and electricity consumption vs. per capita GDP in PPP, 2003-2011 ................................. 3
Figure 8: Final Energy Consumption by Sector for Romania, Germany and EU27 ................................... 4
Figure 9: Electricity and natural gas prices, Romania and EU, 2012 ......................................................... 4
Figure 10: District heating cost in Romania is high and tariffs are highly subsidized ................................ 5
Figure 11: 5% annual decrease in energy intensity (toe/MEuro) necessary to achieve EU27 level by 20307
Figure 12: Installed power generation capacity in Romania and degree of obsolescence ........................... 9
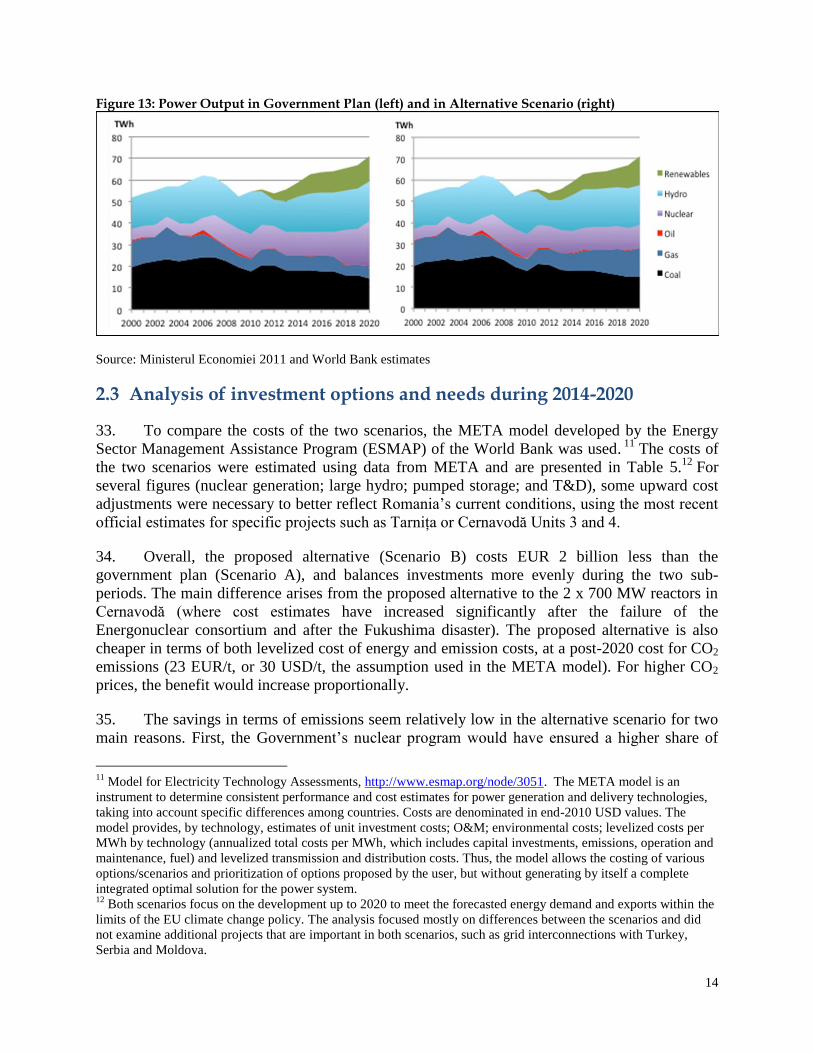
Figure 13: Power Output in Government Plan (left) and in Alternative Scenario (right) .......................... 14
Figure 14: Supply curve of power from renewable energy options ......................................................... 18
Figure 15: GDP energy intensity of EU member countries, 2011............................................................ 22
Figure 16: Residential heating energy is low per dwelling but high in per unit heated area ..................... 23
Figure 17: Overall manufacturing energy intensity matches EU average ................................................ 23
Figure 18: Manufacturing energy intensity at EU structure is significantly higher than EU average ........ 24
Figure 19: Energy intensity in the chemical and steel industries in Romania and EU countries ............... 24
Figure 20: Framework for successful energy efficiency programs .......................................................... 25
Figure 21: Public Energy Efficiency Financing Options Ladder ............................................................. 52
i
Abbreviations and Acronyms ANRE Autoritatea Nationala de Reglementare in Domeniul Energiei (Romanian
Energy Regulatory Authority)
ANRSC Autoritatea Nationala de Reglementare pentru Serviciile Comunitare de
Utilitati Publice (Romanian National Regulatory Authority for Municipal
Services)
BCR Banca Comerciala Romana
CCGT Combined-cycle gas turbine
CCS Carbon capture and storage
CEB Council of Europe Development Bank
CFB Circulating fluidized bed
CFL Compact fluorescent lamp
CO2 Carbon dioxide
COM Covenant of Mayors
DG Directorate General
DH District heating
EBRD European Bank for Reconstruction and Development
EC European Commission
EE Energy efficiency
EED Energy Efficiency Directive
EEFF Energy Efficiency Financing Facility
EEO Energy efficiency obligations
EIB European Investment Bank
EPBD Energy Performance of Buildings Directive
EPC Energy performance contract
ER Exchange rate
ERDF European Regional Development Fund
ESCO Energy service company
ESD Energy Services Directive
ESMAP Energy Sector Management Assistance Program
ETS Emission trading scheme
EU European Union
FGD Flue-gas desulfurization
FI Financial institution
FREE Romanian Energy Efficiency Fund
GC Green certificate
GDP Gross domestic product
GEF Global Environment Facility
GHG Greenhouse gas
HF Holding Fund
HOA Homeowners Association
HVAC Heating, ventilation, and air conditioning
ICEMENERG Energy Research and Modernizing Institute
IFC International Finance Corporation
ii
IFI International Financial Institution
JESSICA Joint European Support for Sustainable Investment in City Areas
kgoe Kilogram of oil equivalent
kWh Kilowatt-hour
LCOE Levelized cost of energy
LED Light-emitting diode
LULUCF Land use, land use change and forestry
m2 Square meter
MDRAP Ministry of Regional Development and Public Administration, formerly
MDRT (Ministry of Regional Development and Tourism)
MECC Ministry of Environment and Climate Change
META Model for Electricity Technology Assessments
MOE Ministry of Economy
Mtoe Million tons of oil equivalent
M&V Measurement and verification
MVA Megavolt ampere
MW Megawatt
MWh Megawatt-hour
NEEAP National Energy Efficiency Action Plan
NIP National Investment Plan
NPV Net present value
nZE Nearly zero energy
OP Operational Program
OPCOM Societatea Comercială Operatorul Pieţei de Energie Electrică (Romanian
Power Market Operator)
O&M Operations and maintenance
PEC Primary energy consumption
PPP Public-private partnership
PPS Purchasing power parity
PV Photovoltaics
RLF Renovation Loan Fund (Estonia)
ROSEFF Romania SME Sustainable Energy Finance Facility
SME Small and medium enterprise
SOE State-Owned Enterprise
SOP Sectoral Operational Program
T5, T8, T12 Fluorescent lamp formats. A Tx tube diameter designation refers to a x/8
inch tube diameter, for example, T8 = 8/8 inch = 26mm
TA Technical assistance
toe Tons of oil equivalent
T&D Transmission and distribution
TSO Transmission System Operator
UNDP United Nations Development Programme
iii
Acknowledgement
The report is an output of the World Bank’s Romania Climate Change Reimbursable Advisory
Service (RAS) Program at the request of the Government of Romania (through its Ministry of
Environment and Climate Change). It was prepared by a core team comprised of Feng Liu, Anke
Meyer, Ana Otilia Nutu and Jean Constantinescu, with inputs from Silpa Kaza. This sector
report benefited from the comments and suggestions of Jas Singh and Grzegorz Peszko. It was
reviewed and cleared by Ranjit Lamech.
The work was carried out between June 2013 and September 2013 and is based upon the results
of extensive discussions with officials in the relevant government agencies, including Nicolae
Voineag, Advisor and George Guran, Director, SOP Competitiveness in the Ministry of
Economy; Mariana Ionita, Director General, Sandu Moise, Director, Daniela Ionescu, Senior
Consultant, Ministry of Regional Development and Public Administration; Emil Calota, Vice
President, Corneliu Rotaru, Director General, Corneliu Radulescu, Director General, Maria
Manicuta, Director General, and Otilia Marin, Director, the National Energy Regulatory
Authority; Iulian Iancu, Committee President of the Chamber of Deputies; Silvia Vlasceanu,
Parliamentary Advisor, and Rodin Traicu, Deputy. The team also benefited from discussions
with experts, including Carmencita Constantin, Director for the Environment and Energy
Division, Cristiana Ion, Consultant, and Anca Popescu, Director, Institute for Studies and Power
Engineering; Ionut Purica, Energy Expert INCE – Romanian Academy; Virgil Musatescu, Senior
Energy Consultant; Mircea Ghitulescu, Senior Energy Expert, and Camelia Rata, Executive
Director ABMEE; Mihail Scvortov, Principal Banker and Venera Vlad, Senior Banker, EBRD;
Cristina Cremenescu, Dalkia Romania; Bogdan Atanasiu, Buildings Performance Institute
Europe.
The World Bank would also like to express gratitude to the Romanian Government for the
excellent working relations established during this assignment and especially the assistance of
the staff and members of the Project Implementing Unit in the Ministry of Environment and
Climate Change, namely Mihaela Smarandache, Narcis Jeler, Alexandra Ulmeanu, Gabriela
Popescu, and Bianca Moldovean.
The World Bank’s Romania Climate Change program is managed by Jian Xie and Erika
Jorgensen, under the general guidance of Laszlo Lovei, Mamta Murthi, Kulsum Ahmed, Satu
Kristiina Kahkonen, and Elisabetta Capannelli from the World Bank.
iv
Executive Summary
The Energy Sector Rapid Assessment was conducted by the World Bank for the Government of
Romania, as part of an advisory services program on climate change and low carbon green
growth. The objective of this assessment is to identify climate change related investment
priorities and necessary implementation support for the 2014-2020 Operational Programs, with a
view to achieving the EU 20-20-20 targets and laying a foundation for continued de-
carbonization of the energy sector.
This rapid assessment focuses on climate change mitigation actions in power and heat
generation and in energy use in manufacturing, residential, public and commercial sectors.
Issues and options for adaptation in the energy sector are not covered. Energy use in agriculture
and forestry, which accounts for less than 2 percent of the total final energy consumption in
Romania, is not analyzed. Energy use and efficiency in the transport sector is studied in a
separate transport sector rapid assessment.
Due to the limitation of time, several pieces of important analyses are deferred to the later phase
of the advisory services program. These include in-depth investigation of the main energy end-
use sectors or subsectors, low-carbon energy supply optimization based on long-term energy
demand patterns and trends, and the design and approaches of key energy efficiency intervention
programs, such as thermal retrofit of residential and public buildings and economization and
modernization of district heating systems.
Main Findings
The economic growth and energy consumption in Romania has been decoupled since 1998,
and the energy intensity of the economy, measured by primary energy consumption per unit of
gross domestic product, has decreased substantially. After the large contractions of the
economy and energy consumption in the 1990s, Romania’s GDP rose by 53 percent from 2000
to 2011 while energy demand remained flat. This is in large part due to the structural adjustments
of the economy toward higher-value-added manufacturing and services and significant
improvements of energy efficiency in industries.
Per capita energy consumption in Romania is substantially lower than that of high-income
EU countries. A significant increase in energy demand is expected if the economy continues to
grow. Per capita fuel and electricity consumptions in 2011 were 51 and 47 percent of the EU27
average, respectively. Even with continued improvement in energy efficiency, energy demand is
likely to grow significantly as Romania is catching up with the high-income countries.
Primary energy consumption in Romania is characterized by a relatively high and increasing
share of low-carbon energy sources, even though natural gas consumption is declining. From
2000 to 2011, the share of primary energy sourced from nuclear, hydro and wind power and
biomass increased from 15 to 22 percent, while that of natural gas declined from 37 to 30 percent.
v
The share of coal crept up from 20 to 22 percent. Overall, the carbon footprint of the energy
sector shrank by approximately 7 percent, from 92.89 to 86.32 million tons of CO2 equivalent.
Final energy consumption patterns in Romania are expected to converge toward those of the
largest EU economies in the long-term, indicating significant increases in quantity and share
of energy for transportation and the services sector. Energy demand of the services sector
surged by 2.6 times from 2000 to 2011, albeit from a relatively small base. Transport energy
demand also grew by 25 percent during the same period, while residential and industrial energy
demand, the largest and second largest among all sectors, declined by 6 and 21 percent,
respectively.
Energy for selected industrial customers and all residential customers are subsidized. Energy-
intensive state-owned enterprises (SOEs) benefit from low, preferential electricity and gas prices.
State and local subsidies for residential district heating cover about 50 percent of residential
customer cost. Under legislation passed in 2012 and 2013, regulated electricity and gas prices for
non-households will be fully liberalized by January 2014 and January 2015, respectively, and
regulated electricity and gas prices for households will be liberalized by January 2018 and
January 2019, respectively. No definite timeline has been given for removing district heat
subsidies.
The energy sector is responsible for 70% of total greenhouse gas (GHG) emissions (excluding
LULUCF) in Romania and has contributed 70% of the overall GHG emissions reduction since
1989. Three quarters of the energy sector GHG emissions are from power and heat generation
and non-transport fuel consumption. Continued de-carbonization of the energy sector, through
low-carbon power and heat supply options and improved efficiency in energy conversion,
transmission, distribution and consumption, is essential to the climate change mitigation agenda
in Romania.
Continued reduction of the carbon footprint of power and heat generation in Romania
requires in the medium term (up to 2020) a significant increase of investments in wind and
solar power and supporting infrastructure, and in high-efficiency gas-fired generation. In the
long term (beyond 2020), while these supply options will remain important, Romania’s
mitigation efforts may also benefit from increased nuclear power generation and potential
opportunities offered by carbon capture and storage (CCS).
The power and heat supply sectors have a large amount of obsolete physical assets which will
need to be selectively modernized or scrapped. For examples, about 80 percent of the fossil fuel-
fired generation capacity is deemed inefficient and obsolete and about 60 percent of the power
distribution networks need to be modernized. Investments in retrofitting fossil fuel-fired power
plants in the last 20 years have yielded scant returns, since many of these plants remain too
expensive to operate.
The broad energy sector reforms advocated by the 2003 Road Map for the Energy Field
remain largely unimplemented, hindering private sector investments and the development of
viable public sector energy companies, both are crucial to Romania’s energy security and
cleaner energy future. While some progress in sector reforms has been made, the key findings
vi
and recommendations on sector governance in the 2011 Functional Review by the World Bank
are still relevant and valid.
The continued deterioration and decline of the district heating systems is particularly
distressing and undermine the quality of life in Romanian cities. The number of operating
district heating systems stood at about 100 in 2011, compared with over 300 in 1995. Many of
the remaining operators are no longer economically viable because a substantial number of
dissatisfied customers have disconnected themselves from the systems and chosen alternative
heating options. The inefficiency and high losses in the district heating systems also make them
among the most costly to operate in the EU. A multi-year comprehensive program is needed to
modernize the economically viable district heating systems: improving their efficiency and
service quality on the one hand and implementing sector reforms to restore district heating
company financial sustainability on the other, while ensuring that subsidies to poor households
are well targeted.
Despite the substantial progress, Romania still lags significantly behind most EU countries in
the broadest measure of energy efficiency and in key end-user sectors. Its energy intensity
denominated by GDP in purchasing power parity was about 18 percent higher than the EU
average in 2011. The efficiency gap is most pronounced for residential space heating where
specific heat consumption (kgoe/m2) is 32 percent higher than comparable best EU practice. For
the two dominating industrial energy users, chemicals manufacturing has a value-added energy
intensity over 4 times higher than the EU average (indicating structural issues), and steel making
has an energy intensity per ton of steel that is 70 percent higher than the EU average. These
three areas of end-use together account for roughly 40 percent of Romania’s final energy
consumption.
Thermal retrofit of residential buildings is a huge challenge financially and implementation-
wise. Only about 1 percent of the 150 million m2 or so apartment buildings which were
determined in need of thermal retrofit had been retrofitted as of 2012. Despite very high capital
subsidies (up to 80 percent) provided by the national and local governments, many low income
households still are reluctant to participate. At about EUR80/m2, total investment for retrofitting
the above mentioned building stock amounts to EUR 12 billion. Turning this huge cost into a big
economic opportunity is perhaps the most challenging energy efficiency agenda in Romania.
Many of the legal and regulatory requirements to enable improved energy efficiency are dealt
with on paper, but implementation is uneven. Romania has transposed all relevant EU
directives and has delivered the first and second National Energy Efficiency Action Plans. It has
built up fairly successful appliance labeling, and started up energy auditing and management for
large industries and the building sector. But particularly in the building sector actual energy
savings have been disappointing compared to the potential. The major unfinished policy agenda
in Romania is energy price reform, with large subsidies remaining for natural gas, district heat
and electricity for some energy-intensive SOEs. These subsidies are major disincentives for
energy consumers to engage in energy efficiency actions and divert public funds from more
productive uses.
Over EUR 2 billion of financing was available for energy efficiency investments during 2007-
2013, including about EUR 800 million EU funds. While this is far from being sufficient to
vii
address the large energy efficiency financing needs in Romania, the institutional support and
technical capacity to implement and deliver energy efficiency investments do not appear to be
adequate at either the national or the local levels. This is caused by a lack of incentives,
information, necessary skills upgrades, and administrative improvements such as strategic
planning, prioritization, systematic evaluations and coordination between the different levels of
government. The implementation and delivery challenges will only grow in the next seven years.
Estimated Investment Needs
The overall investment cost of the government’s power sector development plan during 2014-
2020 is estimated to be about EUR 14 billion with an estimated public funding of EUR 3.6
billion. About half of the total investment cost would be devoted to the construction of two new
nuclear reactors and retrofitting existing coal-fired power plants which would be primarily used
as back-up units for the nuclear capacity. Since the financing of the nuclear units still remains in
limbo due to a lack of investor interest, it is unlikely that they will be completed by 2020. This
would lead to a substantial increase in the use of inefficient fossil fuel-fired units in the latter
years of the 2014-2020 period if power demand growth is robust.
About EUR 2 billion of capital savings could be achieved with reduced overall cost of
electricity in an alternative 2014-2020 power generation scenario, if the Government chooses
to source additional generation capacity primarily from high-efficiency gas-fired units, wind
power and solar PV. The reduced need for public funding amounts to EUR 636 million. The
rapid assessment compared an alternative power generation scenario with the existing
government plan drafted in 2011. The conclusion was that the alternative is cheaper and more
likely attainable by postponing the construction of the nuclear units and scrapping the old coal-
fired units instead of retrofitting them.
In the alternative scenario, the estimated subsidies for wind, solar PV and biomass (steam)
through the existing green certificate scheme are expected to reach EUR 220 million by 2020
to support the significantly higher installed capacity of wind and solar PV. The current green
certificate scheme (which already was scaled back since July 2013) was evaluated and deemed
sufficient to support the additional expansion of wind and solar PV power with a small impact on
end-user electricity costs (about EUR 3/MWh additional cost).
The estimated investment needs for end-use energy efficiency improvements based on a few
selected large-scale interventions implementable during 2014-2020, such as building thermal
retrofit, refrigerator upgrade and industrial energy efficiency, amounts to over EUR 6 billion. 28 percent of the estimated needs, or about EUR 1.7 billion, is expected to be financed by public
funds, including EU and government funds.
Recommended Actions
Combined efforts in investments, sector reforms and implementation and delivery are required
to secure reliable energy supply for economic growth and improving quality of life on the one
hand while increase the share of clean energy sources, including energy efficiency, on the
other. These efforts should be guided by an overarching national energy and climate strategy
viii
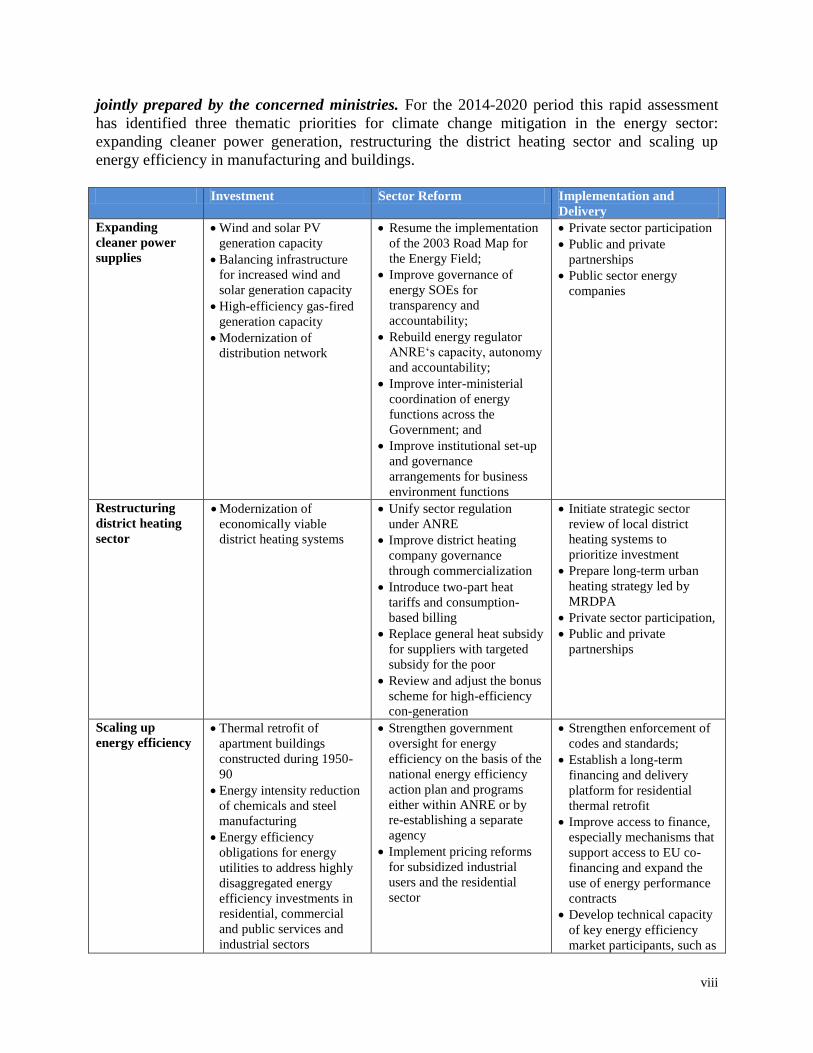
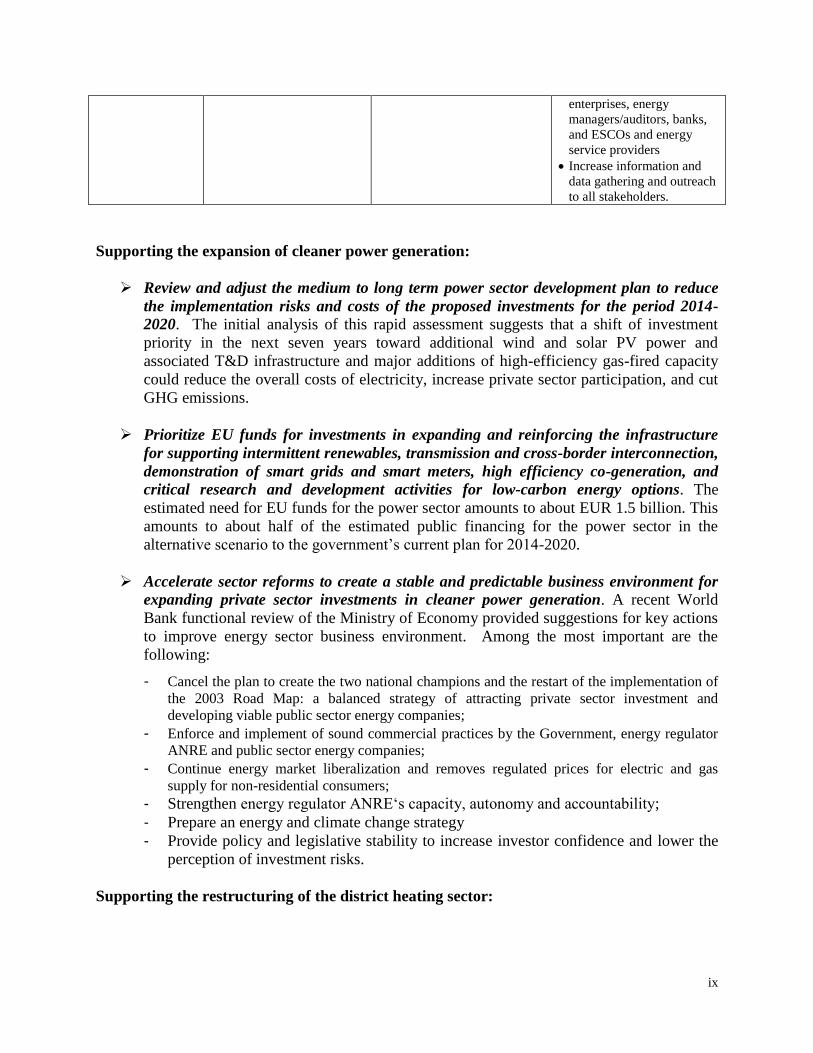
jointly prepared by the concerned ministries. For the 2014-2020 period this rapid assessment
has identified three thematic priorities for climate change mitigation in the energy sector:
expanding cleaner power generation, restructuring the district heating sector and scaling up
energy efficiency in manufacturing and buildings.
Investment Sector Reform Implementation and
Delivery
Expanding
cleaner power
supplies
Wind and solar PV
generation capacity
Balancing infrastructure
for increased wind and
solar generation capacity
High-efficiency gas-fired
generation capacity
Modernization of
distribution network
Resume the implementation
of the 2003 Road Map for
the Energy Field;
Improve governance of
energy SOEs for
transparency and
accountability;
Rebuild energy regulator
ANRE‘s capacity, autonomy
and accountability;
Improve inter-ministerial
coordination of energy
functions across the
Government; and
Improve institutional set-up
and governance
arrangements for business
environment functions
Private sector participation
Public and private
partnerships
Public sector energy
companies
Restructuring
district heating
sector
Modernization of
economically viable
district heating systems
Unify sector regulation
under ANRE
Improve district heating
company governance
through commercialization
Introduce two-part heat
tariffs and consumption-
based billing
Replace general heat subsidy
for suppliers with targeted
subsidy for the poor
Review and adjust the bonus
scheme for high-efficiency
con-generation
Initiate strategic sector
review of local district
heating systems to
prioritize investment
Prepare long-term urban
heating strategy led by
MRDPA
Private sector participation,
Public and private
partnerships
Scaling up
energy efficiency Thermal retrofit of
apartment buildings
constructed during 1950-
90
Energy intensity reduction
of chemicals and steel
manufacturing
Energy efficiency
obligations for energy
utilities to address highly
disaggregated energy
efficiency investments in
residential, commercial
and public services and
industrial sectors
Strengthen government
oversight for energy
efficiency on the basis of the
national energy efficiency
action plan and programs
either within ANRE or by
re-establishing a separate
agency
Implement pricing reforms
for subsidized industrial
users and the residential
sector
Strengthen enforcement of
codes and standards;
Establish a long-term
financing and delivery
platform for residential
thermal retrofit
Improve access to finance,
especially mechanisms that
support access to EU co-
financing and expand the
use of energy performance
contracts
Develop technical capacity
of key energy efficiency
market participants, such as
ix
enterprises, energy
managers/auditors, banks,
and ESCOs and energy
service providers
Increase information and
data gathering and outreach
to all stakeholders.
Supporting the expansion of cleaner power generation:
Review and adjust the medium to long term power sector development plan to reduce
the implementation risks and costs of the proposed investments for the period 2014-
2020. The initial analysis of this rapid assessment suggests that a shift of investment
priority in the next seven years toward additional wind and solar PV power and
associated T&D infrastructure and major additions of high-efficiency gas-fired capacity
could reduce the overall costs of electricity, increase private sector participation, and cut
GHG emissions.
Prioritize EU funds for investments in expanding and reinforcing the infrastructure
for supporting intermittent renewables, transmission and cross-border interconnection,
demonstration of smart grids and smart meters, high efficiency co-generation, and
critical research and development activities for low-carbon energy options. The
estimated need for EU funds for the power sector amounts to about EUR 1.5 billion. This
amounts to about half of the estimated public financing for the power sector in the
alternative scenario to the government’s current plan for 2014-2020.
Accelerate sector reforms to create a stable and predictable business environment for
expanding private sector investments in cleaner power generation. A recent World
Bank functional review of the Ministry of Economy provided suggestions for key actions
to improve energy sector business environment. Among the most important are the
following:
- Cancel the plan to create the two national champions and the restart of the implementation of
the 2003 Road Map: a balanced strategy of attracting private sector investment and
developing viable public sector energy companies;
- Enforce and implement of sound commercial practices by the Government, energy regulator
ANRE and public sector energy companies;
- Continue energy market liberalization and removes regulated prices for electric and gas
supply for non-residential consumers;
- Strengthen energy regulator ANRE‘s capacity, autonomy and accountability;
- Prepare an energy and climate change strategy
- Provide policy and legislative stability to increase investor confidence and lower the
perception of investment risks.
Supporting the restructuring of the district heating sector:
x
Develop and begin to implement a comprehensive investment and sector reform
program to address the multitudes of issues and constraints of the district heating
sector, within the overall framework of a long-term urban heating strategy. Some of the
reforms that need to be implemented to stem the further deterioration of district heating in
Romania include the following:
- Strategic reviews of local district heating systems to establish the most efficient and
cost-effective heat supply options, taking into account economic levels of fuel prices
and environmental costs of burning fuels, as well as modern heat and cogeneration
technologies, efficient and cost-effective distributed systems;
- Acceleration of electricity and natural gas price liberalization, maximizing the role of
the market in proper resource allocation;
- Abolishment of all price subsidies; only low-income families would receive targeted
subsidies in the form of cash payments within the social protection system and
possibly some support for energy-retrofit of their dwellings;
- Investment support for truly high-efficiency cogeneration in economically viable
district heating systems;
- Unification of district heating sector regulation under one regulator (ANRE);
- Introduction of a two-part (binomial) heat tariff system;
- Consumption-based billing at dwelling level for heat and hot water;
- Consideration of additional policies to “protect” district heating in areas where it is
already supplied and cost-effective.
Focus initial investment efforts on a few selected cities where 1) district heating is
deemed economically viable and competitive compared with distributed alternatives, and
2) local governments are committed to sector reforms. Thorough analyses need to be
carried out to determine whether a district heating system can be modernized to the point
of being efficient and competitive compared to distributed alternatives based on economic
costs and benefits before a funding decision is made. Under certain conditions,
modernization of district heating systems should be eligible for EU funding in the 2014-
2020 period.
Scaling-up energy efficiency investments:
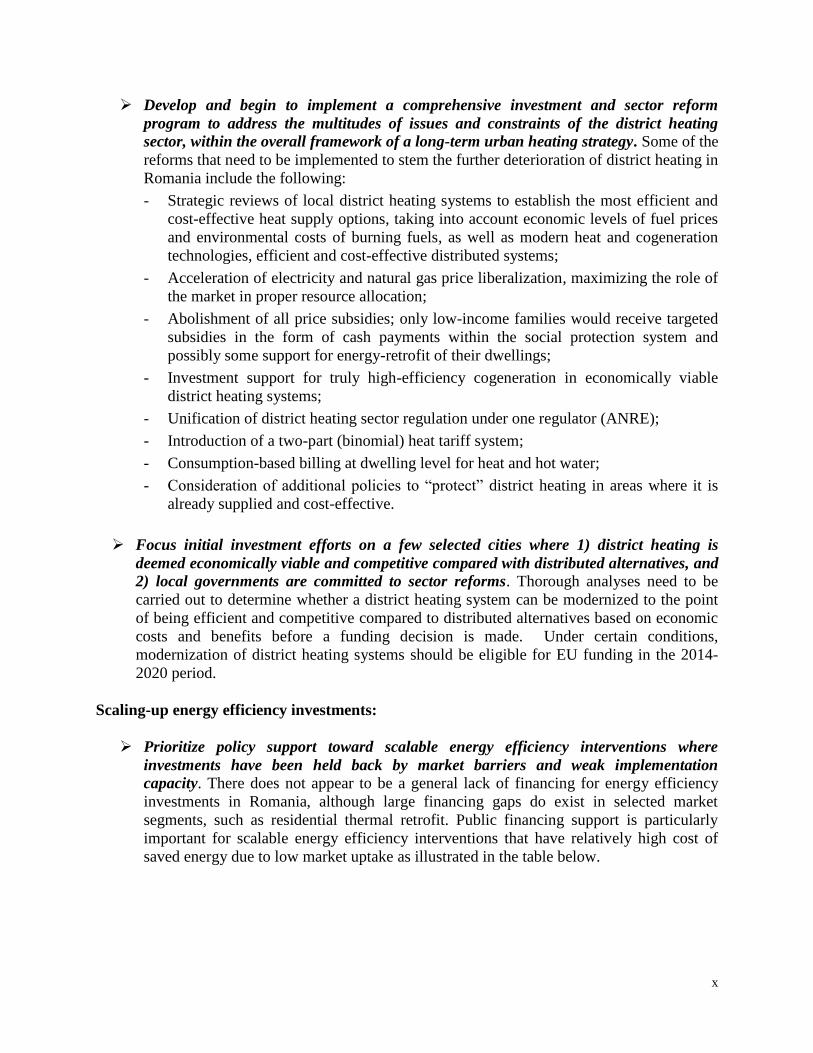
Prioritize policy support toward scalable energy efficiency interventions where
investments have been held back by market barriers and weak implementation
capacity. There does not appear to be a general lack of financing for energy efficiency
investments in Romania, although large financing gaps do exist in selected market
segments, such as residential thermal retrofit. Public financing support is particularly
important for scalable energy efficiency interventions that have relatively high cost of
saved energy due to low market uptake as illustrated in the table below.
xi
Scalability and cost of selected energy efficiency interventions
Cost of saved energy
Low Medium High
Ag
gre
ga
te p
ote
nti
al
en
erg
y s
av
ing
s
Hig
h Energy efficiency measures in
steel and chemicals
manufacturing
Energy efficiency of major
consumer appliances
Industrial motors energy
efficiency
Thermal retrofit of residential
buildings
Med
ium
Energy efficiency measures in
SMEs
Residential lighting (CFL)
Commercial lighting (CFL
and high performance T8)
Modernization of district
heating systems
Thermal retrofit of public
buildings, such as schools
Retrofit or new commercial
HVAC systems
New nZE buildings
Residential lighting (LED)
Commercial lighting (LED)
Lo
w
Public lighting (sodium lamp)
Energy efficiency in water
supply and wastewater
treatment
Public lighting (LED)
High efficiency residential
air conditioners
Match financing and delivery mechanism with specific sector needs and constraints.
Of particular interest in the long term is the use of financial instruments to increase the
leverage of public funds in energy efficiency investments in the public and residential
sectors, especially for the thermal retrofit of buildings. Increasing the role of energy
service companies (ESCOs) in delivery of energy efficiency projects also has the added
benefit of bringing in third party commercial financing, especially for public sector
energy efficiency investments. More specifically, the following should be considered for
financing:
- Manufacturing sector energy efficiency investments should in general be financed
through commercial means. Nevertheless, public funding in supporting information
dissemination, awareness raising and capacity building among key stakeholders
(enterprises, ESCOs and banks) has proven to be of catalytic value.
- A dedicated energy efficiency revolving fund for the public sector could be an
effective way of addressing some of the critical financing and implementation
constraints faced by municipal public entities while also helping nurture and develop
Romania’s nascent ESCO market. Such a fund may be seeded by a combination of
EU funds and government grants while also potentially attract private financing if
proven successful.
- A financing mechanism/platform that matches the needs for long-term (up to 20
years) and low interest rate loans in residential thermal retrofit while also providing
streamlined processing and necessary assistance to home owners associations (HOAs)
will help mitigate the challenges facing thermal retrofit programs in Romania. There
have been some successful operations of housing renovation loan funds in other EU
countries, which could inform the design of a similar program in Romania.
- As part of the transposition of the EE directive, the Romanian government should
also consider the introduction of energy efficiency obligations (EEOs), perhaps first
xii
on a limited basis, requiring that a certain fraction of energy savings is achieved
among vulnerable groups.
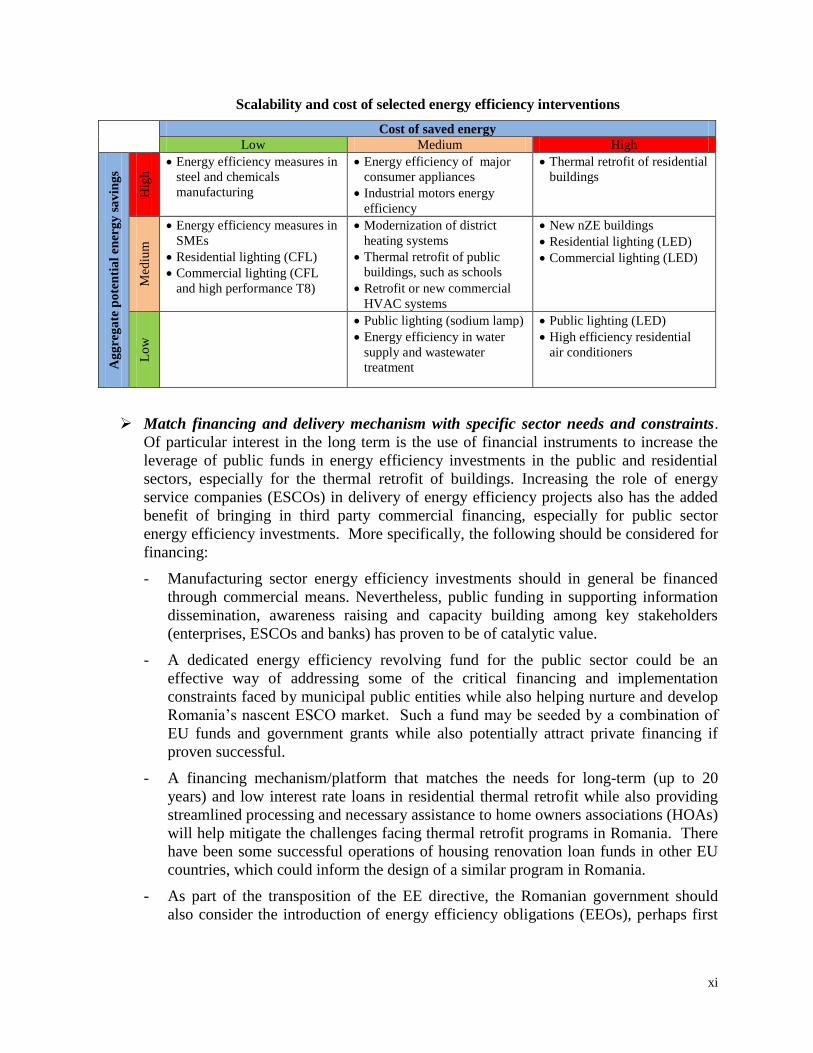
Match government support with critical needs. The characteristics of key government
support are summarized in the table below.
Key areas of
intervention
Critical constraints to scaling-
up EE investment Means of government support
Basic policies Subsidized energy prices Cost reflective prices (remove general price subsidies)
with targeted support for low-income families
Metering and consumption-
based billing
Requiring consumption-based billing as part of
district heating modernization investments
Lack of clear legal regulation of
ESCO contracts, lack of
deliberate policy support for
ESCOs, and insufficient market
recognition and credibility
Market development support efforts to improve the
credibility of ESCOs (such as accreditation and
certification) and access to project financing; changes
in public sector budgeting, accounting and
procurement regulations
Reliance on grant financing Expanded menu of support for energy efficiency:
monetary and non-monetary incentives, financial
instruments that leverage private financing
Institutional
support
Lack of EE planning, policy
implementation and supervision
capacity
Improved governance and strengthening of the EE
agency - either within ANRE or as re-establishment of
a separate EE agency
Selected energy-
intensive
manufacturing
Competing demands on funds,
sector restructuring, SOE
privatization in some industries
Long-term agreements
Information dissemination, awareness raising and
capacity building
Small and medium
enterprises
Information, creditworthiness,
credit terms
Support for audits and dedicated energy efficiency
credit line
Information dissemination, awareness raising and
capacity building
Residential thermal
retrofit
HOA credit-worthiness/ decision
making process, poverty/
affordability;
lack of information on building
stock and energy performance
City-level market assessment, program design and
implementation support
Dedicated financing mechanism with appropriate
blending of long-term and low-interest loans and
grants
TA/grants for engaging and informing HOAs,
preparing, supervising and monitoring projects
Public buildings
thermal retrofit
Lack of information and
capacity, budgeting/accounting/
procurement restrictions;
lack of information on building
stock and energy performance
Market assessment, program design and
implementation support for municipal public
buildings
Changes in budgeting, accounting and procurement
regulations
Dedicated financing mechanism with consideration of
introducing a revolving fund
nZE buildings Untested, new technologies Grants for demonstrations
Large appliances
upgrade
Up-front incremental cost EEOs, on-bill financing, rebates
Residential and
commercial
lighting upgrade
Poverty, up-front capital costs Ideal for EEOs, on-bill financing, rebates; regulation
to phase out incandescent lamps
Other municipal
services, such as
public lighting and
water supply
Access to financing PPPs, for example, ESCO arrangements
Energy assessment support to water utilities

xiii
1
1 The Energy Sector and Climate Change Mitigation in Romania
1.1 Energy sector contribution to greenhouse gas emissions
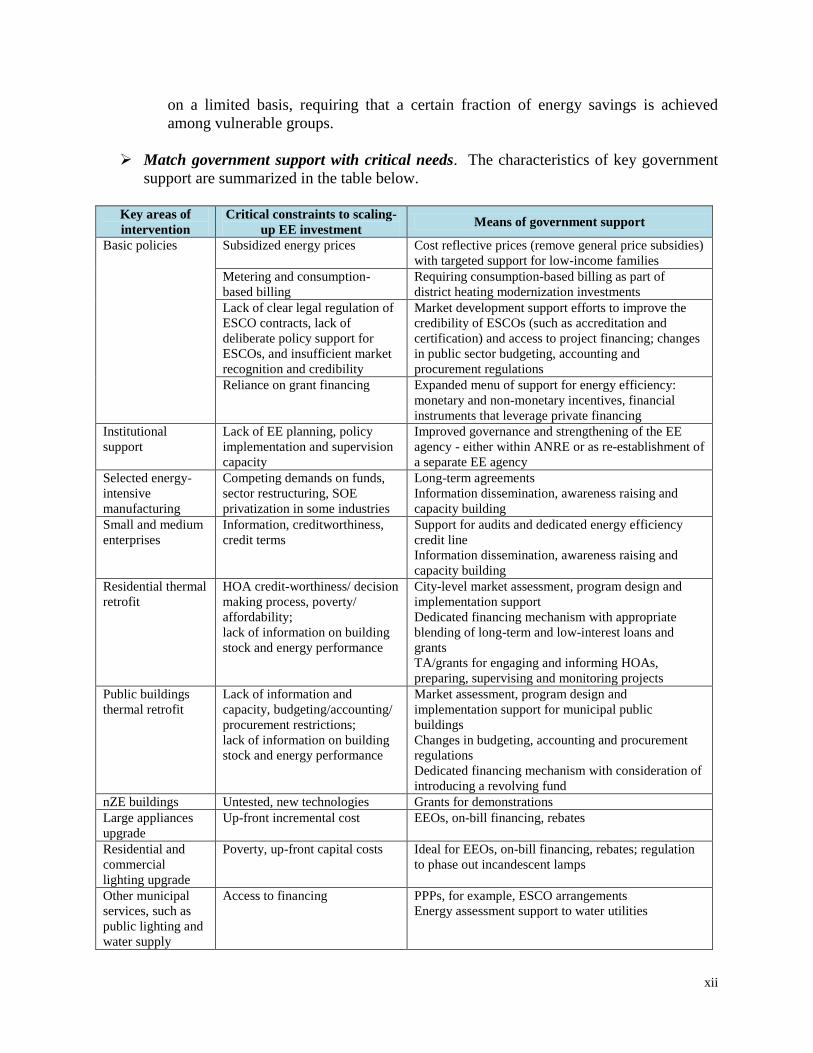
1. In Romania, the energy sector is responsible for 70% of total greenhouse gas (GHG)
emissions (excluding LULUCF1) and has contributed 70% of the overall GHG emission
reduction since 1989. Power and heat generation and non-transport fuel use contribute three
quarters of energy sector GHG emissions (Figure 1). The de-carbonization of the energy sector,
is essential to the success of climate change mitigation in Romania. This can occur through low-
carbon power and heat supply options as well through improved efficiency in energy conversion,
transmission, distribution and consumption,
Figure 1: The Energy Sector Dominates GHG Emissions in Romania
Source: MECC 2013
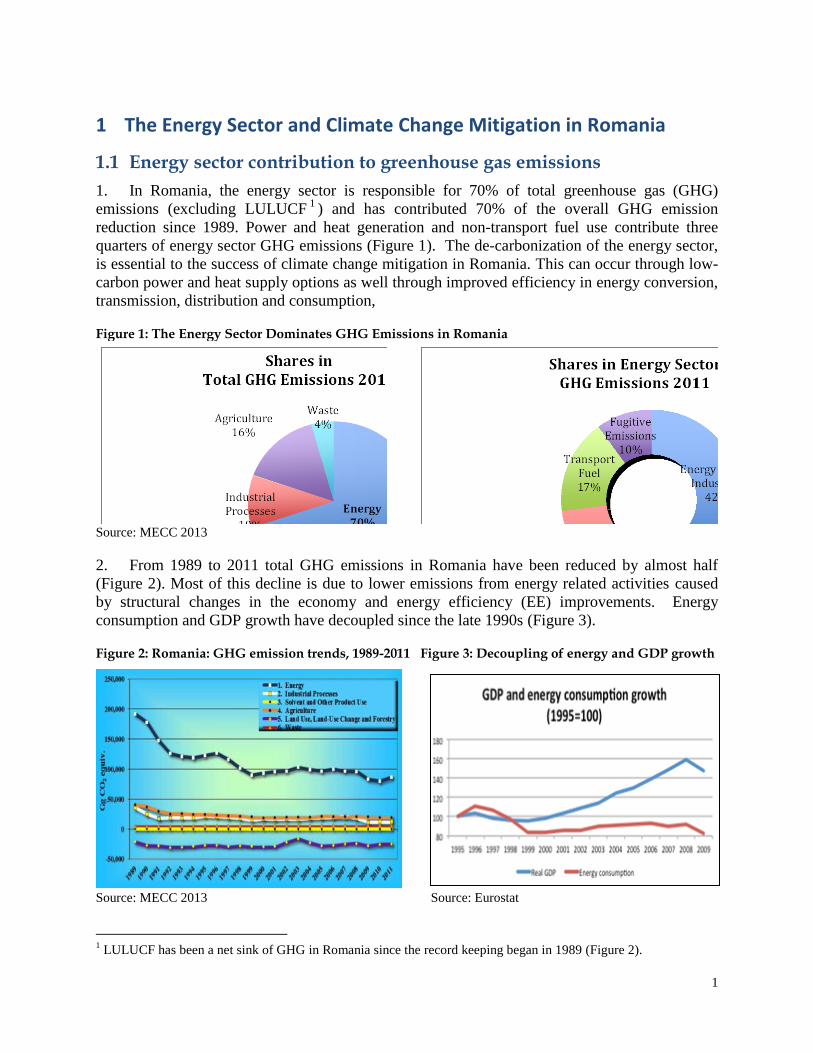
2. From 1989 to 2011 total GHG emissions in Romania have been reduced by almost half
(Figure 2). Most of this decline is due to lower emissions from energy related activities caused
by structural changes in the economy and energy efficiency (EE) improvements. Energy
consumption and GDP growth have decoupled since the late 1990s (Figure 3).
Figure 2: Romania: GHG emission trends, 1989-2011 Figure 3: Decoupling of energy and GDP growth
Source: MECC 2013 Source: Eurostat
1 LULUCF has been a net sink of GHG in Romania since the record keeping began in 1989 (Figure 2).
2
1.2 Main characteristics of energy supply and demand
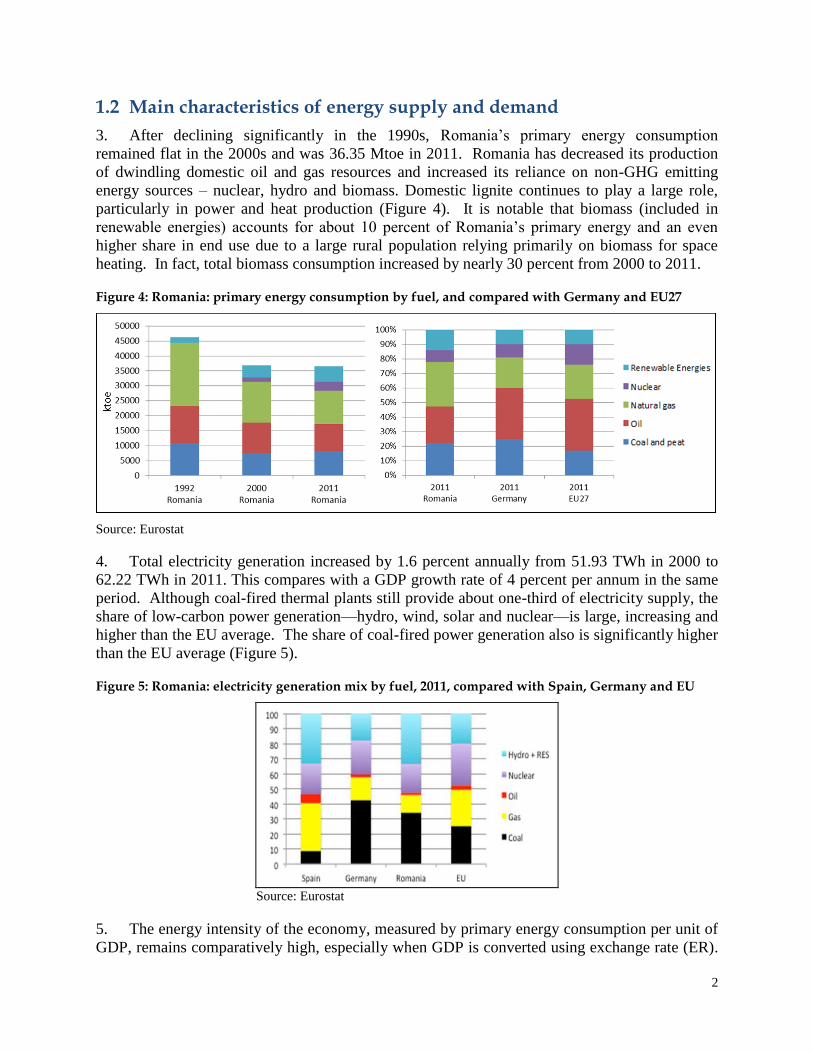
3. After declining significantly in the 1990s, Romania’s primary energy consumption
remained flat in the 2000s and was 36.35 Mtoe in 2011. Romania has decreased its production
of dwindling domestic oil and gas resources and increased its reliance on non-GHG emitting
energy sources – nuclear, hydro and biomass. Domestic lignite continues to play a large role,
particularly in power and heat production (Figure 4). It is notable that biomass (included in
renewable energies) accounts for about 10 percent of Romania’s primary energy and an even
higher share in end use due to a large rural population relying primarily on biomass for space
heating. In fact, total biomass consumption increased by nearly 30 percent from 2000 to 2011.
Figure 4: Romania: primary energy consumption by fuel, and compared with Germany and EU27
Source: Eurostat
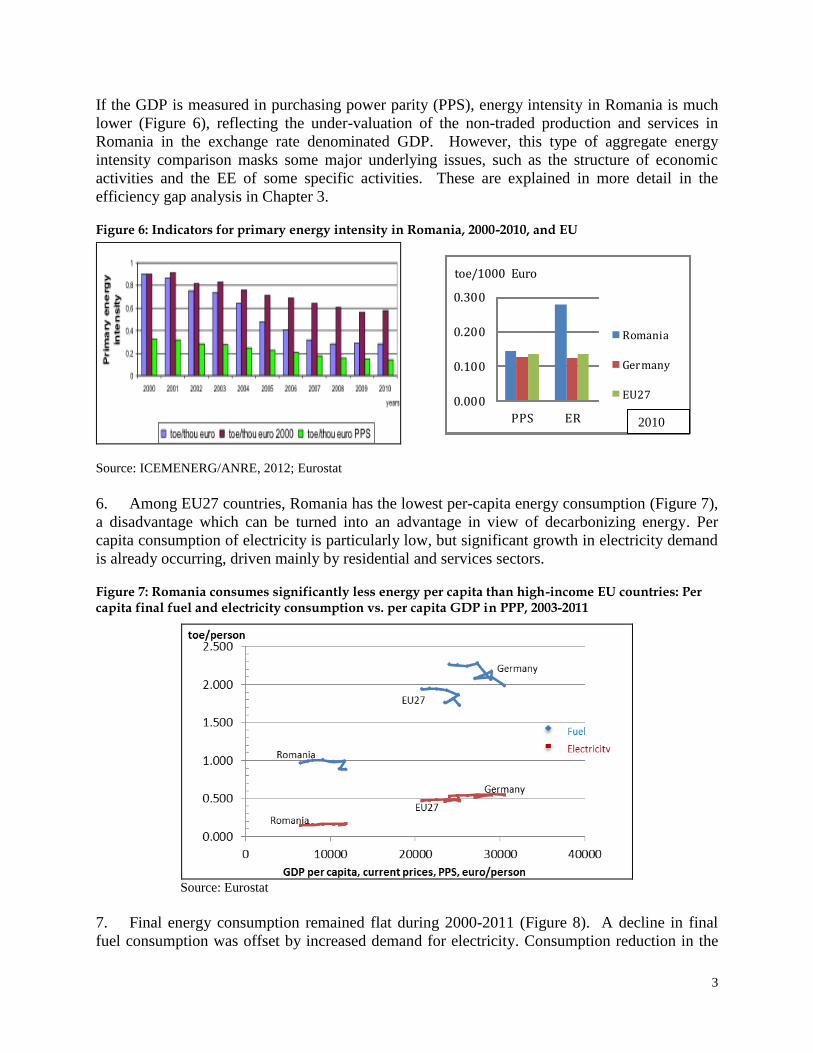
4. Total electricity generation increased by 1.6 percent annually from 51.93 TWh in 2000 to
62.22 TWh in 2011. This compares with a GDP growth rate of 4 percent per annum in the same
period. Although coal-fired thermal plants still provide about one-third of electricity supply, the
share of low-carbon power generation—hydro, wind, solar and nuclear—is large, increasing and
higher than the EU average. The share of coal-fired power generation also is significantly higher
than the EU average (Figure 5).
Figure 5: Romania: electricity generation mix by fuel, 2011, compared with Spain, Germany and EU
Source: Eurostat
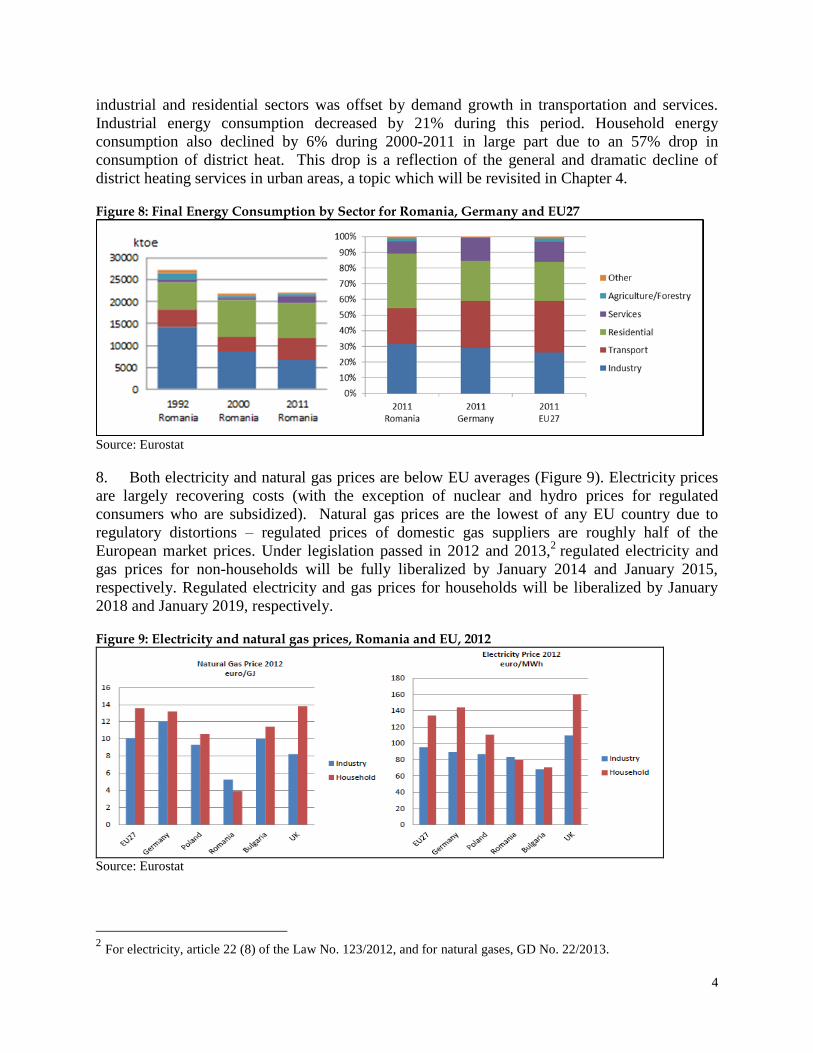
5. The energy intensity of the economy, measured by primary energy consumption per unit of
GDP, remains comparatively high, especially when GDP is converted using exchange rate (ER).
3
If the GDP is measured in purchasing power parity (PPS), energy intensity in Romania is much
lower (Figure 6), reflecting the under-valuation of the non-traded production and services in
Romania in the exchange rate denominated GDP. However, this type of aggregate energy
intensity comparison masks some major underlying issues, such as the structure of economic
activities and the EE of some specific activities. These are explained in more detail in the
efficiency gap analysis in Chapter 3.
Figure 6: Indicators for primary energy intensity in Romania, 2000-2010, and EU
0.000
0.100
0.200
0.300
PPS ER
toe/1000 Euro
Romania
Germany
EU27
Source: ICEMENERG/ANRE, 2012; Eurostat
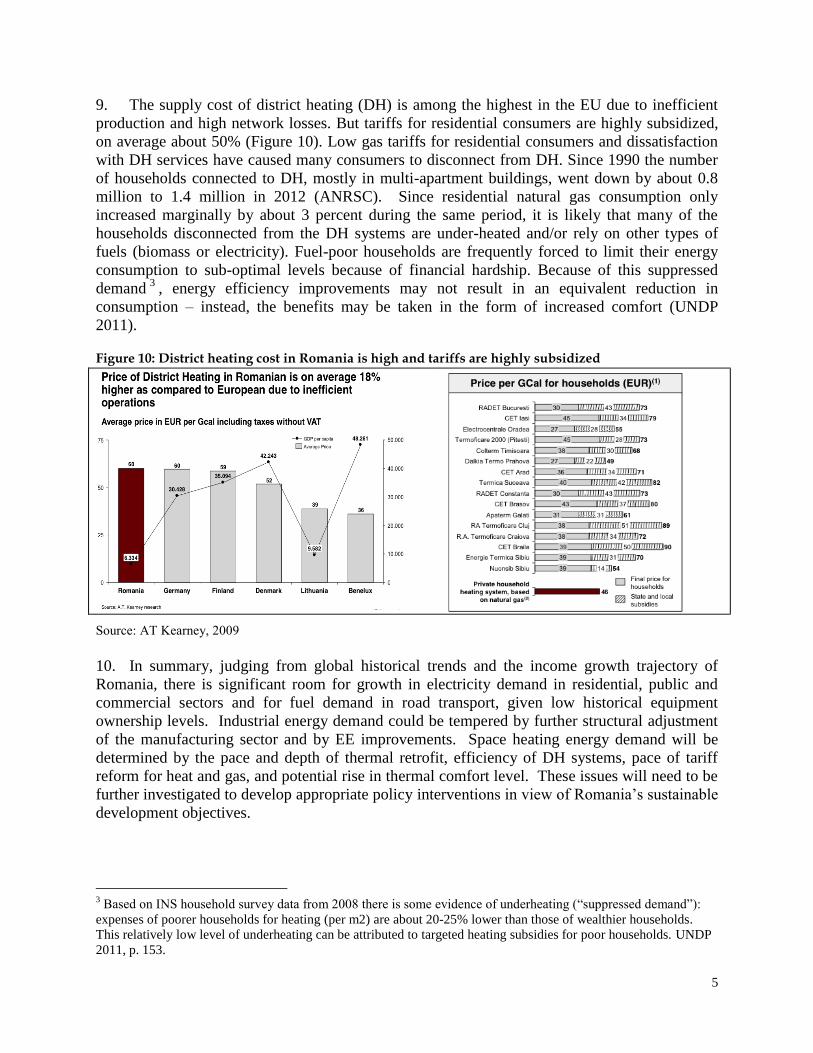
6. Among EU27 countries, Romania has the lowest per-capita energy consumption (Figure 7),
a disadvantage which can be turned into an advantage in view of decarbonizing energy. Per
capita consumption of electricity is particularly low, but significant growth in electricity demand
is already occurring, driven mainly by residential and services sectors.
Figure 7: Romania consumes significantly less energy per capita than high-income EU countries: Per capita final fuel and electricity consumption vs. per capita GDP in PPP, 2003-2011
Source: Eurostat
7. Final energy consumption remained flat during 2000-2011 (Figure 8). A decline in final
fuel consumption was offset by increased demand for electricity. Consumption reduction in the
2010
4
industrial and residential sectors was offset by demand growth in transportation and services.
Industrial energy consumption decreased by 21% during this period. Household energy
consumption also declined by 6% during 2000-2011 in large part due to an 57% drop in
consumption of district heat. This drop is a reflection of the general and dramatic decline of
district heating services in urban areas, a topic which will be revisited in Chapter 4.
Figure 8: Final Energy Consumption by Sector for Romania, Germany and EU27
Source: Eurostat
8. Both electricity and natural gas prices are below EU averages (Figure 9). Electricity prices
are largely recovering costs (with the exception of nuclear and hydro prices for regulated
consumers who are subsidized). Natural gas prices are the lowest of any EU country due to
regulatory distortions – regulated prices of domestic gas suppliers are roughly half of the
European market prices. Under legislation passed in 2012 and 2013,2 regulated electricity and
gas prices for non-households will be fully liberalized by January 2014 and January 2015,
respectively. Regulated electricity and gas prices for households will be liberalized by January
2018 and January 2019, respectively.
Figure 9: Electricity and natural gas prices, Romania and EU, 2012
Source: Eurostat
2 For electricity, article 22 (8) of the Law No. 123/2012, and for natural gases, GD No. 22/2013.
5
9. The supply cost of district heating (DH) is among the highest in the EU due to inefficient
production and high network losses. But tariffs for residential consumers are highly subsidized,
on average about 50% (Figure 10). Low gas tariffs for residential consumers and dissatisfaction
with DH services have caused many consumers to disconnect from DH. Since 1990 the number
of households connected to DH, mostly in multi-apartment buildings, went down by about 0.8
million to 1.4 million in 2012 (ANRSC). Since residential natural gas consumption only
increased marginally by about 3 percent during the same period, it is likely that many of the
households disconnected from the DH systems are under-heated and/or rely on other types of
fuels (biomass or electricity). Fuel-poor households are frequently forced to limit their energy
consumption to sub-optimal levels because of financial hardship. Because of this suppressed
demand3
, energy efficiency improvements may not result in an equivalent reduction in
consumption – instead, the benefits may be taken in the form of increased comfort (UNDP
2011).
Figure 10: District heating cost in Romania is high and tariffs are highly subsidized
Source: AT Kearney, 2009
10. In summary, judging from global historical trends and the income growth trajectory of
Romania, there is significant room for growth in electricity demand in residential, public and
commercial sectors and for fuel demand in road transport, given low historical equipment
ownership levels. Industrial energy demand could be tempered by further structural adjustment
of the manufacturing sector and by EE improvements. Space heating energy demand will be
determined by the pace and depth of thermal retrofit, efficiency of DH systems, pace of tariff
reform for heat and gas, and potential rise in thermal comfort level. These issues will need to be
further investigated to develop appropriate policy interventions in view of Romania’s sustainable
development objectives.
3 Based on INS household survey data from 2008 there is some evidence of underheating (“suppressed demand”):
expenses of poorer households for heating (per m2) are about 20-25% lower than those of wealthier households.
This relatively low level of underheating can be attributed to targeted heating subsidies for poor households. UNDP
2011, p. 153.
6
1.3 EU priorities and targets for sustainable energy in 2020 and Romania’s commitments
11. The European Union sets the framework for the sustainable energy policies of its member
states. The overarching long-term goal is the commitment of the EU to reduce GHG emissions to
80-95% below 1990 levels by 2050. The two main pathways to reach this goal are investments in
low-carbon and smart energy infrastructure and in the efficient use of energy (Table 1).
Table 1: EU measures to reduce GHG emissions
Low-carbon and smart energy infrastructure Efficient use of energy
Electricity and heat generation from low-carbon
sources, especially renewables
Energy efficiency in buildings, especially heat energy
savings in existing buildings
Smart grids and smart meters Industrial energy efficiency
Electricity storage technologies Energy efficiency in transport
Efficiency in energy supply, especially
generation of heat and electricity
12. The medium-term EU energy and climate policy is expressed in the 20-20-20 targets that
were adopted in 2007. By 2020, GHG emissions should be 20% below 1990 levels; renewable
energy (RE) should reach a share of 20% of final energy consumption, and primary energy
consumption should be reduced by 20%, compared with the projected baseline (Table 2).
Table 2: EU and Romanian 20-20-20 targets and current status
Greenhouse Gas Emissions Renewable Energy (RE) Energy Efficiency
EU 2020 target Reduce emissions by 20% by
2020, compared to 1990
RE sources contribute to
20% of final energy
consumption
Reduce primary energy
consumption from the
baseline by 20%
Romania 2020 target Reduce emissions by 20% by
2020, compared to 1990
RE sources contribute to
24% of final energy
consumption
Reduce primary energy
consumption from the
baseline by 19% (10 MToe)
Romania actual
status in 2012
Actual emissions are down
by 52% in 2011, compared to
1990
RE accounts for 20.8% of
final energy consumption
Actual primary energy
consumption is down by
16.6% from the baseline
13. Romania’s GHG emissions in 2011 were far below its 2020 reduction target. GHG
emissions are expected to rebound due to increasing primary energy demand, driven primarily by
transport. But the rebound is unlikely to threaten the 2020 GHG target. Romania is close to the
other two targets now and appears to be poised to achieve them. These general figures partially
reflect a relatively carbon-intensive economy that suffered a huge contraction. Romania has a
real interest to continue to reduce the carbon intensity of the economy by increasing low-carbon
energy supplies and improving EE in both supply and demand sides. The EE target is discussed
in more detail in Box 1.
7
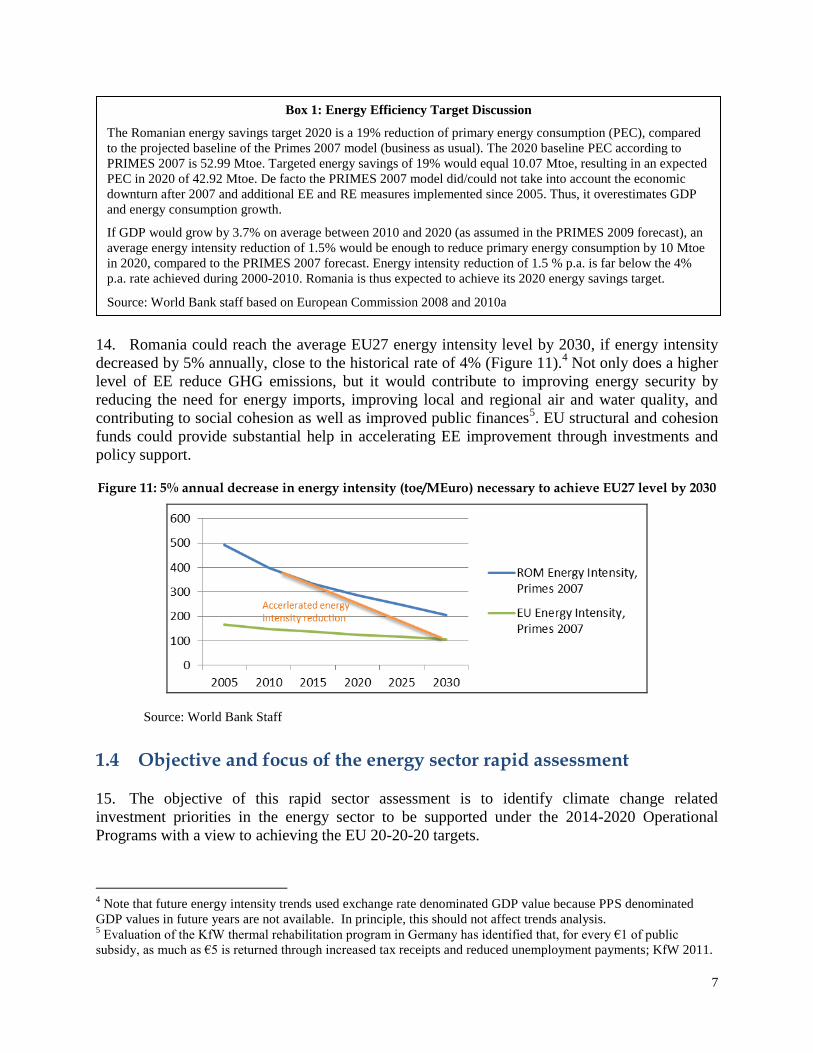
14. Romania could reach the average EU27 energy intensity level by 2030, if energy intensity
decreased by 5% annually, close to the historical rate of 4% (Figure 11).4 Not only does a higher
level of EE reduce GHG emissions, but it would contribute to improving energy security by
reducing the need for energy imports, improving local and regional air and water quality, and
contributing to social cohesion as well as improved public finances5. EU structural and cohesion
funds could provide substantial help in accelerating EE improvement through investments and
policy support.
Figure 11: 5% annual decrease in energy intensity (toe/MEuro) necessary to achieve EU27 level by 2030
Source: World Bank Staff
1.4 Objective and focus of the energy sector rapid assessment
15. The objective of this rapid sector assessment is to identify climate change related
investment priorities in the energy sector to be supported under the 2014-2020 Operational
Programs with a view to achieving the EU 20-20-20 targets.
4 Note that future energy intensity trends used exchange rate denominated GDP value because PPS denominated
GDP values in future years are not available. In principle, this should not affect trends analysis. 5 Evaluation of the KfW thermal rehabilitation program in Germany has identified that, for every €1 of public
subsidy, as much as €5 is returned through increased tax receipts and reduced unemployment payments; KfW 2011.
Box 1: Energy Efficiency Target Discussion
The Romanian energy savings target 2020 is a 19% reduction of primary energy consumption (PEC), compared
to the projected baseline of the Primes 2007 model (business as usual). The 2020 baseline PEC according to
PRIMES 2007 is 52.99 Mtoe. Targeted energy savings of 19% would equal 10.07 Mtoe, resulting in an expected
PEC in 2020 of 42.92 Mtoe. De facto the PRIMES 2007 model did/could not take into account the economic
downturn after 2007 and additional EE and RE measures implemented since 2005. Thus, it overestimates GDP
and energy consumption growth.
If GDP would grow by 3.7% on average between 2010 and 2020 (as assumed in the PRIMES 2009 forecast), an
average energy intensity reduction of 1.5% would be enough to reduce primary energy consumption by 10 Mtoe
in 2020, compared to the PRIMES 2007 forecast. Energy intensity reduction of 1.5 % p.a. is far below the 4%
p.a. rate achieved during 2000-2010. Romania is thus expected to achieve its 2020 energy savings target.
Source: World Bank staff based on European Commission 2008 and 2010a
8
16. The energy assessment focuses on the climate change mitigation opportunities and
investment priorities in power and heat generation and in manufacturing, residential, public and
commercial sectors. Energy use in agriculture and forestry, which account for less than 2 percent
of total final energy consumption, is not analyzed. Energy use and efficiency in the transport
sector is analyzed in a separate transport sector rapid assessment.
17. Overall energy supply optimization and several important demand-side EE issues, including
thermal retrofit for residential, public and commercial buildings and district heating system
modernization, will need to be investigated in more detail (beyond the rapid assessment) to
develop specific policy recommendations and intervention programs.
9
2 Low-carbon Investment Priorities and Policy Support in the Electric Power Sector
2.1 Technologies, infrastructure and sector management
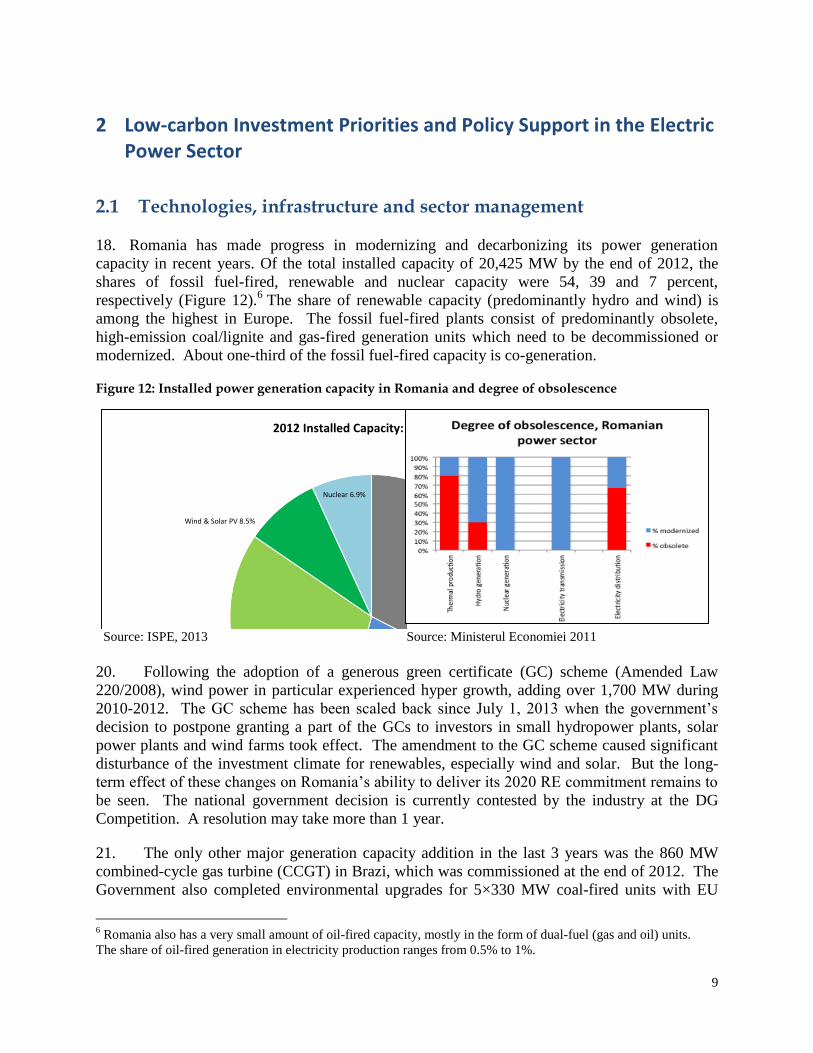
18. Romania has made progress in modernizing and decarbonizing its power generation
capacity in recent years. Of the total installed capacity of 20,425 MW by the end of 2012, the
shares of fossil fuel-fired, renewable and nuclear capacity were 54, 39 and 7 percent,
respectively (Figure 12).6 The share of renewable capacity (predominantly hydro and wind) is
among the highest in Europe. The fossil fuel-fired plants consist of predominantly obsolete,
high-emission coal/lignite and gas-fired generation units which need to be decommissioned or
modernized. About one-third of the fossil fuel-fired capacity is co-generation.
Figure 12: Installed power generation capacity in Romania and degree of obsolescence
Coal/Lignite 32.6%
Natural Gas 21.6%
Hydro 30.4%
Wind & Solar PV 8.5%
Nuclear 6.9%
2012 Installed Capacity: 20,425 MW
Source: ISPE, 2013 Source: Ministerul Economiei 2011
20. Following the adoption of a generous green certificate (GC) scheme (Amended Law
220/2008), wind power in particular experienced hyper growth, adding over 1,700 MW during
2010-2012. The GC scheme has been scaled back since July 1, 2013 when the government’s
decision to postpone granting a part of the GCs to investors in small hydropower plants, solar
power plants and wind farms took effect. The amendment to the GC scheme caused significant
disturbance of the investment climate for renewables, especially wind and solar. But the long-
term effect of these changes on Romania’s ability to deliver its 2020 RE commitment remains to
be seen. The national government decision is currently contested by the industry at the DG
Competition. A resolution may take more than 1 year.
21. The only other major generation capacity addition in the last 3 years was the 860 MW
combined-cycle gas turbine (CCGT) in Brazi, which was commissioned at the end of 2012. The
Government also completed environmental upgrades for 5×330 MW coal-fired units with EU
6 Romania also has a very small amount of oil-fired capacity, mostly in the form of dual-fuel (gas and oil) units.
The share of oil-fired generation in electricity production ranges from 0.5% to 1%.
10
financing. Despite formal political commitments, successive Governments have not managed to
move forward on a series of major projects, including Energonuclear (2×700 MW nuclear
reactors in Cernavodă), seven planned PPPs for thermal generation, and the Tarnița-Lăpuștești
pump storage station (4×250 MW).
22. Romania’s power sector follows the model of liberalized wholesale and retail markets.
Electricity production is unbundled from transmission (Transelectrica). On the wholesale market
there are over 60 active suppliers. Half of the market is liberalized; the other, “captive” segment
(which is regulated both on the wholesale and retail levels) follows a liberalization schedule that
would be completed by the end of 2013 for industrial consumers and by the end of 2017 for
residential users. Legally, regulated consumers have been free to switch suppliers since 2007, but
chose not to do so because regulated prices are well below the free market prices. The current
liberalization schedule gradually reduces the differential between regulated and market prices.
The national regulator ANRE sets and oversees market rules, non-discriminatory access, and
tariff regulation.
23. Power generation is dominated by six large state-owned companies administered by the
Ministry of Economy. They are divided by fuel type (lignite – Oltenia, hard coal – Hunedoara,
hydropower – Hidroelectrica, nuclear – Nuclearelectrica, and several gas-fired units in ELCEN
and Romgaz). There are a few combined heat and power plants owned by municipalities. The
private sector dominates the new and fast growing wind and solar market. Major private
producers include Petrom (the CCGT plant in Brazi) and CEZ (which has a 600 MW wind farm).
24. The TSO Transelectrica, previously under the Ministry of Economy, has been recently
transferred in 2013 to the Ministry of Finance to meet EU’s condition on ownership unbundling
of TSO from producers. The distribution network consists of 8 regional companies of which 5
are private and 3 remain state-owned under Electrica. The power exchange OPCOM has been
operating since 2000 and has developed into a well-functioning, transparent platform on par with
other European exchanges, with day-ahead and term prices following EU trends.
25. The transmission grid has been modernized in the early 2000s and is largely in line with
EU standards. Additional reinforcements and upgrading are necessary to accommodate the new
and fast growing intermittent renewable capacity. Following partial privatization, a total of EUR
1.7 billion was invested in the distribution system during 2005-2010. Substantially more
investments are still needed in rehabilitating and modernizing the electric distribution network,
where 60 percent of the physical assets are deemed obsolete. Additional investments are also
needed to introduce smart grids and smart metering and to allow direct connection of future
distributed energy sources to distribution grids.
2.2 Alternative scenarios for achieving EU 2020 target for renewable energy
26. Romania has committed to achieving a 24% RE share in final energy consumption. This
translates into a target for renewables (hydro, wind, solar and others) to contribute to 38% of
total electricity production in 2020. The Government also committed to closing down or
11
modernizing large fossil fuel-fired plants.7 The Government has a draft energy strategy (2011-
2035) that would allow it to meet the EU targets. However, some of the measures proposed by
the Government would be difficult to implement. An alternative scenario was constructed by the
assessment team to demonstrate a pathway which could avoid those implementation difficulties
and still meet the EU RE target. This alternative scenario was compared with the Government’s
draft plan in this assessment.
27. Government draft plan (Scenario A). In order to achieve its climate change targets, the
Government proposed a power sector development plan for 2020, in the Draft 2011-2035 Energy
Strategy. Though not formally approved as a Strategy, the major projects identified in the draft
strategy have been announced by the Government as the official development plan for the energy
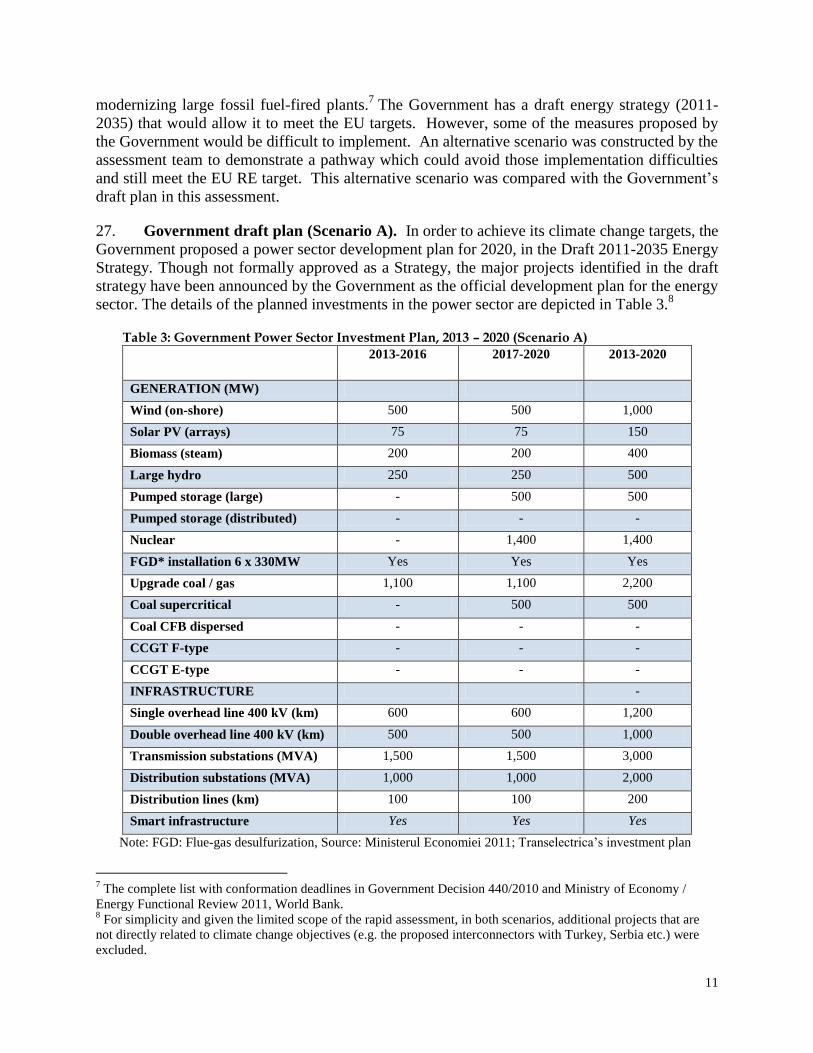
sector. The details of the planned investments in the power sector are depicted in Table 3.8
Table 3: Government Power Sector Investment Plan, 2013 – 2020 (Scenario A) 2013-2016 2017-2020 2013-2020
GENERATION (MW)
Wind (on-shore) 500 500 1,000
Solar PV (arrays) 75 75 150
Biomass (steam) 200 200 400
Large hydro 250 250 500
Pumped storage (large) - 500 500
Pumped storage (distributed) - - -
Nuclear - 1,400 1,400
FGD* installation 6 x 330MW Yes Yes Yes
Upgrade coal / gas 1,100 1,100 2,200
Coal supercritical - 500 500
Coal CFB dispersed - - -
CCGT F-type - - -
CCGT E-type - - -
INFRASTRUCTURE -
Single overhead line 400 kV (km) 600 600 1,200
Double overhead line 400 kV (km) 500 500 1,000
Transmission substations (MVA) 1,500 1,500 3,000
Distribution substations (MVA) 1,000 1,000 2,000
Distribution lines (km) 100 100 200
Smart infrastructure Yes Yes Yes
Note: FGD: Flue-gas desulfurization, Source: Ministerul Economiei 2011; Transelectrica’s investment plan
7 The complete list with conformation deadlines in Government Decision 440/2010 and Ministry of Economy /
Energy Functional Review 2011, World Bank. 8 For simplicity and given the limited scope of the rapid assessment, in both scenarios, additional projects that are
not directly related to climate change objectives (e.g. the proposed interconnectors with Turkey, Serbia etc.) were
excluded.
12
28. The planned investments in new generation capacity would cover the increase in demand
and offset the expected phasing out of 5,500 MW of old thermal plants by 2020. The draft
strategy and other official documents did not include cost estimates, nor did they detail
investments in transmission and distribution infrastructure to accommodate the new capacities.
29. The Government’s program has two main risks. First, the planned nuclear plant is
unlikely to be constructed by 2020. EnergoNuclear, the project company formed to construct the
two additional units at Cernavoda, failed to reach agreement with the Government after two
years of discussions. Efforts to attract new investors have not yet materialized. Even if new
partners with investment capital are found, the construction is expected to be completed after
2020 and possibly using a different technology. The Fukushima disaster in 2011 heightened the
uncertainty in financing as banks became reluctant to lend money for nuclear projects. Second,
the planned upgrading of 2,200 MW coal-fired units is likely to be uneconomic based on past
experience and would not be an optimal solution for increasing generation efficiency and
reducing emissions.9
30. Proposed alternative (Scenario B). Given the difficulties to realize the Government’s
nuclear plan by 2020, and the risks associated with the rehabilitation of thermal units with no
technology improvements, an alternative approach to meet the generation gap is proposed (Table
4). Due to the limited scope of this rapid assessment, the alternative was not determined by an
optimization modeling exercise but through a cost of technology screening process and
implementation feasibility assessment.
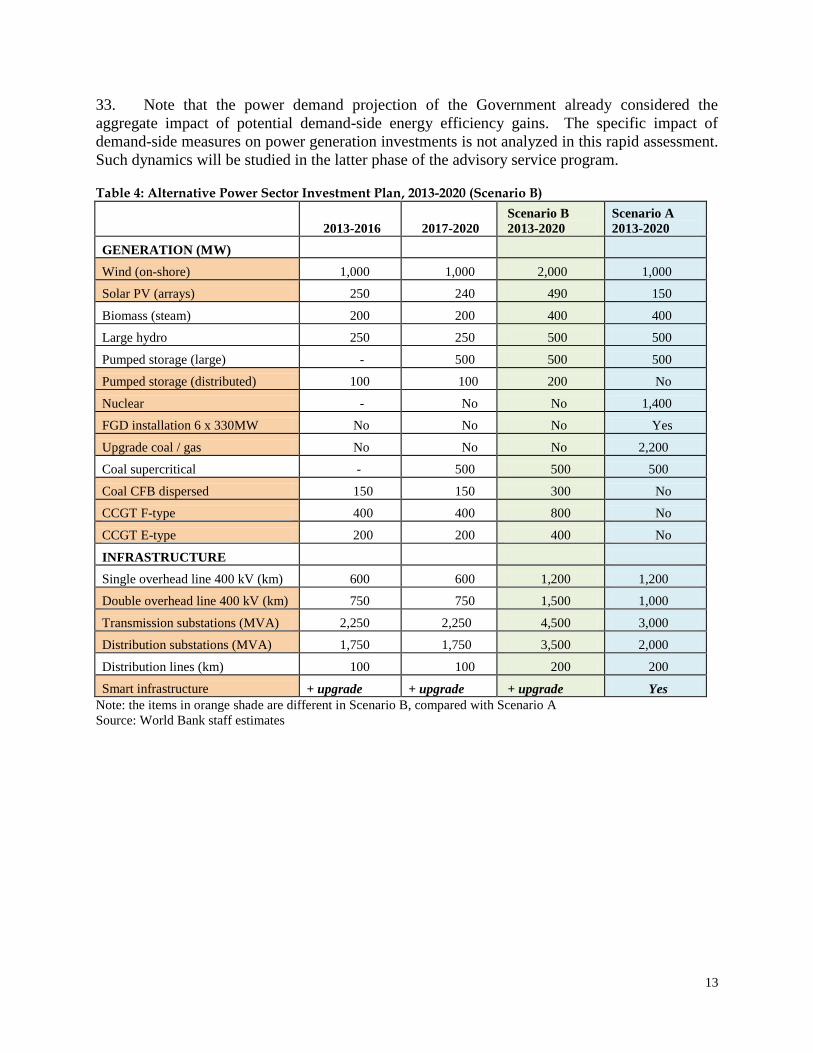
31. The proposed alternative (Scenario B) differs from the government plan (Scenario A) in
the following respects:
the two additional nuclear units are not considered, neither is the upgrading of 2,200MW
coal-fired units;
significantly higher investments in wind and solar PV, more than double the capacity
planned by the government;
significantly higher investments in flexible conventional power generation to enable
increased system load of intermittent renewables, including distributed pumped storage,
dispersed (small and medium size) gas-fired combined cycle power plants, and a limited
number of circulating fluidized bed (CFB) combustion units working in cogeneration
mode;
additional investments in grid infrastructure to integrate intermittent renewables; and
additional investments in reduction of distribution losses.
32. The alternative scenario aims to achieve the same power output10
as the Government’s
plan but with less CO2 emissions and lower levelized energy cost (Figure 13). This is achieved
in large part through a significant increase in high-efficiency gas-fired capacity and an increased
capacity factor of gas- and coal-fired units in the alternative scenario.
9 Thermal units ‘rehabilitated’ in the last 20 years (at Borzesti, Doicesti, Braila, Brazi, Bucharest South, Brasov, Iasi,
Suceava, Oradea, Mintia etc power plants), except for the 330 MW lignite-fired units, have proved to be
uneconomic due to their high generation costs and remained largely out of operation even after ‘rehabilitation’. 10
The power demand forecast is based on a 19% reduction of primary energy consumption by 2020 (see Box 1).
13
33. Note that the power demand projection of the Government already considered the
aggregate impact of potential demand-side energy efficiency gains. The specific impact of
demand-side measures on power generation investments is not analyzed in this rapid assessment.
Such dynamics will be studied in the latter phase of the advisory service program.
Table 4: Alternative Power Sector Investment Plan, 2013-2020 (Scenario B)
2013-2016 2017-2020
Scenario B
2013-2020
Scenario A
2013-2020
GENERATION (MW)
Wind (on-shore) 1,000 1,000 2,000 1,000
Solar PV (arrays) 250 240 490 150
Biomass (steam) 200 200 400 400
Large hydro 250 250 500 500
Pumped storage (large) - 500 500 500
Pumped storage (distributed) 100 100 200 No
Nuclear - No No 1,400
FGD installation 6 x 330MW No No No Yes
Upgrade coal / gas No No No 2,200
Coal supercritical - 500 500 500
Coal CFB dispersed 150 150 300 No
CCGT F-type 400 400 800 No
CCGT E-type 200 200 400 No
INFRASTRUCTURE
Single overhead line 400 kV (km) 600 600 1,200 1,200
Double overhead line 400 kV (km) 750 750 1,500 1,000
Transmission substations (MVA) 2,250 2,250 4,500 3,000
Distribution substations (MVA) 1,750 1,750 3,500 2,000
Distribution lines (km) 100 100 200 200
Smart infrastructure + upgrade + upgrade + upgrade Yes
Note: the items in orange shade are different in Scenario B, compared with Scenario A
Source: World Bank staff estimates
14
Figure 13: Power Output in Government Plan (left) and in Alternative Scenario (right)
Source: Ministerul Economiei 2011 and World Bank estimates
2.3 Analysis of investment options and needs during 2014-2020
33. To compare the costs of the two scenarios, the META model developed by the Energy
Sector Management Assistance Program (ESMAP) of the World Bank was used. 11
The costs of
the two scenarios were estimated using data from META and are presented in Table 5.12
For
several figures (nuclear generation; large hydro; pumped storage; and T&D), some upward cost
adjustments were necessary to better reflect Romania’s current conditions, using the most recent
official estimates for specific projects such as Tarnița or Cernavodă Units 3 and 4.
34. Overall, the proposed alternative (Scenario B) costs EUR 2 billion less than the
government plan (Scenario A), and balances investments more evenly during the two sub-
periods. The main difference arises from the proposed alternative to the 2 x 700 MW reactors in
Cernavodă (where cost estimates have increased significantly after the failure of the
Energonuclear consortium and after the Fukushima disaster). The proposed alternative is also
cheaper in terms of both levelized cost of energy and emission costs, at a post-2020 cost for CO2
emissions (23 EUR/t, or 30 USD/t, the assumption used in the META model). For higher CO2
prices, the benefit would increase proportionally.
35. The savings in terms of emissions seem relatively low in the alternative scenario for two
main reasons. First, the Government’s nuclear program would have ensured a higher share of
11
Model for Electricity Technology Assessments, http://www.esmap.org/node/3051. The META model is an
instrument to determine consistent performance and cost estimates for power generation and delivery technologies,
taking into account specific differences among countries. Costs are denominated in end-2010 USD values. The
model provides, by technology, estimates of unit investment costs; O&M; environmental costs; levelized costs per
MWh by technology (annualized total costs per MWh, which includes capital investments, emissions, operation and
maintenance, fuel) and levelized transmission and distribution costs. Thus, the model allows the costing of various
options/scenarios and prioritization of options proposed by the user, but without generating by itself a complete
integrated optimal solution for the power system. 12
Both scenarios focus on the development up to 2020 to meet the forecasted energy demand and exports within the
limits of the EU climate change policy. The analysis focused mostly on differences between the scenarios and did
not examine additional projects that are important in both scenarios, such as grid interconnections with Turkey,
Serbia and Moldova.
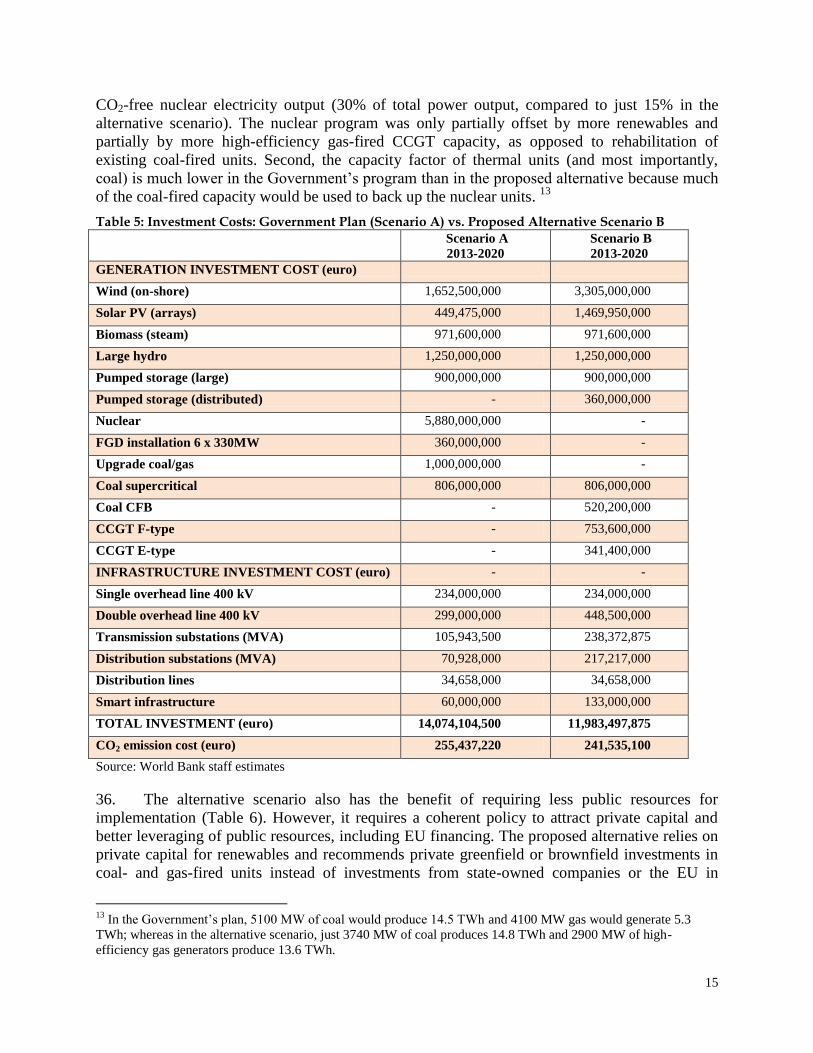
15
CO2-free nuclear electricity output (30% of total power output, compared to just 15% in the
alternative scenario). The nuclear program was only partially offset by more renewables and
partially by more high-efficiency gas-fired CCGT capacity, as opposed to rehabilitation of
existing coal-fired units. Second, the capacity factor of thermal units (and most importantly,
coal) is much lower in the Government’s program than in the proposed alternative because much
of the coal-fired capacity would be used to back up the nuclear units. 13
Table 5: Investment Costs: Government Plan (Scenario A) vs. Proposed Alternative Scenario B Scenario A
2013-2020
Scenario B
2013-2020
GENERATION INVESTMENT COST (euro)
Wind (on-shore) 1,652,500,000 3,305,000,000
Solar PV (arrays) 449,475,000 1,469,950,000
Biomass (steam) 971,600,000 971,600,000
Large hydro 1,250,000,000 1,250,000,000
Pumped storage (large) 900,000,000 900,000,000
Pumped storage (distributed) - 360,000,000
Nuclear 5,880,000,000 -
FGD installation 6 x 330MW 360,000,000 -
Upgrade coal/gas 1,000,000,000 -
Coal supercritical 806,000,000 806,000,000
Coal CFB - 520,200,000
CCGT F-type - 753,600,000
CCGT E-type - 341,400,000
INFRASTRUCTURE INVESTMENT COST (euro) - -
Single overhead line 400 kV 234,000,000 234,000,000
Double overhead line 400 kV 299,000,000 448,500,000
Transmission substations (MVA) 105,943,500 238,372,875
Distribution substations (MVA) 70,928,000 217,217,000
Distribution lines 34,658,000 34,658,000
Smart infrastructure 60,000,000 133,000,000
TOTAL INVESTMENT (euro) 14,074,104,500 11,983,497,875
CO2 emission cost (euro) 255,437,220 241,535,100
Source: World Bank staff estimates
36. The alternative scenario also has the benefit of requiring less public resources for
implementation (Table 6). However, it requires a coherent policy to attract private capital and
better leveraging of public resources, including EU financing. The proposed alternative relies on
private capital for renewables and recommends private greenfield or brownfield investments in
coal- and gas-fired units instead of investments from state-owned companies or the EU in
13
In the Government’s plan, 5100 MW of coal would produce 14.5 TWh and 4100 MW gas would generate 5.3
TWh; whereas in the alternative scenario, just 3740 MW of coal produces 14.8 TWh and 2900 MW of high-
efficiency gas generators produce 13.6 TWh.
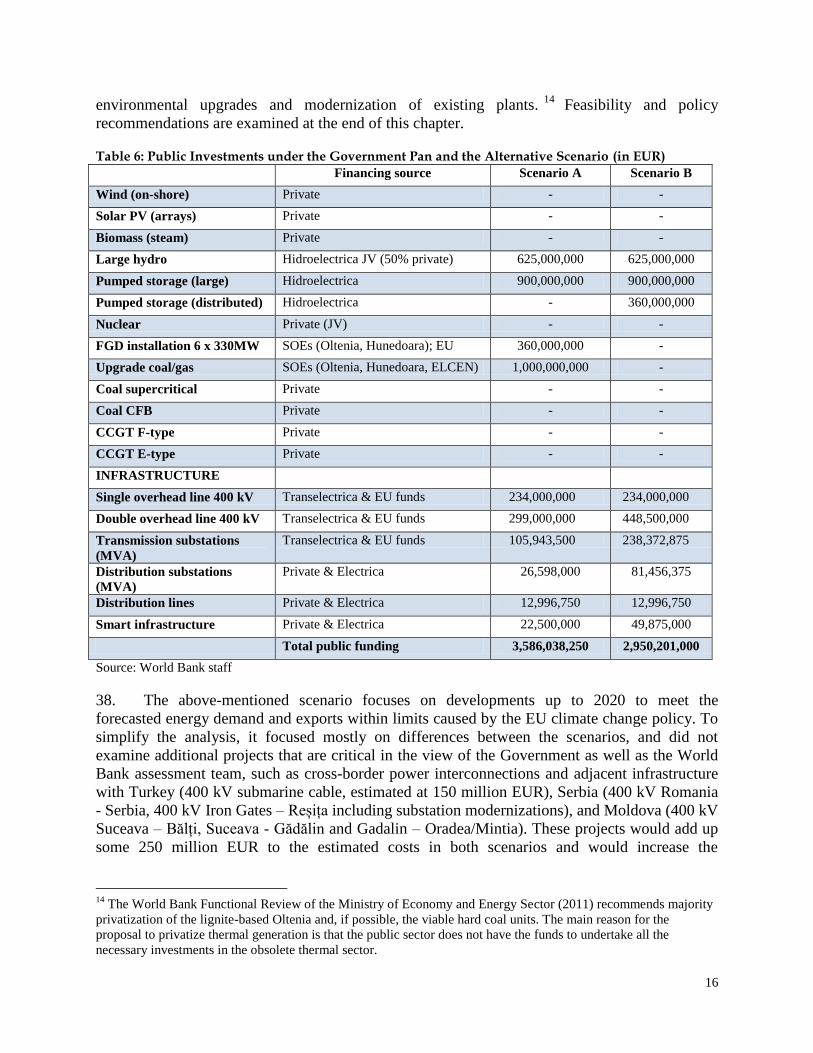
16
environmental upgrades and modernization of existing plants.14
Feasibility and policy
recommendations are examined at the end of this chapter.
Table 6: Public Investments under the Government Pan and the Alternative Scenario (in EUR)
Financing source Scenario A Scenario B
Wind (on-shore) Private - -
Solar PV (arrays) Private - -
Biomass (steam) Private - -
Large hydro Hidroelectrica JV (50% private) 625,000,000 625,000,000
Pumped storage (large) Hidroelectrica 900,000,000 900,000,000
Pumped storage (distributed) Hidroelectrica - 360,000,000
Nuclear Private (JV) - -
FGD installation 6 x 330MW SOEs (Oltenia, Hunedoara); EU 360,000,000 -
Upgrade coal/gas SOEs (Oltenia, Hunedoara, ELCEN) 1,000,000,000 -
Coal supercritical Private - -
Coal CFB Private - -
CCGT F-type Private - -
CCGT E-type Private - -
INFRASTRUCTURE
Single overhead line 400 kV Transelectrica & EU funds 234,000,000 234,000,000
Double overhead line 400 kV Transelectrica & EU funds 299,000,000 448,500,000
Transmission substations
(MVA)
Transelectrica & EU funds 105,943,500 238,372,875
Distribution substations
(MVA)
Private & Electrica 26,598,000 81,456,375
Distribution lines Private & Electrica 12,996,750 12,996,750
Smart infrastructure Private & Electrica 22,500,000 49,875,000
Total public funding 3,586,038,250 2,950,201,000
Source: World Bank staff
38. The above-mentioned scenario focuses on developments up to 2020 to meet the
forecasted energy demand and exports within limits caused by the EU climate change policy. To
simplify the analysis, it focused mostly on differences between the scenarios, and did not
examine additional projects that are critical in the view of the Government as well as the World
Bank assessment team, such as cross-border power interconnections and adjacent infrastructure
with Turkey (400 kV submarine cable, estimated at 150 million EUR), Serbia (400 kV Romania
- Serbia, 400 kV Iron Gates – Reșița including substation modernizations), and Moldova (400 kV
Suceava – Bălți, Suceava - Gădălin and Gadalin – Oradea/Mintia). These projects would add up
some 250 million EUR to the estimated costs in both scenarios and would increase the
14
The World Bank Functional Review of the Ministry of Economy and Energy Sector (2011) recommends majority
privatization of the lignite-based Oltenia and, if possible, the viable hard coal units. The main reason for the
proposal to privatize thermal generation is that the public sector does not have the funds to undertake all the
necessary investments in the obsolete thermal sector.
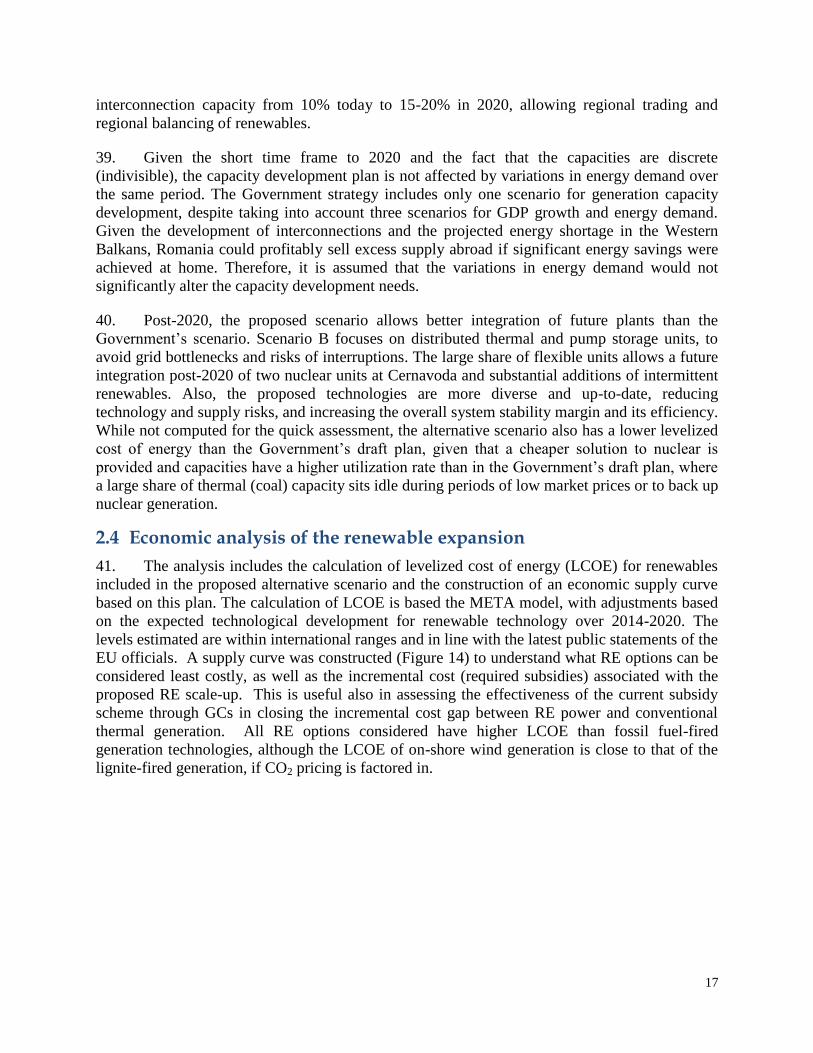
17
interconnection capacity from 10% today to 15-20% in 2020, allowing regional trading and
regional balancing of renewables.
39. Given the short time frame to 2020 and the fact that the capacities are discrete
(indivisible), the capacity development plan is not affected by variations in energy demand over
the same period. The Government strategy includes only one scenario for generation capacity
development, despite taking into account three scenarios for GDP growth and energy demand.
Given the development of interconnections and the projected energy shortage in the Western
Balkans, Romania could profitably sell excess supply abroad if significant energy savings were
achieved at home. Therefore, it is assumed that the variations in energy demand would not
significantly alter the capacity development needs.
40. Post-2020, the proposed scenario allows better integration of future plants than the
Government’s scenario. Scenario B focuses on distributed thermal and pump storage units, to
avoid grid bottlenecks and risks of interruptions. The large share of flexible units allows a future
integration post-2020 of two nuclear units at Cernavoda and substantial additions of intermittent
renewables. Also, the proposed technologies are more diverse and up-to-date, reducing
technology and supply risks, and increasing the overall system stability margin and its efficiency.
While not computed for the quick assessment, the alternative scenario also has a lower levelized
cost of energy than the Government’s draft plan, given that a cheaper solution to nuclear is
provided and capacities have a higher utilization rate than in the Government’s draft plan, where
a large share of thermal (coal) capacity sits idle during periods of low market prices or to back up
nuclear generation.
2.4 Economic analysis of the renewable expansion
41. The analysis includes the calculation of levelized cost of energy (LCOE) for renewables
included in the proposed alternative scenario and the construction of an economic supply curve
based on this plan. The calculation of LCOE is based the META model, with adjustments based
on the expected technological development for renewable technology over 2014-2020. The
levels estimated are within international ranges and in line with the latest public statements of the
EU officials. A supply curve was constructed (Figure 14) to understand what RE options can be
considered least costly, as well as the incremental cost (required subsidies) associated with the
proposed RE scale-up. This is useful also in assessing the effectiveness of the current subsidy
scheme through GCs in closing the incremental cost gap between RE power and conventional
thermal generation. All RE options considered have higher LCOE than fossil fuel-fired
generation technologies, although the LCOE of on-shore wind generation is close to that of the
lignite-fired generation, if CO2 pricing is factored in.
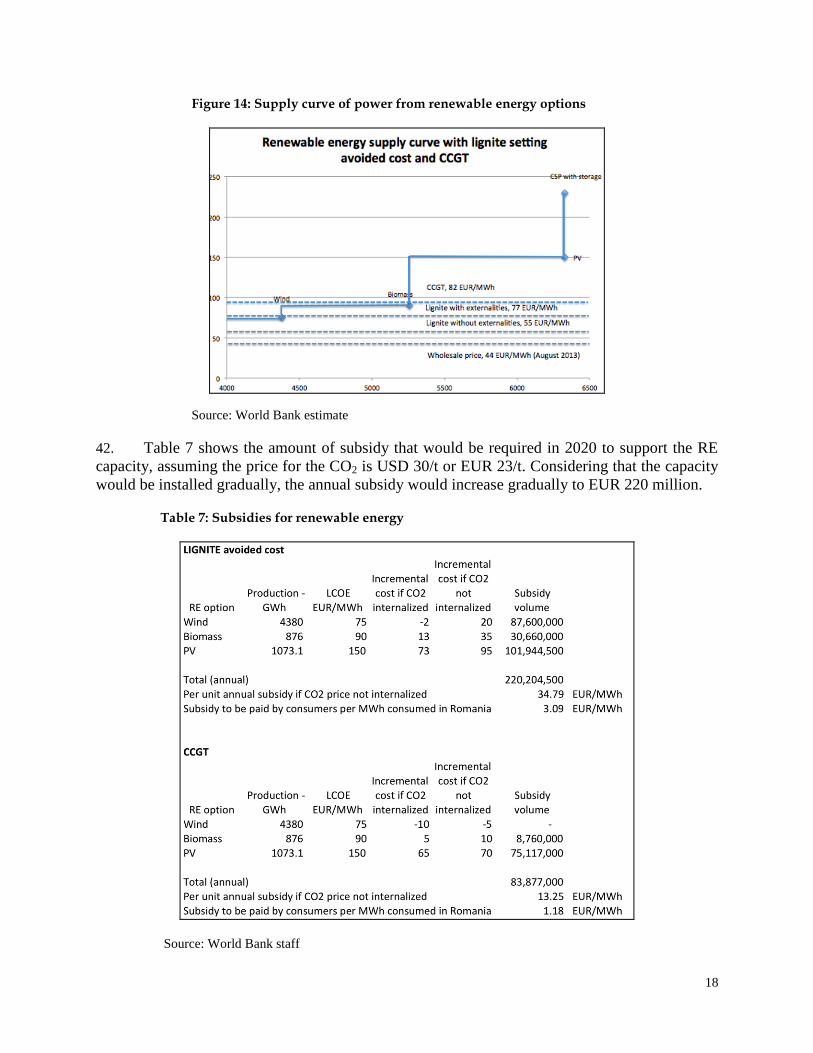
18
Figure 14: Supply curve of power from renewable energy options
Source: World Bank estimate
42. Table 7 shows the amount of subsidy that would be required in 2020 to support the RE
capacity, assuming the price for the CO2 is USD 30/t or EUR 23/t. Considering that the capacity
would be installed gradually, the annual subsidy would increase gradually to EUR 220 million.
Table 7: Subsidies for renewable energy
Source: World Bank staff
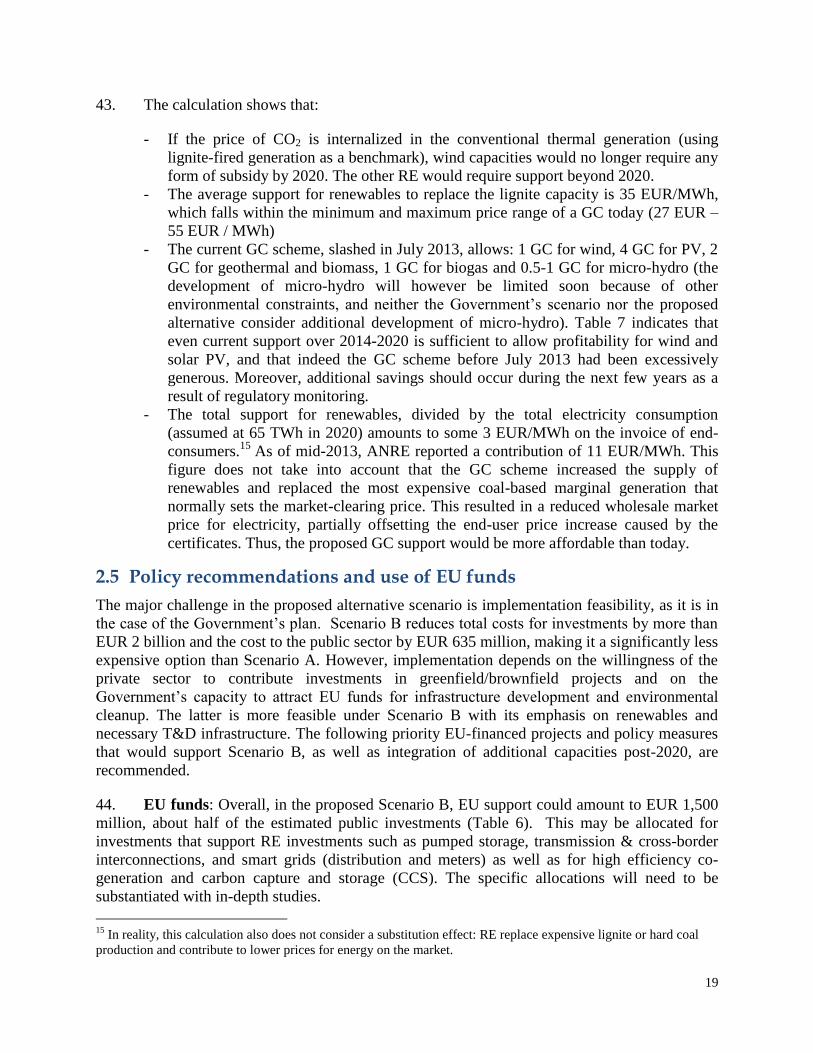
19
43. The calculation shows that:
- If the price of CO2 is internalized in the conventional thermal generation (using
lignite-fired generation as a benchmark), wind capacities would no longer require any
form of subsidy by 2020. The other RE would require support beyond 2020.
- The average support for renewables to replace the lignite capacity is 35 EUR/MWh,
which falls within the minimum and maximum price range of a GC today (27 EUR –
55 EUR / MWh)
- The current GC scheme, slashed in July 2013, allows: 1 GC for wind, 4 GC for PV, 2
GC for geothermal and biomass, 1 GC for biogas and 0.5-1 GC for micro-hydro (the
development of micro-hydro will however be limited soon because of other
environmental constraints, and neither the Government’s scenario nor the proposed
alternative consider additional development of micro-hydro). Table 7 indicates that
even current support over 2014-2020 is sufficient to allow profitability for wind and
solar PV, and that indeed the GC scheme before July 2013 had been excessively
generous. Moreover, additional savings should occur during the next few years as a
result of regulatory monitoring.
- The total support for renewables, divided by the total electricity consumption
(assumed at 65 TWh in 2020) amounts to some 3 EUR/MWh on the invoice of end-
consumers.15
As of mid-2013, ANRE reported a contribution of 11 EUR/MWh. This
figure does not take into account that the GC scheme increased the supply of
renewables and replaced the most expensive coal-based marginal generation that
normally sets the market-clearing price. This resulted in a reduced wholesale market
price for electricity, partially offsetting the end-user price increase caused by the
certificates. Thus, the proposed GC support would be more affordable than today.
2.5 Policy recommendations and use of EU funds
The major challenge in the proposed alternative scenario is implementation feasibility, as it is in
the case of the Government’s plan. Scenario B reduces total costs for investments by more than
EUR 2 billion and the cost to the public sector by EUR 635 million, making it a significantly less
expensive option than Scenario A. However, implementation depends on the willingness of the
private sector to contribute investments in greenfield/brownfield projects and on the
Government’s capacity to attract EU funds for infrastructure development and environmental
cleanup. The latter is more feasible under Scenario B with its emphasis on renewables and
necessary T&D infrastructure. The following priority EU-financed projects and policy measures
that would support Scenario B, as well as integration of additional capacities post-2020, are
recommended.
44. EU funds: Overall, in the proposed Scenario B, EU support could amount to EUR 1,500
million, about half of the estimated public investments (Table 6). This may be allocated for
investments that support RE investments such as pumped storage, transmission & cross-border
interconnections, and smart grids (distribution and meters) as well as for high efficiency co-
generation and carbon capture and storage (CCS). The specific allocations will need to be
substantiated with in-depth studies.
15
In reality, this calculation also does not consider a substitution effect: RE replace expensive lignite or hard coal
production and contribute to lower prices for energy on the market.
20
- The EU is quite restrictive in providing financing directly to companies, due to state
aid rules. However, the EU is willing to finance environmental rehabilitation costs.
In Scenario A the investment needs for flue-gas desulphurization (FGD) of 6 x 330
MW units is estimated at about EUR 360 million (EUR 90 million from the
Government and EUR 250 million from the EU). In Scenario B, this investment
would not be needed, and the EU funding could be used to support other investments.
- The EU is willing to finance T&D infrastructure projects. Through the Large
Infrastructure OP, Romania could cover investments in the smart grids and part of the
interconnections. Interconnectors are also financeable through the Connecting Europe
Facility. 16
The estimation of the needs for smart grid infrastructure would need
further investigation.
- Continued efforts in developing viable CCS solutions may be justified to address
potential mitigation needs and risks. As envisaged previously by the Government,
CCS could be supported through “NER 300”,17
an EU/EIB member states financing
instruments resulting from the sale of emission allowances.
- Renewables: the current (amended) GC scheme is considered as sufficient for the
development of wind and solar PV. EU funds might be requested for the development
of energy balancing capacities including different energy storage facilities; and for
research and development of new renewable technologies.
- EU funds from the cohesion policy, as well as earmarked funds directly allocated
from Brussels, support investments in TEN-T infrastructure. In Scenario B these
investments are closely connected to climate change mitigation, since they would
contribute to integration of a higher share of renewables. Romania should focus on
the completion of the 400 kV ‘inner ring’ with the missing segments Suceava –
Gadalin – Oradea/Mintia and Arad – Iron Gates, and execution of the 400 kV cross-
border interconnections with Moldova, Turkey and Serbia. These are transmission
network interconnections within the 12 Trans-European corridors and zones,
including the Black Sea ring as well, that can remove transmission congestion,
connect additional 2000 MW of variable renewables, interconnect the Tarnita pump-
storage plant and ensure balancing of variable green energy regionally.
45. Other significant sources of grant financing are also available for power sector climate
change mitigation investments, notably, the funds generated from the trading of CO2 certificates,
as explained in Annex 2.
46. Policy support: To attract private investments, Romania needs to adopt a set of
transparent policies that would provide potential investors assurance of a stable and predictable
business environment. The following measures were recommended in the World Bank’s 2011
Functional Review of the Ministry of Economy, Energy Sector and Business Environment:
16
The list of eligible projects – for grants for studies and / or investments - is available at:
http://ec.europa.eu/energy/infrastructure/pci/doc/2013_pci_projects_country.pdf 17
New Entrants’ Reserve of the European Emissions Trading Scheme for subsidizing installations of innovative RE
technology and CCS. 300 million allowances (rights to emit one ton of CO2) were put aside and would be sold on
the carbon market. The money raised — expected to be around EUR 2 billion at current carbon prices — would be
made available to projects.
21
- Improvement of corporate governance and energy contracting of state-owned
companies, to ensure non-discriminatory access to markets and fully commercial
behavior of SOEs, which control 85% of power generation. All SOEs should be
required to sell energy competitively, transparently and non-discriminately on
OPCOM
- Cancellation of any plans to set up integrated champions in the power sector, as
agreed with the IMF/EC/World Bank, to avoid market concentration, uneconomic
prices, cross-subsidies and non-transparent energy deals
- Liberalization of the electricity (and gas) markets, development of OPCOM as a
power/gas exchange, in parallel with deployment of a new social energy assistance
system fully decoupled from the energy markets
- SOE energy consumers pay their bills (particularly the railways sector) to avoid cash
flow issues in the electricity sector
- Full implementation of regulations and laws (e.g., cost pass-throughs for regulated
components, subsidies for public service obligations, incentive-based regulations for
infrastructure)
- Privatizations in the thermal generation sector (Hunedoara, Oltenia) to reduce the
state monopoly in power generation and ensure private investments in existing
plants/replacement of current technologies
- Preparation of an energy and climate change strategy by an internationally and
competitively selected consultant. Investors need a clear, public strategy with
information on Government plans, proposed regulations and legislation, forecasts of
energy supply and demand, and infrastructure development
- Stabilization of policy and legislation, and sound justifications for each policy.
Frequent amendments in laws (e.g., renewables, thermal support, subsidies for coal,
cogeneration bonus etc.) negatively affect investor confidence and increase the
perception of investment risks. Policy and legislative stability is currently mentioned
as the number one issue by all investors.
47. The simultaneous realization of the proposed measures would attract private investments
in the Romanian power sector to meet the targets in the alternative Scenario B.
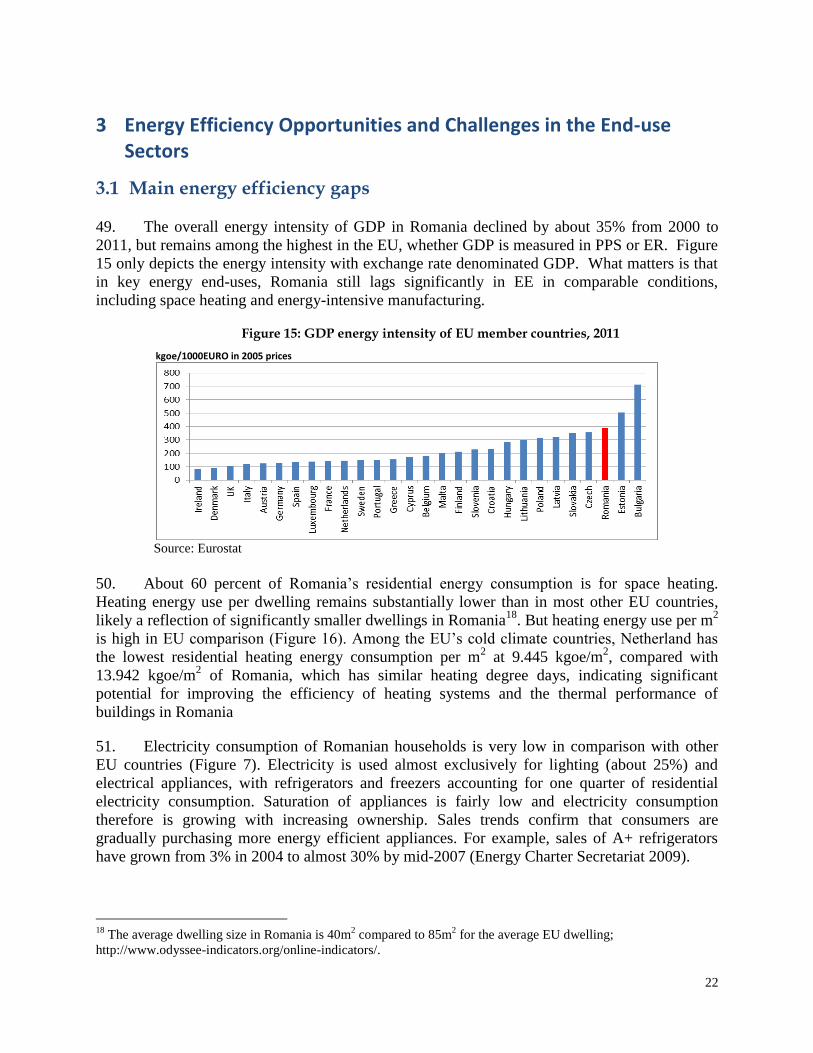
22
3 Energy Efficiency Opportunities and Challenges in the End-use Sectors
3.1 Main energy efficiency gaps
49. The overall energy intensity of GDP in Romania declined by about 35% from 2000 to
2011, but remains among the highest in the EU, whether GDP is measured in PPS or ER. Figure
15 only depicts the energy intensity with exchange rate denominated GDP. What matters is that
in key energy end-uses, Romania still lags significantly in EE in comparable conditions,
including space heating and energy-intensive manufacturing.
Figure 15: GDP energy intensity of EU member countries, 2011
kgoe/1000EURO in 2005 prices
Source: Eurostat
50. About 60 percent of Romania’s residential energy consumption is for space heating.
Heating energy use per dwelling remains substantially lower than in most other EU countries,
likely a reflection of significantly smaller dwellings in Romania18
. But heating energy use per m2
is high in EU comparison (Figure 16). Among the EU’s cold climate countries, Netherland has
the lowest residential heating energy consumption per m2 at 9.445 kgoe/m
2, compared with
13.942 kgoe/m2 of Romania, which has similar heating degree days, indicating significant
potential for improving the efficiency of heating systems and the thermal performance of
buildings in Romania
51. Electricity consumption of Romanian households is very low in comparison with other
EU countries (Figure 7). Electricity is used almost exclusively for lighting (about 25%) and
electrical appliances, with refrigerators and freezers accounting for one quarter of residential
electricity consumption. Saturation of appliances is fairly low and electricity consumption
therefore is growing with increasing ownership. Sales trends confirm that consumers are
gradually purchasing more energy efficient appliances. For example, sales of A+ refrigerators
have grown from 3% in 2004 to almost 30% by mid-2007 (Energy Charter Secretariat 2009).
18
The average dwelling size in Romania is 40m2 compared to 85m
2 for the average EU dwelling;
http://www.odyssee-indicators.org/online-indicators/.
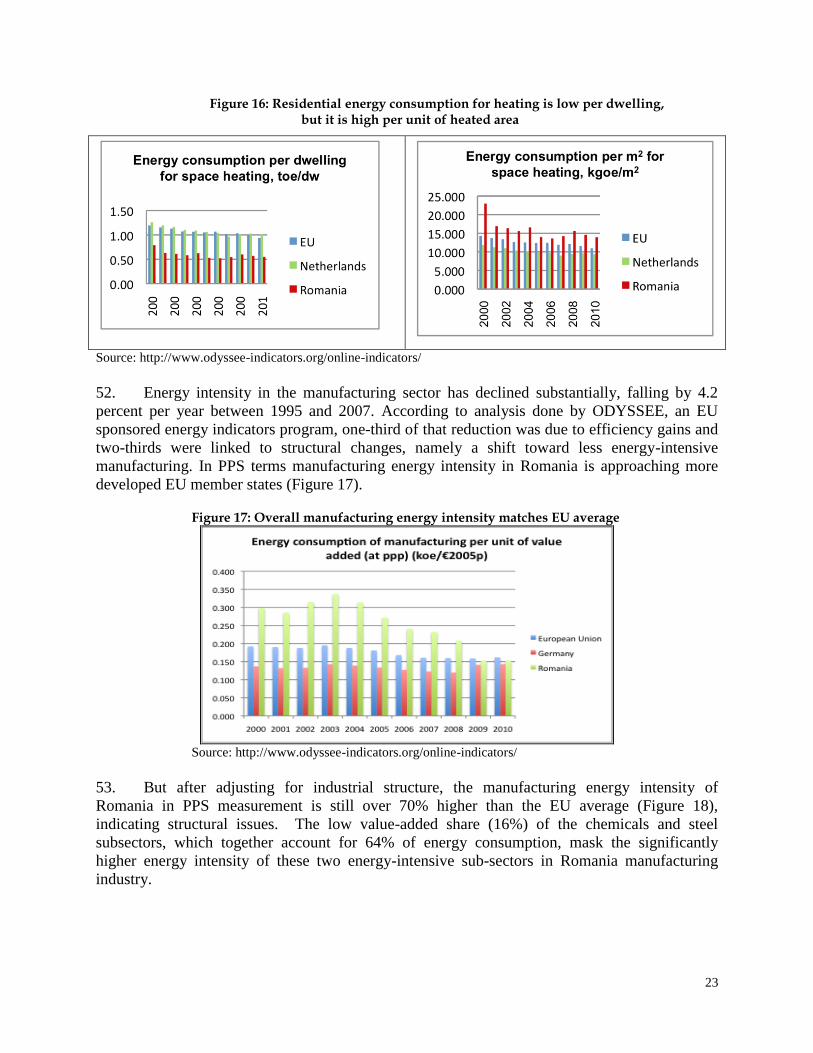
23
Figure 16: Residential energy consumption for heating is low per dwelling, but it is high per unit of heated area
Source: http://www.odyssee-indicators.org/online-indicators/
52. Energy intensity in the manufacturing sector has declined substantially, falling by 4.2
percent per year between 1995 and 2007. According to analysis done by ODYSSEE, an EU
sponsored energy indicators program, one-third of that reduction was due to efficiency gains and
two-thirds were linked to structural changes, namely a shift toward less energy-intensive
manufacturing. In PPS terms manufacturing energy intensity in Romania is approaching more
developed EU member states (Figure 17).
Figure 17: Overall manufacturing energy intensity matches EU average
Source: http://www.odyssee-indicators.org/online-indicators/
53. But after adjusting for industrial structure, the manufacturing energy intensity of
Romania in PPS measurement is still over 70% higher than the EU average (Figure 18),
indicating structural issues. The low value-added share (16%) of the chemicals and steel
subsectors, which together account for 64% of energy consumption, mask the significantly
higher energy intensity of these two energy-intensive sub-sectors in Romania manufacturing
industry.
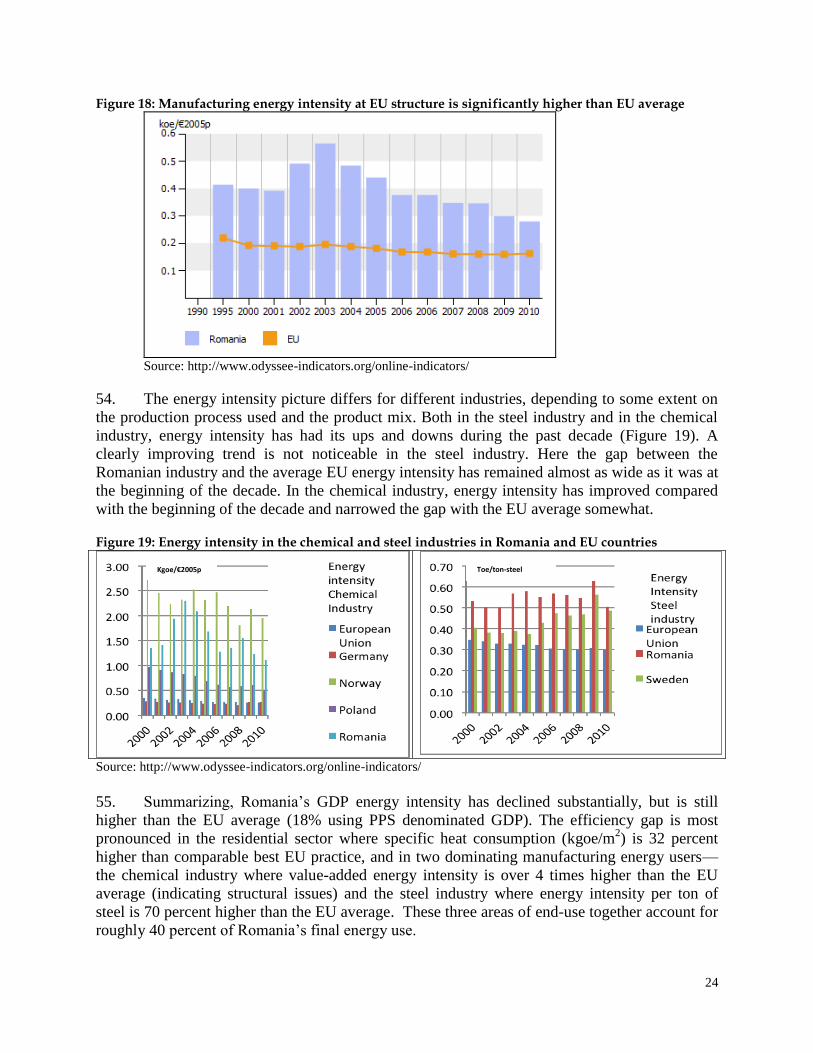
24
Figure 18: Manufacturing energy intensity at EU structure is significantly higher than EU average
Source: http://www.odyssee-indicators.org/online-indicators/
54. The energy intensity picture differs for different industries, depending to some extent on
the production process used and the product mix. Both in the steel industry and in the chemical
industry, energy intensity has had its ups and downs during the past decade (Figure 19). A
clearly improving trend is not noticeable in the steel industry. Here the gap between the
Romanian industry and the average EU energy intensity has remained almost as wide as it was at
the beginning of the decade. In the chemical industry, energy intensity has improved compared
with the beginning of the decade and narrowed the gap with the EU average somewhat.
Figure 19: Energy intensity in the chemical and steel industries in Romania and EU countries
Source: http://www.odyssee-indicators.org/online-indicators/
55. Summarizing, Romania’s GDP energy intensity has declined substantially, but is still
higher than the EU average (18% using PPS denominated GDP). The efficiency gap is most
pronounced in the residential sector where specific heat consumption (kgoe/m2) is 32 percent
higher than comparable best EU practice, and in two dominating manufacturing energy users—
the chemical industry where value-added energy intensity is over 4 times higher than the EU
average (indicating structural issues) and the steel industry where energy intensity per ton of
steel is 70 percent higher than the EU average. These three areas of end-use together account for
roughly 40 percent of Romania’s final energy use.
Kgoe/€2005p Toe/ton-steel
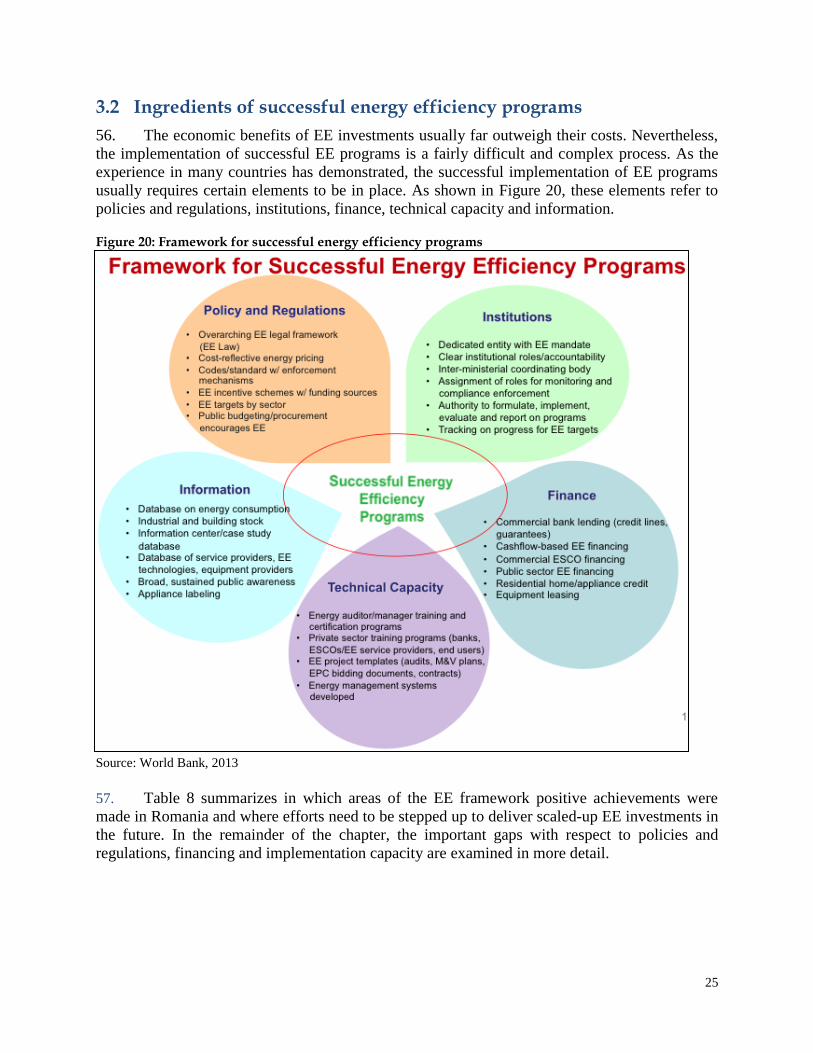
25
3.2 Ingredients of successful energy efficiency programs
56. The economic benefits of EE investments usually far outweigh their costs. Nevertheless,
the implementation of successful EE programs is a fairly difficult and complex process. As the
experience in many countries has demonstrated, the successful implementation of EE programs
usually requires certain elements to be in place. As shown in Figure 20, these elements refer to
policies and regulations, institutions, finance, technical capacity and information.
Figure 20: Framework for successful energy efficiency programs
Source: World Bank, 2013
57. Table 8 summarizes in which areas of the EE framework positive achievements were
made in Romania and where efforts need to be stepped up to deliver scaled-up EE investments in
the future. In the remainder of the chapter, the important gaps with respect to policies and
regulations, financing and implementation capacity are examined in more detail.
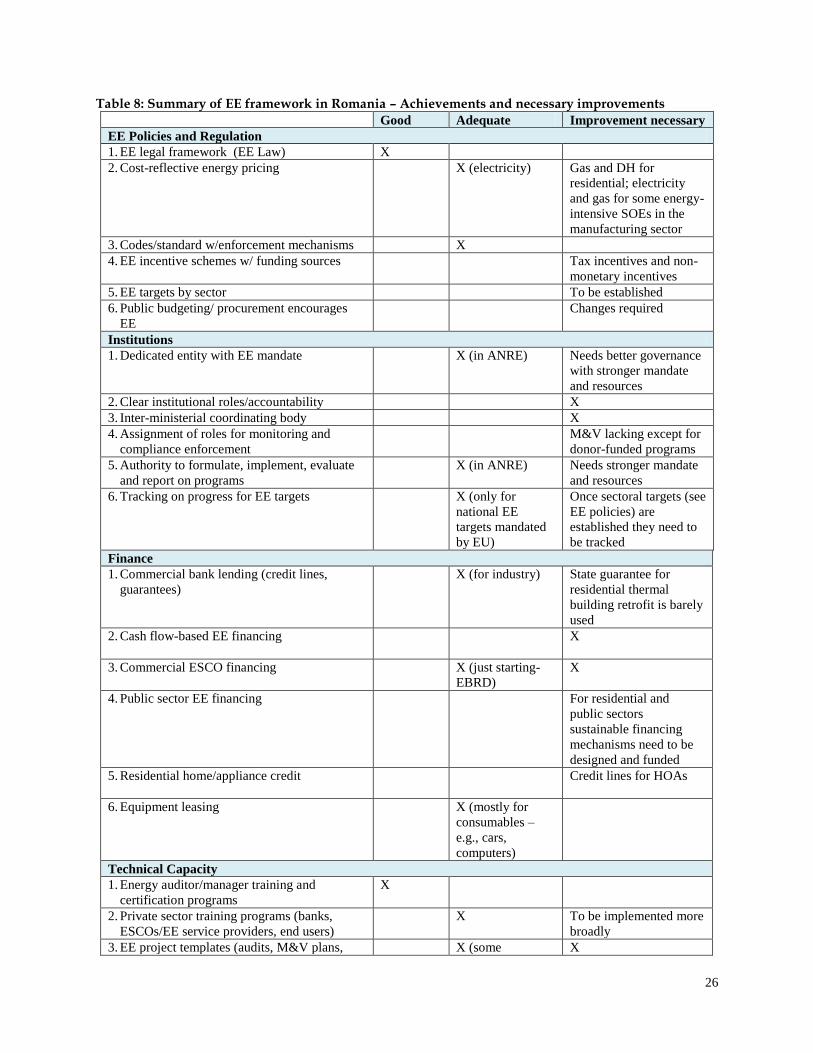
26
Table 8: Summary of EE framework in Romania – Achievements and necessary improvements Good Adequate Improvement necessary
EE Policies and Regulation
1. EE legal framework (EE Law) X
2. Cost-reflective energy pricing X (electricity) Gas and DH for
residential; electricity
and gas for some energy-
intensive SOEs in the
manufacturing sector
3. Codes/standard w/enforcement mechanisms X
4. EE incentive schemes w/ funding sources Tax incentives and non-
monetary incentives
5. EE targets by sector To be established
6. Public budgeting/ procurement encourages
EE
Changes required
Institutions
1. Dedicated entity with EE mandate X (in ANRE) Needs better governance
with stronger mandate
and resources
2. Clear institutional roles/accountability X
3. Inter-ministerial coordinating body X
4. Assignment of roles for monitoring and
compliance enforcement
M&V lacking except for
donor-funded programs
5. Authority to formulate, implement, evaluate
and report on programs
X (in ANRE) Needs stronger mandate
and resources
6. Tracking on progress for EE targets X (only for
national EE
targets mandated
by EU)
Once sectoral targets (see
EE policies) are
established they need to
be tracked
Finance
1. Commercial bank lending (credit lines,
guarantees)
X (for industry) State guarantee for
residential thermal
building retrofit is barely
used
2. Cash flow-based EE financing
X
3. Commercial ESCO financing
X (just starting-
EBRD)
X
4. Public sector EE financing
For residential and
public sectors
sustainable financing
mechanisms need to be
designed and funded
5. Residential home/appliance credit
Credit lines for HOAs
6. Equipment leasing X (mostly for
consumables –
e.g., cars,
computers)
Technical Capacity
1. Energy auditor/manager training and
certification programs
X
2. Private sector training programs (banks,
ESCOs/EE service providers, end users)
X To be implemented more
broadly
3. EE project templates (audits, M&V plans, X (some X
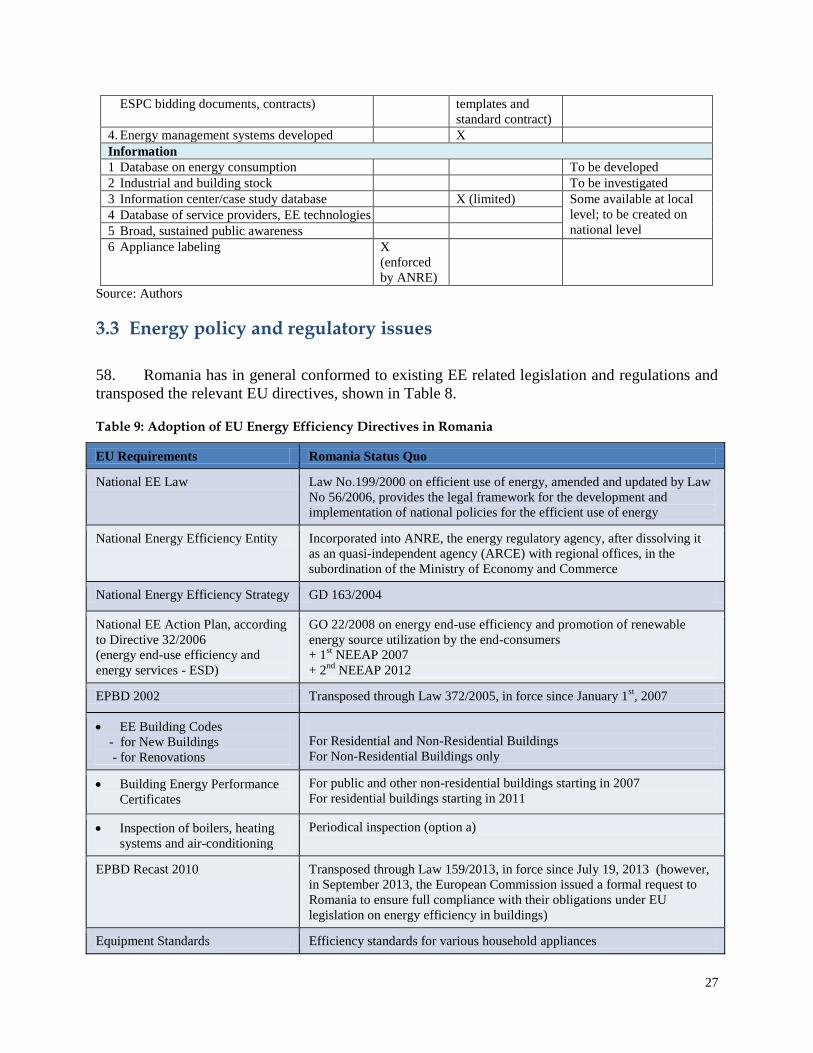
27
ESPC bidding documents, contracts) templates and
standard contract)
4. Energy management systems developed X
Information
1 Database on energy consumption To be developed
2 Industrial and building stock To be investigated
3 Information center/case study database X (limited) Some available at local
level; to be created on
national level 4 Database of service providers, EE technologies, equipment providers
5 Broad, sustained public awareness
6 Appliance labeling X
(enforced
by ANRE)
Source: Authors
3.3 Energy policy and regulatory issues
58. Romania has in general conformed to existing EE related legislation and regulations and
transposed the relevant EU directives, shown in Table 8.
Table 9: Adoption of EU Energy Efficiency Directives in Romania
EU Requirements Romania Status Quo
National EE Law Law No.199/2000 on efficient use of energy, amended and updated by Law
No 56/2006, provides the legal framework for the development and
implementation of national policies for the efficient use of energy
National Energy Efficiency Entity Incorporated into ANRE, the energy regulatory agency, after dissolving it
as an quasi-independent agency (ARCE) with regional offices, in the
subordination of the Ministry of Economy and Commerce
National Energy Efficiency Strategy GD 163/2004
National EE Action Plan, according
to Directive 32/2006
(energy end-use efficiency and
energy services - ESD)
GO 22/2008 on energy end-use efficiency and promotion of renewable
energy source utilization by the end-consumers
+ 1st NEEAP 2007
+ 2nd
NEEAP 2012
EPBD 2002 Transposed through Law 372/2005, in force since January 1st, 2007
EE Building Codes
- for New Buildings
- for Renovations
For Residential and Non-Residential Buildings
For Non-Residential Buildings only
Building Energy Performance
Certificates
For public and other non-residential buildings starting in 2007
For residential buildings starting in 2011
Inspection of boilers, heating
systems and air-conditioning
Periodical inspection (option a)
EPBD Recast 2010 Transposed through Law 159/2013, in force since July 19, 2013 (however,
in September 2013, the European Commission issued a formal request to
Romania to ensure full compliance with their obligations under EU
legislation on energy efficiency in buildings)
Equipment Standards Efficiency standards for various household appliances
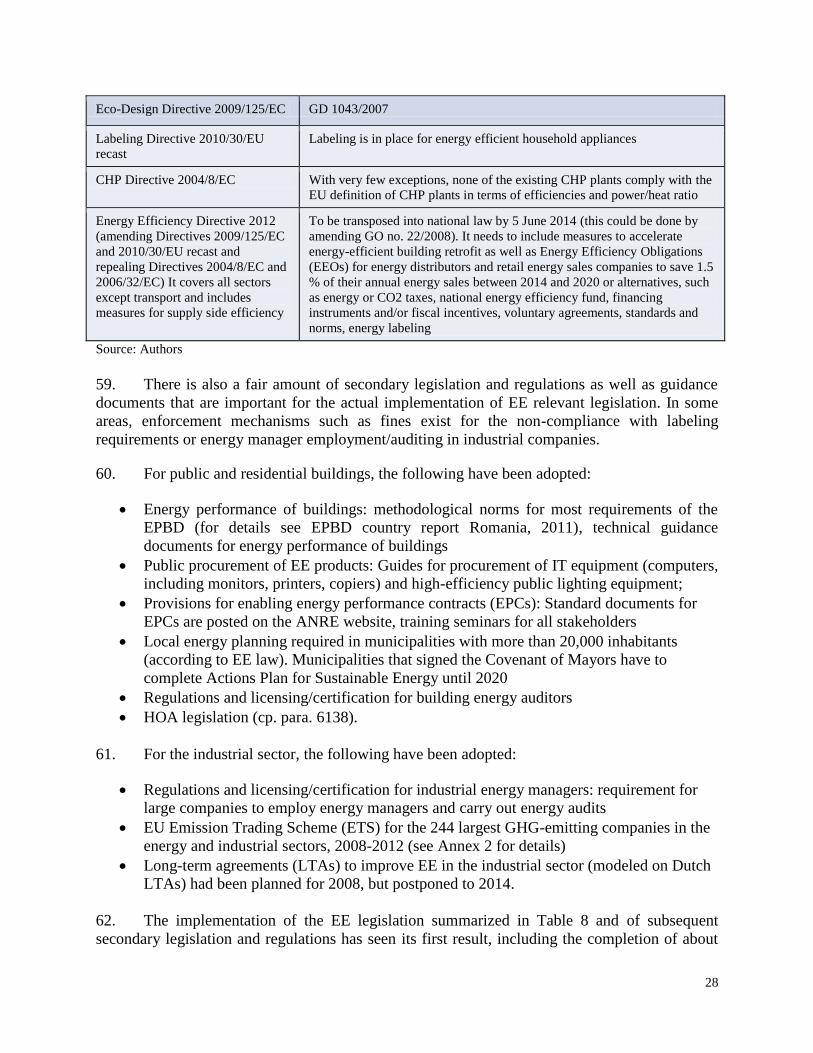
28
Eco-Design Directive 2009/125/EC GD 1043/2007
Labeling Directive 2010/30/EU
recast
Labeling is in place for energy efficient household appliances
CHP Directive 2004/8/EC With very few exceptions, none of the existing CHP plants comply with the
EU definition of CHP plants in terms of efficiencies and power/heat ratio
Energy Efficiency Directive 2012
(amending Directives 2009/125/EC
and 2010/30/EU recast and
repealing Directives 2004/8/EC and
2006/32/EC) It covers all sectors
except transport and includes
measures for supply side efficiency
To be transposed into national law by 5 June 2014 (this could be done by
amending GO no. 22/2008). It needs to include measures to accelerate
energy-efficient building retrofit as well as Energy Efficiency Obligations
(EEOs) for energy distributors and retail energy sales companies to save 1.5
% of their annual energy sales between 2014 and 2020 or alternatives, such
as energy or CO2 taxes, national energy efficiency fund, financing
instruments and/or fiscal incentives, voluntary agreements, standards and
norms, energy labeling
Source: Authors
59. There is also a fair amount of secondary legislation and regulations as well as guidance
documents that are important for the actual implementation of EE relevant legislation. In some
areas, enforcement mechanisms such as fines exist for the non-compliance with labeling
requirements or energy manager employment/auditing in industrial companies.
60. For public and residential buildings, the following have been adopted:
Energy performance of buildings: methodological norms for most requirements of the
EPBD (for details see EPBD country report Romania, 2011), technical guidance
documents for energy performance of buildings
Public procurement of EE products: Guides for procurement of IT equipment (computers,
including monitors, printers, copiers) and high-efficiency public lighting equipment;
Provisions for enabling energy performance contracts (EPCs): Standard documents for
EPCs are posted on the ANRE website, training seminars for all stakeholders
Local energy planning required in municipalities with more than 20,000 inhabitants
(according to EE law). Municipalities that signed the Covenant of Mayors have to
complete Actions Plan for Sustainable Energy until 2020
Regulations and licensing/certification for building energy auditors
HOA legislation (cp. para. 6138).
61. For the industrial sector, the following have been adopted:
Regulations and licensing/certification for industrial energy managers: requirement for
large companies to employ energy managers and carry out energy audits
EU Emission Trading Scheme (ETS) for the 244 largest GHG-emitting companies in the
energy and industrial sectors, 2008-2012 (see Annex 2 for details)
Long-term agreements (LTAs) to improve EE in the industrial sector (modeled on Dutch
LTAs) had been planned for 2008, but postponed to 2014.
62. The implementation of the EE legislation summarized in Table 8 and of subsequent
secondary legislation and regulations has seen its first result, including the completion of about
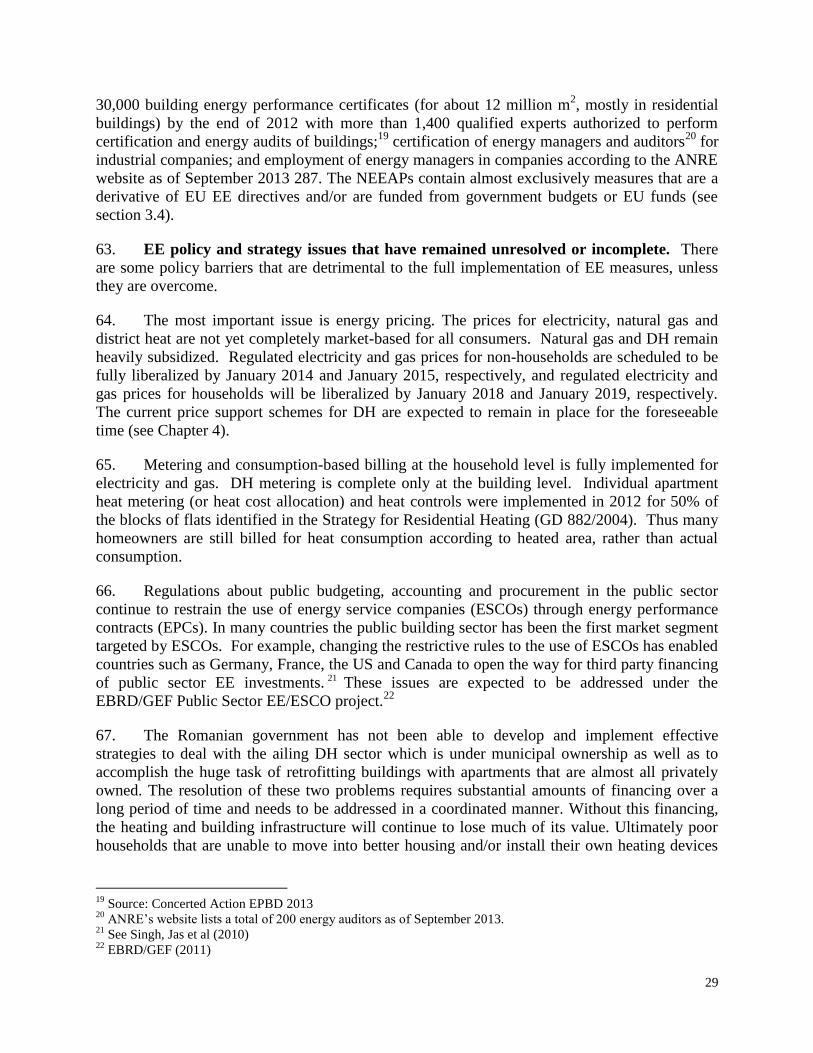
29
30,000 building energy performance certificates (for about 12 million m2, mostly in residential
buildings) by the end of 2012 with more than 1,400 qualified experts authorized to perform
certification and energy audits of buildings;19
certification of energy managers and auditors20
for
industrial companies; and employment of energy managers in companies according to the ANRE
website as of September 2013 287. The NEEAPs contain almost exclusively measures that are a
derivative of EU EE directives and/or are funded from government budgets or EU funds (see
section 3.4).
63. EE policy and strategy issues that have remained unresolved or incomplete. There
are some policy barriers that are detrimental to the full implementation of EE measures, unless
they are overcome.
64. The most important issue is energy pricing. The prices for electricity, natural gas and
district heat are not yet completely market-based for all consumers. Natural gas and DH remain
heavily subsidized. Regulated electricity and gas prices for non-households are scheduled to be
fully liberalized by January 2014 and January 2015, respectively, and regulated electricity and
gas prices for households will be liberalized by January 2018 and January 2019, respectively.
The current price support schemes for DH are expected to remain in place for the foreseeable
time (see Chapter 4).
65. Metering and consumption-based billing at the household level is fully implemented for
electricity and gas. DH metering is complete only at the building level. Individual apartment
heat metering (or heat cost allocation) and heat controls were implemented in 2012 for 50% of
the blocks of flats identified in the Strategy for Residential Heating (GD 882/2004). Thus many
homeowners are still billed for heat consumption according to heated area, rather than actual
consumption.
66. Regulations about public budgeting, accounting and procurement in the public sector
continue to restrain the use of energy service companies (ESCOs) through energy performance
contracts (EPCs). In many countries the public building sector has been the first market segment
targeted by ESCOs. For example, changing the restrictive rules to the use of ESCOs has enabled
countries such as Germany, France, the US and Canada to open the way for third party financing
of public sector EE investments. 21 These issues are expected to be addressed under the
EBRD/GEF Public Sector EE/ESCO project.22
67. The Romanian government has not been able to develop and implement effective
strategies to deal with the ailing DH sector which is under municipal ownership as well as to
accomplish the huge task of retrofitting buildings with apartments that are almost all privately
owned. The resolution of these two problems requires substantial amounts of financing over a
long period of time and needs to be addressed in a coordinated manner. Without this financing,
the heating and building infrastructure will continue to lose much of its value. Ultimately poor
households that are unable to move into better housing and/or install their own heating devices
19
Source: Concerted Action EPBD 2013 20
ANRE’s website lists a total of 200 energy auditors as of September 2013. 21
See Singh, Jas et al (2010) 22
EBRD/GEF (2011)
30
will lose out. In-depth investigations beyond this rapid assessment will be required to identify
appropriate solutions to these two problems.
3.4 Energy efficiency financing during 2007-2013
68. In Romania no single agency has an overview of implemented EE projects, their costs,
financing sources and main results and benefits. In the following section, information on EE
investments in three energy-using sectors – manufacturing sector, residential buildings and
public sector - was assembled for an approximate picture of financing available in the period
2007-2013. Since information on disbursements is scarce, the assessment is not able to put
together a full picture for the actual spending of the available funds.
69. EE financing for the industrial sector, especially in SMEs. Outside of EU financing,
the main sources of external funds for EE investments in manufacturing are several programs set
up by IFIs: The Romanian Energy Efficiency Fund (FREE), established by the World Bank and
GEF, and the Energy Efficiency Financing Facility (EEFF) and Romanian SME Sustainable
Energy Financing Facility (ROSEFF), both established by EBRD and the EC.
70. FREE is a free-standing loan facility that is not restricted to the private sector, but has in
fact provided most of its loans (17) to industrial clients. Between 2004 and 2012, FREE has
made 28 loans totaling USD 14.5 million (EUR 11 million) for a total investment amount of
USD 44 million (EUR 33 million). Activities are currently limited since FREE is a revolving
fund and has not been able to attract any additional capitalization since its initial GEF grant
funding.
71. EEFF is structured as a credit line, based on a EUR 80 million loan from EBRD. Six
Romanian banks are currently participating and provide low-interest loans of up to EUR 2.5
million to their clients. The borrowers have access to free energy audits and receive a grant of
15% of the original loan amount when investment is verified to be complete and operational. The
EC is providing grant funding for these incentives. Between 2009 and mid 2013, 104 projects
were financed with a total loan amount of EUR 64 million and total investment of EUR 100
million. Three of the six banks have already fully committed their credit line.
72. ROSEFF is a follow-up EBRD credit line operation of EUR 60 million, under which
EBRD provides funding to commercial banks and leasing companies in Romania for on-lending
to SME borrowers. Four banks are currently participating.23
ROSEFF is similar to EEFF,
including free audits and up to 15% loan forgiveness, funded by the EC. In addition, it has a
streamlined facility for small projects, provides funding for both EE and renewable energy
investments, and includes among the eligible borrowers housing/homeowner associations as well
as manufacturers, suppliers of EE and RE technology, equipment and materials. Disbursements
under ROSEFF are small so far.
73. EIB has provided a similar credit line of EUR 50 million to Banca Comerciala Romana
(BCR) for investments within its SME Financing Facility Energy Efficiency Window - Green
23
Information on disbursements is not publicly available; see information on three loans at
https://www.seff.ro/downloads/9/page.html
31
Initiative. ESCOs and municipal entities would also be able to borrow. Technical support and a
grant element are a part of this facility as well.
74. All financing programs through banks (both for the private and public sectors) employ
conventional asset-based securitization – borrowers have to provide collateral, often in excess of
100% of the loan amount. The use of future cash flows from energy cost savings is not accepted
yet as loan security.
75. Under the SOP Increase of Economic Competitiveness, private companies in the
manufacturing sector can receive EU financing for efficiency improvements. By mid-March
2013, 23 contracts amounting to RON 495.2 million (EUR 113 million) had been signed, out of a
total allocation of EUR 191 million.
76. Based on the above information, the total financing available for EE investments in the
non-ETS industrial sector between 2007 and 2013 amounted to about EUR 543 million.24
77. Among the barriers that prevent companies in the manufacturing sector from carrying out
financially viable EE projects are a lack of awareness of the cost-saving opportunities by
enterprises, competing needs for capital, and relatively high transaction costs of financing such
projects. In energy-intensive industries, SOEs benefit from subsidized energy prices. SMEs on
the other hand often have problems accessing commercial financing and face high capital costs.
78. Financing for EE retrofit of residential buildings. The national program for thermal
rehabilitation of multi-story family buildings constructed during 1950-1990 started in 2002, was
re-launched in 2007 and has since undergone many changes in its rules and regulations. Initially
in 2007, the state government would contribute 34%, and the local governments and
beneficiaries would contribute 33% each. In 2008, the allocation was changed to 50, 30, and
20%, where local governments could also cover the beneficiaries’ share. In 2010, grant funding
for block buildings was supplemented by a guarantee mechanism covering all residential
buildings. The state budget provides a 100% State guarantee for loans to beneficiaries of up to 5
years and all interest payments, while local governments finance up to 30% of the eligible costs,
and beneficiaries the remainder. In 2011/12, use of the guarantee mechanism has been negligible
with five loans totaling RON 51,000 (EUR 12,000). One reason may be the short term of the
guarantee coverage compared to the much longer payback time of the investment from energy
savings.
79. There is no consistent information about the overall expenditure, number of renovated
buildings and energy savings results under this program. According to information from
MDRAP, the national budget provided RON 451.6 million (EUR 108 million) for the renovation
of 55,000 apartments in 1375 buildings between 2009 and 2012. Assuming that local
governments and beneficiaries supplied another EUR 108 million (according to the co-financing
requirements), the total costs amount to EUR 216 million. The cost per apartment would thus
total roughly EUR 4000 or EUR80/m2. Renovated apartments account for about 1% of
apartments in multi-family buildings (blocks). The overall pace of renovation should increase
24
Assuming that own contribution of beneficiaries under SOP IEC is 40% on average.
32
somewhat with financing from the EIB for Bucharest 25 and the eligibility of thermal
rehabilitation investments in block buildings of EU OP funding for 2013. EU funding is
budgeted with EUR 150 million and would have to be matched by state and local budgets.
80. Green House Program – The Environmental Fund Administration provides grants (90%
of equipment cost) to the residential sector, territorial administrative units and public institutions
that are replacing traditional heating systems with units that use solar energy, geothermal energy
and wind energy or other systems that improve quality of air, water and soil. The program
budgets for 2010 and 2011 amounted to RON 110 and 100 million, respectively. Until early
2012, about 12,000 individual households and 170 legal bodies received funding under the
program for the installation of heating systems using renewable energy.
81. Based on the above information, the total financing available for EE investments in
residential thermal retrofit between 2007 and 2013 would amount to about EUR 827 million,
assuming that the EU funding will be contracted in its entirety and matched completely by state
and local budgets.
82. Future financing mechanisms for the residential sector have to take into account several
barriers that are hampering EE investments. Key barriers include: (i) small project size and
relatively high transaction costs; (ii) perception of high risk on the part of commercial banks; (iii)
lengthy decision-making processes and lack of creditworthiness of HOAs; (iv) diverse
population with respect to income in block buildings; (v) relatively high commercial bank
interest rates and short term of loans compared to payback periods; and (vi) high discount rates
(or hurdle rates) on the part of residential consumers. Financing mechanisms that could mitigate
those barriers will be examined in Chapter 6.
83. EE financing for the public sector. In general, Romanian local governments have a
limited ability to borrow. Annual budget laws limit overall indebtedness of municipalities for the
next year. For example, the ceiling in 2013 was RON 680 million (some EUR 150 million). In
addition, borrowing by local governments has to be pre-approved by the Ministry of Finance.
Municipalities can borrow (including existing and new loans, interests and fees) up to 30% of the
average of their own revenues (mainly local taxes, shared personal income tax plus EU funds)
over the past 3 years. In 2012, overall local public debt was RON 14 billion (some EUR 3
billion), or 5.8% of total public debt. Commercial financing is overwhelmingly from commercial
banks, in addition to some IFI lending and a few bond issues.
84. Commercial financing has been provided by FREE and by EBRD. FREE financed 12
municipal projects, including eight public lighting improvements, three DH projects (geothermal
production, biomass heat production, and substation improvements), and one ESCO project for
cogeneration in an administration building. The total investment amounted to about EUR 3.7
million, of which about EUR 1 million fell into the 2007-13 period. EBRD set up a municipal
finance facility in parallel to its other two EE financing facilities. In April 2012, it provided EUR
25
Three districts in Bucharest have taken loans from EIB totaling EUR192 million for the thermal renovation of
about 730 apartment buildings between 2011 and 2013. The districts will contribute between 25 and 50% of the
cost, including grants from the national program.
http://www.eib.org/attachments/general/bei_info/bei_info144_en.pdf - page=19
33
10 million to BRD Groupe Société Générale (BRD) to be on-lent by BRD to municipalities,
municipally-owned companies and private companies providing municipal services in Romania.
85. Government Directive 1661/2008 initiated the national program for improving energy
efficiency and use of renewable energy resources in the public sector, for 2009-2010. It provided
non-reimbursable co-financing (30-59%) from the Ministry of Economy through ARCE/ANRE.
Eligible projects included DH modernization/change of fuel type; EE rehabilitation and use of
RE in public buildings; and modernization of indoor/outdoor public lighting. Building energy
audits were also co-financed. Seven projects received grant funding of RON 2 million.
86. Thermal rehabilitation of 35 public health buildings was completed between 2005 and
2010 with total allocated funding of EUR 8.7 million from MDRT and the Swiss Government.
87. The national program District Heating - Heat and Comfort, 2006-2015: Rehabilitation of
DH systems, including internal installations in connected buildings provided a total of roughly
EUR 30 million during 2011/2012. Some of the funds allocated by the national budget went
unused in 2011 since municipalities could not finance their originally budgeted share.
88. Under the EU 2007-2013 program, total financing of EUR 657 million (including EUR
101 million national co-financing) was allocated for public building renovation and for the
environmental upgrading of several DH production facilities (SOP Environment, PA 3). Schools
especially benefited from the program, receiving 54% of the total EUR 608.5 million for 342
projects contracted until 2011 (Table 9). Investment per building is fairly high, since most
projects not only aim at increasing the energy performance of the buildings, but also include
structure works, extension of existing buildings and provision of miscellaneous equipment.
Investments in DH production and network facilities received EUR 128 million funding.
Table 10: Public building renovation projects co-financed with EU funds, 2007-2013
Sector Contracted projects, # Financing, EUR Cost per project, EUR
Health 47 200,647,875 4,269,104
Social* 112 79,759,685 712,140
School 183 328,136,014 1,793,093
TOTAL 342 608,543,574 1,779,367
* Including social housing
Source: NEEAP 2012
89. Based on the above information, the total financing available for EE investments in
public sector (covering public buildings and district heating systems) between 2007 and 2013
amounted to about EUR 788 million.
90. Future financing mechanisms to support EE investments in the public sector have to take
into account the following barriers: (i) the limited number of creditworthy municipalities and
borrowing capacity of local governments and other public sector agencies; (ii) restrictive
budgeting, accounting and procurement regulations; (iii) relatively high interest rates charged by
commercial banks; (iv) small project sizes, leading to high project development and transaction
costs; and (v) potentially lower than expected savings in cases where an increase in energy
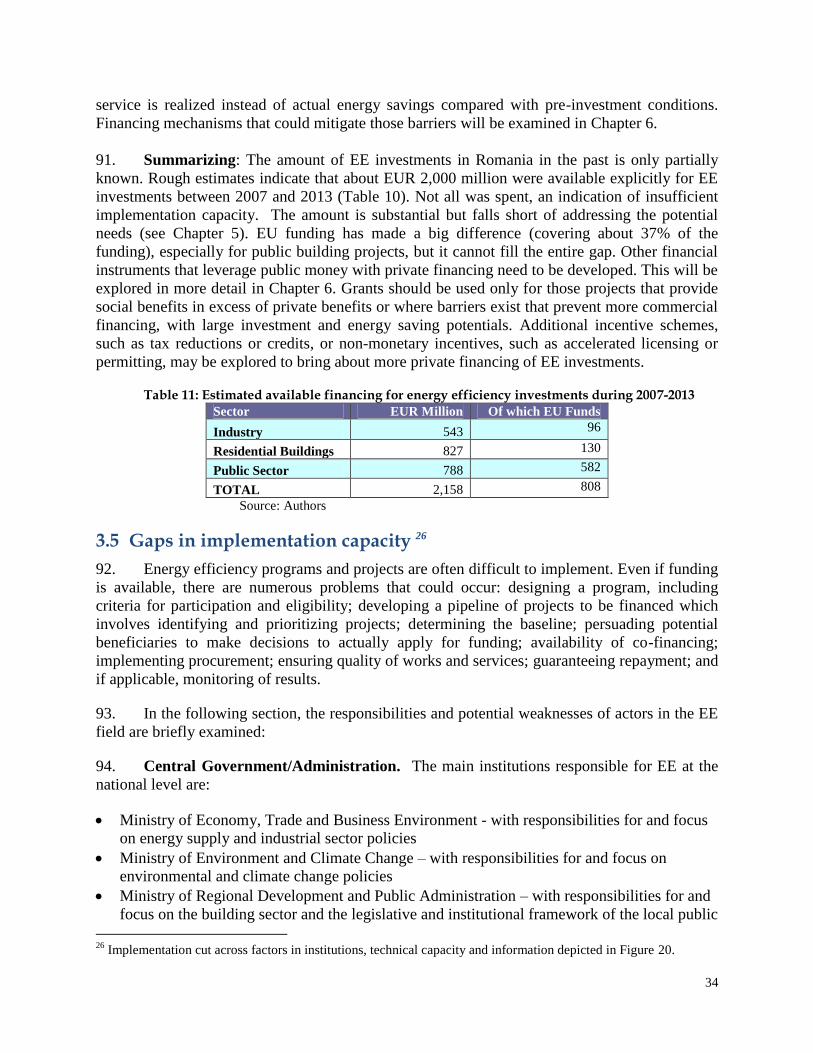
34
service is realized instead of actual energy savings compared with pre-investment conditions.
Financing mechanisms that could mitigate those barriers will be examined in Chapter 6.
91. Summarizing: The amount of EE investments in Romania in the past is only partially
known. Rough estimates indicate that about EUR 2,000 million were available explicitly for EE
investments between 2007 and 2013 (Table 10). Not all was spent, an indication of insufficient
implementation capacity. The amount is substantial but falls short of addressing the potential
needs (see Chapter 5). EU funding has made a big difference (covering about 37% of the
funding), especially for public building projects, but it cannot fill the entire gap. Other financial
instruments that leverage public money with private financing need to be developed. This will be
explored in more detail in Chapter 6. Grants should be used only for those projects that provide
social benefits in excess of private benefits or where barriers exist that prevent more commercial
financing, with large investment and energy saving potentials. Additional incentive schemes,
such as tax reductions or credits, or non-monetary incentives, such as accelerated licensing or
permitting, may be explored to bring about more private financing of EE investments.
Table 11: Estimated available financing for energy efficiency investments during 2007-2013 Sector EUR Million Of which EU Funds
Industry 543 96
Residential Buildings 827 130
Public Sector 788 582
TOTAL 2,158 808
Source: Authors
3.5 Gaps in implementation capacity 26
92. Energy efficiency programs and projects are often difficult to implement. Even if funding
is available, there are numerous problems that could occur: designing a program, including
criteria for participation and eligibility; developing a pipeline of projects to be financed which
involves identifying and prioritizing projects; determining the baseline; persuading potential
beneficiaries to make decisions to actually apply for funding; availability of co-financing;
implementing procurement; ensuring quality of works and services; guaranteeing repayment; and
if applicable, monitoring of results.
93. In the following section, the responsibilities and potential weaknesses of actors in the EE
field are briefly examined:
94. Central Government/Administration. The main institutions responsible for EE at the
national level are:
Ministry of Economy, Trade and Business Environment - with responsibilities for and focus
on energy supply and industrial sector policies
Ministry of Environment and Climate Change – with responsibilities for and focus on
environmental and climate change policies
Ministry of Regional Development and Public Administration – with responsibilities for and
focus on the building sector and the legislative and institutional framework of the local public
26
Implementation cut across factors in institutions, technical capacity and information depicted in Figure 20.
35
administration authorities. Its subordinated regulatory agency ANCSR regulates the public
utility services including DH systems
Romanian Energy Regulatory Authority (ANRE), including its EE department (the formerly
quasi-independent EE agency ARCE)
95. Local Governments are responsible for public service infrastructure and oversight of
real estate within their territory. Local energy planning is required for all municipalities with
more than 20,000 inhabitants; some municipalities are very interested and active in EE/GHG
issues, e.g., those that signed the Covenant of Mayors (COM) and committed to reduce CO2
emissions by at least 20% by 2020 by implementing a Sustainable Energy Action Plan.
96. Energy Efficiency Agency: ARCE was dissolved in 2009, including its regional offices,
and incorporated into ANRE, the energy regulatory agency. ANRE’s EE department suffers from
similar governance issues as ARCE did before. It is not autonomous, properly resourced and
accountable, and lacks good data, all of which are factors that undermine its ability to design,
implement, evaluate, and redesign programs. Energy efficiency and renewable agencies have
been established at the local level, particularly in cities participating in the COM and
EnergieCites.
97. As a result, coordination between many ministries and levels of government is needed for
a seamless implementation of EE measures required by existing laws and regulations. This
coordination is frequently missing due to the lack of staff in general and with experience in EE
issues in particular. The need to implement the EU OPs with their huge resources exacerbates the
problems: procedures need to be established but are frequently not streamlined; prioritization is
missing or based on too little information; procurement is complicated and time consuming.
98. Energy Supply Entities are not involved or interested in demand side EE issues; this
could change if Romania implements an EE obligation scheme, following the 2012 EED.
99. Energy Service Providers: very few ESCOs27
have a track record of implementing EPC
projects.
100. EE Products and EE Capacity of Industries and Trades: the availability of EE
products is improving and does not seem to be much different from that in other EU countries;
capacity building for energy managers and auditors for the industrial and building sectors has
been scaled up; the construction industry needs EE skills upgrade (architects, engineers,
developers, builders and personnel).
101. Monitoring &Verification (M&V) Agencies: no agencies seem to exist.
102. Financial Institutions: Major banks have some interest and gained experience in EE
lending, especially since EBRD started its EE credit lines in 2009; however, they are still limited
to a narrow range of sectors, mostly industry, and slowly expanding into the municipal and
residential sectors as well as the financing of ESCOs; FREE has been largely inactive since
2009.
27
One for electricity, one for thermal services and one working with CHP projects; Econoler 2011.
36
103. Energy Users:
Households and HOAs: limited knowledge of EE options and benefits as well as how to
access financing. Individual billing of consumers supplied by public DH systems on the
basis of heat meters or heat cost allocators was to be implemented by 2009, but has not
been completed
Industry: larger industries have potential EE knowledge through mandatory energy
managers and energy audits. SMEs are being engaged through EBRD credit lines that
incorporate technical support and grant elements
Public sector: basic information on building stock is missing and prioritization therefore
difficult
Commercial sector: limited knowledge of EE options and benefits. Some interest in green
buildings is due to corporate sustainability policies and to enhance public image
104. Other contributing factors to implementation problems. So far, a database for the
Romanian building stock and its energy consumption characteristics and savings potential does
not exist. It is planned to establish an inventory of public buildings to ensure the definition of a
coherent plan for the renovation of the existing public building stock. It would help to develop
audit templates to ensure consistent data collection and minimize costs. A similar effort should
be completed for residential buildings by localities. The UNDP project (UNDP 2011) attempts to
provide some initial information on building types and designs of block buildings that would
facilitate energy audits and design of EE measures. In selected municipalities the project will
assemble building registries28 that would serve to prioritize areas for building renovation.
105. In principle, ANRE’s EE department has the overall responsibility to formulate,
implement, evaluate and report on EE programs. De facto, the ministries responsible for sector
policies assume several of these roles. Frequently, they lack the resources and capabilities to do
this. As a result, especially the evaluation and monitoring of results of programs is deficient.
Gathering this information (financing and results), including monitoring, should be mandatory
for publicly financed projects.
106. Resources for sustained information campaigns about EE benefits and financing are very
limited with the result that participation is limited. Most information and capacity building
programs continue to be financed by IFIs and donors within their projects.
107. Summarizing: The support structure for delivering EE investments is not adequate. This
results in too little planning, data gathering and analysis, ability to prioritize, information about
funding opportunities and requirements, preparation of project pipelines, slow and complex
procurement, no M&V capacity, lack of preparing and disseminating information about results
and benefits of EE interventions.
28
Information in the registry is expected to include: technical information about the building (useful area,
completion date, number of floors, number and size of rooms, etc.), information on the ownership structure, type of
building users, number of building users, heating/cooling source, theoretical energy demand (according to any audits
carried out), actual energy use (according to previous records), pictures of the building (including areas that need
improvement), potential EE measures, including estimated investment costs, energy to be saved, and GHG
emissions reduction at the primary energy source (UNDP 2011).
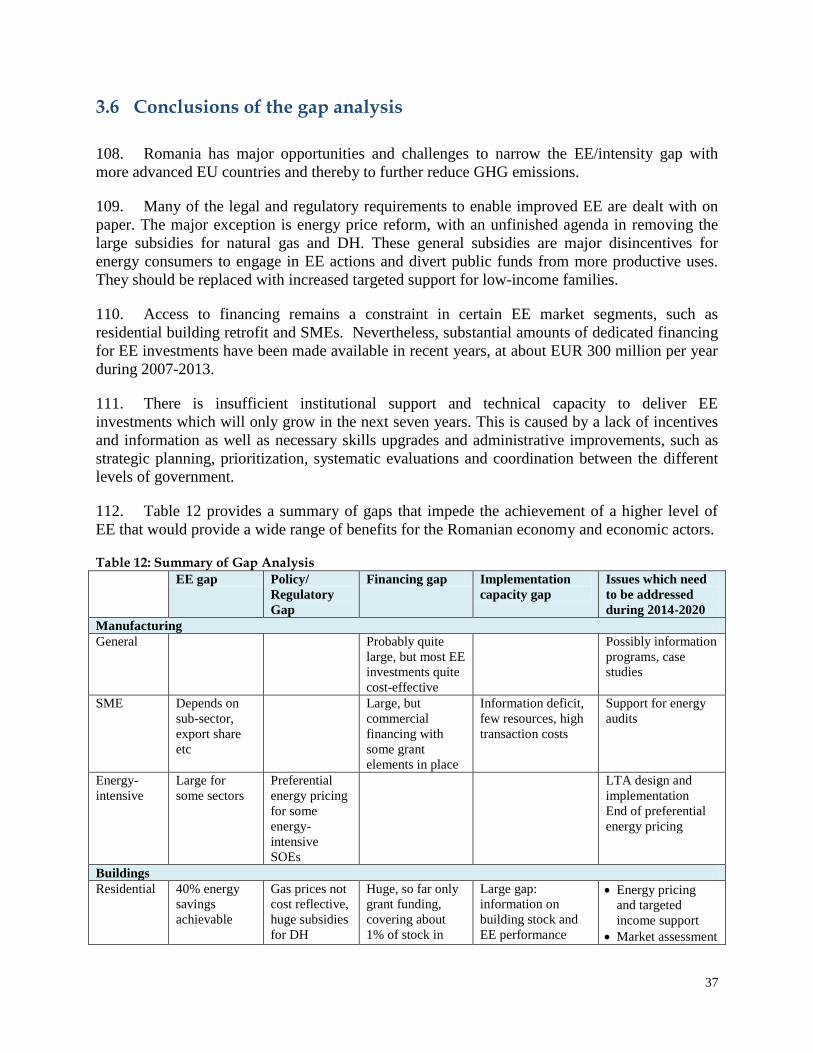
37
3.6 Conclusions of the gap analysis
108. Romania has major opportunities and challenges to narrow the EE/intensity gap with
more advanced EU countries and thereby to further reduce GHG emissions.
109. Many of the legal and regulatory requirements to enable improved EE are dealt with on
paper. The major exception is energy price reform, with an unfinished agenda in removing the
large subsidies for natural gas and DH. These general subsidies are major disincentives for
energy consumers to engage in EE actions and divert public funds from more productive uses.
They should be replaced with increased targeted support for low-income families.
110. Access to financing remains a constraint in certain EE market segments, such as
residential building retrofit and SMEs. Nevertheless, substantial amounts of dedicated financing
for EE investments have been made available in recent years, at about EUR 300 million per year
during 2007-2013.
111. There is insufficient institutional support and technical capacity to deliver EE
investments which will only grow in the next seven years. This is caused by a lack of incentives
and information as well as necessary skills upgrades and administrative improvements, such as
strategic planning, prioritization, systematic evaluations and coordination between the different
levels of government.
112. Table 12 provides a summary of gaps that impede the achievement of a higher level of
EE that would provide a wide range of benefits for the Romanian economy and economic actors.
Table 12: Summary of Gap Analysis
EE gap Policy/
Regulatory
Gap
Financing gap Implementation
capacity gap
Issues which need
to be addressed
during 2014-2020
Manufacturing
General Probably quite
large, but most EE
investments quite
cost-effective
Possibly information
programs, case
studies
SME Depends on
sub-sector,
export share
etc
Large, but
commercial
financing with
some grant
elements in place
Information deficit,
few resources, high
transaction costs
Support for energy
audits
Energy-
intensive
Large for
some sectors
Preferential
energy pricing
for some
energy-
intensive
SOEs
LTA design and
implementation
End of preferential
energy pricing
Buildings
Residential 40% energy
savings
achievable
Gas prices not
cost reflective,
huge subsidies
for DH
Huge, so far only
grant funding,
covering about
1% of stock in
Large gap:
information on
building stock and
EE performance
Energy pricing
and targeted
income support
Market assessment
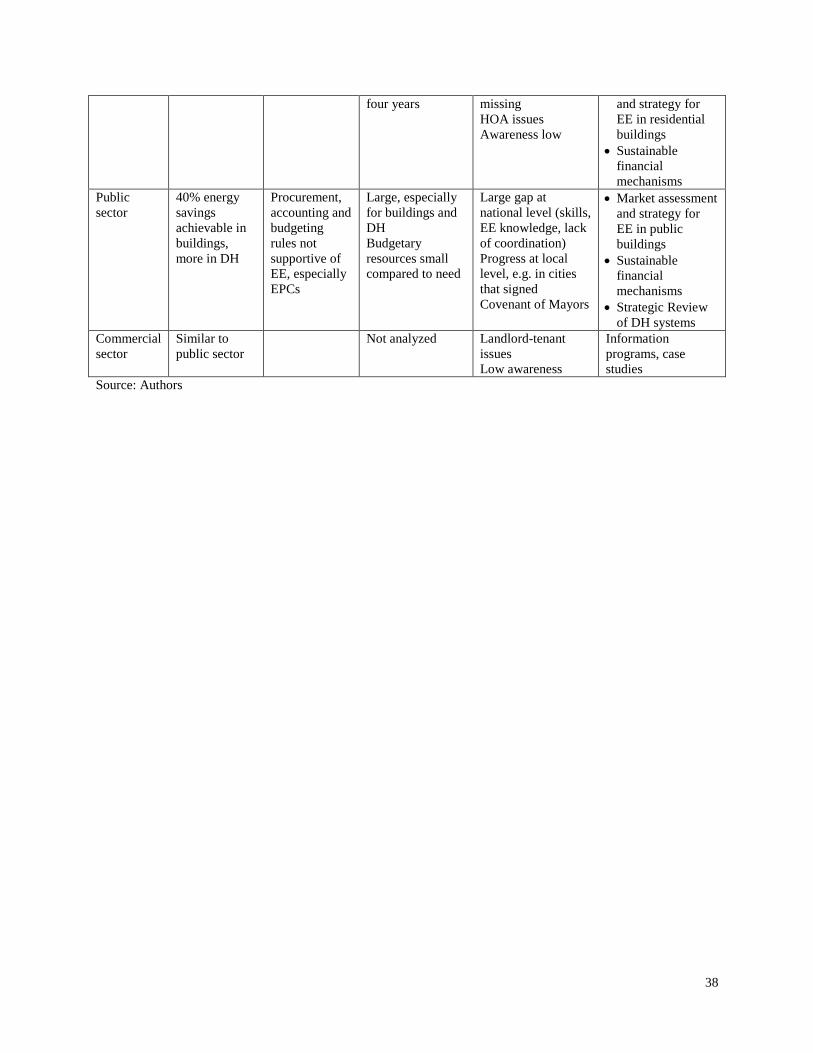
38
four years missing
HOA issues
Awareness low
and strategy for
EE in residential
buildings
Sustainable
financial
mechanisms
Public
sector
40% energy
savings
achievable in
buildings,
more in DH
Procurement,
accounting and
budgeting
rules not
supportive of
EE, especially
EPCs
Large, especially
for buildings and
DH
Budgetary
resources small
compared to need
Large gap at
national level (skills,
EE knowledge, lack
of coordination)
Progress at local
level, e.g. in cities
that signed
Covenant of Mayors
Market assessment
and strategy for
EE in public
buildings
Sustainable
financial
mechanisms
Strategic Review
of DH systems
Commercial
sector
Similar to
public sector
Not analyzed Landlord-tenant
issues
Low awareness
Information
programs, case
studies
Source: Authors
39
4 Preliminary Assessment of District Heating
4.1 Key sector issues
113. Centralized heating (or District Heating – DH) in Romania is beset by serious problems
that have been known for many years (see, for example, the 2004 National DH Strategy29
). But
since no serious changes were made in how the sector functions, DH has become a serious drain
on public finances without providing a satisfactory service to its customers. It is estimated that
the amount of (cross-) subsidies for DH has increased from EUR 88 million in 2003 to about
EUR 500 million in 2010,30
while serving about 1/3 less customers (see below). If the sector is to
receive financing from EU structural and cohesion funds during the 2014-20 period, substantial
reforms need to be made during this period to set DH on a path to become an economic and
financially viable modern service or the funds could be wasted.
114. This assessment only highlights the key issues which the DH sector faces. Further
investigations will be needed to analyze the options for improving and economizing urban
heating in general and DH in particular. The following is a list of issues that has to be dealt with
urgently:
Economic viability of many DH systems. Decline in the number of DH systems from
more than 300 in 1995/96 to 100 in 2010/11, of which 83 are in urban areas. An
assessment is needed to determine which of these remaining ones are economically viable
and should be assisted to restore service quality, improve efficiency, and achieve long-
term financial sustainability. For those that have declined beyond the point of economic
viability, alternative heating service strategies need to be developed.
Continued decline in the number of customers. The residential DH customer base was
reduced from 2.2 million apartments in 1990 to 1.4 million in 2012. In 16 of the 31 DH
systems with initially more than 10,000 customers, the number of customers declined by
more than 50%. Disconnections occurred (and are still occurring though at a much
reduced pace) due to an inability to pay, but more importantly due to competition with
subsidized natural gas prices. In addition to addressing the artificial price distortions,
options to stem disconnections and establish criteria for obligatory DH connections need
to be carefully assessed.
Inefficiencies and high losses in the DH systems:
- Production: In 2010 cogeneration had a share of 10.7% in total electricity generation
and 69.4% in total heat supply (ANRE estimate). 51% of the heat supplied is
generated from natural gas and 38.5% from coal, mainly lignite. Most of the old
inefficient CHPs31
and heat-only boilers are still not upgraded or replaced with
29
The Strategy estimates that investment in the rehabilitation and renovation of heat generation, transmission and
distribution systems would total US$ 6.8 billion (EUR 5.5 billion), requiring annual investment of US$ 453 million
(EUR 364 million) over a period of 15 years. 30
According to PWC 2011 analysis. 31
With very few exceptions, none of the existing plants in Romania comply with the EU definition of high-
efficiency cogeneration. ANRE’s regulation qualifies a CHP facility as high efficiency cogeneration if it realizes
10% fuel savings compared to separate generation of electricity and heat by equivalent ‘reference’ power plants.
40
modern generation equipment, nor are they equipped with adequate burning
equipment. Therefore, the SO2 and NOX emissions exceed EU norms. With an
average of 275 tons of CO2 per Gcal, Romania’s DH producers rank among the most
polluting DH service suppliers in the EU.
- Transportation and distribution networks suffer high heat and water losses. The
distribution networks incur almost 30% losses on average (PwC2011, based on
ANRSC data), compared to 5-10% in the case of fairly new or modernized networks.
- As a result of those inefficiencies, the cost of DH is about 18-20% higher than in
some other EU countries (see Figure 10).
Distortion in residential heat and gas tariffs. Tariffs for residential consumers are
highly subsidized, on average about 50%, through a complex system of support for high-
efficiency cogeneration (paid by electricity consumers, thus reducing the cost of
produced heat)32
and subsidies for local heating companies (provided by municipalities).
The subsidy system is complemented by a heat social assistance system that offers
targeted benefits to poor households.33
It covers less than 15% of the total DH support
and is based and differentiated on a social eligibility criterion, including monthly income.
If DH tariffs were not subsidized, heat costs would amount to about 12% of average
annual incomes. With the subsidies, the burden goes down to 7% on average.34
This is
about the same level as in other CEE countries, such as Poland, Czech Republic, Hungary
and Estonia. See Figure 10. The unit cost of heat sold at the subsidized tariff is slightly
Based on the Romanian reference plants, all existing CHP equipment using steam boilers fulfills the criterion despite
its obsolescence and modest heat efficiency. The share of real highly efficient technology (CCGT, GTs with heat
recovery, and modern dispersed cogeneration units) in total DH supply is still insignificant. The ‘rehabilitation’
projects so far were driven by environmental objectives, including mandatory desulphurization and NOX emission
limitation, while preserving the basic old equipment. 32
The current support scheme applied by ANRE as a cogeneration bonus to all existing cogeneration suppliers
does not promote high efficient technology and may be unsustainable in the long run. Such inefficient and typically
oversized plants should be replaced with dispersed CHP and local peak load boilers. “High efficiency cogeneration”
is defined as when there is 10% primary energy savings as against separate generation of electricity and heat by
reference power plants (and minimum 70% overall heat efficiency for the units larger than 25 MW). The official
reason of the simplified solution to declare a high efficiency cogeneration facility makes reference to the Art. 12
alin. (2) of the 2004/8/CE Directive. It claims for missing the heat efficiency data of the Annex II in the EU
Directive, the ratio C between supplied electricity and heat, in particular. The necessary bonus funds are collected on
a monthly basis as a cogeneration contribution from all electricity customers as well as exporting electricity
suppliers and transferred to Transelectrica, the scheme administrator. The amount of contribution is established by
ANRE on an annual basis and reviewed each semester. ANRE’s Order No. 50/2012 has set it to 23.1 lei/MWh for
the year 2013. Cogeneration bonus is a scheme that establishes a financial support in favor of non-depreciated
cogeneration power plants with a view to maintaining them viable on the competitive electricity market. The scheme
is planned for a maximum power capacity of 4000 MWe for the period 2011-2023. Each cogeneration producer can
receive the support for a maximum period of 11 consecutive years. For the entire period, ANRE has estimated a total
budget of EUR 4.1 billion. 33
Heating aid during the cold season is provided on the basis of GEO 70/2011 on social protection measures during
the cold season. This is available to families who use thermal energy in a centralized house heating system, persons
who use natural gas, or wood, coal and oil, are eligible to these measures. The GEO stipulates the maximum income
of a person or a family for being eligible for the heating allowance, and it stipulates allowance amounts for heating
with natural gas, wood, coal, oil, and thermal energy in a centralized system. The fiscal revenues to support this
social measure originate from the “windfall revenue tax” in the gas sector, introduced in early 2013, which allows
the Government to withhold above 60% of the additional revenues of (state- and private) companies in gas resulting
from higher domestic gas prices. 34
The problem is exacerbated by billing for heat only during the heating season. During these months even
subsidized costs of heating can become unsustainably high for a large part of the population.
41
lower than the levelized costs of an individual heating system based on the (subsidized)
price of natural gas (ATKearney, 2009).
Complex system of regulation with two regulators. ANRE oversees electricity
producers, including CHPs. ANRSC oversees public services at the municipal level,
including heat only boilers and DH suppliers. Prices are set, adjusted and changed on the
basis of ANRE- and ANRSC-approved methodologies. The local heat price is the
aggregation of the generation price with the transportation, distribution and supply tariffs,
which are approved by local authorities (APLs) and ANRSC for each utility. The current
‘cost – plus’ methodologies take into consideration justified operational, capital and
environmental costs, and a profit margin that should be less than 5%.
One-part heat tariff. In most other EU countries two-part heat tariffs with a fixed and a
variable part are the norm and follow the cost structure with the high fixed costs of
delivering heat. The variable one-part tariff exacerbates the financial problems of heat
suppliers in an environment where consumers save energy and/or disconnect.
Incomplete implementation of consumption-based billing. While almost all customers
(HOAs in the case of block buildings) are now individually metered35
and billed based on
their heat and hot water consumption, this does not universally extend to individual
dwellings. Only about 50% of dwellings with DH supply are equipped with heat/hot
water meters or heat cost allocators (and thermostatic valves to regulate heat
consumption).
Insufficient investment in DH infrastructure. The national program District Heating -
Heat and Comfort: Rehabilitation of centralized DH systems provides cofinancing from
the central government for investments in DH transportation and distribution networks
which are under the control and financial responsibility of local authorities. In 2011 and
2012, EUR13 and 15 million, respectively, were invested with slightly more than 50% of
the total coming from the national government.36
115. Some of the reforms that need to be implemented to stem the further deterioration of DH
in Romania include:
Strategic reviews of local DH systems to establish the most efficient and cost-effective
heat supply options, taking into account economic levels of fuel prices and environmental
costs of burning fuels, as well as modern heat and cogeneration technologies, efficient
and cost-effective distributed systems. The reviews should also consider how to establish
PPPs for those DH systems that are deemed viable to bring in private sector funds and
expertise in modernizing and efficiently operating DH systems;
Acceleration of electricity and natural gas price liberalization to maximize the role of the
market in resources allocation;
Abolishment of all price subsidies and targeting only low-income families for subsidies
in the form of cash payments within the social protection system;
35
97% for heat and 96% for hot water consumption (Source: ANRSC July 2013) 36
2012: RON 60 million (EUR 13 million), of which Lei 31.2 million from the national budget and Lei 28.98
million from local budgets. 2011: 42.8 million lei were allocated from the 2011 state budget to 27 administrative -
territorial units of which only 35.46 million were spent by 22 units. The own contribution of local authorities was
28.7 million lei. This totals RON 64 million (EUR 15 million).
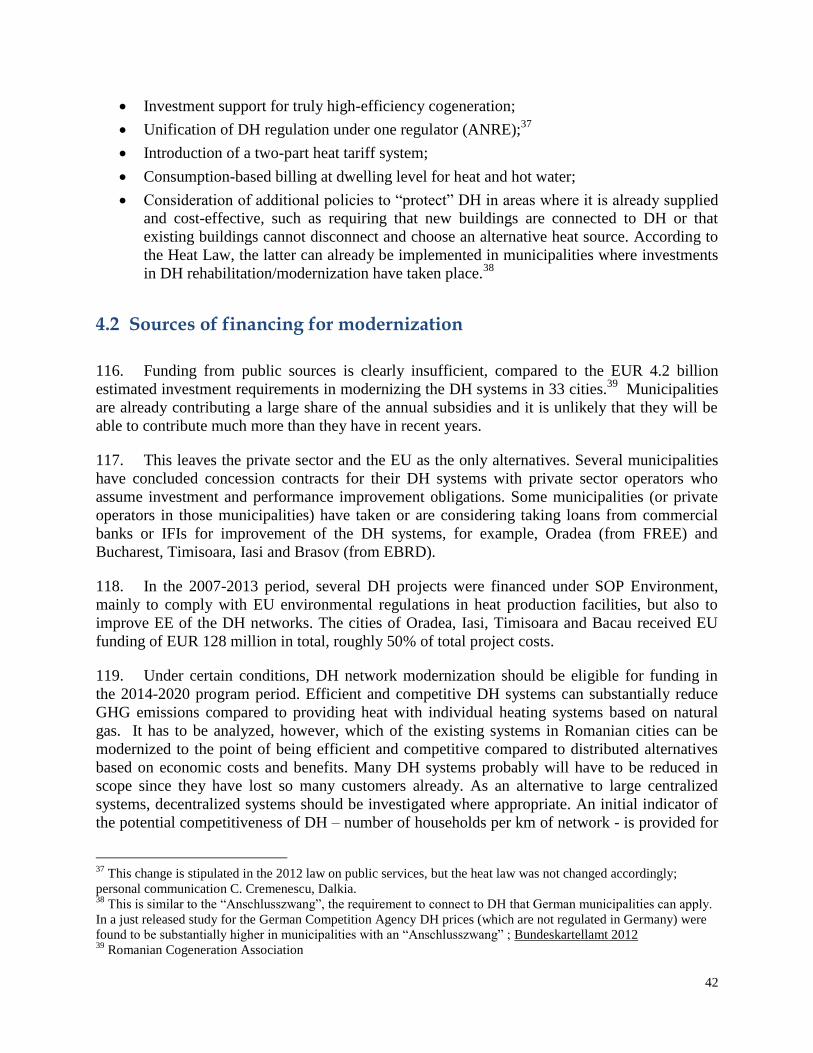
42
Investment support for truly high-efficiency cogeneration;
Unification of DH regulation under one regulator (ANRE);37
Introduction of a two-part heat tariff system;
Consumption-based billing at dwelling level for heat and hot water;
Consideration of additional policies to “protect” DH in areas where it is already supplied
and cost-effective, such as requiring that new buildings are connected to DH or that
existing buildings cannot disconnect and choose an alternative heat source. According to
the Heat Law, the latter can already be implemented in municipalities where investments
in DH rehabilitation/modernization have taken place.38
4.2 Sources of financing for modernization
116. Funding from public sources is clearly insufficient, compared to the EUR 4.2 billion
estimated investment requirements in modernizing the DH systems in 33 cities.39
Municipalities
are already contributing a large share of the annual subsidies and it is unlikely that they will be
able to contribute much more than they have in recent years.
117. This leaves the private sector and the EU as the only alternatives. Several municipalities
have concluded concession contracts for their DH systems with private sector operators who
assume investment and performance improvement obligations. Some municipalities (or private
operators in those municipalities) have taken or are considering taking loans from commercial
banks or IFIs for improvement of the DH systems, for example, Oradea (from FREE) and
Bucharest, Timisoara, Iasi and Brasov (from EBRD).
118. In the 2007-2013 period, several DH projects were financed under SOP Environment,
mainly to comply with EU environmental regulations in heat production facilities, but also to
improve EE of the DH networks. The cities of Oradea, Iasi, Timisoara and Bacau received EU
funding of EUR 128 million in total, roughly 50% of total project costs.
119. Under certain conditions, DH network modernization should be eligible for funding in
the 2014-2020 program period. Efficient and competitive DH systems can substantially reduce
GHG emissions compared to providing heat with individual heating systems based on natural
gas. It has to be analyzed, however, which of the existing systems in Romanian cities can be
modernized to the point of being efficient and competitive compared to distributed alternatives
based on economic costs and benefits. Many DH systems probably will have to be reduced in
scope since they have lost so many customers already. As an alternative to large centralized
systems, decentralized systems should be investigated where appropriate. An initial indicator of
the potential competitiveness of DH – number of households per km of network - is provided for
37
This change is stipulated in the 2012 law on public services, but the heat law was not changed accordingly;
personal communication C. Cremenescu, Dalkia. 38
This is similar to the “Anschlusszwang”, the requirement to connect to DH that German municipalities can apply.
In a just released study for the German Competition Agency DH prices (which are not regulated in Germany) were
found to be substantially higher in municipalities with an “Anschlusszwang” ; Bundeskartellamt 2012 39
Romanian Cogeneration Association
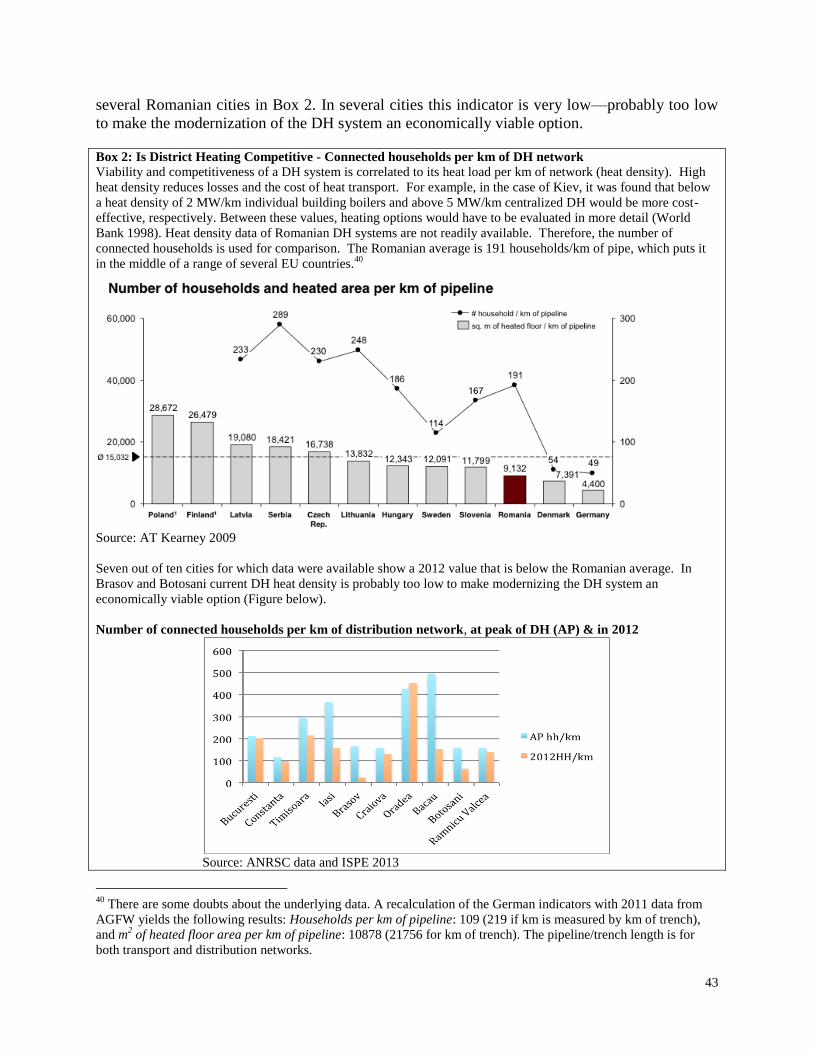
43
several Romanian cities in Box 2. In several cities this indicator is very low—probably too low
to make the modernization of the DH system an economically viable option.
Box 2: Is District Heating Competitive - Connected households per km of DH network
Viability and competitiveness of a DH system is correlated to its heat load per km of network (heat density). High
heat density reduces losses and the cost of heat transport. For example, in the case of Kiev, it was found that below
a heat density of 2 MW/km individual building boilers and above 5 MW/km centralized DH would be more cost-
effective, respectively. Between these values, heating options would have to be evaluated in more detail (World
Bank 1998). Heat density data of Romanian DH systems are not readily available. Therefore, the number of
connected households is used for comparison. The Romanian average is 191 households/km of pipe, which puts it
in the middle of a range of several EU countries.40
Source: AT Kearney 2009
Seven out of ten cities for which data were available show a 2012 value that is below the Romanian average. In
Brasov and Botosani current DH heat density is probably too low to make modernizing the DH system an
economically viable option (Figure below).
Number of connected households per km of distribution network, at peak of DH (AP) & in 2012
Source: ANRSC data and ISPE 2013
40
There are some doubts about the underlying data. A recalculation of the German indicators with 2011 data from
AGFW yields the following results: Households per km of pipeline: 109 (219 if km is measured by km of trench),
and m2 of heated floor area per km of pipeline: 10878 (21756 for km of trench). The pipeline/trench length is for
both transport and distribution networks.
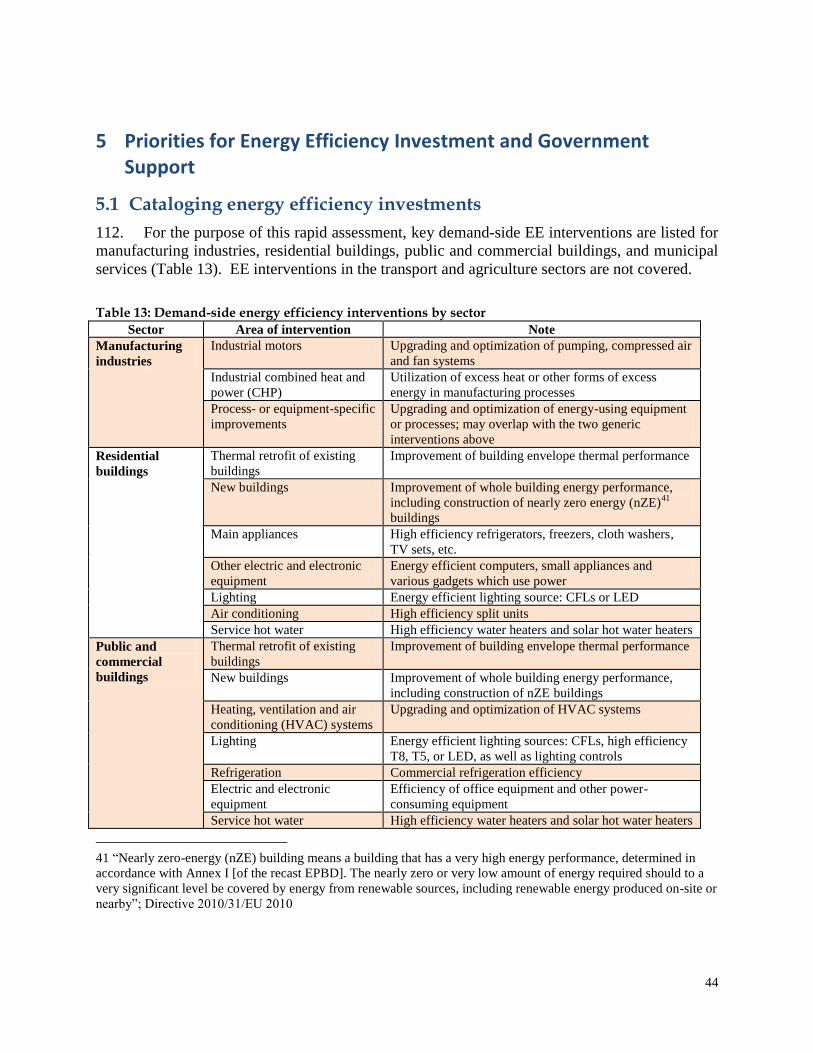
44
5 Priorities for Energy Efficiency Investment and Government Support
5.1 Cataloging energy efficiency investments
112. For the purpose of this rapid assessment, key demand-side EE interventions are listed for
manufacturing industries, residential buildings, public and commercial buildings, and municipal
services (Table 13). EE interventions in the transport and agriculture sectors are not covered.
Table 13: Demand-side energy efficiency interventions by sector
Sector Area of intervention Note
Manufacturing
industries
Industrial motors Upgrading and optimization of pumping, compressed air
and fan systems
Industrial combined heat and
power (CHP)
Utilization of excess heat or other forms of excess
energy in manufacturing processes
Process- or equipment-specific
improvements
Upgrading and optimization of energy-using equipment
or processes; may overlap with the two generic
interventions above
Residential
buildings
Thermal retrofit of existing
buildings
Improvement of building envelope thermal performance
New buildings Improvement of whole building energy performance,
including construction of nearly zero energy (nZE)41
buildings
Main appliances High efficiency refrigerators, freezers, cloth washers,
TV sets, etc.
Other electric and electronic
equipment
Energy efficient computers, small appliances and
various gadgets which use power
Lighting Energy efficient lighting source: CFLs or LED
Air conditioning High efficiency split units
Service hot water High efficiency water heaters and solar hot water heaters
Public and
commercial
buildings
Thermal retrofit of existing
buildings
Improvement of building envelope thermal performance
New buildings Improvement of whole building energy performance,
including construction of nZE buildings
Heating, ventilation and air
conditioning (HVAC) systems
Upgrading and optimization of HVAC systems
Lighting Energy efficient lighting sources: CFLs, high efficiency
T8, T5, or LED, as well as lighting controls
Refrigeration Commercial refrigeration efficiency
Electric and electronic
equipment
Efficiency of office equipment and other power-
consuming equipment
Service hot water High efficiency water heaters and solar hot water heaters
41 “Nearly zero-energy (nZE) building means a building that has a very high energy performance, determined in
accordance with Annex I [of the recast EPBD]. The nearly zero or very low amount of energy required should to a
very significant level be covered by energy from renewable sources, including renewable energy produced on-site or
nearby”; Directive 2010/31/EU 2010
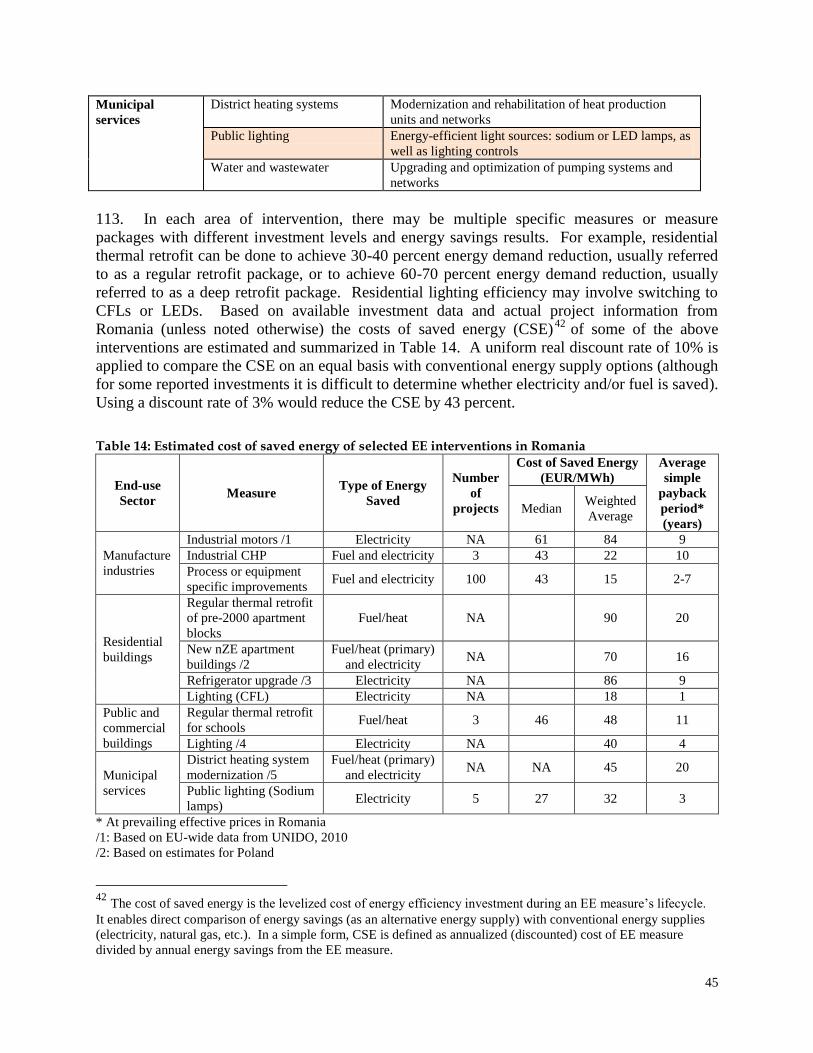
45
Municipal
services
District heating systems Modernization and rehabilitation of heat production
units and networks
Public lighting Energy-efficient light sources: sodium or LED lamps, as
well as lighting controls
Water and wastewater Upgrading and optimization of pumping systems and
networks
113. In each area of intervention, there may be multiple specific measures or measure
packages with different investment levels and energy savings results. For example, residential
thermal retrofit can be done to achieve 30-40 percent energy demand reduction, usually referred
to as a regular retrofit package, or to achieve 60-70 percent energy demand reduction, usually
referred to as a deep retrofit package. Residential lighting efficiency may involve switching to
CFLs or LEDs. Based on available investment data and actual project information from
Romania (unless noted otherwise) the costs of saved energy (CSE)42
of some of the above
interventions are estimated and summarized in Table 14. A uniform real discount rate of 10% is
applied to compare the CSE on an equal basis with conventional energy supply options (although
for some reported investments it is difficult to determine whether electricity and/or fuel is saved).
Using a discount rate of 3% would reduce the CSE by 43 percent.
Table 14: Estimated cost of saved energy of selected EE interventions in Romania
End-use
Sector Measure
Type of Energy
Saved
Number
of
projects
Cost of Saved Energy
(EUR/MWh)
Average
simple
payback
period*
(years)
Median Weighted
Average
Manufacture
industries
Industrial motors /1 Electricity NA 61 84 9
Industrial CHP Fuel and electricity 3 43 22 10
Process or equipment
specific improvements Fuel and electricity 100 43 15 2-7
Residential
buildings
Regular thermal retrofit
of pre-2000 apartment
blocks
Fuel/heat NA 90 20
New nZE apartment
buildings /2
Fuel/heat (primary)
and electricity NA 70 16
Refrigerator upgrade /3 Electricity NA 86 9
Lighting (CFL) Electricity NA 18 1
Public and
commercial
buildings
Regular thermal retrofit
for schools Fuel/heat 3 46 48 11
Lighting /4 Electricity NA 40 4
Municipal
services
District heating system
modernization /5
Fuel/heat (primary)
and electricity NA NA 45 20
Public lighting (Sodium
lamps) Electricity 5 27 32 3
* At prevailing effective prices in Romania
/1: Based on EU-wide data from UNIDO, 2010
/2: Based on estimates for Poland
42
The cost of saved energy is the levelized cost of energy efficiency investment during an EE measure’s lifecycle.
It enables direct comparison of energy savings (as an alternative energy supply) with conventional energy supplies
(electricity, natural gas, etc.). In a simple form, CSE is defined as annualized (discounted) cost of EE measure
divided by annual energy savings from the EE measure.
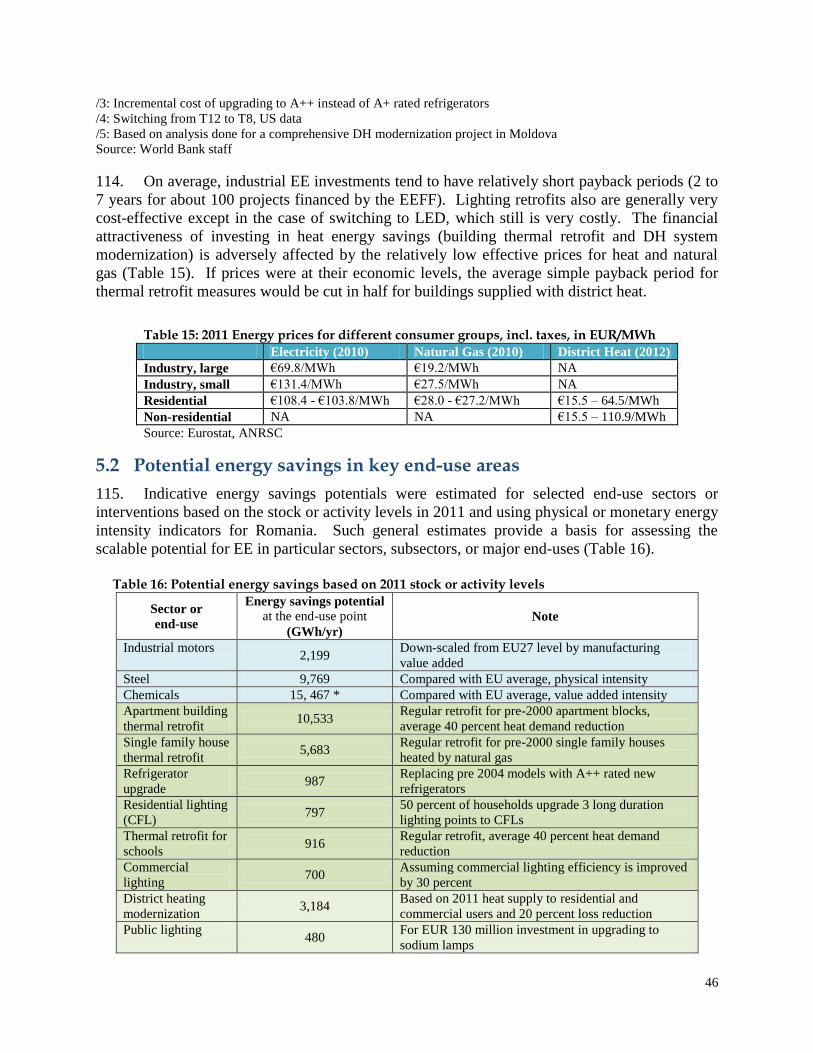
46
/3: Incremental cost of upgrading to A++ instead of A+ rated refrigerators
/4: Switching from T12 to T8, US data
/5: Based on analysis done for a comprehensive DH modernization project in Moldova
Source: World Bank staff
114. On average, industrial EE investments tend to have relatively short payback periods (2 to
7 years for about 100 projects financed by the EEFF). Lighting retrofits also are generally very
cost-effective except in the case of switching to LED, which still is very costly. The financial
attractiveness of investing in heat energy savings (building thermal retrofit and DH system
modernization) is adversely affected by the relatively low effective prices for heat and natural
gas (Table 15). If prices were at their economic levels, the average simple payback period for
thermal retrofit measures would be cut in half for buildings supplied with district heat.
Table 15: 2011 Energy prices for different consumer groups, incl. taxes, in EUR/MWh
Electricity (2010) Natural Gas (2010) District Heat (2012)
Industry, large €69.8/MWh €19.2/MWh NA
Industry, small €131.4/MWh €27.5/MWh NA
Residential €108.4 - €103.8/MWh €28.0 - €27.2/MWh €15.5 – 64.5/MWh
Non-residential NA NA €15.5 – 110.9/MWh
Source: Eurostat, ANRSC
5.2 Potential energy savings in key end-use areas
115. Indicative energy savings potentials were estimated for selected end-use sectors or
interventions based on the stock or activity levels in 2011 and using physical or monetary energy
intensity indicators for Romania. Such general estimates provide a basis for assessing the
scalable potential for EE in particular sectors, subsectors, or major end-uses (Table 16).
Table 16: Potential energy savings based on 2011 stock or activity levels
Sector or
end-use
Energy savings potential
at the end-use point
(GWh/yr)
Note
Industrial motors 2,199
Down-scaled from EU27 level by manufacturing
value added
Steel 9,769 Compared with EU average, physical intensity
Chemicals 15, 467 * Compared with EU average, value added intensity
Apartment building
thermal retrofit 10,533
Regular retrofit for pre-2000 apartment blocks,
average 40 percent heat demand reduction
Single family house
thermal retrofit 5,683
Regular retrofit for pre-2000 single family houses
heated by natural gas
Refrigerator
upgrade 987
Replacing pre 2004 models with A++ rated new
refrigerators
Residential lighting
(CFL) 797
50 percent of households upgrade 3 long duration
lighting points to CFLs
Thermal retrofit for
schools 916
Regular retrofit, average 40 percent heat demand
reduction
Commercial
lighting 700
Assuming commercial lighting efficiency is improved
by 30 percent
District heating
modernization 3,184
Based on 2011 heat supply to residential and
commercial users and 20 percent loss reduction
Public lighting 480
For EUR 130 million investment in upgrading to
sodium lamps
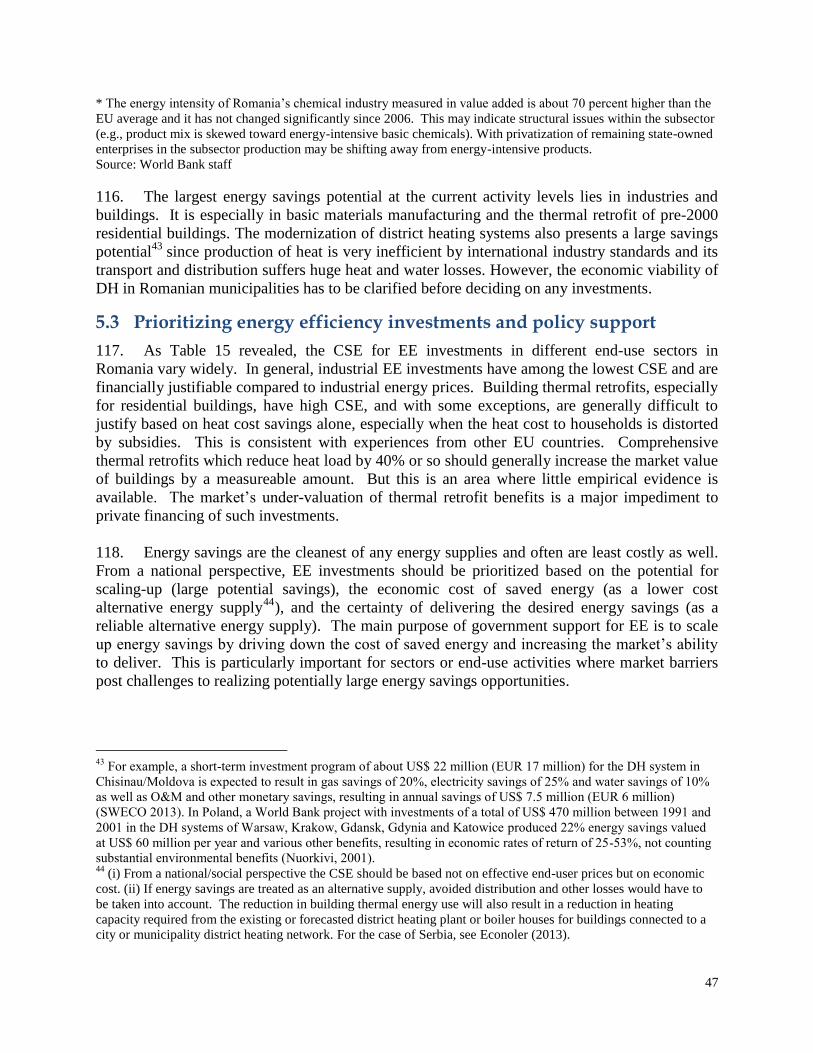
47
* The energy intensity of Romania’s chemical industry measured in value added is about 70 percent higher than the
EU average and it has not changed significantly since 2006. This may indicate structural issues within the subsector
(e.g., product mix is skewed toward energy-intensive basic chemicals). With privatization of remaining state-owned
enterprises in the subsector production may be shifting away from energy-intensive products.
Source: World Bank staff
116. The largest energy savings potential at the current activity levels lies in industries and
buildings. It is especially in basic materials manufacturing and the thermal retrofit of pre-2000
residential buildings. The modernization of district heating systems also presents a large savings
potential43
since production of heat is very inefficient by international industry standards and its
transport and distribution suffers huge heat and water losses. However, the economic viability of
DH in Romanian municipalities has to be clarified before deciding on any investments.
5.3 Prioritizing energy efficiency investments and policy support
117. As Table 15 revealed, the CSE for EE investments in different end-use sectors in
Romania vary widely. In general, industrial EE investments have among the lowest CSE and are
financially justifiable compared to industrial energy prices. Building thermal retrofits, especially
for residential buildings, have high CSE, and with some exceptions, are generally difficult to
justify based on heat cost savings alone, especially when the heat cost to households is distorted
by subsidies. This is consistent with experiences from other EU countries. Comprehensive
thermal retrofits which reduce heat load by 40% or so should generally increase the market value
of buildings by a measureable amount. But this is an area where little empirical evidence is
available. The market’s under-valuation of thermal retrofit benefits is a major impediment to
private financing of such investments.
118. Energy savings are the cleanest of any energy supplies and often are least costly as well.
From a national perspective, EE investments should be prioritized based on the potential for
scaling-up (large potential savings), the economic cost of saved energy (as a lower cost
alternative energy supply44
), and the certainty of delivering the desired energy savings (as a
reliable alternative energy supply). The main purpose of government support for EE is to scale
up energy savings by driving down the cost of saved energy and increasing the market’s ability
to deliver. This is particularly important for sectors or end-use activities where market barriers
post challenges to realizing potentially large energy savings opportunities.
43
For example, a short-term investment program of about US$ 22 million (EUR 17 million) for the DH system in
Chisinau/Moldova is expected to result in gas savings of 20%, electricity savings of 25% and water savings of 10%
as well as O&M and other monetary savings, resulting in annual savings of US$ 7.5 million (EUR 6 million)
(SWECO 2013). In Poland, a World Bank project with investments of a total of US$ 470 million between 1991 and
2001 in the DH systems of Warsaw, Krakow, Gdansk, Gdynia and Katowice produced 22% energy savings valued
at US$ 60 million per year and various other benefits, resulting in economic rates of return of 25-53%, not counting
substantial environmental benefits (Nuorkivi, 2001). 44
(i) From a national/social perspective the CSE should be based not on effective end-user prices but on economic
cost. (ii) If energy savings are treated as an alternative supply, avoided distribution and other losses would have to
be taken into account. The reduction in building thermal energy use will also result in a reduction in heating
capacity required from the existing or forecasted district heating plant or boiler houses for buildings connected to a
city or municipality district heating network. For the case of Serbia, see Econoler (2013).
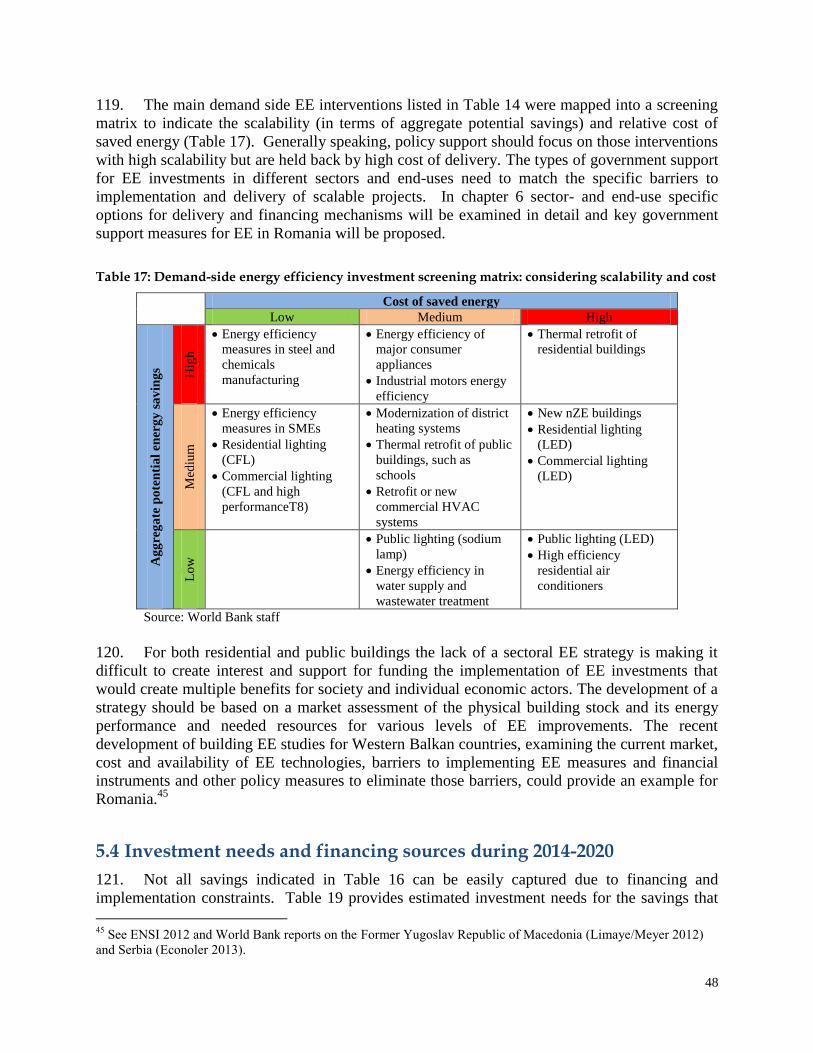
48
119. The main demand side EE interventions listed in Table 14 were mapped into a screening
matrix to indicate the scalability (in terms of aggregate potential savings) and relative cost of
saved energy (Table 17). Generally speaking, policy support should focus on those interventions
with high scalability but are held back by high cost of delivery. The types of government support
for EE investments in different sectors and end-uses need to match the specific barriers to
implementation and delivery of scalable projects. In chapter 6 sector- and end-use specific
options for delivery and financing mechanisms will be examined in detail and key government
support measures for EE in Romania will be proposed.
Table 17: Demand-side energy efficiency investment screening matrix: considering scalability and cost
Cost of saved energy
Low Medium High
Ag
gre
ga
te p
ote
nti
al
en
erg
y s
av
ing
s Hig
h
Energy efficiency
measures in steel and
chemicals
manufacturing
Energy efficiency of
major consumer
appliances
Industrial motors energy
efficiency
Thermal retrofit of
residential buildings
Med
ium
Energy efficiency
measures in SMEs
Residential lighting
(CFL)
Commercial lighting
(CFL and high
performanceT8)
Modernization of district
heating systems
Thermal retrofit of public
buildings, such as
schools
Retrofit or new
commercial HVAC
systems
New nZE buildings
Residential lighting
(LED)
Commercial lighting
(LED)
Lo
w
Public lighting (sodium
lamp)
Energy efficiency in
water supply and
wastewater treatment
Public lighting (LED)
High efficiency
residential air
conditioners
Source: World Bank staff
120. For both residential and public buildings the lack of a sectoral EE strategy is making it
difficult to create interest and support for funding the implementation of EE investments that
would create multiple benefits for society and individual economic actors. The development of a
strategy should be based on a market assessment of the physical building stock and its energy
performance and needed resources for various levels of EE improvements. The recent
development of building EE studies for Western Balkan countries, examining the current market,
cost and availability of EE technologies, barriers to implementing EE measures and financial
instruments and other policy measures to eliminate those barriers, could provide an example for
Romania.45
5.4 Investment needs and financing sources during 2014-2020
121. Not all savings indicated in Table 16 can be easily captured due to financing and
implementation constraints. Table 19 provides estimated investment needs for the savings that
45
See ENSI 2012 and World Bank reports on the Former Yugoslav Republic of Macedonia (Limaye/Meyer 2012)
and Serbia (Econoler 2013).
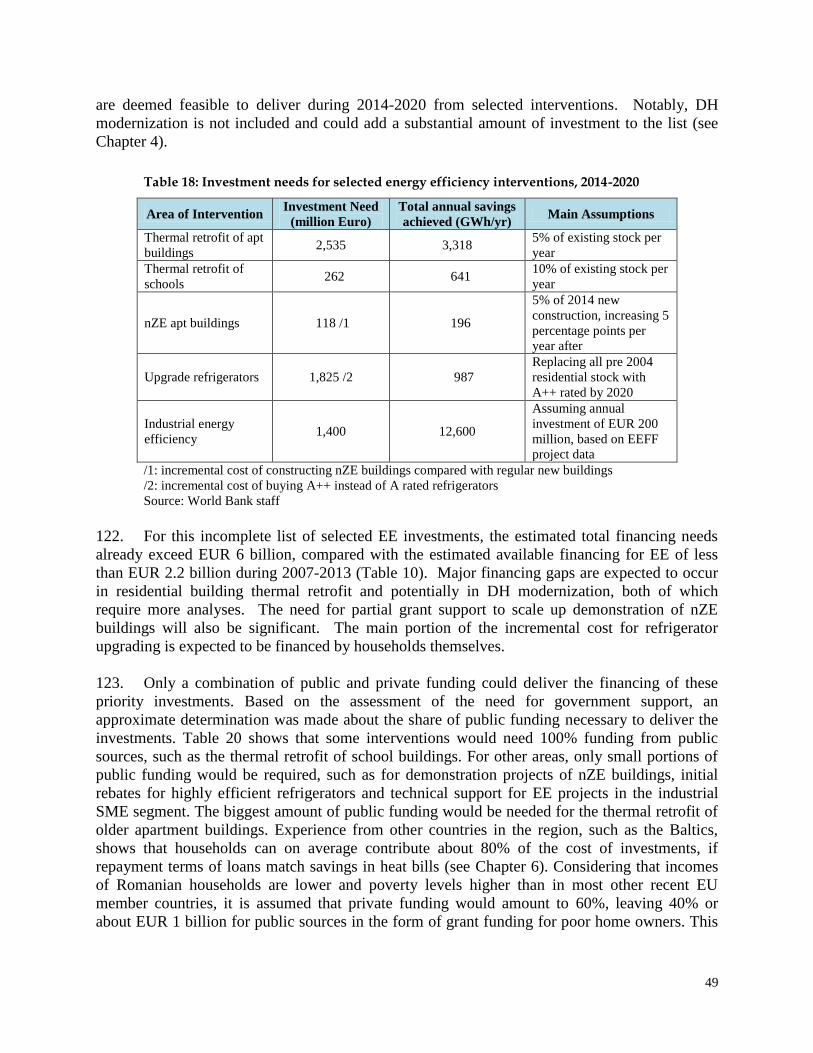
49
are deemed feasible to deliver during 2014-2020 from selected interventions. Notably, DH
modernization is not included and could add a substantial amount of investment to the list (see
Chapter 4).
Table 18: Investment needs for selected energy efficiency interventions, 2014-2020
Area of Intervention Investment Need
(million Euro)
Total annual savings
achieved (GWh/yr) Main Assumptions
Thermal retrofit of apt
buildings 2,535 3,318
5% of existing stock per
year
Thermal retrofit of
schools 262 641
10% of existing stock per
year
nZE apt buildings 118 /1 196
5% of 2014 new
construction, increasing 5
percentage points per
year after
Upgrade refrigerators 1,825 /2 987
Replacing all pre 2004
residential stock with
A++ rated by 2020
Industrial energy
efficiency 1,400 12,600
Assuming annual
investment of EUR 200
million, based on EEFF
project data
/1: incremental cost of constructing nZE buildings compared with regular new buildings
/2: incremental cost of buying A++ instead of A rated refrigerators
Source: World Bank staff
122. For this incomplete list of selected EE investments, the estimated total financing needs
already exceed EUR 6 billion, compared with the estimated available financing for EE of less
than EUR 2.2 billion during 2007-2013 (Table 10). Major financing gaps are expected to occur
in residential building thermal retrofit and potentially in DH modernization, both of which
require more analyses. The need for partial grant support to scale up demonstration of nZE
buildings will also be significant. The main portion of the incremental cost for refrigerator
upgrading is expected to be financed by households themselves.
123. Only a combination of public and private funding could deliver the financing of these
priority investments. Based on the assessment of the need for government support, an
approximate determination was made about the share of public funding necessary to deliver the
investments. Table 20 shows that some interventions would need 100% funding from public
sources, such as the thermal retrofit of school buildings. For other areas, only small portions of
public funding would be required, such as for demonstration projects of nZE buildings, initial
rebates for highly efficient refrigerators and technical support for EE projects in the industrial
SME segment. The biggest amount of public funding would be needed for the thermal retrofit of
older apartment buildings. Experience from other countries in the region, such as the Baltics,
shows that households can on average contribute about 80% of the cost of investments, if
repayment terms of loans match savings in heat bills (see Chapter 6). Considering that incomes
of Romanian households are lower and poverty levels higher than in most other recent EU
member countries, it is assumed that private funding would amount to 60%, leaving 40% or
about EUR 1 billion for public sources in the form of grant funding for poor home owners. This
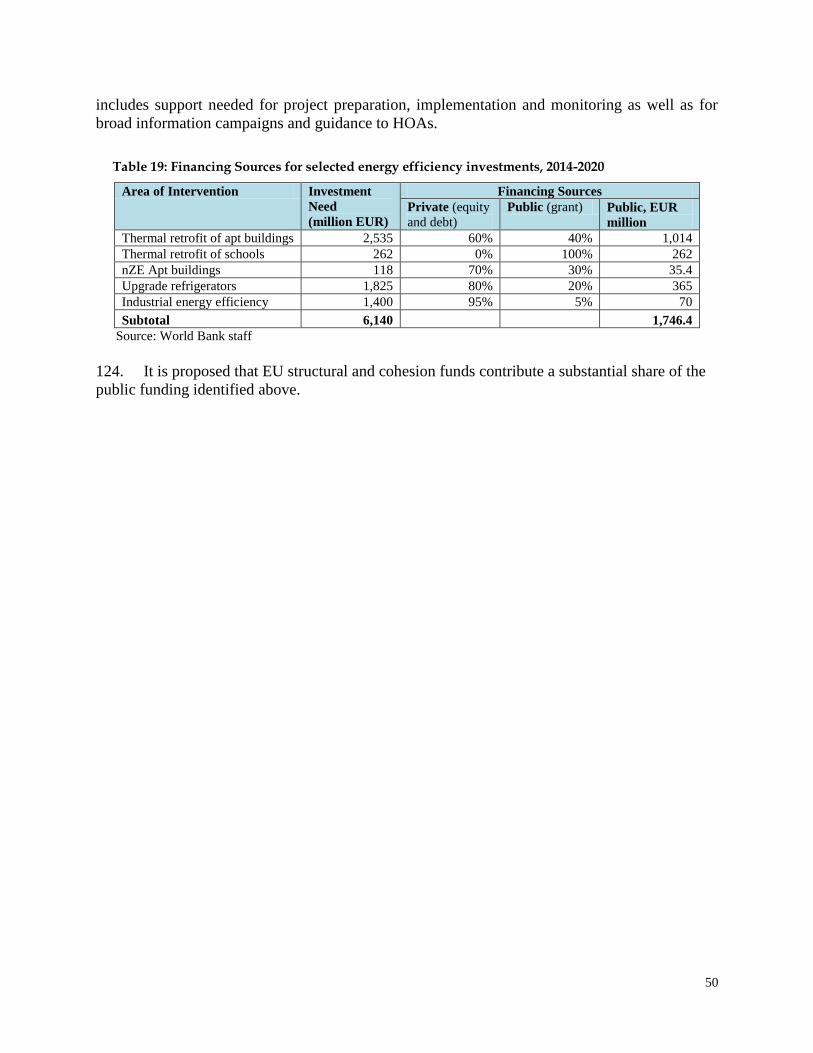
50
includes support needed for project preparation, implementation and monitoring as well as for
broad information campaigns and guidance to HOAs.
Table 19: Financing Sources for selected energy efficiency investments, 2014-2020
Area of Intervention Investment
Need
(million EUR)
Financing Sources
Private (equity
and debt)
Public (grant) Public, EUR
million
Thermal retrofit of apt buildings 2,535 60% 40% 1,014
Thermal retrofit of schools 262 0% 100% 262
nZE Apt buildings 118 70% 30% 35.4
Upgrade refrigerators 1,825 80% 20% 365
Industrial energy efficiency 1,400 95% 5% 70
Subtotal 6,140 1,746.4
Source: World Bank staff
124. It is proposed that EU structural and cohesion funds contribute a substantial share of the
public funding identified above.
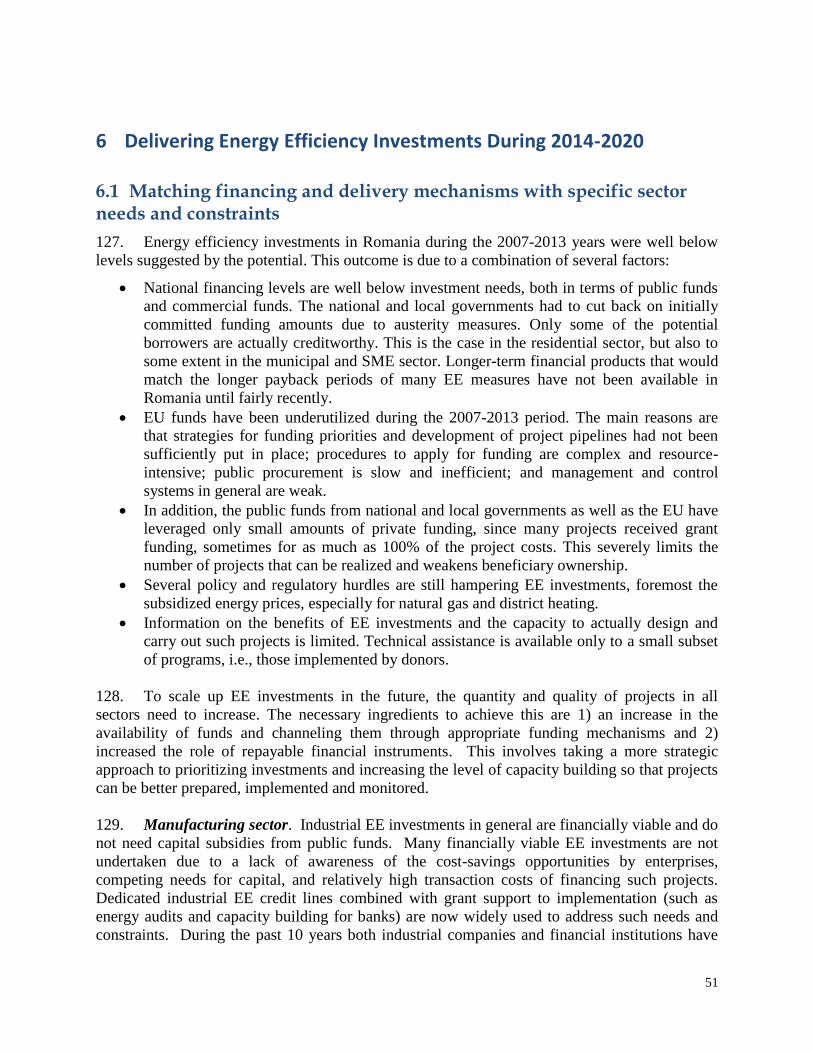
51
6 Delivering Energy Efficiency Investments During 2014-2020
6.1 Matching financing and delivery mechanisms with specific sector needs and constraints
127. Energy efficiency investments in Romania during the 2007-2013 years were well below
levels suggested by the potential. This outcome is due to a combination of several factors:
National financing levels are well below investment needs, both in terms of public funds
and commercial funds. The national and local governments had to cut back on initially
committed funding amounts due to austerity measures. Only some of the potential
borrowers are actually creditworthy. This is the case in the residential sector, but also to
some extent in the municipal and SME sector. Longer-term financial products that would
match the longer payback periods of many EE measures have not been available in
Romania until fairly recently.
EU funds have been underutilized during the 2007-2013 period. The main reasons are
that strategies for funding priorities and development of project pipelines had not been
sufficiently put in place; procedures to apply for funding are complex and resource-
intensive; public procurement is slow and inefficient; and management and control
systems in general are weak.
In addition, the public funds from national and local governments as well as the EU have
leveraged only small amounts of private funding, since many projects received grant
funding, sometimes for as much as 100% of the project costs. This severely limits the
number of projects that can be realized and weakens beneficiary ownership.
Several policy and regulatory hurdles are still hampering EE investments, foremost the
subsidized energy prices, especially for natural gas and district heating.
Information on the benefits of EE investments and the capacity to actually design and
carry out such projects is limited. Technical assistance is available only to a small subset
of programs, i.e., those implemented by donors.
128. To scale up EE investments in the future, the quantity and quality of projects in all
sectors need to increase. The necessary ingredients to achieve this are 1) an increase in the
availability of funds and channeling them through appropriate funding mechanisms and 2)
increased the role of repayable financial instruments. This involves taking a more strategic
approach to prioritizing investments and increasing the level of capacity building so that projects
can be better prepared, implemented and monitored.
129. Manufacturing sector. Industrial EE investments in general are financially viable and do
not need capital subsidies from public funds. Many financially viable EE investments are not
undertaken due to a lack of awareness of the cost-savings opportunities by enterprises,
competing needs for capital, and relatively high transaction costs of financing such projects.
Dedicated industrial EE credit lines combined with grant support to implementation (such as
energy audits and capacity building for banks) are now widely used to address such needs and
constraints. During the past 10 years both industrial companies and financial institutions have
52
become familiar with such projects due to the experiences with IFI-funded projects. High
efficiency cogeneration projects could still receive some investment grants but these should be
channeled through commercial financial institutions. For other industrial projects, especially
those carried out in the SME sector, some funds could be made available to provide support for
project preparation as well as monitoring and dissemination of results after implementation.
130. Public sector.46 Despite attractive payback periods and energy savings potential in the
public sector, EE is often plagued by a number of market failures and barriers (see paragraph
90). Global experience shows that there are a number of financing options for public buildings
that can help address some of these barriers. This “financing ladder” (Figure 21) can help guide
policymakers to select one or more options that can then be designed to provide accessible
financing products.
Figure 21: Public Energy Efficiency Financing Options Ladder
Source: World Bank staff
131. The selection of appropriate mechanisms and their subsequent design will depend on
factors such as: (i) current legislative and regulatory conditions; (ii) maturity of financial and
public credit markets; (iii) current state of the local EE service markets, including ESCOs and
energy auditors; and (iv) the technical and financial capabilities of public entities to undertake
EE projects. Once the basic mechanisms are selected, these mechanisms must then be carefully
designed to suit local market characteristics. During the design phase, one mechanism can be
developed to offer more than one financial product, for example, guarantees in addition to loans.
Multiple product offerings are generally recommended, as they allow different public clients
with different capacities to be better served via one program.
46
Based on: Singh and Hofer, 2013
53
132. In the case of Romania, several financing options are already in place for the public
sector, particularly municipalities. In addition to grant financing from the national budget and
grants under the EU OP, several EE/renewable energy credit lines are available from commercial
banks as well as from FREE, the Romanian EE Fund. The uptake is still limited, perhaps due to a
lack of capacity to develop and package projects, limited borrowing capacity of local
governments and inertia from a public sector accustomed to receiving grants. So far, it seems
that the most frequently funded public projects are street lighting projects. ESCO financing is
very limited, partially due to the limitation in the number and experience of ESCOs in Romania
and their access to financing, as well as barriers to EPCs in the form of accounting, budgeting
and procurement issues. In addition to the options already available in Romania, i.e., credit lines
with commercial banks and EE fund (FREE), a potential mechanism that could be explored in
the near term includes a full service EE revolving fund. Energy performance contracting and
ESCO development should also receive more support to develop ESCO financing into a viable
financing option for the public sector.
133. EE revolving funds. Romania already has experience with a revolving EE fund, FREE.
It was established when the commercial banking sector exhibited major aversion to risk and did
not provide mid to long-term loans that would match the payback periods of EE projects.
Ultimately, it was not funded sufficiently and after disbursing its capital, FREE has been relying
on the flow-back of funds to make additional loans. Experience of the EBRD shows that the use
of grant funds as subordinated debt can help mobilize commercial co-financing. A fund would
also be able to provide TA to disseminate information on EE subproject performance/financial
data critical to sustainability. A fund is a fairly expensive mechanism, however, since a
professional, well-incentivized Fund Manager/team is key. also It is necessary to be cautious
designing a fund in a way that it does not crowd out sustainable private finance, but instead is
able to leverage private funds.
134. Following up on the FREE experience, it might be helpful to consider a slightly different
EE revolving fund that would take a more active stance in supporting clients to design projects,
implement them and monitor the results. It should provide different types of financial products
for public clients with different needs. The Armenian Revolving EE fund (see Box 3) might
provide a relevant example. It provides straight loans for creditworthy municipalities and energy
service contracts for municipalities that are not creditworthy or have borrowing limits and for
agencies/units that do not have their own budgets. Those service contracts are not considered
public debt. It also uses a procurement approach with simplified ESCO contracts to shift some
technical and performance risks to private construction firms. In this way it takes an important
step towards building up an energy service industry.
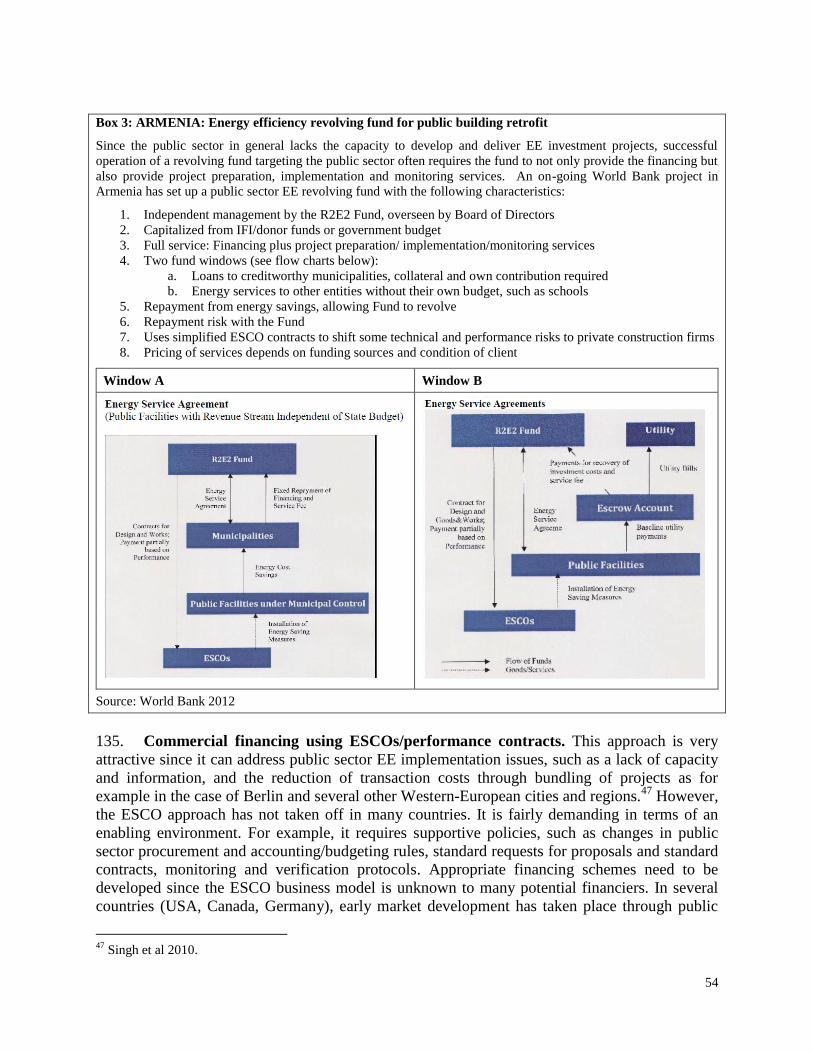
54
Box 3: ARMENIA: Energy efficiency revolving fund for public building retrofit
Since the public sector in general lacks the capacity to develop and deliver EE investment projects, successful
operation of a revolving fund targeting the public sector often requires the fund to not only provide the financing but
also provide project preparation, implementation and monitoring services. An on-going World Bank project in
Armenia has set up a public sector EE revolving fund with the following characteristics:
1. Independent management by the R2E2 Fund, overseen by Board of Directors
2. Capitalized from IFI/donor funds or government budget
3. Full service: Financing plus project preparation/ implementation/monitoring services
4. Two fund windows (see flow charts below):
a. Loans to creditworthy municipalities, collateral and own contribution required
b. Energy services to other entities without their own budget, such as schools
5. Repayment from energy savings, allowing Fund to revolve
6. Repayment risk with the Fund
7. Uses simplified ESCO contracts to shift some technical and performance risks to private construction firms
8. Pricing of services depends on funding sources and condition of client
Window A Window B
Source: World Bank 2012
135. Commercial financing using ESCOs/performance contracts. This approach is very
attractive since it can address public sector EE implementation issues, such as a lack of capacity
and information, and the reduction of transaction costs through bundling of projects as for
example in the case of Berlin and several other Western-European cities and regions.47
However,
the ESCO approach has not taken off in many countries. It is fairly demanding in terms of an
enabling environment. For example, it requires supportive policies, such as changes in public
sector procurement and accounting/budgeting rules, standard requests for proposals and standard
contracts, monitoring and verification protocols. Appropriate financing schemes need to be
developed since the ESCO business model is unknown to many potential financiers. In several
countries (USA, Canada, Germany), early market development has taken place through public
47
Singh et al 2010.
55
sector projects. To kick start the market, PPP models should be developed with private sector
involvement. The EBRD/GEF project is supposed to support many of the necessary changes in
the public sector enabling environment, while EBRD credit lines are accessible to ESCOs. See
Annex 1 for more details on energy performance contracting in the public sector.
136. Residential Sector. The financing options available to the residential sector are more
limited than those available for the public sector and thus the ladder is “shorter”. Four major
financing options have been used in other countries to help overcome the barriers listed above
(see paragraph 82) and support EE improvements in residential buildings. These include:
EE funds;
Commercial bank financing;
Partial credit guarantees; and
Utility EE programs.
137. A national revolving EE fund could be a valid alternative. If it is channeled through
commercial banks, it could combine the more efficient commercial delivery of large numbers of
financial contracts with the possibility of softening some of the commercial terms to make
funding more attractive for projects that have fairly high costs of saved energy. If the
creditworthiness of potential beneficiaries is a real concern, as it might be in the case of HOAs or
municipalities, then an independent fund structure could be considered.
138. Any financial mechanism targeted at the thermal retrofit of residential buildings will have
to take into account that most of the beneficiaries/borrowers would likely be HOAs of multi-
apartment buildings from the post-war period. In Romania, the formation of HOAs in owner-
occupied apartment buildings is mandatory, if not always enforced, and they are registered as a
legal entity. HOAs are required by law to establish a bank account and collect fees for building
maintenance and other expenses on a monthly basis, but it is not clear that such funds are indeed
collected by each HOA. If they are collected, their use has to be decided by all members of the
HOA. Until the law was changed in 2007, a 50% majority was necessary, since then a two-thirds
majority is required.48
139. In the past, the uptake of the thermal renovation program (see Chapter 3) has been slow,
despite the fact that up to 66%, and after 2008 up to 100%, were grants from national and local
governments. The reasons for the slow uptake seem to be the lack of coordination among
owners, especially in buildings with large disparities in income, and lack of public awareness of
the program. Lack of renovation funds that were initially the source of the beneficiaries’ share in
the thermal renovation program may have been another reason. Home-owners and HOAs may
also have been reluctant to assume debt for an investment with a somewhat uncertain benefit.
Finally, banks have little if any experience with HOAs as borrowers, and vice versa. Judging by
the experience in other countries in the region, such as Lithuania, Estonia or Hungary, it takes
serious investments in capacity building on both sides to establish a commercial relationship
between banks and HOAs. For the first time, the ROSEFF credit line counts HOAs among the
eligible borrowers.
48
Rabenhorst 2012.
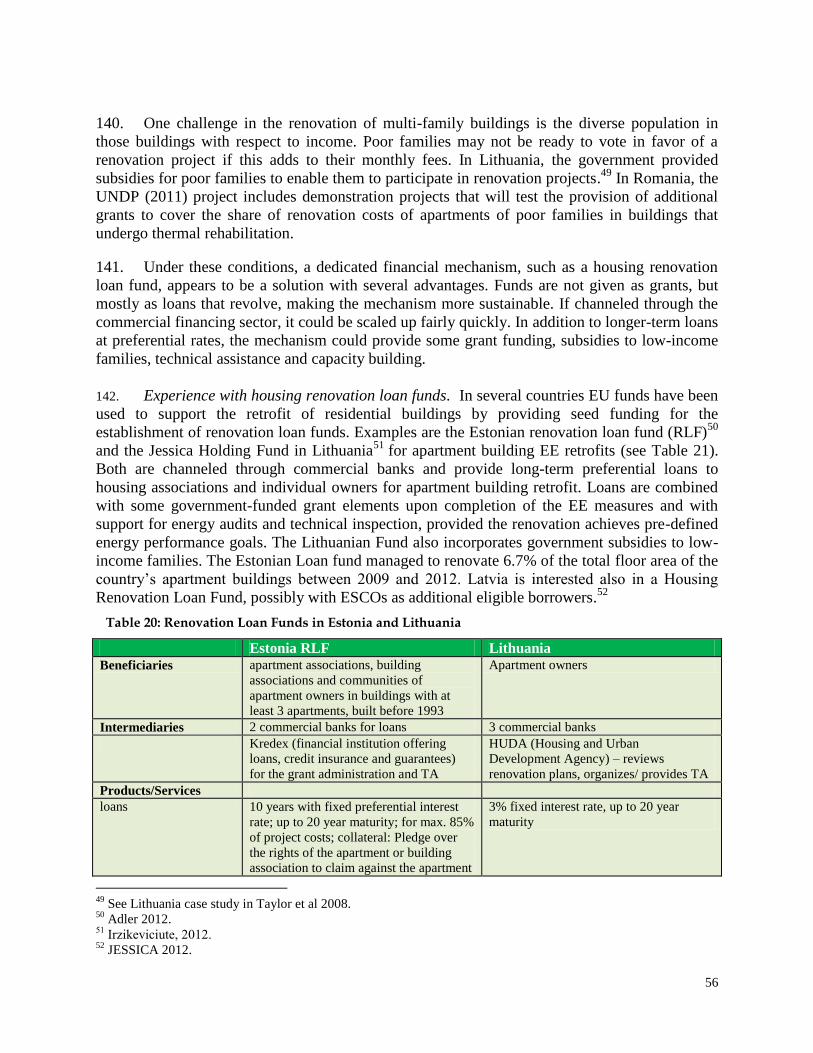
56
140. One challenge in the renovation of multi-family buildings is the diverse population in
those buildings with respect to income. Poor families may not be ready to vote in favor of a
renovation project if this adds to their monthly fees. In Lithuania, the government provided
subsidies for poor families to enable them to participate in renovation projects.49
In Romania, the
UNDP (2011) project includes demonstration projects that will test the provision of additional
grants to cover the share of renovation costs of apartments of poor families in buildings that
undergo thermal rehabilitation.
141. Under these conditions, a dedicated financial mechanism, such as a housing renovation
loan fund, appears to be a solution with several advantages. Funds are not given as grants, but
mostly as loans that revolve, making the mechanism more sustainable. If channeled through the
commercial financing sector, it could be scaled up fairly quickly. In addition to longer-term loans
at preferential rates, the mechanism could provide some grant funding, subsidies to low-income
families, technical assistance and capacity building.
142. Experience with housing renovation loan funds. In several countries EU funds have been
used to support the retrofit of residential buildings by providing seed funding for the
establishment of renovation loan funds. Examples are the Estonian renovation loan fund (RLF)50
and the Jessica Holding Fund in Lithuania51
for apartment building EE retrofits (see Table 21).
Both are channeled through commercial banks and provide long-term preferential loans to
housing associations and individual owners for apartment building retrofit. Loans are combined
with some government-funded grant elements upon completion of the EE measures and with
support for energy audits and technical inspection, provided the renovation achieves pre-defined
energy performance goals. The Lithuanian Fund also incorporates government subsidies to low-
income families. The Estonian Loan fund managed to renovate 6.7% of the total floor area of the
country’s apartment buildings between 2009 and 2012. Latvia is interested also in a Housing
Renovation Loan Fund, possibly with ESCOs as additional eligible borrowers.52
Table 20: Renovation Loan Funds in Estonia and Lithuania
Estonia RLF Lithuania
Beneficiaries apartment associations, building
associations and communities of
apartment owners in buildings with at
least 3 apartments, built before 1993
Apartment owners
Intermediaries 2 commercial banks for loans 3 commercial banks
Kredex (financial institution offering
loans, credit insurance and guarantees)
for the grant administration and TA
HUDA (Housing and Urban
Development Agency) – reviews
renovation plans, organizes/ provides TA
Products/Services
loans 10 years with fixed preferential interest
rate; up to 20 year maturity; for max. 85%
of project costs; collateral: Pledge over
the rights of the apartment or building
association to claim against the apartment
3% fixed interest rate, up to 20 year
maturity
49
See Lithuania case study in Taylor et al 2008. 50
Adler 2012. 51
Irzikeviciute, 2012. 52
JESSICA 2012.
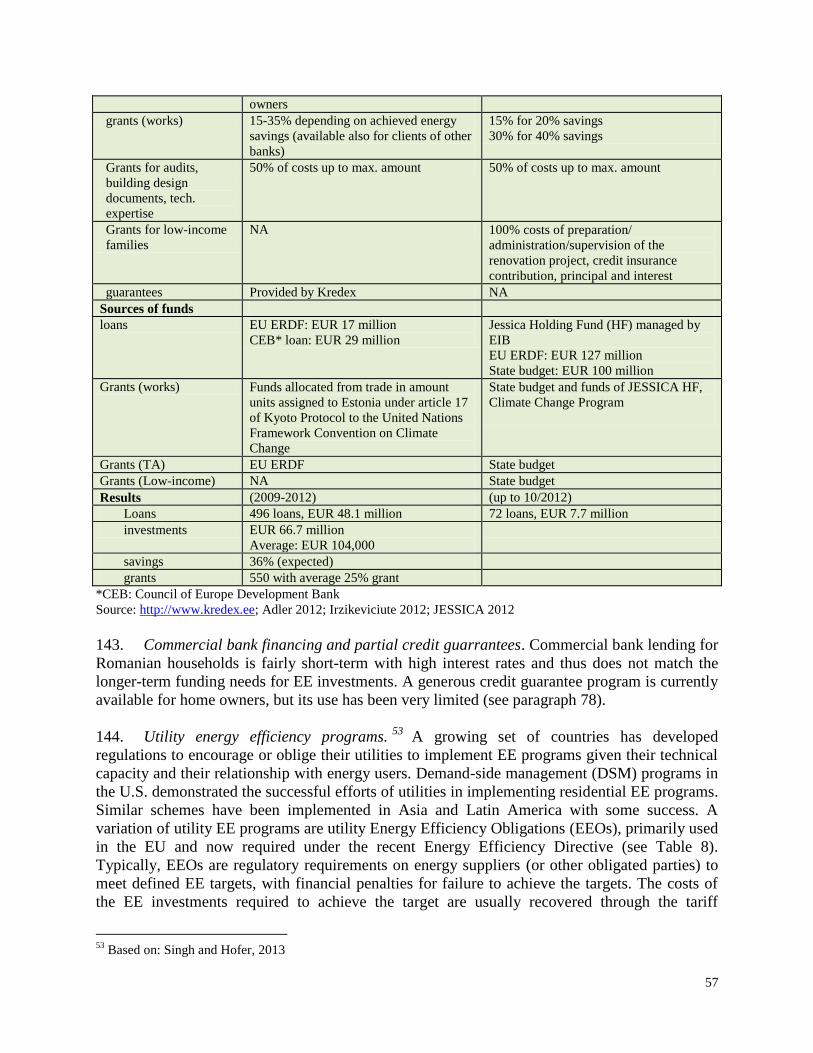
57
owners
grants (works) 15-35% depending on achieved energy
savings (available also for clients of other
banks)
15% for 20% savings
30% for 40% savings
Grants for audits,
building design
documents, tech.
expertise
50% of costs up to max. amount 50% of costs up to max. amount
Grants for low-income
families
NA 100% costs of preparation/
administration/supervision of the
renovation project, credit insurance
contribution, principal and interest
guarantees Provided by Kredex NA
Sources of funds
loans EU ERDF: EUR 17 million
CEB* loan: EUR 29 million
Jessica Holding Fund (HF) managed by
EIB
EU ERDF: EUR 127 million
State budget: EUR 100 million
Grants (works) Funds allocated from trade in amount
units assigned to Estonia under article 17
of Kyoto Protocol to the United Nations
Framework Convention on Climate
Change
State budget and funds of JESSICA HF,
Climate Change Program
Grants (TA) EU ERDF State budget
Grants (Low-income) NA State budget
Results (2009-2012) (up to 10/2012)
Loans 496 loans, EUR 48.1 million 72 loans, EUR 7.7 million
investments EUR 66.7 million
Average: EUR 104,000
savings 36% (expected)
grants 550 with average 25% grant
*CEB: Council of Europe Development Bank
Source: http://www.kredex.ee; Adler 2012; Irzikeviciute 2012; JESSICA 2012
143. Commercial bank financing and partial credit guarrantees. Commercial bank lending for
Romanian households is fairly short-term with high interest rates and thus does not match the
longer-term funding needs for EE investments. A generous credit guarantee program is currently
available for home owners, but its use has been very limited (see paragraph 78).
144. Utility energy efficiency programs.53
A growing set of countries has developed
regulations to encourage or oblige their utilities to implement EE programs given their technical
capacity and their relationship with energy users. Demand-side management (DSM) programs in
the U.S. demonstrated the successful efforts of utilities in implementing residential EE programs.
Similar schemes have been implemented in Asia and Latin America with some success. A
variation of utility EE programs are utility Energy Efficiency Obligations (EEOs), primarily used
in the EU and now required under the recent Energy Efficiency Directive (see Table 8).
Typically, EEOs are regulatory requirements on energy suppliers (or other obligated parties) to
meet defined EE targets, with financial penalties for failure to achieve the targets. The costs of
the EE investments required to achieve the target are usually recovered through the tariff
53
Based on: Singh and Hofer, 2013
58
mechanisms. While utilities can be well-placed to undertake such programs, careful regulatory
mechanisms need to be developed to address potential conflicts with their traditional business of
energy sales. To meet the obligations, the utilities may: (i) directly implement EE measures in
residential buildings; (ii) engage contractors to do the implementation; (iii) purchase energy
savings achieved by others; or (iv) establish a fund that can be utilized for EE measure
implementation. Formal measurement, reporting and verification of the savings are required. In
the EU, EEOs have been implemented in Belgium, Denmark, France, Ireland, Italy, Netherland
and the UK. In the UK EEO scheme, where the residential sector is a major target market,
obligated parties are required to achieve a specified fraction of their energy savings among
priority groups – mainly the elderly and those receiving certain means-tested benefits. The
UNDP project is currently investigating whether/how EEO could contribute to reducing energy
poverty in Romania.54
6.2 Policy support and implementation capacity-building
145. The availability of financing alone will not result in improved EE. Decision makers need
to have proper incentives to participate in EE programs and knowledge/information about the
costs and benefits of doing so. Eliminating distortions in the energy markets, particularly with
respect to energy pricing, will generate a powerful incentive to pursue investments in EE,
particularly for the residential building sector where decision makers face the most serious
energy price distortions.
146. In addition to having an economic incentive to participate, decision makers need to be
engaged and provided with the information necessary to make decisions. Program marketing and
capacity building of the target sector entities need to be expanded to address the information and
knowledge gaps related to EE, build demand for financing, and improve the sustainability of
energy savings.
147. Many past and existing government programs have not included any monitoring and
verification (M&V) of results. This is an essential part of any program though, since this is the
only way to show whether funds were well spent and achieved the intended outcomes, as well as
whether a program should be continued or if there is a need to adapt it. Support for the
development and/or adaptation of methodologies for M&V and for the provision of M&V
training to EE program staff, facility managers and engineers, and private sector service
providers should therefore be included in EE programs.
6.3 Improving EE governance
148. In the wake of the financial crisis and resulting cutbacks in government spending, EE
efficiency (as well as climate change issues) seems to have been relegated to the back burner
despite a flurry of policy statements and legal changes triggered by EU requirements. One of the
victims was the energy efficiency agency ARCE which was subsumed by the energy regulatory
agency ANRE. A first step to elevate EE both within the government but also for external
54
Househam/Musatescu 2012
59
stakeholders would be to improve the governance of the EE agency. Several options exist,
requiring more analysis than is possible in this assessment, and among them are the following:
o ANRE’s EE department could be strengthened. However, ANRE is a regulatory
agency and only some responsibilities of an EE agency are of a regulatory nature
o ARCE could be revived as a separate agency with a strengthened mandate and its
own independent budget. As a separate entity it would be able to establish regional
offices which would be helpful in supporting local governments and other consumers.
It should be considered whether responsibilities for buildings and EE in local
governments should be moved from MDRAP to the EE Agency. At the very least,
communication between the two entities needs to be improved.
o Some functions of either ANRE or ARCE could be outsourced to firms or NGOs
under performance contracts (for example, regional offices).
It is proposed to investigate in detail how to improve EE governance. For cross-cutting issues
such as establishment of national targets, EE incentives and so on, national leadership is
indispensable, particularly in view of the importance that the EU is assigning to EE in the
context of climate change.
149. In the future, cities should be engaged more, since they are critical in housing retrofit and
district heating issues. The cities participating in the Covenant of Mayors, for example, would be
natural champions for EE and RE initiatives. Local governments should be supported in the
preparation of heating strategies and building stock data bases and the strengthening of support
structures for HOAs.
6.4 Summary of main recommendations
150. To scale-up energy efficiency investments, the financing and delivery mechanisms need
to match specific sector needs and constraints. Of particular interest in the long term is the use of
financial instruments to increase the leverage of public funds in energy efficiency investments in
the public and residential sectors, especially for the thermal retrofit of buildings. Increasing the
role of ESCOs in delivery of energy efficiency projects also has the added benefit of bringing in
third party commercial financing, especially for public sector energy efficiency investments.
More specifically,
- Manufacturing sector energy efficiency investments should in general be financed
through commercial means. Nevertheless, public funding in supporting information
dissemination, awareness raising and capacity building among key stakeholders
(enterprises, ESCOs and banks) have proven to be of catalytic value.
- A dedicated energy efficiency revolving fund for the public sector could be an
effective way of addressing some of the critical financing and implementation
constraints faced by municipal public entities while also helping to nurture and
develop Romania’s nascent ESCO market. Such a fund may be seeded by a
combination of EU funds and government grants and could potentially attract private
financing if proven successful.
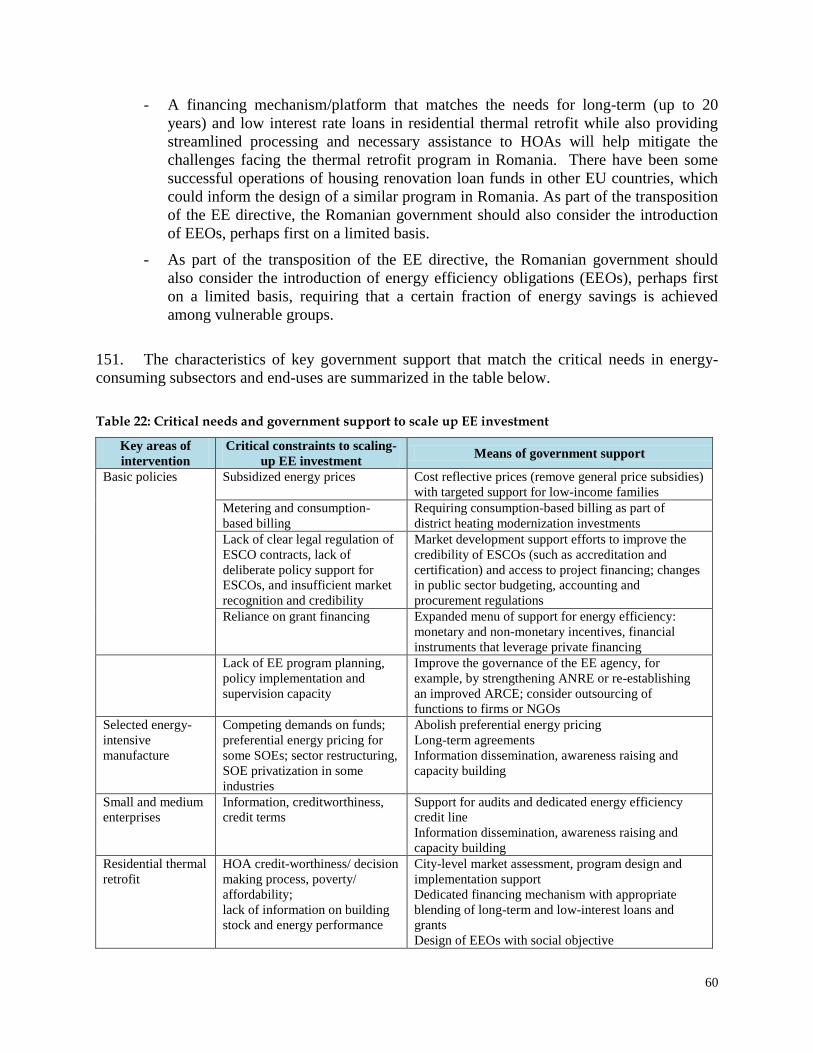
60
- A financing mechanism/platform that matches the needs for long-term (up to 20
years) and low interest rate loans in residential thermal retrofit while also providing
streamlined processing and necessary assistance to HOAs will help mitigate the
challenges facing the thermal retrofit program in Romania. There have been some
successful operations of housing renovation loan funds in other EU countries, which
could inform the design of a similar program in Romania. As part of the transposition
of the EE directive, the Romanian government should also consider the introduction
of EEOs, perhaps first on a limited basis.
- As part of the transposition of the EE directive, the Romanian government should
also consider the introduction of energy efficiency obligations (EEOs), perhaps first
on a limited basis, requiring that a certain fraction of energy savings is achieved
among vulnerable groups.
151. The characteristics of key government support that match the critical needs in energy-
consuming subsectors and end-uses are summarized in the table below.
Table 22: Critical needs and government support to scale up EE investment
Key areas of
intervention
Critical constraints to scaling-
up EE investment Means of government support
Basic policies Subsidized energy prices Cost reflective prices (remove general price subsidies)
with targeted support for low-income families
Metering and consumption-
based billing
Requiring consumption-based billing as part of
district heating modernization investments
Lack of clear legal regulation of
ESCO contracts, lack of
deliberate policy support for
ESCOs, and insufficient market
recognition and credibility
Market development support efforts to improve the
credibility of ESCOs (such as accreditation and
certification) and access to project financing; changes
in public sector budgeting, accounting and
procurement regulations
Reliance on grant financing Expanded menu of support for energy efficiency:
monetary and non-monetary incentives, financial
instruments that leverage private financing
Lack of EE program planning,
policy implementation and
supervision capacity
Improve the governance of the EE agency, for
example, by strengthening ANRE or re-establishing
an improved ARCE; consider outsourcing of
functions to firms or NGOs
Selected energy-
intensive
manufacture
Competing demands on funds;
preferential energy pricing for
some SOEs; sector restructuring,
SOE privatization in some
industries
Abolish preferential energy pricing
Long-term agreements
Information dissemination, awareness raising and
capacity building
Small and medium
enterprises
Information, creditworthiness,
credit terms
Support for audits and dedicated energy efficiency
credit line
Information dissemination, awareness raising and
capacity building
Residential thermal
retrofit
HOA credit-worthiness/ decision
making process, poverty/
affordability;
lack of information on building
stock and energy performance
City-level market assessment, program design and
implementation support
Dedicated financing mechanism with appropriate
blending of long-term and low-interest loans and
grants
Design of EEOs with social objective
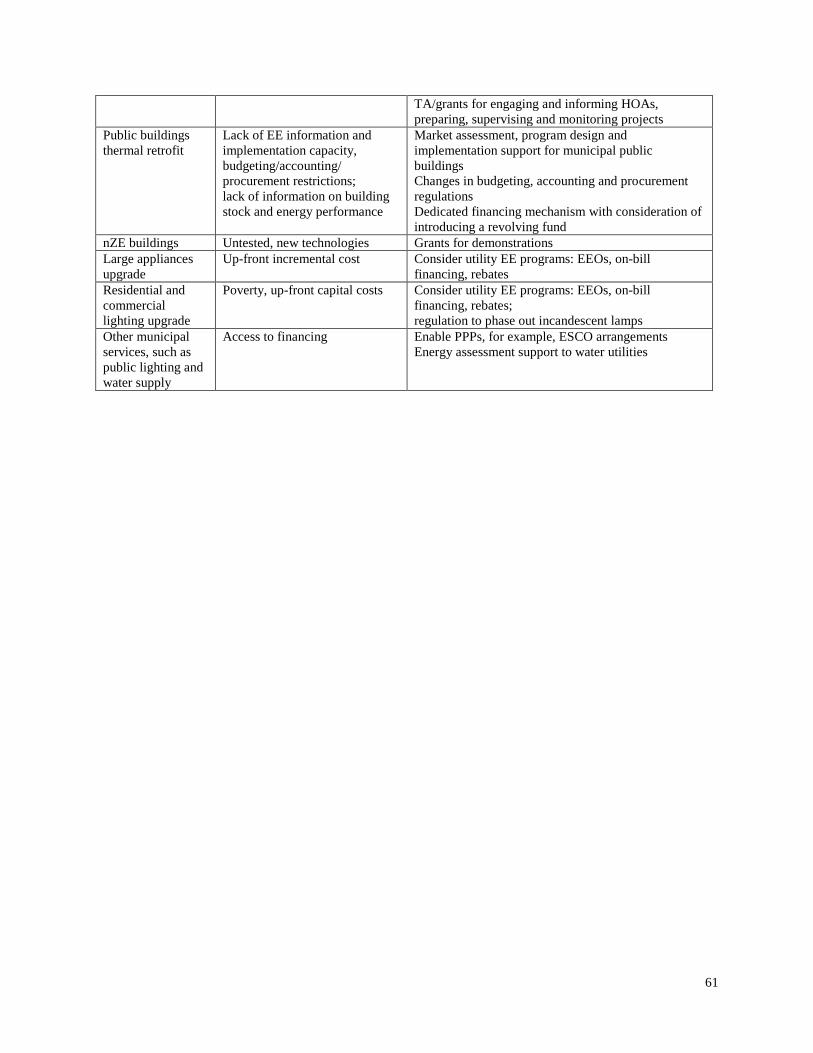
61
TA/grants for engaging and informing HOAs,
preparing, supervising and monitoring projects
Public buildings
thermal retrofit
Lack of EE information and
implementation capacity,
budgeting/accounting/
procurement restrictions;
lack of information on building
stock and energy performance
Market assessment, program design and
implementation support for municipal public
buildings
Changes in budgeting, accounting and procurement
regulations
Dedicated financing mechanism with consideration of
introducing a revolving fund
nZE buildings Untested, new technologies Grants for demonstrations
Large appliances
upgrade
Up-front incremental cost Consider utility EE programs: EEOs, on-bill
financing, rebates
Residential and
commercial
lighting upgrade
Poverty, up-front capital costs Consider utility EE programs: EEOs, on-bill
financing, rebates;
regulation to phase out incandescent lamps
Other municipal
services, such as
public lighting and
water supply
Access to financing Enable PPPs, for example, ESCO arrangements
Energy assessment support to water utilities
62
Annexes
Annex 1: Lessons learned on energy performance contracting in the public sector55
There are three basic types of ESCO contracts:
(i) energy supply contracting (ESC), where an ESCO deals with all aspects of energy
supply to a customer and gets paid through a margin on energy sales;
(ii) energy operations contracting (EOC), where an ESCO optimizes an energy system and
gets an operations fee; and
(iii)energy performance contracting (EPC), where an ESCO finances an energy investment
(new or rehabilitation) and is repaid from the energy savings. Because such a
contract can be structured so that the financing and the risks are born by the ESCO,
this form of contracting is ideal for the public sector as discussed below.
EPC and the Public Sector
The public sector is normally the most promising market segment for EPC because it is a major
energy consumer; ownership/tenancy of the facilities is clear; the risk of bankruptcy is virtually
nonexistent; and the risk of closure of a facility is low. However, there are barriers. The most
important of these are the public sector’s procurement rules, budget procedures and lack of
savings incentives. Often there is also limited in-house competence related to energy
management and the complexity of energy performance contracting.
Procurement of EPC: maximize results rather than minimize cost. Under traditional
procurement the emphasis is on achieving the lowest price for known specifications. Under
EPC, however, the emphasis is on maximizing results rather than minimizing equipment cost.
Also, the main focus of the bid evaluation should be on the basic methodology for guaranteeing
the savings, the proposed energy savings measures, and the benefit derived from working with
that ESCO. Other key differences between performance contracting and traditional contracting
are: (i) the provision of a package of EE services by a single company – the ESCO – as opposed
to contracting with separate companies for the engineering design, supply and commissioning,
and maintenance; and (ii) a contract with an ESCO usually covers 5-10 years or longer, which
does not match the annual budget cycles of public sector institutions.
Budget procedures: consider letting Agencies keep some of the savings. Unless the
Government sets mandatory targets (and penalties for not meeting them) for each government
agency, incentives may have to be provided to the agencies for undertaking energy savings
measures. Normally reduced energy bills that translate into equally reduced energy budgets in
the next year will not motivate agencies to voluntarily undertake EE investments unless
considerations of comfort, building appearance, etc., provide adequate incentives. In the US,
federal agencies are in principle allowed to retain up to 50% of the energy savings resulting from
55
See Singh et al 2010.
63
EPC (though in practice it is far less than that). In Germany and Hungary block budgets for
some types of agencies provide built-in incentives to reduce operating costs, including energy
costs.
Designing a scheme under which net savings are shared between the Ministry of Finance and the
contracting Agency, perhaps on a declining basis, could be a win-win situation. It would also
help Poland to reduce its energy intensity further and help it meet current and future EE,
greenhouse gas and renewable energy commitments (the latter by reducing the denominator).
Typically, most of the EE potential in the public sector is for heating (and increasingly cooling)
and the remainder for lighting. Over the life cycle of EE investments, enormous savings to the
Treasury and a very significant reduction in GHG emissions can be achieved.
Debt ceilings: EPC payments as operating expenses. In some countries, like Poland, EPC
contracting is counted against the debt ceiling of public sector entities and therefore a non-
starter. In Germany and the US, however, EPC contracting is allowed if the following conditions
are met: (i) the ESCO must contract the commercial debt and put it on its balance sheet; and (ii)
the project should have guaranteed positive cash flow to the agency in any given year of the
contract period, backed up by strict performance guarantees, including performance and
payments bonds, insurance certificates, or letters of guarantee. Dispute resolution procedures are
also clearly specified and may involve third parties, but there have been very few such disputes
in either country. Provided the above conditions are met, payments to an EPC contractor or
considered to be operating expenses (building maintenance), not debt repayments.
Developing industries and services of the future. Because of a lack of energy expertise in many
government agencies, ESCOs are ideal to assist them in that area. Government is in a unique
position to take the lead. By helping develop the demand for, and supply of, ESCOs and
associated equipment and services, their use could then spread to other sectors of the economy.
In this way the Polish economy could engage in applying and developing the cutting edge EE
technologies and services of the future, becoming a leader in this important new field rather than
lagging behind.
Experience in the USA
The Federal Energy Management Program was established in 1995 to help federal agencies
reduce their energy consumption. The Energy Independence and Security Act (2007) set new
mandatory goals: federal agencies are required by law to cut their energy use by 3% per year
through 2015 (and to significantly increase their use of renewable energy and reduce water
consumption by 2% per year, with 2003 as the base year). EPCs, or ESPCs as they are called in
the US (Energy Savings Performance Contracts), have been a major vehicle to achieve this.
Legislation giving federal agencies authority to enter into shared savings contracts with private
sector ESCOs was enacted starting in 1985.
Net savings sharing. Over the past decade, more than 460 federal ESPC projects have been
awarded. These projects will save the US Government US$7.1 billion in energy costs, US$5.7
billion of which will finance the facilities upgrade, resulting in net savings to the government of
US$1.4 billion. Agencies can in principle retain 50% of net energy and water cost savings for
additional energy saving projects, including employee incentive programs. However, given the
64
pressure to limit federal budgets, any cost savings that remain after payment of the EPCs are
often cut from the agencies’ operating budget.
Procurement: mandatory savings and multiyear contracts. The authorization for federal
agencies to enter into ESPCs specifies that savings guarantees are mandatory and that M&V
protocols will be used to verify that the guaranteed savings are realized. The savings to the
agency must exceed payments to the ESCO in every year of the contract’s term. The contract
term for federal ESPCs, including the construction period, may be a maximum of 25 years
though the average is about 15 years. They can include a broad portfolio of energy savings
measures, ranging from quick impact measures to ones with longer payback periods. With the
aggressive US directives to reduce energy use, agencies have usually implemented many low-
cost and no-cost measures themselves and use ESPC projects to replace old, inefficient
equipment. Projects thus tend to be capital intensive and do not involve cream skimming.56
Project financing on ESCOs balance sheet. ESCOs commonly obtain financing from a third
party. They must solicit competitive financing offers for the energy project in commercial
markets to ensure that the agency will receive the best possible overall value. It is the
responsibility of the ESCO to obtain competitive offers, evaluate them, and make a selection
based on pre-established criteria for best value. The ESCO is required to document its selection.
The financing of an EPC project is a contract between the ESCO and the financier, and is based
on the ESCO’s balance sheet, not the agencies’.
Performance guarantee. At the heart of the ESPC is a guarantee of specified levels of cost
savings and performance. The customer is not obligated to pay for an unmet guarantee and thus
maintains a positive cash flow throughout the project period. The allocation of responsibilities
between the agency and the ESCO defines the specifics of the guarantee. The agency must
receive acceptable performance and payment bonds as well as any required insurance certificates
before construction begins.
The sharing of the savings between the agency and the ESCO is negotiated and defined in the
contract, but the energy cost savings must be greater than the payments to the ESCO. The agency
keeps any savings over the target. If the savings fall short of the target, then the ESCO’s
guarantee takes effect and covers the shortfall. The contracts include requirements for the
ESCO to repair or replace any malfunctioning or burned-out equipment during the contract
period.
Project facilitators. To help agencies enter into ESPCs, the Department of Energy has
established a special team that can provide technical assistance and facilitate the process. These
56
Under a new Super ESPC process, an ESCO is competitively selected by the US Department of Energy to service
a region or provide a specific type of technology. Super-ESPCs use an “indefinite-delivery, indefinite-quantity”
(IDIQ) contract method, introduced to make ESPCs a more practical and streamlined tool for agencies to use. These
umbrella contracts are competitively awarded to ESCOs that demonstrated their capabilities to provide energy
savings projects for federal facilities. The super-ESPC approach, with prequalified ESCOs, has been designed to
accelerate the contracting process. A super-ESPC delivery order can be awarded in 4-12 months, while a typical
stand-alone ESPC can take 2-3 years (or longer). The Department of Energy maintains a Qualified ESCO list (there
is also a separate industry certification process by the National Association of Energy Service Companies). It is not
uncommon for ESCOs on this list to work as subcontractors to one of the prime ESCOs awarded a super-ESPC.
65
project facilitators guide the agencies throughout the ESPC process and consult with agencies on
contracting and financing issues, M&V, and technology and engineering issues. FEMP teams
offer the assistance at no cost, starting with the kick-off meeting and extending through the
review of an ESCO’s initial proposal. Project facilitators are required for all super-ESPCs under
the new, master IDIQ contract.
General observations about the US ESCO market. In 2006, about 82% of ESCO investments
were with existing public sector building facilities (22% in the federal market 58% in state/local
government, universities, schools and hospitals markets; and 2% with public housing
authorities). Private sector investment was split between commercial (9%), industrial (6%) and
residential (3%). Recently, some of the larger ESCOs have begun responding to interest in green
buildings and are offering energy-related services that support green building certification
processes.
ESCOs in the US have a track record of developing comprehensive projects that utilize EE,
onsite generation and renewable energy technologies. The core market in which the ESCO
business model has been most successful is in energy-efficiency retrofits of large buildings,
primarily owned by institutional clients. Other types of energy service providers (e.g., lighting
and HVAC contractors, engineering firms, and architects) are more active in residential and
small commercial markets as they tend to work on a design/build basis, are compensated
directly, and assume no ongoing performance risk. ESCOS are not generally involved in new
construction.
Experience in Germany
Germany is generally considered to have the most mature ESCO industry in Europe. By 2005,
ESCOs there had a total investment volume of about €5 billion. The vast majority, 85 percent, is
for energy supply contracting (ESC), mostly for heat; about 10 percent for EPC; and the
remainder for other forms such as energy operations contracting (EOC).
There are about 500 ESCOs in Germany, with annual revenues of over €3 billion. ESCOs range
from subsidiaries of large utilities and former municipal utilities to equipment suppliers,
construction companies, and engineering and consulting firms. There are two national ESCO
Associations, with membership overlapping significantly.
EPC in the Public Sector. EPC was slow in gaining market share: uncertainty regarding
procurement and budget procedures related to EPC; lack of information and awareness; lack of
competence to deal with procurement complexity; and lack of staff incentives. However, EPC
became an essential instrument to meet Germany’s EE and climate change targets when the
Energy Efficiency Contracting in Federal Properties Program was started in 2002. The basic
procurement and public budgeting barriers were dealt with early on, both at the state and federal
levels. EPCs are generally allowed, provided that procurement is competitive and that the
comparison of offers includes self-implementation of projects by the agencies, i.e., without
ESCO involvement.
Clarification of budgetary issues. All public properties in Germany, whether federal, state, or
municipal, can in principle use EPC as an alternative to credit financing. As long as measures
66
carried out under energy performance contracts are profitable— i.e., cost savings are greater than
payments for contractor services—they are not taken into account for debt limits in most German
states. Municipalities must have all credit transactions, and transactions similar to credits,
authorized by their supervising authorities, except those for O&M. Energy performance
contracts emphasize the service of the contractor, rather than the investment, and are considered
to be an operating expense if their term does not exceed 10 years. If the contract includes a
guarantee of the profitability of the measures to be taken, and if it has been awarded
competitively, no preauthorization is required. Payments to the ESCO contractor are budgeted as
building maintenance expenditures.
Procurement. Contracts have to be awarded through a competitive process, ranging from: (i)
open public procurement; (ii) limited procurement; (iii) negotiated procurement; and (iv)
competitive dialogue procurement. The second and third options can be used if the service to be
rendered cannot be described unequivocally and exhaustively, such that a price for the service
can be determined objectively. This applies to EPC projects, especially complex projects such as
those covering many federal properties. Since the EPC contractor is expected to determine the
specific measures, the objective of the contract is described in a functional way: percentage
reduction of energy costs. Option (iv) is used for very complex projects after a EU-wide
announcement. Contracts typically include both equipment and services (planning, installation,
optimization, and maintenance of equipment; controlling; documentation, etc.).
Energy audits. An initial energy audit is usually not required or performed. Baseline data
(technical, energy use, and cost) for the building(s) are provided by the agency, based on model
data sheets provided in EPC guidelines. This is usually complemented by facility walkthroughs
by bidders. In a two-stage contract the winning bidder carries out a detailed analysis, including
an audit, the cost of which will be covered by the contract
Baseline data are typically collected by the agency, sometimes with help from specialists, such as
a private consulting company. For the first demonstration projects in a program, the service is
often provided free, but later the agency has to pay for such services. Federal and regional energy
agencies have put together guides and data sheet templates for the process.
Multiyear contracts. Contract durations range from 7-12 years, depending on the savings
potential, the level of investment, and cost savings participation of the client. For contracts of
less than 10 years, few budgetary issues arise for state and municipal projects. Bigger, longer-
term, and federal EPCs need to be approved and receive a commitment authorization for future
payments to the ESCO.
Project financing. For almost all public sector EPC projects in Germany, financing is provided
by the ESCO. Only for obligatory EE measures will an agency sometimes provide part of the
financing. Although some ESCOs are able to use their own equity for financing, the usual
source is long-term commercial bank loans. ESCOs can obtain lower-cost loans, comparable to
what is available for public sector borrowing, if they sell their future payments from the client to
the financing institution (factoring). The factoring share is usually restricted to 70-80% of the
agreed payment to the contractor. This is roughly the value of the guaranteed investment, which
could serve as a security.
67
Performance guarantees. The energy performance contract typically guarantees a minimum
percentage energy cost savings over the term of the contract. This limits the payments from the
public client to the ESCO. Frequently an immediate sharing of the benefits by the client is agreed
upon. In case the contractor does not achieve the guaranteed cost savings in a period, he has to
provide a compensation payment. The public client also has several other ways to reduce the risk
of nonperformance. Typically, the installed equipment passes into the ownership of the client
after commissioning. The ESCO can also be required to provide a bank letter of guarantee to the
client.
Monitoring and Verification. Energy savings can be verified relatively easily through energy
bills, metering of energy consumption, and correction of the baseline caused by any changes in
energy prices, climate, and facility use. Model contracts provided by energy agencies oblige the
contractor to install an energy management system that includes metering to control the energy
consumption in relevant parts of the facilities. Remote monitoring enables the contractor to
constantly optimize operation to achieve the targeted savings. It is customary for contractor and
client staff to meet several times a year to discuss any issues, such as any changes in the use of
the facility that affect energy consumption. So far, no disputes have been reported.
Energy agencies as project facilitators. In most cases, public sector clients use the services of an
external adviser for support in managing the entire EPC process. Energy agencies, which exist
on the federal, state, and communal levels, often provide those advisory services. In many states,
they have been the first promoters of EPC in the public sector and have developed demonstration
projects, guidelines, model contracts, and evaluations of EPC programs. During the first phases
of EPC in a state or city, the energy agency typically receives funding from the government and
provides its services free of charge. Subsequently, clients are supposed to pay for the services.
However, project facilitation provided free of charge is still the norm.
Lessons Learned and Key Steps
Experience in other countries shows that factors facilitating more widespread use of EPC are:
Existence of champions, especially in construction administrations.
A reliable legal framework for procurement, contracting and budgeting.
Standardized procedures and contracts reduce time and cost as well as increase the
reliability of the process.
Neutral process management through a trustworthy facilitator who provides technical and
economic know-how, preferably free of charge.
Creating pools of properties (within one agency or budget) to create economies of scale.
Benefits are shared among all agencies involved, by assigning separate shares in the
savings in the contract.
Some of the key steps for introducing EPC in the public sector are:
Conduct an upfront market survey of ESCOs. Such a survey should be cast broadly to
include all types of entities that could serve as ESCOs. It should gauge their level of
interest and ability to take risk. The Government may wish to announce its intention to
start using ESCOs for EPC well in advance, so that interested parties can start preparing.
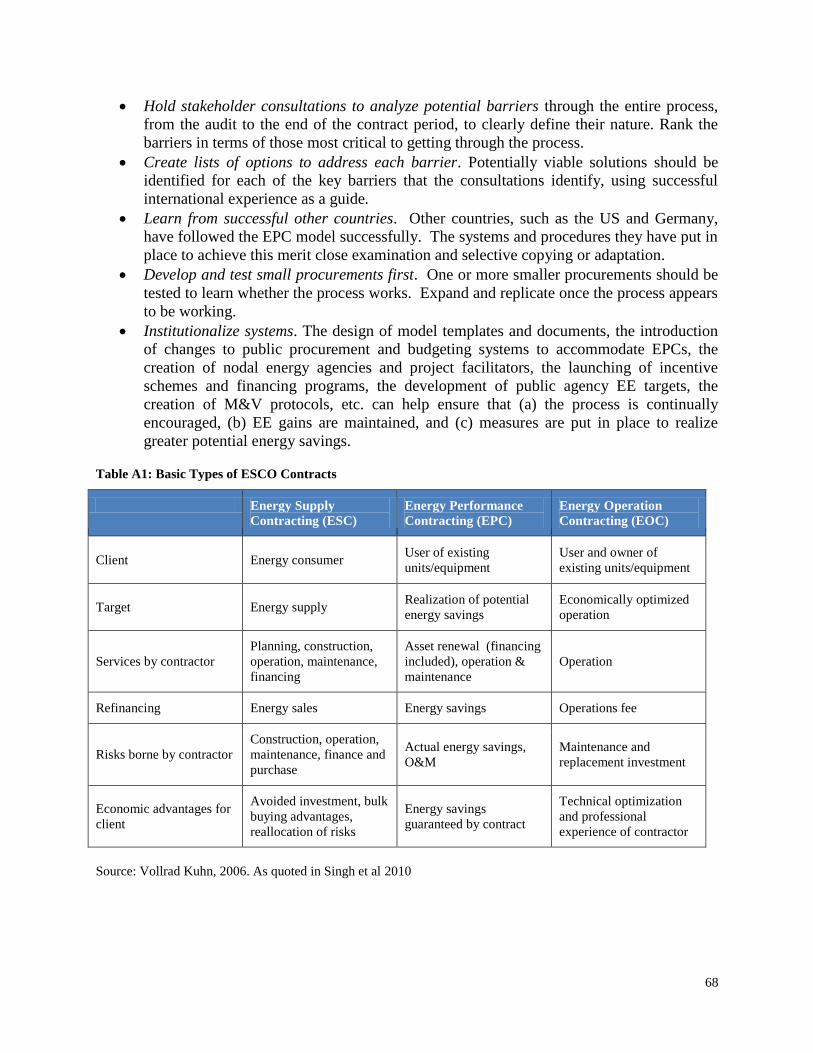
68
Hold stakeholder consultations to analyze potential barriers through the entire process,
from the audit to the end of the contract period, to clearly define their nature. Rank the
barriers in terms of those most critical to getting through the process.
Create lists of options to address each barrier. Potentially viable solutions should be
identified for each of the key barriers that the consultations identify, using successful
international experience as a guide.
Learn from successful other countries. Other countries, such as the US and Germany,
have followed the EPC model successfully. The systems and procedures they have put in
place to achieve this merit close examination and selective copying or adaptation.
Develop and test small procurements first. One or more smaller procurements should be
tested to learn whether the process works. Expand and replicate once the process appears
to be working.
Institutionalize systems. The design of model templates and documents, the introduction
of changes to public procurement and budgeting systems to accommodate EPCs, the
creation of nodal energy agencies and project facilitators, the launching of incentive
schemes and financing programs, the development of public agency EE targets, the
creation of M&V protocols, etc. can help ensure that (a) the process is continually
encouraged, (b) EE gains are maintained, and (c) measures are put in place to realize
greater potential energy savings.
Table A1: Basic Types of ESCO Contracts
Energy Supply
Contracting (ESC)
Energy Performance
Contracting (EPC)
Energy Operation
Contracting (EOC)
Client Energy consumer User of existing
units/equipment
User and owner of
existing units/equipment
Target Energy supply Realization of potential
energy savings
Economically optimized
operation
Services by contractor
Planning, construction,
operation, maintenance,
financing
Asset renewal (financing
included), operation &
maintenance
Operation
Refinancing Energy sales Energy savings Operations fee
Risks borne by contractor
Construction, operation,
maintenance, finance and
purchase
Actual energy savings,
O&M
Maintenance and
replacement investment
Economic advantages for
client
Avoided investment, bulk
buying advantages,
reallocation of risks
Energy savings
guaranteed by contract
Technical optimization
and professional
experience of contractor
Source: Vollrad Kuhn, 2006. As quoted in Singh et al 2010
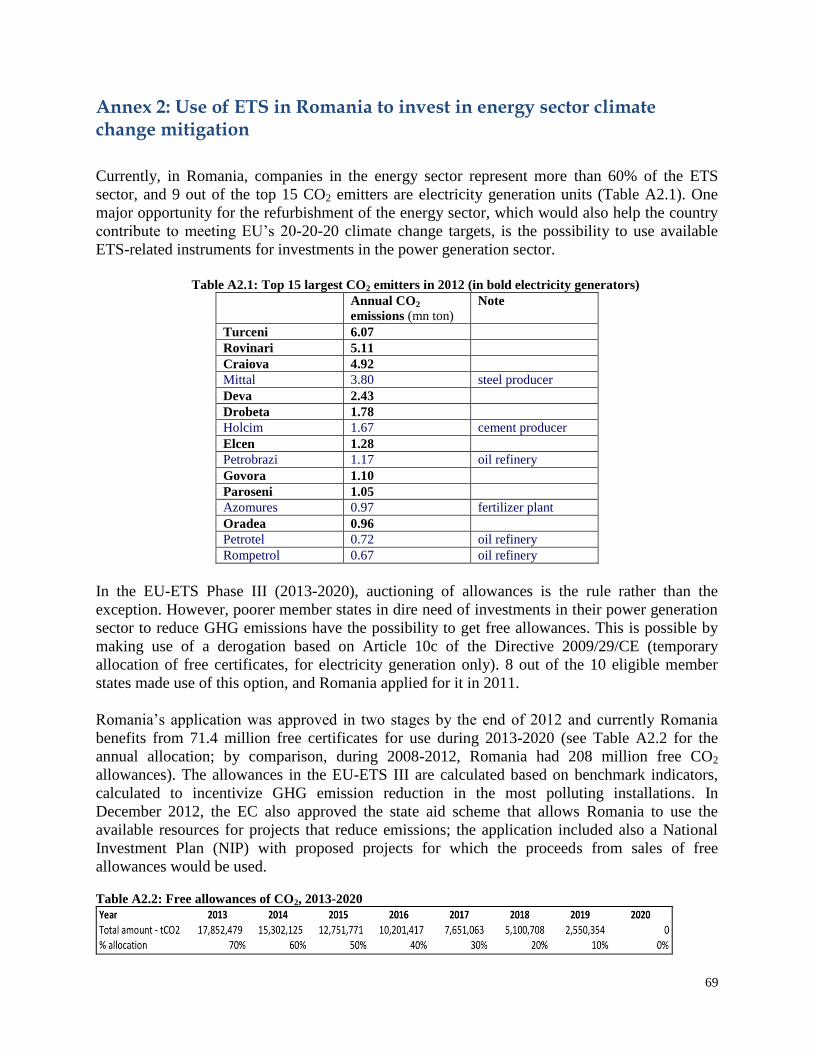
69
Annex 2: Use of ETS in Romania to invest in energy sector climate change mitigation
Currently, in Romania, companies in the energy sector represent more than 60% of the ETS
sector, and 9 out of the top 15 CO2 emitters are electricity generation units (Table A2.1). One
major opportunity for the refurbishment of the energy sector, which would also help the country
contribute to meeting EU’s 20-20-20 climate change targets, is the possibility to use available
ETS-related instruments for investments in the power generation sector.
Table A2.1: Top 15 largest CO2 emitters in 2012 (in bold electricity generators)
Annual CO2
emissions (mn ton) Note
Turceni 6.07
Rovinari 5.11
Craiova 4.92
Mittal 3.80 steel producer
Deva 2.43
Drobeta 1.78
Holcim 1.67 cement producer
Elcen 1.28
Petrobrazi 1.17 oil refinery
Govora 1.10
Paroseni 1.05
Azomures 0.97 fertilizer plant
Oradea 0.96
Petrotel 0.72 oil refinery
Rompetrol 0.67 oil refinery
In the EU-ETS Phase III (2013-2020), auctioning of allowances is the rule rather than the
exception. However, poorer member states in dire need of investments in their power generation
sector to reduce GHG emissions have the possibility to get free allowances. This is possible by
making use of a derogation based on Article 10c of the Directive 2009/29/CE (temporary
allocation of free certificates, for electricity generation only). 8 out of the 10 eligible member
states made use of this option, and Romania applied for it in 2011.
Romania’s application was approved in two stages by the end of 2012 and currently Romania
benefits from 71.4 million free certificates for use during 2013-2020 (see Table A2.2 for the
annual allocation; by comparison, during 2008-2012, Romania had 208 million free CO2
allowances). The allowances in the EU-ETS III are calculated based on benchmark indicators,
calculated to incentivize GHG emission reduction in the most polluting installations. In
December 2012, the EC also approved the state aid scheme that allows Romania to use the
available resources for projects that reduce emissions; the application included also a National
Investment Plan (NIP) with proposed projects for which the proceeds from sales of free
allowances would be used.
Table A2.2: Free allowances of CO2, 2013-2020
70
As of the end of September 2013, the mechanism to use these amounts has been posted for
public debate on the Ministry of Economy’s website and is expected to be approved shortly. In
brief, beneficiaries of free allowances (eligible electricity generators in operation before 2008)
are required to pay the value of the free CO2 certificates to a fund managed by the Department of
Energy. The “free allowances” are traded by the Ministry of Finance on the ETS platform, like
the other CO2 certificates. The prices for CO2 allowances considered for the fund are the market
prices, or the reference values if the market prices deviate by more than 10% from the reference
values (14.5 – 20 EUR/t). The Department of Energy manages the amounts in a dedicated
account that is made available for the projects in the NIP. The Plan, approved already by the EC
as part of Romania’s application for the derogation on Article 10c, is a list of 39 projects that
contribute to EU’s 20-20-20 targets. Of these, 29 are electricity and cogeneration projects – 24
for new capacities and 5 for refurbishments. Of the new capacity projects, 3 are renewable
projects and 14 are cogeneration units. Thus, some of the investments included in the NIP57
concern the same electricity generators that benefit from free allowances; others are new
capacities. The grants from the fund can cover 25% of eligible expenses for the proposed
investments.
Investments in energy production are covered only by the proceeds from the sale of “free
allowances”. The other funds resulting from the ETS trading of CO2 allowances58
(proceeds from
sales of “non-free” allowances) are used to finance projects in transport or environment.
57
The list of 29 electricity and cogeneration projects from the NIP is available at:
http://www.minind.ro/propuneri_legislative/2013/septembrie/Anexa_3_PNI_09092013.pdf. The NIP also includes
units that are in the government’s scenario A – e.g. rehabilitation of 5x330 MW coal-fired units. 58
The relevant legislation consists of: Government Decision 780/2006 on the trading mechanism, subsequently
amended; and Emergency Ordinance 115/2011 that authorizes the Ministry of Finance to auction allowances for
Romania.
71
References
Adler, Mirja (2012). Revolving Fund for Housing in Estonia, KredEx.
Agency for the Cooperation of Energy Regulators (ACER). 2012. Framework Guidelines on
Electricity Balancing (FG-2012-E-009)
http://www.acer.europa.eu/Official_documents/Acts_of_the_Agency/Framework_Guidelines
/Framework%20Guidelines/Framework%20Guidelines%20on%20Electricity%20Balancing.
pdf. Ljubljana: ACER
ANRE. 2013. Annual reports and data. http://anre.ro/
ANRSC 2013. Annual reports and data. http://www.anrsc.ro
AT Kearney. 2009. Why heating costs more in Romania than in most of other EU countries.
International Market Study. Bucharest: AT Kearney.
Atanasiu, Bogdan, Marina Economidou, Joana Maio, and Carine Sebi. 2012. The challenges,
dynamics and activities in the building sector and its energy demand in Romania. Entranze
Project.
http://www.entranze.eu/files/downloads/D2_1/D2_1_Short_country_summary_report_-final-
Romania.pdf
Buildings Performance Institute Europe (BPIE). 2011. Europe’s Buildings under the Microscope.
Brussels, http://www.bpie.eu/documents/BPIE/LR_ CbC_study.pdf
Bundeskartellamt 2012. Abschlussbericht Sektoruntersuchung Fernw rme - Bericht gem 32e
GWB - August 2012.
http://www.bundeskartellamt.de/wDeutsch/download/pdf/Publikationen/2012-08-23_SU-
Bericht_Fernwaerme.pdf
Candole Partners. 2012. Romanian Gas and Electricity Markets – review of supply and
regulations. Prague: Candole Partners.
CEER (Council of European Energy Regulators). 2013. Status Review of Renewable and Energy
Efficiency Support Schemes in Europe. Brussels: CEER.
http://www.iern.net/portal/page/portal/IERN_HOME/ICER_HOME/ABOUT_ICER/ICER_R
esources/RegulatoryResearchDatabase/2012/C12-SDE-33-03_RES%20SR_3-Dec-
2012_Rev19-Feb-2013.pdf.
Chubu Electric Power. 2012. Model for Electricity Technology Assessment Guide (META),
Washington DC: World Bank/ESMAP. http://www.esmap.org/node/3051.
Cogen Romania 2011. Starea Actuala a Sistemelor Centralizate de Termoficare - Propuneri
pentru Reabilitarea si Dezvoltarea Acestora
Concerted Action EPBD 2013. Implementing the Energy Performance of Buildings Directive -
Featuring Country Reports 2012. European Union. http://www.epbd-ca.eu/country-
information
EBRD/GEF (2011) Romania: Financing Public Building Efficiency. Request for CEO
Endorsement/Approval.
http://www.thegef.org/gef/sites/thegef.org/files/documents/document/08-11-2011-ID4009-
Council document.pdf
72
Econoler 2011. IFC Energy Service Company Market Analysis. Final Report for International
Finance Corporation.
http://www.ifc.org/wps/wcm/connect/dbaaf8804aabab1c978dd79e0dc67fc6/IFC+EE+ESCO
S+Market+Analysis.pdf?MOD=AJPERES
Econoler 2013. National Building Energy Efficiency Study for Serbia. Consultant report for the
World Bank.
Energy Charter Secretariat 2009. Policies that Work - Introducing Energy Efficiency Standards
and Labels for Appliances and Equipment. Brussels.
Enero 2006. Long Term Agreement – Study on Romanian Context;
http://www.enero.ro/proiecte/lta/doc/LTA_report_3_EN.pdf
ENSI 2012. Study on Energy Efficiency in Buildings in the Contracting Parties of the Energy
Community. Final Report 24.02.2012
European Commission. 2008. European Energy and Transport: Trends to 2030 – Update 2007.
Brussels: European Commission.
http://ec.europa.eu/energy/observatory/trends_2030/doc/trends_to_2030_update_2007.pdf
European Commission. 2010a. European Energy Trends to 2030 – Update 2009. Brussels:
European Commission.
http://ec.europa.eu/energy/observatory/trends_2030/doc/trends_to_2030_update_2009.pdf
European Commission. 2010b. Smart Grids, Energy infrastructure priorities for 2020 and
beyond - A Blueprint for an integrated European energy network, Communication from the
Commission to the European Parliament, the Council, the European economic and social
Committee and the Committee of the regions, COM (2010) 677 final. Brussels: European
Commission.
Eurostat. 2013. Statistical data on energy.
http://epp.eurostat.ec.europa.eu/portal/page/portal/eurostat/home/
EWEA (European Wind Energy Association). 2012. Managing the variability problem in
Europe. http://www.europeanvoice.com/article/imported/managing-the-variability-problem-
in-europe-/75252.aspx. Brussels: EWEA.
Government of Romania 2012. Second National Action Plan for Energy Efficiency (NAPEE)
2012 http://ec.europa.eu/energy/efficiency/end-use_en.htm
Grontmij CarlBro. 2010. Energy Strategy for Bucharest”.
http://www4.pmb.ro/wwwt/L52/docs/01_20100504.pdf. Bucharest: PMB.
Househam, Ian and Virgil Musatescu. 2012. Fuel Poverty. Draft assessment report for the
UNDP/GEF Project Improving Energy Efficiency in Low-Income Households and
Communities in Romania. http://www.undp.ro/libraries/projects/EE/Assesment Report on
Fuel Poverty - DRAFT(1).pdf
ICEMENERG/ANRE. 2012. Energy Efficiency Policies and Measures in Romania - Monitoring
of EU and national energy efficiency targets. http://www.odyssee-
indicators.org/publications/PDF/romania_nr.pdf
73
IEA (International Energy Agency). 2011. Technology Roadmap – Smart Grids.
http://www.iea.org/publications/freepublications/publication/smartgrids_roadmap.pdf
Irzikeviciute, Simona (2012). Experience of Lithuania in financing multi-apartment housing
refurbishment. Housing and Urban Development Agency.
ISPE 2013. Romania Climate Change and Low Carbon Green Growth Program. August 2013
ISPE 2013 – personal communication
JESSICA 2012. Financing Energy Efficiency Renovations in the Latvian Housing Sector. Final
Report, 31 January 2012.
http://ec.europa.eu/regional_policy/archive/funds/2007/jjj/doc/pdf/jessica/20-jessica-study-
latvia-en.pdf
KfW Bankengruppe 2011.Impact on Public Budgets of KfW Promotional Programmes in the
Field of Energy-Efficient Building and Rehabilitation . STE Research Report,
Forschungszentrum J lich, commissioned by KfW Bankengruppe, abridged translation
https://www.kfw.de/migration/Weiterleitung-zur-Startseite/Homepage/KfW-
Group/Research/PDF-Files/Energy-efficient-building-and-rehabilitation.pdf
Limaye, Dilip, and Anke Meyer (2012) Financing Options for the National Program for Energy
Efficiency in Public Buildings (NPEEPB) in the Former Yugoslav Republic of Macedonia,
2012–18. World Bank
MECC (Ministry of Environment and Climate Change). 2013. Romania’s Greenhouse Gas
Inventory 1989-2011. National Inventory Report. http://www.anpm.ro/upload/101770_NIR-
NGHGI 2013 V. 1.4.pdf
Ministerul Economiei. 2012. Aplicația României trimisă de România Articol 10 c Directiva
2003/87/CE. Bucharest: MEC
http://www.minind.ro/Template_for_application_RO_22June_site.pdf.
Ministerul Economiei. 2011. Elemente de strategie energetică 2011-2035. Bucharest: MEC
http://www.minind.ro/dezbateri_publice/2011/strategia_energetica_20112035_20042011.pdf
Ministry of Regional Development. 2004. National District Heating Strategy (Strategy on the
heat supply of localities by means of district heating systems approved through GD 882/2004)
Monsson Group. 2013. Romania benefits from Renewable Energy, presentation at Wind Energy
Conference, Bucharest: Monsson.
NERC (North American Electricity Reliability Corporation). 2010. Reliability Considerations
from the Integration of Smart Grid.
http://energy.gov/sites/prod/files/oeprod/DocumentsandMedia/SGTF_Report_Final.pdf
Nuorkivi, Arto. 2001. Energy for an Enlarged European Union: Investing in a Greener Future.
Presentation at the 30th Congress EUROHEAT & POWER, UNICHAL, Gdynia/Poland
Odyssee – Energy Efficiency Indicators in Europe. 2013. http://www.odyssee-
indicators.org/online-indicators/
PWC (Price Waterhouse Coopers). 2011. Provocări și oportunități pentru sistemul de furnizare
centralizată a energiei termice în România. Bucharest: PWC.
74
http://www.pwc.ro/en/publications/assets/assets_2011/Provocari_Oportunitati_Energie_Term
ica.pdf.
Rabenhorst, Carol 2012. Homeowners’ Associations in CEE: Two Decades after Housing
Privatization.
Singh, Jas, Dilip Limaye, Brian Henderson and Xiaoyu Shi. 2010. Public Procurement of Energy
Efficiency Services – Lessons from International Experience. World Bank/ESMAP
Singh, Jas and Kathrin Hofer. 2013. Scaling Up Energy Efficiency in Buildings in the Western
Balkans – Interim Report. World Bank.
SWECO 2013. Moldova - Identification of Near-term Priority Investments and Preparation of
their Technical Specifications and Tender Documents.
Sweet, B., 2011, EPA Issues Regulations for New Coal-Fired Plants, IEEE Spectrum
Taylor, Robert P., Chandrasekar Govindarajalu , Jeremy Levin, Anke S. Meyer, William A.
Ward. 2008. Financing Energy Efficiency – Lessons from Brazil, China, India and Beyond.
World Bank.
Transelectrica. 2011. Planul de perspectivă RET 2010-2014 și orientativ 2019. Bucharest
http://www.transelectrica.ro/documents/10179/39843/Planul+de+Perspectiva+al+RET+2010
+2014+2019+iulie2011.pdf/b18c4c8c-2689-418f-be33-03cf188f20e1
Transelectrica. 2013. http://www.transelectrica.ro/home
UNDP 2011 Improving Energy Efficiency in Low-Income Households and Communities in
Romania. GEF Project Document.
http://www.undp.ro/libraries/projects/Improving_Energy_Efficiency_in_Low-
Income_Households_and_Communities_in_Romania_-_Project_Document.pdf
UNIDO 2010. Motor Systems Efficiency Supply Curves.
http://www.unido.org/fileadmin/user_media/Services/Energy_and_Climate_Change/Energy_
Efficiency/CCS/UNIDO - UN-Energy - 2010 - Motor Systems Efficiency Supply Curves
(2).pdf
World Bank. 2011, Functional Review: Ministry of Economy, Energy Sector and Business
Environment. Bucharest: World Bank.
http://www.sgg.ro/index.php?politici_publice_documente,
World Bank 2012. Project Appraisal Document on a Proposed Grant from the Global
Environment Facility Trust Fund in the Amount of US$ 1.82 million to the Republic of
Armenia for an Energy Efficiency Project. Washington D.C.
World Bank. 2013, draft report: Scaling up Energy Efficiency in Buildings in Western Balkans