Embed Size (px)
Citation preview

© OECD/IEA 2011
Energy Security & Sustainability for Asia in the 21st Century
2012/2/21 Tokyo UniversityNobuo TANAKAFormer Executive Director of the IEAGlobal Associate of Energy Security and Sustainability, IEEJ
© OECD/IEA 2011 2
0
1,000
2,000
3,000
4,000
5,000
6,000
7,000
8,000
19
71
19
80
19
90
20
00
20
09
20
20
20
30
20
35
Mtoe
Primary Energy Demand by Region (World)
Asia
N.Amerca
OECD Europe
Non-OECD Europe L. AmericaMiddle EastAfrica
Oceania
AAGR*
’80-’09
’09-’35
World 1.8% 1.7%
Asia 4.6% 2.6%
N. America 0.7% 0.4%
200911.2 bil. toe
↓
203517.3 bil. toe
(1.5-fold increase)
World
Asia2009
3.9 bil. toe↓
20357.6 bil. toe
(1.9-fold increase)
3.9 bil. toe
7.6 bil. toe
Reference
*Average annual growth rate
By 2035, primary energy demand of Asia will double from the current level, reflecting high economic growth; 3.9 billion toe(2009) → 7.6 billion toe(2035). Non-OECD will represent 90% of incremental growth of global energy demand toward 2035.
IEEJ Outlook 2011

Figure 3.21 Breakeven costs, budget breakeven and commerciallyattractive prices for current oil production for selectedproducers, mid-2011
0
20
40
60
80
100
120
0 05 510 1015 20 25 30 35 40 45
Oil produc on (mb/d)
Dollarspe
rbarrel
Budgetbreakeven
Commerciallya rac ve
Qatar Ku
wait
SaudiArabia
UAE
Libya
Russia
Vene
zuala
Ango
la
Algeria
Iraq
Nigeria
Ecua
dor
Iran
Supermajors
Breakevencost
Notes: Only OPEC countries, Russia and the aggregation of the five super‐majors (BP, Chevron, ExxonMobil, Shell andTotal) are included. The breakeven cost is the realised oil price at which all operating expenses (excluding taxes) andcapital costs (including a 10% capital discount rate), are fully recovered.
Sources: IEA databases and analysis based on industry sources: APICORP (2011), Deutsche Bank (2011), Credit Suisse(2011), IMF (2011), PFC (2011) and CGES (2011). 3
Figure 2.18 Natural gas demand and the share of imports by region in theNew Policies Scenario, 2009 and 2035
0
100
200
300
400
500
600
700
800 Imports
Domes cproduc on
2009 2035 2009 2035 2009 2035 2009 20352009 2035 2009 2035
United States Japan European Union Other AsiaChina India
bcm
Note: Other Asia had net natural gas exports of 56 bcm in 2009.
Asian demand for gas grows much faster.
China’s demand is 97 BCM in 2009, same as Germany,In 2035 it grows to 502 BCM same as Europe as a whole in 2009
IEA WEO 2011
4

Harnessing Variable Renewables
5
450 ppm Scenmario : what we need and where .Figure 6.2 World energy-related CO2 emissions by scenario2
20
25
30
35
40
45
1990 2000 2010 2020 2030 2035
Gt
15 Gt
7 Gt71%
65%
33%
28%OECD
Non‐OECD Current PoliciesScenario
450 Scenario
New PoliciesScenario
Note: There is also some abatement of inter‐regional (bunker) emissionswhich, at less than 2% of the difference betweenscenarios, is not visible in the 2035 shares.
Figure 6.4 World energy-related CO2 emissions abatement in the450 Scenario relative to the New Policies Scenario
Gt
2020 2035
Efficiency
Renewables
Biofuels
Nuclear
72%
17%
2%
5%
44%
21%
4%
9%
3% 22%
Abatement
Total (Gt CO2)
CCS
20
22
24
26
28
30
32
34
36
38
2010 2015 2020 2025 2030 2035
New Policies Scenario
450 Scenario2.5 14.8
IEA WEO 2011
6
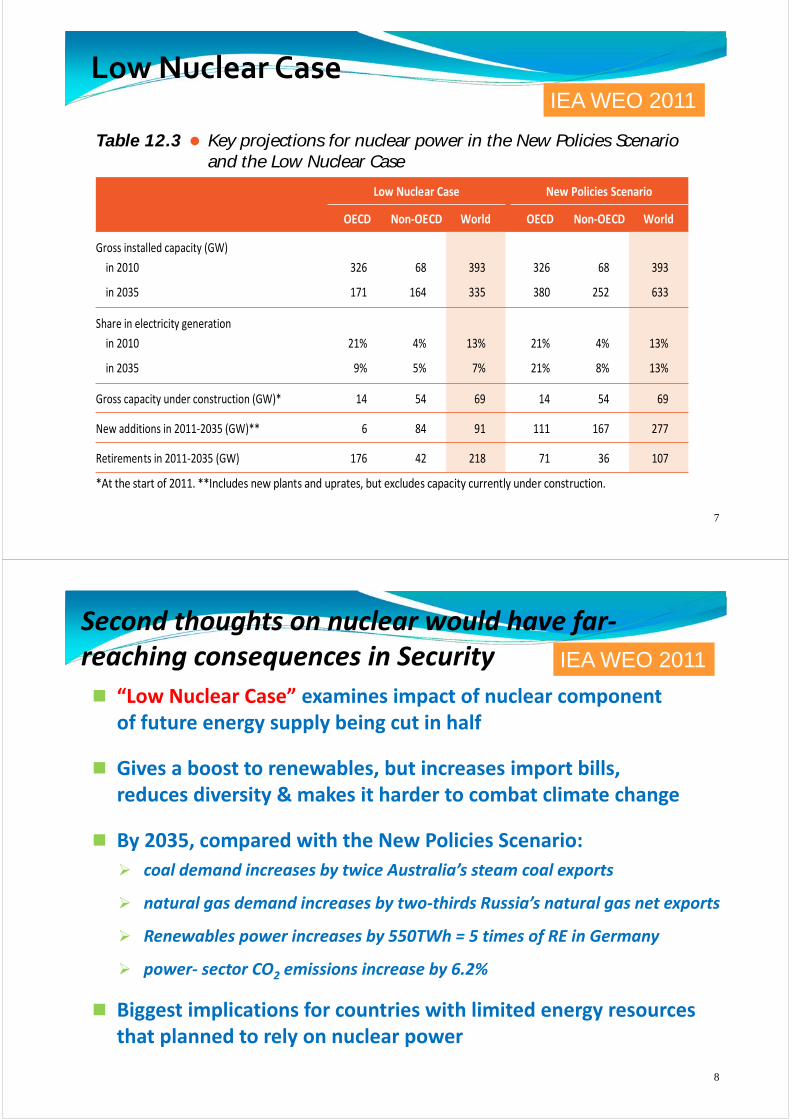
Low Nuclear Case
Table 12.3 Key projections for nuclear power in the New Policies Scenarioand the Low Nuclear Case
Low Nuclear Case New Policies Scenario
OECD Non‐OECD World OECD Non‐OECD World
Gross installed capacity (GW)
in 2010 326 68 393 326 68 393
in 2035 171 164 335 380 252 633
Share in electricity generation
in 2010 21% 4% 13% 21% 4% 13%
in 2035 9% 5% 7% 21% 8% 13%
Gross capacity under construction (GW)* 14 54 69 14 54 69
New additions in 2011‐2035 (GW)** 6 84 91 111 167 277
Retirements in 2011‐2035 (GW) 176 42 218 71 36 107
*At the start of 2011. **Includes new plants and uprates, but excludes capacity currently under construction.
IEA WEO 2011
7
Second thoughts on nuclear would have far‐reaching consequences in Security
“Low Nuclear Case” examines impact of nuclear component of future energy supply being cut in half
Gives a boost to renewables, but increases import bills, reduces diversity & makes it harder to combat climate change
By 2035, compared with the New Policies Scenario:
coal demand increases by twice Australia’s steam coal exports
natural gas demand increases by two‐thirds Russia’s natural gas net exports
Renewables power increases by 550TWh = 5 times of RE in Germany
power‐ sector CO2 emissions increase by 6.2%
Biggest implications for countries with limited energy resources that planned to rely on nuclear power
IEA WEO 2011
8

Germany may needs much more Gas to phase out Nuclear by 2022
0
100
200
300
400
500
600
700
Current Policy 2022
others
Renewables
nuclear
Gas
Coal
Germany needs to import 16 BCM of gas to achieve electricity mix with 10% demand reduction, no nuclear, 35% renewables and CO2 at the target level
twh
9
Power grid in Europe
Source: IEA 「Electricity Information 2010」Indicative value for Net Transfer Capacities (NTC) in Continental Europe
:Generation capacity
:maximum powerflow
France Germany
UK
Netherlands
Norway
Sweden
Italy
Spain Swiss
Austria
Belgium
Max Capacity
Max Capacity
Max Capacity
Max Capacity
Max Capacity
Max Capacity
Max Capacity
Max Capacity
Max Capacity
Max Capacity
Max Capacity
10

Power grid in Japan
Source: Agency for Natural Resources and Energy, The Federation of Electric Power Companies of Japan, Electric Power System Council of Japan, The International Energy Agency
Tokyo
Hokkaido
Tohoku
HokurikuKansaiChugoku
Kyushu29GW
Shikoku12GW
Chubu 40GW
Okinawa2GW
Hydro
Oil
Gas
Nuclear
Coal
Other
Power utility company
Generating company
In‐house generation
--- 50 hz
60 hz <-------
11
Energy mix as Energy Security Mix
Nuclear is an important option for countries with limited indigenous energy resources (low energy sustainability).
Self sufficiency =inland production / tpes (2010 estimates)
26%
51%
96%
10%
8%
30%
14%
11%
0%
0% 20% 40% 60% 80% 100% 120% 140%
EU 27
IEA
ASEAN
12

Does current IEA system continue to work?
IEA stockholding cover of global oil demand
Growing share of non‐OECD oil demand results in declining global demand cover from IEA oil stocks
‐
5
10
15
20
25
30
35
40
0%
10%
20%
30%
40%
50%
60%
days of world oil demand cover
% share of world oil demand
IEA 90 days of stockholding, share of world demand with Chinawith Indiawith ASEANShare of non‐OECD in global oil demand
13
Figure 8.15 Major gas fields and supply infrastructure in Russia
Harbin
Northern Ligh ts
Nord Stream
Export toEurope
Moscow
Yamburg
Medvezhye
Daqing
Shtokman
Urengoy
MongoliaSyria NorthKorea
China
Irkutsk
Japan
Slov. Rep.
Cz.Rep.
Poland
Germany
SwedenDen.
R U S S I A SakhalinIsland
Komsomolsk
Khabarovsk
BovanenkovoSouthTambei
Neth.
Chayandin
ZapolyarnoeS.Russkoe
Krasnoyarsk
Yakutsk
Export toFinland
St. Petersburg
Estonia
Norway
Finland
Latvia
SouthStream
China
Novosibirsk Kemerovo
Tomsk
Surgut
Kazakhstan
U b ki
Tyumen
Orenburg
Astrakhan
Khvalynskoe
TsentralnoeTurkey
Georgia
Azer.Arm.
Volgograd
Ukhta
Vladivostok
Murmansk
YamalPeninsula
Kovykta
Export toEurope
RomaniaMol.
Hungary Sakhalin
Other offshore Arctic
Other ArcticoffshoreBarents Sea
Eastern Siberia
Western Siberia
Volga/Urals
TimanPechora
Caspian
Ukraine
Lithuania
Belarus
Selected gas field
Existing gas pipeline
Pipeline planned/under const.
Existing LNG export terminal
Planned LNG export terminal
This map is for illustrative purposes and is without prejudice to the status of or sovereignty over any territory covered by this map.
SeaofOkhotsk
LaptevSea
East SiberianSea
ChukchiSea
BeringSea
CaspianSea
BlackSea
BalticSea
KaraSeaBarentsSea
Gas Supply Security and Russian Gas Pipelines
IEA WEO 2011
14

Overseas Investments by Chinese National Oil Companies: Assessing the Drivers and Impacts 15
Connecting MENA and Europe:" Desertec" as “Energy for Peace"
Source: DESRETEC Foundation16
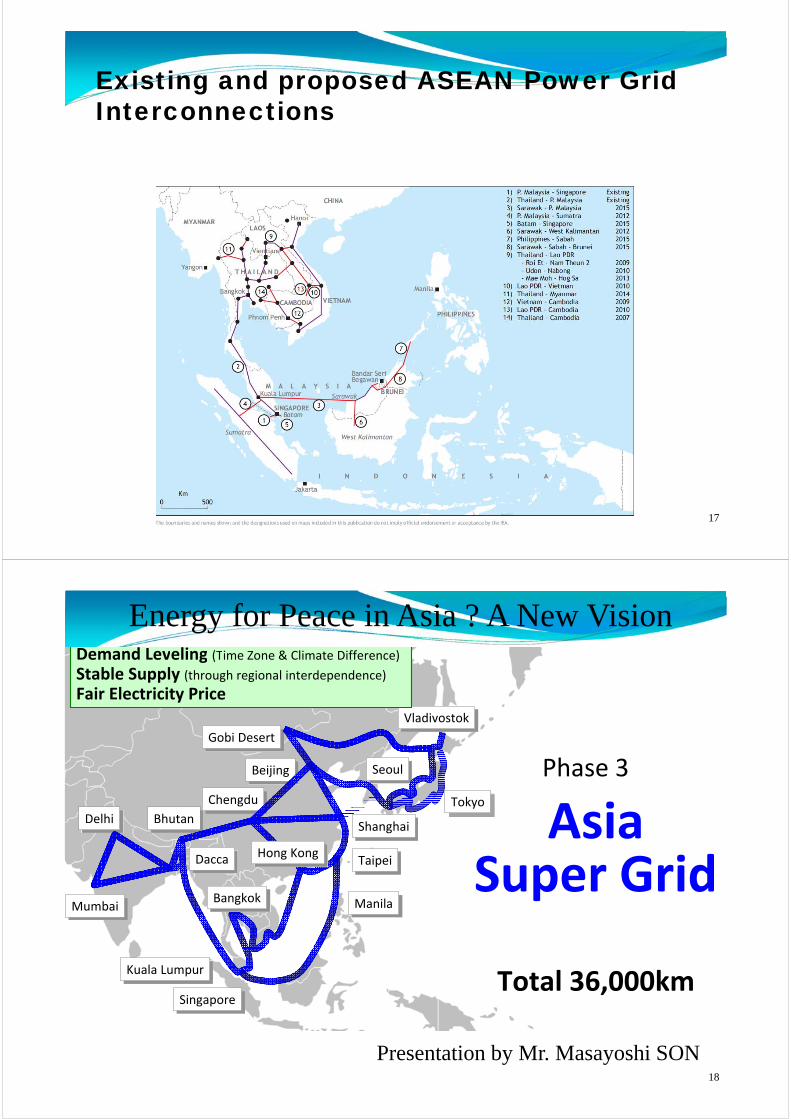
Existing and proposed ASEAN Power Grid Interconnections
17
BhutanBhutan
Gobi DesertGobi Desert
ShanghaiShanghai
TaipeiTaipei
DelhiDelhi
MumbaiMumbai
SingaporeSingapore
VladivostokVladivostok
ChengduChengdu
BeijingBeijing SeoulSeoul
ManilaManila
DaccaDacca
AsiaSuper Grid
Total 36,000km
Phase 3
BangkokBangkok
Hong KongHong Kong
Kuala LumpurKuala Lumpur
TokyoTokyo
Demand Leveling
(Time Zone & Climate Difference)
Stable Supply
(through regional interdependence)
Fair Electricity Price
Presentation by Mr. Masayoshi SON
Energy for Peace in Asia ? A New Vision
18

One cannot enhance energy security by risking someone else‘s.
-Energy Security for the 21st Century must be Comprehensive Electricity Supply Security with diversified sources, such as oil, gas, renewables, cleaner coal and safer nuclear, under sustainability constraints.
-EU Model of Collective Energy Security be applied to the growing Asia. Enlarge IEA’s oil emergency preparedness to Asia and other fuels.
Develop Regional Power Grid interconnection & Gas Pipelines including Russia.
-Deploy a green growth paradigm by Efficiency, decentralized Renewables, EVs, Smart Grids, Storage, etc.
-New technologies help; hydrogen economy, Methane-hydrate , 4G Nuclear power, Super-conductivity grid, CCUS, etc .
-Develop unconventional gas resources and infrastructure.
-For coal to remain the backbone of power supply, CCS readiness & highly efficient power plants are needed.
-Japan’s role after Fukushima: Share the lessons learned for safer Nuclear Power deployment in Asia.
19


![[Challenge:Future] Sustainability in 21st century](https://img.pdfslide.net/doc/110x75/54b98b194a79593d0f8b4621/challengefuture-sustainability-in-21st-century.jpg)