Embed Size (px)
Citation preview

1
Energy Storage Fuel Cell Vehicle Analysis
Ahmad PesaranNational Renewable Energy Laboratory
Golden, Colorado, USA
NREL/PR-540-38143August 2005

2
Co-AuthorsTony Markel (NREL)
Matthew Zolot (NREL)Sam Sprik (NREL)
Harshad Tataria (GM/USABC)Tien Duong (DOE)
Support and GuidanceFreedomCAR Energy Storage Technical Team
USABC Technical Advisory CommitteeTed Miller (Ford)
Cyrus Ashtiani (DaimlerChrysler)Dave Howell (DOE)
Acknowledgments

3
Outline
• Study Objectives• Assumptions & Requirements• Analysis Approach• Results• Conclusions

4
Objective
Determine ESS Requirements for Fuel Cell Hybrid Vehicles for FreedomCAR Tech Teams
F r e e d o m C A R G o a ls F u e l C e l l H y b r id B a t te ry
C h a r a c te r is t ic s U n its
P u ls e D is c h a rg e P o w e r (x s ) k W T B D M a x R e g e n P u ls e (y s ) k W T B D T o ta l A v a i la b le E n e rg y k W h T B D R o u n d T r ip E f f ic ie n c y % > 9 0 C y c le L i fe C y c . T B D C o ld -s ta r t a t -3 0 °C (T B D k W fo r T B D m in . ) k W T B D C a le n d a r L i fe Y rs T B D M a x W e ig h t k g T B D M a x V o lu m e l i te rs T B D P ro d u c t io n P r ic e @ 1 0 0 k u n its /y r $ T B D M a x im u m O p e ra t in g V o lta g e V d c T B D M in im u m O p e ra t in g V o lta g e V d c T B D M a x im u m S e lf D is c h a rg e W h /d 5 0 O p e ra t in g T e m p e ra tu re °C -3 0 to + 5 2 S u rv iv a l T e m p e ra tu re °C -4 6 to + 6 6
Will these requirements will be different than ones for ICE-HEVs?

5
Vehicle Attributesfor Analysis
• Midsize – Initial focus (popular)– Needs smaller fuel cell, thus lower cost
• Extremely Lightweight– For the same increase in fuel economy, it is
more cost effective to take weight out of the vehicle rather than using a larger fuel cell
• Light weighting $/kg >> Larger fuel cell $/kW
• Aerodynamic (relatively low drag coefficient)
Forward-looking(What would be the vehicle characteristics when the fuel cell technology is ready and affordable?)

6
Vehicle Assumptions Characteristics and Requirements
Characteristic Chevrolet MalibuModel Year 2004 Mid-size car
Final NREL Assumptions for Mid-Size Car
(similar to Basic Malibu Sedan)
4,783 x 1,460 x 2,700
1437 kg
1030 (w/ driveline)
63:37
0.5 – estimated
0.30
2.0 (calculated)
0.008 – 0.009
756 km
Better than 160 km/hr
11.0 seconds (estimate)
Better than 6.5% Grade @ 65 mph
4,749 x 1,416 x 2,656
TBD kg = 1060*0.6 + PT Mass
636 =1060*0.6
50:50
0.45
0.25
2.0
Rolling Resistance Coefficient 0.0070
Range (composite City/highway) (320 miles) 500 km (minimum)
Maximum Speed (FC only) (100 mph) 160 km/h
11 seconds
5.5% Grade @ 55 mph (88 km/h)
Dimensions [mm](L x H x L-wheelbase)
Curb Weight [kg] (calculated)
Glider Mass [kg]
Weight Fraction (Front:Rear) [%]
Center-of-Gravity Height [m]
Coefficient of drag
Frontal Area [m2]
(0-60 mph) 0-100 km/h Acceleration
Gradeability (FC only)
7
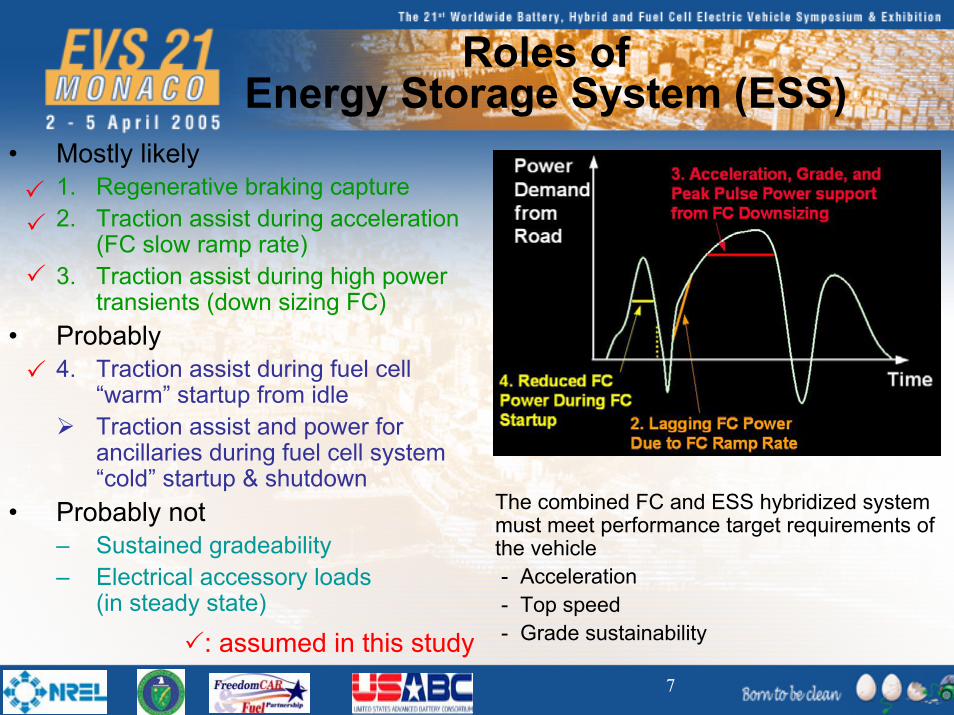
Roles of Energy Storage System (ESS)
• Mostly likely1. Regenerative braking capture2. Traction assist during acceleration
(FC slow ramp rate) 3. Traction assist during high power
transients (down sizing FC)• Probably
4. Traction assist during fuel cell “warm” startup from idleTraction assist and power for ancillaries during fuel cell system “cold” startup & shutdown
• Probably not – Sustained gradeability– Electrical accessory loads
(in steady state)
The combined FC and ESS hybridized system must meet performance target requirements of the vehicle- Acceleration- Top speed- Grade sustainability: assumed in this study

8
Other Assumptions 2010 FreedomCAR/DOE Targets
Motor/ControllerAssumption Description Units ValueSpecific Power (Motor and Controller) kW/kg 0.75Specific Cost (Motor and Controller) $/kW 11Power Density (Motor and Controller) kW/L 3.53
12
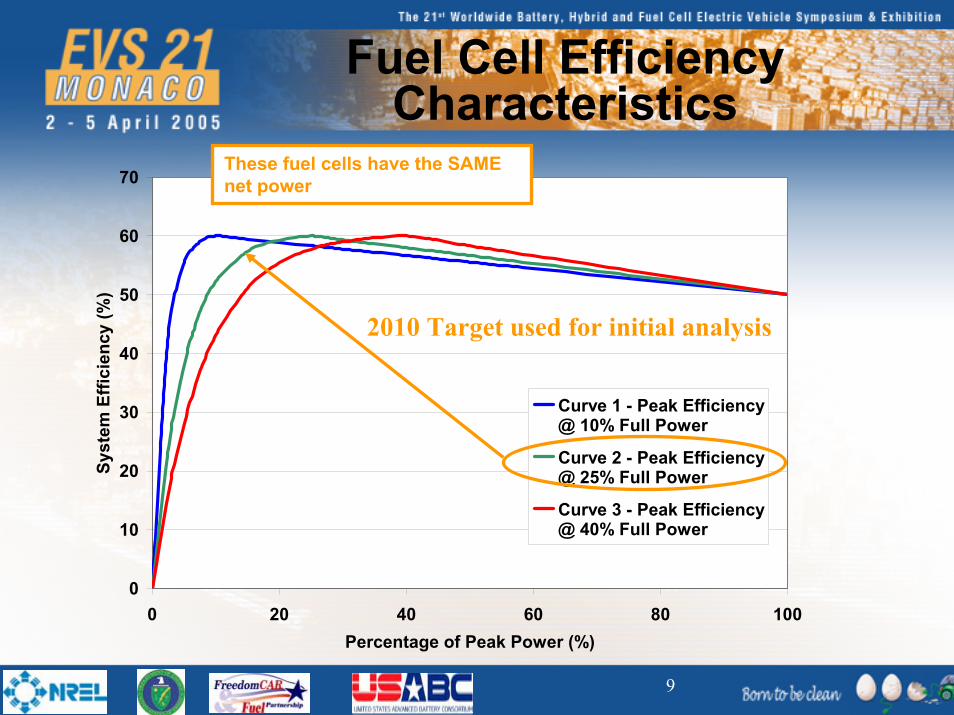
Assumption Description Units ValueFuel Type -- hydrogenFuel Cell Peak Efficiency % 60Fuel Cell Efficiency at 25% Power % 60
Fuel Cell Efficiency at Rated Power % 50Fuel Cell System Specific Power W/kg 500Fuel Cell System Power Density W/L 500Fuel Cell System Cost $/kW 105Fuel Cell System 10-90% Power Transient Response Capability s 1Time from Start to Full Power Output Capability (20C) s 15
Fuel Cell
32 Assumption Description Units ValueEfficiency % 95Specific Cost $/kW 5
Power Electronics
• Assumed 700 W constant accessory loads• Fuel cell is always on (i.e. no start/stop operation)• Fuel cell net power is zero at vehicle stop/idle (gross power >0)• At idle, hydrogen fuel consumption 0.3% of rated power consumption
Hydrogen StorageAssumption Description Units ValueH2 Storage Energy Density kWh/L 1.2H2 Storage Specific Energy kWh/kg 1.5H2 Storage Cost $/kWh 64
9
Fuel Cell Efficiency Characteristics
0
10
20
30
40
50
60
70
0 20 40 60 80 100Percentage of Peak Power (%)
Syst
em E
ffici
ency
(%)
Curve 1 - Peak Efficiency@ 10% Full Power
Curve 2 - Peak Efficiency@ 25% Full Power
Curve 3 - Peak Efficiency@ 40% Full Power
These fuel cells have the SAME net power
2010 Target used for initial analysis
10
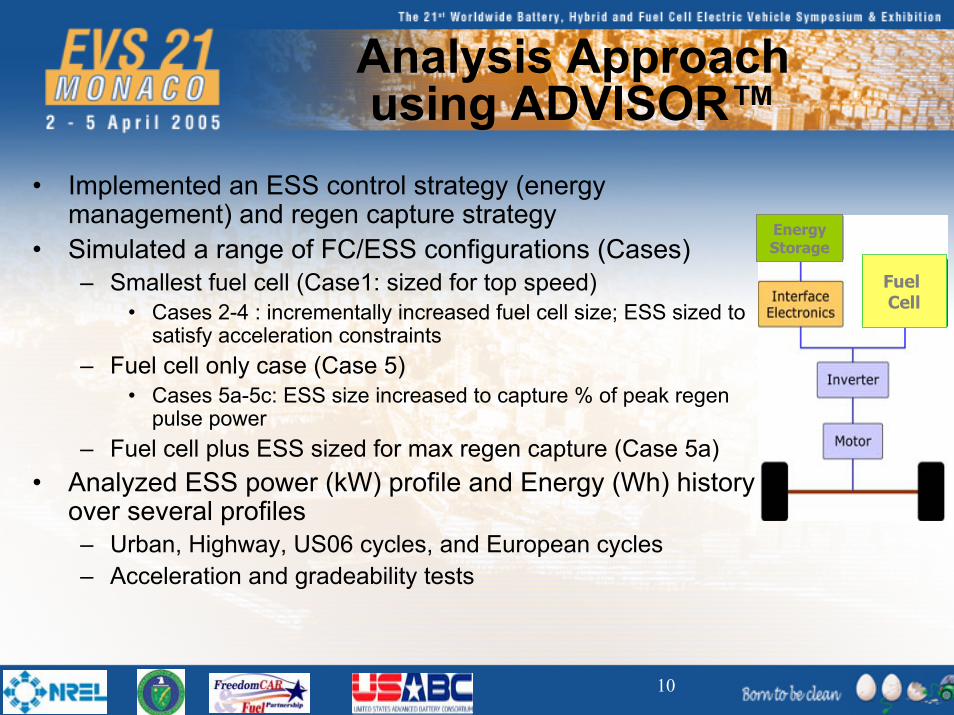
Analysis Approach using ADVISOR™
• Implemented an ESS control strategy (energy management) and regen capture strategy
• Simulated a range of FC/ESS configurations (Cases)– Smallest fuel cell (Case1: sized for top speed)
• Cases 2-4 : incrementally increased fuel cell size; ESS sized to satisfy acceleration constraints
– Fuel cell only case (Case 5)• Cases 5a-5c: ESS size increased to capture % of peak regen
pulse power – Fuel cell plus ESS sized for max regen capture (Case 5a)
• Analyzed ESS power (kW) profile and Energy (Wh) history over several profiles– Urban, Highway, US06 cycles, and European cycles – Acceleration and gradeability tests
Fuel Cell
EnergyStorage
Fuel Cell
EnergyStorage

11
Energy Management Strategy/Assumption Used
• Monitored changes in ESS and modified the fuel cell command to maintain ESS energy level
• Included– Accounting of kinetic energy – Opportunity charge and discharge functionality (only take action if it
makes the overall system efficiency better)– Monitored delta ESS energy to fuel-use ratio for correcting fuel
economy• Used multiple parameters to manage the strength of various
elements of control• A Design of Experiments was performed on each case to
determine the best parameter settings• Two Regenerative Braking Energy Capture
– A fraction of total possible– Deceleration rate-based
12
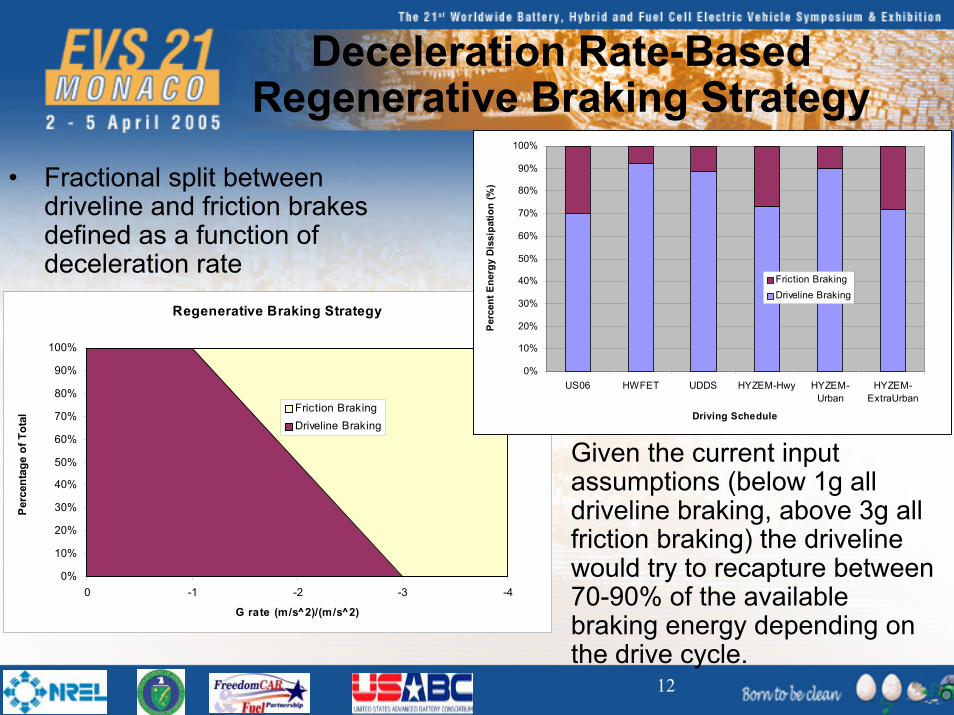
Deceleration Rate-Based Regenerative Braking Strategy
• Fractional split between driveline and friction brakes defined as a function of deceleration rate
• Given the current input assumptions (below 1g all driveline braking, above 3g all friction braking) the driveline would try to recapture between 70-90% of the available braking energy depending on the drive cycle.
Regenerative Braking Strategy
0%
10%
20%
30%
40%
50%
60%
70%
80%
90%
100%
0 -1 -2 -3 -4
G rate (m/s^2)/(m/s^2)
Perc
enta
ge o
f Tot
al
Friction BrakingDriveline Braking
0%
10%
20%
30%
40%
50%
60%
70%
80%
90%
100%
US06 HWFET UDDS HYZEM-Hwy HYZEM-Urban
HYZEM-ExtraUrban
Driving Schedule
Per
cent
Ene
rgy
Dis
sipa
tion
(%)
Friction BrakingDriveline Braking

13
Matrix of Vehicle Configurations Evaluated
• Case 1-4 varies fuel cell size with “deceleration-based regen strategy”
– ESS sized to satisfy acceleration performance constraints
• Case Xa-c with increasing regen power limits
• Case Xf differs from Xa by the fuel cell characteristics
– Xa peak eff at 25% power (DOE goal)
– Xf peak eff at 10% power
Fuel Cell Name Description (kW) Regen (kW) Discharge(KW)
Case 1FC sized for grade/top speed; decel regen strategy; FC_FC50_P25 47000 34000 25000
Case 1a Case 1 + 100% regen 47000 34000 25000Case 1b Case 1 + 75% regen 47000 25500 25000Case 1c Case 1 + 50% regen 47000 17000 25000Case 1f Case 1a + FC_FC50_P10 47000 34000 25000
Case 2Fuel cell - sized to 25% point; decel regen strategy; FC_FC50_P25 54250 34000 18000
Case 2a Case 2 + 100% regen 54250 34000 18000Case 2b Case 2 + 75% regen 54250 25500 18000Case 2c Case 2 + 50% regen 54250 17000 18000Case 2f Case 2a + FC_FC50_P10 54250 34000 18000
Case 3Fuel cell - sized to 50% point; decel regen strategy; FC_FC50_P25 61500 34000 12500
Case 3a Case 3 + 100% regen 61500 34000 12500Case 3b Case 3 + 75% regen 61500 25500 12500Case 3c Case 3 + 50% regen 61500 17000 12500Case 3f Case 3a + FC_FC50_P10 61500 34000 12500
Case 4Fuel cell - sized to 75% point; decel regen strategy; FC_FC50_P25 69000 34000 7500
Case 4a Case 4 + 100% regen 69000 34000 7500Case 4b Case 4 + 75% regen 69000 25500 7500Case 4c Case 4 + 50% regen 69000 17000 7500Case 4f Case 4a + FC_FC50_P10 69000 34000 7500Case 5 Fuel cell only - no ess; FC_FC50_P25 75000 0 0Case 5a Fuel cell only plus 100% ess 75000 36000 36000Case 5b Fuel cell only plus 75% ess 75000 27000 27000Case 5c Fuel cell only plus 50% ess 75000 18000 18000Case 5f Case 5 + FC_FC50_P10 75000 0 0
ESS
Power Requirements (FC-Only): • Accel 0-60 mph: 75 kW• Top speed 100 mph: 47 kW• Gradeability (55 mph @ 5.5%): 34 kW
14
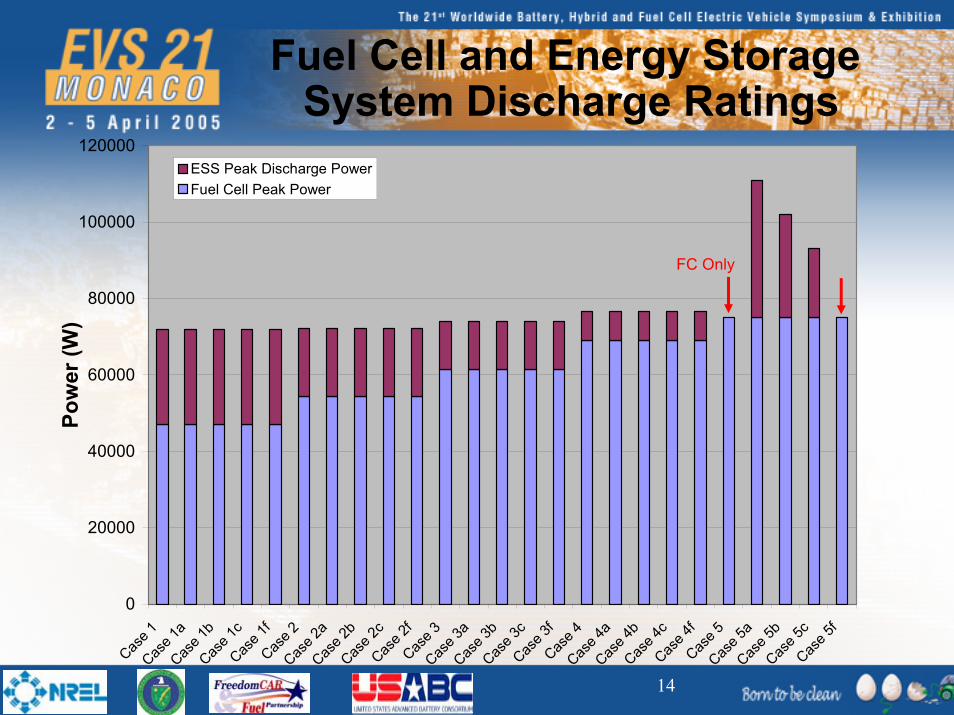
Fuel Cell and Energy StorageSystem Discharge Ratings
0
20000
40000
60000
80000
100000
120000
Case 1
Case 1
aCas
e 1b
Case 1
cCas
e 1f
Case 2
Case 2
aCas
e 2b
Case 2
cCas
e 2f
Case 3
Case 3
aCas
e 3b
Case 3
cCas
e 3f
Case 4
Case 4
aCas
e 4b
Case 4
cCas
e 4f
Case 5
Case 5
aCas
e 5b
Case 5
cCas
e 5f
Pow
er (W
)
ESS Peak Discharge PowerFuel Cell Peak Power
FC Only

15
Preferred Usable Energy Window for EES
0
50
100
150
200
250
300
Case 1
Case 1
aCas
e 1b
Case 1
cCas
e 1f
Case 2
Case 2
aCas
e 2b
Case 2
cCas
e 2f
Case 3
Case 3
aCas
e 3b
Case 3
cCas
e 3f
Case 4
Case 4
aCas
e 4b
Case 4
cCas
e 4f
Case 5
Case 5
aCas
e 5b
Case 5
cCas
e 5f
Max
Ene
rgy
Ran
ge (W
h)
16
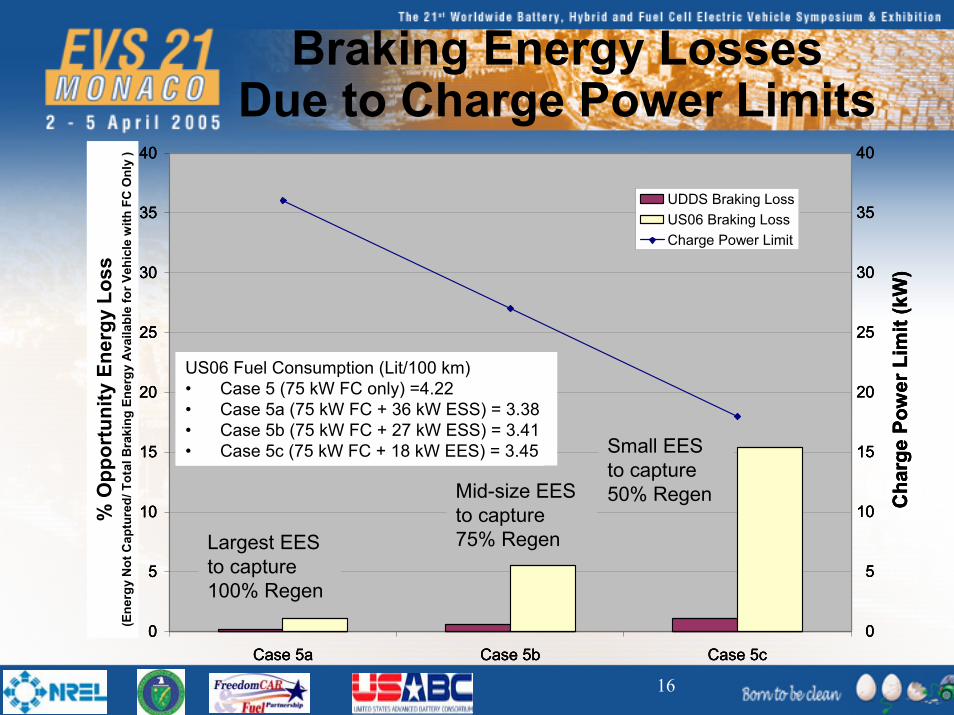
Braking Energy Losses Due to Charge Power Limits
0
5
10
15
20
25
30
35
40
Case 5a Case 5b Case 5c
Bra
king
Los
ses
(% o
f fue
l cel
l onl
y ca
se)
Pow
er (k
W)
UDDS Braking LossUS06 Braking LossCharge Power Limit
Largest EES to capture 100% Regen
Small EES to capture 50% RegenMid-size EES
to capture 75% Regen
0
5
10
15
20
25
30
35
40
Cha
rge
Pow
er L
imit
(kW
)
% O
ppor
tuni
ty E
nerg
y Lo
ss
(Ene
rgy
Not
Cap
ture
d/ T
otal
Bra
king
Ene
rgy
Ava
ilabl
e fo
r Veh
icle
with
FC
Onl
y )
US06 Fuel Consumption (Lit/100km) :• Case 5 (75 kW FC only) = 4.22• Case 5a (75 kW FC + 36 kW ES) = 3.38• Case 5a (75 kW FC + 27 kW ES) = 3.41• Case 5b (75 kW FC + 18 kW ES) = 3.45
0
5
10
15
20
25
30
35
40
Case 5a Case 5b Case 5c
Bra
king
Los
ses
(% o
f fue
l cel
l onl
y ca
se)
Pow
er (k
W)
UDDS Braking LossUS06 Braking LossCharge Power Limit
Largest EES to capture 100% Regen
Small EES to capture 50% RegenMid-size EES
to capture 75% Regen
0
5
10
15
20
25
30
35
40
Cha
rge
Pow
er L
imit
(kW
)
% O
ppor
tuni
ty E
nerg
y Lo
ss
(Ene
rgy
Not
Cap
ture
d/ T
otal
Bra
king
Ene
rgy
Ava
ilabl
e fo
r Veh
icle
with
FC
Onl
y )
0
5
10
15
20
25
30
35
40
Case 5a Case 5b Case 5c
Bra
king
Los
ses
(% o
f fue
l cel
l onl
y ca
se)
Pow
er (k
W)
UDDS Braking LossUS06 Braking LossCharge Power Limit
Largest EES to capture 100% Regen
Small EES to capture 50% RegenMid-size EES
to capture 75% Regen
0
5
10
15
20
25
30
35
40
Cha
rge
Pow
er L
imit
(kW
)
% O
ppor
tuni
ty E
nerg
y Lo
ss
(Ene
rgy
Not
Cap
ture
d/ T
otal
Bra
king
Ene
rgy
Ava
ilabl
e fo
r Veh
icle
with
FC
Onl
y )
US06 Fuel Consumption (Lit/100km) :• Case 5 (75 kW FC only) = 4.22• Case 5a (75 kW FC + 36 kW ES) = 3.38• Case 5a (75 kW FC + 27 kW ES) = 3.41• Case 5b (75 kW FC + 18 kW ES) = 3.45
US06 Fuel Consumption (Lit/100 km)• Case 5 (75 kW FC only) =4.22• Case 5a (75 kW FC + 36 kW ESS) = 3.38• Case 5b (75 kW FC + 27 kW ESS) = 3.41• Case 5c (75 kW FC + 18 kW EES) = 3.45
17
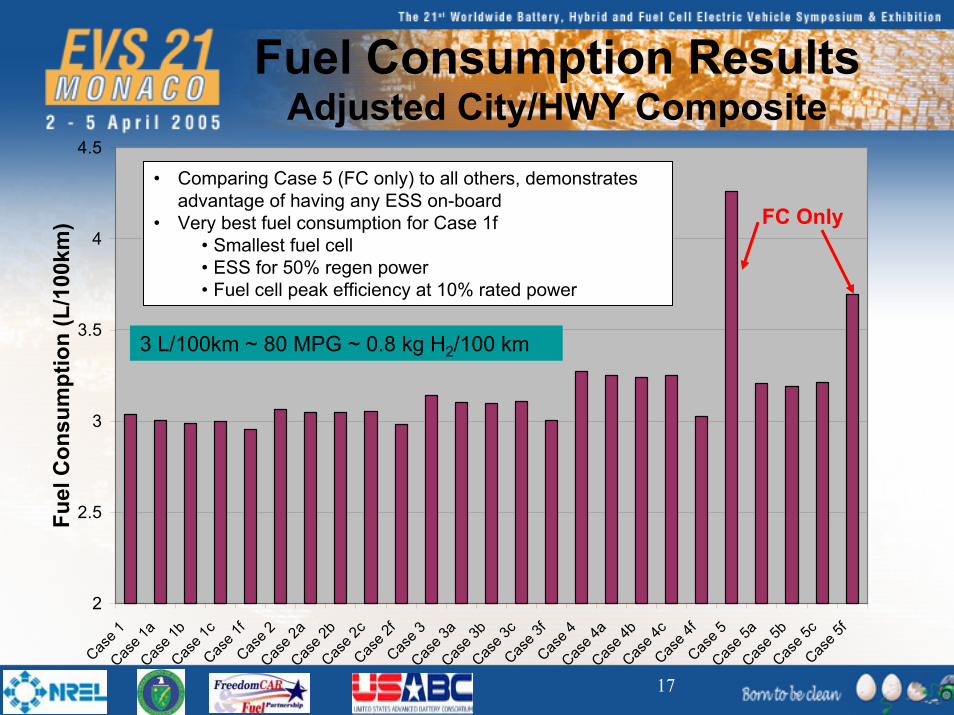
Fuel Consumption ResultsAdjusted City/HWY Composite
2
2.5
3
3.5
4
4.5
Case 1
Case 1
aCas
e 1b
Case 1
cCas
e 1f
Case 2
Case 2
aCas
e 2b
Case 2
cCas
e 2f
Case 3
Case 3
aCas
e 3b
Case 3
cCas
e 3f
Case 4
Case 4
aCas
e 4b
Case 4
cCas
e 4f
Case 5
Case 5
aCas
e 5b
Case 5
cCas
e 5f
Fuel
Con
sum
ptio
n (L
/100
km)
Composite (adjusted)• Comparing Case 5 (FC only) to all others, demonstrates
advantage of having any ESS on-board• Very best fuel consumption for Case 1f
• Smallest fuel cell• ESS for 50% regen power• Fuel cell peak efficiency at 10% rated power
3 L/100km ~ 80 MPG ~ 0.8 kg H2/100 km
FC Only

18
0
500
1000
1500
2000
2500
3000
3500
4000
4500
5000
Case 1
Case 1
aCas
e 1b
Case 1
cCas
e 1f
Case 2
Case 2
aCas
e 2b
Case 2
cCas
e 2f
Case 3
Case 3
aCas
e 3b
Case 3
cCas
e 3f
Case 4
Case 4
aCas
e 4b
Case 4
cCas
e 4f
Case 5
Case 5
aCas
e 5b
Case 5
cCas
e 5f
Pow
ertr
ain
Cos
t ($)
Energy Storage (20 $/kW)Power Electronics (5 $/kW)Traction Motor ($12/kW)Hydrogen Storage (4 $/kWh)Fuel Cell (32 $/kW)
First Cost Summary using 2010 Targets
• Fuel cell primary cost component
• Costs decrease with decreasing fuel cell size
• Costs decrease with decreasing battery size within a case
19
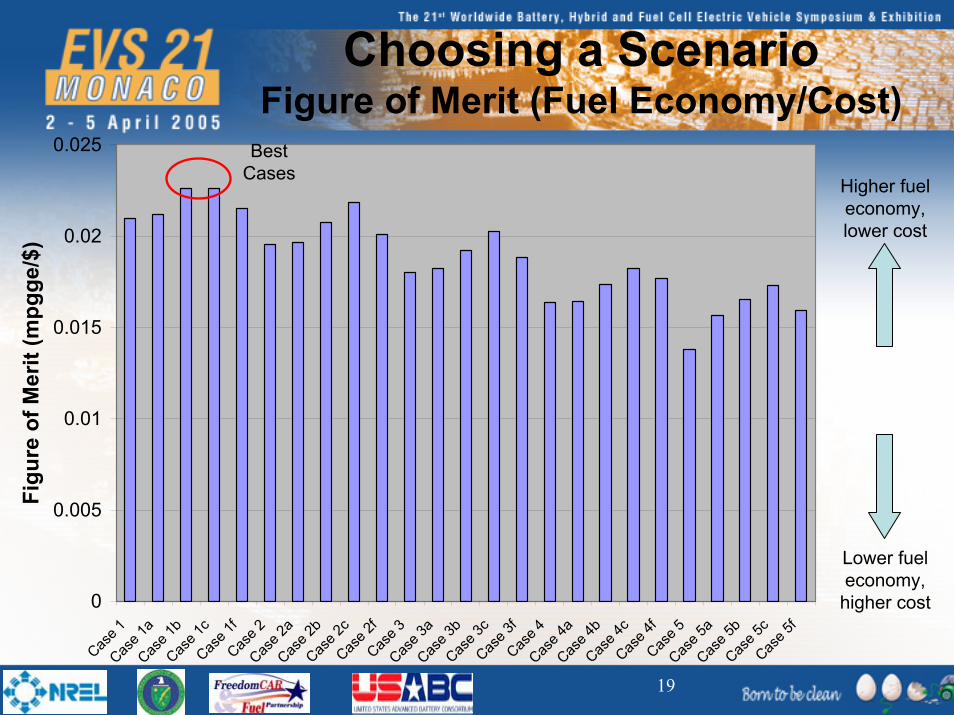
Choosing a Scenario Figure of Merit (Fuel Economy/Cost)
0
0.005
0.01
0.015
0.02
0.025
Case 1
Case 1
aCas
e 1b
Case 1
cCas
e 1f
Case 2
Case 2
aCas
e 2b
Case 2
cCas
e 2f
Case 3
Case 3
aCas
e 3b
Case 3
cCas
e 3f
Case 4
Case 4
aCas
e 4b
Case 4
cCas
e 4f
Case 5
Case 5
aCas
e 5b
Case 5
cCas
e 5f
Figu
re o
f Mer
it (m
pgge
/$)
Higher fuel economy, lower cost
Lower fuel economy, higher cost
Best Cases

20
How to determine ESS requirements from instantaneous power demands from cycles?
Given typical ESS power profile, what would be the appropriate:
• Discharge power (x s)• Regen power (y s)• Energy range (Wh)?
US06
Example: Case 1
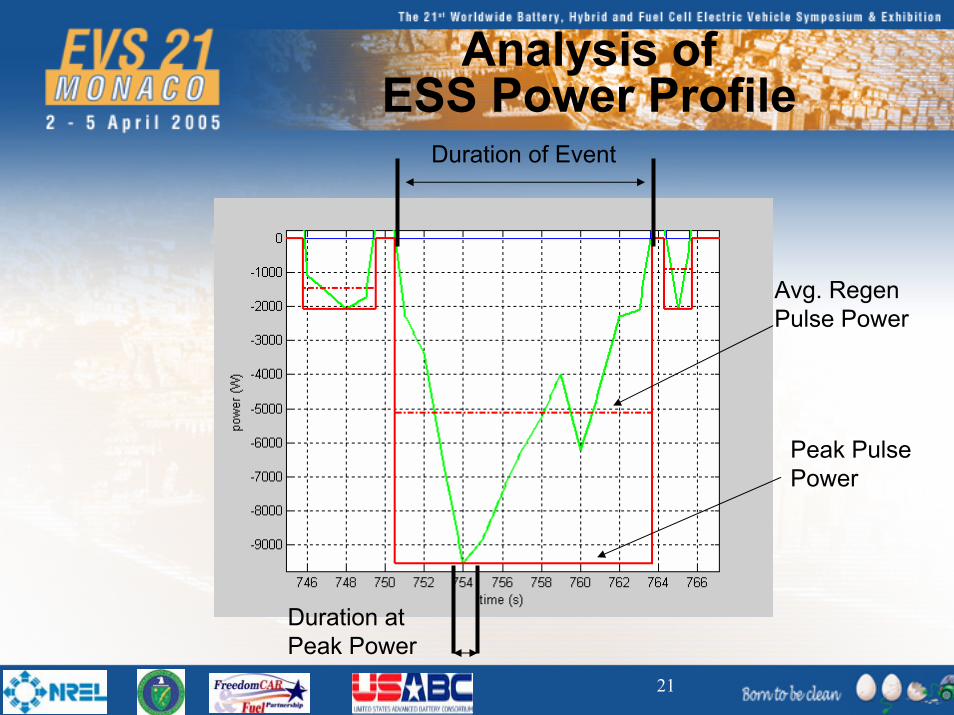
21
Analysis of ESS Power Profile
Avg. RegenPulse Power
Peak Pulse Power
Duration at Peak Power
Duration of Event
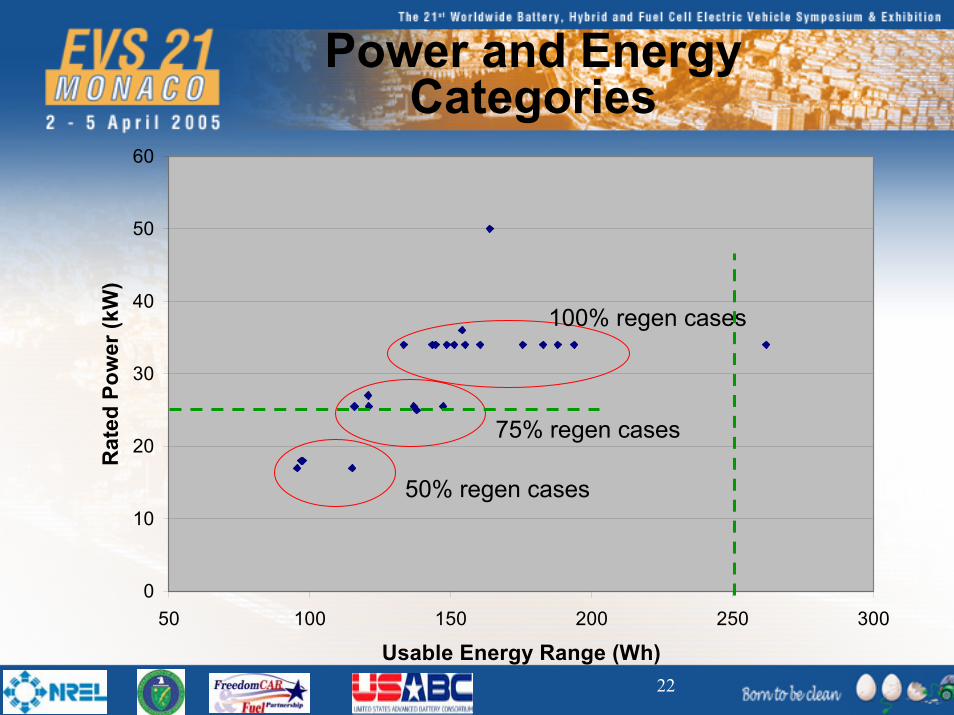
22
Power and Energy Categories
0
10
20
30
40
50
60
50 100 150 200 250 300
Usable Energy Range (Wh)
Rat
ed P
ower
(kW
)
100% regen cases
75% regen cases
50% regen cases

23
Peak Power vs. DurationData for Multiple Cycles
• Peak power events typically only last for short duration (artifact of study approach)
• Discharge sized for acceleration
• Charge sized for US06

24
Avg. Power Need vs. Duration Data for Multiple Cycles
• Power is average power of an event (energy/duration)
• Duration is the time from 0 to 0 power
• Acceleration performance sets discharge requirements
• US06 cycle sets charge requirements

25
Proposed Recommendationsfor ESS for mid-size FCVs
(Smallest fuel cell with moderate ESS)(For a light-weight, aerodynamic, mid-size car)
Goal(Specifications) (units)
ESS for FCV
Pulse Discharge Power (12 s) kW 25Max Regen Pulse (5 s) kW 20Available Energy Wh 250

26
Conclusions
• Intelligent energy management strategy to capture and utilize regen energy in fuel cell hybrid vehicle is critical
• In general, 25-30% improvement in fuel consumption from hybridization– As long as regen capture is maximized – regen strategy not critical– smallest fuel cell with moderate ESS was the most fuel efficient, but
also the least expensive scenario • ESS with 200-250 Wh of usable range seems sufficient for
assumed lightweight midsize fuel cell car• ESS with regen power of around 20 kW for 5s and discharge
power of 25 kW for 10-15s appears to be sufficient for lightweight midsize fuel cell car
• Planning to perform sensitivity analysis and investigate other opportunities provided by fuel cell operating strategies