Embed Size (px)
Citation preview
KTH – SKOLAN FÖR ARKITEKTUR OCH
SAMHÄLLSBYGGNAD - BYGGVETENSKAP
UNIVERSITÀ DEGLI STUDI DI PADOVA
DIPARTIMENTO DI FISICA TECNICA
Energy storage systems: an approach involving the
concept of exergy
MASTER THESIS PROJECT
AUTHOR: Alberto Bellù
KTH SUPERVISOR: Folke Björk
KTH CO-SUPERVISOR: Marco Molinari
UNIVERSITÁ DEGLI STUDI DI PADOVA SUPERVISOR: Roberto Zecchin
Division of Building technology, Master thesis work no 391
ACADEMIC YEAR 2008-2009

2
Energy storage systems: an approach involving the concept of exergy

3
3 Abstract
Abstract
This thesis deals with thermal energy storage systems (TES), which are devices used to store and
re-lease thermal energy with a time delay. In the first part of the thesis, the state-of-art of the
TES systems is discussed, grouping the different technologies on the basis of the energy storing
process. In the second part, a storage system represented by a water tank buried into the
ground is analyzed; the tank is supposed to store the heat coming from a solar collector. The
heat stored through a heat pump is used to supply the heating load to a small house. The simu-
lation is made in three different locations: Stockholm, Venice, and Barcelona; for each of them
an exergy comparison is presented among different systems to supply the heating load.

4
Energy storage systems: an approach involving the concept of exergy
Table of contents
Abstract ............................................................................................................................................ 3
1. Introduction ............................................................................................................................. 6
1.1. Energy and environmental related problems ....................................................................... 6
1.2. Thermal energy storage (TES) as a solution ........................................................................ 7
1.3. Criteria for TES selection ....................................................................................................... 9
2. Energy and exergy analyses ................................................................................................... 11
2.1. Energy analysis .................................................................................................................... 12
2.2 Exergy analysis ..................................................................................................................... 14
3. Methods and examples of the thermal energy storage ........................................................ 17
3.1. Sensible energy storage ...................................................................................................... 18
3.1.1. Solar ponds................................................................................................................... 19
3.1.2. Water storage tanks ..................................................................................................... 29
3.1.3. Underground thermal energy storage ......................................................................... 33
3.1.4. High temperature heat storage ................................................................................... 42
3.1.5. Solid storage systems ................................................................................................... 45
3.2. Latent energy storage ......................................................................................................... 47
3.2.1. Ice storage .................................................................................................................... 49
3.2.2. Organic PCMs ............................................................................................................... 57
3.2.3. Hydrated salts .............................................................................................................. 59
3.3. Thermo-chemical energy storage ....................................................................................... 60

5
5 <Table of contents
3.3.1. Adsorption systems ...................................................................................................... 60
4. Energy and exergy analysis of thermal energy storages ........................................................ 66
4.1. Methodology ....................................................................................................................... 67
4.2. Description of the system .................................................................................................... 69
4.2.1. Stockholm ..................................................................................................................... 69
4.2.2. Venice (Italy) ................................................................................................................. 71
4.2.3. Barcelona (Spain) .......................................................................................................... 73
4.2.4. IDA indoor and climate energy ..................................................................................... 75
4.2.5. Determination of the efficiency of a solar collector..................................................... 77
4.2.6. Determination of the temperature distribution in the soil .......................................... 78
4.2.7. Energy balance of the storage tank .............................................................................. 81
4.3. Results of simulations .......................................................................................................... 83
4.5.1. Stockholm ..................................................................................................................... 84
4.5.2. Venice ........................................................................................................................... 90
4.5.3. Barcelona ...................................................................................................................... 96
5. Conclusions ........................................................................................................................... 102
References ................................................................................................................................ 105

6
Energy storage systems: an approach involving the concept of exergy
1. Introduction
1.1. Energy and environmental related
problems
Everything in our lives is based on energy. Industries, transports and buildings require energy to
produce, to move and to air-condition respectively.
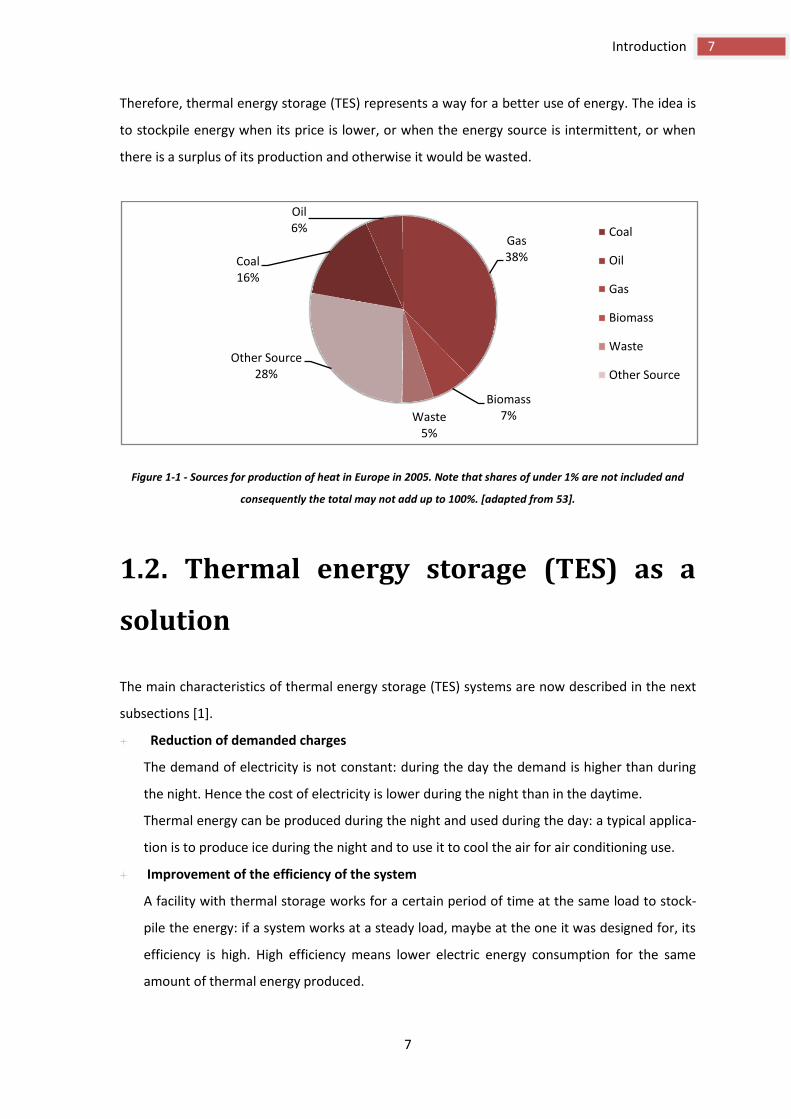
In 2005, Europe consumed 2˙816˙886 TJ of energy to produce heat, and 64% of this heat was
generated by burning coal, gas or oil [53] (see Figure 1-1). It is well-known that fossil fuels are
not renewable; therefore it is possible that in the future they would deplete.
Moreover the use of these sources involves environmental problems; such as [1]:
acid rain;
ozone layer depletion;
greenhouse effect;
productions of air pollutants;
reduction of the air quality;
pollution of underground and surface waters;
radiation and radioactivity (nuclear energy).
Thus it is necessary to find new energy sources. A possibility could be the renewable ones (such
as wind, solar, geothermal energy) but these sources have low energy density (for example with
a photovoltaic panel of 1 m2 it is possible to produce 20-60 W, while with a fossil source from
1.000 to 10.000 W [54]). Hence they can contribute only marginally in satisfying the energy de-
mand. Therefore if they were the solution, a drastic change in our life-style would be necessary.
However, another solution can be pursued, which is the energy efficency and the energy
savings; and a way to do it is to store energy.
7
7 Introduction
Therefore, thermal energy storage (TES) represents a way for a better use of energy. The idea is
to stockpile energy when its price is lower, or when the energy source is intermittent, or when
there is a surplus of its production and otherwise it would be wasted.
Figure 1-1 - Sources for production of heat in Europe in 2005. Note that shares of under 1% are not included and
consequently the total may not add up to 100%. [adapted from 53].
1.2. Thermal energy storage (TES) as a
solution
The main characteristics of thermal energy storage (TES) systems are now described in the next
subsections [1].
Reduction of demanded charges
The demand of electricity is not constant: during the day the demand is higher than during
the night. Hence the cost of electricity is lower during the night than in the daytime.
Thermal energy can be produced during the night and used during the day: a typical applica-
tion is to produce ice during the night and to use it to cool the air for air conditioning use.
Improvement of the efficiency of the system
A facility with thermal storage works for a certain period of time at the same load to stock-
pile the energy: if a system works at a steady load, maybe at the one it was designed for, its
efficiency is high. High efficiency means lower electric energy consumption for the same
amount of thermal energy produced.
Coal16%
Oil6%
Gas38%
Biomass7%Waste
5%
Other Source28%
Coal
Oil
Gas
Biomass
Waste
Other Source

8
Energy storage systems: an approach involving the concept of exergy
Moreover, facilities are designed to compensate for the peak of demanded charges. While
utilizing TES technologies, the size of systems components can be lower because no peak of
demand occurs anymore.
Utilization of renewable energies
Thermal energy storage systems contribute to a better utilization of renewable energies.
Many of these sources, besides the problem of their low energy density mentioned pre-
viously, they present the problem of uncertainty in collecting: sun does not shine 24 hours a
day. Moreover they show a mismatch between the period of the demand of heat and the
time when it is available.
In order to overcome these problems, a possible solution is to install a storage system that
receives the energy when it is produced and release it to the facilities when they require it.
Storing of surplus energy
In many industrial processes thermal energy represents a waste: a possible rational use of
this surplus is to store it.
Moreover, since demand for cooling, heating or hot water in a building is not constant, the
excess of production during the off-peak period can be stored; so during the high-demand
period this energy can be released, thus allowing an increased capacity of the facilities.
Thus the adoption of TES enables facilities not to follow the load of energy required, but
they work with a quasi-constant demand, increasing efficiency [1].
Environmental aspects
Most of the thermal energy consumed by Europe is produced by polluting sources (oil, gas,
and coal). When burning these substances, many greenhouse gases are released to the at-
mosphere, worsening an already precarious state.
Many improvements can be pursued to brake the global warming [19], and one of them is
the TES technology.
Limitations of the TES
The idea of storing energy seems good but a wider consideration shows its weaknesses.
First of all, to store energy another kind of energy is required.
Moreover, complexity of systems increases and to see if TES is profitable or not, a suitable
economical analysis must be done for each situation.
Another limit of these technologies is given by the efficiency of the system: a certain amount
of energy is stored, but the one that is released is less, this to fulfill the thermodynamic laws.
Usually the amount of energy lost is very high, especially in the long-time storage (for exam-
ple when heat is stored for more than 1 or 2 months).
9
9 Introduction
Generally, it is profitable in stockpiling energy only if otherwise that amount of energy would
be unused.
Therefore, some evaluations of cost/benefits must be done before installing a storage sys-
tem; on the next paragraph general criteria are described.
1.3. Criteria for TES selection
We describe in this paragraph some of the criteria to evaluate and select a thermal energy sto-
rage system that best fit to a specific application.
According to Dincer and Rosen [1], there are different criteria but basically we can group them
into the following items.
Technical
There are different technical aspects such as storage medium, size, storage capacity, life-
time, and efficiency; nevertheless usually this not enough to evaluate a storage system be-
cause technical aspect are not independent from the economical one.
Careful evaluations among different possible TES solutions have to be done, finding the one
the best fit a specific application, considering also possible space restrictions or the effect of
the storage into the whole system.
Environmental and safety
Thermal energy storage systems have to be safe and environmentally friendly.
Possible leakages or the working of the TES facility have not to overly impair human health
or the environment.
Economic
Economic criterion is the one that better spur to the use or not of TES technology.
TES systems are economically justified if the annualized capital and operating costs are
enough lower than the ones for a system without TES facility: usually the advantage in using
TES system is evaluated with the primary energy saved.
According to Dincer and Rosen, an economic evaluation for a TES has to take into account
three main aspects that are: the trend of the thermal loads, the energy consumption with or
without TES system, and the size of the storage.
It is required to know the hourly costs of the primary energy, costs of the TES facility, and
possible financial incentives.
10
Energy storage systems: an approach involving the concept of exergy
Sizing
The selection of a proper size of the storage is essential. Undersized storages neutralize or
minimize the pros of the choice of a TES system: if the storage is not big enough, the whole
suffer the consequence and a larger use of traditional facility is required.
For example, if a cold storage is undersized, a low level of indoor comfort will result.
Also oversized storages have to be avoided, because the initial costs are higher and a certain
amount of energy is wasted.
Moreover it is important to design properly installation and control of the storage.
The sizing aspect would appear complicated in certain applications, such as big commercial
building, where the thermal load and occupancy rating are hardly foreseeable.
Storage duration
The costs and the size of the storage vary according to storage duration.
According to Dincer and Rosen, we can classify the storage duration into 3 groups: short,
medium or long term.
Short term storage is used to reduce the peak of thermal loads allowing smaller size of the
facilities and/or to take advantage from a cheaper energy fare. Generally thermal energy is
produced and stockpiled during the off-peak periods and released during the peak ones: this
kind of storage is called diurnal.
Medium and long term storages are used when the delay between the stockpiling and the
releasing is within few weeks and several months. An example of this kind of storage is when
solar energy is collected and stored during the summer, and it is released during the winter
to heat a building.
Integration into an existing thermal facility
Sometimes a TES is integrated into an existing thermal facility. Beyond considering the pre-
vious items, a careful selection has to consider also the existing situation, to best fit the sto-
rage system into the older thermal system.
11
11 Energy and exergy analyses
2. Energy and exergy analyses
Different ways to store thermal energy exist and it is difficult to establish a unique method to
compare them.
Generally the parameters used to evaluate a TES system is the ratio between energy input and
output from the storage: for example the amount of energy coming from a solar collector and
the one released after the storage to the user.
According to Dincer and Rosen [1], this ratio is limitative because of it does not take into account
some aspects such as:
how far is the storage process from the ideal one;
storage duration;
the temperatures of the stored and released energy;
the environmental temperature.
Thus if we are comparing two different storage systems that have stockpiled the same amount
of energy, and they have the same efficiency but they release heat at a different temperature,
from the energy analysis point of view the two systems are equal.
In other words, this ratio does not take into account the quality of the energy. In order to over-
come this limit, a new concept has been introduced.
This concept derives from the second Law of Thermodynamic and it is the exergy balance.

12
Energy storage systems: an approach involving the concept of exergy
2.1. Energy balance
The energy analysis is based on the First Law of Thermodynamics, which states the equivalence
between heat and work or, from another point of view, the principle of conservation of energy
[49]; in formula:
where stand for work and represents heat.
It means that “in a cyclic process, the amount of heat exchanged between the system and the
surroundings is equal to the amount of net work exchanged, if both the two quantities are con-
sidered with their sign” *adapted from 49+.
Removing the integral sign, it appears that:
where represents the total energy stored by the system. is composed of three terms:
where represents internal energy, is kinetic energy, and the last one represents
the potential energy of the system.
Figure 2-1 - Open system [adapted from 50].

13
13 Energy and exergy analyses
Considering now an open system (see Figure 2-1) in which a certain amount of matter is flowing
through a certain control region, bounded by sections and . It is defined [50]:
as the work exchanged without changing the volume of the system;
as the work exchanged changing the volume of the system;
as the values of pressure, internal energy, volume, velocity and geodesic
height of the mass that is entering inside the control region;
as the values of pressure, internal energy, volume, velocity and geo-
desic height of the mass that is leaving the control region;
as the heat that is exchanged between the control region and the surroundings;
The borders of the system are considered in two different moments: with the broken line is con-
sidered the system in instant , while the dash dot line represents the boundary in the instant
.
It is defined also as the variation of the total energy of the matter inside the control region
during the instant , while represents the mass of the matter inside the control region.
According to conservation of mass, it is possible to write:
Deriving the above equation,
And if there is a permanent flow, and so
The work that is exchanged can be expressed by the following expression:
While the total variation of the system can be expressed as:
where represents the potential energy, is the kinetics energy and is the in-
ternal energy.
The first Law of Thermodynamics gives:
hence,
Deriving with respect of time and considering the enthalpy :

14
Energy storage systems: an approach involving the concept of exergy
If there are more than one heat flows, work and matter that flow in or out the system, it can be
said:
If and there is no variation of volume of the control region ( ), the
sum of the fluxes of energy that enter inside the region control is equal to the one that exit. In
formula:
where stands for energy.
2.2 Exergy balance
When an energy balance of a building is done, usually cubic meters of gas required to heat are
separated from electricity consumption; generally speaking, we distinguish the thermal kWh
from the electric one.
This distinction can be overcome with the concept of exergy. Exergy is a parameter by which is
possible to compare different sources of energy on a unique basis, which is represented by the
environmental state.
What we compare is the quality of the different source of energy, which is their ability to pro-
duce mechanical work [50].
Exergy is the maximum work which can be obtained from a particular source of energy [50], thus
we can said that one kWh of work is equal to one kWh of exergy.
According to Kotas [50], the energy balance states the principle of the conservation of energy,
while the exergy balance affirms that the energy degrades: every energy transformation being
irreversible involves a loss of quality of energy, or in other word a loss of exergy [50].
We can consider now the control region Σ on Figure 2-2.
A flow of matter enters, while another one is leaving: the system work on permanent state, thus
the inlet mass is equal to the outlet one.
Through the boundaries of the control region thermal is exchanged. The sources have different
temperatures; moreover the system exchanges heat with the environment, which represents
the reference state.
According to the First Principle of Thermodynamics, we can affirm [49]:

15
15 Energy and exergy analyses
Figure 2-2 - The system analyzed [49].
Where:
is the thermal energy exchanged with the environment;
represents the sum of the thermal energy exchanged with the different
thermal sources at temperatures ;
is the flow of matter that is crossing the boundaries of the control region;
and are the enthalpies of the outlet and the inlet flux respectively;
and are the kinematic energies of the outlet and the inlet flux respective-
ly;
and are the potential energies of the outlet and the inlet flux re-
spectively;
is the power exchanged by the system with the environment.
According to the Second Principle of Thermodynamics, we can affirm [49]:
Where:
and represent the entropy of the outlet and the inlet flux respectively;
is the temperature of the environment;
is the temperature of the thermal source;
represents the increase of entropy due to irreversibility.

16
Energy storage systems: an approach involving the concept of exergy
Now we multiply the last equation by and sum the two expressions above written.
We have [49]:
If the process is reversible is equal to 0: it is possible to evaluate the maximum pow-
er reachable through the heat exchanged and the difference of state between the inlet
and the outlet flux.
If we remember the definition of exergy, as the maximum work reachable through a
process, what we have written here is a generic exergetic balance.
In particular:
is the exergy associated to a specific amount of thermal energy;
represents the exergy associated at the sys-
tem (the control region Σ);
and represent the kinematic and potential
energy (these forms of energy are considered pure exergy);
is the exergy that is lost during the process.
17
17 Methods and examples of the thermal energy storage
3. Methods and examples of the
thermal energy storage
There are different systems to store heat. In the following paragraphs we introduce some of the
more common ones [1].
A first classification could be [4]:
sensible energy storage (energy is stored in a medium which doesn´t change its phase)
see 3.1;
latent energy storage (in which energy is stockpiled and than exchanged through a
changing phase material) see 3.2;
thermo-chemical energy storage (energy is stored through a endothermic chemical reac-
tion, while to release it, a exothermic reaction takes place) see 3.3..

18
Energy storage systems: an approach involving the concept of exergy
3.1. Sensible energy storage
Sensible energy storage means that energy is stockpiled or released through heating or cooling a
medium.
Thus the energy stored is proportional to the temperature change of the material: this could be
expressed as [4]:
,
where m represents the mass of the medium, cp is the specific heat and T1 and T2 are the tem-
peratures between which the system works.
Sensible heat storage systems are simpler in the design than the thermo-chemical or latent
ones, but their sizes are bigger [4].
Moreover they cannot store and release thermal energy at a constant temperature [4].
In this thesis the following types of sensible heat storages have been considered:
solar ponds (see 3.1.1.);
water storage tanks (see 3.1.2.);
underground thermal energy storage (see 3.1.3.);
high temperature heat storage (see 3.1.4.);
solid storage systems (see 3.1.5.).
Figure 3-1 - Range of temperatures of sensible thermal storage systems
0
100
200
300
400
500
600
Solar Ponds Water Tank Aquifer Thermal Energy Storage
Borehole Thermal Energy Storage
Oils tank Molten Salts Tank
Tem
pe
ratu
re [
°C]

19
19 Methods and examples of the thermal energy storage
3.1.1. Solar ponds
A solar pond is a volume of water enclosed in a basin which is used to convert store solar radia-
tion into heat.
There are two kinds of solar pond: convective or not.
To the second group belong deep ponds and, in order to store thermal energy, inhibition of the
natural convection is needed (See 3.1.1.1).
At the first group belongs the shallow solar pond. As the name suggests, system consists of a low
depth basin (usually few centimeters), (See 3.1.1.2.).
Figure 3-2 - Classification of solar ponds technologies (adapted from [2]).
Solar ponds
Non convective
Salt gradient
Gel stabilized
Honeycomb
Other
Convective Shallow

20
Energy storage systems: an approach involving the concept of exergy
3.1.1.1. Non-convective solar pond
In this group it´s possible to distinguish between three different types, on the basis of the way
natural convection is suppressed. These are:
salinity gradient solar pond (SGSP) (see 3.1.1.1.1.);
gel stabilized solar pond (see 3.1.1.1.2.);
honeycomb solar pond (see 3.1.1.1.3.);
other solar pond (see 3.1.1.1.4.).
Of these systems, only SGSP has got certain diffusion, especially in the average-lower latitudes.
3.1.1.1.1. Salinity Gradient Solar Pond (SGSP)
A solar pond is a volume of water enclosed in a basin, in which thermal convection is inhibited.
This phenomenon can be observed in nature. For example in a group of Hungarian lakes, where
there is a temperature gradient that rises with the depth and this is due to the unusual salt con-
centration on the bottom of the lake. At a depth of 1,3 meters, temperature upwards 70 °C has
been registered [5].
Artificial solar pond is a pool of water in which a certain concentration of salt is dissolved. It
represents a cheap way to store solar energy.
The concentration of salt varies with the depth and it’s artificially created. So it’s possible to dis-
tinguish three different zones [3]:
UCZ (Upper Convective Zone): where the level of salinity is very low and more or less
constant with the depth;
NCZ (Non Convective Zone): there’s a salinity positive gradient with the dept
LCZ (Lower Convective Zone): level of salinity can be assumed close to saturated brine
and uniform.
Salinity, temperature and density distributions are shown in Figure 3-3.
The thermal heat storage works only if salinity of these three different layers is preserved.
In a pond without this gradient of salt, incident solar radiation penetrates with a certain angle
due to the different coefficient of transmission between air and water. The energy absorbed
warms the water up, generating a gradient of temperature and consequently a density gradient
which induces an up-down flux into the pond. The result is that pond water temperature re-
mains close at the one of the atmosphere [6].
To store the solar radiation energy, this phenomenon must be avoided or at least reduced.
A way to do this is to contrast the gradient of density due to temperature, with another one in
the opposite way. Thus the upward buoyancy force is counterbalanced by the one due to the sa-
21
21 Methods and examples of the thermal energy storage
linity gradient facing downward. Typical concentrations are 20% ÷ 30% on the bottom and 0% on
the top [3].
As a consequence, no convective currents are allowed and through the NCZ only conductive heat
transfer is possible. Nevertheless, the conductivity coefficient of the water is low, so this layer
works as an insulator.
Salt diffusion from below to the upper level is low because convection motions are suppressed.
Thus, the lower layer works as a heat storage system: the LCZ can reach the temperature of 80°C
and this value is around 50°C the morning after [3]. The temperature of the brine on the bottom
of the system could not get over the boiling point of the fresh water.
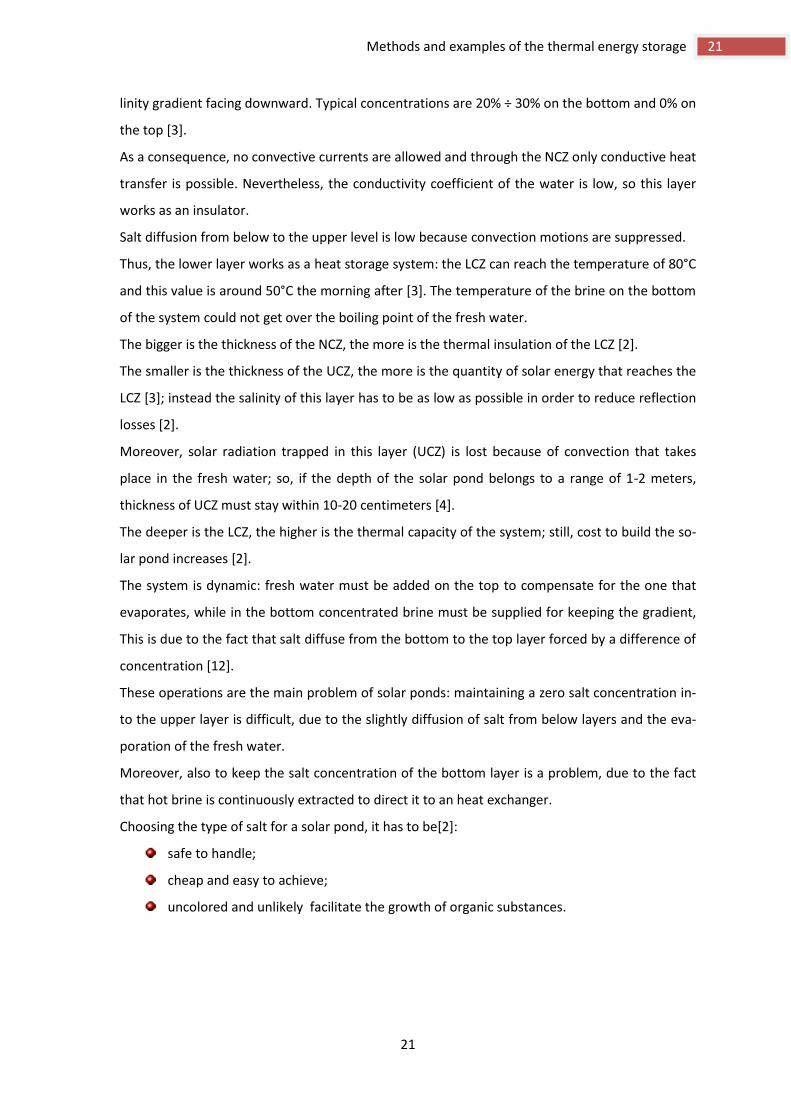
The bigger is the thickness of the NCZ, the more is the thermal insulation of the LCZ [2].
The smaller is the thickness of the UCZ, the more is the quantity of solar energy that reaches the
LCZ [3]; instead the salinity of this layer has to be as low as possible in order to reduce reflection
losses [2].
Moreover, solar radiation trapped in this layer (UCZ) is lost because of convection that takes
place in the fresh water; so, if the depth of the solar pond belongs to a range of 1-2 meters,
thickness of UCZ must stay within 10-20 centimeters [4].
The deeper is the LCZ, the higher is the thermal capacity of the system; still, cost to build the so-
lar pond increases [2].
The system is dynamic: fresh water must be added on the top to compensate for the one that
evaporates, while in the bottom concentrated brine must be supplied for keeping the gradient,
This is due to the fact that salt diffuse from the bottom to the top layer forced by a difference of
concentration [12].
These operations are the main problem of solar ponds: maintaining a zero salt concentration in-
to the upper layer is difficult, due to the slightly diffusion of salt from below layers and the eva-
poration of the fresh water.
Moreover, also to keep the salt concentration of the bottom layer is a problem, due to the fact
that hot brine is continuously extracted to direct it to an heat exchanger.
Choosing the type of salt for a solar pond, it has to be[2]:
safe to handle;
cheap and easy to achieve;
uncolored and unlikely facilitate the growth of organic substances.

22
Energy storage systems: an approach involving the concept of exergy
Figure 3-3 - The SGSP and trends of salinity, temperature and density into it [3].
Different salts satisfy the criteria, such as magnesium chloride MgCl2, potassium nitrate KNO3,
ammonium nitrate NH4NO3, sodium nitrate NaNO3, urea NH2CO · NH2[6].
To improve the system, usually the bottom of the pond is blackened and well-insulated from the
outside environment.
Bezir et al. [7] developed a numerical analysis and an experimental study about the increasing of
the performance of a SGSP with or without reflectors and cover.
The area of the SGSP considered is 3,5 x 3,5 m2 and a depth is 2 m. Two covered surface has be
put on the top of the basin: one is fixed with a particular angle and the other one is moved with
an electric motor on the basis of solar elevation angle. Numerical results and direct measure-
ments show that covers have a little significance in preventing the heat losses during the night;
while if these covers work also as collectors during the day, SGSP increase in performance of
about 25%.
23
23 Methods and examples of the thermal energy storage
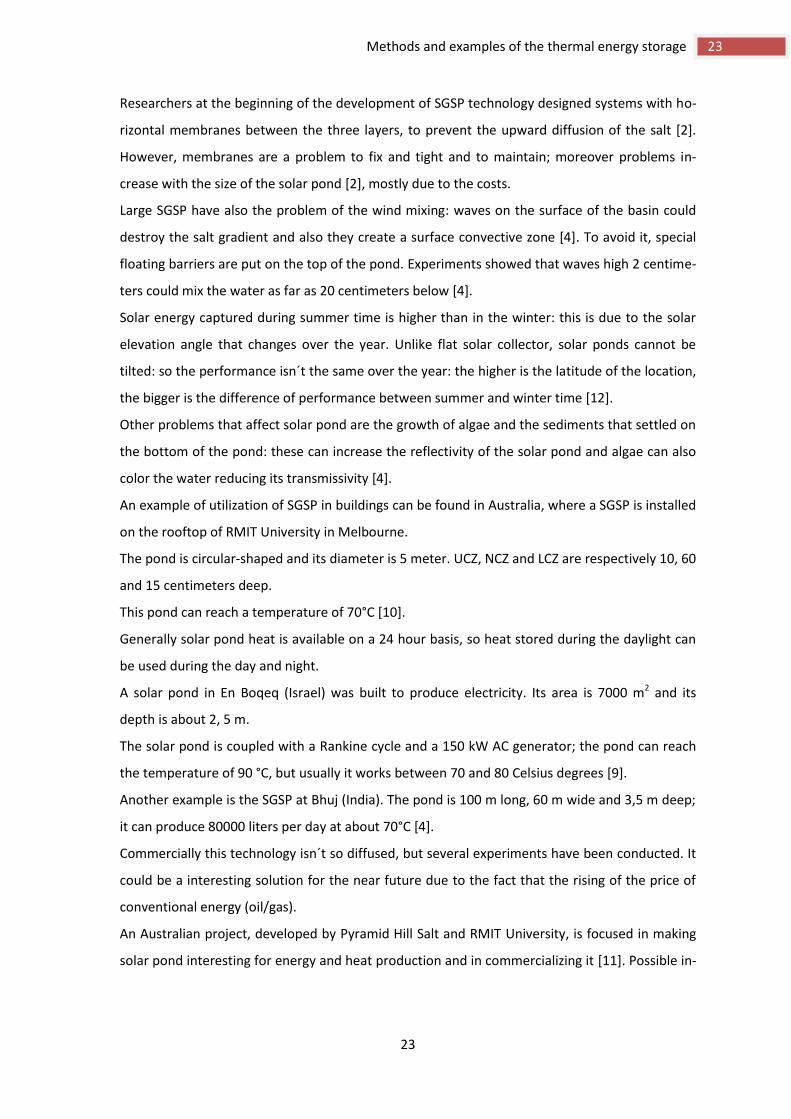
Researchers at the beginning of the development of SGSP technology designed systems with ho-
rizontal membranes between the three layers, to prevent the upward diffusion of the salt [2].
However, membranes are a problem to fix and tight and to maintain; moreover problems in-
crease with the size of the solar pond [2], mostly due to the costs.
Large SGSP have also the problem of the wind mixing: waves on the surface of the basin could
destroy the salt gradient and also they create a surface convective zone [4]. To avoid it, special
floating barriers are put on the top of the pond. Experiments showed that waves high 2 centime-
ters could mix the water as far as 20 centimeters below [4].
Solar energy captured during summer time is higher than in the winter: this is due to the solar
elevation angle that changes over the year. Unlike flat solar collector, solar ponds cannot be
tilted: so the performance isn´t the same over the year: the higher is the latitude of the location,
the bigger is the difference of performance between summer and winter time [12].
Other problems that affect solar pond are the growth of algae and the sediments that settled on
the bottom of the pond: these can increase the reflectivity of the solar pond and algae can also
color the water reducing its transmissivity [4].
An example of utilization of SGSP in buildings can be found in Australia, where a SGSP is installed
on the rooftop of RMIT University in Melbourne.
The pond is circular-shaped and its diameter is 5 meter. UCZ, NCZ and LCZ are respectively 10, 60
and 15 centimeters deep.
This pond can reach a temperature of 70°C [10].
Generally solar pond heat is available on a 24 hour basis, so heat stored during the daylight can
be used during the day and night.
A solar pond in En Boqeq (Israel) was built to produce electricity. Its area is 7000 m2 and its
depth is about 2, 5 m.
The solar pond is coupled with a Rankine cycle and a 150 kW AC generator; the pond can reach
the temperature of 90 °C, but usually it works between 70 and 80 Celsius degrees [9].
Another example is the SGSP at Bhuj (India). The pond is 100 m long, 60 m wide and 3,5 m deep;
it can produce 80000 liters per day at about 70°C [4].
Commercially this technology isn´t so diffused, but several experiments have been conducted. It
could be a interesting solution for the near future due to the fact that the rising of the price of
conventional energy (oil/gas).
An Australian project, developed by Pyramid Hill Salt and RMIT University, is focused in making
solar pond interesting for energy and heat production and in commercializing it [11]. Possible in-

24
Energy storage systems: an approach involving the concept of exergy
dustries interested in this technology are those that need heat at low temperature (45-80°C)
such as [11]:
salt manufactures
aquaculture
dairy industries
grain and greens drying industries
water supplies (for desalination).
Solar pond are attractive if [11],[1]:
the utility is in a desert area, far from gas network and the costs for supplying of energy
is expensive;
the temperature required is between 40 and 80°C;
is available a flat cheap barren area;
the annual-average solar-irradiation of such area is quite high;
is possible to have a large amount of salt cheaply.
Figure 3-4 - Solar pond in El Paso, Texas [67].

25
25 Methods and examples of the thermal energy storage
3.1.1.1.2. Gel stabilized solar pond
Because of the problems of the SGSP, in 1978 a new system was proposed by Shaffer [15].
His idea was to use a gel polymer which, at the same time, insulates the pond below and allows
the solar radiation to reach the storage zone.
In this way the gel, floating over the LCZ, replaces the NCZ and the UCZ of the SGSP.
Main advantages of this technology are [13]:
is eliminated the problem of adding fresh water on the UCZ to compensate for the one
that evaporates;
no sediments falls into the storage zone. A periodical cleaning of the upper side of the
gel surface;
no problems occur due to wind mixing.
The main problem is due to high costs of the gel, which prevents the use of this system in larger
scale systems.
A demonstrative application of this system was built in the 1980 by Wilkins et al.[14] (figure 3.3).
Figure 3-5 - Schematic diagram of the gel pond built [14].
The solar gel pond was built close to the University of New Mexico (Figure 3-5). Experiments
were conducted changing the salt concentration and the thickness of the gel layer [14].
The pond reached the temperature of 57°C in the autumn 1981 with a gel thick 25 cm
A commercial pond was built in Chamberino in New Mexico to supply heat to a food company.
The area of the pond is 110 m2 and the bottom layer reached the temperature of about 60°C.
26
Energy storage systems: an approach involving the concept of exergy
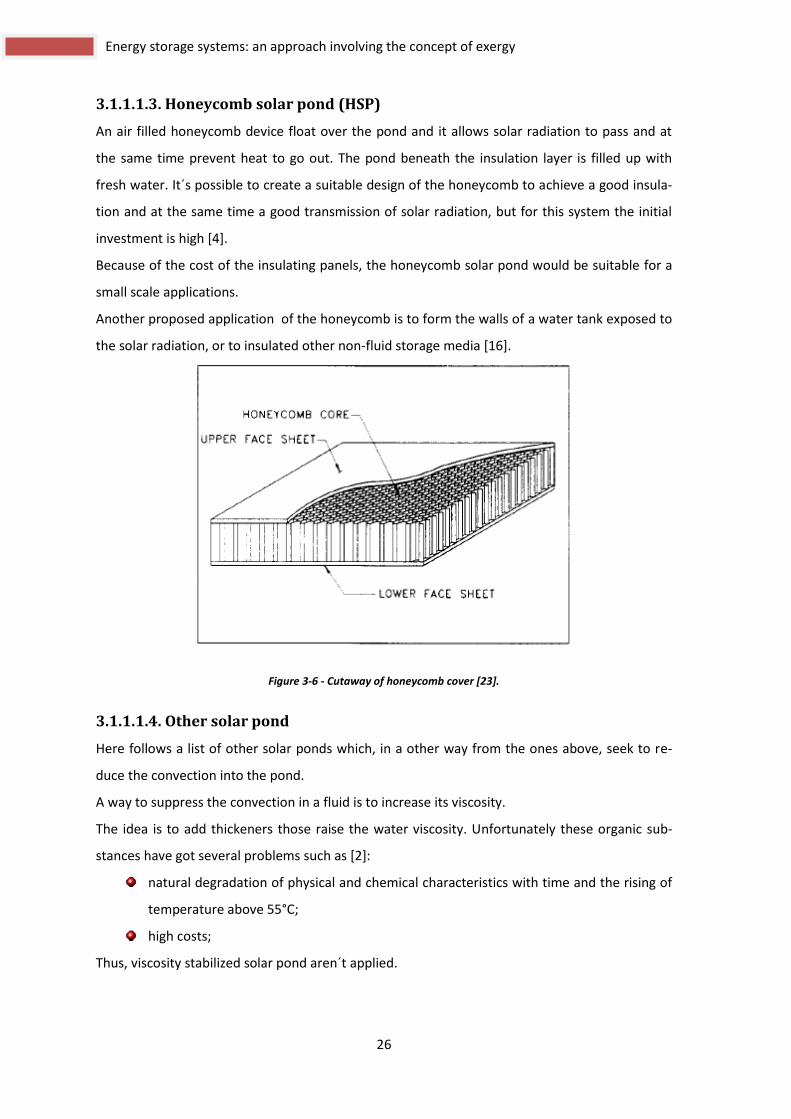
3.1.1.1.3. Honeycomb solar pond (HSP)
An air filled honeycomb device float over the pond and it allows solar radiation to pass and at
the same time prevent heat to go out. The pond beneath the insulation layer is filled up with
fresh water. It´s possible to create a suitable design of the honeycomb to achieve a good insula-
tion and at the same time a good transmission of solar radiation, but for this system the initial
investment is high [4].
Because of the cost of the insulating panels, the honeycomb solar pond would be suitable for a
small scale applications.
Another proposed application of the honeycomb is to form the walls of a water tank exposed to
the solar radiation, or to insulated other non-fluid storage media [16].
Figure 3-6 - Cutaway of honeycomb cover [23].
3.1.1.1.4. Other solar pond
Here follows a list of other solar ponds which, in a other way from the ones above, seek to re-
duce the convection into the pond.
A way to suppress the convection in a fluid is to increase its viscosity.
The idea is to add thickeners those raise the water viscosity. Unfortunately these organic sub-
stances have got several problems such as [2]:
natural degradation of physical and chemical characteristics with time and the rising of
temperature above 55°C;
high costs;
Thus, viscosity stabilized solar pond aren´t applied.

27
27 Methods and examples of the thermal energy storage
Another way to create a solar pond is to separate a part of a natural salt lake with suitable ther-
mal insulated membranes: this system is called coffered solar pond (CSP). In this way no excava-
tion cost is present, but membranes must be bought. Horizontal pipes placed at different levels
create the gradient of salt; while other pipes on the bottom collect the hot brine. Thermal varia-
tion and waves of the surrounding lake can perturb the CSP: a double membrane with a buffer in
the middle could be required [2].
Figure 3-7 - Coffered solar pond [2].
Avoid the upward diffusion of salt in a SGSP could be difficult: a possible solution is to use par-
ticular salts which solubility is temperature-dependent [2]. Thus, when the temperature rises,
also the concentration of the salt rises and in this way all the layers of the pond are saturated.
Because of this, this system is called saturated [2] or equilibrium [4] solar pond. In this way all
the problems linked with the maintenance of the salt gradient are eliminated [4].The suitable
salt must respond to the prerequisites above mentioned, but at the moment not many studies
have been conducted in his field: this is due to the fact that not many salts have got the suitable
characteristics (for example the solubility of potassium aluminum sulphate dodecahydrate is
temperature dependent [2], but the toxicity of this salt avoids its use).
Another solar pond was introduced by Sokolov and Arbel in the 1990 [15] (see Figure 3-8). The
system use a bottom basin filled in of fresh water. The pond is insulated from the ground
around. There´s a foamed polystyrene layer (in figure n.8) that floats over the water: this per-
form a double duty. First of all it insulates the pond from the outside and secondly it supports a
network of pipes. These ducts spread water over the blackened surface of the polyester layer.
The water is pumped from the basin below, warms itself by the solar radiation and it falls down
in some holes that are made into the floating layer. To insulate the water that is over the polys-
tyrene sheet, an enclosed volume of air (in figure n.13) is trapped thanks to a transparent thin

28
Energy storage systems: an approach involving the concept of exergy
plastic sheet above the pond (in figure n.9). Air is pumped by a fan (in figure n.10).
Figure 3-8 - Freshwater floating collector solar pond [15].
The system is quite simple, but it needs network of pipes to spray hot water over the darkened
plastic sheet and it requires fans to keep blow up the transparent plastic sheet.
3.1.1.2. Convective solar ponds
Convective solar ponds are simple devices in which natural convection isn´t inhibited as the sys-
tems described above.
Many different models of this typology of solar pond has been proposed through the years, but
the basic characteristic is the small depth of the water (typically between 4 and 15 centimeters
[7]): because of this they´re called shallow solar pond (SSP).
Basically the system is constituted of a blackened insulating material which composed the bot-
tom and the walls of the pond. The top usually is a transparent insulating material (such as an
honeycomb structure) and inside there is a certain volume of water.
The system can work in two ways: `batch´ or `flow-through´ [2]. In the first way water is left to
warm itself into the device by solar radiation and when it reaches a suitable temperature it is
stored in a suitable storage; otherwise the water flow through the system and the discharge
temperature is keep fixed adjusting the flow rate.
These systems are widely used to collect solar energy, referring to some other systems the role
of storage the energy.
29
29 Methods and examples of the thermal energy storage
3.1.2. Water storage tanks
Water is the most widely used medium to stockpile thermal energy.
This is due to its high specific heat, its cheapness availability and its harmlessness [1].
Water storage are used in the thermal systems to store hot/cold water both for air conditioning
and for accumulation of hot domestic water.
The main advantages are:
produce hot/cold water during off-peak period of energy (so during the night)[18];
the tank work as a buffer, allowing to uncouple the side of the system that “produces”
from the one that “uses” the thermal energy;
water storage tanks are easily interfaceable with the other utilities of a air conditioning
system, because the fluid medium is the same [1];
Number or the size of chillers is less; because of they are not designed to meet the peak
thermal loadings [1].
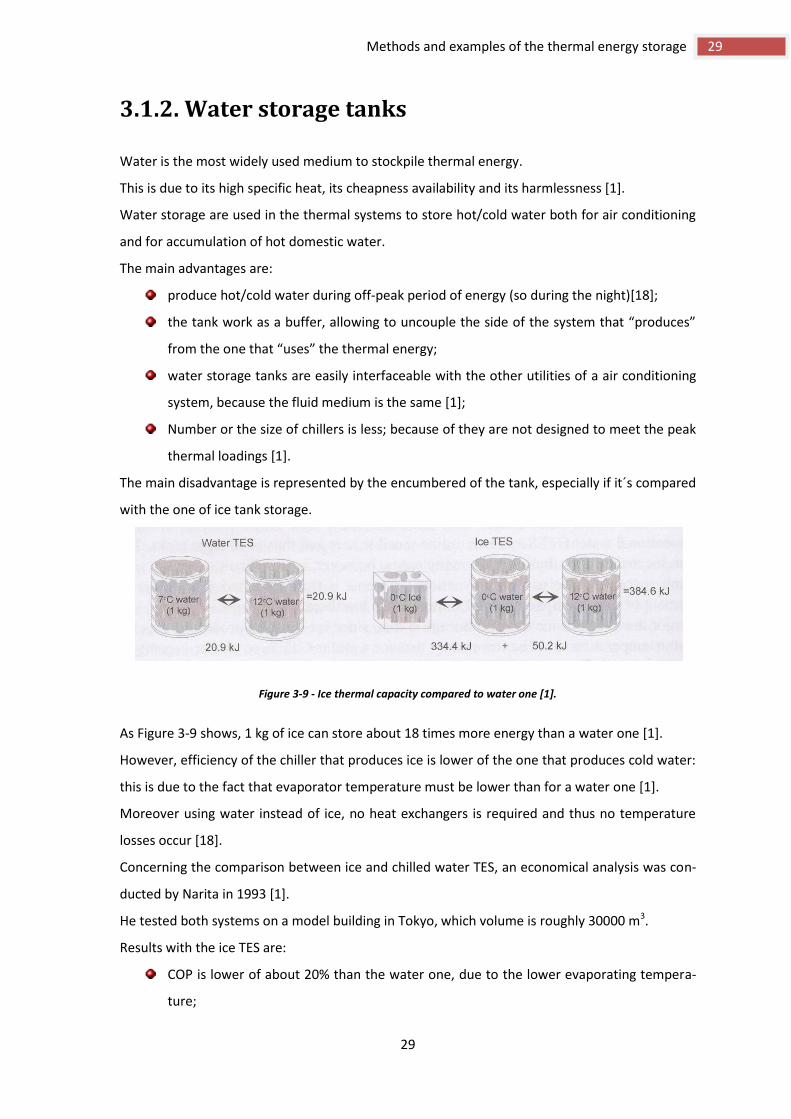
The main disadvantage is represented by the encumbered of the tank, especially if it´s compared
with the one of ice tank storage.
Figure 3-9 - Ice thermal capacity compared to water one [1].
As Figure 3-9 shows, 1 kg of ice can store about 18 times more energy than a water one [1].
However, efficiency of the chiller that produces ice is lower of the one that produces cold water:
this is due to the fact that evaporator temperature must be lower than for a water one [1].
Moreover using water instead of ice, no heat exchangers is required and thus no temperature
losses occur [18].
Concerning the comparison between ice and chilled water TES, an economical analysis was con-
ducted by Narita in 1993 [1].
He tested both systems on a model building in Tokyo, which volume is roughly 30000 m3.
Results with the ice TES are:
COP is lower of about 20% than the water one, due to the lower evaporating tempera-
ture;

30
Energy storage systems: an approach involving the concept of exergy
Initial costs are 20% higher, above all due to ice making equipment;
Operating costs are 20% higher;
Tanks can be above the ground or buried: the latter are more expensive.
These systems can stockpile thermal energy for few hours or for several months.
There´s a wide range of capacities of the tanks: between few liters, for example the ones used in
the boilers with storage, and millions of liters, used for example in district heating systems.
Recently is common to use water tanks with stratification: this means that inside the tank exists
a temperature gradient.
In this way is possible to [18]:
have cool and heat at the same time;
reduce from two to one the number of tanks required;
reduce costs of the system (insulation, ducts,…).
The insulation between warm and cold water is produced by a temperature gradient: this is
possible only if thermal conductivity of the liquid is low; otherwise a rapid equilibration of tem-
perature occurs [18].
Typical differences of temperature between the bottom and the top of a stratified tank are be-
tween 5°C and 10°C.
In Figure 3-10 a possible layout of a stratified tank application is showed.
Figure 3-10 - Chiller water storage layout [20].
In literature many examples of such systems are described: most of them report about using TES
to improve an existing conventional chiller system.
Moreover water storage can be used both to partial and to full load: in the first way, thermal
energy stockpiled in water tanks supports the facilities reducing the peak of demand, while in
the second way there is a full mismatch between the production of the thermal energy and its
utilization.

31
31 Methods and examples of the thermal energy storage
Summarizing, main characteristics of water TES are [1]:
it is a well-know medium,
it can be used both for cooling and heating,
it can be easily interfaceable with the other facilities of the system.
In Edirne, Turkey, an experimental study has been conducted about a solar collector system with
a seasonal storage tank [21].
The tank has a double shell and it is made of galvanized iron.
Figure 3-11 - Experimental system using a storage tank [22].
In Figure 3-11 the system is shown: the solar energy captured is stored in the tank buried into
the sand and Figure 3-12 shows the vertical section of the tank.
Three heat exchangers are present: one carries the heat coming from the solar collector; anoth-
er one is used for the space heating and the last one supplies hot domestic water.
The last one is inserted in the interspace between the two shells: in this way it is able to use also
the heat stored into the sand that surrounds the tank. Diameter of the tank is 0, 65 m and its
height is 0, 70 m.

32
Energy storage systems: an approach involving the concept of exergy
Figure 3-12 - A vertical section of the tank [22].
In Friedrichshafen a district heating for a neighborhood with 280 housing units was built [25].
Over the roofs of the houses, solar collectors are put and heat collected during the summer is
stored in a big buried tank. Volume of the water tank is 12.000 m3 and it is made of concrete.
The storage is insulated from the environmental ground and outside with a rock-wool layer,
which thickness is within 20 and 30 centimeters. In Figure 3-13 are presented the characteristics
of the loads. This kind of buried tank storage system is also called pit storage [26].
Figure 3-13 - Building data of neighborhood [25].

33
33 Methods and examples of the thermal energy storage
3.1.3. Underground thermal energy storage
This paragraph deals with the underground storage systems. Three of them are taken into ac-
count [19]:
aquifer thermal energy storage, ATES (see chapter 3.1.3.1.);
borehole thermal energy storage, BTES (see chapter 3.1.3.2.);
cavities/caverns thermal energy storage, CTES (see chapter 3.1.3.3.).
ATES and BTES are quite used all over the world, while CTES is rarely used [19].
3.1.3.1. Aquifer thermal energy storage, ATES
Aquifer is an underground layer constituted of permeable material, such as gravel, sand or clay,
in which underground water flows. Generally it is constituted for 25% by water and rest is un-
consolidated material.
Water from surface permeates into the ground, it starts to flow over an impermeable layer
through a permeable one and finally, it reaches an outside basin.
This underground water can be easily intercepted with a water well.
The idea is to use this “wet-layer” to stockpile the thermal energy; note that the storage is con-
stituted both of the underground water and the solid material because it traps heat too.
Basically are needed two wells: one is used to extract the water (production well) and the other
one to re-inject it into the aquifer (reinjection well).
Typical range of temperatures of storage with ATES is between 10 and 40°C.
Main applications of ATES are shown in Figure 3-14 [19].
Case A is the simplest applications of ATES. Water is pumped from the well and it is used
to preheat air during the winter time or to precool it during the summer. Thus heat is
stored into the aquifer during the summer and cold during the winter.
Case B represents the typical application of ATES that is when the storage is coupled
with a heat pump.
In case C, surface water with an approximate temperature of 15-10°C during the sum-
mer is pumped into the well. The heat stored is later used during the winter time.
System D is just the opposite of case C: cold is stored during the winter to be used in the
cooling period.
System B is the widely used, system C was a solution proposed at dawning of ATES technology;
case D is a new proposal, which could be interesting for a district cooling application [19].

34
Energy storage systems: an approach involving the concept of exergy
Figure 3-14 - Possible applications of ATES [52].
UTES system For illustration, see
Figure 3-14
Number of plants
Average storage capacity (MW)
Utilization sector (Number of plants)
Heat Cold Com/Ins building
District Heating
(DH)
Combined DC/DH
District Cooling
(DC)
Industry (Process cooling of telecommunication
stations included)
A. Direct heating
and cooling 1 0.3 0.3 1 - - - -
B.
Heat pump supported
heating and cooling
25 1.30 1.45 15 4 6
C. Heat pump supported
heating only 5 1.9 - 1 4 - - -
D. Cooling only 7 - 6.9 - - - 4 3
Total 38 - - 17 4 4 4 9
Figure 3-15 - Diffusion of ATES systems in Sweden [adapted from 52].
The storing capacity of an ATES mainly depends on [1]:
range of temperature allowed;
thermal conductivity;
flow rate of underground water.
In Sweden there are a lot of application of this system, a summary table is given in Figure 3-15.

35
35 Methods and examples of the thermal energy storage
The pay-back (PB) of this technology is low, between 0 and 2 years for system A and D; while in
the case C the PB is longer, between 4 and 8 years.
Main problems encountered are [19]:
wells clogging;
leakages;
sand production from the wells (this may cause problems of subsidence);
The most common problem is the wells clogging. This is due usually to iron precipitation and
causes a restriction of the section of the wells. As a result the flow rate of the well decreases and
so the capacity of the system is lower.
An example of application of this technology can be found in the district cooling of Brunkebergs
Torg, in the inner city of Stockholm [19]. Cold source is the water coming from the Värtan lake.
The temperature of the water is between 4 and 6°C; capacity of the cooling system is 60 MW.
Moreover, an ATES system was installed to increase in capacity the system: during the night cold
water from the lake is pumped into the aquifer and it is restored during the period of peak of
demand. Thus a diurnal storage is established.
ATES system is constituted of 6 cold and 6 warm wells, which were drilled in two different
streets.
Temperature of the cold well is about 4°C, while the warm one is 14°C.
With a flow rate of 600 l/s, cooling capacity is 25MW. However, collecting the water from the
well a lot of sand appears and subsidence problems occurred.
So flow rate was reduced till 360 l/s reducing the cooling capacity at about 15 MW.
Operational results show that efficiency of this ATES system was about 60% during the first year
of work (1999) and it increases the years after.
Initial cost for the ATES system was 3 million of Euro and the maintenance costs are estimated in
50,000 Euro/year.
Considering an annual production of 2500 MWh, the cost of thermal energy produced with this
system is about 25 Euro/MWh, counting also cost of electricity for the pumps.
Another application in Sweden is in the district cooling in a neighborhood in Malmö, where 5
cold and 5 warm wells were drilled at a depth of 70-80 m.
A seasonal storage is established: cold is stored in the ATES from winter to summer.
Thermal source for the ATES are two: one is the cold coming from the Öresund Sea, while the
other one is represented by the waste cold produced by the heat pump.
ATES represents the basis for cooling; during the peak of demand the system is supported with
heat pump or chillers.

36
Energy storage systems: an approach involving the concept of exergy
Temperature of the cold well is about 4,5°C and the warm one works between 13-15°C.
With a flow rate of 32,5 l/s, the capacity of the aquifer is estimated in 1,3 MW.
Initial cost was about 350000 Euro and maintenance costs are roughly 15000 Euro/year, so con-
sidering a cold production of 3900 MWh/year, results that cost to produce cold with this system
is about 4 Euro/MWh.
Another example of ATES technology can be found in the Oslo Gardemoen airport [51].
A large aquifer is used both for heating and cooling the airport building; the cooling demand of
the airport is estimated in 5000 MWh/y and the building area is 180000 m2.
There are 18 wells: nine of these constitute the cold heat source and the rest are the warm one.
The wells are coupled with a heat pump: its heat production was about 11,1 GWh and its COP is
3,5. Concerning the cooling load, roughly the 25% of it is supplied only exchanging thermal ener-
gy with the water of the aquifer, while the 75% has to be accomplish using the heat pump sys-
tem coupled with the aquifer.
The system is working since 1998; due to clogging problems, the cooling capacity of the system
had to be reduced and in 2003 it became half: thus it has been necessary to establish a cleaning
process. Nevertheless the ATES-heat pump system can cover all the cooling load for the airport,
saving roughly 10,5 GWh/year of primary energy.
The payback time of the ATES system was 4 years.
Figure 3-16 - The working principle of the heating/cooling system in Oslo airport [51].
37
37 Methods and examples of the thermal energy storage
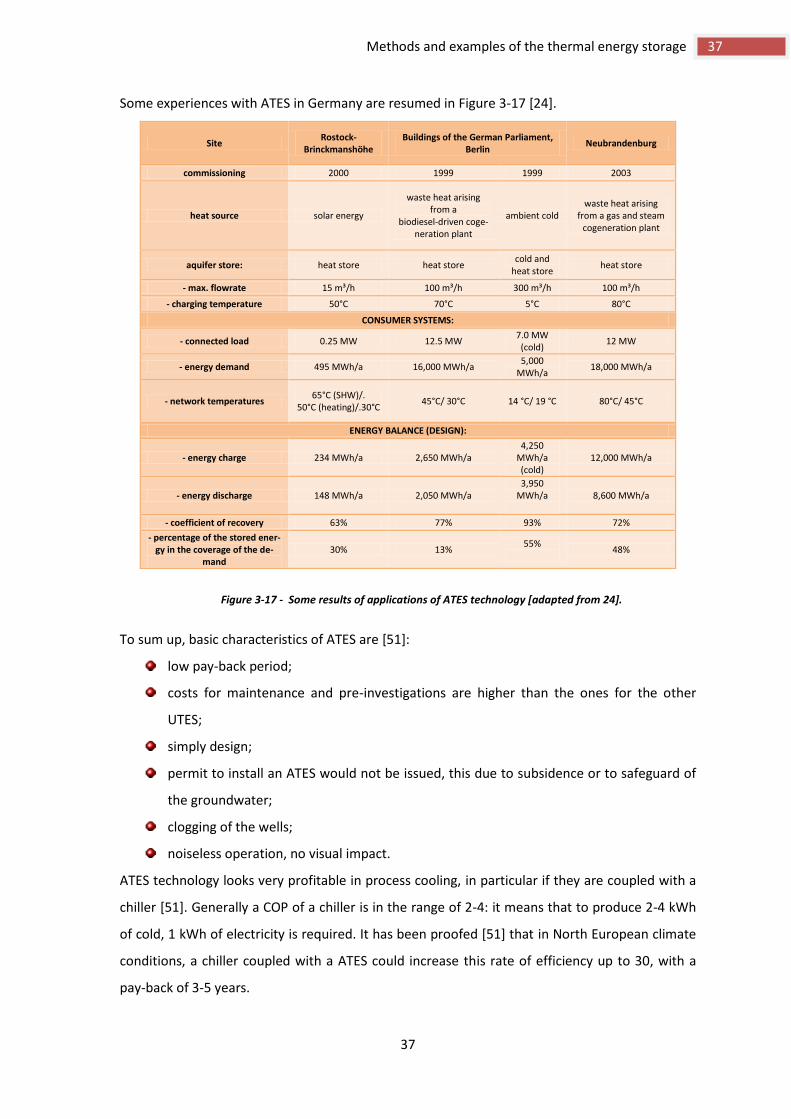
Some experiences with ATES in Germany are resumed in Figure 3-17 [24].
Site Rostock-
Brinckmanshöhe Buildings of the German Parliament,
Berlin Neubrandenburg
commissioning 2000 1999 1999 2003
heat source solar energy
waste heat arising from a
biodiesel-driven coge-neration plant
ambient cold waste heat arising
from a gas and steam cogeneration plant
aquifer store: heat store heat store cold and
heat store heat store
- max. flowrate 15 m³/h 100 m³/h 300 m³/h 100 m³/h
- charging temperature 50°C 70°C 5°C 80°C
CONSUMER SYSTEMS:
- connected load 0.25 MW 12.5 MW 7.0 MW
(cold) 12 MW
- energy demand 495 MWh/a 16,000 MWh/a 5,000
MWh/a 18,000 MWh/a
- network temperatures 65°C (SHW)/.
50°C (heating)/.30°C 45°C/ 30°C 14 °C/ 19 °C 80°C/ 45°C
ENERGY BALANCE (DESIGN):
- energy charge 234 MWh/a 2,650 MWh/a 4,250
MWh/a (cold)
12,000 MWh/a
- energy discharge 148 MWh/a 2,050 MWh/a 3,950
MWh/a
8,600 MWh/a
- coefficient of recovery 63% 77% 93% 72%
- percentage of the stored ener-gy in the coverage of the de-
mand 30% 13%
55%
48%
To sum up, basic characteristics of ATES are [51]:
low pay-back period;
costs for maintenance and pre-investigations are higher than the ones for the other
UTES;
simply design;
permit to install an ATES would not be issued, this due to subsidence or to safeguard of
the groundwater;
clogging of the wells;
noiseless operation, no visual impact.
ATES technology looks very profitable in process cooling, in particular if they are coupled with a
chiller [51]. Generally a COP of a chiller is in the range of 2-4: it means that to produce 2-4 kWh
of cold, 1 kWh of electricity is required. It has been proofed [51] that in North European climate
conditions, a chiller coupled with a ATES could increase this rate of efficiency up to 30, with a
pay-back of 3-5 years.
Figure 3-17 - Some results of applications of ATES technology [adapted from 24].

38
Energy storage systems: an approach involving the concept of exergy
Moreover ATES technology looks very profitable in cooling system placed in countries where the
problem of humidity is almost irrelevant [51].
When is required to dehumidify a certain flux of air, it is necessary to provide a medium which
temperature has to be lower than dew point of the air. Thus if there is no problem of humidity, a
“higher” cooling temperature is sufficient to cool air.
This speaks in favor of these storage systems because temperature of the liquid in the well is
higher at the end of the cooling season, this is due to the thermal drift of the aquifer.
3.1.3.2. Borehole thermal energy storage, BTES
Boreholes are wells drilled into the ground. Inside these holes, pipes U-shaped are put.
Inside the ducts, a certain fluid (usually water with antifreeze) flows.
The medium, that is which store the thermal energy, is constituted by the ground itself.
Boreholes heat exchangers BHE are widely used coupled with heat pumps; in this way ground is
used as a heat sink during the winter and a cold one during the summer. This is done because
temperature of the ground is higher than the outside ambient one during the winter and is low-
er during the summer. In this case temperature of the ground is considered constant, that is to
say that thermal capacity of the ground is unlimited. Ground temperature drift is considered a
problem because it causes a decrease in the COP of the heat pump.
On the contrary, with BTES, heat is stockpiled during the summer while cool is stored for the
winter time. Hence ground temperature changes throughout the year.
Thus the two systems are similar such as technology, but there is a difference between “ex-
change” and “store” thermal energy with / into the ground.
Thus, to distinguish between BHE and BTES, if the amount of thermal energy exchanged in a cer-
tain period is bigger than the thermal capacity of the portion of the ground involved, the system
work as a storage system; otherwise the temperature of the ground could be considered roughly
constant and so the borehole is a BHE.
An application of BTES is in Oshawa, Ontario, at the Institute of Technology [19]. This application
is used to store thermal energy on a seasonal basis.
The ground between 55 and 200 m below surface is constituted by a non-permeable layer. This
is an advantage because no underground water is present, which otherwise would drag with it-
self the thermal energy stored in the ground.372 boreholes, 200 m deep were drilled. They are
disposed in a square grid which side is 4,5 m, thus the occupied surface area is 7000 m2.

39
39 Methods and examples of the thermal energy storage
Figure 3-18 - Schematic diagram of UOIT district cooling and heating [19].
During the summer, the water that comes from the condenser of the chillers is pumped into the
well in order to cooling itself. The heat stored it will be used during the winter time to provide
heat for the buildings. Moreover heat is removed from buildings during the summer, and it is
stored into the ground.
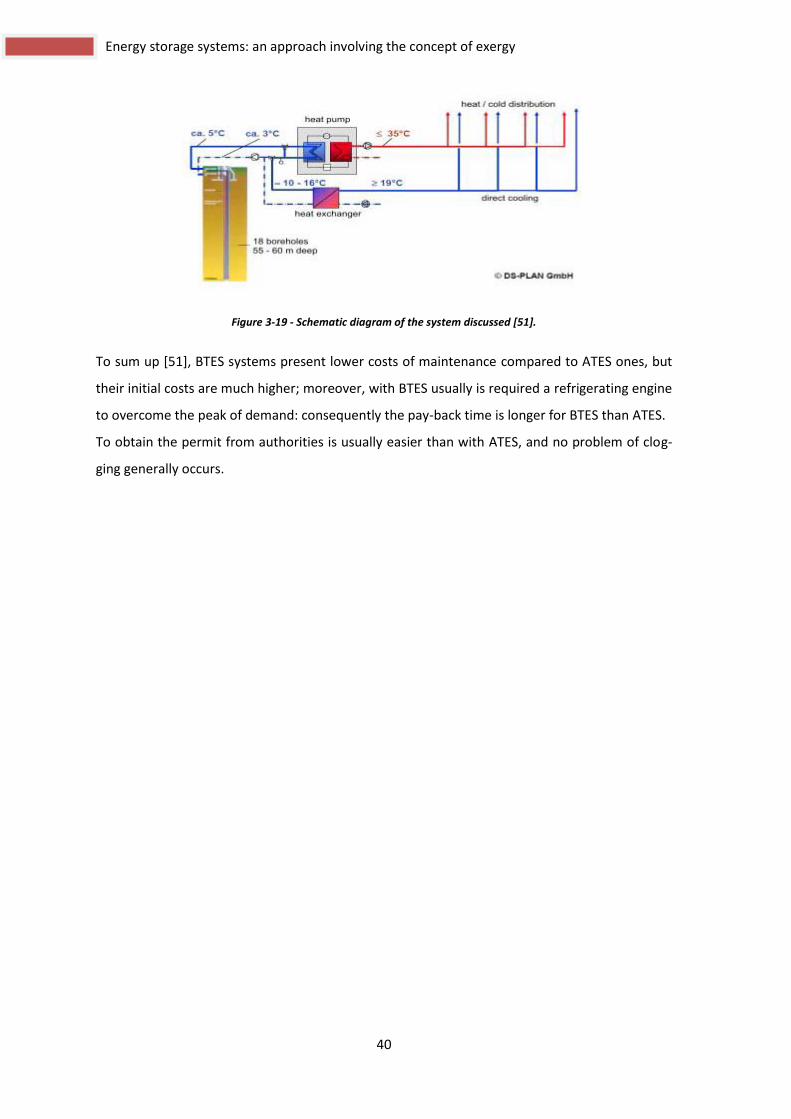
Another example of BTES is in Stuttgart (Germany) [51]. The facilities were installed in 2002:
they are constituted of 18 boreholes coupled with a heat pump (Figure 3-19). Each borehole is
55 m deep; the cooling load is roughly 42,5 MWh/y. The floor area of the building is 2500 m2.
The system is used both for cooling and heating an office building; ground represents the heat
source for the heat pump. The thermal energy is extracted and stockpiled in the ground through
a medium constituted of a mixture of water and antifreeze.
During the summer, cold water coming from the boreholes exchanges heat with the medium of
the cooling network of the building.
During the winter, the ground represents the lower temperature heat source for the heat pump.
It has been calculated that electricity saved using this system is around 120 MWh/y, that is to
say 205 MWh/y of primary energy.
40
Energy storage systems: an approach involving the concept of exergy
Figure 3-19 - Schematic diagram of the system discussed [51].
To sum up [51], BTES systems present lower costs of maintenance compared to ATES ones, but
their initial costs are much higher; moreover, with BTES usually is required a refrigerating engine
to overcome the peak of demand: consequently the pay-back time is longer for BTES than ATES.
To obtain the permit from authorities is usually easier than with ATES, and no problem of clog-
ging generally occurs.

41
41 Methods and examples of the thermal energy storage
3.1.3.3. Cavities/caverns thermal energy storage, CTES
CTES techniques are rarely used.
The idea is to use the water enclosed in underground cavern both for cold and heat storage.
An example is the “Minewater project” in Harleen, the Netherlands [27]; here, abandoned mines
naturally were filled with ground water and, due to the geothermal energy, water temperature
is at a roughly constant temperature.
Figure 3-20 - Schematic diagram of the network [27].
The system consists of more wells (Figure 3-20). There are 2 wells that reach the depth of 800 m
and are called “warm wells”; their temperature is approx 35°C.
Other 2 wells are deep 400 m and are called the cold ones. The temperature of these two wells
is roughly 17°C.
A duct connects the water pumped from the wells to a heat exchanger placed in an energy sta-
tion; here the thermal energy is transferred to the network connecting the buildings.
The water returning from the buildings exchange thermal energy with water coming from an in-
termediate well deep 250 m. The return temperature is roughly 22°C.
The loads require temperatures at different levels, and this aim is reached with heat pumps that
rise or decrease the temperature of the heat extracted from the minewater.
Moreover gas boilers have been installed to supply the peak of demand.
The heat removed from the buildings in the summer and the waste heat coming from industrial
processes are stored in the minewater.
42
Energy storage systems: an approach involving the concept of exergy
3.1.4. High temperature heat storage
Water is widely used as storage medium; however the maximum temperature of the storage is
100°C at a pressure of 1 bar. To overcome this limit is possible to storage the water at a higher
pressure, but costs of system increase: sometimes it is economically possible and sometimes no.
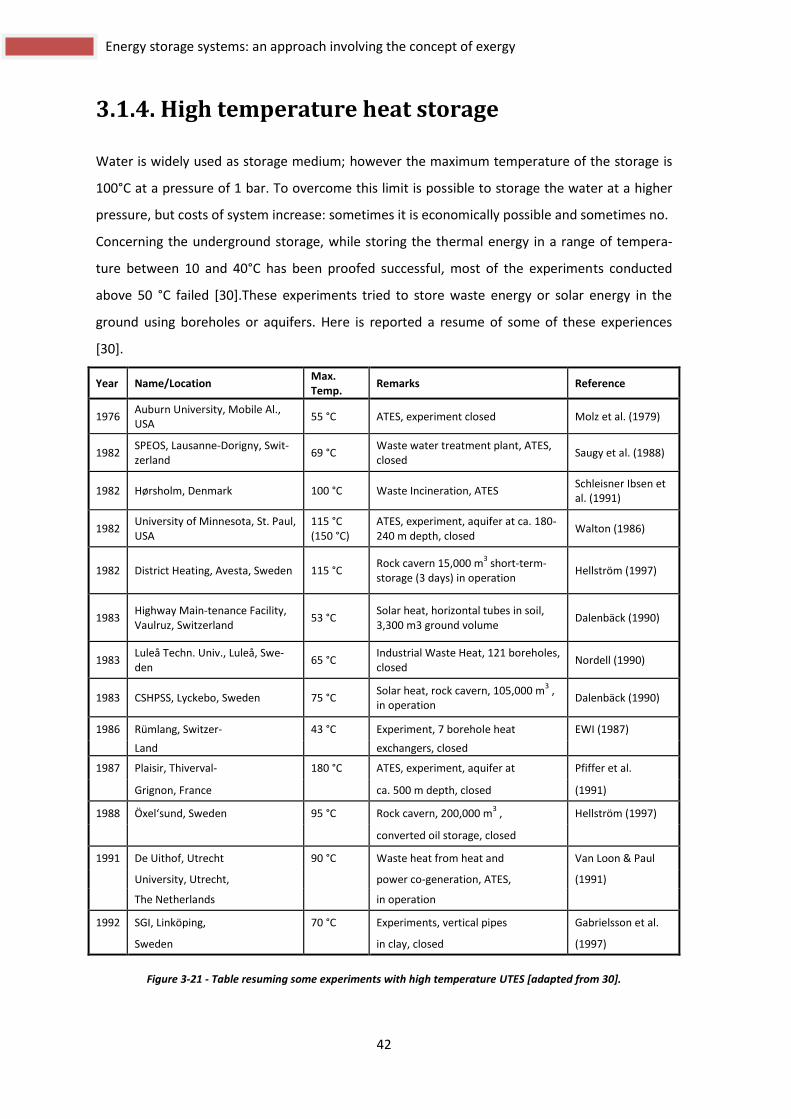
Concerning the underground storage, while storing the thermal energy in a range of tempera-
ture between 10 and 40°C has been proofed successful, most of the experiments conducted
above 50 °C failed [30].These experiments tried to store waste energy or solar energy in the
ground using boreholes or aquifers. Here is reported a resume of some of these experiences
[30].
Year Name/Location Max. Temp.
Remarks Reference
1976 Auburn University, Mobile Al., USA
55 °C ATES, experiment closed Molz et al. (1979)
1982 SPEOS, Lausanne-Dorigny, Swit-zerland
69 °C Waste water treatment plant, ATES, closed
Saugy et al. (1988)
1982 Hørsholm, Denmark 100 °C Waste Incineration, ATES Schleisner Ibsen et al. (1991)
1982 University of Minnesota, St. Paul, USA
115 °C (150 °C)
ATES, experiment, aquifer at ca. 180-240 m depth, closed
Walton (1986)
1982 District Heating, Avesta, Sweden 115 °C Rock cavern 15,000 m
3 short-term-
storage (3 days) in operation Hellström (1997)
1983 Highway Main-tenance Facility, Vaulruz, Switzerland
53 °C Solar heat, horizontal tubes in soil, 3,300 m3 ground volume
Dalenbäck (1990)
1983 Luleå Techn. Univ., Luleå, Swe-den
65 °C Industrial Waste Heat, 121 boreholes, closed
Nordell (1990)
1983 CSHPSS, Lyckebo, Sweden 75 °C Solar heat, rock cavern, 105,000 m
3 ,
in operation Dalenbäck (1990)
1986 Rümlang, Switzer- 43 °C Experiment, 7 borehole heat EWI (1987)
Land exchangers, closed
1987 Plaisir, Thiverval- 180 °C ATES, experiment, aquifer at Pfiffer et al.
Grignon, France ca. 500 m depth, closed (1991)
1988 Öxel‘sund, Sweden 95 °C Rock cavern, 200,000 m3 , Hellström (1997)
converted oil storage, closed
1991 De Uithof, Utrecht 90 °C Waste heat from heat and Van Loon & Paul
University, Utrecht, power co-generation, ATES, (1991)
The Netherlands in operation
1992 SGI, Linköping, 70 °C Experiments, vertical pipes Gabrielsson et al.
Sweden in clay, closed (1997)
Figure 3-21 - Table resuming some experiments with high temperature UTES [adapted from 30].
43
43 Methods and examples of the thermal energy storage
Most of the experiments were only a research project and they haven´t been carried on after
their conclusion; others presented environmental and technological problems that caused their
end (most of all the ones which storage temperature was above 100°C) [30].
Nevertheless some recent applications (see Figure 3-17) have been built.
According to Sanner and Knoblich [30], storing high temperature in UTES is economical if heat
comes from a cogeneration plant or is a reject of an industrial production.
More practiced ways to store heat at a high temperature are the ones that use oil, molten salts
and liquid metals; typical applications of storage with these fluids are:
indirect heating installation;
solar power electric plant (solar thermodynamic);
storage of waste heat from industrial processes.
Although these media have not the pressure problem that water has above 100˚C, their use is
limited because of high costs, handling and difficulties in stockpiling
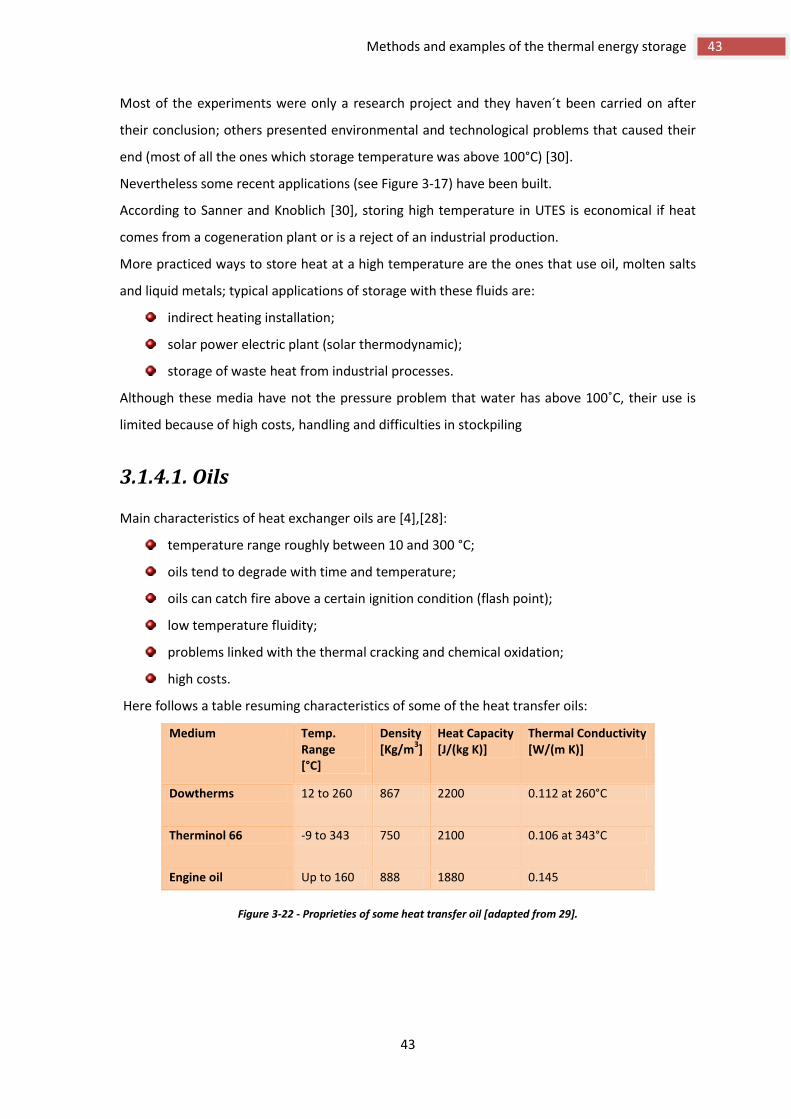
3.1.4.1. Oils
Main characteristics of heat exchanger oils are [4],[28]:
temperature range roughly between 10 and 300 °C;
oils tend to degrade with time and temperature;
oils can catch fire above a certain ignition condition (flash point);
low temperature fluidity;
problems linked with the thermal cracking and chemical oxidation;
high costs.
Here follows a table resuming characteristics of some of the heat transfer oils:
Medium Temp. Range [°C]
Density [Kg/m
3]
Heat Capacity [J/(kg K)]
Thermal Conductivity [W/(m K)]
Dowtherms 12 to 260 867 2200 0.112 at 260°C
Therminol 66 -9 to 343 750 2100 0.106 at 343°C
Engine oil Up to 160 888 1880 0.145
Figure 3-22 - Proprieties of some heat transfer oil [adapted from 29].
44
Energy storage systems: an approach involving the concept of exergy
3.1.4.2. Molten salts
Commercial molten salt are available. They represent a possible solution to overcome the prob-
lems of mineral oils.
They can be used as heat transport fluid in some high-temperature industrial processes, such as
rubber curing or reactant heating.
Basic characteristics are [31], [32]:
no-flammable;
temperature of utilization between 150 and 540°C (Hitec [32]);
no toxic;
in case of accidental leakage, the salt freeze, avoiding its penetration into the ground.
good heat transport proprieties (high coefficient of heat transfer, high heat capacity, low
operating pressure);
low cost if compared to oils.
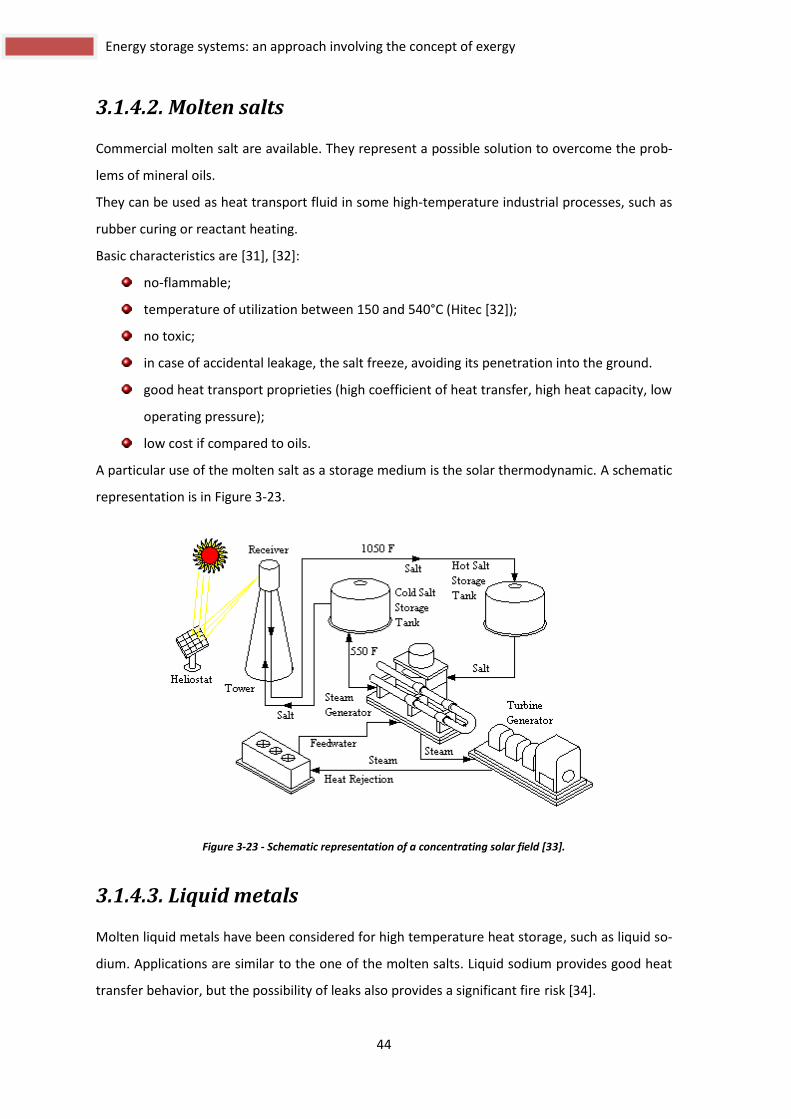
A particular use of the molten salt as a storage medium is the solar thermodynamic. A schematic
representation is in Figure 3-23.
Figure 3-23 - Schematic representation of a concentrating solar field [33].
3.1.4.3. Liquid metals
Molten liquid metals have been considered for high temperature heat storage, such as liquid so-
dium. Applications are similar to the one of the molten salts. Liquid sodium provides good heat
transfer behavior, but the possibility of leaks also provides a significant fire risk [34].

45
45 Methods and examples of the thermal energy storage
3.1.5. Solid storage systems
Another way to store thermal energy is cooling or heating rock or pebbles packed in tank.
This kind of storage is used also for temperatures storage above 100°C, and a possible applica-
tion is to couple a solar air collector and tank storage filled with rocks (Figure 3-24).
The volume of rock required per square meter of solar collector is roughly 1, 6 m3. Thus if the
average collector area for a typical house is approximatively 30, 4 m2, the volume of the rock
storage would be 4, 6 m2.
Figure 3-24 - A solar rock bed system [1].
However, volumetric thermal capacity of rock is roughly 2 times lower than the water one [1]
(1818 kJ/(m3K) for rock and 4044 kJ/(m3K) for water at 100°C [4]). However, cost of the storage
media per kJ stored is competitive, comparable to the one of the water.
According to O.E. Ataer, main advantages of rocks as storage media are [29]:
no toxicity and non-inflammability;
low costs;
no heat exchangers devices are required, because of rock constitutes both the storage me-
dium and the exchange surface;
losses from the pile of pebbles are low because the contact area among the rocks is little;
exchange area between rocks and heat transfer medium (air or water) is high.

46
Energy storage systems: an approach involving the concept of exergy
Other media that can be used to store heat are the refractory materials such as magnesium
oxide, aluminum oxide and silicon oxide [4].
Bricks of refractory materials have been used in some countries. These bricks are constituted of
electric heater placed inside the refractory: during the night electricity is used to warm the
bricks; this thermal energy is released during the day flowing air around the storage medium.
In Figure 3-25 some proprieties of solid storage media are shown.
Medium Density
[kg/m3
]
Specific Heat
[J/kg·K]
Heat Capacity
ρcx10-6
[J/(m3
·K)]
Thermal Conductivity [W/(m·K)]
Thermal Diffusivity
α = k/ρc 106
[m2
/s]
Aluminum 2707 896 2.4255 204 at 20°C 84.100
Aluminum oxide 3900 840 3.2760 - -
Aluminum sulfate 2710 750 2.0325 - -
Brick 1698 840 1.4263 0.69 at 29°C 0.484
Brick magnesia 3000 1130 3.3900 5.07 1.496
Concrete 2240 1130 2.5310 0.9 – 1.3 0.356-0514
Cast iron 7900 837 6.6123 29.3 4.431
Pure iron 7897 452 3.5694 73.0 at 20°C 20.450
Calcium chloride 2510 670 1.6817 - -
Copper 8954 383 3.4294 385 at 20°C 112.300
Earth (wet) 1700 2093 3.5581 2.51 0.705
Earth (dry) 1260 795 1.0017 0.25 0.250
Potassium chloride 1980 670 1.3266 - -
Potassium sulfate 2660 920 2.4472 - -
Sodium carbonate 2510 1090 2.7359 - -
Stone, granite 2640 820 2.1648 1.73 to 3.98 0.799-1.840
Stone, limestone 2500 900 2.2500 1.26 to1.33 0.560-0.591
Stone, marble 2600 800 2.0800 2.07 to 2.94 0.995-1.413
Stone, sandstone 2200 710 1.5620 1.83 1.172
Figure 3-25 - Some proprieties of solid storage media [29].

47
47 Methods and examples of the thermal energy storage
3.2. Latent energy storage
Latent heat storage means that a certain amount of thermal energy is supplied to a material that
undergoes a phase change, usually between liquid and solid [4]. Thus the process is isothermal
and the temperature is the one of freezing/melting of the material at the fixed pressure.
In formula,
where islatent heat of fusion, while is the mass of the material.
Usually isothermal processes are difficult to obtain, thus the process evolves in a range of tem-
peratures and , around the one of the melting point [4]. In formula,
Where is the specific heat of the solid phase, is the one of the liquid phase and
represents the melting point temperature [4].
Heat is stored melting the material and is released when it freezes.
Several materials that undergo a phage change are used in the thermal energy storage; such are
called phase change materials (PCMs).
A “perfect” PCM must have *4+, *19+:
melting point within the range of the application temperatures;
elevated value of the latent fusion heat;
small volume change during the phase change;
little subcooling or superheating to make sure that melting and freezing occur at the
same temperature;
high thermal conductivity, in both the two phases;
low vapor pressure at the temperature in use;
chemical stability, compatibility with other materials;
non toxicity and non corrosive;
recyclability;
low prices.

48
Energy storage systems: an approach involving the concept of exergy
It does not exist a material that fulfill all the requirements; so many materials have been devel-
oped and for each a particular strategy and approach has been studied [19].
Three groups of PCMs can be distinguished:
Inorganic materials (such as water/ice);
Organic materials (such as paraffin and other polymers);
Hydrated salts.
The organic and inorganic materials have a commercial use and they´re widely used, while their
mixtures are still in an experimental status.
Figure 3-26 - Melting temperature vs. melting enthalpy of most commons PCM [35].
The phase change between vapor and liquid possess a high enthalpy; however it appears not
technological suitable. This process depend on the boundary conditions: that means that if the
volume is constant, temperature and pressure change within a wide range that makes the sys-
tem not technically available. Otherwise, if the system is kept under a constant pressure and in a
closed system, change of volume during the evaporation process makes it technically not appli-
cable. To overcome this problem, an open system must be used; in this way the produced vapor
is released to the environment. When the heat is requested, vapor from the environment is re-
covered. Thus the only technical material available is the water [19].
Main advantages with the latent storages systems compared with the sensible ones are:
high storage density (as mentioned in chapter 3.1.2.);
constant temperature of the process.
Applications of the PCMs are [35]:
residential and commercial heating and cooling;

49
49 Methods and examples of the thermal energy storage
district heating and cooling;
green houses temperature control;
temperature control of telecom and other electronic equipment;
conservation and transport of temperature sensitive goods;
other applications such as cold bags, warm keeping and medical wraps.
In the following chapters some of these PCMs applied for building heating and cooling are dis-
cussed.
3.2.1. Ice storage
Here the most common applications of ice storage are presented; in Figure Figure 3-27 a dia-
gram shows a possible classification.
Figure 3-27 - A classification of the ice storage technologies [1].
3.2.1.1. Natural ice storage
The use of collect snow and ice during the winter to use them during the summer is an old tech-
nique in the cold climates. Winter snow was collected in the so called ice-house to use it later,
during the summer to keep the perishable goods.
It can be used also nowadays but it has an economical sense only if enough snow/ice can be
stored during the winter in a certain area; it also depends on the weather conditions. Otherwise
snow can be produced with snow guns but obviously the costs increase.
Snow/ice can be collected in [19]:
Ice Storage
Natural
Artificial
Ice-slurry type
Ice on coil
Ice harvesting
Encapsulated type
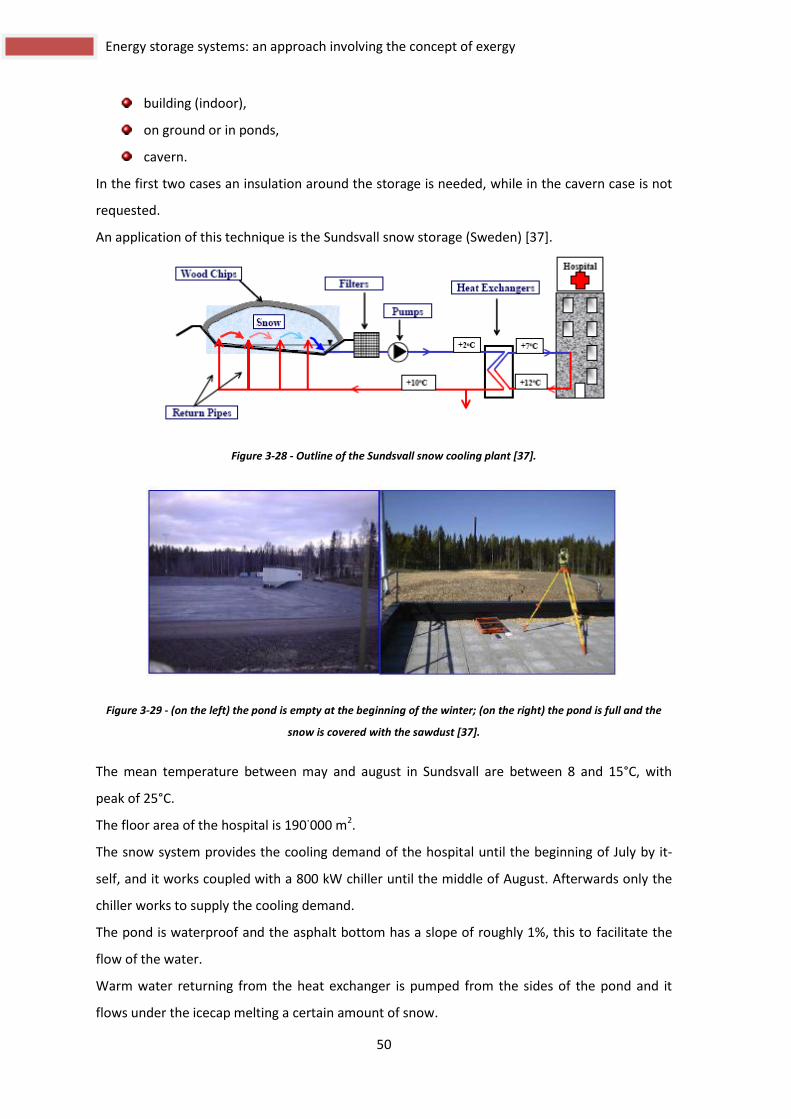
50
Energy storage systems: an approach involving the concept of exergy
building (indoor),
on ground or in ponds,
cavern.
In the first two cases an insulation around the storage is needed, while in the cavern case is not
requested.
An application of this technique is the Sundsvall snow storage (Sweden) [37].
Figure 3-28 - Outline of the Sundsvall snow cooling plant [37].
Figure 3-29 - (on the left) the pond is empty at the beginning of the winter; (on the right) the pond is full and the
snow is covered with the sawdust [37].
The mean temperature between may and august in Sundsvall are between 8 and 15°C, with
peak of 25°C.
The floor area of the hospital is 190˙000 m2.
The snow system provides the cooling demand of the hospital until the beginning of July by it-
self, and it works coupled with a 800 kW chiller until the middle of August. Afterwards only the
chiller works to supply the cooling demand.
The pond is waterproof and the asphalt bottom has a slope of roughly 1%, this to facilitate the
flow of the water.
Warm water returning from the heat exchanger is pumped from the sides of the pond and it
flows under the icecap melting a certain amount of snow.

51
51 Methods and examples of the thermal energy storage
The melt water chills, and is pumped from the lower corner of the bottom of the pond. It is fil-
tered and it is sent to the heat exchanger.
The snow is collected during the winter from the streets and a part is also artificially produced
with snow guns (in a percentage varying from 38-59% depending on the amount the falling snow
during the winter).
The pond is designed to collect 60˙000 m3 of snow, which average density has been estimated in
650 kg/m3. Over the snow wood chips are placed to insulate the storage.
In Figure 3-30 are shown the results obtained by measurements conducted in Sundsvall by Nor-
dell and Skogsberg [37].
Figure 3-30 - Results obtained by measurements conducted in Sundsvall by Nordell and Skogsberg [37].
The cost for kWh of cool produced with this system was evaluated in 1,62 SEK/kWh for the years
2002 and 2003; it has decreased from then on because the pond starts to receives a fee for each
lorry-load of snow carried coming from urban spaces.

52
Energy storage systems: an approach involving the concept of exergy
3.2.1.2. Artificial ice storage
In this chapter artificial ice TES systems are discussed. This system can be used in the same ap-
plications of the water storage tanks, with the advantages and disadvantages already discussed
in chapter 3.1.2.
It is possible to distinguish three main technologies of ice TES [19]:
ice on coil (see 3.2.1.2.1.);
ice harvesting (see 3.2.1.2.2.)
encapsulated type (see 3.2.1.2.3.);
ice-slurry type (see 3.2.1.2.4.);
Another classification is proposed in [1]. Artificial ice storage could be divided in:
static system (water is freeze and ice melted in the same storage tank);
dynamic system (ice is produced and after stored inside a storage tank).
Slurry type and ice harvesting is a dynamic system, while ice on coil and encapsulated type are
static.
3.2.1.2.1. Ice on coil
In this system, refrigerant fluid flows inside coil while ice is formed on the exchange area.
There are two kinds of ice on coil system: in the first (called external melt ice on coil, on the left
in Figure 3-31) during the discharge water or air flows outside the coil and it melts the ice; in the
other case (called internal melt ice on coil, on the right in Figure 3-31) warm glycol flows inside
the coil melting the ice outside [36].
External melt ice on coil Internal melt ice on coil
Figure 3-31 - Possible configuration of ice on coil system [36].
In the internal melt mode, water is enclosed in the volume of the tank and it is not hydronically
connected to the building cooling network [20]. Tank and pipes are made of both plastic and
stainless or galvanized steel. The heat exchanger (HX) occupies roughly the 80% of the internal
volume of the tank, while the rest is filled with water [20] (see Figure 3-32).
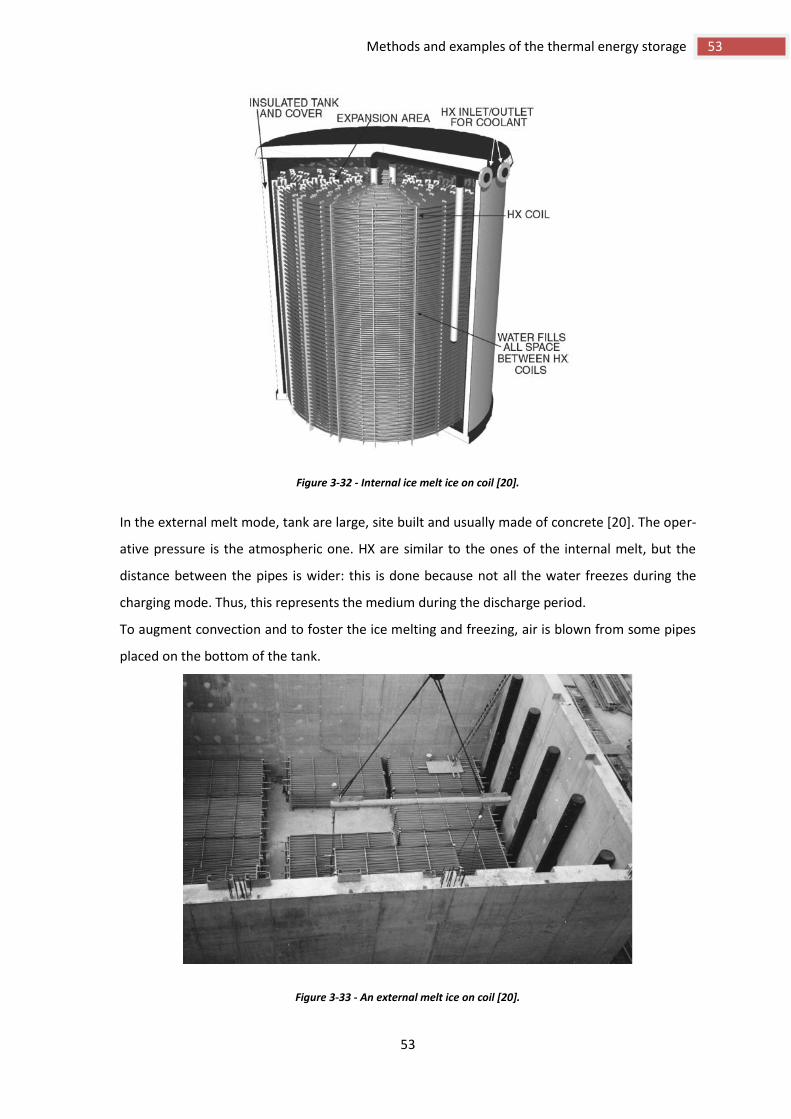
53
53 Methods and examples of the thermal energy storage
Figure 3-32 - Internal ice melt ice on coil [20].
In the external melt mode, tank are large, site built and usually made of concrete [20]. The oper-
ative pressure is the atmospheric one. HX are similar to the ones of the internal melt, but the
distance between the pipes is wider: this is done because not all the water freezes during the
charging mode. Thus, this represents the medium during the discharge period.
To augment convection and to foster the ice melting and freezing, air is blown from some pipes
placed on the bottom of the tank.
Figure 3-33 - An external melt ice on coil [20].

54
Energy storage systems: an approach involving the concept of exergy
3.2.1.2.2. Ice harvesting
Figure 3-34 - The ice harvester system [41].
Figure 3-35 - The ice making mode (on the left) and the harvesting mode (on the right) [42].
In this system, ice is built on evaporator plates which are positioned above a water/ice storage
tank [41].
An evaporating refrigerant flows inside the plate, while water pumped from the bottom of the
tank flows outside around the plate. Water freezes and the thickness of the ice increases until 6-
10 mm; after that hot gas is sent inside the plates instead of the liquid refrigerant to take down
the ice from the plates [40]. The discharge involves only a plate per time, and the hot gas is the
refrigerant coming from the other plates that are building ice.
Usually ice making takes 20-30 minutes, while the detaching period is about 20-90 seconds [40].
The main advantages of the ice harvesting are its simplicity both of design and of installation [1].
Disadvantages can be found in:
high costs (stainless steel of plates and chassis);
the fact that the tank is open to the atmosphere, so water has to be treated.
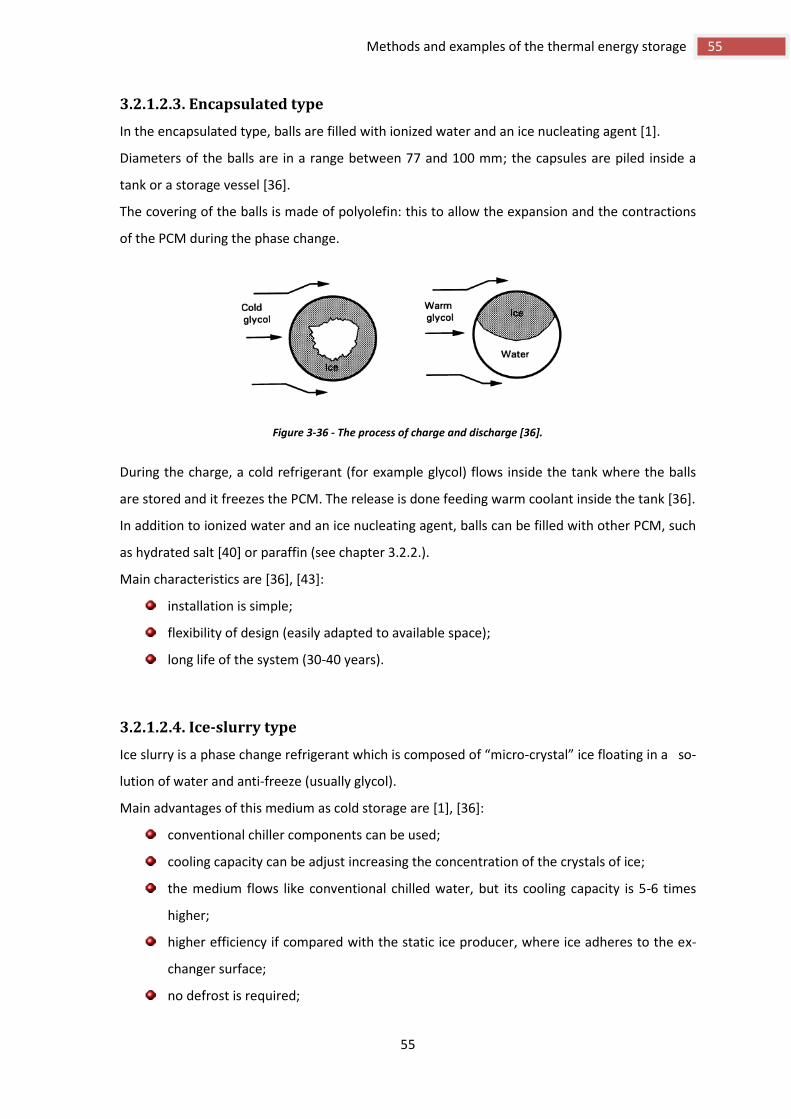
55
55 Methods and examples of the thermal energy storage
3.2.1.2.3. Encapsulated type
In the encapsulated type, balls are filled with ionized water and an ice nucleating agent [1].
Diameters of the balls are in a range between 77 and 100 mm; the capsules are piled inside a
tank or a storage vessel [36].
The covering of the balls is made of polyolefin: this to allow the expansion and the contractions
of the PCM during the phase change.
Figure 3-36 - The process of charge and discharge [36].
During the charge, a cold refrigerant (for example glycol) flows inside the tank where the balls
are stored and it freezes the PCM. The release is done feeding warm coolant inside the tank [36].
In addition to ionized water and an ice nucleating agent, balls can be filled with other PCM, such
as hydrated salt [40] or paraffin (see chapter 3.2.2.).
Main characteristics are [36], [43]:
installation is simple;
flexibility of design (easily adapted to available space);
long life of the system (30-40 years).
3.2.1.2.4. Ice-slurry type
Ice slurry is a phase change refrigerant which is composed of “micro-crystal” ice floating in a so-
lution of water and anti-freeze (usually glycol).
Main advantages of this medium as cold storage are [1], [36]:
conventional chiller components can be used;
cooling capacity can be adjust increasing the concentration of the crystals of ice;
the medium flows like conventional chilled water, but its cooling capacity is 5-6 times
higher;
higher efficiency if compared with the static ice producer, where ice adheres to the ex-
changer surface;
no defrost is required;
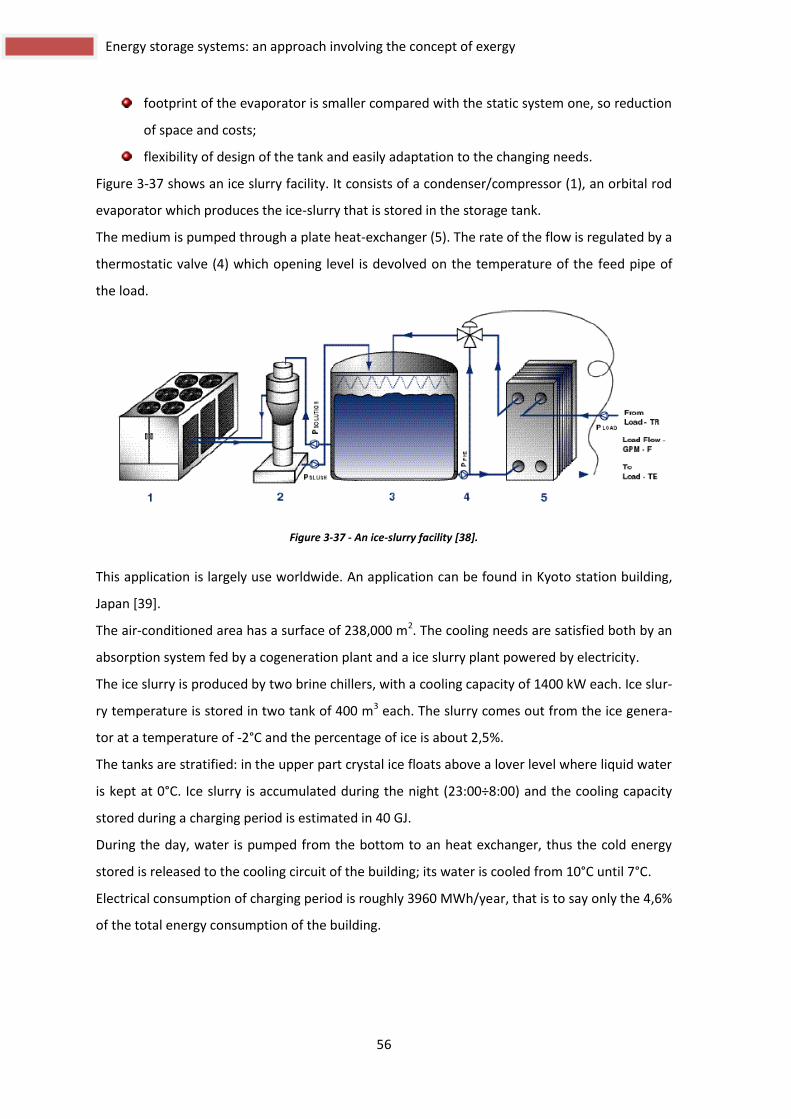
56
Energy storage systems: an approach involving the concept of exergy
footprint of the evaporator is smaller compared with the static system one, so reduction
of space and costs;
flexibility of design of the tank and easily adaptation to the changing needs.
Figure 3-37 shows an ice slurry facility. It consists of a condenser/compressor (1), an orbital rod
evaporator which produces the ice-slurry that is stored in the storage tank.
The medium is pumped through a plate heat-exchanger (5). The rate of the flow is regulated by a
thermostatic valve (4) which opening level is devolved on the temperature of the feed pipe of
the load.
Figure 3-37 - An ice-slurry facility [38].
This application is largely use worldwide. An application can be found in Kyoto station building,
Japan [39].
The air-conditioned area has a surface of 238,000 m2. The cooling needs are satisfied both by an
absorption system fed by a cogeneration plant and a ice slurry plant powered by electricity.
The ice slurry is produced by two brine chillers, with a cooling capacity of 1400 kW each. Ice slur-
ry temperature is stored in two tank of 400 m3 each. The slurry comes out from the ice genera-
tor at a temperature of -2°C and the percentage of ice is about 2,5%.
The tanks are stratified: in the upper part crystal ice floats above a lover level where liquid water
is kept at 0°C. Ice slurry is accumulated during the night (23:00÷8:00) and the cooling capacity
stored during a charging period is estimated in 40 GJ.
During the day, water is pumped from the bottom to an heat exchanger, thus the cold energy
stored is released to the cooling circuit of the building; its water is cooled from 10°C until 7°C.
Electrical consumption of charging period is roughly 3960 MWh/year, that is to say only the 4,6%
of the total energy consumption of the building.

57
57 Methods and examples of the thermal energy storage
Figure 3-38 - The ice slurry system in Kyoto station [39].
3.2.2. Organic PCMs
In this chapter are discussed the paraffin waxes as organic phase change materials.
These materials [44]:
are chemically stable;
are recyclable many times;
have a high heat of fusion;
are available in a wide range of melting temperature.
Main disadvantages are [1]:
low thermal conductivity (for paraffin waxes is about 0, 24 W/ (m·K));
flammability;
high costs.
unexpectedness of behavior in the long-term.
These PCMs are usually encapsulated, this to [44]:
increase the exchange surface ;
reduce the PCMs reactivity towards the outside environment;
control the changes of volume of the storage materials as phase change occurs.
Dimensions of the capsules vary depending on the typology of the applications.
Micro capsules have dimension of few micron and they are employed in [45]:
building materials;
goods storage solutions;
cooling electronics components;
clothing (gloves, outer garments, footwear).
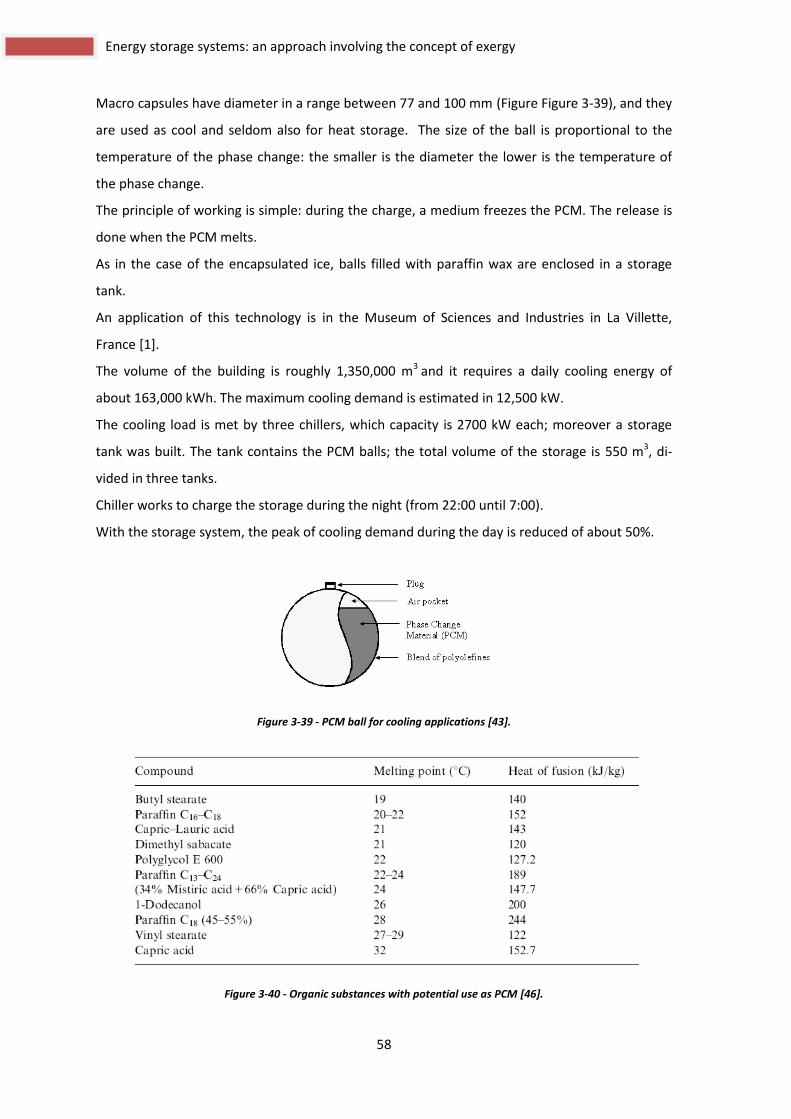
58
Energy storage systems: an approach involving the concept of exergy
Macro capsules have diameter in a range between 77 and 100 mm (Figure Figure 3-39), and they
are used as cool and seldom also for heat storage. The size of the ball is proportional to the
temperature of the phase change: the smaller is the diameter the lower is the temperature of
the phase change.
The principle of working is simple: during the charge, a medium freezes the PCM. The release is
done when the PCM melts.
As in the case of the encapsulated ice, balls filled with paraffin wax are enclosed in a storage
tank.
An application of this technology is in the Museum of Sciences and Industries in La Villette,
France [1].
The volume of the building is roughly 1,350,000 m3 and it requires a daily cooling energy of
about 163,000 kWh. The maximum cooling demand is estimated in 12,500 kW.
The cooling load is met by three chillers, which capacity is 2700 kW each; moreover a storage
tank was built. The tank contains the PCM balls; the total volume of the storage is 550 m3, di-
vided in three tanks.
Chiller works to charge the storage during the night (from 22:00 until 7:00).
With the storage system, the peak of cooling demand during the day is reduced of about 50%.
Figure 3-39 - PCM ball for cooling applications [43].
Figure 3-40 - Organic substances with potential use as PCM [46].

59
59 Methods and examples of the thermal energy storage
3.2.3. Hydrated salts
Hydrated salts have good characteristics to be used in the thermal energy storage.
This is due to their [44]:
high volumetric storage density (roughly 350 MJ/m3);
relatively high thermal conductivity (roughly 0,5 W/ (m·K));
relatively low costs if compared to the one of paraffin waxes;
no flammable;
high latent heat (for example the one of Glauber salt is 254 kJ/kg with a melting temper-
ature of 32,4°);
Main disadvantages are:
phase segregation;
elevated subcooling (so a nucleating agent is required).
In Figure 3-41 are reported the most commons PCMs on the market.
Figure 3-41 - Commercial PCMs available in the International market [46].

60
Energy storage systems: an approach involving the concept of exergy
3.3. Thermo-chemical energy storage
In a thermo-chemical storage process, thermal energy is stored through a endothermic chemical
reaction, while to release it, a exothermic reaction takes place.
This technology is proposed for medium high temperature storage [4].
Chemical reactions are attractive processes in application of the thermal energy storage, howev-
er this field is still a frontier [19].
The main advantage in using chemical reaction is that they present a higher energy density than
one of the physical changes (temperature, pressure, volume).
A chemical reaction to be attractive for thermal energy storage has to [4]:
occur with a temperature close to the one of the heating source (for the forward reac-
tion) or in a range in which heat is requested for the use (for the reverse reaction);
have its products of reactions in liquid form and the energy store per volume should be
as high as possible;
be reversible and no secondary products have to be generated;
be cheap and safe.
Many processes have been studied, but generally these systems are very expensive.
Some examples are discussed in the next paragraph.
3.3.1. Adsorption systems
In an adsorption system gas or liquid (solute) adheres on the surface of an adsorbent that can be
solid or liquid; in this way a thin layer is constituted above the interface of the solute and the ad-
sorbent. The most common adsorbents are zeolites and silicagels [19], while is widely used wa-
ter as solute.
Another similar system is the absorption one; the principles of operation of the absorption sys-
tems are the same of the adsorption ones: the only difference is that in an adsorption system
the solute adheres on the surface of the adsorbent, while in the absorbent ones the sorption oc-
curs inside the absorber, like water (solute) and a sponge (absorbent).

61
61 Methods and examples of the thermal energy storage
Figure 3-42 - Open absorption storage [19].
During the absorption process, a concentrated salt solution is placed over an exchange surface; a
moist air stream flows over this surface and it dehumidifies, diluting the salt solution with the
water vapor. The diluted salt solution is concentrated again during the regeneration.
In the next chapter are discussed some examples of adsorption system, more suitable to be a
thermal energy storage.
Adsorption systems can be classified in closed and open.
3.3.1.1. Closed adsorption system
The closed adsorption system is evacuated or air-free; the working principle is shown in Figure
3-43. During the charging process, heat coming from a high temperature source (such as solar
collectors) warms the adsorbent which releases the vapor it has captured during the discharging
process. The vapor is sent to a steam condenser and after the water to a tank.
During the storage period the dry adsorbent is separated from the rest of the system and no
heat losses occur, if are neglected the ones due to sensible heat.
Figure 3-43 - Working principle of a closed-cycle adsorption heat store [48].

62
Energy storage systems: an approach involving the concept of exergy
During the discharging process, water evaporates at low temperature (the pressure of the sys-
tem is very low) and the vapor is pumped in the tank containing the adsorbent, where it adheres
and releases the adsorption heat [48].
The heat of adsorption for a zeolite/water system could reach the value of 61 kJ/mol [47].
HYDES is an European project for long-term storage of thermal solar energy.
Figure 3-44 - HYDES project [19].
The layout of the system is shown in Figure 3-44. The heat collected during the summer with the
solar collector is stored in the three adsorbers. The heat to release the vapor adhered the silica-
gel is supplied with an heat exchanger put into the tank of the adsorber.
The vapor released is delivered to a condenser and the condensing heat is discharged as waste
with a cooling fan.
During the winter, discharging operation takes place. Low temperature heat is caught with the
solar collectors and it is used to evaporate the water. The vapor generated flows in the tank with
the silicagel and the process released high temperature heat that is delivered to the heating
network of the building [19].

63
63 Methods and examples of the thermal energy storage
3.3.1.2. Open adsorption system
In this system, the medium usually is air at atmospheric working pressure.
Figure 3-45 - Working process of open adsorption system [adapted from 35].
During the desorption (charging), an hot flux of dry air flows into a packed bed of solid adsor-
bents and it frees the vapor adhered. The air stream leaves the adsorbent cooler and with an
higher steam ratio.
In the discharging process (adsorption), the moist cool air flows through the adsorbent, leaving
the system warmer and with a lower steam ratio [35].
An application of this technology can be found in Munich, Germany [19].
An adsorption storage system has been installed in a school building and it has been connected
to the local district heating network and it is used to air conditioning in summer and to heat in
the winter time.
The heated floor space of the school is 1652 m2, the maximum heat load (with an external tem-
perature of -16°C) is 95 kW. The building requires 65 kWh/(m2·a) and a fresh air flow rate of 30
m3/h per person. The heating system is a combined radiator/floor/air heating system.
Concerning the heating, the system has been connected to the local district and it stores the
heat during the night and uses it during the day (Figure 3-46)

64
Energy storage systems: an approach involving the concept of exergy
Figure 3-46 - Layout of the operations of charging and discharging for heating mode [19].
The storage system is charged during the night using the heat coming from the steam that flows
in the district heating system. Temperature of the zeolite reaches 130-180°C. The condensing
heat of the process (35-40°C) is discharged forwarding it to the heating system of the school.
During the day air is heated up 25-30°C and it is saturated by a humidifier; the heat for this
process is supplied by the returning circuit of the district heating network. The dry air is heated
up to 100°C and it heats medium of the building heating system.
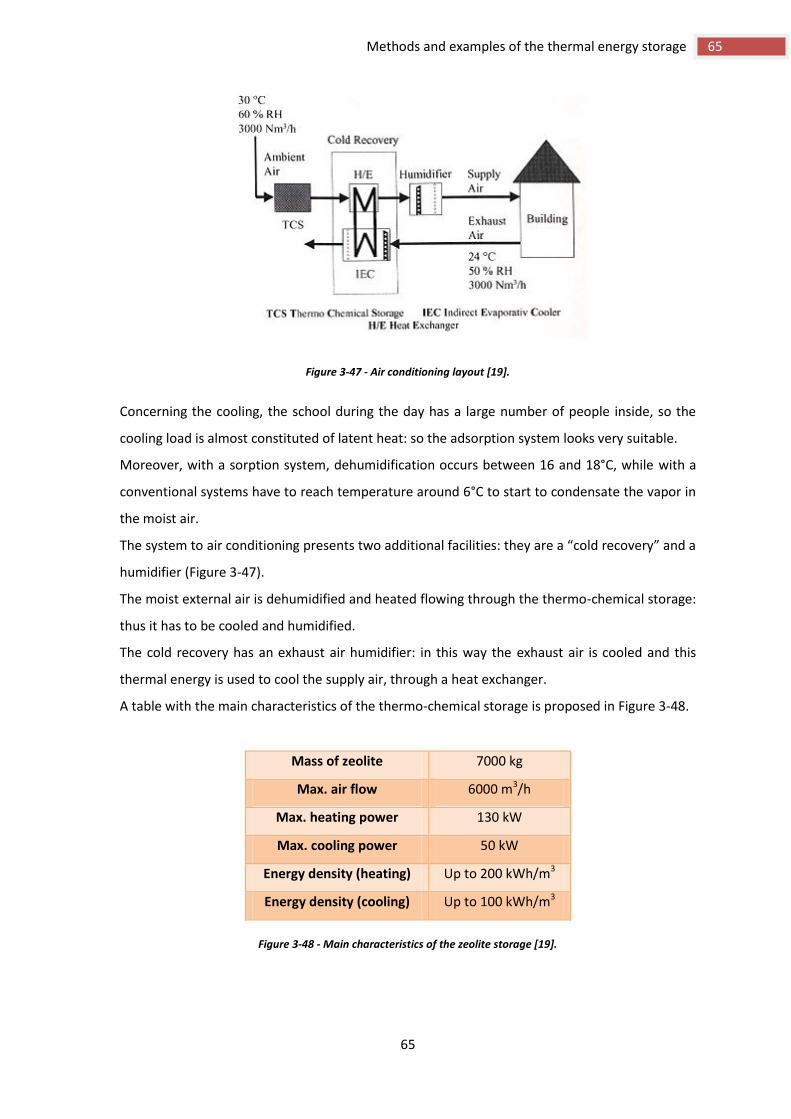
65
65 Methods and examples of the thermal energy storage
Figure 3-47 - Air conditioning layout [19].
Concerning the cooling, the school during the day has a large number of people inside, so the
cooling load is almost constituted of latent heat: so the adsorption system looks very suitable.
Moreover, with a sorption system, dehumidification occurs between 16 and 18°C, while with a
conventional systems have to reach temperature around 6°C to start to condensate the vapor in
the moist air.
The system to air conditioning presents two additional facilities: they are a “cold recovery” and a
humidifier (Figure 3-47).
The moist external air is dehumidified and heated flowing through the thermo-chemical storage:
thus it has to be cooled and humidified.
The cold recovery has an exhaust air humidifier: in this way the exhaust air is cooled and this
thermal energy is used to cool the supply air, through a heat exchanger.
A table with the main characteristics of the thermo-chemical storage is proposed in Figure 3-48.
Mass of zeolite 7000 kg
Max. air flow 6000 m3/h
Max. heating power 130 kW
Max. cooling power 50 kW
Energy density (heating) Up to 200 kWh/m3
Energy density (cooling) Up to 100 kWh/m3
Figure 3-48 - Main characteristics of the zeolite storage [19].

66
Energy storage systems: an approach involving the concept of exergy
4. Energy and exergy analysis of
thermal energy storages
In this chapter we examine the thermal energy storage systems coupled with renewable energy
sources, especially the solar radiation.
As mentioned in the first chapter, the solar radiation is free of charge but its energy density is
low and usually there is a mismatch between the period of collecting and the period when the
energy is required. Hence to use this resource a certain kind of buffer is required, so thermal
energy storage systems look suitable for this purpose.
In this chapter a thermal energy storage system coupled with a solar collector is examined.
The analysis has been performed in different European localities to see dimensions and efficien-
cies of the thermal energy storage systems.
The system is designed to stockpile with a storage tank the energy required to heat a building
through the year. Energy is supplied by solar radiation, through solar collectors.
All the analysis has been conducted considering a test year, and estimates have been done at
daily intervals.
Radiation and temperature data for the simulations has been taken from IDA software [57].

67
67 Energy and exergy analysis of thermal energy storages
4.1. Methodology
We have studied three different locations:
Stockholm
Venice
Barcelona
For each of them, a simulation has been done to evaluate the effect of a storage system in the
heating of a building; moreover the storage stockpiles the heat coming from a solar collector.
The methodology followed is presented in
Figure 4-1.
What we have done is an energy balance on the storage tank to evaluate its temperature.
The yearly air temperature data hour per hour and the thermal diffusivity of the ground allow
knowing the temperature of the ground at a certain depth: the formula is reported on paragraph
4.2.6.
The storage is a tank which is supposed buried at a certain depth. Variables are:
The internal radius, the height , and the thickness of the tank;
Additional mass of the tank (due to fitting, pipes union, etc.);
The thickness and thermal conductivity of the insulation;
The density and the specific heat of the material of the tank;
The density, the specific heat and the initial temperature of the storage medium;
The storage tank is connected with a solar collector and a small house, which volume is 450 m3.
To estimate the energy collected with the solar collectors, solar radiation data has to be known.
For our simulation, we have taken the ones from the webpage of IDA software [62].
Through IDA software it has been possible to estimate for every yearly hour the heating load of
the building.
In this way, we have evaluated the daily average of the heating load and the solar energy col-
lected; if the characteristics of the storage are known and the temperature of the ground at the
depth the tank is buried, is possible to estimate the temperature of medium inside the storage.
In the next paragraphs we describe in-depth step by step this energy balance.

68
Energy storage systems: an approach involving the concept of exergy
Thermal diffusivity
of the ground
Air temperature
data
GROUND
TEMPERATU
RE
CARACHTERISTICS OF THE
STORAGE:
-Height of the tank
-Radius of the tank
-Thickness of the tank
-Density of the material of the tank
-Additional mass
-Specific heat of the material of the
tank
-Density of the storage medium
-Specific heat medium
-Thermal conductivity of the
insulation
-Thickness of the insulation
-Initial temperature medium
ENERGY
BALANCE
Building data
IDA
software
DAILY
AVERAGE
HEATING TO
THE ZONE
Area of the
collectors
DAILY
AVERAGE
ENERGY
COLLECT
ED
Direct indirect
radiation data
TEMPERATURE
OF
THE MEDIUM
INSIDE THE
STORAGE
Figure 4-1 - Diagram of the methodology followed.

69
69 Energy and exergy analysis of thermal energy storages
4.2. Description of the system
On Figure 4-2 is shown the system we are going to analyze.
Figure 4-2 - Layout of the system.
The energy collected with solar collector is stockpiled in the buried storage tank, which is at the
same time coupled with the evaporator of a heat pump.
The tank is filled in with water (density = 1000 kg/m3, specific heat = 4195 J/(kg·K) ).
In this way, the heat pump works between two temperatures, the one of the storage (evapora-
tion) and the one of the condenser, which is supposed fixed at 45°C. The heating load is upllied
to the house through a floor heating system.
Data regarding the three building for each different location are presented in the next subsec-
tions.
4.2.1. Stockholm
Stockholm has been chosen for its low temperature and the low amount of solar radiation dur-
ing winter. In Figure 4-4 are shown some data regarding the city.
On Figure 4-3 it is shown the plan of the building, as it appears on IDA.
We have considered a building, which features are the typical ones for a new house in Stock-
holm climate. The plan of the building is shown in Figure 4-3; U-values are:
wall, 0,178 W/(m2·K);
floor, 0,1805 W/(m2·K);
ceiling, 0,1227 W/(m2·K);
windows, 1,3 W/(m2·K).

70
Energy storage systems: an approach involving the concept of exergy
The plan of the building is shown in Figure 4-3. The building is 15 meters long, 10 meters wide
and 3 meters high. It has got two windows on the north façade and another three on the south
one; total windows area is 10,8 m2. Windows are supposed never to be opened.
Inside the building there are two people (1,0 met and 1,0 clo) always present and the heating
load due to lighting is 100 W.
Figure 4-3 - Plan of the building [57].
Figure 4-4 - Monthly average temperatures and rainfall in Stockholm [55].

71
71 Energy and exergy analysis of thermal energy storages
4.2.2. Venice (Italy)
Venice presents a milder winter compared to the one of Stockholm; but during the summer the
quite high rate of humidity and temperatures see to it that the cooling load is high. In Figure 4-5
are shown some data regarding weather of Venice.
Figure 4-5 - Monthly average temperatures and rainfall in Venice [55].
To establish the energy required in winter to heat a building, regulations subdivide Italy in dif-
ferent climatic zones.
These zones are classified on the basis of the “degrees-day”, which are defined as *40+:
Where:
represents the ”degrees-day”;
is the set point temperature for the heated space (is set by convention at 20°C);
is the external temperature for the day considered;
is the length of the heating period, which is the number of days a year that external
temperature falls down 12°C.
According to this definition, Italian territory has been subdivided in different climatic zone la-
beled with a letter from “A” to “F”, where “A” zone has a milder winter than “F”.
Venice has been labeled with “E” and in order to fall within limits of regulations *63+, the follow-
ing U-values have been chosen for the simulation with IDA:
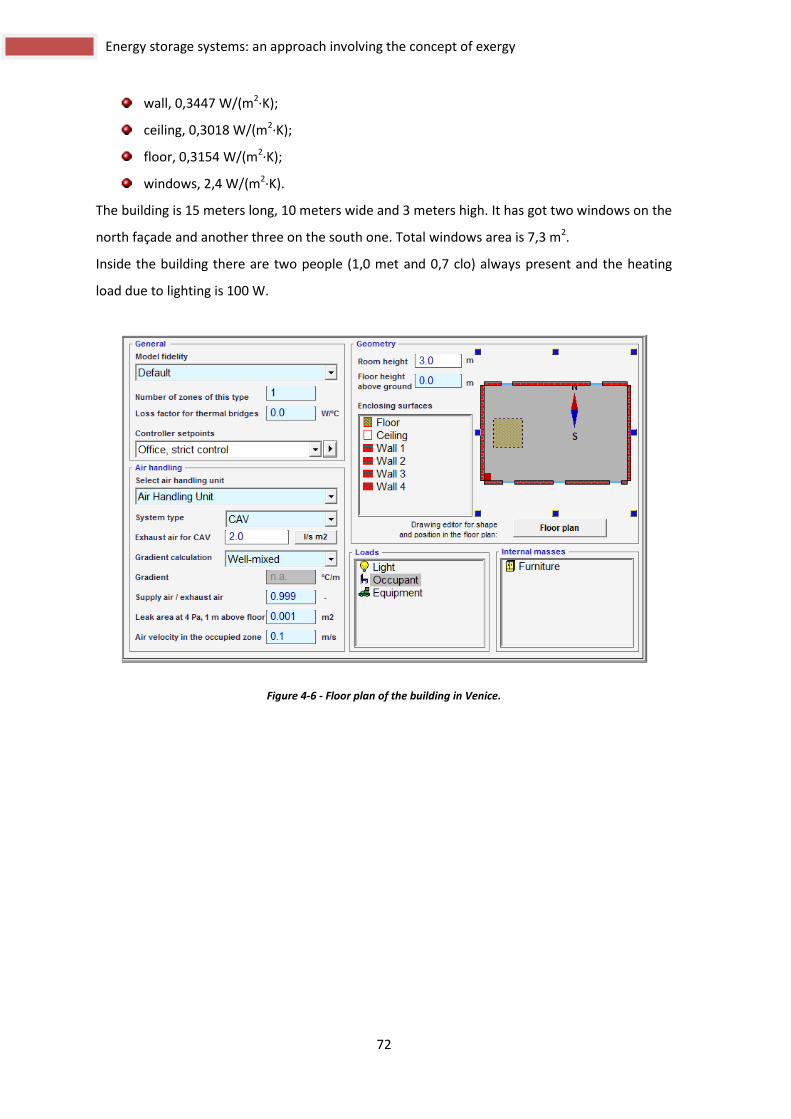
72
Energy storage systems: an approach involving the concept of exergy
wall, 0,3447 W/(m2·K);
ceiling, 0,3018 W/(m2·K);
floor, 0,3154 W/(m2·K);
windows, 2,4 W/(m2·K).
The building is 15 meters long, 10 meters wide and 3 meters high. It has got two windows on the
north façade and another three on the south one. Total windows area is 7,3 m2.
Inside the building there are two people (1,0 met and 0,7 clo) always present and the heating
load due to lighting is 100 W.
Figure 4-6 - Floor plan of the building in Venice.
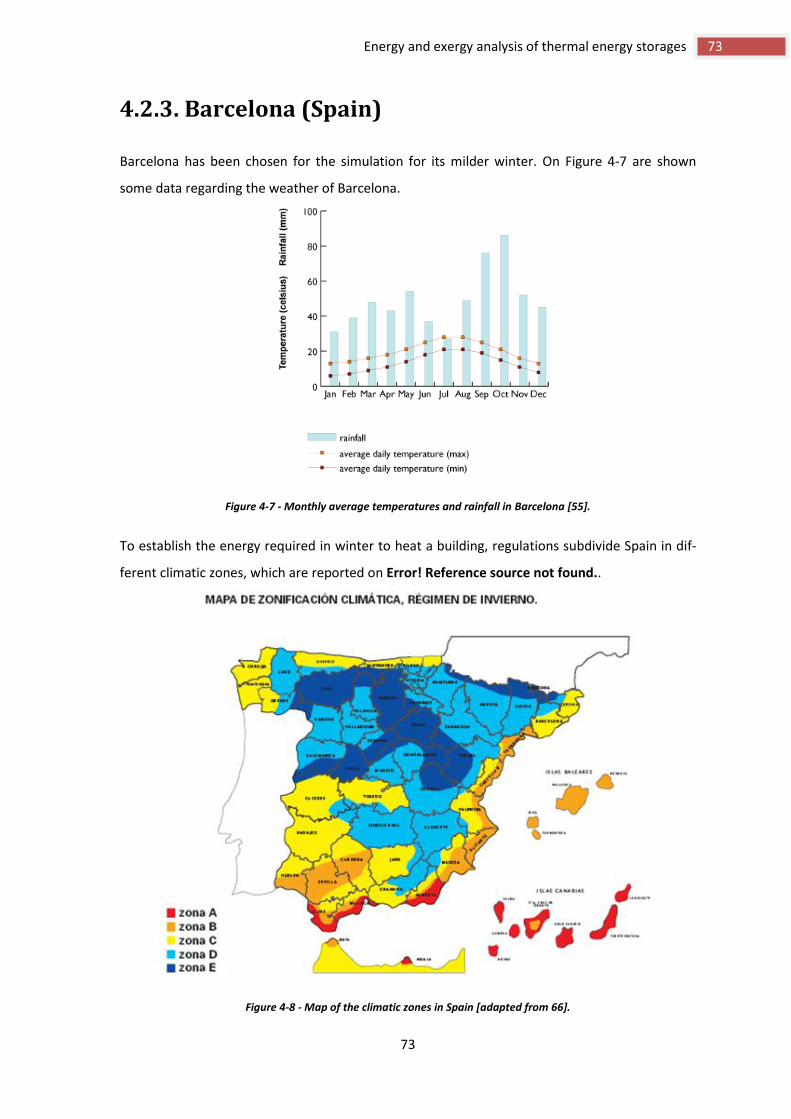
73
73 Energy and exergy analysis of thermal energy storages
4.2.3. Barcelona (Spain)
Barcelona has been chosen for the simulation for its milder winter. On Figure 4-7 are shown
some data regarding the weather of Barcelona.
Figure 4-7 - Monthly average temperatures and rainfall in Barcelona [55].
To establish the energy required in winter to heat a building, regulations subdivide Spain in dif-
ferent climatic zones, which are reported on Error! Reference source not found..
Figure 4-8 - Map of the climatic zones in Spain [adapted from 66].

74
Energy storage systems: an approach involving the concept of exergy
The building that has been considered for the simulation with IDA presents the following U-
values:
Wall, 0,6758 W/(m2·K);
Roof, 0,3585 W/(m2·K);
Floor, 0,4224 W/(m2·K);
Window, 4,40 W/(m2·K).
These values are inside the limits imposed by Spanish regulations; for the climatic zone of Barce-
lona they are:
Wall, 0,73 W/(m2·K);
Roof, 0,41 W/(m2·K);
Floor, 0,50 W/(m2·K);
Window, 4,40 W/(m2·K).
The plan of the building is reported in Figure 4-9.
Figure 4-9 - Plan of the building [57].

75
75 Energy and exergy analysis of thermal energy storages
4.2.4. IDA indoor and climate energy
When the U-values and the geometry for the building are chosen, it is possible to start with the
IDA simulation.
Figure 4-10 - IDA opening window.
IDA indoor and climate energy is a software that allows estimating of the heating and cooling
loads of a building.
Moreover is possible to assess [59]:
energy calculation on hourly basis;
natural ventilation through open doors, windows and chimneys;
displacement ventilation;
carbon dioxide and moisture concentration;
Fanger´s comfort index;
daylight.
Initial data are [59]:

76
Energy storage systems: an approach involving the concept of exergy
location;
rooms geometry;
system operation;
description of the facilities present in the room;
description of the people inside the rooms and their activity;
heating and cooling facilities.
It is possible to choose among different ways to supply the heating load, such as radiators, floor
heating systems, and all-air systems.
IDA was developed by thirty companies among the Scandinavian countries and nowadays it
represents the widely used building simulation software. Moreover is open structure software,
which means that anybody can contribute to its development.
Each location has a database in which is included:
temperature of the air;
relative humidity;
direction and speed of wind;
direct and indirect solar radiation;
Figure 4-11 - The program during the simulation.

77
77 Energy and exergy analysis of thermal energy storages
4.2.5. Determination of the efficiency of a solar col-
lector
Efficiency of a solar collector can be determined through a testing procedure; here we describe
the one proposed by the American Society of Heating, refrigerating, and Air-conditioning Engi-
neering (ASHRAE) reported by Sukhatme [4].
The efficiency is defined as:
where represents the heat generated by the solar collector, is the area of
the panels and is the total solar radiance.
The collector´s efficiency can be written as:
where represents the flow rate of medium inside the solar collector, while is the specific
heat of the medium and is the difference between the temperature of the medium
that flows in and the one that flows out.
The testing procedure requires the acquisition of the following data:
fluid flow rate;
inlet and outlet temperature of the fluid;
pressure drop across the collector;
ambient temperature;
solar radiation incident the solar collector;
wind speed.
The results of the test conducted on a solar collector allow expressing the efficiency with a for-
mula:
where represents the air temperature while and represents two constant that are de-
fined through the testing results.
A test conducted on a commercially available liquid flat-plane collector in the Heat Transfer La-
boratories at I.I.T. and reported in [4] has given the following results for the two parameters:

78
Energy storage systems: an approach involving the concept of exergy
The results have been assessed considering a flow rate of approximately 0,02 kg/s and the wind
speed has to be 3 and 6 m/s while the solar irradiance has to be greater than 600 W/m2.
Nevertheless, for our simulation we have used this formula also if the solar irradiance was lower
than 600 W/m2; this was done to simplify the analysis and also because the lower amounts of
solar radiation do not influence the final result.
Moreover, the inlet temperature has been set as the one determined for the medium the pre-
vious hour.
4.2.6. Determination of the temperature distribu-
tion in the soil
The tank that we want to study is buried into the ground. To determine the temperature of the
medium inside the tank it is necessary to know the temperature distribution inside the ground.
According to Popiel et al. [58] and Kusuda [60], ground temperature is influenced by:
physical characteristics of the ground (such as thermal conductivity, moisture continent
and packing density);
conditions at the surface (the profile is different if the surface is covered with grass or
concrete);
geographic and climate condition (such as latitude, altitude, air temperature, wind, solar
radiation, air humidity and rainfall).
Moreover Popiel subdivides the ground in three different layers:
“surface zone”, that reaches the depth of 1 m. The temperature in this bed is sensitive
of the outside temperature;
“shallow zone”, from 1 to 8 m (for dry light soils) or 20 m (for moist heavy sandy soils)
where ground temperature is almost constant and close to the average annual outside
temperature;
“deep zone” , deeper than 8-20 m, where the temperature is approximately constant,
because of the very slow rising with the depth due to the geothermal gradient.
Because ground temperature is affected by so many factors, which also change in a seasonal
cycle [60], it is impossible to assess the profile of temperature without direct measurements.
According to Kusuda et al. [60], Penrod and Carson proposed that earth temperature can be
represented with a sufficient accuracy by a harmonic representation [60]:

79
79 Energy and exergy analysis of thermal energy storages
where:
is the monthly average temperature
represents the elapsed time from January, 1st [h] ;
is the period of one cycle, for one year 8766 hours (average on 4 years);
is the average earth temperature [K];
is the amplitude of the annual cycle of the monthly average earth temperature at a
given depth [K];
represents the phase angle of the Earth temperature cycle, [rad].
Kusuda determined the values of fitting to equation above reported, for a site in Lexing-
ton, Kentucky at given depths.
Moreover Kusuda in his article suggests a formula proposed by Carslaw and Eckert which can es-
timate earth temperature.
Assuming that:
ground is homogeneous and the thermal diffusivity is constant throughout it;
the surface temperature varies with time according to a periodical cycle;
the temperature of the ground varies with time according to a periodical cycle.
The data require are:
amplitude of the annual cycle of the monthly average surface temperature, BO [K];
the average surface temperature, AO [K];
thermal diffusivity, D [m2/h];
period of one cycle, T (8766 hours);
surface temperature phase angle, PO [rad];
depth at which temperature has to be calculated, z [m].
Kusuda reports the following formula:
Where and represent the phase angle and the amplitude of the nth harmonic.
Because we are considering an annual temperature cycle, harmonics with n≥2 are negligible.
The formula becomes:
We can notice that this formula reflects the equation (*) on the previous page, where

80
Energy storage systems: an approach involving the concept of exergy
Moving from these considerations, a simplified formula derived from Kusuda´s one is given in
[61]. Here it follows:
Where:
is the mean value of the air temperature throughout the year;
is amplitude of the surface temperature, , where is the
maximum daily average temperature and is the minimum one throughout the year;
is the day of the year we are considering;
is the depth we want estimate the temperature;
represents the thermal diffusivity of the ground;
is the difference [day] between January, 1st and the day in which has been
registered;
This formula is very simple and does not consider all the different variables that only an analysis
on collected data can give. Nevertheless, the formula has been used in all the simulations that
have been done.

81
81 Energy and exergy analysis of thermal energy storages
4.2.7. Energy balance of the storage tank
In order to do an energy balance, here we present the theoretical and the practical method pur-
sued.
4.2.7.1. Theoretical energy balance
In order to estimate the final temperature of the water, it has been assumed that the medium in
the tank is well-mixed: this has been done to simplify our study.
An energy analysis has been conducted to define the temperature of the medium in the tank.
The balance equation is [4]:
where:
is the heat capacity of the liquid in the tank;
is the heat capacity of the tank itself;
represents the temperature of the liquid;
is the time;
is the energy supplied by the collectors;
is the heating load of the building;
represents the heat coefficient of all the surface of the tank;
is the environmental temperature.
We can integrate the above equation considering for , (intial temperature of the
medium). We have:
The unknown factor is the temperature of the liquid, thus the equation becomes:

82
Energy storage systems: an approach involving the concept of exergy
4.2.7.2. Practical energy balance
The energy balance has been done through Microsoft Excel.
In the columns it has been reported the hourly heating load, the air temperature, the solar radi-
ation (direct and diffused), and the primary energy consumed by the boiler. In a table it has been
reported the initial data that have been discussed on paragraph 4.1.
Hourly data have been transformed on daily average, in order to give an easier reading of the
resulting graphs.
It has been prepared three different worksheets, one for each year. Moreover other two work-
sheets have been added to study the influence of the thickness of insulation of the tank.
This worksheet can evaluate:
the final temperature of the medium when the tank is buried at a certain depth;
the final temperature of the medium when the tank is above the ground;
the temperature of the ground;
the electricity consumption of a heat pump coupled with the ground or with the me-
dium inside the storage tank or with the external air.
All formula are parameterized, for example is possible to change an unique parameter and see
directly the effects on the final results.
It has been developed three books, once for each location; but the same worksheet can be ap-
plied to other locations, it is required only to change the initial data.
On Figure 4-12 is shown an image of the worksheets.
Figure 4-12 - A screen shot of the worksheet developed.

83
83 Energy and exergy analysis of thermal energy storages
4.3. Results of simulations
The results of simulations are discussed in the following paragraphs.
Storage medium, physical characteristics of the tank, and boundary conditions for the simula-
tions are the same for the different locations; these data are reported on Figure 4-13 - Table
with data for simulation.
Figure 4-13 - Table with data for simulation.
DATA VALUE
height of the tank [m] 6,000
tank INTERNAL radius [m] 1,000
thickness of the tank [m] 0,006
density of the material of the tank [kg/m^3] 7800,000
Additional mass [kg] 200,000
Total mass of the tank [kg] 2272,497
Total volume of the medium [m^3] 18,850
specific heat of the tank [J/(kgK)] 460,000
density of the storage medium [kg/m^3] 1000,000
specific heat medium [J/(kgK) 4195,000
thermal conductivity of the insulation [W/(mK)] 0,080
thickness of the insulation [m] 0,100
(UA) tank [W/K] 32,460
DETERMINING BC…
initial Temp medium [K] 281,150
area of collectors [m^2] 10,000
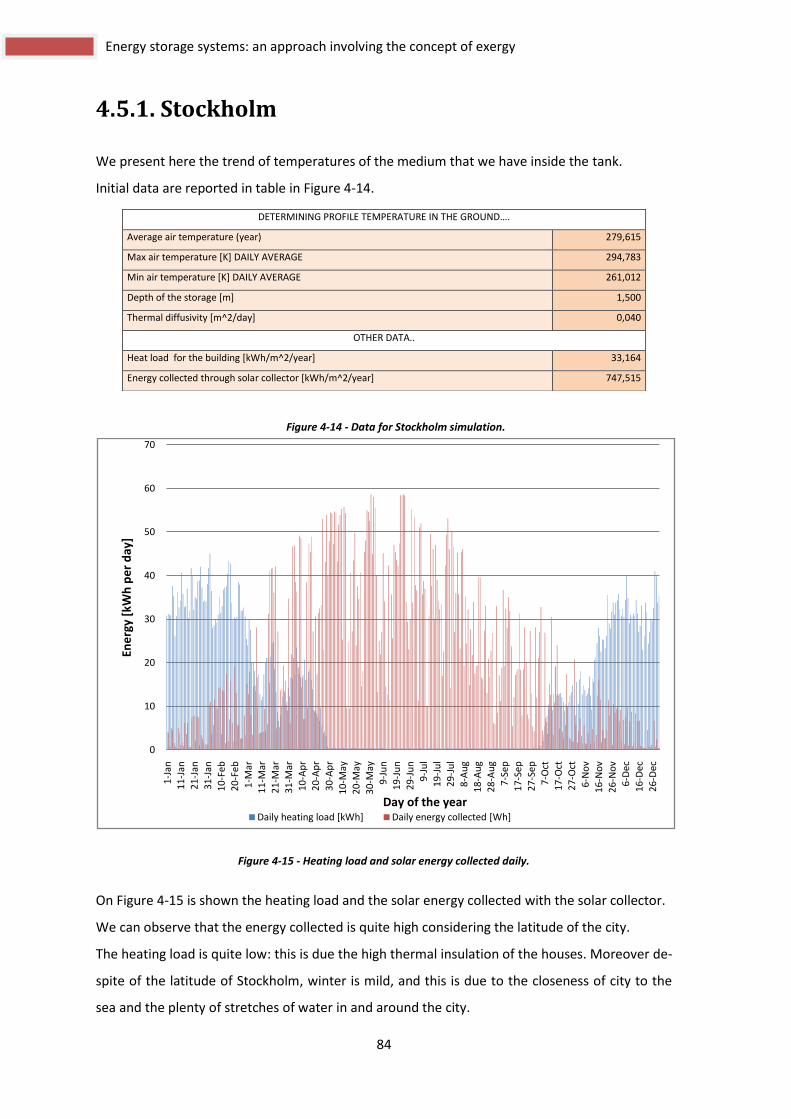
84
Energy storage systems: an approach involving the concept of exergy
4.5.1. Stockholm
We present here the trend of temperatures of the medium that we have inside the tank.
Initial data are reported in table in Figure 4-14.
Figure 4-15 - Heating load and solar energy collected daily.
On Figure 4-15 is shown the heating load and the solar energy collected with the solar collector.
We can observe that the energy collected is quite high considering the latitude of the city.
The heating load is quite low: this is due the high thermal insulation of the houses. Moreover de-
spite of the latitude of Stockholm, winter is mild, and this is due to the closeness of city to the
sea and the plenty of stretches of water in and around the city.
0
10
20
30
40
50
60
70
1-J
an
11
-Jan
21
-Jan
31
-Jan
10
-Feb
20
-Feb
1-M
ar
11
-Mar
21
-Mar
31
-Mar
10
-Ap
r
20
-Ap
r
30
-Ap
r
10
-May
20
-May
30
-May
9-J
un
19
-Ju
n
29
-Ju
n
9-J
ul
19
-Ju
l
29
-Ju
l
8-A
ug
18
-Au
g
28
-Au
g
7-S
ep
17
-Sep
27
-Sep
7-O
ct
17
-Oct
27
-Oct
6-N
ov
16
-No
v
26
-No
v
6-D
ec
16
-Dec
26
-Dec
Ene
rgy
[kW
h p
er
day
]
Day of the yearDaily heating load [kWh] Daily energy collected [Wh]
Figure 4-14 - Data for Stockholm simulation.
DETERMINING PROFILE TEMPERATURE IN THE GROUND….
Average air temperature (year) 279,615
Max air temperature [K] DAILY AVERAGE 294,783
Min air temperature [K] DAILY AVERAGE 261,012
Depth of the storage [m] 1,500
Thermal diffusivity [m^2/day] 0,040
OTHER DATA..
Heat load for the building [kWh/m^2/year] 33,164
Energy collected through solar collector [kWh/m^2/year] 747,515
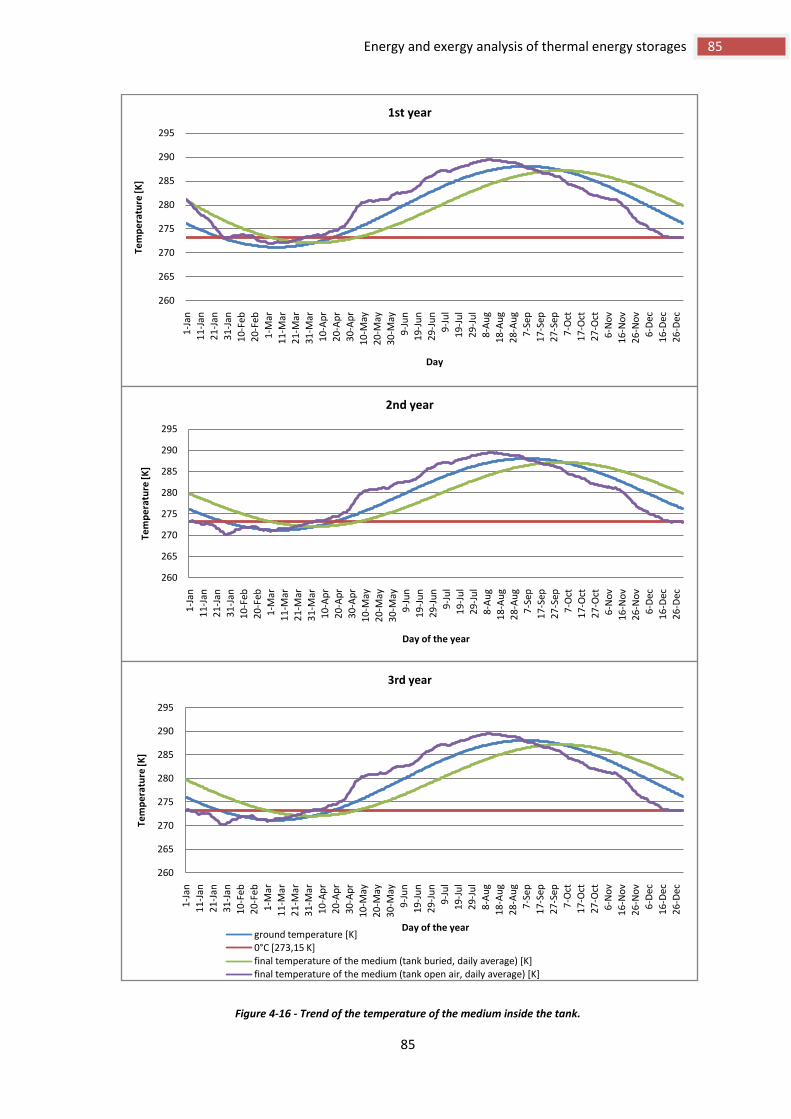
85
85 Energy and exergy analysis of thermal energy storages
Figure 4-16 - Trend of the temperature of the medium inside the tank.
260
265
270
275
280
285
290
295
1-J
an
11
-Jan
21
-Jan
31
-Jan
10
-Feb
20
-Feb
1-M
ar
11
-Mar
21
-Mar
31
-Mar
10
-Ap
r
20
-Ap
r
30
-Ap
r
10
-May
20
-May
30
-May
9-J
un
19
-Ju
n
29
-Ju
n
9-J
ul
19
-Ju
l
29
-Ju
l
8-A
ug
18
-Au
g
28
-Au
g
7-S
ep
17
-Sep
27
-Sep
7-O
ct
17
-Oct
27
-Oct
6-N
ov
16
-No
v
26
-No
v
6-D
ec
16
-Dec
26
-Dec
Tem
pe
ratu
re [K
]
Day
1st year
260
265
270
275
280
285
290
295
1-J
an
11
-Jan
21
-Jan
31
-Jan
10
-Feb
20
-Feb
1-M
ar
11
-Mar
21
-Mar
31
-Mar
10
-Ap
r
20
-Ap
r
30
-Ap
r
10
-May
20
-May
30
-May
9-J
un
19
-Ju
n
29
-Ju
n
9-J
ul
19
-Ju
l
29
-Ju
l
8-A
ug
18
-Au
g
28
-Au
g
7-S
ep
17
-Sep
27
-Sep
7-O
ct
17
-Oct
27
-Oct
6-N
ov
16
-No
v
26
-No
v
6-D
ec
16
-Dec
26
-Dec
Tem
pe
ratu
re [K
]
Day of the year
2nd year
260
265
270
275
280
285
290
295
1-J
an
11
-Jan
21
-Jan
31
-Jan
10
-Feb
20
-Feb
1-M
ar
11
-Mar
21
-Mar
31
-Mar
10
-Ap
r
20
-Ap
r
30
-Ap
r
10
-May
20
-May
30
-May
9-J
un
19
-Ju
n
29
-Ju
n
9-J
ul
19
-Ju
l
29
-Ju
l
8-A
ug
18
-Au
g
28
-Au
g
7-S
ep
17
-Sep
27
-Sep
7-O
ct
17
-Oct
27
-Oct
6-N
ov
16
-No
v
26
-No
v
6-D
ec
16
-Dec
26
-Dec
Tem
pe
ratu
re [K
]
Day of the year
3rd year
ground temperature [K]0°C [273,15 K]final temperature of the medium (tank buried, daily average) [K]final temperature of the medium (tank open air, daily average) [K]

86
Energy storage systems: an approach involving the concept of exergy
As we can see from the diagram above, temperature of the medium is mostly influenced by the
one of the ground.
Thus an important factor is the thickness of the insulation of the tank; as we can see on Figure
4-17, the peak of temperature is lower increasing the thickness of the insulation and at the same
time the minimum value of temperature falls on beyond days.
Supposing the tank coupled with a heat pump (the medium in the tank represents the heat
source at lower temperature), a thicker layer allowed to have a higher temperature of the sto-
rage medium the tank when the heat load is higher, and this enables an higher COP of the heat
pump.
Moreover, the amplitude of the temperature of the medium decreases, thus the influence of the
temperature of the ground is lower.
Figure 4-17 - Outline of the temperature of the medium during the first year, modifying only the thickness of the in-
sulation.
260,0
265,0
270,0
275,0
280,0
285,0
290,0
1-J
an1
1-J
an2
1-J
an3
1-J
an1
0-F
eb2
0-F
eb1
-Mar
11
-Mar
21
-Mar
31
-Mar
10
-Ap
r2
0-A
pr
30
-Ap
r1
0-M
ay2
0-M
ay3
0-M
ay9
-Ju
n1
9-J
un
29
-Ju
n9
-Ju
l1
9-J
ul
29
-Ju
l8
-Au
g1
8-A
ug
28
-Au
g7
-Sep
17
-Sep
27
-Sep
7-O
ct1
7-O
ct2
7-O
ct6
-No
v1
6-N
ov
26
-No
v6
-Dec
16
-Dec
26
-Dec
Tem
pe
ratu
re o
f th
e m
ed
ium
[K
]
Day of the year
thickness of insulation = 0,1 m thickness of insulation = 0,2 m thickness of insulation = 0,5 m
0°C [273,15 K] ground temperature [K]

87
87 Energy and exergy analysis of thermal energy storages
An exergetic comparison among different systems used to supply heat to the building is shown
on Figure 4-19. Heat pump systems have been supposed working to supply heat at 45°C, with
the lower heat source that varies among three different temperatures:
the one of the medium inside the storage;
the one of external air;
the one of ground at the same depth of the buried storage tank.
With exergetic analysis we can compare on the same graph also the exergy used by a boiler that
have to supply the heat for the same building.
Figure 4-18 - Electricity consumption of the same heat pump varying the thermal source at lower temperature.
This heat it has been estimated with IDA software. Supposing that the boiler burns natural gas,
whose rate specific chemical exergy/lower calorific value is supposed to be 1,04, and considering
that the gas is on physical equilibrium with the ambient benchmark, we can “translate” the gas
burned by the boiler in exergy used.
0
2
4
6
8
10
12
14
16
1-J
an
11
-Jan
21
-Jan
31
-Jan
10
-Feb
20
-Feb
1-M
ar
11
-Mar
21
-Mar
31
-Mar
10
-Ap
r
20
-Ap
r
30
-Ap
r
10
-May
20
-May
30
-May
9-J
un
19
-Ju
n
29
-Ju
n
9-J
ul
19
-Ju
l
29
-Ju
l
8-A
ug
18
-Au
g
28
-Au
g
7-S
ep
17
-Sep
27
-Sep
7-O
ct
17
-Oct
27
-Oct
6-N
ov
16
-No
v
26
-No
v
6-D
ec
16
-Dec
26
-Dec
Ele
ctri
city
co
nsu
mp
tio
n [
kWh
pe
r d
ay]
Day
Electricity consumption with air Electricity consumption with ground
Electricity consumption with TES

88
Energy storage systems: an approach involving the concept of exergy
To evaluate the efficiency of the heat pump, it has been considered a certain rate between the
real COP and the one ideal, reachable through an ideal Carnot cycle; the rate has been fixed con-
stant varying the temperature of the of the cooler source.
This rate is given by:
The real consumption of electricity results increased by 100% compared with the one in the ideal
situation.
On Figure 4-18 it is shown the electricity consumption varying the lower temperature source.
On Figure 4-19 it is reported the exergetic comparison among the different heat pump solutions
and the boiler.
Figure 4-19 - Daily exergy consumption for the different systems.
The simulation shows the huge difference among exergy consumption with the different sys-
tems. The graph on Figure 4-19 shows that the exergy consumption of the boiler is almost 5
times higher than the one of the heat pump, whatever the heat source at lower temperature is.
0
10
20
30
40
50
60
70
1-J
an
11
-Jan
21
-Jan
31
-Jan
10
-Feb
20
-Feb
1-M
ar
11
-Mar
21
-Mar
31
-Mar
10
-Ap
r
20
-Ap
r
30
-Ap
r
10
-May
20
-May
30
-May
9-J
un
19
-Ju
n
29
-Ju
n
9-J
ul
19
-Ju
l
29
-Ju
l
8-A
ug
18
-Au
g
28
-Au
g
7-S
ep
17
-Sep
27
-Sep
7-O
ct
17
-Oct
27
-Oct
6-N
ov
16
-No
v
26
-No
v
6-D
ec
16
-Dec
26
-Dec
Exe
rgy
con
sum
ed
[kW
h p
er
day
]
Day
Electricity consumption with TES Electricity consumption with ground
Electricity consumption with air Daily exergy consumed by the boiler

89
89 Energy and exergy analysis of thermal energy storages
Considering now the three different solutions of heat pumps on Figure 4-18, it appears that the
solution heat pump coupled with the air uses electricity (exergy) more than the one coupled
with the ground, which consumes more electricity than the one coupled with the medium of the
storage system.
On Figure 4-20 is shown the yearly electricity consumption of the three different heat pumps.
We can estimate that there is approximately 100 kWh per year of difference among air —
ground solutions and 80 kWh per year among ground – TES solutions.
Figure 4-20 - Yearly electricity consumption of the heat pumps.
0
200
400
600
800
1000
1200
1400
1600
Ele
ctri
dit
y co
nsu
me
d [
kWh
pe
r ye
ar]
Consumption of the heat pump coupled with the air
Consumption of the heat pump coupled with the ground
Consumption of the heat pump coupled with the TES

90
Energy storage systems: an approach involving the concept of exergy
4.5.2. Venice
Data for the simulation of Venice are shown on Figure 4-21.
Figure 4-21 - Data for the simulation of Venice.
We can observe on Figure 4-22 that the solar energy collected would be enough to heat a typical
small house in this climate.
The yearly heat load per square meter of Stockholm is lower than the one of Venice:
Figure 4-22 - Daily heating load and solar energy collected throughout the year.
0
10
20
30
40
50
60
70
1-J
an
11
-Jan
21
-Jan
31
-Jan
10
-Feb
20
-Feb
1-M
ar
11
-Mar
21
-Mar
31
-Mar
10
-Ap
r
20
-Ap
r
30
-Ap
r
10
-May
20
-May
30
-May
9-J
un
19
-Ju
n
29
-Ju
n
9-J
ul
19
-Ju
l
29
-Ju
l
8-A
ug
18
-Au
g
28
-Au
g
7-S
ep
17
-Sep
27
-Sep
7-O
ct
17
-Oct
27
-Oct
6-N
ov
16
-No
v
26
-No
v
6-D
ec
16
-Dec
26
-Dec
Ene
rgy
[kW
h p
er
day
]
Day
Daily heating load [kWh] Daily energy collected [kWh]
DETERMINING PROFILE TEMPERATURE IN THE GROUND….
Average air temperature (year) 286,359
Max air temperature [K] DAILY AVERAGE 301,221
Min air temperature [K] DAILY AVERAGE 271,392
Depth of the storage [m] 1,500
Thermal diffusivity [m^2/day] (*) 0,072
OTHER DATA..
Total volume of the medium [m^3] 18,850
Heat load for the building [kWh/m^2/year] 31,070
Energy collected through solar collector [kWh/m^2/year] 832,355
(*) = this value is referred to Padua and is reported in [64].

91
91 Energy and exergy analysis of thermal energy storages
Figure 4-23 - Temperature profile of the medium.
260
265
270
275
280
285
290
295
300
1-J
an
11
-Jan
21
-Jan
31
-Jan
10
-Feb
20
-Feb
1-M
ar
11
-Mar
21
-Mar
31
-Mar
10
-Ap
r
20
-Ap
r
30
-Ap
r
10
-May
20
-May
30
-May
9-J
un
19
-Ju
n
29
-Ju
n
9-J
ul
19
-Ju
l
29
-Ju
l
8-A
ug
18
-Au
g
28
-Au
g
7-S
ep
17
-Sep
27
-Sep
7-O
ct
17
-Oct
27
-Oct
6-N
ov
16
-No
v
26
-No
v
6-D
ec
16
-Dec
26
-Dec
Tem
pe
ratu
re [K
]
Day of the year
1st year
260
265
270
275
280
285
290
295
300
1-J
an
11
-Jan
21
-Jan
31
-Jan
10
-Feb
20
-Feb
1-M
ar
11
-Mar
21
-Mar
31
-Mar
10
-Ap
r
20
-Ap
r
30
-Ap
r
10
-May
20
-May
30
-May
9-J
un
19
-Ju
n
29
-Ju
n
9-J
ul
19
-Ju
l
29
-Ju
l
8-A
ug
18
-Au
g
28
-Au
g
7-S
ep
17
-Sep
27
-Sep
7-O
ct
17
-Oct
27
-Oct
6-N
ov
16
-No
v
26
-No
v
6-D
ec
16
-Dec
26
-Dec
Tem
pe
ratu
re [K
]
Day of the year
2nd year
260
265
270
275
280
285
290
295
300
1-J
an
12
-Jan
23
-Jan
3-F
eb
14
-Feb
25
-Feb
7-M
ar
18
-Mar
29
-Mar
9-A
pr
20
-Ap
r
1-M
ay
12
-May
23
-May
3-J
un
14
-Ju
n
25
-Ju
n
6-J
ul
17
-Ju
l
28
-Ju
l
8-A
ug
19
-Au
g
30
-Au
g
10
-Sep
21
-Sep
2-O
ct
13
-Oct
24
-Oct
4-N
ov
15
-No
v
26
-No
v
7-D
ec
18
-Dec
29
-Dec
Tem
pe
ratu
re [K
]
Day of the year
3rd year
ground temperature [K]
0°C [273,15 K]
final temperature of the medium (tank buried, daily average) [K]
final temperature of the medium (tank open air, daily average) [K]

92
Energy storage systems: an approach involving the concept of exergy
On Figure 4-23 are reported the temperature of the medium inside the tank.
Considering that the size of the storage is the same of the one for the simulation in Stockholm,
we can observe that the temperature of the medium is always above the zero degrees Celsius.
Moreover the temperature of the ground at the depth of the buried storage tank is almost equal
to the one of the medium with the tank above the ground: thus we can say that the efficiency of
a heat pump coupled with the ground and the efficiency of the same machinery coupled with
the medium inside the tank are the same.
The annual heat load per square meter estimated with IDA software for Venice is close to the
one of Stockholm, 38,626 kWh/(m2year)is the value for Venice, while for Stockholm is 33,164
kWh/(m2year).
Figure 4-24 - Final temperature of the medium varying the thickness of the insulation of the tank, for the first and
the second year of operation.
260
265
270
275
280
285
290
295
300
1-J
an
11
-Jan
21
-Jan
31
-Jan
10
-Feb
20
-Feb
1-M
ar
11
-Mar
21
-Mar
31
-Mar
10
-Ap
r
20
-Ap
r
30
-Ap
r
10
-May
20
-May
30
-May
9-J
un
19
-Ju
n
29
-Ju
n
9-J
ul
19
-Ju
l
29
-Ju
l
8-A
ug
18
-Au
g
28
-Au
g
7-S
ep
17
-Sep
27
-Sep
7-O
ct
17
-Oct
27
-Oct
6-N
ov
16
-No
v
26
-No
v
6-D
ec
16
-Dec
26
-Dec
Tem
pe
ratu
re [K
]
Day
1st year.
260
265
270
275
280
285
290
295
300
1-J
an
11
-Jan
21
-Jan
31
-Jan
10
-Feb
20
-Feb
1-M
ar
11
-Mar
21
-Mar
31
-Mar
10
-Ap
r
20
-Ap
r
30
-Ap
r
10
-May
20
-May
30
-May
9-J
un
19
-Ju
n
29
-Ju
n
9-J
ul
19
-Ju
l
29
-Ju
l
8-A
ug
18
-Au
g
28
-Au
g
7-S
ep
17
-Sep
27
-Sep
7-O
ct
17
-Oct
27
-Oct
6-N
ov
16
-No
v
26
-No
v
6-D
ec
16
-Dec
26
-Dec
Tem
pe
ratu
re [K
]
Day
2nd year.
thickness = 0,10 m thickness = 0,20 m thickness = 0,50 m
ground temperature 0°C [273,15 K]

93
93 Energy and exergy analysis of thermal energy storages
On Figure 4-24 are shown the temperature of the medium inside the tank varying the thickness
of the insulation.
We can observe on Figure 4-24 that at the beginning of the 1st year varying the thickness of the
insulation, temperatures of the medium inside the tank are almost the same; while these three
temperatures differ after the first half of the 1st year.
This aspect does not appear on Stockholm simulation: this is explained considering that the dif-
ference between the temperature of the medium and the one of the ground is lower for the Ve-
nice simulation than for the Stockholm one. It is very important the insulation of the tank, espe-
cially for the harsher climate.
On Figure 4-25 is reported the exergetic comparison between four different solutions; we have
considered the electricity consumption of the same heat pump which is supposed working to
supply heat at 45°C, with the lower heat source that varies among three different temperatures:
the one of the medium inside the storage;
the one of external air;
the one of ground.
Moreover, on Figure 4-26 is reported the exergetic comparison between the different solutions
for the heat pumps and a boiler, which has to supply the same heat to the climatic zone.
We have considered the rate between the real and the ideal COP equal to the one adopted for
the simulation of Stockholm.
Figure 4-25 – Electricity consumption of the heat pump varying the thermal source at lower temperature.
0,0
2,0
4,0
6,0
8,0
10,0
12,0
14,0
01
-jan
11
-jan
21
-jan
31
-jan
10
-feb
20
-feb
01
-mar
11
-mar
21
-mar
31
-mar
10
-ap
r
20
-ap
r
30
-ap
r
10
-maj
20
-maj
30
-maj
09
-ju
n
19
-ju
n
29
-ju
n
09
-ju
l
19
-ju
l
29
-ju
l
08
-au
g
18
-au
g
28
-au
g
07
-sep
17
-sep
27
-sep
07
-okt
17
-okt
27
-okt
06
-no
v
16
-no
v
26
-no
v
06
-dec
16
-dec
26
-dec
Ele
ctri
city
co
nsu
mp
tio
n [
kWh
pe
r d
ay]
Day
Electricity consumption with air Electricity consumption with ground
Electricity consumption with TES

94
Energy storage systems: an approach involving the concept of exergy
We can observe on Figure 4-26 that the exergy consumption with the boiler is up to 6 times
higher than with whatever heat pump solution.
On Figure 4-25 the heat pump coupled with the TES appears more convenient during the winter,
but starting from the 60th-70th day, we observe that the difference among the three solutions
not only disappears but also it seems that the electricity consumed with the heat pump coupled
with the air is lower than the one with the TES.
Figure 4-26 - Exergetic comparison among different solutions.
This can be explained considering the trend of the temperatures of ground, air and TES (Figure
4-27): while during the beginning of the year, temperature of the storage medium is higher than
the others, after the first two months (60 days) temperatures of ground and the one of air be-
come higher than the one of the storage medium inside the tank.
Due to this, the efficiency of the heat pump coupled with the TES decreases.
Nevertheless, as the efficiency worsens as the heating load decreases, thus considering the year-
ly electricity consumptions (on Figure 4-28), we can observe that the total electricity used by the
heat pump coupled with TES is lower than the one of air or ground.
0
10
20
30
40
50
60
70
1-J
an
14
-Jan
27
-Jan
9-F
eb
22
-Feb
6-M
ar
19
-Mar
1-A
pr
14
-Ap
r
27
-Ap
r
10
-May
23
-May
5-J
un
18
-Ju
n
1-J
ul
14
-Ju
l
27
-Ju
l
9-A
ug
22
-Au
g
4-S
ep
17
-Sep
30
-Sep
13
-Oct
26
-Oct
8-N
ov
21
-No
v
4-D
ec
17
-Dec
30
-Dec
Exe
rgy
con
sum
ed
[kW
h p
er
day
]
Day
Electricity consumption with TES Electricity consumption with ground
Electricity consumption with air Daily exergy consumed by the boiler

95
95 Energy and exergy analysis of thermal energy storages
Figure 4-27 - Trend of temperatures of air, ground, and storage medium.
Figure 4-28 - Yearly electricity consumption for the three heat pumps.
255
260
265
270
275
280
285
290
295
300
305
1-J
an
13
-Jan
25
-Jan
6-F
eb
18
-Feb
1-M
ar
13
-Mar
25
-Mar
6-A
pr
18
-Ap
r
30
-Ap
r
12
-May
24
-May
5-J
un
17
-Ju
n
29
-Ju
n
11
-Ju
l
23
-Ju
l
4-A
ug
16
-Au
g
28
-Au
g
9-S
ep
21
-Sep
3-O
ct
15
-Oct
27
-Oct
8-N
ov
20
-No
v
2-D
ec
14
-Dec
26
-Dec
Tem
pe
ratu
re [
K]
Day of the year
average daily air temperature [K]ground temperature [K]final temperature of the medium (tank buried, daily average) [K]
0
200
400
600
800
1000
1200
Ele
ctri
dit
y co
nsu
me
d [
kWh
pe
r ye
ar]
Consumption of the heat pump coupled with the air
Consumption of the heat pump coupled with the ground
Consumption of the heat pump coupled with the TES

96
Energy storage systems: an approach involving the concept of exergy
4.5.3. Barcelona
Data for the simulation of Barcelona are reported on Figure 4-29.
On Figure 4-30 is reported the daily heating load and the daily energy collected with the solar
collectors. Energy collected is much higher than the one that is required to heat the building.
Figure 4-30 - Daily heating load and solar energy collected in Barcelona.
0
10
20
30
40
50
60
70
1-J
an
11
-Jan
21
-Jan
31
-Jan
10
-Feb
20
-Feb
1-M
ar
11
-Mar
21
-Mar
31
-Mar
10
-Ap
r
20
-Ap
r
30
-Ap
r
10
-May
20
-May
30
-May
9-J
un
19
-Ju
n
29
-Ju
n
9-J
ul
19
-Ju
l
29
-Ju
l
8-A
ug
18
-Au
g
28
-Au
g
7-S
ep
17
-Sep
27
-Sep
7-O
ct
17
-Oct
27
-Oct
6-N
ov
16
-No
v
26
-No
v
6-D
ec
16
-Dec
26
-Dec
Ene
rgy
[kW
h p
er
day
]
Day of the year
Daily heating load [kWh] Daily energy collected [kWh]
Figure 4-29 - Data for the simulation of Barcelona.
DETERMINING PROFILE TEMPERATURE IN THE GROUND….
Average air temperature (year) 288,850
Max air temperature [K] DAILY AVERAGE 299,821
Min air temperature [K] DAILY AVERAGE 276,117
Depth of the storage [m] 1,500
Thermal diffusivity [m^2/day] (*) 0,040
OTHER DATA…
Total volume of the medium [m^3] 18,850
Heat load for the building [kWh/m^2/year] 18,581
Energy collected through solar collector [kWh/m^2/year] 1117,053

97
97 Energy and exergy analysis of thermal energy storages
Figure 4-31 - Temperature profile of the medium.
260
265
270
275
280
285
290
295
300
1-J
an
11
-Jan
21
-Jan
31
-Jan
10
-Feb
20
-Feb
1-M
ar
11
-Mar
21
-Mar
31
-Mar
10
-Ap
r
20
-Ap
r
30
-Ap
r
10
-May
20
-May
30
-May
9-J
un
19
-Ju
n
29
-Ju
n
9-J
ul
19
-Ju
l
29
-Ju
l
8-A
ug
18
-Au
g
28
-Au
g
7-S
ep
17
-Sep
27
-Sep
7-O
ct
17
-Oct
27
-Oct
6-N
ov
16
-No
v
26
-No
v
6-D
ec
16
-Dec
26
-Dec
Tem
pe
ratu
re [K
]
Day of the year
1st year
260
265
270
275
280
285
290
295
300
1-J
an
11
-Jan
21
-Jan
31
-Jan
10
-Feb
20
-Feb
1-M
ar
11
-Mar
21
-Mar
31
-Mar
10
-Ap
r
20
-Ap
r
30
-Ap
r
10
-May
20
-May
30
-May
9-J
un
19
-Ju
n
29
-Ju
n
9-J
ul
19
-Ju
l
29
-Ju
l
8-A
ug
18
-Au
g
28
-Au
g
7-S
ep
17
-Sep
27
-Sep
7-O
ct
17
-Oct
27
-Oct
6-N
ov
16
-No
v
26
-No
v
6-D
ec
16
-Dec
26
-Dec
Tem
pe
ratu
re [K
]
Day of the year
2nd year
260
265
270
275
280
285
290
295
300
1-J
an
12
-Jan
23
-Jan
3-F
eb
14
-Feb
25
-Feb
7-M
ar
18
-Mar
29
-Mar
9-A
pr
20
-Ap
r
1-M
ay
12
-May
23
-May
3-J
un
14
-Ju
n
25
-Ju
n
6-J
ul
17
-Ju
l
28
-Ju
l
8-A
ug
19
-Au
g
30
-Au
g
10
-Sep
21
-Sep
2-O
ct
13
-Oct
24
-Oct
4-N
ov
15
-No
v
26
-No
v
7-D
ec
18
-Dec
29
-Dec
Tem
pe
ratu
re [K
]
Day of the year
3rd year

98
Energy storage systems: an approach involving the concept of exergy
On Figure 4-31, it is shown the temperature profile of the storage medium, when the tank is bu-
ried and not, and the temperature of the ground.
As it has already observed in the simulation of Venice, the temperature of the medium inside
the tank placed above the ground is almost the same of the one of the ground.
Moreover the progress of the temperature of the medium during the 2nd and the one of the 3rd
year are equal: thus we must expect the same progress for the next years.
The increasing of the thickness of the insulation does not allow a significant alteration on the
temperature profile (Figure 4-32)
Figure 4-32 - Temperature profile of the medium varying the thickness of insulation, for the first and the second
year of operation.
260
265
270
275
280
285
290
295
300
1-J
an1
1-J
an2
1-J
an3
1-J
an1
0-F
eb2
0-F
eb1
-Mar
11
-Mar
21
-Mar
31
-Mar
10
-Ap
r2
0-A
pr
30
-Ap
r1
0-M
ay2
0-M
ay3
0-M
ay9
-Ju
n1
9-J
un
29
-Ju
n9
-Ju
l1
9-J
ul
29
-Ju
l8
-Au
g1
8-A
ug
28
-Au
g7
-Sep
17
-Sep
27
-Sep
7-O
ct1
7-O
ct2
7-O
ct6
-No
v1
6-N
ov
26
-No
v6
-Dec
16
-Dec
26
-Dec
Tem
pe
ratu
re [K
]
Day
1st year
260
265
270
275
280
285
290
295
300
1-J
an
12
-Jan
23
-Jan
3-F
eb
14
-Feb
25
-Feb
7-M
ar
18
-Mar
29
-Mar
9-A
pr
20
-Ap
r
1-M
ay
12
-May
23
-May
3-J
un
14
-Ju
n
25
-Ju
n
6-J
ul
17
-Ju
l
28
-Ju
l
8-A
ug
19
-Au
g
30
-Au
g
10
-Sep
21
-Sep
2-O
ct
13
-Oct
24
-Oct
4-N
ov
15
-No
v
26
-No
v
7-D
ec
18
-Dec
29
-Dec
Tem
pe
ratu
re [K
]
Day
2nd year
thickness = 0,10 m thickness = 0,20 m
thickness = 0,50 m ground temperature
0°C [273,15 K]

99
99 Energy and exergy analysis of thermal energy storages
Figure 4-33 - Daily exergy consumption for the different systems.
On Figure 4-33 and on Figure 4-34 are shown the exergy consumption of the four solutions al-
ready introduced in the previous paragraphs.
For these analyses, it has been chosen the temperature data of the second year.
This is due to the initial trend of the storage medium: its temperature is rising at the beginning,
after it follows a permanent sinusoidal trend, as it is shown on Figure 4-32.
Thus we have preferred to present this exergy comparison during the second year of operation
of the system.
As already discussed in the previous paragraph of Venice, also in the simulation of Barcelona we
can observe that the electricity consumption of a heat pump coupled with the TES is lower than
the others solutions until the temperature of the storage medium is lower than the one of air or
ground (Figure Figure 4-35).
The heating load for Barcelona is the lowest of the three simulations done.
The exergy used by the boiler is up to 5 times higher than the one consumed by the heat pumps,
whatever the thermal source at lower temperature is.
0
10
20
30
40
50
60
Jan
-00
Jan
-00
Jan
-00
Jan
-00
Feb
-00
Feb
-00
Mar
-00
Mar
-00
Mar
-00
Mar
-00
Ap
r-0
0
Ap
r-0
0
Ap
r-0
0
May
-00
May
-00
May
-00
Jun
-00
Jun
-00
Jun
-00
Jul-
00
Jul-
00
Jul-
00
Au
g-0
0
Au
g-0
0
Au
g-0
0
Sep
-00
Sep
-00
Sep
-00
Oct
-00
Oct
-00
Oct
-00
No
v-0
0
No
v-0
0
No
v-0
0
Dec
-00
Dec
-00
Dec
-00
Exe
rgy
con
sum
ed
[kW
h p
er
day
]
Day
Electricity consumption with TES Electricity consumption with ground
Electricity consumption with air Daily exergy consumed by the boiler

100
Energy storage systems: an approach involving the concept of exergy
Figure 4-34 - Electricity consumption of the heat pump varying the thermal source at lower temperature.
Figure 4-35 - Trend of temperatures of air, ground, and storage medium.
0,0
1,0
2,0
3,0
4,0
5,0
6,0
7,0
8,0
9,0
10,0
1-J
an
11
-Jan
21
-Jan
31
-Jan
10
-Feb
20
-Feb
1-M
ar
11
-Mar
21
-Mar
31
-Mar
10
-Ap
r
20
-Ap
r
30
-Ap
r
10
-May
20
-May
30
-May
9-J
un
19
-Ju
n
29
-Ju
n
9-J
ul
19
-Ju
l
29
-Ju
l
8-A
ug
18
-Au
g
28
-Au
g
7-S
ep
17
-Sep
27
-Sep
7-O
ct
17
-Oct
27
-Oct
6-N
ov
16
-No
v
26
-No
v
6-D
ec
16
-Dec
26
-Dec
Ele
ctri
city
co
nsu
mp
tio
n [
kWh
pe
r d
ay]
Day
Electricity consumption with air Electricity consumption with ground Electricity consumption with TES
260
265
270
275
280
285
290
295
300
305
1-J
an
11
-Jan
21
-Jan
31
-Jan
10
-Feb
20
-Feb
1-M
ar
11
-Mar
21
-Mar
31
-Mar
10
-Ap
r
20
-Ap
r
30
-Ap
r
10
-May
20
-May
30
-May
9-J
un
19
-Ju
n
29
-Ju
n
9-J
ul
19
-Ju
l
29
-Ju
l
8-A
ug
18
-Au
g
28
-Au
g
7-S
ep
17
-Sep
27
-Sep
7-O
ct
17
-Oct
27
-Oct
6-N
ov
16
-No
v
26
-No
v
6-D
ec
16
-Dec
26
-Dec
Tem
pe
ratu
re [K
]
Day of the year
average daily air temperature [K]
ground temperature [K]
final temperature of the medium (tank buried and eff<1, daily average) [K]

101
101 Energy and exergy analysis of thermal energy storages
On Figure 4-36 is reported the yearly electricity consumption.
We can observe that the difference among the three solutions is small, in particular we can de-
calre that there is not an significant difference between the TES and the ground solution.
In this case an economical evaluation would be conclusive to establish which solution is better.
Figure 4-36 - Yearly electricity consumption for the three heat pump solutions.
We postpone the final consideration about the three simulations done on Chapter 5.
0
100
200
300
400
500
600
700
Ele
ctri
dit
y co
nsu
me
d [
kWh
pe
r ye
ar]
Consumption of the heat pump coupled with the air
Consumption of the heat pump coupled with the ground
Consumption of the heat pump coupled with the TES

102
Energy storage systems: an approach involving the concept of exergy
5. Conclusions
The thesis that has been discussed in the previous chapters deals with the thermal energy sto-
rage.
Thermal energy storage (TES) means to store energy when its price is lower or when there is in
plenty, and to release it when the thermal load requires it.
We have described many different TES systems, which basically are grouped in:
Sensible;
Latent ;
Thermochemical.
In the “sensible” group belong all the systems in which no phase change occurs during the stor-
ing/releasing of the thermal energy.
In this group the most attractive TES suitable for building applications are:
Aquifer thermal energy storage;
Borehole thermal energy storage;
Water tanks.
There are many applications of these technologies, above all in the North Europe.
A latent storage is made changing the phase of the storage medium. A typical example is the wa-
ter: to store the thermal energy the water freezes, and to release, it melts.
Ice storage systems belong to this group and are often used, especially in large applications (cold
storehouses for example).
A thermochemical storage is a way to store thermal energy through a chemical energy: to store
an endothermic chemical reaction occurs, while to release a exothermic reaction takes place.
Many thermochemical processes have been studied; concerning building application, adsorption
system represents a possible solution.
We have also analyzed a storage system represented by a water tank buried a certain depth into
the ground.

103
103 Conclusions
The tank is supposed storing the heat coming from a solar collector. The heat stored is used to
supply the heating load of a small house (450 m3).
A heat pump uses the storage medium as thermal source at lower temperature to supply the
heating load to the building through floor heating (Figure 5-1)
Figure 5-1 - The system analyzed.
The same system has been studied in three different locations: Stockholm, Venice, and Barcelo-
na.
Thus three simulations with IDA software have been done to evaluate the heating load of the
three houses; through a simplified energy balance we have estimated the final temperature of
the storage medium.
With this temperature profile it has been possible to compare on exergetic basis the same heat
pump coupled with three different thermal sources:
the external air;
the water inside the storage tank;
the ground at the depth the tank is buried.

104
Energy storage systems: an approach involving the concept of exergy
Considering the three simulations done, even if the simulation is very simplified, we can observe
that:
when the tank is buried, temperature of the storage medium is basically influenced by
the temperature of the ground;
the tank acts as a buffer, thus the profile of temperature of the medium has a constant
phase shift with the one of the ground at the same depth;
the phase shift between the two temperatures allows a reduced electricity consumption
for the heat pump coupled with the TES, in comparison with the one coupled with the
ground (for example see Figure 4-20)
the temperature of the medium inside the buried tank presents the same progress start-
ing from the second year;
The use of an heat pump coupled with the ground or the storage allows a reduced elec-
tricity consumption in comparison with the same heat pump, which uses the external air
as thermal source at lower temperature;
The use of the boiler to meet the heating load is “exergetically” much less convenient
then using the heat pumps, whatever the lower temperature source is;
The difference between the electricity consumed by the heat pump coupled with the
ground and the one coupled with the storage medium is low, especially in the Barcelona
simulation.
Even though the simulation is facile, I hope that the work done would be useful for a future
project on TES systems.

105
105 Conclusions
References
[1] I. Dincer, M.A. Rosen, Thermal energy storage, Wiley. 2002.
[2] H.E.A. Abdel-Salam, S.D. Probert, Solar Ponds: designs and prospects, Applied Energy 24.
1986.
[3] V. Velmurugan, K. Srithar, Prospects and scopes of solar pond: a detailed review, Renew-
able & sustainable energy reviews 12. 2008.
[4] S.P. Sukhatme, Solar Energy, Tata McGraw-Hill. 1996.
[5] H. Weinberger, The physics of the solar pond, Solar energy 8. 1964.
[6] H. Kurt et al., Experimental and numerical analysis of sodium-carbonate salt gradient so-
lar-pond performance under simulated solar-radiation, Applied energy 83. 2006.
[7] N. Ç. Bezir et al., Numerical and experimental analysis of a salt gradient solar pond per-
formance with or without reflective covered surface, Applied Energy 85. 2008.
[8] Australia Government, department of the environment, water, heritage and the arts.
2008. <http://www.environment.gov.au/settlements/renewable/recp/solar/three.html>
(accessed 09-2008).
[9] Mother Earthy News, Israel´s 150-kW solar pond. May/June 1980.
<http://www.motherearthnews.com/Modern-Homesteading/1980-05-01/Israels-150-
KW-Solar-Pond.aspx> (accessed 09-2008).
[10] Green Trust. <http://www.green-trust.org/solarpond.htm> (accessed 09-2008).
[11] RMIT University. <http://www.rmit.edu.au/browse;ID=905wa9169827; STA-
TUS=A?QRY=solar%20pond&STYPE=ENTIRE> (accessed 09-2008).
[12] H. Tabor, Solar Ponds, Solar Energy 27. 1981.
[13] E. Wilkins, Operation of a commercial solar gel pond, Solar Energy 46. 1991.
[14] E. Wilkins et al., Development of the gel pond technology, Solar Energy 39. 1987.
[15] M. Sokolov et al., Freshwater floating-collector-type solar pond, Solar Energy 44. 1990.
[16] N.D. Kaushika et al., Transparent honeycomb insulated solar thermal systems for energy
conservation. Heat Recovery Systems and CHP 14. 1994.
[17] H.P. Garg et al., Shallow solar pond: state of the art. Energy Conversion. 22. 1982.
[18] M. A. Rosen et al., Effect of stratification on energy and exergy capacities in thermal sto-
rage systems. Int. J. of Energy Res. 28. 2004.
[19] H.Ö. Paksoy et al., Thermal energy storage for sustainable energy consumption, Springer.
2005.

106
Energy storage systems: an approach involving the concept of exergy
[20] Brian Silvetti, Thermal Energy Storage. Encyclopedia of Energy Engineering and Technol-
ogies. Taylor and Francis Group. 2007.
[21] S. Beagley, A chilled water storage system as part of an energy management system,
<www.tefma.com/infoservices/papers/1999/beagley.pdf> . 1999. (Accessed 09-2008).
[22] Karacavus, Thermal and economical analysis of an underground seasonal storage heat-
ing system in Thrace. Energy and Buildings. 2008.
[23] Schaffer et al., The optimum design of honeycomb solar ponds and a comparison with
salt gradient pond. Solar Energy 48. 1992.
[24] Seibt P., Kabus F., Aquifer thermal energy storage-Projects implemented in Germany.
Proceedings of Ecostock 2006.
[25] Energi-Cités, Technische Werke Friederichshafen GmbH, Solar district heating case study
in Friederichshafen (Germany). 2002.
[26] Nielsen K., Thermal energy storage, a state-of-the-art. Report within the research pro-
gram Smart energy-efficient buildings at NTNU and SINTEF 2002-2006. 2003.
[27] Op ´t Veld P., Demollin-Schneiders E., The Minewater project Heerlen, the Netherlands.
Annex 49 newsletter 1, 2007.
[28] Mobil, Mobiltherm 600 series, heat transfer oils. 2006. <http://www.mobil.com/Sweden-
English/Lubes/PDS/euxxenindmomobiltherm_600.pdf>. (Accessed 10-2008).
[29] Ataer O. E., Storage of thermal energy, Energy Storage Systems, Encyclopedia of Life
Support Systems (EOLSS). 2006.
[30] Sanner B., Knoblich K, New IEA activity ECES annex 12 “high temperature underground
thermal energy storage”. 1998. <http://intraweb.stockton.edu/eyos/energy_studies/
content/docs/proceedings/sanne2.pdf>. (Accessed 10-2008).
[31] Maccari A., Innovative heat transfer concepts in concentrating solar fields. 2006.
<http://ec.europa.eu/energy/res/events/doc/maccari_enea.pdf>. (Accessed 10-2008).
[32] Coastal Chemical Co., Hitec heat transfer salt. <http://www.coastalchem.com/
PDFs/HITECSALT/HITEC%20Heat%20Transfer%20Salt.pdf>. (Accessed 10-2008)
[33] <http://www.sandia.gov/Renewable_Energy/solarthermal/NSTTF/salt.htm>
[34] ANU, Concentrating Solar Thermal System , < http://solar-
thermal.anu.edu.au/high_temp/ concentrators/basics.php>. (Accessed 10-2008).
[35] AA VV., Final report Annex 17, available on <http://www.fskab.com/annex17/>. (Ac-
cessed 10-2008).

107
107 Conclusions
[36] Federal energy management program, Thermal energy storage for space cooling,
<http://www1.eere.energy.gov/femp/pdfs/FTA_coolstorage.pdf>.2000 (accessed 10-
2008).
[37] Nordell B., Skogsberg K., Snow cooling in Sweden, Proceedings Ecostock conference
2006.
[38] Kirby P. Nelson, P.E., Ice slurry generator, <http://pmc.biz/ProductDivisions/
Ice_Systems_Group/pdfs/isg.pdf>. 1998. (Accessed 10-2008).
[39] Bellas I., Tassou S.A., Present and future applications of ice slurries, Int. Journal of Ref.
28. 2005.
[40] Rossi N., Manuale del termotecnico. Hoepli. 2003.
[41] <http://www.epsltd.co.uk/iceharvester.pdf> (accessed 10-2008).
[42] Paul Mueller company, Avalanche ice harvester/chiller,
<http://www.paulmuellercompany.com/pdfs/Literature/TE-2001-7Avalanche.pdf> (ac-
cessed 10-2008)
[43] Cristopia Energy system, <http://www.cristopia.com/ english/products
/indproducts.html>. (accessed 10-2008).
[44] Farid et al., A review on phase change energy storage: materials and applications, Energy
conversion and management 45. 2004.
[45] Microtek laboratories. <http://www.microteklabs.com>. (Accessed 10-2008)
[46] Tyagi V.V. et al., PCM thermal storage in buildings: A state of art, Renewable & sustaina-
ble energy reviews 11. 2005.
[47] Wongsuwan W. et al., A review of chemical heat pump technology and applications. Ap-
plied thermal Engineering 21. 2001.
[48] Jaehnig D. et al., Thermo-chemical storage for solar space heating in a single family
house. Proceedings of Ecostock 2006.
[49] Cavallini A., Mattarolo L., Termodinamica applicata. CLEUP. 1992.
[50] Kotas, T.J., The exergy method of thermal plant analysis. 1985
[51] EU commission SAVE programme & Nordic Energy research, Pre-design guide for ground
source cooling systems with thermal energy storage. COWI. 2004.
[52] Andersson O. et al., Heating and cooling with UTES in Sweden – current situation and po-
tential market development. Proceedings Futurestock conference 2003.
[53] International Energy Agency, “Electricity/Heat in OECD Europe in 2005“.
<http://www.iea.org/Textbase/stats/electricitydata.asp?COUNTRY_CODE=25&Submit=S
ubmit> (01 Oct 2008)

108
Energy storage systems: an approach involving the concept of exergy
[54] V. Smil. (2003) Energy at the Crossroads. MIT press.
[55] BBC Weather Centre, < http://www.bbc.co.uk/weather/world>. (Accessed 11-2008).
[56] Fölke Bjork, class notes.
[57] IDA software and data.
[58] Popiel et al., Measurements of temperature distribution in the ground, Experimental
Thermal and fluid science, 25. 2001.
[59] IDA Room online help. Version 1.0, 2001.
[60] Kusuda T., Achenbach P.R., Earth temperature and thermal diffusivity at selected stations
in the United States. Ashrae Transactions, Vol. 71, Part I. 1965.
[61] Rottmayer S.P., Simulation of ground coupled vertical U-tube heat exchanger. Master of
Science, University of Wisconsin, Madison. 1997. Available on
<http://minds.wisconsin.edu/handle/1793/7759?show=full> (accessed 12-2008).
[62] <http://www.equaonline.com/iceuser/index.html> (accessed 12-2008).
[63] DLgs 311/2007, Disposizioni correttive e integrative del decreto legislativo 19/8/2005
n.192, recante attuazione della direttiva 2002/91 CE, relativa al rendimento energetico
nell’edilizia. Gazzetta Ufficiale della Repubblica Italiana, Supplemento Ordinario n. 26 del
1/02/07. Available on <www.anit.it>.
[64] De Carli M. et al., Sviluppi nelle pompe di calore: il terreno come sorgente termica,
Convegno Aicarr 2002. Avaiable on < http://www.energeo-
system.com/index.php?option=com_docman&task=doc_download&gid=5%20->. (Ac-
cessed 01-2009).
[65] Documento Básico HE, Ahorro de Energía, Texto modificado por RD 1371/2007, de 19 de
octubre (BOE 23/10/2007) y corrección de errores (BOE 25/01/2008).
[66] Sistema Kömmerling, Código Técnico de la Edificación. Avaiable on
<http://www.construnario.com/diccionario/swf/28134/Cat%C3%A1logos/C%C3%B3digo
%20T%C3%A9cnico%2007.pdf>. (Accessed on 01-2009).
[67] < http://www.infinitepower.org/images/jspaerial.jpg>. (Accessed 01-2009).